Embed Size (px)
Citation preview
High Performance Buildings Research & Implementation Center (HiPer BRIC)
Automating and Optimizing Demand Responsive Commercial Buildings
Automating and Optimizing Demand Responsive Commercial Buildings
December 21, 2007
Mary Ann Piette
Environmental Energy Technologies Division
Mary Ann Piette
Environmental Energy Technologies Division

2
ElectricityTariffs &Carbon EmissionRates
ExternalPower
ElectricityStorage
OnsitePowerGeneration
WasteHeat
Sunlight
Technical Scope of Buildings
Sensor Modules• Occupancy• Temperature• Humidity• Air Quality• Light• Appliances
Sensor Modules• Occupancy• Temperature• Humidity• Air Quality• Light• Appliances
AppliancePower Control
AppliancePower Control
ThermalStorage Capacity/
TemperatureInfo
ExternalVentilation Outside Air
Temperature/Humidity Info
Output• Energy Consumption• Indoor air quality and security data• Integrated and component system performanceGoal• Zero energy and/or carbon building• Healthy, comfortable, safe/secure environment• Minimum cost
Building Operating Platform (BOP)Real-time optimization - consumption, cost, carbon footprint
Building Simulation,Modeling & Analysis(DOE-2; EnergyPlus)
CentralAir Conditioning/
Heat Pump
Local Thermal/Humidity Control
Local Thermal/Humidity Control
Lighting/Window/FacadeControl
Lighting/Window/FacadeControl
Coupled Interactions
CoupledInteractions
Current &Future Weather
Network Communication Layer

3
Demand Response Definitions and Technology Needs
DR Definition: Action to reduce load when• Contingencies occur that threaten supply-demand balance• Market conditions occur that raise supply costs
– peak-load reductions different from efficiency, transient vs. permanent
DR Communications Infrastructure Needs• Create real-time, automated DR infrastructure to respond to changing
contingency and market conditions• DR infrastructure should coexist with legacy systems, technology and tariff
improvements, with near- and long-term benefits.
California Daily Peak Loads -- 2006
0
10,000
20,000
30,000
40,000
50,000
60,000
70,000
Jan-06 Mar-06 May-06 Jul-06 Sep-06 Nov-06
MW
Residential Air Conditioning
Commercial Air Conditioning

4
Automated DR Project Past and Present
Recent Research Goals•Cost - Develop low-cost, automation infrastructure to improve DR capability in California•Technology - Evaluate “readiness” of buildings to receive signals•Capability - Evaluate capability of control strategies for current and future buildings
AutoDR Definition - Fully automated signal for end-use control•Signaling – Continuous, secure, reliable, 2-way communication with listen and acknowledge signals•Industry Standards - Open, interoperable standard control and communications to integrate with both common EMCS and other end-use devices that can receive a relay or similar signals (such XML)•Timing of Notification - Day ahead and day of signals are provided to facilitate a diverse set of end-use strategies

5
Manual DR - Common Practice

6
DRAS Clients –
1. Software only (Smart)
2. Software & Hardware (Simple)
DR Automation Server w/ DRAS Client
4 Energy Management Control System (EMCS) and other systems carry out shed based on pre-programmed strategies.
3 Polling clients request price level and event data every minute
2 Price-Level and DR event signals sent on DRAS
Utility sends DR notification to DRAS1
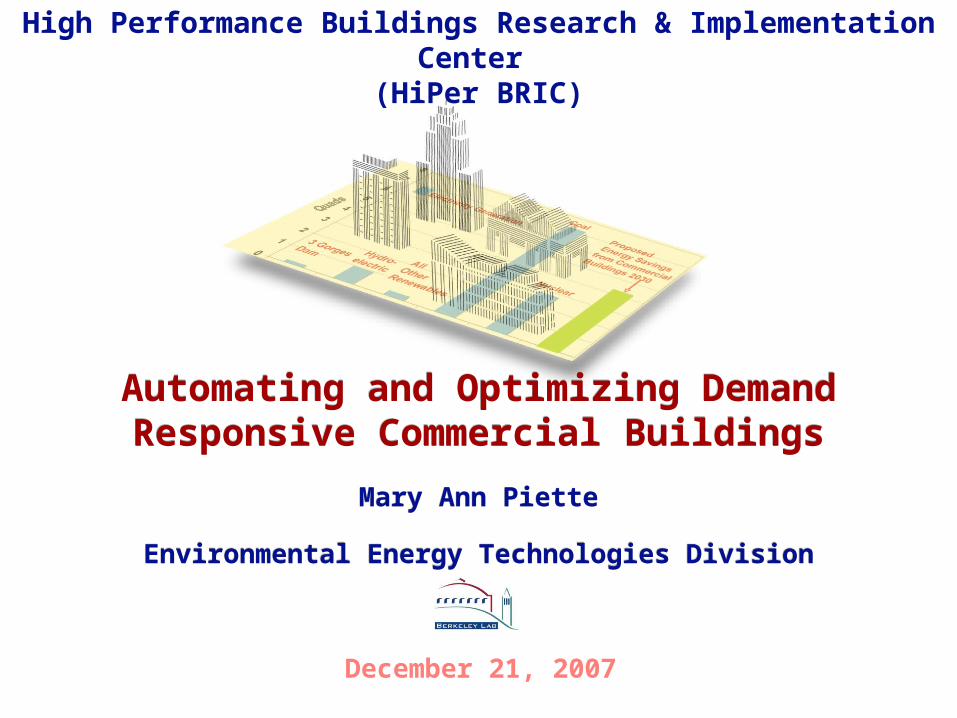
DR Automation Server Event Architecture
DRAS
Intern
et(S
SL
Secu
red)
Intern
et(S
SL
Secu
red)
Program Operator
Participant Site
Initiate DR Event
Configure DRProgram
Get OperatorReports
Check status, getreports
DR opt out
Set Load Status
Configure DRASClient Connection
Modify DR Event
Send Event Info toDRAS Client
`
Web Client
Utility Information
System
DRAS UI Web Server
DRASClient
`
Web Client
DRAS UIWeb Server
Update RTP Info
Send RTP Info toDRAS Client
Utility/ISO
Exception Alarms
3rd Party NotificationSystem
Voice mail,Email,
Page, etc.
Participant
Manager
8
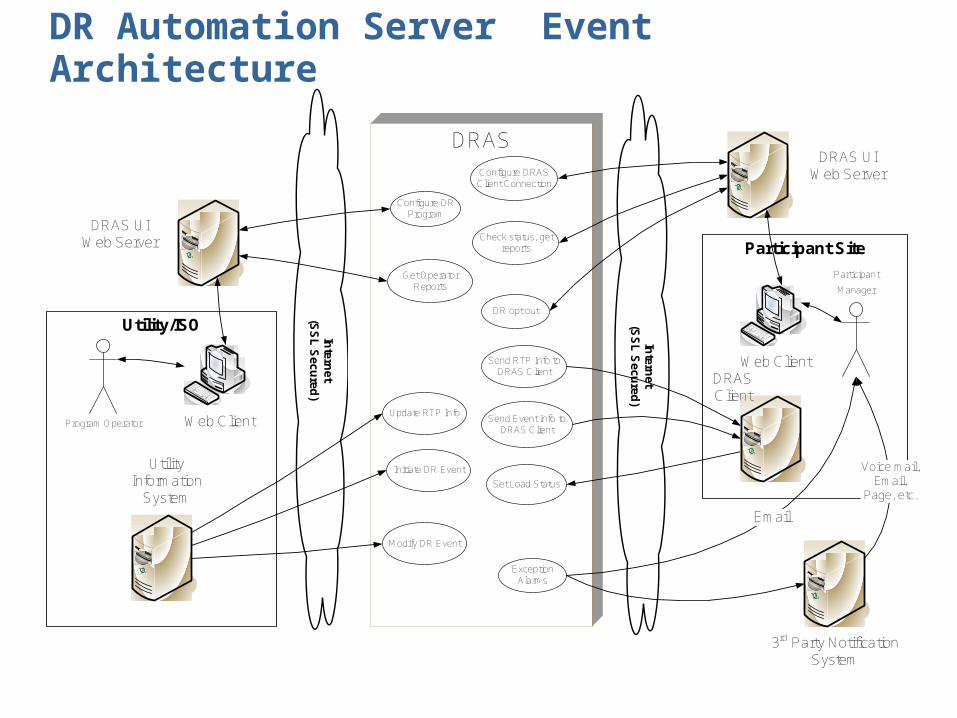
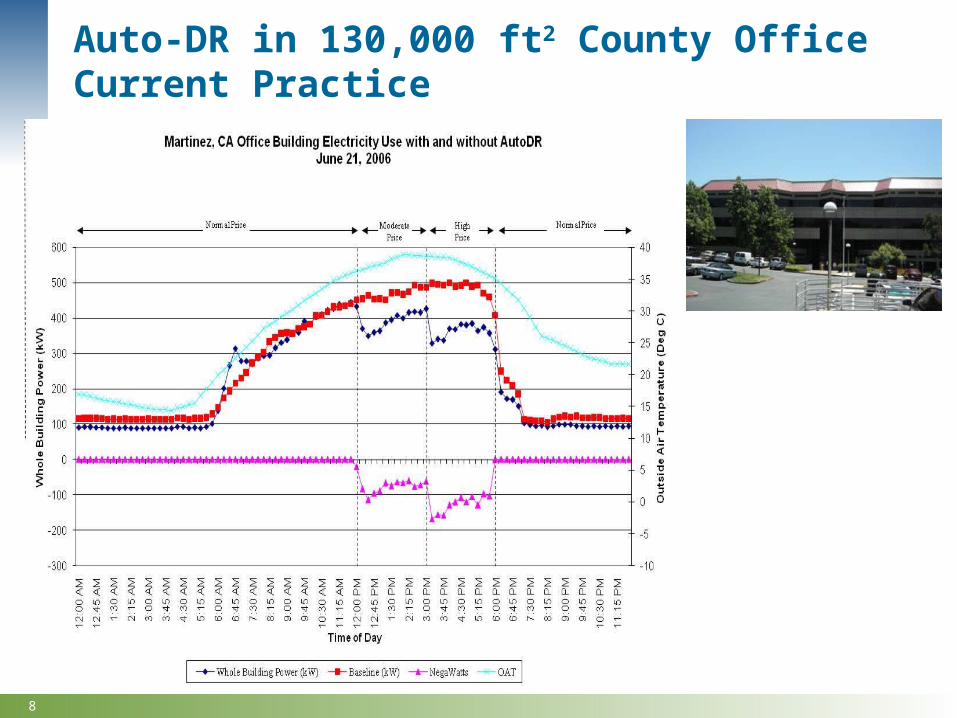
Auto-DR in 130,000 ft2 County Office Current Practice

9
Auto-DR in 130,000 ft2 County Office with Optimized Shed Shape

10
Improving DR capability in Buildings – from Present to Future
• Improved levels of granularity/modular control
• Improved intelligence of building modes – lighting, HVAC, other
• Improved end-use metering, service level performance metrics
• Multi-objective optimization
HVAC Lighting Other
Building use Glo
bal t
emp.
adj
ustm
ent
Duc
t sta
tic p
res.
Incr
ease
SA
T In
crea
se
Fan
VF
D li
mit
CH
W te
mp.
Incr
ease
Fan
qty
. red
uctio
n
Pre
-coo
ling
Coo
ling
valv
e lim
it
Boi
ler
lock
out
Slo
w re
cove
ry
Ext
ende
d sh
ed p
erio
d
Com
mon
are
a lig
ht d
im
Offi
ce a
rea
light
dim
Tur
n of
f lig
ht
Dim
mab
le b
alla
st
Bi-l
evel
sw
itchi
ng
Non
-crit
ical
pro
cess
she
d
ACWD Office, lab X X X X X X XB of A Office, data center X X X X XChabot Museum X X2530 Arnold Office X X50 Douglas Office X XMDF Detention facility XEchelon Hi-tech office X X X X X X X XCenterville Junior Highschool X XIrvington Highschool X XGilead 300 Office XGilead 342 Office, Lab X XGilead 357 Office, Lab X XIKEA EPaloAlto Furniture retail XIKEA Emeryville Furniture retail XIKEA WSacto Furniture retailOracle Rocklin Office X XSafeway Stockton Supermarket XSolectron Office, Manufacture X XSvenhard's Bakery XSybase Hi-tech office XTarget Antioch Retail X XTarget Bakersfield Retail X XTarget Hayward Retail X X X XWalmart Fresno Retail X X

11
Enhance Current AutoDR Web Portal: Retain Chain
12
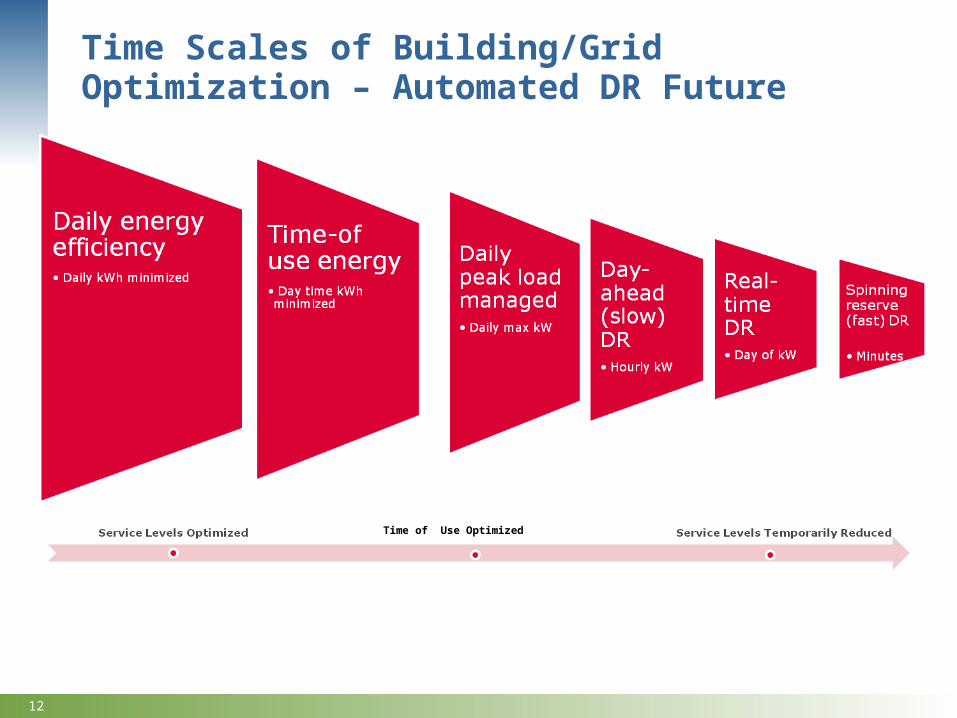
Time Scales of Building/Grid Optimization – Automated DR Future
Time of Use Optimized
13
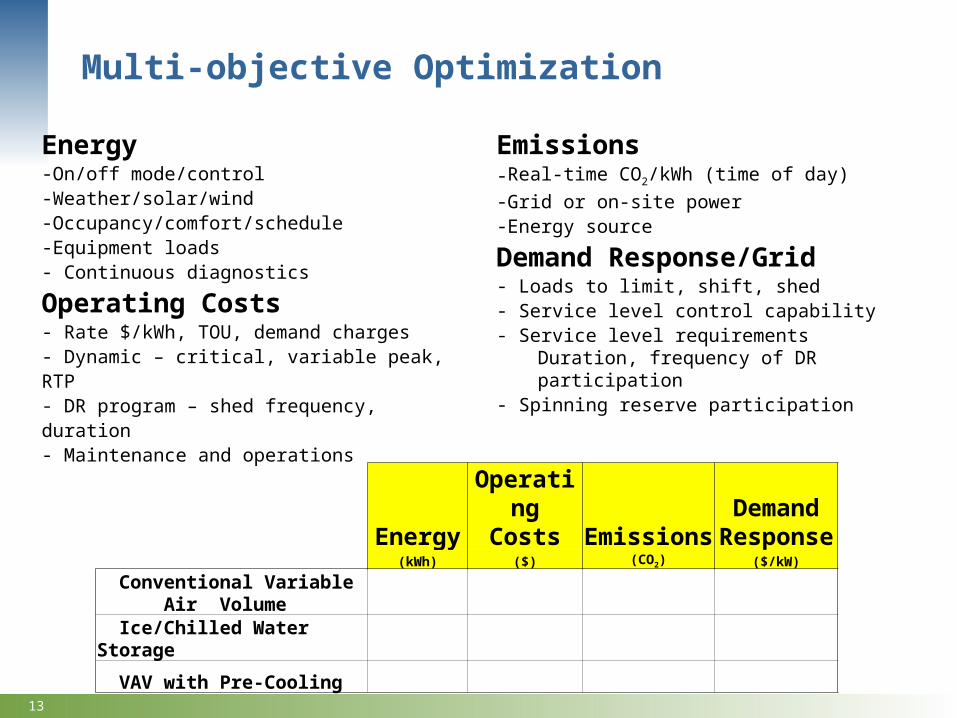
Multi-objective Optimization
Energy-On/off mode/control-Weather/solar/wind-Occupancy/comfort/schedule-Equipment loads- Continuous diagnostics
Operating Costs- Rate $/kWh, TOU, demand charges- Dynamic – critical, variable peak, RTP- DR program – shed frequency, duration- Maintenance and operations
Emissions-Real-time CO2/kWh (time of day)-Grid or on-site power-Energy source
Demand Response/Grid- Loads to limit, shift, shed- Service level control capability- Service level requirements
Duration, frequency of DR participation
- Spinning reserve participation
EnergyOperating
Costs EmissionsDemand
Response(kWh) ($) (CO2) ($/kW)
Conventional Variable Air Volume
Ice/Chilled Water Storage
VAV with Pre-Cooling
14
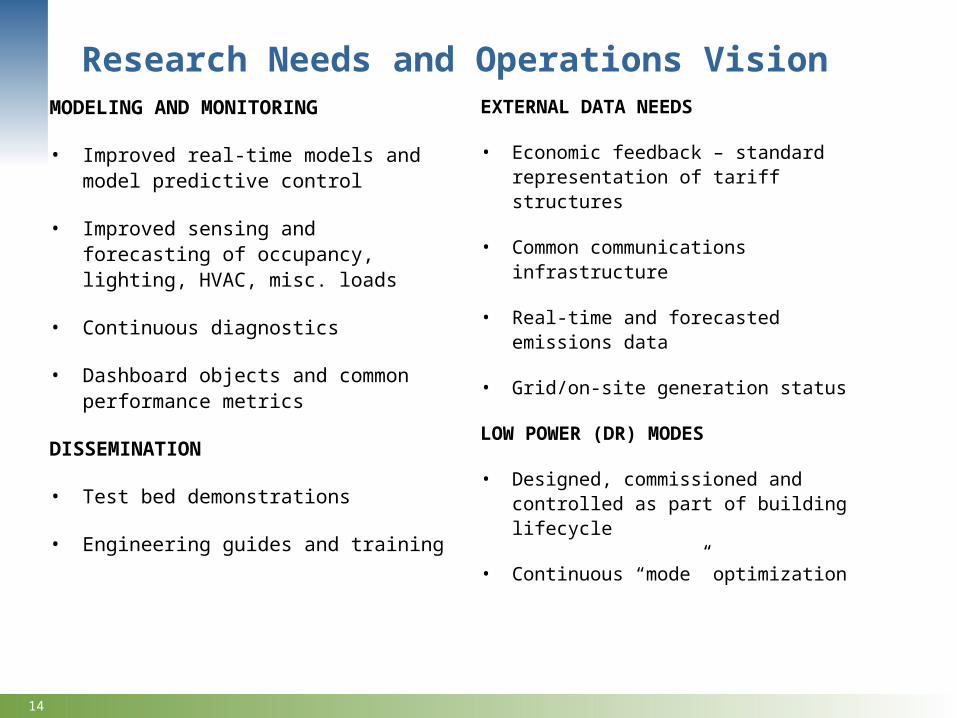
Research Needs and Operations VisionMODELING AND MONITORING
• Improved real-time models and model predictive control
• Improved sensing and forecasting of occupancy, lighting, HVAC, misc. loads
• Continuous diagnostics
• Dashboard objects and common performance metrics
DISSEMINATION
• Test bed demonstrations
• Engineering guides and training
EXTERNAL DATA NEEDS
• Economic feedback – standard representation of tariff structures
• Common communications infrastructure
• Real-time and forecasted emissions data
• Grid/on-site generation status
LOW POWER (DR) MODES
• Designed, commissioned and controlled as part of building lifecycle
• Continuous “mode” optimization

15
APPENDICES

16
Ideal start - good commissioning, retro-commissioning, advanced/new controls
HVAC - Direct digital control (DDC) global temperature adjustment
• In process for Title 24 2008
• Closed loop
Lighting Continuum - Zone Switching, Fixture Switching, Lamp Switching, Stepped Dimming, Continuous Dimming
Maybe you “can” use a strategy every day?
Desire to tryDR
Global temp.adjustment
DDC zonecontrol?
Y N
Global temp.Adjustmentcapability?
Y N
Central plantcontrol
Airdistribution
control
Air distributionSystem DDC?
Y N
Can program GTA?
Y N Central plantDDC?
Y N
Do not try DRat this time
Desire to tryDR
Global temp.adjustment
DDC zonecontrol?
Y NDDC zonecontrol?
Y N
Global temp.Adjustmentcapability?
Y NGlobal temp.Adjustmentcapability?
Y N
Central plantcontrol
Airdistribution
control
Air distributionSystem DDC?
Y NAir distributionSystem DDC?
Y N
Can program GTA?
Y NCan program GTA?
Y N Central plantDDC?
Y NCentral plantDDC?
Y N
Do not try DRat this time
Linking DR and Energy Efficiency

17
EnergyPlus DR Assessment Tools

18
2006 Auto-CPP Participants (n=24)Wide variety of building types
Total ConditionedACWD Fremont 2 Office, lab 1 51,200 51,200 348B of A Concord 2 Office, data center 4 616,000 708,000 5712Chabot Oakland 2 Museum 2 86,000 86,000 3362530 Arnold Martinez 2 Office 1 131,000 131,000 53650 Douglas Martinez 2 Office 1 90,000 90,000 459MDF Martinez 2 Detention facility 1 172,300 172,300 561Echelon San Jose 2 Hi-tech office 1 75,000 75,000 523Centerville Fremont 2 Junior Highschool 1 N/A N/A 332Irvington Fremont 2 Highschool 1 186,000 186,000 446Gilead 300 Foster City 1 Office 1 83,000 83,000 288Gilead 342 Foster City 1 Office, Lab 1 32,000 32,000 495Gilead 357 Foster City 1 Office, Lab 1 33,000 33,000 662IKEA EPaloAlto East Palo Alto 1 Furniture retail 1 300,000 300,000 1466IKEA Emeryville Emeryville 2 Furniture retail 1 274,000 274,000 1191IKEA WSacto West Sacramento 2 Furniture retail 1 265,000 265,000 1055Oracle Rocklin Rocklin 2 Office 2 100,000 100,000 552Safeway Stockton Stockton 2 Supermarket 1 65,000 65,000 479Solectron Milpitas 2 Office, Manufacture 9 499,206 499,206 4655Svenhard's Oakland 2 Bakery 1 101,000 101,000 696Sybase Dublin 2 Hi-tech office 2 425,000 425,000 1995Target Hayward Hayward 2 Retail 1 130,000 130,000 449Target Antioch Antioch 2 Retail 1 140,686 140,686 572Target Bakersfield Bakersfield 2 Retail 1 143,941 143,941 645Walmart Fresno Fresno 2 Retail 1 125,503 125,503 571
35 3,714,706 3,806,706 23,235
# ofBldg
Floor Space Peak Load kW
CPP Zone
Short Name Location Building Use

19
Communications Systems
SiteCommunication
MethodDevice
Price Client Host
Price ClientHost Location
Price ClientHosted at Co-Lo
ACWD Relay at site ADAM6060 DRAS DRAS Co-Lo YesB of A Relay at site ADAM6060 DRAS DRAS Co-Lo YesChabot Relay at site ADAM6060 DRAS DRAS Co-Lo Yes2530 Arnold Relay w/WAN ADAM6060 DRAS DRAS Co-Lo Yes50 Douglas Relay w/WAN ADAM6060 DRAS DRAS Co-Lo YesMDF Relay w/WAN ADAM6060 DRAS DRAS Co-Lo YesEchelon Software client i.LON Kenmark San Francisco, CA NoCenterville CLIR CLIR CLIR Onsite NoIrvington CLIR CLIR CLIR Onsite NoGilead 300 Relay w/WAN ADAM6060 DRAS DRAS Co-Lo YesGilead 342 Relay w/WAN ADAM6060 DRAS DRAS Co-Lo YesGilead 357 Relay w/WAN ADAM6060 DRAS DRAS Co-Lo YesIKEA EPaloAlto Relay at site ADAM6060 DRAS DRAS Co-Lo YesIKEA Emeryville CLIR CLIR CLIR Onsite NoIKEA WSacto CLIR CLIR CLIR Onsite NoOracle Rocklin CLIR CLIR CLIR Onsite NoSafeway Stockton CLIR CLIR CLIR Onsite NoSolectron CLIR CLIR CLIR Onsite NoSvenhard's Relay at site ADAM6060 DRAS DRAS Co-Lo YesSybase CLIR CLIR CLIR Onsite NoTarget Hayward Software client Canon Technologies Target Minesota YesTarget Antioch Software client Automated Logic Target Minesota YesTarget Bakersfield Software client Automated Logic Target Minesota YesWalmart Fresno Software client EnergyICT EnergyICT Belgium Yes

20
Related Research - Pre-Cooling Studies
# of Sites/Location
Peak Shift
(W/ft2)
% (whole
building)
Strategies Comfort Peak outside temp
oF
2003 1 / Santa Rosa
2.3 ~60% Pre cool – one step temp set up
No complaints 90-95
2004 2 / Santa Rosa, Sacramento
0.5~2.0 10~66% Pre cool – one step temp set up
Comfort survey 85-90
2005 2 / Oakland 0.5~1.0 10~25% Pre cool - various shed & recovery strategies
Comfort survey, indoor monitors
80-85
2006 1 / Visalia 0.5~1.0 10~15% Pre cool - various shed & recovery strategies
Comfort survey, indoor monitors
95-100

21

22
Aggregated Demand, 6/26/2006 (OAT: 89 °F) - Zone 2, 8 sites
0.0
1.0
2.0
3.0
4.0
5.0
6.0
7.0
8.0
9.0
0:00
1:00
2:00
3:00
4:00
5:00
6:00
7:00
8:00
9:00
10:0
0
11:0
0
12:0
0
13:0
0
14:0
0
15:0
0
16:0
0
17:0
0
18:0
0
19:0
0
20:0
0
21:0
0
22:0
0
23:0
0
Po
wer
[M
W]
ACWD B of A Chabot 2530 Arnold 50 Douglas
MDF Echelon Gilead 300 Gilead 342 Gilead 357
IKEA EPaloAlto Oracle Rocklin Target Hayward Adj OAT Reg BL CPP BL
Moderate Price High Price
Aggregated AutoDR Results – June 26, Zone 2 OAT and CPP Baselines show different results
Moderate High Moderate High Moderate HighACWD 78 91 28% 32% 1.53 1.78B of A 478 604 9% 12% 0.67 0.852530 Arnold 102 140 20% 29% 0.78 1.0750 Douglas 57 94 13% 22% 0.63 1.04MDF 90 155 17% 30% 0.52 0.90Echelon -2 80 0% 22% -0.02 1.07Oracle Rocklin 85 60 17% 14% 0.85 0.60Target Hayward 59 56 15% 15% 0.45 0.43Aggregated 946 1281 11% 16% 0.65 0.88
Average kW Average % Average W/ft²
1.3 MW reduction
during high price
period