Embed Size (px)
Citation preview
High Impedance Fault Detection
On
Distribution Feeders
Mark Adamiak Craig Wester Manish Thakur GE Power Management
King of Prussia, PA Duluth, GA Markham, Ontario
Chuck Jensen JEA
Jacksonville, FL

2
High Impedance Fault Detection On Distribution Feeders
by
Mark Adamiak Craig Wester Manish Thakur Charles Jensen
GE Power Management JEA
Abstract The ability to detect High Impedance (HiZ) faults has been a topic of research and development for over 30 years. About seven years ago, products began to appear on the market that could securely perform this function. Over this time period, several hundred HiZ detection devices have been placed in service and have performed to expectations. This paper reviews the operating principle of HiZ fault detection, looks at the application issues encountered over this time, highlights some of the actual detections, and looks at possible future directions of the technology. I. Introduction From the beginning of power distribution, the power system protection engineer has been challenged with the detection of HiZ faults. The IEEE Power System Relay Committee working group on High Impedance Fault Detection Technology [1] defines HiZ faults as those that �do not produce enough fault current to be detectable by conventional overcurrent relays or fuses�. As such, it should be noted that whereas traditional protection is designed to protect the power system, HiZ protection is primarily focused on the protection of people and property. The typical HiZ fault is when a conductor physically breaks and falls to the ground. The break in the conductor will usually result in either a drop in load on the affected feeder or possibly a momentary overcurrent condition as the falling conductor briefly comes in contact with a solidly grounded object. Once on the ground, the resulting electrical signature is very much a function of the contacted surface. Surfaces such as concrete, grass, dirt, and wet surfaces in general will result in an �arcing fault� with RMS fault currents in the range of 10 to 50 amps whereas surfaces such as dry sand and asphalt will result in a constant low level of current flow. Arcing faults result in a very definable and detectable pattern whereas the signatures presented by the latter surfaces present a challenge to secure and reliable detection.
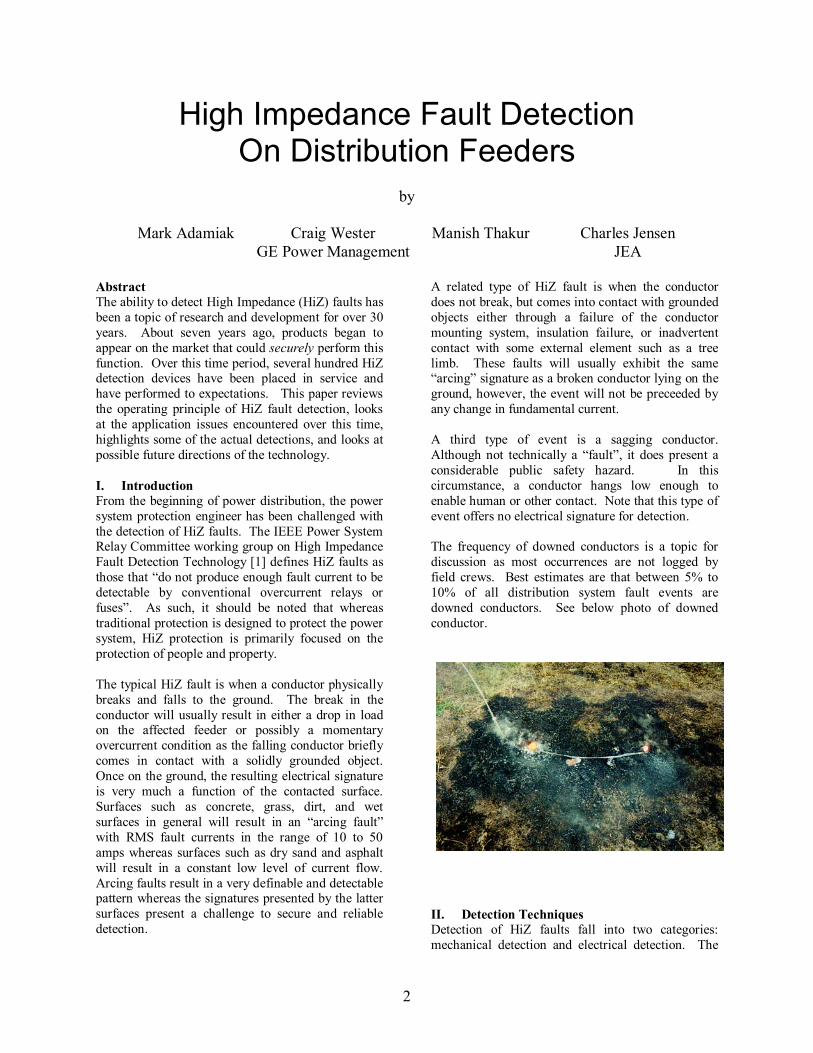
A related type of HiZ fault is when the conductor does not break, but comes into contact with grounded objects either through a failure of the conductor mounting system, insulation failure, or inadvertent contact with some external element such as a tree limb. These faults will usually exhibit the same �arcing� signature as a broken conductor lying on the ground, however, the event will not be preceeded by any change in fundamental current. A third type of event is a sagging conductor. Although not technically a �fault�, it does present a considerable public safety hazard. In this circumstance, a conductor hangs low enough to enable human or other contact. Note that this type of event offers no electrical signature for detection. The frequency of downed conductors is a topic for discussion as most occurrences are not logged by field crews. Best estimates are that between 5% to 10% of all distribution system fault events are downed conductors. See below photo of downed conductor.
II. Detection Techniques Detection of HiZ faults fall into two categories: mechanical detection and electrical detection. The

3
following sections offer a brief review of the various techniques that have been developed in these areas. a. Mechanical Detection Mechanical detection usually involves some way of forcing contact with a solid ground in order to allow conventional overcurrent protection to operate. The first type of mechanical HiZ detection method consists of a device(s) mounted to a cross arm or pole. The device is mounted under each phase wire in order to catch the conductor as it falls to the ground. The force of the falling conductor releases an internal spring that ejects a bus bar to make contact with the fallen wire and create a low impedance ground fault. The ground fault created will cause conventional overcurrent protection to operate. Sagging conductors that do not come in contact with earth or a grounded object could be detected by this mechanical method. The installation and maintenance costs are high. For bi-directional coverage, six units would have to be mounted on each pole. Even though the cost may be high to allow usage on every pole, utilities may install in certain areas, such as churches, schools, or hospitals. A second type of mechanical HiZ detection method uses a pendulum mounted aluminum rod with hooked ends. It is suspended from an under-built neutral conductor. The falling conductor is caught and produces a low impedance ground fault, which operates conventional overcurrent protection. Typically, two units are mounted per span. Sagging conductors that do not come in contact with earth or a grounded object could be detected by this mechanical method. Ice, wind, and tree growth could cause a false detection. b. Electrical Detection There are three primary �algorithmic� techniques that have been developed and field tested to date. A summary of these three systems follows:
High Impedance Fault Analysis System This electrical HiZ detection method measures the third harmonic current phase angle with respect to the fundamental voltage. There is a distinct phasor relationship between the third harmonic current and the faulted phase voltage. The device calculates and stores the average ambient third harmonic current phasor. When a fault occurs, the new third harmonic current phasor is vectorially subtracted from the stored value. A high impedance fault is issued if the magnitude is above setting and angle matches a predetermined value for a downed conductor. The device acquires current and voltage values from the
relaying current and voltage transformers. Typically, one unit is installed in each distribution breaker. Units have been in service since the early 1990�s.
Open Conductor Detection This electrical HiZ detection method detects loss of voltage to determine a broken conductor. The system measures the voltage at each end of a single phase lateral. When the voltage of any phase drops below the specified threshold, a transmitter sends a signal on the neutral conductor to a receiver at the upstream device. The upstream device opens if voltage is present at the upstream device. Systems have been under test since 1992.
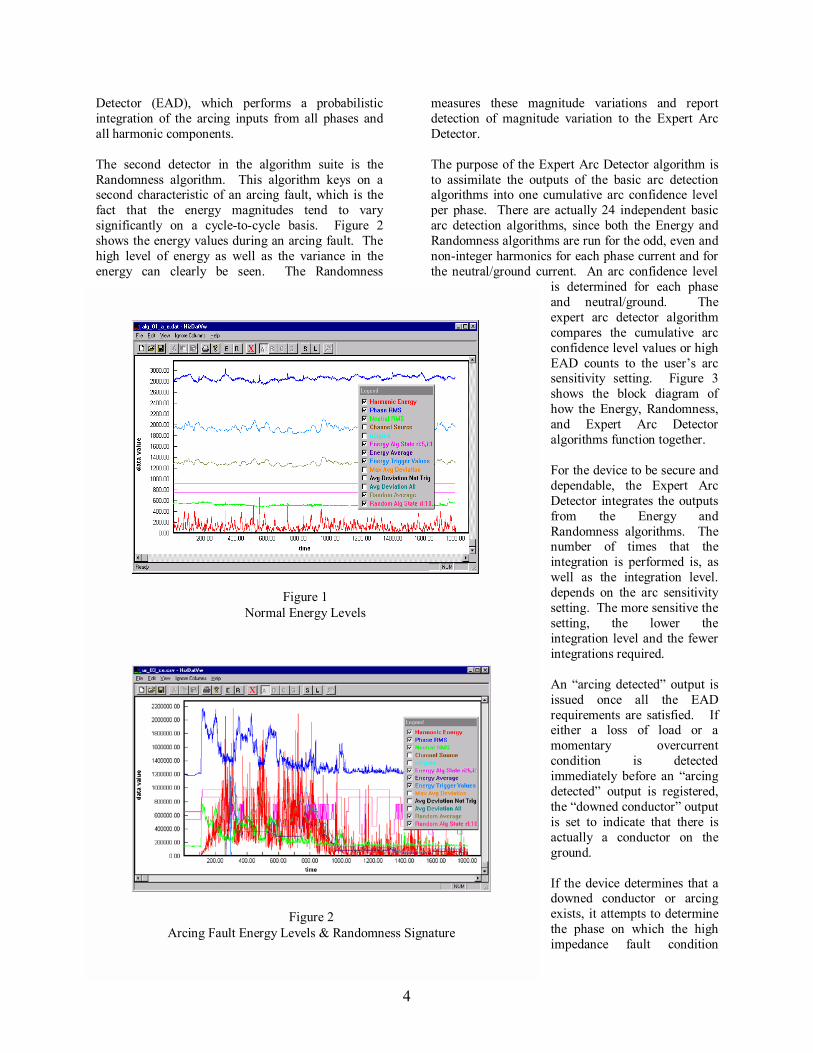
Signature Based HiZ Detection The signature based HiZ IED performs expert system pattern recognition on the harmonic energy levels on the currents in the arcing fault. This technique is based on the technology developed at Texas A&M University after more than two decades of research, funded in part by the Electric Power Research Institute. The HiZ IED uses a high waveform sampling rate (64 samples/cycle) on the ac current inputs to create the spectral information used in the signature analysis. Expert system techniques are employed to assure security while maintaining dependability. The overall process incorporates nine algorithms, each performing a specific detection or classification function. High impedance fault detection requires inputs from the three phase and ground currents via relaying current transformers. Voltage inputs are used to enhance security and to provide supplemental phase identification and are not required for arcing detection. The primary detection algorithms are the Energy and Randomness algorithms. The Energy algorithm focuses on the fact that arcing causes bursts of energy that register throughout the frequency spectrum. The energy values � computed as the square of the harmonic and non-harmonic spectral components (excepting the fundamental) � are integrated into odd, even, and non-integer harmonics values. Sampling at 64 samples per cycle allows computation of frequency components up to the 25th harmonic. The Energy algorithm monitors these computed harmonics on all phase and ground currents. After establishing an average energy value for a given signal, the algorithm indicates �arcing� if it detects a sudden, sustained increase in the value of that component. Figure 1 shows �normal� energy levels as measured on an actual feeder. Indications of energy increase are reported to the Expert Arc
4
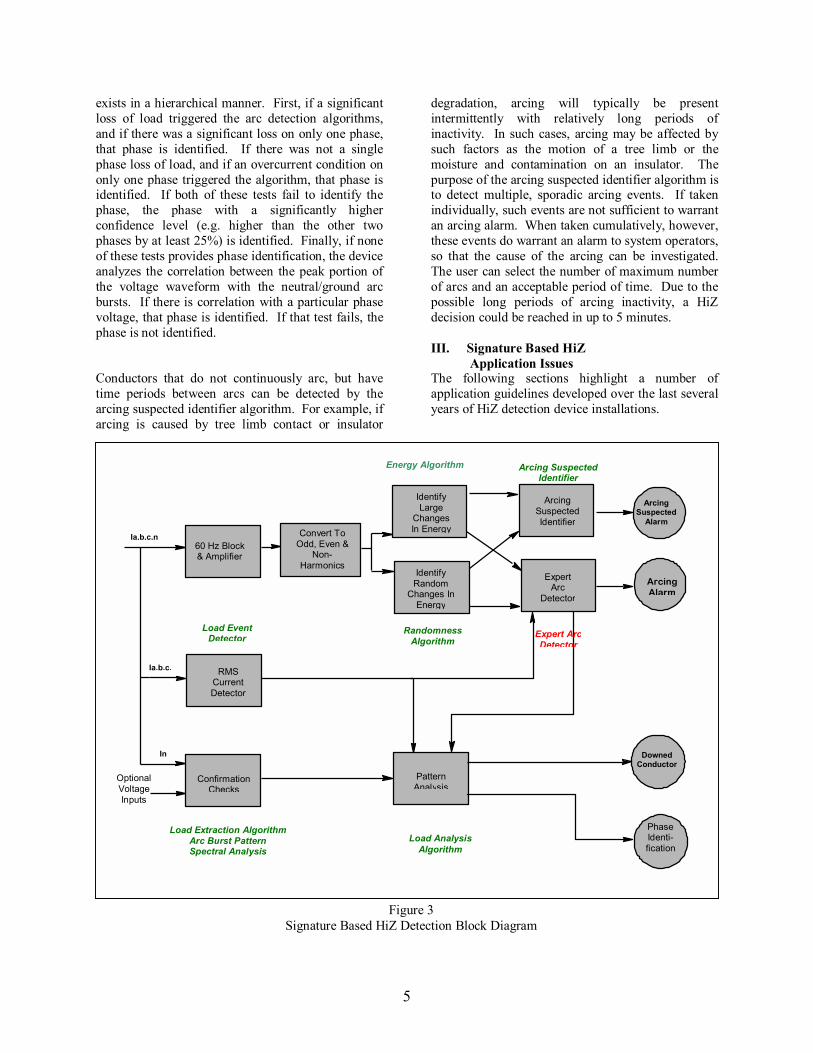
Detector (EAD), which performs a probabilistic integration of the arcing inputs from all phases and all harmonic components. The second detector in the algorithm suite is the Randomness algorithm. This algorithm keys on a second characteristic of an arcing fault, which is the fact that the energy magnitudes tend to vary significantly on a cycle-to-cycle basis. Figure 2 shows the energy values during an arcing fault. The high level of energy as well as the variance in the energy can clearly be seen. The Randomness
measures these magnitude variations and report detection of magnitude variation to the Expert Arc Detector. The purpose of the Expert Arc Detector algorithm is to assimilate the outputs of the basic arc detection algorithms into one cumulative arc confidence level per phase. There are actually 24 independent basic arc detection algorithms, since both the Energy and Randomness algorithms are run for the odd, even and non-integer harmonics for each phase current and for the neutral/ground current. An arc confidence level
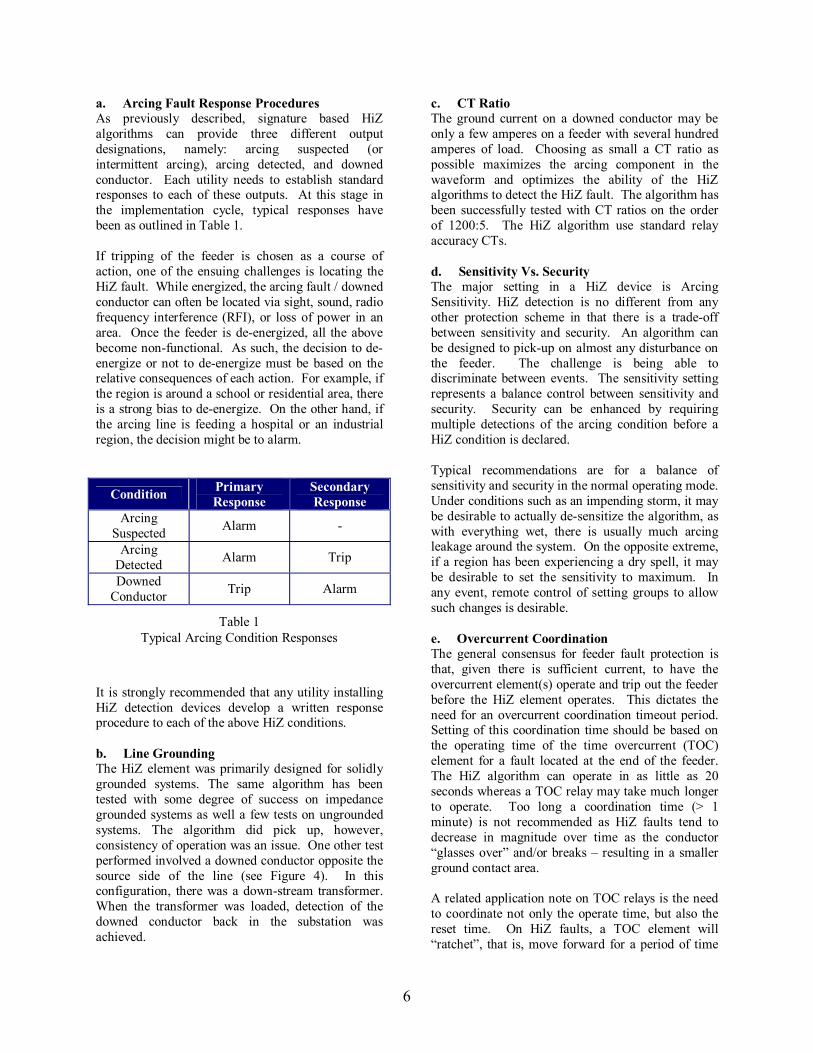
is determined for each phase and neutral/ground. The expert arc detector algorithm compares the cumulative arc confidence level values or high EAD counts to the user�s arc sensitivity setting. Figure 3 shows the block diagram of how the Energy, Randomness, and Expert Arc Detector algorithms function together. For the device to be secure and dependable, the Expert Arc Detector integrates the outputs from the Energy and Randomness algorithms. The number of times that the integration is performed is, as well as the integration level. depends on the arc sensitivity setting. The more sensitive the setting, the lower the integration level and the fewer integrations required. An �arcing detected� output is issued once all the EAD requirements are satisfied. If either a loss of load or a momentary overcurrent condition is detected immediately before an �arcing detected� output is registered, the �downed conductor� output is set to indicate that there is actually a conductor on the ground. If the device determines that a downed conductor or arcing exists, it attempts to determine the phase on which the high impedance fault condition
Figure 2Arcing Fault Energy Levels & Randomness Signature
Figure 1Normal Energy Levels
5
exists in a hierarchical manner. First, if a significant loss of load triggered the arc detection algorithms, and if there was a significant loss on only one phase, that phase is identified. If there was not a single phase loss of load, and if an overcurrent condition on only one phase triggered the algorithm, that phase is identified. If both of these tests fail to identify the phase, the phase with a significantly higher confidence level (e.g. higher than the other two phases by at least 25%) is identified. Finally, if none of these tests provides phase identification, the device analyzes the correlation between the peak portion of the voltage waveform with the neutral/ground arc bursts. If there is correlation with a particular phase voltage, that phase is identified. If that test fails, the phase is not identified. Conductors that do not continuously arc, but have time periods between arcs can be detected by the arcing suspected identifier algorithm. For example, if arcing is caused by tree limb contact or insulator
degradation, arcing will typically be present intermittently with relatively long periods of inactivity. In such cases, arcing may be affected by such factors as the motion of a tree limb or the moisture and contamination on an insulator. The purpose of the arcing suspected identifier algorithm is to detect multiple, sporadic arcing events. If taken individually, such events are not sufficient to warrant an arcing alarm. When taken cumulatively, however, these events do warrant an alarm to system operators, so that the cause of the arcing can be investigated. The user can select the number of maximum number of arcs and an acceptable period of time. Due to the possible long periods of arcing inactivity, a HiZ decision could be reached in up to 5 minutes. III. Signature Based HiZ Application Issues The following sections highlight a number of application guidelines developed over the last several years of HiZ detection device installations.
Optional Voltage Inputs
60 Hz Block& Amplifier
Convert ToOdd, Even &
Non-Harmonics
Identify Large
Changes In Energy
RMS Current Detector
Phase Identi- fication
DownedConductor
Ia,b,c,n
Ia,b,c,
RandomnessAlgorithm
Load Event Detector
Load Analysis Algorithm
Load Extraction Algorithm Arc Burst Pattern Spectral Analysis
Arcing Suspected Identifier
Expert Arc
Detector
Arcing Suspected Identifier
PatternAnalysis
Confirmation Checks
ArcingSuspected
Alarm
ArcingAlarm
Expert Arc Detector
Identify Random
Changes In Energy
Figure 3Signature Based HiZ Detection Block Diagram
In
Energy Algorithm
6
a. Arcing Fault Response Procedures As previously described, signature based HiZ algorithms can provide three different output designations, namely: arcing suspected (or intermittent arcing), arcing detected, and downed conductor. Each utility needs to establish standard responses to each of these outputs. At this stage in the implementation cycle, typical responses have been as outlined in Table 1. If tripping of the feeder is chosen as a course of action, one of the ensuing challenges is locating the HiZ fault. While energized, the arcing fault / downed conductor can often be located via sight, sound, radio frequency interference (RFI), or loss of power in an area. Once the feeder is de-energized, all the above become non-functional. As such, the decision to de-energize or not to de-energize must be based on the relative consequences of each action. For example, if the region is around a school or residential area, there is a strong bias to de-energize. On the other hand, if the arcing line is feeding a hospital or an industrial region, the decision might be to alarm.
Condition Primary Response
Secondary Response
Arcing Suspected Alarm -
Arcing Detected Alarm Trip
Downed Conductor Trip Alarm
It is strongly recommended that any utility installing HiZ detection devices develop a written response procedure to each of the above HiZ conditions. b. Line Grounding The HiZ element was primarily designed for solidly grounded systems. The same algorithm has been tested with some degree of success on impedance grounded systems as well a few tests on ungrounded systems. The algorithm did pick up, however, consistency of operation was an issue. One other test performed involved a downed conductor opposite the source side of the line (see Figure 4). In this configuration, there was a down-stream transformer. When the transformer was loaded, detection of the downed conductor back in the substation was achieved.
c. CT Ratio The ground current on a downed conductor may be only a few amperes on a feeder with several hundred amperes of load. Choosing as small a CT ratio as possible maximizes the arcing component in the waveform and optimizes the ability of the HiZ algorithms to detect the HiZ fault. The algorithm has been successfully tested with CT ratios on the order of 1200:5. The HiZ algorithm use standard relay accuracy CTs. d. Sensitivity Vs. Security The major setting in a HiZ device is Arcing Sensitivity. HiZ detection is no different from any other protection scheme in that there is a trade-off between sensitivity and security. An algorithm can be designed to pick-up on almost any disturbance on the feeder. The challenge is being able to discriminate between events. The sensitivity setting represents a balance control between sensitivity and security. Security can be enhanced by requiring multiple detections of the arcing condition before a HiZ condition is declared. Typical recommendations are for a balance of sensitivity and security in the normal operating mode. Under conditions such as an impending storm, it may be desirable to actually de-sensitize the algorithm, as with everything wet, there is usually much arcing leakage around the system. On the opposite extreme, if a region has been experiencing a dry spell, it may be desirable to set the sensitivity to maximum. In any event, remote control of setting groups to allow such changes is desirable. e. Overcurrent Coordination The general consensus for feeder fault protection is that, given there is sufficient current, to have the overcurrent element(s) operate and trip out the feeder before the HiZ element operates. This dictates the need for an overcurrent coordination timeout period. Setting of this coordination time should be based on the operating time of the time overcurrent (TOC) element for a fault located at the end of the feeder. The HiZ algorithm can operate in as little as 20 seconds whereas a TOC relay may take much longer to operate. Too long a coordination time (> 1 minute) is not recommended as HiZ faults tend to decrease in magnitude over time as the conductor �glasses over� and/or breaks � resulting in a smaller ground contact area. A related application note on TOC relays is the need to coordinate not only the operate time, but also the reset time. On HiZ faults, a TOC element will �ratchet�, that is, move forward for a period of time
Table 1 Typical Arcing Condition Responses

7
and then begin to reset as the fault current drops below the pickup level of the relay. If a TOC relay with instantaneous reset is placed downstream of a TOC relay with timed reset, the relays may mis-coordinate resulting in the disconnection of more of the feeder than desired. IV. Experience to Date To date, utilities around the world have installed over several hundred HiZ detection devices. Dozens of real arcing suspected, arcing detected, and downed-conductor events have been recorded with a number of the installations connected to trip. Almost all report into SCADA. The ratio of �detected� downed conductors to the total population of downed conductors has been about 80%. The following are a few highlights from the accumulated experience base:
• On the JEA Jacksonville, FL system, reports of �arcing suspected� were being received from a HiZ device at the same time every day for a period of time. Figure 5 shows �arc confidence�, integrated arcing information from the reporting IED. Note that the arc confidence rose quickly for two integration periods then settled out. As a result, the detection on this event was reported as �arcing suspected� initially and shortly after, �arcing detected� was declared. Inspection of the line uncovered no obvious arcing sites. Following this result, an analysis of the customer base connected to the suspect feeder was
performed and one customer with a heavy-duty process was identified. A phone call to the identified customer was made to inquire if any of his processes included arc furnaces or other arcing loads to which the customer responded �no�. On the day following the inquiry by JEA, the customer phoned back and stated that a large motor in their facility had just failed. The HiZ device was able to see through the distribution transformer into the customer site and the customer motor. • The connection to the high voltage bushing of a distribution transformer had become loose and began to arc. The resulting signature was detected by a HiZ device (as well as the customer, when his lights went out once the connection burned through.) • After a long dry spell, a rainstorm came into the area. Many of the insulators on the feeders, which had become quite contaminated, began to conduct in an arcing manner. In conjunction with the storm was lightning, which produced a transient fault on one of the feeders. As a result, the HiZ IED saw fault current followed by arcing and declared a �downed conductor�. • Many utilities have performed staged fault tests on their systems in order to test the effectiveness of HiZ detection. In most cases, the utility would include a �challenge� test case � typically a conductor dropped on asphalt or sand. In this one test, the conductor was dropped on asphalt with the
To Substation
3-Ph Xfmr
Industrial Load
Downed Conductor
Figure 4Load Side Downed Conductor

8
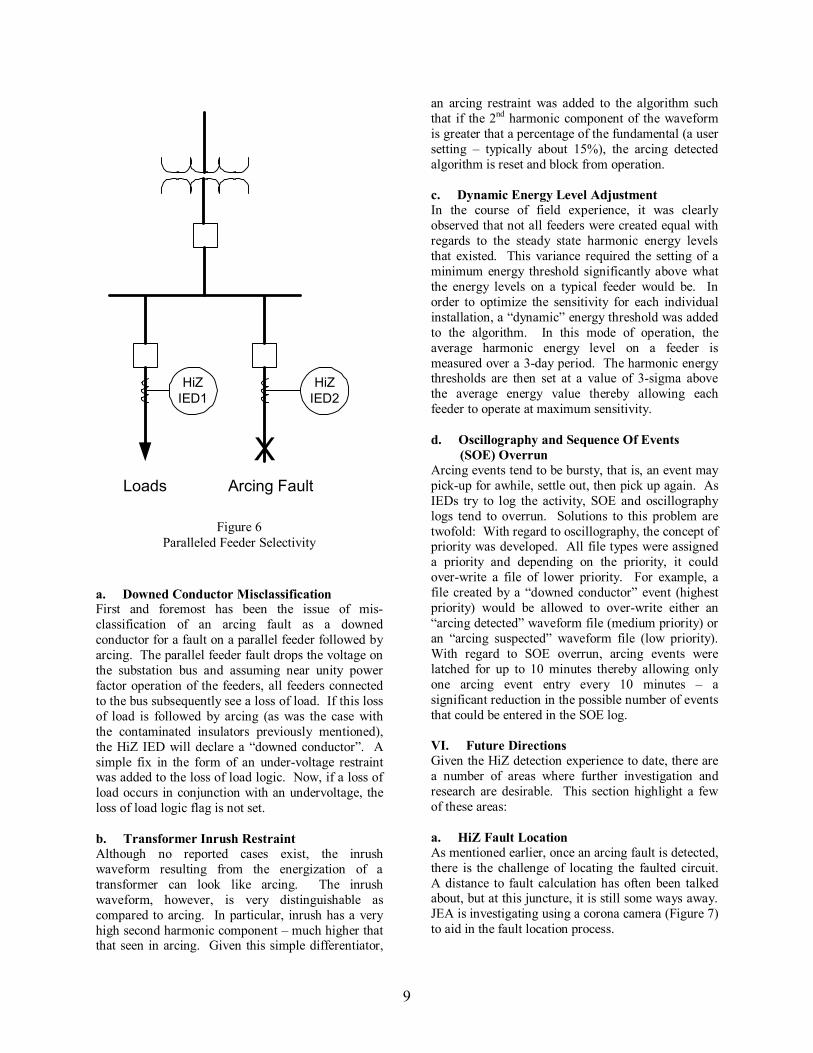
expectation of no detection. What occurred, however, was that the arc found paths through cracks in the asphalt that permitted arcing and subsequent detection by the HiZ device. • One question often asked is how �directional� is the HiZ algorithm? To find the answer to this question, one utility ran staged fault tests with HiZ IEDs installed on two parallel feeders (see Figure 6). HiZ faults were placed on one feeder while the performance of the parallel feeder was observed. In all cases, the HiZ IED on the non-faulted feeder did not detect any arcing, while the HiZ IED on the faulted line detected about 80% of the HiZ staged faults. • As utilities expand their usage of HiZ devices, they are surprised by the number of arcing conditions existing on their distribution system. As JEA added HiZ signature devices to 27 feeders, it came as a total
surprise that 50% of these feeders began to report �arcing suspected� conditions. Now that JEA knows that something is happening, they plan to use other devices to help locate/determine the root of the arcing conditions • Finally, in the challenge arena, several HiZ faults were staged on dry sandy soil. In most cases, the HiZ IED did not detect arcing. Analysis of the waveforms from these faults does show a change in energy; however, sand does not exhibit the �randomness� of other material types. V. Lessons Learned As a result of the knowledge base garnered from several years of field experience, a number of enhancements to the HiZ algorithms have been identified.
Figure 5Arcing Signature for Failing Motor
9
Loads Arcing Fault
X
HiZIED1
HiZIED2
a. Downed Conductor Misclassification First and foremost has been the issue of mis-classification of an arcing fault as a downed conductor for a fault on a parallel feeder followed by arcing. The parallel feeder fault drops the voltage on the substation bus and assuming near unity power factor operation of the feeders, all feeders connected to the bus subsequently see a loss of load. If this loss of load is followed by arcing (as was the case with the contaminated insulators previously mentioned), the HiZ IED will declare a �downed conductor�. A simple fix in the form of an under-voltage restraint was added to the loss of load logic. Now, if a loss of load occurs in conjunction with an undervoltage, the loss of load logic flag is not set. b. Transformer Inrush Restraint Although no reported cases exist, the inrush waveform resulting from the energization of a transformer can look like arcing. The inrush waveform, however, is very distinguishable as compared to arcing. In particular, inrush has a very high second harmonic component � much higher that that seen in arcing. Given this simple differentiator,
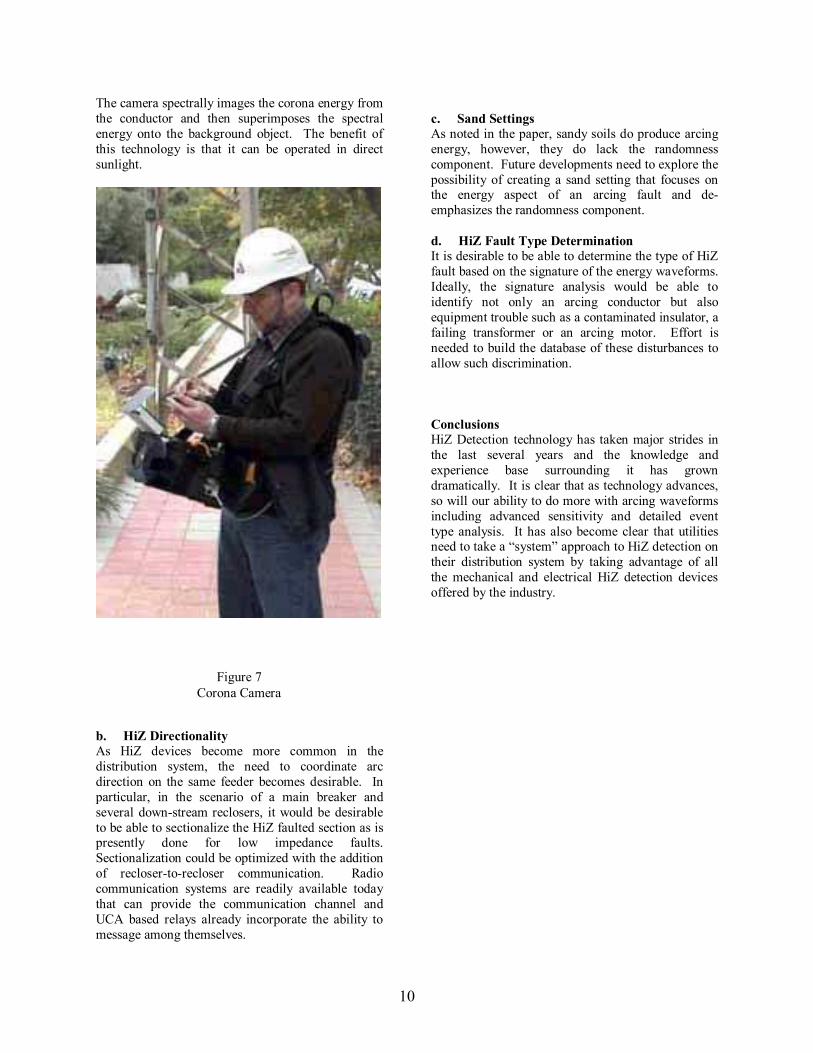
an arcing restraint was added to the algorithm such that if the 2nd harmonic component of the waveform is greater that a percentage of the fundamental (a user setting � typically about 15%), the arcing detected algorithm is reset and block from operation. c. Dynamic Energy Level Adjustment In the course of field experience, it was clearly observed that not all feeders were created equal with regards to the steady state harmonic energy levels that existed. This variance required the setting of a minimum energy threshold significantly above what the energy levels on a typical feeder would be. In order to optimize the sensitivity for each individual installation, a �dynamic� energy threshold was added to the algorithm. In this mode of operation, the average harmonic energy level on a feeder is measured over a 3-day period. The harmonic energy thresholds are then set at a value of 3-sigma above the average energy value thereby allowing each feeder to operate at maximum sensitivity. d. Oscillography and Sequence Of Events (SOE) Overrun Arcing events tend to be bursty, that is, an event may pick-up for awhile, settle out, then pick up again. As IEDs try to log the activity, SOE and oscillography logs tend to overrun. Solutions to this problem are twofold: With regard to oscillography, the concept of priority was developed. All file types were assigned a priority and depending on the priority, it could over-write a file of lower priority. For example, a file created by a �downed conductor� event (highest priority) would be allowed to over-write either an �arcing detected� waveform file (medium priority) or an �arcing suspected� waveform file (low priority). With regard to SOE overrun, arcing events were latched for up to 10 minutes thereby allowing only one arcing event entry every 10 minutes � a significant reduction in the possible number of events that could be entered in the SOE log. VI. Future Directions Given the HiZ detection experience to date, there are a number of areas where further investigation and research are desirable. This section highlight a few of these areas: a. HiZ Fault Location As mentioned earlier, once an arcing fault is detected, there is the challenge of locating the faulted circuit. A distance to fault calculation has often been talked about, but at this juncture, it is still some ways away. JEA is investigating using a corona camera (Figure 7) to aid in the fault location process.
Figure 6 Paralleled Feeder Selectivity
10
The camera spectrally images the corona energy from the conductor and then superimposes the spectral energy onto the background object. The benefit of this technology is that it can be operated in direct sunlight.
b. HiZ Directionality As HiZ devices become more common in the distribution system, the need to coordinate arc direction on the same feeder becomes desirable. In particular, in the scenario of a main breaker and several down-stream reclosers, it would be desirable to be able to sectionalize the HiZ faulted section as is presently done for low impedance faults. Sectionalization could be optimized with the addition of recloser-to-recloser communication. Radio communication systems are readily available today that can provide the communication channel and UCA based relays already incorporate the ability to message among themselves.
c. Sand Settings As noted in the paper, sandy soils do produce arcing energy, however, they do lack the randomness component. Future developments need to explore the possibility of creating a sand setting that focuses on the energy aspect of an arcing fault and de-emphasizes the randomness component. d. HiZ Fault Type Determination It is desirable to be able to determine the type of HiZ fault based on the signature of the energy waveforms. Ideally, the signature analysis would be able to identify not only an arcing conductor but also equipment trouble such as a contaminated insulator, a failing transformer or an arcing motor. Effort is needed to build the database of these disturbances to allow such discrimination. Conclusions HiZ Detection technology has taken major strides in the last several years and the knowledge and experience base surrounding it has grown dramatically. It is clear that as technology advances, so will our ability to do more with arcing waveforms including advanced sensitivity and detailed event type analysis. It has also become clear that utilities need to take a �system� approach to HiZ detection on their distribution system by taking advantage of all the mechanical and electrical HiZ detection devices offered by the industry.
Figure 7 Corona Camera
11
Bibliography
1. High Impedance Fault Detection Technology. Report of PSRC Working Group D15; http://www.pes-psrc.org/d/D15MSW60.html
2. B.M. Aucoin, R.H. Jones, �High Impedance Fault Implementation Issues�, IEEE Transactions on Power Delivery, January 1996, Volume 11, Number 1, pp 139-148.
3. R. Patterson, W. Tyska, �A Microprocessor-Based Digital Feeder Monitor with High-Impedance Fault Detection�, presented at 47th Annual Conference for Protective Relay Engineers � Texas A&M University, March 1994.
Authors Mark Adamiak received his Bachelor of Science and Master of Engineering degrees from Cornell University in Electrical Engineering and an MS-EE degree from the Polytechnic Institute of New York. Mark started his career with American Electric Power (AEP) in the System Protection and Control section where his assignments included R&D in Digital Protection, relay and fault analysis, Power Line Carrier and Fault Recorders. In 1990, Mark joined General Electric where his activities have ranged from development, product planning, and system integration. In addition, Mr. Adamiak has been actively involved in developing the framework for the implementation of the MMS/Ethernet peer-to-peer communication solutions for next generation relay communications. Mark is a Senior Member of IEEE, past Chairman of the IEEE Relay Communications Sub Committee, and a member of the US team on IEC TC57 - Working Group 11 on Substation Communication. Craig Wester was born in Belgium, Wisconsin, and received a B.S. in Electrical Engineering with a strong emphasis on power systems from the University of Wisconsin-Madison in 1989. Craig joined General Electric in 1989 as a utility transmission & distribution application engineer. Mr. Wester is currently an employee of GE Power Management as Regional Sales Manager. Mr. Wester�s role consists of providing sales management, power system protection application and support to the investor-owned utilities, rural electric cooperatives, electric municipals, consultants, and OEMs throughout the southern US for GE relaying equipment. Mr. Wester is a member of the IEEE.
Charles Jensen is Manager, System Protection and Control for JEA, Jacksonville, FL. In this role, Mr. Jensen, oversees and manages all protective relaying and control from generation through the TS&D systems up to the ultimate utilization customer. Prior to this position, Mr. Jensen was Director, System Information and Distribution Automation (DA) for the Jacksonville Electric Authority. As Director of DA, Mr. Jensen's responsibilities included management of a multi-million, multi-year, multi-phase Distribution Automation Project. Mr. Jensen has held progressively responsible positions within the utility industry leading to his present position. As Division Chief of Technical Support Engineering, Mr. Jensen was responsible for distribution system standards, AM/FM/GIS systems, distribution system connectivity databases, power quality, distribution system analysis and developing of engineering design systems. Other areas of specialty include, trouble call management systems, distribution transformer test system design and implementation, protection and control systems, substation designs, preventative maintenance program development and implementation and fleet and equipment management. Mr. Jensen received his M.S. degree in Electrical Engineering/Systems Science and a B.S. degree in Electrical Engineering from Michigan State University. Mr. Jensen is a dually registered Professional Electrical Engineer and Master Electrician in both Florida and Michigan. Mr. Jensen is a member of the IEEE and other professional organizations. Manish Thakur completed his B.S. in Electrical Engineering from REC-NAGPUR of India. From 1996-1999, Mr. Thakur worked for ABB Network Control & Protection Business Area. From 1999-2001, Mr. Thakur completed his M.S. in Electrical Engineering from the University of Manitoba. He is currently working for GE Power Management as an application engineer. He is a member of IEEE.