Embed Size (px)
Citation preview

Electronic copy available at: http://ssrn.com/abstract=1082438
1
High-Growth SMEs and the Availability of Private Equity and Venture Capital in Brazil
Leonardo de Lima Ribeiro*
05/2007
ABSTRACT
This chapter discusses private equity and venture capital (PE/VC) in Brazil. Firstly, it is shown that PE/VC has a strong impact in the Brazilian capital markets, with PE/VC-backed companies representing close to half the amount raised by initial public offerings (IPOs) in the stock exchanges. By examining two of these deals, which involved small and medium-sized enterprises (SMEs), it is argued that PE/VC managers have acted as catalysts of the impressive growth rates experienced before these companies entered the stock markets. Indeed, PE/VC firms represent an important segment of the capital market, with specialization to invest in high-growth innovative SMEs. PE/VC managers exercise superior selection, monitoring and governance that mitigate the uncertainty and risks of investing in such companies. Despite its successes in Brazil, PE/VC is still very much restrained by the challenging local economic and institutional environment. Thus, changes in the legal and fiscal system, simplification in bureaucratic procedures, and other such improvements will most likely result in a sensible growth in the Brazilian PE/VC industry, with positive impact in the SME access to finance in Brazil. Since most countries in Latin America share similar economic and institutional traits with Brazil, the path followed by the local PE/VC industry can serve as an example for other countries to learn with its successes and failures. 1 – A new segment of capital market has emerged in Brazil Between 2004 and 2006, Brazil experienced a significant expansion of initial public offerings (IPO) on the Brazilian Stock Exchange (Bovespa). The 40 new entrants raised approximately US$ 10 billion. While this came somewhat as a surprise after years of a shallow IPO market, it has also marked the existence of a new breed of financial intermediaries in Brazil, the private equity and venture capital (PE/VC) firms. PE/VC firms are financial intermediaries that perform investment in equity or quasi-equity instruments of unlisted companies and projects. It has been used around the world to finance privatizations of government-owned firms, infrastructure development, buyouts, and specially the creation and expansion of high-growth small and medium-sized enterprises (SMEs). Differently from most sources of financing, PE/VC firms provide more than money. After a careful screening process, they usually require a seat on the board of directors of the * Researcher at the Center for Private Equity and Venture Capital Research – Fundação Getúlio Vargas Graduate School of Business (GVcepe). This is a preliminary version of the chapter prepared for inclusion in the book: Crabbe, Carolin A, ed. 2007. Small Business Access to Finance in Latin America and the Caribbean. Washington, DC: Inter-American Development Bank. Do not distribute. I am indebted to an anonymous referee and especially to Carolin Crabbe (the editor), Susana Garcia-Robles and Patrícia Freitas for very useful comments and advice.

Electronic copy available at: http://ssrn.com/abstract=1082438
2
companies in which they invest. During the long-term relationship, PE/VC managers provide portfolio companies with strategic advice and access to their valuable business network. Due to the rigor of the PE/VC investment and monitoring process, which includes detailed due diligence and the adoption of serious corporate governance, PE/VC recipients have a stamp of approval that reduces the risks perceived by their suppliers, customers, external finance providers and employees. After a maturation period, PE/VC firms seek to exit their investments by selling shares to strategic buyers, external investors or even to existing shareholders, in order to obtain significant capital gains. Sometimes, exits take place in the stock exchange indicating that the invested company has successfully graduated to the stage of receiving investment from a great number of institutional investors and individuals. Table 1 lists the 40 companies that completed IPOs on Bovespa between 2004 and 2006. It reveals that 19 IPOs were made by companies that were financed by PE/VC, representing US$ 4.59 billion in new funds raised, close to half the total amount raised in that period. In 2004, PE/VC investment represented 76.7% of total. While the relative figure has tapered in 2005 and 2006, the absolute size increased year after year, making 2006 IPOs of PE/VC-backed companies exceed the total amount raised by all of the 2005 IPOs. The analyses illustrates that the Brazilian PE/VC industry has reached a maturity and size that generates a visible and economically significant impact in the stock markets. Moreover, the PE/VC-backed companies came from sectors that were new to the stock exchange, such as software (Datasul and Totvs), Internet (UOL and Submarino), laboratorial services (DASA), dental care insurance (Odontoprev), administration of credit cards (CSU), car rental (Localiza) and cosmetics (Natura). By examining the history behind the IPOs of some of the PE/VC-backed companies, specially those that occurred in 2006, it is interesting to note that many were SMEs1 at the time the initial investment was made. Clearly, the PE/VC investment enabled SMEs like CSU, Gafisa, Lupatech, Odontoprev, Submarino Totvs and Vivax to structure their operations, expand and successfully graduate to the stock exchange. PE/VC investments cover different stages of business development, from the financing of an idea or invention (seed capital), to the acquisition of significant stakes in existing corporations (buyout), to start-up and expansion financing for high-growth SMEs. Typically, investments in early stage companies (i.e. seed capital, start-up and expansion stages) are considered as the venture capital (VC) segment of the PE/VC industry. In more developed economies, PE/VC firms tend to specialize by stage, region and sector. This is not usually the case in a smaller market such as Brazil, where it is common to see PE/VC managers doing both VC and buyout deals. For example, one of the biggest PE/VC firms in Brazil, GP Investimentos, has invested in privatizations (e.g., ALL and Equatorial) as well as in start-ups (e.g., Mandic and Submarino). 1 According to the Banco Nacional de Desenvolvimento Econômico e Social (BDES), a Brazilian company is considered to be small-sized when its revenues are below R$ 10.5 million. A medium-sized company posts revenues of R$ 10.5 to R$ 60 million. Between 1996 and 2006, the Brazilian currency (Real) varied between 0.97 and 3.95 to the dollar.

3
Table 1: IPOs in the Brazilian Stock Exchanges2
Year Company Funds raised
US$ mn
Date of PE/VC
Investment
Size at investment
date Sector
Porto Seguro 136 - - Insurance DASA 158 07/1999 62 [C] Laboratorial services
Grendene 216 - - Footwear production CPFL 287 11/1997 1,317 [C] Energy generation and distribution ALL 189 07/1996 179 [C] Transportation and logistics Gol 283 02/2003 192 [C] Airline
2004
Natura 243 12/2000 519 [C] Cosmetics Total 2004 1,512
Total to PE/VC-backed 1,160 (76,7) UOL 267 09/1999 74 [C] Internet service provider Cosan 350 - - Bioenergy (ethanol)
Nossa Caixa 419 - - Banking OHL Brasil 212 - - Toll-road concessionaire
Energias do Brasil 354 - - Energy generation and distribution TAM 225 11/1997 475 [C] Airline
Localiza 108 03/1997 191 [C] Car rental Submarino 176 06/1999 0 [S] E-commerce
2005
Renar Maçãs 6 - - Fruit production Total 2005 2,117
Total to PE/VC-backed 776 (36,7) Dufry 344 03/2006 334 [C] Duty-free retail Lopes 193 - - Real estate brokerage and consulting
Positivo 265 - - Software and hardware production Odontoprev 209 08/1998 9 [S] Dental care insurance
Brasil Ecodiesel 175 - - Bioenergy (ecodiesel) Terna 293 - - Energy distribution
Profarma 188 - - Pharmaceuticals Brascan 556 - - Real estate
M. Dias Branco 193 - - Food Santos Brasil 436 09/1997 76* [C] Port container terminal administration Klabin Segall 244 - - Real estate Medial Saúde 340 - - Health maintenance
Abyara 75 - - Real estate brokerage and consulting MMX 510 - - Mining
Datasul 140 2S/1998 55 [M] Enterprise resource planning systems Lupatech 220 08/1987 2 [S] Precision foundry
CSU 165 07/1997 43 [M] Administration of credit cards ABnote 227 - - Plastic cards, ID systems and printing
Equatorial 251 04/2004 146 [C] Energy distribution Totvs 213 04/1999 30 [M] Enterprise resource planning software
Company 133 - - Real estate Gafisa 438 12/1997 26* [M] Real estate development Copasa 370 - - Sanitation
2006
Vivax 241 08/1996 0 [S] Cable television services Total 2006 6,419
Total to PE/VC-backed 2,657 (41,4) Grand Total 10,048
Total to PE/VC-backed 4,593 (45,7)
2 Data obtained with companies, Bovespa, CVM, and PE/VC firms. Size equals revenues (in US$) in the year ending closest to the PE/VC investment date. Values marked with an asterisk refer to 1998. Letters in brackets refer to BNDES classification of size: [C] Corporate; [M] Medium; [S] Small. Figures in parentheses are percentage of the total. GP Investments and BrasilAgro were excluded since they are PE/VC firms.

4
There are two companies – Odontoprev and Totvs – that provide some insights into how a small and a medium-sized enterprise become larger to the point of accessing the stock markets after receiving a few rounds of PE/VC investment. These cases illustrate the positive impact of PE/VC investment in Brazilian SMEs that face difficulty in raising capital to undertake ambitious growth plans. Furthermore, they show how the external finance provider can help the SME circumvent the initial skepticism of new clients about their ability to provide high-quality and reliable services, especially those that are most critical to corporations and financial institutions. 1.1 – Case Study 1: Microsiga/Totvs3 Totvs is a US$ 550 million dollar company listed in the Brazilian Novo Mercado, the top corporate governance segment at Bovespa. Formerly known as Microsiga, Totvs is now the leader of enterprise resource planning (ERP) software and related services for SMEs in Latin America. According to the International Data Corporation - IDC (2004), ERP is a US$ 0,72 billion market in Latin America and it is expected to grow at 8.6% until 2008. About 42% of the market is in Brazil, and Totvs has managed to secure a 29% stake of it. However, the company is also generating 5.5% of revenues in other Latin American countries, through its office in Mexico and Argentina. Since more than half of the market is outside Brazil, the company still has room to expand and continue its astonishing growth trajectory. Totvs is now considered as an example of a successful entrepreneurial IT company in Latin America, having experienced two rounds of private equity investments before the March 2006 initial public offering (IPO). But in 1998, entrepreneurs Laércio Cosentino and Ernesto Mário Haberkornit and their 14 year-old medium-sized business Microsiga were struggling to compete in a highly fragmented ERP market that featured several local players and foreign software companies with international reputation such as Baan, Oracle, Peoplesoft and SAP. At that time, Gartner, an IT consultancy and think-tank foresaw a consolidating ERP market. As AMR Research (2005) would later confirm, while the top ERP vendors in Brazil accounted for 59% of the market in 1999, only six years later this figure had reached 72%. Beginning in the 1990s, several strategic decisions were taken by Microsiga, including: the opening of the first franchise (1990); the first strategic partnerships (1993); ISO 9001 accreditation, the first among Brazilian software company (1996); the entry in Argentina (1997); and the development of new ERP modules (1998). No outside financing was used. But competition was getting harsher forcing Laércio and Mário to search for an international partner that could help them consolidate their position in Brazil through acquisitions, and expand into Latin America, where ERP has a very low penetration rate and SMEs, Microsiga's usual customers, abound. After talking to 12 private equity firms, they concluded a deal with Advent International. Advent was founded in 1984 and it is one of the biggest independent private equity managers in the world, with more than US$ 10 billion raised for PE/VC investments. In 1996, Advent 3 Case prepared based on an interview organized by GVcepe with Totvs' CEO, Laércio Cosentino, and Advent's senior partner, Patrice Etlin. Additional information was collected in the IPO prospectus, as well as in Totvs and Advent's websites.

5
began operations in Latin America with a US$ 225 million fund. In 2002 and 2005 two follow-on funds were raised, of US$ 265 million and US$ 375 million, respectively. Advent has a local presence in three cities: Sao Paulo, Mexico City and Buenos Aires and a team of 16 professionals. Until November 2006, its Brazilian team had examined more than 430 deals and invested in about eight medium-sized companies in several different sectors. For Advent, Microsiga represented a rare opportunity to invest in an innovative company and national market leader that could consolidate its position in Brazil and obtain ERP market leadership in the fast growing Latin American market. The company had a distribution network that could effectively reach the SME segment in the region. Before closing the deal in April 1999, Microsiga was a US$ 30 million revenue company financing its expansion as most Latin American SMEs do, with retained earnings. Its EBITDA4 was then at about US$ 5 million. Debt was not an option at hand. Indeed, just before the 2006 IPO, the company still had absolutely no long-term debt and virtually no short-term debt (i.e., US$ 900,000 of short-term debt for a total capitalization of US$ 32.6). But since the company was already profitable, the search for a private equity investor was more about reassuring prospective customers about service quality and product reliability than just getting the money needed to finance acquisitions. In a SME market segment under assault by important international players, Microsiga needed a "foreign surname" as Laércio put it. So anytime a prospective client would ask about Microsiga's reliability, he could calmly suggest the client to call the Boston offices of his international partners. Despite offers from other private equity firms, the team decided to stick with Advent, not only for its strong international name, but also for having a local team that could make decisions pertaining to local deals without having to consult with their U.S. headquarters each time. The ERP software market is a dynamic one requiring fast decision-making. Negotiations between Microsiga and Advent took more than one year. In Brazil, Advent usually invests through majority stakes, in order to ensure enforcement and make the necessary changes in the company, especially if growth slows down. According to Patrice Etlin, one of Advent's partners, minority investments have more complex contracts that are difficult to enforce under the intricate institutional environment prevalent in Brazil. However, Microsiga was an exception. It not only featured a strong entrepreneurial team with a clear financial understanding, but it was not a family owned business nor was going through problematic successions, as it is so commonly seen in Brazilian medium-sized companies. So Advent felt it could comfortably acquire a minority stake of 25%. During the post-investment period, Advent was key in the structuring and internationalization of Microsiga's business. By taking seats on the board of directors, it brought a strong corporate governance culture and strategic advice. It also provided Microsiga with prospective customers, such as the other medium-sized companies in Advent's portfolio. When Microsiga decided to enter the Mexican market, the local Advent office provided invaluable advice. In February 2005, three major transactions took place simultaneously. First, the company repurchased Advent's 25% interests for US$ 12.9 million. That same year, Logocenter was 4 Acronym for earnings before interest, taxes, depreciation and amortization, which is considered as a measure of cash flow.

6
acquired with 11.9% of Totvs shares plus a cash payment of US$ 7 million. The operation was a typical recapitalization financed by the Banco Nacional de Desenvolvimento Econômico e Social Participações S.A. (BNDESPar)5 for US$ 16.4 million, corresponding to 16.7% of shares. Due to Totvs high governance standards, BNDESPar waived the right to perform due-diligence before investing. Since the initial PE/VC investment, Microsiga/Totvs has undergone a complete transformation. Its revenues grew from US$ 30 million to US$ 105.7 million. Between 2003 and 2005, revenues grew at an outstanding annual rate of 40%. Now, more than 8,300 customers are estimated to use Totvs products and services. Expending around 10% of revenues in R&D and featuring a team of 284 professionals fully dedicated to it, the company has also achieved technological advancements such as a proprietary software language that translates into significant flexibility and reduced costs for the development of new solutions. In the stock exchange, the company now has different obligations to stockholders. Up to November 2006, more than 700 presentations were made to investors. In every one of these meetings, the company had to be prepared to answer effectively to questions about its performance and future growth strategies. Since the IPO, the stock price has grown 41% against 11.7% valorization of the main market index. For the future, the company is betting in the newly structured management consulting services to go along its existing ERP implantation and maintenance service line. The case of Totvs shows how a Brazilian medium-sized software company reacted to increasing competition from global market leaders and skeptical reactions from potential clients. It took a strategic decision to obtain investment from an international and renowned private equity group that also brought advice, governance and an implicit stamp of approval for its services and products. In a following round of investment from BNDESPar, the company could simultaneously buy back all shares owned by Advent, and finance the serial acquisition of local competitors to promote its rapid growth. While in 1999, year of the first round of investment, the company was already generating positive cash flows that could eventually finance most of the subsequent acquisitions, Totvs would probably had to reduce important expending in R&D and training to do it exclusively with retained earnings. 1.2 – Case Study 2: Odontoprev6 The following is the story of Odontoprev, a dental benefits company in a very fragmented but growing market, providing an extremely important health service to the Brazilian population. In order to grow, the company performed serial acquisitions and invested in a robust technological platform to better manage the risk and quality of its services. Once again, PE/VC played an important role in the company's rapid development. During its initial public offering (IPO) on the Brazilian Novo Mercado on November 30, 2006, Odontoprev stocks were priced at US$ 12.9, resulting in a total market capitalization of US$ 329 million. The company is now the leader of the dental plan market in Brazil, a fast growing segment of the health care insurance (HCI) market which, according to the Agência 5 BNDESPar is the private equity arm of the national development bank, a government-owned firm. 6 Case prepared based on information collected in the IPO prospectus, as well as in Odontoprev's website.

7
Nacional de Saúde Suplementar (ANS)7, was growing at 17.9% a year between December 2000 and June 2006. HCI provides an important service for a Brazilian population that is badly attended by the public health system. While 36.1 million Brazilians are covered by HCI, dental benefits are relatively new to the population, with a mere 3.8% penetration rate. Only 19.2% (or 6.9 million) of HCI’s plan participants are also covered by dental plans. With 589 providers, the market is highly fragmented. The seven largest companies account for a 40.8% market share and the 64 largest companies hold 79.7% of the market. Odontoprev leads with a modest 17.6% market share, or 1.4 million participants covered. But only eight years ago, Odontoprev was still a small-sized business founded by a group of dentists to serve a few multinational corporations in Brazil. In 1998, TMG Capital Partners invested in Odontoprev. This would forever change the US$ 8.7 million revenue Odontoprev run by dentist-entrepreneur Randal Luiz Zanetti and his partners. At that time, it had 82 employees and a thin 3% market share (90,000 plan participants). While the company had a good management team and a good technological platform, it clearly needed a well-defined growth strategy and the financing to implement it. TMG Capital Partners is an independent PE/VC management firm founded by Luis Francisco Novelli Vianna, a renowned executive and angel investor, and a group of experienced partners. TMG Capital is responsible for managing TMG PE I, a US$ 100 million fund formed by international investors and TMG partners. Besides providing capital to privately held companies with good management teams and outstanding growth prospects, TMG Capital also adds value to portfolio companies by working closely with entrepreneurs. This allows TMG managers to provide strategic advice and deliver best-practice management techniques that will enable Brazilian SMEs to become market leaders. When Odontoprev received the first round of investment, TMG had already performed a complete due diligence including management and market assessment. Their bet was that a fragmented and fast growing dental plan market could translate into generous growth opportunities for Odontoprev if it were well capitalized. The strategy was to rely on TMG Capital's financial power and expertise to execute selective acquisitions to expand Odontoprev's market share. At the same time, part of the investment would generate significant economies of scale by building on Odontoprev's strong brand name, management and IT systems. The deal was concluded with a majority stake being acquired by TMG, corresponding to two-thirds of shares by the time of the IPO. Four year after the investment, Odontoprev had become the market leader, insuring 700,000 people. In 2002, it posted US$ 42.5 million in revenues. During the period, the company has also hired experienced executives and invested in proprietary software to manage its operations and actuarial risks. Due to its innovativeness, the so-called DCMS-7 software was registered with the Instituto Nacional da Propriedade Intelectual (INPI)8. In 1999 and 2000, Odontoprev acquired three smaller competitors: Unidont, Cade and Clidec. Between 2003 and 2005, Odontoprev increased its number of clients by 48.4%. Revenues went up from US$ 32.9 to US$ 61.1 million. Cash flow (EBITDA) in local currency increased 7 ANS is the national private health agency created in 2000 to regulate the market. 8 INPI is the Brazilian intellectual property protection office.

8
2.6 times. Today, the company has around 650 employees and a network of 12.5 thousand dentists operating in more than 1,000 Brazilian cities. But the growth story does not seem to be over yet. With the funding from the IPO, Odontoprev has exercised the option to acquire Dentalcorp, the 5th largest DCI in Brazil. The US$ 11.4 million deal has brought 180,000 people under the coverage of Odontoprev’s dental benefits business. Most of these new plan participants are workers of Brazilian SMEs, a market segment that is still vastly unexplored by the company. With all the potential M&A targets, Odontoprev believes it could rapidly expand its insurance coverage to two million plan participants. Clearly, it would have been virtually impossible for Odontoprev to finance such an ambitious expansion with traditional debt. Indeed, the company entered the stock markets with no debt at all. Besides acquisitions, the company also plans to grow by: (i) increasing revenues with existing clients; (ii) diversifying regionally – the dental plan market is concentrated 63.7% in the southeastern region of Brazil; and (iii) convincing more HCI customers to include dental benefits in their plans. HCI has about 2.7 million plan participants that are not covered by dental benefits, representing a huge market that Odontoprev expects to tap by partnering with health care providers and insurance brokers. As for the stock price, two months after the IPO, the stock price had increased by 45% in U.S. dollars. It seems that Odontoprev is set to make all but one category of stakeholders smile: its competitors. Both Odontoprev and Totvs' stories reveal the role of PE/VC investments in an emerging market such as Brazil, where credit is scarce and expensive, the legal environment is inefficient, making it difficult to enforce business and investment agreements, and where foreign competitors with strong brand names represent a real and constant threat. At the same time they reveal the existence of well-managed SMEs with good products and services that are both credit constrained and apt to receive PE/VC investment. The lack of governmental investment in fundamental sectors (e.g., health) represent opportunities for the private sector, and fragmented markets makes it possible for SMEs to grow following acquisition strategies. While SMEs are generally underserved in terms of business and financial services, Odontoprev and Totvs have been able to attract them as clients. They have shown that it is possible to succeed in such a problematic environment and transform small and medium-sized businesses into leading corporations. In turn, TMG Capital and Advent have proved the catalytic role of PE/VC in this process, which is further discussed in the next section. 2 – The role of venture capitalists in the financing of high-growth SMEs Venture capital (VC) is a class of financial intermediation that started in the U.S. in 19469. Between 1960s and the beginning of the 1980s, VC became an industry in its own right. By 1983, the VC model was well tested and institutionalized, raising US$ 4.5 billion. (Sahlman, 1990). This was such an important surge in fundraising that, by the end of 1983, the industry had accumulated US$12.1 billion under management, or three times the amount managed in the 1970s. From 1983 on, the industry experienced exponential growth before reaching a record of US$ 106 billion invested in 2000.
9 American Research & Development (ARD) is considered as the first modern venture capital firm.

9
Venture capital firms are in the business of managing a pool of resources from one or more investors to provide temporary investment for high-growth companies and projects for a specified period of time, after which they exit. While publicly listed companies are within the scope of buyout investments, VC usually flows to privately-held SMEs that are not yet prepared to list their shares in the stock markets. The high potential entrepreneurs managing these firms generally have ambitious projects involving new technologies or processes and typically face large barriers in obtaining credit to finance them. Besides featuring astonishing growth prospects and top-notch entrepreneurs in their management teams, companies that are successful in attracting VC investment have a few characteristics in common: (i) they lack audited balance sheets and financial reports; (ii) they have little or no tangible assets to be put up as collateral; (iii) their operations are usually in relatively new and dynamic markets, making it difficult for external parties to assess the quality of their business and risks; (iv) their cash flows approximate a J-curve (i.e., relatively long period of negative cash flows is expected in the beginning and a rapidly increase in cash flows is expected afterwards), making it difficult for the company to cope with intermediary interest payments. In financial markets, VC is considered as an alternative to traditional sources of financing such as bank credit, and offerings in the stock exchange.10 VC firms, funds and managers are better prepared than banks and stock market investors to mitigate the risks associated with SMEs in general, and innovative SMEs in particular (e.g., high uncertainty, asymmetric information, illiquidity, intangibility of assets and lack of collateral). Thus, VCs are well positioned to serve innovative SMEs in need of external sources of capital to finance high expected-return projects. To finance such projects, VC managers use sophisticated techniques of investment selection, governance and monitoring (Sahlman, 1990). Unlike investors in the stock markets, venture capitalists do participate in the management of their portfolio companies. They provide strategic advice through board participation, influence corporate governance and control systems, introduce entrepreneurs to prospective clients, suppliers and service providers and often indicate key executives for the company. They also maintain close contact with the portfolio companies to make sure that projections are met, risks are mitigated, and capital is allocated efficiently. In short, they are active investors (Jensen, 1991). Each year, VC firms receive hundreds of investment proposals. After a diligent screening process, only around 1% receive funding11. The selectiveness of VC is mainly due to its illiquid nature (i.e., VC investors can hardly resell acquired shares if they regret their investment choice), and the need to obtain robust financial returns to cope with investors' expectations and management costs. Once the money is invested, a few years may pass by before an exit from the invested company takes place. It is common to have PE/VC investments maturing in between three to ten years. It means that a wrong investment choice will most likely result in the loss of capital and/or a conflicting relationship with the entrepreneurial team for a long period. 10 Many SMEs do not have enough maturity, size and corporate governance standards to list its shares in the stock market, which could result in thin trading, lack of analyst coverage, and poor stock performance. 11 This was the average rate in the U.K. about a decade ago (Wright and Robbie, 1996), and it is still the same nowadays in Brazil (Carvalho et al., 2006).

10
According to Fried and Hisrich (1994), VCs evaluate three aspects of a business: (i) the concept – the potential of earnings growth due to market growth, increase in market shares or significant cost cutting; (ii) the management – quality of individuals (e.g., integrity, past success, experience, flexibility and leadership) and their potential for success as a team; and (iii) returns – potential for a high rate of return and a high absolute return at the end of the investment cycle, with a clear exit perspective. After this careful screening of investment proposals (i.e. business plans) and the approval from the investment committee, PE/VC managers negotiate the price and the conditions for the investment, which take place in the form of shares, convertible debt and options. After a few years of monitoring and adding value, the PE/VC firm seeks to liquidate its holdings by offering their share of the invested company on the stock market or to strategic buyers seeking to integrate the company with its own operations. While less attractive, other exit mechanisms exist: share buybacks and secondary sales. At the end of the investment cycle, the objective is to return capital to investors with robust capital gains and keep the so-called carried interests or "carry" for a job well done (usually 20% of real gains). VCs usually invest third-party resources and therefore need to satisfy their investor's returns expectations, including a premium for the extra uncertainty, risk and reduced liquidity (Lerner and Willinge, 1996). Furthermore, all the activities and services performed by VCs are said to be valuable and time consuming. For these reasons, VC is somewhat an expensive source of capital, which can only be matched by the fastest of the fast growing businesses. The governance is the key element behind the efficiency of VC investments. According to Williamson's (2003) definition, governance is the ordering of an economic relationship in which potential conflicts threat opportunities of mutual gains. In other words, governance is the set of formal and informal contracts that implicitly and explicitly regulate transactions. In a recent round-table debate promoted by the Journal of Applied Corporate Finance (JACF, 2006), Professor Michael Jensen from Harvard Business School stated that PE/VC firms are in the business of running governance systems that run businesses. Governance is translated into business practice in the form of corporate governance. Several institutions have developed their own guidelines of corporate governance best practices. The OECD Principles of Corporate Governance is considered as one of the most comprehensive of such documents, including aspects such as protection and ease of exercise of shareholders' rights, equitable treatment of shareholders, disclosure and transparency, the monitoring role of the board and its accountability to the company and the shareholders, selection of executives based on managerial competence rather than personal ties with insiders, etc. The adoption of corporate governance practices in the Brazilian PE/VC setting is depicted in the Example 1 below. Example 1: Corporate governance system at FIR Capital FIR Capital is a Brazilian VC firm based in Belo Horizonte, State of Minas Gerais, with US$ 87 million in capital under management for SMEs. It employs an interesting corporate governance (CG) system to monitor its 15 portfolio companies in the biotechnology and IT sectors. Since these companies are smaller and need to focus on innovation, FIR uses a less demanding CG standard than most listed companies do, especially those in the Novo Mercado.

11
FIR Portfolio Monitoring System (SAE) is a database with online interface that puts FIR CG standards into action. It contains all relevant information and facts, minutes of board and shareholders' meetings, as well as monthly and quarterly financial reports. Portfolio companies, FIR personnel, external auditors, investors and regulators have access it, each one with different access permissions. There are three pre-conditions for FIR CG standards and SAE to work properly: (i) a skilled management team; (ii) an active board; and (iii) an efficient and effective control system within each company. So the adoption of FIR CG standards begins in the pre-investment phase. In the due diligence, FIR managers analyze: (i) how existing practices comply with FIR standards; (ii) if there are hidden liabilities and other problems relating to tax payments, accounting practices, labor contingencies, and respect to laws and contracts; and (iii) entrepreneurs' degree of commitment and character. During the investment phase: (i) entrepreneurs get to know FIR CG standards and SAE; (ii) a workshop is administered on CG; (iii) companies' charters incorporate FIR CG practices; (iv) entrepreneurs commit themselves to adopt FIR CG Guidelines, including procedures to prepare and call board meetings, accounting standards, and deadlines to disclose information. During the post-investment phase: (i) board meeting take place on a quarterly basis; (ii) FIR analysts meet with entrepreneurs on a weekly basis; (iii) all deadlines are rigorously observed; (iv) companies are audited by external auditors; (v) entrepreneurs are advised by coaches to develop managerial and CG culture; and (vi) SAE is accessed by stakeholders online. A summary of the main differences between debt and PE/VC instruments from the SME perspective is presented in Table 2. Firstly, while debt is onerous due to the constant payment of interests and amortizations of principal, PE/VC is a non-onerous type of investment, making it possible for the invested company to undertake long-term projects that are cash consuming. Although PE/VC investors are looking for attractive returns, they usually come at the end of the investment cycle, in the form of capital gains. Most often, the exit is performed by trade-sales and IPOs, so no cash is withdrawn from the fast growing company. Eventually, dividends are paid out, but shareholders (i.e. entrepreneurs and VCs) usually have discretion over it to avoid leaving the company with less cash than it needs to continue its projects.
Table 2 – Traditional debt x PE/VC: Different characteristics
Traditional debt PE/VC Onerous Non onerous Interest payments Capital gains and dividends Amortization Exit (sales of shares) Credit analysis Screening and monitoring Credit history and financial reports Managerial competence and business plan Real guaranties (e.g., collateral) Legal guaranties (i.e., rights and agreements) Tangibility of assets Intangibility of assets Simple contracts Complex contracts Financial stability Rapid growth rates Seniority and preference Return subjected to exceeding cash-flow Lower risk Higher risk Little influence over management Direct influence over management Distance Proximity

12
Secondly, debt is normally allocated according to the results of the credit analysis, which is mostly based on the company's credit history and financial reports. While it may take management quality into consideration (e.g., the M in CAMEL analysis), PE/VC firms put much more emphasis in this criterion, as well as in the attractiveness of the business plan. Indeed, PE/VC managers perform a detailed screening process that takes several months and allow PE/VC managers to know the entrepreneurial team and the company relatively well. Thirdly, in order to extend credit, banks will usually require guarantees in the form of collateral (usually real property with clear title). Firms with few tangible assets (e.g., high-tech companies) will face difficulties in meeting this requirement since their businesses are usually based on computer software, patents, copyrights, customer lists, licenses, customer and supplier relationships, and so on. On the other hand, PE/VC is based mostly on legal guarantees in the form of complex agreements that gives PE/VC managers certain economic rights and options. Thus, PE/VC firms can cope with the lack of tangible assets of the most innovative SMEs. Fourthly, while financial stability is important to creditors that have preferential rights to cash flows, it is less so for PE/VC managers. The latter want to invest in high expected-growth businesses. These growth opportunities are naturally associated with risks and uncertainties. From an option theory point of view, since PE/VC investments are similar to call options, more volatility raises the value of the option. Moreover, while an increase in debt ratios can be seen as a menace for credit holders, it can work positively to leverage the returns for the PE/VC investors. Finally, it is clear that PE/VC managers are exposed to greater risks than debt holders. To mitigate these risks, PE/VC managers insist upon an active role in the supervision of the invested company through their position on its board and, sometimes, in an executive capacity on a daily basis. 3 – The economic impact of venture capital12 In countries were VC is already a mature part of the financial system, its economic impact is quite impressive. Recognizing the strategic role of VC for socioeconomic development, the OECD (2002) recommends every country to devise adequate support for the sustainable growth of this type of activity. In the U.S., companies that have received VC contributed 10% of employment and 10% of GDP in 2003. Between 2000 and 2003, while the private sector was cutting jobs by 2.3%, VC-backed companies continued to hire, increasing jobs by 6.5% (Global Insight, 2004). Furthermore, U.S. companies that received VC generated twice the sales of similar companies, paid three times more taxes, exported two times more and invested three times the amount usually invested in R&D as a proportion of total assets. (DRI-WEFA, 2002). The higher level of R&D expenditures by VC-backed companies spurred innovation, as Kortum and Lerner (2000) have shown by measuring the impact of VC investment in patent fillings. According to their results, VC activity significantly increases the generation of patents to a much greater extent than corporate R&D does. While from 1983 to 1992 the ratio
12 This section relies on Ribeiro et al. (2006).

13
of VC to R&D was around 3%, VC investment may have accounted for 8% of innovations in the same period. It is now broadly recognized that VC has been instrumental in the development of some of the most prestigious companies, such as Microsoft, Compaq, FedEx, Apple, Sun, Amazon, Lotus, Cisco, Staples, Netscape, eBay, JetBlue, Intel, Amgen, Medtronic, Oracle, Google and YouTube, to mention a few. These companies have experienced astonishing growth rates and rapidly become multinational corporations, sometimes even founding completely new sectors in the global economy. In Europe, recent research points to similar conclusions. Perhaps more compellingly for about 95% of European VC-backed companies stated that they would not exist or would not have developed so rapidly if it were not for VC (EVCA, 2002). Moreover, in a few European countries, there is a general lack of access to credit by SMEs, making VC an important source of entrepreneurial and corporate financing. (Bottazi and Da Rin, 2002). Clearly, VC plays a crucial role in entrepreneurial development and start-up financing, innovation. But all these evidence are still more compelling when we observe that it represents a tiny fraction of the U.S. and the European GDP, usually well below 1%. While some authors state that a vigorous stock market is a pre-requisite for the existence of a vigorous VC industry (e.g., Black and Gilson, 1998), there is a lot of evidence that also suggest the inverse relationship: VC promote stock markets development, by bringing in smaller companies in new sectors which are already comfortable with the good corporate governance exercised when the VC investor actively monitored the company. The positive impact of PE/VC investment in the stock markets can be measured by its participation in IPOs. Today, VC-backed companies represent about 30% of IPOs in the U.S., with this figure reaching over 50% in 1999, when these companies captured most of the US$ 71 billion raised (Lee and Wahal, 2004). Several studies analyze the subsequent performance VC-backed IPOs. Barry et al. (1990) found lower underpricing and volatility. Megginson and Weiss (1991) showed that VC-backed companies get to the stock markets earlier than most companies and have highly reputable underwriters. Far from a development instrument that generates socioeconomic impact but does not attract the interest of private investors, PE/VC has demonstrated the ability to produce superior returns and actually enhance the overall performance of investment portfolios, especially for investors that are able to cope with the temporary lack of liquidity so common of PE/VC investments. Investigating this issue, Chen et al. (2002) have shown that the good performance and weak covariance between VC and stock market indexes make it an attractive asset for long-term investors such as pension funds, endowments and insurance companies. So it is not surprising to see that U.S. pension funds that have US$ 5 billion or more in assets are already directing 3.4% of their portfolio to VC funds (Venture Economics apud CVCA, 2005). 4 – The development of private equity and venture capital in Brazil Brazil is among the first emerging countries to have adopted PE/VC. According to Kenney et al. (2003), the first PE/VC globalization wave occurred in the end of the 1970s and the beginning of the 1980s. It covered countries such as Malaysia, Singapore, Taiwan, South
14
Korea an Israel, where the industry has successfully evolved. Other countries such as India were late adopters of the PE/VC technology. Even in Europe the industry is fairly recent. According to Bottazzi et al. (2004), 53% of European PE/VC firms were formed after 1997 and have less than nine years of operation. In the sample collected by the authors, representing 15% of the European industry, this figure reaches 73%. The Brazilian PE/VC begun in the early 1980s. In 1982, there were only three PE/VC firms (Brasilpar, CRP and BNDESPar) in the country.13 By December 2004, the number had reached 65 PE/VC firms managing 90 different investment vehicles. These had a total of US$ 5.07 billion in assets under management14 and an aggregated portfolio of 265 Brazilian companies that were operating in 19 different industrial sectors. Unofficial results of a recent update made by the Center for Private Equity and Venture Capital Research at FGV Graduate School of Business (GVcepe), in partnership with the Endeavor Institute, suggest that, by the end of 2006, there were more than US$ 7.2 billion in 108 PE/VC investment vehicles in Brazil. The aggregate portfolio had surpassed 350 companies. Graph 1 presents the history of new firms entering the Brazilian PE/VC market since 1981. While the analysis does not include firms that abandoned the market before December 2004, it reveals important aspects of the Brazilian PE/VC industry, such as:
(a) The industry started in the beginning of the 1980s. While not appearing in the graph, the first PE/VC firm in Brazil, Brasilpar, was founded in 1975, but it later has exited from the PE/VC business.
(b) The strongest entry activity begun just after the monetary stabilization plan of 1994
(i.e., Plano Real). In that same year, Comissão de Valores Mobiliários (CVM), the Brazilian security and exchange commission, issued Regulation 209/1994. For the first time, VC vehicles could be established as Fundos Mútuos de Investimento em Empresas Emergentes (FMIEE), with the economic and fiscal advantages typical of mutual funds, specially when compared to holding companies (section 4.1 includes additional information on the industry's regulatory evolution);
(c) In 1997, the Brazilian government started its major privatization plan. Several PE/VC
firms were formed to execute buyouts of major state-owned enterprises in industrial sectors and public services, such as telecommunications, energy, transportation and infrastructure;
(d) In 1998, entry activity was temporarily suspended due to anticipation of the February
1999 monetary crisis. This finding corroborates the argument in Ribeiro and Almeida (2005) that 1998 represents a dividing line between traditional and young firms;
(e) The rapid expansion of 1999-2001 shows a strong correlation with the reduced price
of Brazilian assets in U.S. dollars, as well as the Internet boom. This expansion peaked
13 That same year, the U.S. had 331 firms with 1,031 employees managing US$ 7.6 billion. More than 900 investments were concluded in that year for a total of US$ 1.45 billion (Sahlman, 1990). 14 Equals the sum of all capital available for new investments and the capital already invested in portfolio companies.

15
in 2000, with 13 firms entering the market. In July 2000 the Brazilian PE/VC association (Abvcap) was officially founded;
(f) Between 2002 and 2004, the entry has been decreasing constantly, possibly due to
September 11th events, the bust of the Internet bubble and uncertainty over the election outcome in Brazil;
(g) Approximately 80% of PE/VC firms have less than nine years of experience in Brazil
(started from 1997 on). So while some firms are already concluding operations of their first close-end funds, with visible impact in the stock markets, most of the industry has not yet completed its first cycle of investment and exit.15
Graph 1 – Entry of New Firms in the Brazilian Market16
Source: Ribeiro (2005).
The history presented in Graph 1 suggests the pivotal role of (i) a stable economy with controlled inflation; (ii) the privatization process; (iii) attractive currency exchange ratios; and (iv) technological waves (e.g., Internet) in the formation of a domestic PE/VC industry. This process happened despite the enormous interest rates prevalent in Brazil since 2004, among the highest in the world. 4.1 – Governmental and DFI support While the creation of the Brazilian PE/VC industry was mainly the result of private sector initiatives, the industry has benefited much from the direct and indirect support from the development finance institutions (DFIs), as well as the Brazilian government, regulatory agencies and legislative power, especially for the creation and development of new VC funds for early and seed stage investment, improvements in legal and regulatory environments and the institutionalization of the industry.
15 For this reason, it is premature to present and discuss the return on investments accomplished by the Brazilian PE/VC industry. 16 Graph 1 depicts the distribution of PE/VC firms with offices in Brazil according to the year of initial operation. Does not include firms that left the market before December 2004. Total represents the aggregated number of firms in each year-end.

16
Among the development finance institutions with relevant actions in Brazil, the Inter-American Development Bank (IDB), through its Inter-American Investment Corporation and Multilateral Investment Fund (MIF), has supported the creation of new VC funds with both technical assistance interventions and direct investment in selected funds (see Example 2 below). The International Finance Corporation and the International Bank for Reconstruction and Development, members of the World Bank Group, have acted in similar ways, but mostly in vehicles that aim at businesses in more advanced stages of business development. The Overseas Private Investment Corporation, an independent U.S. government agency, has taken a more generalist approach, by investing in vehicles that operate simultaneously in several Latin American countries. Also, the Netherlands Development Finance Company (FMO) and the Commonwealth Development Corporation (CDC), a UK government-owned fund of funds, have acted as investors in PE/VC funds in Brazil. Example 2: Inovar Project – Building a VC industry in Brazil17 Inovar is a project from the Financiadora de Estudos e Projetos (Finep), a government-owned company linked to the Brazilian Ministry of Science and Technology (MCT). Launched in May of 2000, the project's main objective was to support innovative SMEs in Brazil through the promotion of the local VC industry. The project was partially financed by the Multilateral Investment Fund (MIF), a mechanism from the Inter-American Development Bank (IDB) whose mission is to stimulate the innovative private sector development in Latin America and the Caribbean. Since its inception the project has also received the support from two local partners: Serviço Brasileiro de Apoio às Micro e Pequenas Empresas18 (SEBRAE) and Fundação Petrobras de Seguridade Social19 (PETROS). The project's scope is relatively broad, covering activities such as: a forum for innovative SMEs to meet with potential investors; training for VC fund managers; and an on-line portal for the VC industry in Brazil. However, Inovar is better known for a fourth activity: its VC fund incubator, a pioneering action in Latin America to foster the creation of new VC funds and attract private investors to the VC industry with the adoption of superior fund selection, assessment and monitoring practices. The incubator consists of a group of investors lead by Finep with the mandate to invest in VC funds. These investors join efforts to execute a detailed screening process and take investment decision individually or jointly in the selected funds. Once every year the Inovar partners get together to assess the proposals of new and existing fund managers. The number of partners in the Inovar VC incubator has increased along the years. In the 6th calls, Fundação dos Economiários Federais (Funcef) and Bovespa joined the group of official partners that take part in the selection committee. In the 7th call, the committee incorporated Banco do Brasil Banco de Investimentos (BB-BI) and Caixa de Previdência dos Funcionários do Banco do Brasil (Previ), the largest pension fund in Latin America. Since the project welcomes institutional observers in the selection process, the number of 17 Example based on interviews with Finep personnel. 18 Similar to the Small Business Administration (SBA) in the U.S. 19 Occupational pension fund linked to Petrobras
17
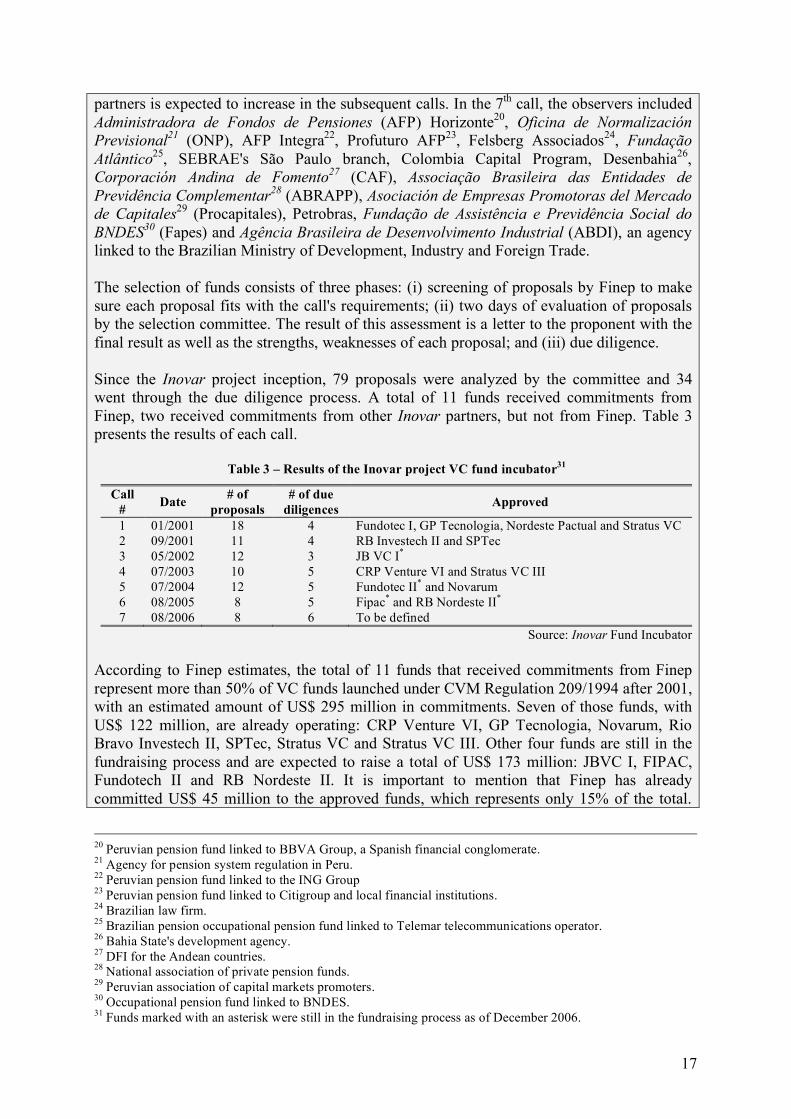
partners is expected to increase in the subsequent calls. In the 7th call, the observers included Administradora de Fondos de Pensiones (AFP) Horizonte20, Oficina de Normalización Previsional21 (ONP), AFP Integra22, Profuturo AFP23, Felsberg Associados24, Fundação Atlântico25, SEBRAE's São Paulo branch, Colombia Capital Program, Desenbahia26, Corporación Andina de Fomento27 (CAF), Associação Brasileira das Entidades de Previdência Complementar28 (ABRAPP), Asociación de Empresas Promotoras del Mercado de Capitales29 (Procapitales), Petrobras, Fundação de Assistência e Previdência Social do BNDES30 (Fapes) and Agência Brasileira de Desenvolvimento Industrial (ABDI), an agency linked to the Brazilian Ministry of Development, Industry and Foreign Trade. The selection of funds consists of three phases: (i) screening of proposals by Finep to make sure each proposal fits with the call's requirements; (ii) two days of evaluation of proposals by the selection committee. The result of this assessment is a letter to the proponent with the final result as well as the strengths, weaknesses of each proposal; and (iii) due diligence. Since the Inovar project inception, 79 proposals were analyzed by the committee and 34 went through the due diligence process. A total of 11 funds received commitments from Finep, two received commitments from other Inovar partners, but not from Finep. Table 3 presents the results of each call.
Table 3 – Results of the Inovar project VC fund incubator31
Call # Date # of
proposals # of due
diligences Approved
1 01/2001 18 4 Fundotec I, GP Tecnologia, Nordeste Pactual and Stratus VC 2 09/2001 11 4 RB Investech II and SPTec 3 05/2002 12 3 JB VC I* 4 07/2003 10 5 CRP Venture VI and Stratus VC III 5 07/2004 12 5 Fundotec II* and Novarum 6 08/2005 8 5 Fipac* and RB Nordeste II* 7 08/2006 8 6 To be defined
Source: Inovar Fund Incubator According to Finep estimates, the total of 11 funds that received commitments from Finep represent more than 50% of VC funds launched under CVM Regulation 209/1994 after 2001, with an estimated amount of US$ 295 million in commitments. Seven of those funds, with US$ 122 million, are already operating: CRP Venture VI, GP Tecnologia, Novarum, Rio Bravo Investech II, SPTec, Stratus VC and Stratus VC III. Other four funds are still in the fundraising process and are expected to raise a total of US$ 173 million: JBVC I, FIPAC, Fundotech II and RB Nordeste II. It is important to mention that Finep has already committed US$ 45 million to the approved funds, which represents only 15% of the total.
20 Peruvian pension fund linked to BBVA Group, a Spanish financial conglomerate. 21 Agency for pension system regulation in Peru. 22 Peruvian pension fund linked to the ING Group 23 Peruvian pension fund linked to Citigroup and local financial institutions. 24 Brazilian law firm. 25 Brazilian pension occupational pension fund linked to Telemar telecommunications operator. 26 Bahia State's development agency. 27 DFI for the Andean countries. 28 National association of private pension funds. 29 Peruvian association of capital markets promoters. 30 Occupational pension fund linked to BNDES. 31 Funds marked with an asterisk were still in the fundraising process as of December 2006.

18
Private investors contributed 60% while DFIs (mainly the IBD/MIF) and other government branches contributed the remaining 25%. The group of active funds financed by the Inovar project has already invested in 26 SMEs in the fields of software and IT (10 companies), telecommunications (6), medicine and biotechnology (5), industrial technologies (3), chemicals (1) and aeronautics (1). Most investments were directed to SMEs with less than US$ 1 million in revenues (10 cases), whereas nine investments were made in companies with revenues between US$ 1 million and US$ 5 million. The remaining seven investments were made in companies with more than R$ US$ 5 million in revenues. Around 63% of investments (in value) were directed to the States of Sao Paulo (59%), Rio de Janeiro (2%) and Minas Gerais (2%). The Southern States took the remaining 37%, with Rio Grande do Sul receiving 29%. Given its success in the creation of new funds, the Inovar project is now being replicated by Peru, Colombia and Argentina. In Peru, it is known as Proyecto Invertir and it is run by Procapitales, a not-for-profit organization created by a group of private companies and institutions. Now, Finep is starting to aim in the seed stage, with the creation of Inovar Semente. Its first call of funds took place in December 2005. The aim is to have local Seed funds with 100% of capital being directed to companies with less than US$ 1 million in revenues in regions with technological vocation and in a radius of 100km from the VC firm. Finep hopes to fund around 24 funds (US$ 148 million) with 40% of commitments coming from Finep, 40% from local development agencies and 20% from private investors that have the right to attractive economic benefits. A total of 14 proposals were received in the first Inovar Semente call for proposals. Four are in the due diligence phase. These funds are aiming for a total commitment of US$ 23 million. If approved, they will receive US$ 9 million from Finep. Moreover, two proposals come from managers that have never asked for Inovar support. The next call will take place in April 2007 and Finep will invite proposals with any size to invest in ten to 20 companies. In terms of regulatory and legal aspects, the government, the legislative power and regulatory bodies have taken several measures that foster the PE/VC market. For example, Law 9,307/1996 allowed for dispute resolution by arbitration to be valid regardless of Judiciary rectification. The amendment of the Corporation Law (Laws 6,404/1976 and 10,303/2001) enhanced protection for outside investors in general and minority investors in particular. Nowadays, most portfolio companies are incorporated as Sociedades Anônimas (S.A.). In order to foster private investment in public services, Brazil has enacted Law 11,079/2004 to discipline public-private partnerships. The Innovation Law (Law 10,973/2004) establishes incentives to scientific and technological ventures in both private companies and research institutions. The New Bankruptcy Law (Law 11,101/2005) now facilitates the buyout of companies in financial distress. The General SME Law (Complementary Law 123/2006) decreases some taxes, facilitates the creation of new companies and increases governmental support to SMEs. CVM has also enacted specific regulations for the industry, making it possible for governmental organizations and pension funds to invest in PE/VC vehicles in Brazil. This was the result of CVM Regulations number 209/1994 (for innovative SMEs with revenues below

19
R$ 100 million), 391/2003 (for private equity funds) and 406/2004 (for private equity funds leveraged by development institutions), which is a variation of Regulation CVM 391/2003. According to Carvalho et al. (2006), one third of investment vehicles are now established under these regulations, thus showing their relevance to the industry. Another benefit of CVM regulations is that PE/VC vehicles started to be treated as pass-through vehicles for tax purposes. It means that the transactions made by those funds are tax exempted. Taxes are paid upon the liquidation of the fund, according to the tax level of each individual investor. Under the Resolution 2.689/2000, foreign sophisticated investors can be fully exempted from taxes on capital gains. The same is true for natural persons investing in funds for infrastructure, the so-called Fundo de Investimento em Infra-estrutura (Medida Provisória 348/2007). In addition to that, the government has implemented tax benefits for investment in innovation (Law 11,196/2005). The stock market itself, has taken indirect and direct actions to support PE/VC investments, and more importantly, exits, in Brazil. The adoption of Novo Mercado and the special corporate governance segments in 2000 has made it possible for companies with superior corporate governance practices to differentiate themselves in the market. This has benefited the PE/VC-backed companies that are already quite comfortable with the corporate governance practices prevailing during the PE/VC investment phase. Moreover, Bovespa has created the Bovespa Mais, which functions as an access market for the benefit of SMEs that need greater trading flexibility and reduced costs early on. Several branches of the Brazilian Government have taken direct actions to support PE/VC in Brazil. Among them, Agência Brasileira de Desenvolvimento Industrial (ABDI), an agency linked to the Brazilian Ministry of Development, Industry and Foreign Trade; Banco Nacional de Desenvolvimento Econômico e Social (BNDES); Banco do Nordeste (BNB); Financiadora de Estudos e Projetos (Finep), a government-owned company linked to the Brazilian Ministry of Science and Technology (MCT); Serviço Brasileiro de Apoio às Micro e Pequenas Empresas (SEBRAE); and Banco do Nordeste. ABDI has mostly helped in the internationalization of the industry by financing Abvcap's road shows in Europe and North America, while the other institutions acted as PE/VC investors (as shown in Example 2), except for BNDES, which acted as both PE/VC investor and PE/VC managing organization by investing directly in non-listed privately-held companies (see Example 3). Example 3: PE/VC and the role of National Development Banks32 Banco Nacional de Desenvolvimento Econômico e Social (BNDES) was the first governmental body to get involved in the Brazilian PE/VC industry, by founding BNDES Participações S.A. (BNDESPar) in 1982, which quickly became one of the first PE/VC organizations in Brazil. In 1991, BNDES launched the Contec Program to invest up to US$ 2 million in technology-based SMEs with less than US$ 15 million in revenues. A total of 46 investments were made, totaling US$ 100 million. Close to 70% of it was directed to telecommunications, electronics, consumer goods, ecological services, ecological products and biotechnology.
32 This example relies on BNDES (2006).

20
Beginning in the mid-nineties, BNDES supported the creation of PE/VC funds, in a total of three funds for later-stage investment, three regional investment funds for SMEs, four funds for technology-based SMEs, one fund for oil and gas and one fund for alternatives sources of energy. An additional fund for health and education did not close its fundraising process. The bank has also developed two programs in which securities directly owned by the bank or its affiliates were handed over to privately managed PE/VC and Private Investment in Public Equity (PIPE) funds, in a total of five funds. The total amount committed by the bank in these 18 funds reached approximately US$ 300 million. For a long period, BNDES followed different guidelines that kept itself away from the PE/VC industry. But in August 2006, BNDES resumed its program for the creation and development of new PE/VC funds. In the new program, the bank wishes to deploy approximately US$ 130 million to nine funds (two funds for later-stage investment and seven funds for innovative SMEs). The bank has also launched a similar program to foster the creation of a seed capital fund with US$ 40 million that will operate nationwide through local fund managers. 5 – Barriers for PE/VC development in Brazil33 Despite a strong presence in the stock exchanges, the Brazilian PE/VC industry is quite small compared to the size of the country's economy. In countries with high PE/VC availability, annual investments can surpass 1% of GDP (OECD, 2002). In Israel this figure reached 3.17% of national GDP in 2000 (Megginson, 2004). But average investments made in Brazil between 1999 and 2004 accounted for only 0.06% of GDP. Graphs 2 and 3 show the availability of PE/VC in each country according to two measures: funds raised as a percentage of GDP and investments made as a percentage of GDP. Firstly, it is important to note that Australia, Canada, Hong Kong, Israel, the Netherlands, Norway, South Africa, Sweden, the U.K., and the U.S. have representative PE/VC industries, with more than 0.35% of GDP being directed to PE/VC funds or invested in operating companies in 2004. A second important aspect to be noted is the difference between fundraising and investment as a percentage of GDP. In a stable PE/VC industry, funds raised in a given year tend to be slightly higher than the amount invested in that same year, since part of the funds will be used to cover administrative expenses. However, when funds raised are much higher than the amount invested, it suggests that the local PE/VC industry is growing. So, while Canada, South Africa, and the U.K. have invested more money in 2004 than they actually levied, the Netherlands and Sweden seem to be rapidly increasing the pool of resources for future investments. A third aspect to be noted is that the availability of PE/VC varies widely between countries, from virtually 0% in Greece (where only US$ 6 million was raised and invested) to an impressive 1.31% (funds raised/GDP) in Sweden, where US$ 4.54 billion was raised and US$ 2.02 billion was invested in 2004. On average, approximately 0.25% of the GPD is raised or invested each year in the sample.
33 Part of this section stems from Ribeiro et al. (2006).

21
Graph 2 – International Availability of PE/VC34
Sources: Europe (EVCA), U.S. (Venture Economics), Israel (IVC), Canada (CVCA), South Africa (SAVCA), Asia-Pacific (AVCJ), Latin America (VE-LA and LAVCA), and Brazil (GVcepe). GDP figures obtained with
the World Bank's World Development Indicators, 2005. In order to better observe the difference between individual countries with little availability of PE/VC (i.e., for the sake of this analysis, less than 0.35% of GDP), Graph 3 presents a zoom of Graph 2 so the difference becomes more visible.
Graph 3 – International Availability of PE/VC (zoomed)
Sources: Same as Graph 1.
34 All figures refer to 2004 and were converted to U.S. dollars based on average annual exchange rates. Abbreviations follow international standards. For Australia, China, Korea, Hong Kong and India, only investment figures were obtained. Fundraise was estimated as equal the amount invested the same year. For the U.S., investment was estimated as equal the fundraising figure.

22
The detailed analysis shows that France and New Zealand, at more than 0.3% of GDP raised for PE/VC, are still quite ahead of other countries depicted in Graph 2, which feature less than 0.2% of GDP in funds raised or invested in 2004. The latter includes emerging economies (Argentina, Brazil, Chile, China, Czech Republic, Hungary, India, Mexico, Poland, Slovak), as well as developed ones (Austria, Denmark, Finland, Greece, Ireland, Italy, Japan, Portugal and Switzerland). But since there are considerable cross-country investments among European countries, it is quite possible that the huge English and Swedish PE/VC industries are also acting in a few of the above mentioned European countries. According to recent research, the relative size of a country's PE/VC industry is related to its institutional environment in general and to the legal system in particular. (Megginson, 2004). The Latin American institutional environment is notoriously different from those prevailing in developed markets, especially when it comes to opportunity costs, business informality, entrepreneurial culture, the stock market, corporate governance traditions, legal system efficiency and rights enforcement. The institutional idiosyncrasies in Latin America represent great and sometimes insurmountable constraints for the PE/VC industry. Indeed, the PE/VC industry has emerged in just a few countries, including Argentina, Brazil, Chile and Mexico. These countries present one or more of the following characteristics: (i) bigger internal markets, which translates into a larger base of entrepreneurs, scientists, skilled personnel, service providers (e.g., lawyers, accountants, consultants, investment banks) and investment opportunities; (ii) closer links to developed countries (e.g., Mexico and the U.S.); and (iii) better institutional environments or concrete actions to improve it (e.g., the Chilean relatively efficient tributary system results in lower levels of informality). Another aspect that hampers PE/VC in Latin America is the difference in the business and regulatory environment of each country in the region. This highly increases the "distance" between the regional business communities. As a consequence, cross-country investment by the PE/VC industry is relatively rare. Table 4 depicts the economic and institutional variables that should affect the industry's size and structure. Despite being one of the nine biggest economies in the world and expected to become one of the five largest over the next 45 years (Wilson and Purushothaman, 2003), Brazil still has severe wealth distribution problems. Its GDP per capita is as low as US$ 8 thousand. Moreover, the wealth is badly distributed. The richest 20% concentrate 62% of all wealth created. According to World Bank data, this puts Brazil among the 12 countries with the most unequal wealth distributions. Wealth concentration tends to reduce the number of high potential entrepreneurs as well as the market size for consumer products and services. After 1994, the country tackled the vigorous inflation that used to blur market competition. Since then, high interest rates have prevailed and growth rates have been below world averages. When comparing Brazil's growth rate to that of other developing economies (e.g., India and China) one wonders if Brazil still deserves this title. According to the World Bank data depicted in Table 4, between 1980 and 2004 Brazil grew at a meager 2.0% to 2.9% a year in the selected periods, while the world was growing at 2.7% to 3.5%. Countries such as India and China grew at astonishing rates close to 6% and 10%, respectively. In a recent study released by the American Chamber of Commerce (2006), Brazil was ranked last among BRICs (Brazil, Russia, India and China) plus Mexico in terms of competitiveness.

23
The fact that Brazil is lagging behind translates into fewer opportunities for business creation and development, as well as a weak competitive position in attracting foreign capital. The positive aspect of the reduction of inflation rates and the opening of the economy was an increase in competition that forced a major change in the business arena. Companies that would obtain most of their revenues from cash management were forced to increase the efficiency of their operations. This created PE/VC investment opportunities in medium-sized enterprises and bigger corporations. Brazil features high entrepreneurial activity. Almost 13.5% of the population is involved with the creation or management of new businesses. But according to the Global Entrepreneurship Monitor (GEM) very few of these entrepreneurs can be classified under the label high-expectation (Reynolds et al., 2003). Only 530 per million inhabitants expect to initiate a new venture that will, within five years: (i) generate at least 19 jobs; (ii) obtain 11% of revenues from exports; and (iii) have no more than 75% of customers located within one hour of distance. The average for all countries covered by the study was 2,154 per million. Due to high labor market rigidity (e.g., hiring and firing workers), workers tend to stick to their jobs and entrepreneurs assume great liabilities when employing personnel. PE/VC investments presume high returns, thus, high-expectation entrepreneurs are the ones more apt to receive them. Bureaucratic procedures are an endemic problem in Brazil. Opening a business, obtaining construction licenses, paying taxes as well as exporting and importing goods are severely delayed by bureaucratic obstacles. It takes 152 days and 17 steps to start a business. Another 19 steps and 460 days are needed to get all licenses to build a warehouse (Table 4). Exporting and importing takes 39 and 43 days, respectively, thus increasing the need of working capital to perform foreign trade. According to Kaufmann et al. (2003) bureaucracy and corruption are strongly correlated. As it can be seen, Brazil scores low in both indicator: 1.5 and 3.7 out of ten, respectively. Delays and bribery impose direct and indirect costs for businesses. These costs tend to be higher for smaller enterprises, penalizing early-stage PE/VC investments. The tax burden in Brazil is extremely heavy for companies (equivalent to 71.7% of profits). Tax procedures are complex, requiring an average of 2,600 hours of work from each company. The government also faces difficulty enforcing correct tax payment. Consequently, 40% of the economy is in the informal sector. Companies with hidden fiscal and labor liabilities present increased risks for PE/VC managers and their investors. Financial reports tend to be less reliable and monitoring becomes more difficult. Thus, PE/VC managers overlook industrial sectors, development stages and companies that feature a high degree of informality.

24
Table 4 – Economic and Institutional Indicators35
Indicator Description Year Brazil Min. Avg. Max.
Income and consumption a Richest 20% (%) 2003 62.1 34.8 43.2 62.2 GDP per capita a USD 2005 7,969 3,013 22,635 39,397 Total Entrepreneurship Activity d Entrep./Total Pop. (%) 2004 13.5 3.7 6.8 14.7 Growth a % of GDP 1980-1990 2.7 -0.7 3.3 10.3 Growth a % of GDP 1990-2000 2.9 1.0 3.5 10.6 Growth a % of GDP 2000-2004 2.0 -0.1 2.7 9.4 Inflation a (%) 1990-2000 98.3 0.3 7.4 98.3 Inflation a (%) 2000-2004 9.6 -2.1 3.1 12.0 Real interest rate a (%) 2004 43.2 -2.2 4.4 43.2 Creditor protection b Index (0 to 10) 2005 2.0 2.0 5.9 10 Investor protection b Index (0 to 10) 2005 5.3 3.0 6.0 9.7 Enforcement of contracts b Time (days) 2005 616 109 444.2 1,420 Enforcement of contracts b Cost (% of debt) 2005 15.5 5.5 16.7 126.5 Legal and regulatory framework c Index (0 to 10) 2006 2.9 1.4 n.a. 8.5 Starting a business b Time (days) 2005 152 2 32.5 152 Starting a business b Procedures (number) 2005 17 2 7.8 17 Obtaining licenses b Time (days) 2005 460 56 191.3 460 Obtaining licenses b Procedures (number) 2005 19 7 16.4 31 Trading across borders b Time for export (days) 2005 18 5 14.6 36 Trading across borders b Time for import (days) 2005 24 3 17.1 43 Closing a business b Time (years) 2005 10 0.4 2.6 10 Closing a business: Recovery rate b (cents/dollar) 2005 0.4 0.4 58.5 92.6 Bureaucracy c Index (0 to 10) 2005 1.5 1.1 3.3 6.7 Corruption e Index (0 to 10) 2005 3.7 2.2 6.6 9.6 Paying taxes b Time (hours) 2005 2,600 30 344.7 2,600 Total tax payable b (% of profit) 2005 71.7 25.7 51.3 116.8 Informality b % of GNP 2005 39.8 8.8 19.6 39.8 Routes a Km (million) 1999-2003 1.7 0.002 0.6 6.4 Paved routes a (%) 1999-2003 5.5 5.5 73.6 100 Labor market rigidity c Index (0 to 100) 2005 56 0 35.9 66 Market capitalization a % of GDP 2004 54.7 10.7 94.3 528.5 Capital markets accessibility c Index (0 to 10) 2005 5.8 3.4 7.4 9.6 R&D expenditure a % of GDP 1996-2003 1.0 0.4 1.7 4.9 Enrollment in higher education a % relevant age group 2004 20 11 52.9 89
Source: Ribeiro et al. (2006), compiled from (a) World Bank Development Indicators, 2005; (b) World Bank Doing Business Survey, 2005; (c) IMD Global Competitiveness Yearbook, 2005; (d) Global Entrepreneurship
Monitor, 2004; (e) Lambsdorff, J. "Corruption Perception Index." Transparency International, 2005. The Brazilian legal and regulatory framework is considered inefficient, receiving a score of only 2.9 out of ten from a panel of executives and policy makers. The enforcement of creditors' and investors' rights is particularly weak, making capital expensive and scarce. In a scale ranging from zero to ten, Brazil scores two in creditor protection, which is the lowest score in the sample, and 5.3 in investor protection (Table 4). According to Table 4, the low enforcement of creditor protection seems to be related to the time for judges to reach decisions in the Judiciary, rather than the cost of disputes relative to 35 Average, minimum and maximum figures are based on a sample of 37 economies with PE/VC industries: Argentina, Australia, Austria, Belgium, Brazil, Canada, Chile, China, Czech Republic, Denmark, Finland, France, Germany, Greece, Hong Kong, Hungary, India, Indonesia, Ireland, Israel, Italy, Japan, Korea, Mexico, Netherlands, New Zealand, Norway, Poland, Portugal, Singapore, Slovakia, South Africa, Spain, Sweden, Switzerland, U.K. and U.S. Indexes that range from 10 (positive) to 0 (negative) relate to perceptions of business people and country analysts.

25
the amount pledged. While the time taken to enforce a contract, of 616 days, is above the average for the chosen countries, the time to close a business in a bankruptcy event is the highest for the sample. A bankruptcy process takes ten years and usually results in a recovery rate of 0.4%. As a consequence of low creditor protection and high interest rates, PE/VC firms' access to leverage is very limited, thus buyouts (e.g., MBOs) are highly constrained. In a bad legal environment, the complex contracts used for PE/VC (e.g., shareholders' agreements) are difficult to enforce forcing some managers to invest with majority positions only. While legislators are working to solve the main regulatory issues, the real problem seems to be related to the judiciary, which should ultimately enforce laws and contracts. Fortunately, the recognition of arbitration has brought some relief, by allowing disputes to be settled privately. Several PE/VC vehicles already stipulate arbitration in their bylaws and all funds established under CVM Regulation 391/2003, enacted in 2003, must indicate an arbitration court to solve potential conflicts with portfolio firms. In Brazil, companies also face difficulties to hire qualified personnel. Only 20% of the population at the age of attending university is enrolled in higher education. This coupled with the low investment in research and development (R&D) translates into fewer opportunities for PE/VC investment in technology-oriented businesses. The existence of infrastructure is an important element for the PE/VC industry. If the right infrastructure is in place, business of all sizes can build on it, creating investment opportunities. Otherwise, building and maintaining infrastructure (e.g., routes, railways, ports, sanitation, telecommunication and energy) should, by its turn, attract important sums of investment that could be provided by PE/VC vehicles and covered by government guaranties and other incentives. To take one examples in the field of transportation, Brazil is a huge country with roads that run along 1.7 million kilometers, but only 5.5% of it is paved. This is the lowest figure of all 37 countries compared in Table 4 statistics. In Brazil, the government has enacted a law that provides the right framework for the public private partnerships (PPP) schemes, similar to the English private finance initiatives (PFI). It can be used for infrastructure as well as other services of public interest (e.g., health). Brazil has a relatively small stock market, with a total capitalization of 54.7% of GDP. This suggests the existence of high direct and indirect costs in raising capital from market investors. Indeed, Brazil scores only 5.8 out of ten in terms of markets accessibility (Table 4). The local stock market, Bovespa, has taken and is still taking important steps to increase its quality and accessibility. For example, the Novo Mercado has helped differentiate companies with good governance practices. The newly created Bovespa Mais will function as an access market for smaller companies. In the last three years (2004-2006) the market was buoyant. In 2004 and 2005, offerings resented 0.30% and 0.26% of GDP, respectively. Contemporaneous U.S. IPOs raised 0.40% and 0.12% of GDP. Healthy stock markets are essential for PE/VC, allowing investment managers to exit successfully and entrepreneurs to regain control (Black and Gilson, 1998). 6 – Gaps in the Brazilian PE/VC industry
26
The Brazilian PE/VC industry operates in a harsh environment. Thus, it faces several obstacles that result in visible gaps in the industry's investment pattern. An analysis of the industry's total portfolio36 in December, 2004, reveals those gaps: (i) lack of investment in earlier stages of business development; (ii) lack of capital for companies that need small amounts of capital; (iii) few investments in high-technology sectors; and (iv) lack of investment in the least developed and most distant regions of Brazil (i.e., North and Northeastern). The first two gaps, namely stage gap and deal size gap, generate the biggest concern to the industry's future growth and sustainability. The other two gaps, namely technology gap and regional gap, are of secondary importance since they also exist in other developed and developing countries. The following sub-sections discuss each of these gaps. Ideally, there should not be any gaps in the portfolio. Good companies in all stages, of all sizes, in any region, should be able to obtain PE/VC investment, regardless of the technological content of their businesses. 6.1 – Stage gap For a financial market to be complete, companies with good prospects should find adequate sources of financing during all phases of its development. If this financial value-chain is broken in at least one segment, all the system risks losing momentum. In the beginning, the entrepreneur will recur to governmental resources, friends and family members. Sometimes, angel investors may be willing to invest in the new idea. At the pre-operational stage, the venture may attract the interest of firms of the formal venture capital industry, such as seed capital funds, to invest in the development of new products as well as the ensuing market tests and patent fillings. Once the product has been developed and the venture has already identified the target-market and team to run it, start-up capital helps in the initial structuring of the company, as well as in surviving the threats of the first years of operations, when their products and services are not yet commercialized. However, if the venture already has enough demand, expansion capital may be needed in the form of working capital, as well as direct investment for plant and distribution chain expansion, communication, and marketing campaigns. When the company is mature and faces stable growth rates, later-stage PE/VC investment can act as a catalyst, increasing growth rates and profitability. Sometimes, the growth is mainly the result of a series of acquisitions. In this phase, PE/VC firms can provide the so-called aquisition finance, as well as M&A advice. If the managers want to buy out the original founder or the controlling shareholders, a management buyout (MBO) financing may take place. Debt instruments may be used. When the company has almost reached the certain size and maturity to execute an IPO, PE/VC managers can still provide bridge financing for the company to prepare its entry in the stock markets. This stage is also covered by mezzanine investments, which are performed with subordinated convertible debt. Finally, companies that face financial hardship but still have promising businesses are candidates for turnaround investments.
36 Based in the responses of all 65 PE/VC firms with operations in Brazil. See Ribeiro (2005) for further detail.

27
Table 5: Portfolio Companies by Stage37
Stage Number of Firms Percentage
Seed capital 36 13.7 Start-Up 72 27.4 Expansion 98 37.3 Later stage 42 16.0 Acquisition finance 5 1.9 Management buyout/in 3 1.1 Bridge finance 1 0.4 Turnaround 6 2.3
Unidentified 2 - Total 306 100.0
Source: Ribeiro (2005). As depicted in Table 5, The Brazilian PE/VC industry has a portfolio of investments in all stages of business development. However, only 13.7% of the portfolio companies received their first round of PE/VC in the form of seed capital. Only 27.4% were categorized as start-ups. According to Bottazzi et al. (2004), 42% of the European PE/VC portfolio is composed of start-ups, 17% are seed capital investments, and 39% are expansion deals. In the U.S., the National Venture Capital Association - NVCA (2005) has recently surveyed its members about their preference in terms of stage. Start-up came up first with 31%, closely followed by expansion (24%) and seed investments (20,5%). The remaining 25,1% was divided among later stage, acquisition finance and mezzanine. The comparison suggests that Brazilian PE/VC managers are more biased towards later stage transactions. Normally, there should be much more investment in earlier stages of investment, with several small deals representing a greater percentage of value invested by the PE/VC industry. The small number of investment in this stage in Brazil represents a threat to the long-term sustainability of the local PE/VC industry. Without the continuing upraise of small companies with the support of seed and venture capital, later stage investment opportunities could well become more and more scarce to a growing number of PE/VC firms in the market.
37 Distribution of companies in the portfolio of all the 65 PE/VC firms (excluding PIPEs) with operations in Brazil in December, 2004, according to their stage at the time of the first PE/VC injection. Stages are defined as follows: Seed Capital: usually involving a small capital injection, at a pre-operational stage, for the development of a product, market tests or patent filing. Start-up: capital injected into firms at their structuring stage, usually during the first year of operations, when the products/services are not yet marketed. At this stage, firms have begun hiring professionals and carried out all the studies needed to put their business plans to action. Expansion: capital injection to expand the activities of a firm that already markets its products. It is usually directed towards working capital, plant expansion, distribution chain expansion, or communication and marketing campaigns. Includes mezzanine investments that are made by mean of subordinated debt that is senior to equity (e.g. convertible debt). Later Stage: capital injection into firms that have reached relatively stable growth rates and positive cash flow. Acquisition Finance: capital used to finance growth through mergers and acquisitions. Management Buyout/in (MBO/I): capital used to finance the acquisition of a company by a team of existing or new managers that wish to secure control. Bridge Finance: injection made when a firm plans to carry out an IPO within a short period of time (usually two years), and may involve restructuring the positions of major shareholders and/or other capital providers. Turnaround: investment in the financial and operational restructuring of distressed assets.

28
6.2 – Deal size gap There is usually a positive relationship between deal size and stage of invested companies. The earlier the stage of development of a company, the smaller the amount invested. However, this is not always true. For example, Brazil witnessed at least one seed capital investment of US$ 30 million for the initial development of a biotechnology firm (i.e., seed capital). For this reason, it is recommended to treat stage and deal size as two different variables of PE/VC investment. The size of the deal is a very important criterion for investment selection for a number of PE/VC firms. Firstly, PE/VC is an activity with important economies of scale. The costs involved in the screening, structuring, monitoring and exiting of portfolio companies have a fixed nature. Moreover, the monitoring of earlier stage companies may be more time consuming than the monitoring of more established companies, sometimes imposing greater costs for smaller funds. This aspect should not be overlooked since monitoring is the longer lasting phase of the PE/VC investment cycle, taking several years of work before an exit finally occurs. Secondly, the PE/VC firms tend to diversify their investments by forming a portfolio of firms with different characteristics. Depending on the size of the PE/VC fund, managers just cannot undertake investments above a certain amount otherwise their portfolio may end up being less than optimally diversified. Indeed, it is common that funds' bylaws impose stringent limits for investment size (e.g., no more than a certain percentage of the fund can be directed to a single investment, or portfolio companies must have revenues below a certain amount in the year prior the investment). Thirdly, there is an overall market perception that successful IPOs need to raise around US$ 100 million, otherwise, the issue risks losing analysts interests and liquidity, resulting in poor performance to market investors. The larger the deal size, the higher the chance that a successful exit takes place in the stock exchange, thus increasing the liquidity and diminishing the exit risk of PE/VC investments. Graph 4 presents the distribution of firms according to deal size and the total amount of capital under management in these firms. Clearly, it shows that there are virtually no PE/VC for deals below US$ 200 thousand. Most firms prefer to invest between US$ 300 thousand and US$ 2 million. However, firms with most of the capital under management target larger deals with a size range between US$ 10 million to US$ 25 million. Assuming that PE/VC firms receive half the amount raised in IPOs and the other half is received by the company to undertake its growth plan, a 15% to 38% annualized internal rate of return (IRR) would suffice to have the latter deals reach the typical IPO size in five years.

29
Graph 4 – Distribution of Firmss and Capital According to Deal Size38
Graph 4 shows the amount of capital under management in PE/VC firms according to their preferred minimum and maximum investment size. A total of 21 PE/VC firms that informed both figures were included in the analysis. According to Graph 4, there is a limited amount of PE/VC for companies that require less than US$ 6 million, and even less capital for companies that need investments of US$ 3 million to US$ 4 million. Assuming that: (i) a PE/VC firm acquires around 30% of each portfolio company; (ii) that portfolio companies have a 20% EBITDA margin; and (iii) that these companies are valued at a multiple of 5x EBITDA, then we observe that very few capital is available to SMEs with less than US$20 million in revenues. And a perceptible gap exists for companies with revenues in the US$ 10 million to US$ 12 million range. 6.3 – Technology gap Table 6 presents the industrial sectors in which portfolio companies operate in Brazil. Apparently, there is an equilibrated distribution between technology intensive and non-technology intensive sectors. Among technological sectors, IT and Electronics receive most attention, specially the software segment, closely followed by Telecommunications. There are also a few portfolio companies venturing in the biotechnology sector.
38 Distribution of PE/VC firms according to preferred deal size and the amount of capital under management with these firms. The x-axis presents the preferred value of investment, which was provided by the PE/VC firms based on minimum and maximum preferred size of investment. The left y-axis represents the number of PE/VC firms with corresponding investment preference in the x-axis. The right y-axis presents the aggregated capital under management in these firms. Only 21 out of 65 PE/VC firms that reported both the minimum and the maximum preferred size of investments were included.

30
Table 6 – Portfolio Companies by Industrial Sector39
Industrial Sector # % Industrial Sector # %
1.IT and Electronics 91 34.6 6.Food 10 3.8 1.1.Software 50 6.1.Food 8 1.2.Business Process Outsourcing 14 6.2.Fast-food and Franchises 2 1.3.Internet 8 7.Biotechnology 10 3.8 1.4.IT Machinery and Equipment 7 7.1.Human 7 1.5.IT Support Services 5 7.2.Vegetable 2 1.6.Commercial Automation 2 7.3.Animal 1 1.7.Systems Integration 1 8.Financial Services 10 3.8 1.8.Digital Security 1 8.1.Insurance 2 1.9.Electrical Equipment 1 8.2.Dental Plan 1 1.10.Security Equipment 1 8.3.Credit Cards 1 1.11.Retail 1 8.4.Unspecified 6
2.Industrial Products and Services 31 11.8 9.Entertainment/Travel 8 3.0 2.1.Machinery and Equipment 5 10.Medicine and Beauty 8 3.0 2.2.Base Industry 4 10.1.Pharmaceuticals 3 2.3.Industrial Automation 4 10.2.Medical-Hospital Products 2 2.4.Textile 4 10.3.Beauty and Health Franchises 1 2.5.Industrial Viewing Systems 2 10.4.Medical and Lab Services 1 2.6.Husehold Appliances 2 10.5.Medical Instruments 1 2.7.Industrial Laundry 2 11.Construction/Real Estate 7 2.7 2.8.Sterilization 1 11.1.Construction Materials 4 2.9.Engineering 1 11.2.Real Estate Developments 2 2.10.Furniture 1 11.3.Real Estate Services 1 2.11.Packaging 1 12.Agribusiness 7 2.7 2.12.Water Treatment 1 12.1.Agriculture and Cattle 4 2.13.Maintenance Materials Dist. 1 12.2.Machinery and Equipment 1 2.14.Automotive 1 12.3.Inputs 1 2.15.Chemical 1 12.4.Reforestation 1
3.Telecommunications 29 11.0 13.Comunicação/Mídia 7 2.7 3.1.Services 21 14.Power 4 2.7 3.2.Equipment 7 14.1.Distribution 2 3.3.Call center 1 14.2.Production 1
4.Transport., Logistics and Dist. 16 6.1 14.3.Power Planning 1 4.1.Integrated Logistics 6 15.Incubator/Holding 3 1.1 4.2.Aerial 4 16.Education 3 1.1 4.3.Railways 3 17.Security Equipment 1 0.4 4.4.Terrestrial 2 18.Auctions 1 0.4 4.5.Maritime 1 19.Sanitation 1 0.4
5.Retail 16 6.1 Unspecified 2 - Total 265 100.0
Source: Ribeiro (2005) Indeed, the PE/VC industry is renowned for investing in high-tech companies. According to the OECD (2005), in countries such as Canada, Ireland, and the U.S., more than 70% of PE/VC investments are directed to technological sectors. Software and biotech are the two sectors where most deals were made in 2004 for five out of six countries in a study performed by Ernst & Young (E&Y, 2005): France, Germany, Israel, Sweden, U.K. and U.S. In the sample of 1,331 European companies analyzed by Bottazzi et al (2004), software, Internet, electronics, biotech, medical supplies and pharmaceutical represented 59%.
39 Aggregate distribution of portfolio companies in December 2004. For firms operating in more than one industry, only the main industrial sector was considered.

31
According to Lerner and Schoar (2005), it is expected that developing countries should have more investments being directed to traditional sectors with little technological innovation. In terms of the number of deals (Table 6), Brazil seems to have very few investments in sectors of technological relevance. For example, it is surprising that in a country with agrarian aptitude, only seven investments are in agribusiness and only three are in vegetable or animal biotechnology. With a potential market of 180 million people, one should also expect more companies producing medical supplies and equipments. 6.4 – Regional gap In Brazil, 99% of the pool of PE/VC commitments is managed by firms based in Sao Paulo or Rio de Janeiro, cities located in the Southeastern region of the country. Given that PE/VC firms prefer to stay within a reasonable distance from portfolio companies, Table 7 shows that 65% of portfolio companies are also located in the same region. The Southern region, renowned for its European migrants and entrepreneurial culture, comes second, with 25.5% of companies. However, the rest of the Brazilian territory is left with less than 10% of investments. The Northern region, close to the Amazon, is represented by one single investment in a telephony provider. Geographical concentration is a typical characteristic of the PE/VC industry. In the U.S., Silicon Valley (Santa Clara county and San Francisco bay area), and Route 128 (Great Boston, MA) concentrate 34% and 15% of the VC investments (Moneytree, 2005). In other emerging markets, the concentration is similar. A few years ago in India, 31 PE/VC firms were located in Mumbai (Bombay), the country's financial center. New Delhi, the political capital came second with ten firms. Finally, Bangalore, the technological cluster had eight firms (Dossani and Kenney, 2002).40 For this reason, this gap cannot be considered as a malfunction of the Brazilian PE/VC, but just as a feature that could be enhanced by business and public policies. Since PE/VC can function as a development tool with recognized economic and social impact, it is of great relevance for the government to provide the right incentives and institutional framework for entrepreneurial activity and innovation in the less developed regions of Brazil. So far, there have been a few initiatives to gather local universities and corporations to develop technological centers in the Northeastern region. At least one of these centers41 has effectively created new enterprises in the IT sector. Moreover, a few of these companies received VC investment from firms located in the Southeastern region. If similar policies were to be adapted and replicated in other cities in the Northeaster region, the grater number of new high-growth SMEs should translate into real incentives for a few experienced PE/VC firms to open local offices and look to investment opportunities in the region with more interest.
40 The smallest distance among these three cities is approximately 900 kilometers. 41 Centro de Estudos e Sistemas Avançados do Recife (CESAR) in the State of Pernambuco fostered the creation of more than 30 new IT ventures. At least two of them received VC investment.

32
Table 7 – Geographic Distribution of Portfolio Companies42
Region Number of Firms Valid Percentage Southeast 171 65.0
São Paulo 100 38.0 São Paulo Interior 14 5.3 Rio de Janeiro Rio de Janeiro 32 12.2
Belo Horizonte 22 8.4 Minas Gerais Interior 2 0.8 Espírito Santo Interior 1 0.4
South 67 25.5 Porto Alegre 27 10.3 Rio Grande do Sul Interior 2 0.8 Florianópolis 14 4.6 Santa Catarina Interior/Coastal 10 3.8 Curitiba 13 4.9 Paraná Interior 1 0.4
Northeast 15 5.7 Bahia Salvador 5 1.9 Pernambuco Recife 5 1.9 Paraíba Interior 1 0.4 Rio Grande do Norte Natal 2 0.8 Ceará Fortaleza 3 1.1
Center-West 9 3.4 Goiás Goiânia 3 1.1 Mato Grosso Cuiabá 1 0.4 Distrito Federal Brasília 4 1.5 Mato Grosso do Sul Interior 1 0.4
Norte 1 0.4 Pará Belém 1 0,4
Unspecified 2 - Total 265 100.0
Source: Ribeiro (2005) 7 - Concluding remarks As seen in this chapter, PE/VC is a vital and complementary segment of capital markets and is essential to high-growth SMEs. While PE/VC is not the only way to promote entrepreneurship and the creation of new companies (IDB, 2003), it is considered as an important intermediary step to give them access to capital markets, especially in Latin America and the Caribbean (LAC). To date, PE/VC has an outstanding record of accomplishment in developed countries, but it is still in an early stage of development in LAC. Brazil is the possible exception. Its PE/VC industry has been evolving over the past 25 years and is now a protagonist in about half the IPOs that take place in the local stock markets. Many of which were performed by companies that were SMEs when they first received PE/VC investment. In addition, a great number of trade-sales (i.e. acquisition of portfolio companies by corporations) have been performed by the Brazilian PE/VC industry. This success has been possible due to three conditions. The first pertains to Brazil’s special characteristics and large size that produces a larger number of companies for PE/VC firms to choose from and a larger pool of entrepreneurial
42 Aggregate distribution of portfolio companies in December, 2004 by region, state and metropolitan area.

33
talent. Brazil also features a great number of sectors that are highly fragmented (i.e., many small players operating at less than optimal scale). This represents an opportunity for consolidation financed by PE/VC. The second pertains to Brazil’s success in reforming many policies and regulations that impeded PE/VC from existing and from investing in SMEs. These have included the opening of the economy, a successful stabilization plan that brought inflation under control, the privatization of industrial and public service companies, the adoption of a new corporate law that enhanced investor protection, the creation of the Novo Mercado that raised the standards of corporate governance in listed companies, the approval of a new regulatory framework for PE/VC funds, and the adoption of new Laws to promote foreign direct investment, entrepreneurship, innovation and public-private partnerships. The third condition relates to the Brazilian government and FDIs early reaction to promote PE/VC investment in the country with the effective participation of private sector organziations. While Brazil was lucky to have both the right setting and experience and the right economic and institutional events for the industry to develop, it still faces several challenges related to its economic and institutional environment, which hinder the PE/VC industry and threaten its survival. The most important areas for the next round of reforms will be:
Promote economic and institutional policies that stimulate growth rates supporting of business creation, development, and attraction of foreign capital.
Increase PE/VC investment opportunities through policies that promote broader
income distribution and reduce the high wealth concentration that limits the number of potential entrepreneurs as well as the market size for consumer products and services.
Provide entrepreneurship education to students at secondary school.
Make labor regulations more flexible to accommodate greater competitiveness. Reduce bureaucracy and corruption that slow down business, especially the smaller
ones. This will translate into more opportunities for early-stage investment.
Reform the tax system that forces companies to become informal. While the tax burden should become lighter for Brazilian companies, the tax procedures need to be completely reviewed and simplified.
Improve transportation, energy and telecommunication infrastructure in order to
increase welfare and reduce operational costs to companies that rely on these services, thus increasing the competitiveness of several sectors. Since the Brazilian government does not have enough capital to finance all of the country' needs, this translates into interesting public-private partnership opportunities which can be financed by PE/VC firms.
Promote greater R&D expenditure. This should translate into more opportunities for
PE/VC investment in technology-oriented businesses.

34
Reform judiciary procedures and policies in order to speed-up the solution of business and investment-related conflicts.
Enhance the enforcement of creditor' and investors' rights in order to make capital less
expensive and scarce. This will diminish the risk perception of both PE/VC investors that rely on complex contracts and potential suppliers of leverage to portfolio companies. As a result, more LBOs and MBOs will take place in Brazil.
This a non-exhaustive but relatively large list of reforms, which requires a long-term plan and coordinated efforts between the executive, legislative and judiciary powers, their several branches, and private sector organizations that promote auto-regulatory policies. The benefits of such effort are straightforward. Besides promoting a stronger PE/VC market, a better business environment should translate into more high-growth start-ups, increased competitiveness by the use of innovation and technology, and the development of more distant and less wealthy regions. In sum, this would most probably put Brazil back in its deserved category of highly developing country. Since most countries in LAC share similar economic and institutional traits with Brazil, the path followed by the local PE/VC industry can serve as an example for others to learn with its successes and failures. The environment is quickly changing in LAC, creating a very positive condition for the PE/VC industry to evolve. This is the result of economic stability coupled with institutional reforms and a moment of high world liquidity. Countries that do not have a mature PE/VC industry should pay close attention to the experience of others in order to foster their own industries. On the other hand, countries with more mature PE/VC industries should make sure that the increased world liquidity helps them close the investment "gaps". Specifically: more investments in the extremes of venture capital and buyout; well managed companies under US$20 million of revenues having access to PE/VC sources; more technology-oriented deals; and increased presence of PE/VC firms outside the traditional business and financial clusters. The LAC countries should also find means of creating a less heterogeneous business environment in the region, thus promoting the growth of financial intermediation activities that require economies of scale, such as PE/VC. PE/VC in LAC is already having a great deal of public recognition for the few success cases that illustrate its economic and social impact, but if the industry continues its course, it is safe to say that this was just the beginning. References AMCHAM. 2006. 2006 Competitiveness Panel. Sao Paulo, SP: American Chamber of
Commerce. AMR Research. 2005. The Enterprise Resource Planning Spending Report, 2005–2006.
Boston, MA: AMR Research. Barry, C., C. Muscarella, J. Peavy III and M. Vetsuypens. 1990. The Role of Venture Capital
in the Creation of Public Companies: Evidence from the Going Public Process. Journal of Financial Economics. 27(2):447-471.

35
Black, B. and R. Gilson. 1998. Venture Capital and the Structure of Capital Markets: Banks
Versus Stock markets. Journal of Financial Economics. 47(3):243-277. BNDES. BNDES, the Private Equity and Venture Capital Industry and Small and Medium-
Sized Companies. Rio de Janeiro, R.J.: Banco Nacional de Desenvolvimento Econômico e Social.
Bottazzi, L. and M. Da Rin. 2002. Venture Capital in Europe and the Financing of Innovative
Companies. Economic Policy. 17(34):229-270. Bottazzi, L., M. Da Rin and T. Hellman. 2004. The Changing Face of the European Venture
Capital Industry: Facts and Analysis. Journal of Private Equity. 8(1). Carvalho, G., L. Ribeiro and C. Furtado. 2006. Private Equity and Venture Capital in Brazil –
The first Census. Sao Paulo, SP: Editora Saraiva. Chen, P., G. Baierl and P. Kaplan. 2002. Venture Capital and Its Role in Strategic Asset
Allocation: Long-Term Risk-Return Characteristics. Journal of Portfolio Management. 28(2):83-89.
CVCA. 2004. Review of Venture Capital Investment Activity in Canada. Toronto: Canada's
Venture Capital & Private Equity Association. DRI-WEFA. 2002. Measuring the importance of venture capital and its benefits to the United
States economy. Arlington, VA: DRI-WEFA. EVCA. 2002. Survey of the Economic and Social Impact of Venture Capital in Europe.
Brussels: European Venture Capital Association. EVCA. 2005. Final Activity Figures for 2004. Brussels: European Venture Capital
Association. E&Y. 2005. Renewal and New Frontiers – Global Private Equity: Venture Capital Insights
Report 2004-2005. Ernst & Young. Fried, V. and R. Hisrich. 1994. Toward a Model of Venture Capital Investment Decision
Making. Financial Management. 23(3):28-37. Global Insight. 2004. Venture Impact: Venture Capital Benefits to the U.S. Economy.
Arlington, VA: Global Insight. IDC. 2004. Latin America Semiannual Back Office Applications Tracker. Framingham, MA:
International Data Corporation. IDB. 2003. MIF Evaluation – Development of Venture Capital. Washington, D.C.: Inter-
American Development Bank. JACF. 2006. Morgan Stanley Roundtable on Private Equity and Its Import for Public
Companies. Journal of Applied Corporate Finance. 18(3): 8-37.

36
Jensen, M. 1991. Corporate Control and the Politics of Finance. Journal of Applied Corporate
Finance. 4(2):13-33. Kauffmann, D, A. Kraay and M. Mastruzzi. 2003. Governance Matters III: Governance
Indicators for 1996-2002. The World Bank Policy Research Reports Series. Washington, DC.
Kenney, M, K. Han and S. Tanaka. 2003. The Globalization of Venture Capital: The Cases of
Taiwan and Japan. In Financial Systems, Corporate Investment in Innovation and Venture Capital, eds. A. Bartzokas and S. Mani. Cheltenham, UK and Northampton, MA: Edward Elgar.
Kortum, S. and J. Lerner. 2000. Assessing the Contribution of Venture Capital to Innovation.
RAND Journal of Economics. 31(4):674-692. Lee, P. and S. Wahal. 2004. Grandstanding, Certification and the Underpricing of Venture
Capital Backed IPOs. Journal of Financial Economics. 73(2):375-407. Lerner, J. and J. Willinge. 1996. A Note on Valuation in Private Equity Settings. Harvard
Business School, Note 9-297-050. Lerner, J. and A. Schoar. 2005. Does Legal Enforcement Affect Financial Transactions? The
Contractual Channel in Private Equity. Quarterly Journal of Economics, 120(1). Mariz, F. and J. Savoia. 2005. Private Equity in Brazil: A Comparative Perspective. Journal
of Private Equity. 1(1):1-14. Megginson, W. 2004. Toward a Global Model of Venture Capital? Journal of Applied
Corporate Finance. 16(1):8-26. Megginson, W. and K. Weiss. 1991. Venture Capitalist Certification in Initial Public
Offerings. Journal of Finance. 46(3):879-903. Moneytree. 2005. Moneytree Survey: Full Year and Q4 2004 Results – U.S. Report.
Moneytree. NVCA. 2005. Year in Review: 2004-2005. Arlington, VA: National Venture Capital
Association. OECD. 2002. Venture Capital: Trends and Policy Recommendations. Paris: Organisation for
Economic Co-Operation and Development. OECD. 2005. Developments in Venture Capital and Private Equity Since the end of "Tech
Bubble". Paris: Organisation for Economic Co-Operation and Development. Pavani, C. 2003. O Capital de Risco no Brasil: Conceito, Evolução e Perspectivas. Rio de
Janeiro, RJ: E-papers.

37
Reynolds, P., M. Hay, W. Bygrave, S. Camp and E. Autio. 2003. Global Entrepreneurship Monitor: 2003 Executive Report. London, UK: Babson College & London Business School.
Ribeiro, L. 2005. A Model of Private Equity and Venture Capital in Brazil. Masters' thesis,
School of Economics, Business and Accounting, University of Sao Paulo. Sao Paulo, SP.
Ribeiro, L. and M. Almeida. 2005. Estratégia de Saída em Capital de Risco. Revista de
Administração da Universidade de São Paulo (RAUSP). 40(1):55-67. Ribeiro, L., A. Carvalho and C. Furtado. 2006. Private Equity and Venture Capital in an
Emerging Economy: Evidence from Brazil. Paper presented at the conference, Babson College Entrepreneurship Research Conference, 7-10 June, Bloomington, United States.
Sahlman, W. 1990. The Structure and Governance of Venture-Capital Organizations. Journal
of Financial Economics. 27(2):473-521. Williamson, O. 2003. Examining Economic Organization Through the Lens of Contract.
Industrial and Corporate Change. 12(1):917-942. Wilson, D., R. Purushothaman. DreamingWith BRICs: The Path to 2050. 2003. Goldman
Sachs Global Economic Papers n.99. New York, NY. Wright, M. and K. Robbie. 1996. Venture Capitalists, Unquoted Equity Investment Appraisal
and the Role of Accounting Information. Accounting and Business Research 26(2):153-168.