Embed Size (px)
Citation preview

SME Equity Financing AtlasA new investment boom phase driven by startups and tech
www.pwcaccelerator.com
First editionMarch 2017

2 PwC’s Accelerator
This document is exclusively designed for the general information of readers and is (i) not intended to address the specific circumstances of any particular individual or entity and (ii) not necessarily comprehensive, complete, accurate or up to date and hence cannot be relied upon to take business decisions. Consequently, PwC’s Accelerator does not guarantee that such information is accurate as of the date it is received or that it will continue to be accurate in the future. The reader must be aware that the information to which he/she has access in this document is provided “as is” without any express or implied guarantee by PwC’s Accelerator and does not constitute the giving of an investment advice.
PwC’s Accelerator cannot be held liable for mistakes, omissions, or for the possible effects, results or outcome obtained further to the use of this publication or for any loss which may arise from reliance on materials contained in it, which is issued for informative purposes only. No reader should act on or refrain from acting on the basis of any matter contained in this publication without considering and, if necessary, taking appropriate advice in respect of his/her own particular circumstances.

1SME Equity Financing Atlas 2016
Table of contentForeword 2
Global perspective 4Boom in equity investments in SMEs: deals +108% and capital invested +122% in 5 years 6
Ticket sizes have increased at all stages of investment... 8
...with +159% in pre-money valuations in later stage deals 9
Investor activity: accelerators and incubators on the rise 10
Investments in IT count for over a third of the total capital invested in 2015 12
Europe picking up the pace, but still far behind the US 14
Deals per 100,000 inhabitants (per capita) in 2015 15
Industry focus by country 16
Series A investors take biggest equity stakes (on average) 18
Follow-up financing after seed-round - 52% make it to a Series A round 19
A journey of equity financed SMEs over a 10 year period (part 1) 20
A journey of equity financed SMEs over a 10 year period (part 2) 21
Regional perspective 22USA still globally dominant in terms of deals and volumes 24
As a North American SME, where do I look for the highest density of investor(s) according to my industry and my financing need? 26
Slowdown in deals in European SMEs in 2015 28
As a European SME, where do I look for highest density of investor(s) according to my industry and my financing need? 30
China and India are the dominating hubs in Asia 32
As an Asian or Middle East SME, where do I look for the highest density of investor(s) according to my industry and my financing need? 34
Countries in the spotlight 36German equity investment market in SMEs 38
Slowdown in deals and increase in capital invested 39
Top three most active investors investing in German SMEs by ticket size and industry (within last two years) 40
French equity investment market in SMEs 41
Slowdown in deals and volatile capital invested 42
Top three most active investors investing in French SMEs by ticket size and industry (within last two years) 43
Industry in the spotlight 44Significant growth of investments in “Big Data” focused SMEs 46
Location of equity investor backed Big Data SMEs worldwide (last five years) 48
Example of innovative Big Data SMEs receiving equity in last two years 49
Most active investors in Big Data SMEs by deals size (last two years) 50

2 PwC’s Accelerator
SME Equity Financing AtlasA new investment boom phase driven by startups and tech
Laurent ProbstPwC’s Accelerator Global Leader
Cyrille FoillardPwC’s Accelerator Managing Director
Why?Our objective was to evaluate the equity financing market for SMEs, identify barriers and enablers at a global, cross-border and regional level.
How?We analysed equity investments in SMEs from 2010-2015 (based on Pitchbook and World Bank data), covering:
• 52,614 companies that employ less than 250 persons;
• 81,141 deals with a known deal size under EUR 500m
• 33,490 equity investors
– including VC deals and PE growth and expansion deals from all investor types (angels, venture capital funds, family offices, etc.);
– excluding secondary market transactions (buy-outs, buy-ins, M&As).
For whom?Our Atlas is both addressing CEOs of SMEs looking for equity financing with an overview of key aspects in current equity financing relevant to them, as well as equity investors wanting to gain an overview of the current market situation. We also give policy makers a panorama of the equity financing ecosystem to help them address relevant questions.

3SME Equity Financing Atlas 2017
Key insights
1. Boom in equity investment in SMEs - deals up by 108% and capital invested by 122% in five years, resulting in 18,186 deals and nearly EUR 150bn in capital invested in 2015.
2. Significant increases in pre-money valuation of young companies (especially in later-stage investments) puts pressure on CEOs to deliver on expectations.
3. Accelerator and incubators on the rise and investing in young companies, as shown by the growth of 578% in number of deals in five years (from 547 to 3,709).
4. More and more corporates are creating their own venture capital funds to source and invest in young innovative SMEs with > EUR 20bn capital invested in 2015.
5. SMEs operating in booming industry verticals such as FinTech, Big Data, Mobile or Cybersecurity are increasingly attracting equity investors.
6. Europe picking up with 21% of deals done with European ventures, but still far behind the US. More and more cross-border deals show foreign investors’ interest in local ventures.
7. Of the 1,182 equity-backed companies we’ve followed over a period of 10 years, only 5% are able to exit via IPO, with the vast majority being US companies (75%).
Key questions for government and policy makers to muscle the ecosystem!1. Staying or leaving?Are the capital gains and exit through equity investment in SMEs reinjected into the local ecosystem? Are successful entrepreneurs re-investing or leaving the territory?2. Is your local ecosystem attractive enough for equity investments in SMEs?Are SMEs or your ecosystem attracting external financing in the form of equity financing or do they have to go abroad for financing?3. Are your local incubators and accelerators strong enough to support SMEs in your
ecosystem?Do your local incubators and accelerators provide strong enough assistance to SMEs to grow fast in domestic and international markets?4. Growing or selling your SMEs?What are the entrepreneurs of your ecosystem likely to do: grow or sell their SMEs? How many IPOs relative to M&As happen in your ecosystem? What are the true remaining barriers for SMEs growth in your ecosystem?5. Enough engagement of corporates?How can you boost corporate investments into SMEs? How active are corporates in investing in SMEs?6. Enough entrepreneurs?Do you have enough good entrepreneurs in your ecosystem?
3SME Equity Financing Atlas 2016
33,490equity
investors
52,614SMEs
86,141deals

4 PwC’s Accelerator
Part 1

5
Global perspective
SME Equity Financing Atlas 2016

Equity investments in SMEs have been growing steadily over the last years. The main drivers are the accumulation of capital in investors’ hands, new technologies and the low-interest rates. Since some asset classes (e.g. debt asset classes, like bonds)
can’t yield good returns anymore, some investors turn towards riskier asset classes, like equity for start-ups. It’s difficult to estimate how this growing trend will look in the future, as new macroeconomic factors (e.g. Brexit) might have a role to play.
Nevertheless, SMEs and their often disruptive and innovative solutions can offer significant returns for investors.
Equity investments in SMEs worldwide
Boom in equity investments in SMEs:deals +108% and capital invested +122% in 5 years
00.00
5.00
10.00
15.00
20.00
25.00
30.00
35.00
40.00
45.00
50.00
500
1,000
1,500
2,000
2,500
3,000
3,500
4,000
4,500
5,000
Number of deals closed Capital invested in EUR bn
2015
Q4
2014
Q4
2013
Q4
2012
Q4
2011
Q4
2010
Q4
2015
Q2
2014
Q2
2013
Q2
2012
Q2
2011
Q2
2010
Q2
2015
Q3
2014
Q3
2013
Q3
2012
Q3
2011
Q3
2010
Q3
2015
Q1
2014
Q1
2013
Q1
2012
Q1
2011
Q1
2010
Q1
Total capital invested (in EUR bn) Number of deals (#)
6 PwC’s Accelerator

7SME Equity Financing Atlas 2017
• Strong growth in deals and capital invested over the last five years.
• Significant slowdown in deals in 2015 (mainly in Europe).
• Growth in deals for 2010-2015 (+108%) is slightly lower than for capital invested (+122%).
• Significant growth in capital invested in the last three years (+70%).
• First signs in the first half of 2016 that these evolutions will continue.
Key information
Year to year perspective
Source: PitchBook Inc.
2010
8,723
10,453
13,017
16,426
18,686 18,186
2011 2012 2013 2014 2015
20,000 200.00
150.00
100.00
50.00
0.00
15,000
10,000
5,000
0
Number of deals closed Capital invested in EUR bn

8 PwC’s Accelerator
Since 2013, ticket sizes have increased at all stages of investment, mainly due to an increase in capital inflows. Moreover, in recent years the “Unicorn Club” (private companies that exceed USD 1bn pre-money valuation mark) had become increasingly crowded, with prominent companies like AirBnB, Dropbox or Uber.
Average ticket size per series
0.00 2.50 5.00 7.50
10.00 12.50 15.00 17.50 20.00 22.50 25.00 27.50 30.00 32.50 35.00 37.50 40.00
1998 1999 2000 2001 2002 2003 2004 2005 2006 2007 2008 2009 2010 2011 2012 2013 2014 2015
Seed Series A Series B Series C
in EUR m
Nevertheless, increasing valuations raise the bar for young companies' future performance. These valuations can put pressure on the firm to deliver on the expectations - this requires strong partners helping to meet expectations. Not meeting expectations in the form of down-rounds can lead to dilution and
misalignment. From the investors’ perspective, mainly the later-stage ones are currently affected by the increase of valuations.
Ticket sizes have increased at all stages of investment...

9SME Equity Financing Atlas 2017
• Significant growth in average ticket size per series since 2015, reaching new heights for the last years.
• Pre-money valuation, across all series, reaching new heights.• Very large sized tickets (> 25m) show largest growth in pre-money
valuation.• High pre-money valuations are mainly seen with SMEs in the
information technology sector, but also in areas such as Life Science or CleanTech.
• Superior growth in ticket size over pre-money valuation has also led to an increased dilution for investors.
Key information
Pre-money valuation median by ticket size
2.54
3.90
6.49
17.35
37.96
76.13
8.25
19.98
47.58
215.88
Source: PitchBook Inc.
2010
2010
2010
2010
2010
1.15
1.46
2010
2015
2015
2015
2015
2015
2015
0 - 499k
500k - 0.9m
1m - 4.9m
5m - 9.9m
10m - 24.9m
> 25m
+27.5%
+53.5%
+27.2%
+15.2%
+25.3%
+159.9%
...with +159% in pre-money valuations in later stage deals

10 PwC’s Accelerator
Share of capital invested by investor type over the period 2010-2015
Median deal size by type of investor
0
2.5
5
7.5
10
12.5
15
2010 2011 2012 2013 2014 2015
Angel (group & individual) & family office Accelerators & incubators Venture capital firm Corporate VC PF growth/expansion or mezzanine fund Government or universities
in EUR m
Investor activity: accelerators and incubators on the rise
Following the big success of projects initially funded through incubators or accelerators (e.g. AirBnB, Dropbox), more and more similar projects are rolled-out globally. However, venture capital remains the main source of funding for early-stage companies.
This is firstly due to the historic appetite of venture capital investors for risky business ideas (start-ups) and secondly, because they provide management assistance, client introduction and expertise, which are key for the critical stages of a start-up.
Nevertheless, private equity funds and venture capital investors remain the dominant players in terms of capital invested, as they nearly account for 2/3 of all invested capital.
41%
36%
10%
3% 9%
1%
PE growth/expansion or mezzanine fund Venture capital firms Angel (group & individual) & family office
Government or universities
Corporate VC Accelerators & incubators
41%
36%
10%
3% 9%
1%
PE growth/expansion or mezzanine fund Venture capital firms Angel (group & individual) & family office
Government or universities
Corporate VC Accelerators & incubators
11SME Equity Financing Atlas 2017
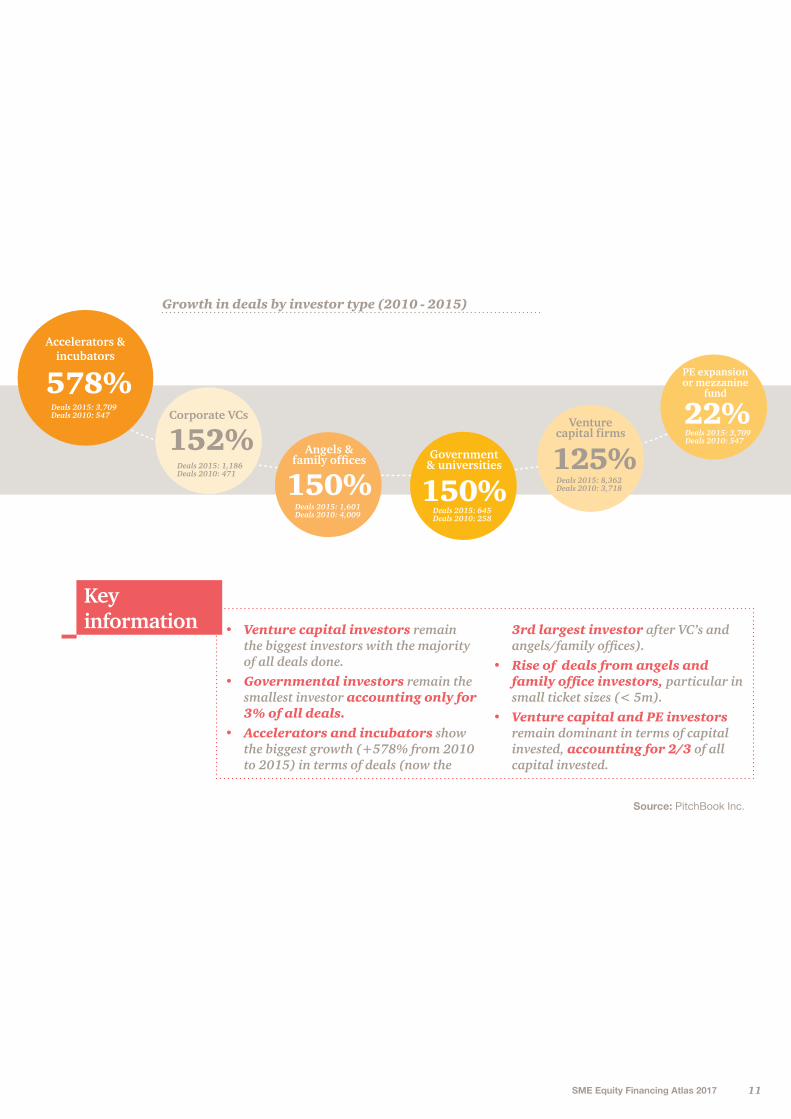
• Venture capital investors remain the biggest investors with the majority of all deals done.
• Governmental investors remain the smallest investor accounting only for 3% of all deals.
• Accelerators and incubators show the biggest growth (+578% from 2010 to 2015) in terms of deals (now the
3rd largest investor after VC’s and angels/family offices).
• Rise of deals from angels and family office investors, particular in small ticket sizes (< 5m).
• Venture capital and PE investors remain dominant in terms of capital invested, accounting for 2/3 of all capital invested.
Key information
Growth in deals by investor type (2010 - 2015)
Source: PitchBook Inc.
152%150% 150%
125%22%Corporate VCs
Angels & family offices Government
& universities
Venture capital firms
PE expansion or mezzanine
fund578%
Accelerators & incubators
Deals 2015: 3,709Deals 2010: 547
Deals 2015: 1,186Deals 2010: 471
Deals 2015: 8,362Deals 2010: 3,718
Deals 2015: 1,601Deals 2010: 4,009 Deals 2015: 645
Deals 2010: 258
Deals 2015: 3,709Deals 2010: 547

12 PwC’s Accelerator
Investments in IT count for over a third of the total capital invested in 2015
Source: PitchBook Inc.
Capital invested by industry sector
2000 2001 2002 2003 2004 2005 2006 2007 2008 2009 2010 2011 2012 2013 2014 2015
0%
0%
25%
25%
100%
100%
75%
75%
50%
50%
Materials & Resources
Information Technology
Healthcare Financial Services Energy Consumer Products & Services
Business Products & Services
Deals by Industry Sector

13SME Equity Financing Atlas 2017
• The majority of deals are done with SMEs in the information technology sector (42% in 2015).
• Since 2010, information technology deals have gained market share, both in terms of number of deals and capital invested.
• Median pre-money valuations are above average (> 15m) in the sectors SaaS, Big Data, FinTech, Life Sciences and Mobile.
• Emerging SMEs in the area of 3D Printing (+1667% from 2010 to 2015) and Wearables/Quantified Self (+1536%) show significant growth in terms of deals, but remain minor in terms of absolute number of deals.
Key information
Source: PitchBook Inc. and World Bank Data
Hot industry verticals (number of deals 2015)
1,308
Life Sciences
Deals 2010: 1,072
3,522SaaS
Deals 2010: 1,325
2,967Mobile
Deals 2010: 931
1,503Manufacturing
Deals 2010: 941
1,257E-Commerce
Deals 2010: 399
750FinTech
Deals 2010:175
722Big Data
Deals 2010:140
603CleanTech
Deals 2010:641
541HealthTech
Deals 2010:132
425EdTech
Deals 2010:92 405
MarketingTech
Deals 2010:185
401IoT
Deals 2010:87
298AdTech
Deals 2010:211
229Wearables
Deals 2010:14
209Robotics &
Drones
Deals 2010:32
1063D Printing
Deals 2010:6
Deals 2015: 18,186
Deals 2010: 8,723

14 PwC’s Accelerator
Europe picking up the pace, but still far behind the US
There’s a historical link between a country’s size of the economy and the capital available for young companies. Countries with more developed economies are able to supply young companies with more capital and foster innovation. However, what we’ve seen in terms of number of deals per 100,000 inhabitants is that although some countries are small, they manage to do more deals than larger states.
Europe
3,862 EUR 23bn
>5 or 0 deals 99 – 5 deals 199 – 100 deals 499 – 200 deals 999 – 500 deals >1000 deals
North America 12,186 EUR 90bn
South America
208 EUR 2bn
Africa
73 EUR 0.5bn
Oceania
189 EUR 0.3bn
Asia
1,755 EUR 29bn

15SME Equity Financing Atlas 2017
Deals per 100,000 inhabitants (per capita) in 2015
<0.01 0.09 – 0.01 0.24 – 0.1 0.49 – 0.25 0.99 – 0.5 >1
Israel
EstoniaIreland
Iceland SingaporeLuxembourg
United Kingdom
United States
2nd
1st
3rd
5th 6th 7th 8th
4th
Relatively small economies that have attracted significant capital investments in SMEs
Large mature equity markets with high volume of capital

16 PwC’s Accelerator
Industry focus by country
No. 1 industry by global region in terms of capital invested in 2015
Business products & services
Consumer products & services
Financial services
Energy Healthcare Information technology
Resources & materials

17SME Equity Financing Atlas 2017
Source: PitchBook Inc. and World Bank Data
• The most important industry varies significantly across countries. In most of the northern economies, the IT industry dominates.
• The US remain dominant in deals and volume, but Europe and Asia are picking up year by year.
• Europe has seen a significant slowdown in deals in 2015 (-12% compared to 2014).
• Countries like Israel, Ireland Finland, Luxembourg, Estonia, Sweden or Switzerland come close to the US in terms of per capita deals.
• Most important countries by absolute number of deals following the US are: United Kingdom, Canada, Israel, Germany, Ireland, France, Italy, China and India.
Key information
Evolution of deals by global regions (by number of deals)
0%
20%
40%
60%
80%
100%
2015 2014 2013 2012 2011 … 2005
Oceania Middle East
Africa Asia
South & Central America Europe
Canada United States
62%
21%
9% 3%
14%
76%
0%
20%
40%
60%
80%
100%
2015 2014 2013 2012 2011 … 2005
Oceania Middle East
Africa Asia
South & Central America Europe
Canada United States
62%
21%
9% 3%
14%
76%

PwC’s Accelerator
Series A investors take biggest equity stakes (on average)
Average equity stake taken by investors (2015)
Seed Series A Series B Series C Series D Series E
20.8%
28.5%23.3%
20.5%16.8%
11.2%
Source: PitchBook Inc.
18

19SME Equity Financing Atlas 2017
Follow-up financing after seed-round 52% make it to a Series A round
% of these companies that received equity financing in follow up Series (until 2015)
tillSeries A
tillSeries B
tillSeries C
tillSeries D
tillSeries E+
No follow-up
No follow-up
51.8%39.6%
19.3%12.0%
3.7%
48.2%
SMEs received their first seed equity financingin 2005(Seed)
187
Source: PitchBook Inc.

20 PwC’s Accelerator
A journey of equity financed SMEs over a 10 year period (part 1)
Companies applying for equity financing in 2005
“Only a small number of all SMEs worldwide are raising capital from equity investors. For the management of SMEs it’s highly important to identify the right investors in their domain, before approaching them. Moreover, the inability to manage expectations and lack of experience in the screening phase can often result in unsuccessful fundraising of SMEs.”
René AndresPwC’s Accelerator Senior Advisor
SMEs received their first seed equity financingin 2005(Seed)
187
1,182 SMEs worldwide raised their first money in 2005 from equity investors (Seed or Series A)
On average only
0.56% of companies that apply for equity financing actually receive it1
1. Based on PwC´s Accelerator internal knowledge

21SME Equity Financing Atlas 2017
A journey of equity financed SMEs over a 10 year period (part 2)M&As remain the most attractive exit option for investors. This is because IPOs are complex and timing is a further difficult factor to control. It takes a lot of time and preparation work to make companies ready to go public, compared to M&As. Moreover, investors can’t directly liquidate all their shares in an IPO compared to an M&A.
1,182SMEs worldwide raised their first Seed or Series A money in 2005 from equity investors
only 1 in 125 companies is able to exit via an IPO > 1b EUR
After 10 years…
Valuation % % of US ventures
0-10m 34% 40%
10m-20m 13% 41%
20-50m 16% 47%
50-100M 13% 48%
> 100m 24% 63.%
A trade sale is8.34 times more frequent than an IPO.
For European SMEs that exited via M&A
35% were bought by US companies and
10% by Asian companies.
Origin of ventures:
75% US ventures, with only 11% EU ventures
Status in 2015 Number of companies
% (of 1,182 companies)
IPO and current enterprise Value > 1b EUR 10 0.8%
IPO and current enterprise Value < 1 b EUR 51 4.3%
Were acquired or merged 509 43.0%
Are generating revenue and have > 15 employees 241 20.4%
Are generating revenue and have < 15 employees 157 13.2%
Are still in clinical trials/product development
27 2.3%
Out of Business or Bankruptcy/Liquidation 187 15.8%
Source: PitchBook Inc.

22 PwC’s Accelerator 22 PwC’s Accelerator
Part 2

23SME Equity Financing Atlas 2017
Regional perspective
23SME Equity Financing Atlas 2016

24 PwC’s Accelerator
USA still globally dominant in terms of deals and volumes
The USA are the biggest market for equity financing worldwide. Over many years, the USA have created local hubs with a high density of start-ups and investors. This and the fact that investors generally prefer proximity to their ventures explain why many deals are local. As there are so many young companies for example in Palo Alto, many investors are also located there and invest in them. Moreover, for very large deals (> EUR 25m) many non-US ventures (e.g. Canadian, Mexican) seek money in the USA, due to the availability of capital and expertise in this region.
0
20,000
40,000
60,000
80,000
100,000
-
2,500
5,000
7,500
10,000
12,500
15,000
2010 2011 2012 2013 2014 2015
USA
0
2,500
5,000
7,500
10,000
12,500
15,000
-
500
1,000
1,500
2,000
2010 2011 2012 2013 2014 2015
Canada
0
2,500
5,000
-
250
500
2010 2011 2012 2013 2014 2015
Foreign investors1 Local investors1
Mexico
1. Percentage of foreign (local) investors that invested in SMEs in the respective country in 2015

25SME Equity Financing Atlas 2017
Capital invested in local SMEs (in EUR m) by ticket size and importance of foreign investors involved (2015)
Country 0-499k 500k-1m 1m-5m 5m-10m 10m-25m 25m+USA% local inv.
66487%
99487%
7,76185%
7,31684%
14,24180%
36,65375%
Canada% local inv.
4158%
4478%
29853%
25239%
65537%
1,12844%
Mexico% local inv.
546%
387%
1750%
3720%
3816%
44533%
100 120 140 160 180 200
0
100
200
300
400
500
2010 2011 2012 2013 2014 2015
Number of deals closed
-
1,000
2,000
3,000
4,000
5,000
2010 2011 2012 2013 2014 2015
Capital invested inEUR m
Explanation
Source: PitchBook Inc.

26 PwC’s Accelerator
Industry 0 – 1m 1m-10m +10m
SaaS (2015 – EUR 14.93bn)
Mobile (2015 – EUR 7.24bn)
Life science (2015 – EUR 14.64bn)
Manufacturing (2015 – EUR 8.89bn)
E-Commerce (2015 – EUR 3.45bn)
CleanTech (2015 – EUR 3.13bn)
Big Data (2015 – EUR 3.73bn)
FinTech (2015 – EUR 3.20bn)
Cybersecurity (2015 – EUR 2.39bn)
IoT (2015 – EUR 1.04bn)
Source: PitchBook Inc.
- 125 250 375 500
USA Canada UK
- 125 250 375 500
USA Canada UK
- 125 250 375 500
USA Canada UK
- 125 250 375 500
USA Canada India
- 125 250 375 500
USA Canada UK
- 125 250 375 500
USA UK China
- 125 250 375 500
USA Canada UK
- 125 250 375 500
USA Canada UK
- 125 250 375 500
USA China Canada
- 125 250 375 500
USA Canada UK
- 125 250 375 500
USA Canada UK
- 125 250 375 500
USA Canada China
- 125 250 375 500
USA Canada Mexico
- 125 250 375 500
USA Canada UK
- 125 250 375 500
USA Canada China
- 125 250 375 500
USA Canada UK
- 125 250 375 500
USA Canada France
- 125 250 375 500
USA Canada UK
- 125 250 375 500
USA Canada UK
- 125 250 375 500
USA Canada China
- 125 250 375 500
USA UK Canada
- 125 250 375 500
USA Canada Japan
- 125 250 375 500
USA Canada UK
- 125 250 375 500
USA UK Canada
- 125 250 375 500
USA Canada UK
- 125 250 375 500
USA Canada Israel
- 125 250 375 500
USA Canada
Canada
France
- 125 250 375 500
USA Canada Australia
- 125 250 375 500
USA Ireland UK
- 125 250 375 500
USA UK
+500
+500
+500
+500
+500
+500
+500
+500
+500
+500
Explanation: The numbers displayed include investors having at least done one investment in the last two years in the given industry (sorted by the top three countries with the greatest amount of active investors in that industry and deal range).
UK Canada Australia USA India China France Ireland Israel
Ticket size
As a North American SME, where do I look for the highest density of investor(s) according to my industry and my financing need?
There’s so much capital available in all industries in the US that ventures don’t necessarily need to look for investors in other countries. Only for some industries, US ventures could consider the UK or Canada as a second option.
Industrialised and well developed countries (US, Germany, France, UK, etc.) mainly focus on IT-driven ventures (SaaS, Cybersecurity, Big data), whereas many emerging and developing countries have more capital invested in B2C or B2B products and services.
2. Capital invested in North American SMEs in 2015 in these industry vertical

27SME Equity Financing Atlas 2017
Industry 0 – 1m 1m-10m +10m
SaaS (2015 – EUR 14.93bn)
Mobile (2015 – EUR 7.24bn)
Life science (2015 – EUR 14.64bn)
Manufacturing (2015 – EUR 8.89bn)
E-Commerce (2015 – EUR 3.45bn)
CleanTech (2015 – EUR 3.13bn)
Big Data (2015 – EUR 3.73bn)
FinTech (2015 – EUR 3.20bn)
Cybersecurity (2015 – EUR 2.39bn)
IoT (2015 – EUR 1.04bn)
Source: PitchBook Inc.
- 125 250 375 500
USA Canada UK
- 125 250 375 500
USA Canada UK
- 125 250 375 500
USA Canada UK
- 125 250 375 500
USA Canada India
- 125 250 375 500
USA Canada UK
- 125 250 375 500
USA UK China
- 125 250 375 500
USA Canada UK
- 125 250 375 500
USA Canada UK
- 125 250 375 500
USA China Canada
- 125 250 375 500
USA Canada UK
- 125 250 375 500
USA Canada UK
- 125 250 375 500
USA Canada China
- 125 250 375 500
USA Canada Mexico
- 125 250 375 500
USA Canada UK
- 125 250 375 500
USA Canada China
- 125 250 375 500
USA Canada UK
- 125 250 375 500
USA Canada France
- 125 250 375 500
USA Canada UK
- 125 250 375 500
USA Canada UK
- 125 250 375 500
USA Canada China
- 125 250 375 500
USA UK Canada
- 125 250 375 500
USA Canada Japan
- 125 250 375 500
USA Canada UK
- 125 250 375 500
USA UK Canada
- 125 250 375 500
USA Canada UK
- 125 250 375 500
USA Canada Israel
- 125 250 375 500
USA Canada
Canada
France
- 125 250 375 500
USA Canada Australia
- 125 250 375 500
USA Ireland UK
- 125 250 375 500
USA UK
+500
+500
+500
+500
+500
+500
+500
+500
+500
+500
Explanation: The numbers displayed include investors having at least done one investment in the last two years in the given industry (sorted by the top three countries with the greatest amount of active investors in that industry and deal range).
UK Canada Australia USA India China France Ireland Israel
Ticket size

28 PwC’s Accelerator
Slowdown in deals in European SMEs in 2015 The EU is attractive for many ventures and their investors, due to the size of the market and the number of potential customers. Another benefit is the nearly harmonised approach when it comes to regulation and the use of a single currency across several countries.
0
2,000
4,000
6,000
8,000
10,000
-
500
1,000
1,500
2,000
2010 2011 2012 2013 2014 2015
UK
0
2,000
4,000
6,000
8,000
10,000
-
500
1,000
1,500
2,000
2010 2011 2012 2013 2014 2015
Ireland
-
2,000
4,000
6,000
8,000
10,000
0
500
1,000
1,500
2,000
2010 2011 2012 2013 2014 2015
Germany
-
2,000
4,000
6,000
8,000
10,000
0
500
1,000
1,500
2,000
2010 2011 2012 2013 2014 2015
France
-
2,000
4,000
6,000
8,000
10,000
0
500
1,000
1,500
2,000
2010 2011 2012 2013 2014 2015
Spain
-
2,000
4,000
6,000
8,000
10,000
0
500
1,000
1,500
2,000
2010 2011 2012 2013 2014 2015
Netherlands
Foreign investors Local investors

29SME Equity Financing Atlas 2017
Capital invested in local SMEs (in EUR m) by ticket size and importance of foreign investors involved (2015)
Country 0-499k 500k-1m 1m-5m 5m-10m 10m-25m 25m+UK% local inv.
10958%
12359%
83050%
62052%
1,30642%
5,70837%
Ireland% local inv.
841%
1060%
8933%
2250%
11926%
1867%
Germany% local inv.
1048%
1571%
18155%
15649%
39043%
2,37619%
France% local inv.
1578%
4074%
36074%
25274%
39662%
1,46555%
Spain% local inv.
1458%
1658%
7551%
3844%
18931%
1,01831%
Netherlands% local inv.
1158%
980%
6943%
6943%
6316%
71617%
Source: PitchBook Inc.

30 PwC’s Accelerator
- 125 250
UK USA France
SaaS (2015 – EUR 3.55bn)
Mobile (2015 – EUR 2.92bn)
Life science (2015 – EUR 3.45bn)
Manufacturing (2015 – EUR 3.53bn)
E-Commerce (2015 – EUR 2.75bn)
CleanTech (2015 – EUR 1.00bn)
Big Data (2015 – EUR 0.32bn)
FinTech (2015 – EUR 1.830bn)
Cybersecurity (2015 – EUR 0.22bn)
IoT (2015 – EUR 0.45bn)
- 125 250
UK USA Italy
- 125 250
UK USA Germany
- 125 250
USA Germany UK
- 125 250
USA UK Germany
- 125 250
UK USA Germany
- 125 250 UK France Spain
- 125 250 UK Germany France
- 125 250 USA UK Switzerland
- 125 250 UK France Germany
- 125 250 UK France USA
- 125 250 France Germany UK
- 125 250
UK Spain Italy
- 125 250
UK France USA
- 125 250
USA UK Germany
- 125 250
UK France Italy
- 125 250
UK France Germany
- 125 250
UK Germany France
- 125 250
UK France Germany
- 125 250
UK USA France
- 125 250
France UK USA
- 125 250
UK Germany Spain
- 125 250
UK USA Germany
- 125 250
USA UK Germany
- 125 250
UK France USA
- 125 250
UK USA France
- 125 250
USA UK Israel
- 125 250 UK Italy Spain
- 125 250 France UK Germany
- 125 250 France UK Switzerland
Explanation: The numbers displayed include investors having at least done one investment in the last two years in the given industry (sorted by the top three countries with the greatest amount of active investors in that industry and deal range).
UK Germany USA Italy Switzerland France Spain Israel
Industry 0 – 1m 1m-10m +10m
As a European SME, where do I look for highest density of investor(s) according to my industry and my financing need?

31SME Equity Financing Atlas 2017
- 125 250
UK USA France
SaaS (2015 – EUR 3.55bn)
Mobile (2015 – EUR 2.92bn)
Life science (2015 – EUR 3.45bn)
Manufacturing (2015 – EUR 3.53bn)
E-Commerce (2015 – EUR 2.75bn)
CleanTech (2015 – EUR 1.00bn)
Big Data (2015 – EUR 0.32bn)
FinTech (2015 – EUR 1.830bn)
Cybersecurity (2015 – EUR 0.22bn)
IoT (2015 – EUR 0.45bn)
- 125 250
UK USA Italy
- 125 250
UK USA Germany
- 125 250
USA Germany UK
- 125 250
USA UK Germany
- 125 250
UK USA Germany
- 125 250 UK France Spain
- 125 250 UK Germany France
- 125 250 USA UK Switzerland
- 125 250 UK France Germany
- 125 250 UK France USA
- 125 250 France Germany UK
- 125 250
UK Spain Italy
- 125 250
UK France USA
- 125 250
USA UK Germany
- 125 250
UK France Italy
- 125 250
UK France Germany
- 125 250
UK Germany France
- 125 250
UK France Germany
- 125 250
UK USA France
- 125 250
France UK USA
- 125 250
UK Germany Spain
- 125 250
UK USA Germany
- 125 250
USA UK Germany
- 125 250
UK France USA
- 125 250
UK USA France
- 125 250
USA UK Israel
- 125 250 UK Italy Spain
- 125 250 France UK Germany
- 125 250 France UK Switzerland
Explanation: The numbers displayed include investors having at least done one investment in the last two years in the given industry (sorted by the top three countries with the greatest amount of active investors in that industry and deal range).
UK Germany USA Italy Switzerland France Spain Israel
Industry 0 – 1m 1m-10m +10m
- 125 250
UK USA France
SaaS (2015 – EUR 3.55bn)
Mobile (2015 – EUR 2.92bn)
Life science (2015 – EUR 3.45bn)
Manufacturing (2015 – EUR 3.53bn)
E-Commerce (2015 – EUR 2.75bn)
CleanTech (2015 – EUR 1.00bn)
Big Data (2015 – EUR 0.32bn)
FinTech (2015 – EUR 1.830bn)
Cybersecurity (2015 – EUR 0.22bn)
IoT (2015 – EUR 0.45bn)
- 125 250
UK USA Italy
- 125 250
UK USA Germany
- 125 250
USA Germany UK
- 125 250
USA UK Germany
- 125 250
UK USA Germany
- 125 250 UK France Spain
- 125 250 UK Germany France
- 125 250 USA UK Switzerland
- 125 250 UK France Germany
- 125 250 UK France USA
- 125 250 France Germany UK
- 125 250
UK Spain Italy
- 125 250
UK France USA
- 125 250
USA UK Germany
- 125 250
UK France Italy
- 125 250
UK France Germany
- 125 250
UK Germany France
- 125 250
UK France Germany
- 125 250
UK USA France
- 125 250
France UK USA
- 125 250
UK Germany Spain
- 125 250
UK USA Germany
- 125 250
USA UK Germany
- 125 250
UK France USA
- 125 250
UK USA France
- 125 250
USA UK Israel
- 125 250 UK Italy Spain
- 125 250 France UK Germany
- 125 250 France UK Switzerland
Explanation: The numbers displayed include investors having at least done one investment in the last two years in the given industry (sorted by the top three countries with the greatest amount of active investors in that industry and deal range).
UK Germany USA Italy Switzerland France Spain Israel
Industry 0 – 1m 1m-10m +10m
Source: PitchBook Inc.

32 PwC’s Accelerator
China and India are the dominating hubs in Asia
Israel has become a start-up hub over the last few years, known all around the world. One of the explanations for this trend lays in the entrepreneurial mindset in Israel. Also the ecosystem includes many investors and research institutions constantly developing and supporting new innovative solutions. This ecosystem has also already attracted many foreign investors (the US for example).
0
5,000
10,000
15,000
20,000
-
500
1,000
1,500
2,000
2010 2011 2012 2013 2014 2015
India
0
2,000
4,000
6,000
8,000
10,000
-
500
1,000
1,500
2,000
2010 2011 2012 2013 2014 2015
Israel
0
5,000
10,000
15,000
20,000
-
500
1,000
1,500
2,000
2010 2011 2012 2013 2014 2015
China
Foreign investors Local investors

33SME Equity Financing Atlas 2017
Capital invested in local SMEs (in EUR m) by ticket size and importance of foreign investors involved (2015)
Country 0-499k 500k-1m 1m-5m 5m-10m 10m-25m 25m+China% local inv.
550%
950%
10157%
35555%
1,20574%
13,92344%
India% local inv.
4360%
5765%
43252%
53038%
1,04731%
7,29629%
Israel% local inv.
1633%
2548%
27441%
20640%
51137%
40830%
Source: PitchBook Inc.

34 PwC’s Accelerator
SaaS (2015 – EUR 4.62b)
Mobile (2015 – EUR 8.54b)
Life Science (2015 – EUR 1.32b)
Manufacturing (2015 – EUR 1.77b)
E-Commerce (2015 – EUR 7.57b)
CleanTech (2015 – EUR 0.49b)
Big Data (2015 – EUR 0.37b)
FinTech (2015 – EUR 1.84b)
Cybersecurity (2015 – EUR 0.21b)
IoT (2015 – EUR 0.29b)
Source: PitchBook Inc.
- 125 250
USA China Israel
- 125 250
USA Israel India
- 125 250
USA India Israel
- 125 250
India USA Singapore
- 125 250
USA China India
- 125 250
China USA Japan
- 125 250
USA South Korea India
- 125 250
Israel Japan USA
- 125 250
USA China Israel
- 125 250
India USA South Korea
- 125 250
USA China India
- 125 250
China Israel USA
- 125 250
India USA Singapore
- 125 250
USA India Singapore
- 125 250
China USA India
- 125 250
India USA Singapore
- 125 250
USA Israel India
- 125 250
USA India China
- 125 250
India Israel USA
- 125 250
USA Israel South Korea
- 125 250
USA Israel China
- 125 250
USA Singapore Japan
- 125 250
USA India Japan
- 125 250
China USA Hong Kong
- 125 250
India USA Israel
- 125 250
Israel USA Germany
- 125 250
Israel China USA
- 125 250
Israel India South Korea
- 125 250
USA Taiwan Japan
- 125 250
USA Israel Japan
Explanation: The numbers displayed include investors having at least done one investment in the last two years in the given industry (sorted by the top three countries with the greatest amount of active investors in that industry and deal range).
UK India USA Singapore China Japan Taiwan Israel South Korea
Industry 0 – 1m 1m-10m +10m
As an Asian or Middle East SME, where do I look for the highest density of investor(s) according to my industry and my financing need?

35SME Equity Financing Atlas 2017
SaaS (2015 – EUR 4.62b)
Mobile (2015 – EUR 8.54b)
Life Science (2015 – EUR 1.32b)
Manufacturing (2015 – EUR 1.77b)
E-Commerce (2015 – EUR 7.57b)
CleanTech (2015 – EUR 0.49b)
Big Data (2015 – EUR 0.37b)
FinTech (2015 – EUR 1.84b)
Cybersecurity (2015 – EUR 0.21b)
IoT (2015 – EUR 0.29b)
Source: PitchBook Inc.
- 125 250
USA China Israel
- 125 250
USA Israel India
- 125 250
USA India Israel
- 125 250
India USA Singapore
- 125 250
USA China India
- 125 250
China USA Japan
- 125 250
USA South Korea India
- 125 250
Israel Japan USA
- 125 250
USA China Israel
- 125 250
India USA South Korea
- 125 250
USA China India
- 125 250
China Israel USA
- 125 250
India USA Singapore
- 125 250
USA India Singapore
- 125 250
China USA India
- 125 250
India USA Singapore
- 125 250
USA Israel India
- 125 250
USA India China
- 125 250
India Israel USA
- 125 250
USA Israel South Korea
- 125 250
USA Israel China
- 125 250
USA Singapore Japan
- 125 250
USA India Japan
- 125 250
China USA Hong Kong
- 125 250
India USA Israel
- 125 250
Israel USA Germany
- 125 250
Israel China USA
- 125 250
Israel India South Korea
- 125 250
USA Taiwan Japan
- 125 250
USA Israel Japan
Explanation: The numbers displayed include investors having at least done one investment in the last two years in the given industry (sorted by the top three countries with the greatest amount of active investors in that industry and deal range).
UK India USA Singapore China Japan Taiwan Israel South Korea
Industry 0 – 1m 1m-10m +10m
- 125 250
UK USA France
SaaS (2015 – EUR 3.55bn)
Mobile (2015 – EUR 2.92bn)
Life science (2015 – EUR 3.45bn)
Manufacturing (2015 – EUR 3.53bn)
E-Commerce (2015 – EUR 2.75bn)
CleanTech (2015 – EUR 1.00bn)
Big Data (2015 – EUR 0.32bn)
FinTech (2015 – EUR 1.830bn)
Cybersecurity (2015 – EUR 0.22bn)
IoT (2015 – EUR 0.45bn)
- 125 250
UK USA Italy
- 125 250
UK USA Germany
- 125 250
USA Germany UK
- 125 250
USA UK Germany
- 125 250
UK USA Germany
- 125 250 UK France Spain
- 125 250 UK Germany France
- 125 250 USA UK Switzerland
- 125 250 UK France Germany
- 125 250 UK France USA
- 125 250 France Germany UK
- 125 250
UK Spain Italy
- 125 250
UK France USA
- 125 250
USA UK Germany
- 125 250
UK France Italy
- 125 250
UK France Germany
- 125 250
UK Germany France
- 125 250
UK France Germany
- 125 250
UK USA France
- 125 250
France UK USA
- 125 250
UK Germany Spain
- 125 250
UK USA Germany
- 125 250
USA UK Germany
- 125 250
UK France USA
- 125 250
UK USA France
- 125 250
USA UK Israel
- 125 250 UK Italy Spain
- 125 250 France UK Germany
- 125 250 France UK Switzerland
Explanation: The numbers displayed include investors having at least done one investment in the last two years in the given industry (sorted by the top three countries with the greatest amount of active investors in that industry and deal range).
UK Germany USA Italy Switzerland France Spain Israel
Industry 0 – 1m 1m-10m +10m

36 PwC’s Accelerator 36 PwC’s Accelerator 36 PwC’s Accelerator
Part 3

37SME Equity Financing Atlas 2017 37SME Equity Financing Atlas 2015
Countries in the Spotlight
Germany France Germany France
At European level, we have seen a slowdown in deals in 2015. Factors influencing that development include stable/slightly declining fundraising of investor funds as well as market uncertainty.
The major investor hubs for Germany remain Berlin and Munich, as well as for France Paris, with a focus on software ventures (especially SaaS, mobile and E-Commerce). Most SMEs employ new and interesting solutions, with a current trend to use more and more machine learning and deep learning approaches.
37SME Equity Financing Atlas 2016

38 PwC’s Accelerator
German equity investment market in SMEs
Share of Foreign investors
56%
Munich
Bonn
Hamburg
Switzerland Luxembourg UK
Investor # deals(<EUR 10m)
High-Tech Gründerfonds
37
Axel Springer Plug & Play Accelerator 18
IBB 11
Target Partners 10
ProSiebenSat.1 Accelerator
10
B-to-v Partners 8
Innovationsstarter Hamburg
8
Holtzbrinck Ventures 7
Cavalry Ventures 7
Capnamic Ventures 7
Investor # deals(>EUR 10m)
Holtzbrinck Ventures 12
Rocket Internet 10
Wellington Partners 6
Highland Capital Partners Europe
5
B-to-v Partners 5
Tengelmann Ventures
4
Mangrove Capital Partners
4
Earlybird Venture Capital
4
DN Capital 4
High-Tech Gründerfonds
4
Most active investors in German SMEs
Source: PitchBook Inc.
Location of ten most active investors (last two years)
1 1
1
1
2 2
2
2 3 3
3
3
4 4
4
5 5
5
5
6 6
6
6
7 7
7
7
8 8
8
89 9
9
9
10 10
10
10
10

39SME Equity Financing Atlas 2017
Slowdown in deals and increase in capital invested
Ten most important industry verticals (# deals – last five years) for German SMEs Deals and capital invested (German SMEs)
Source: PitchBook Inc.
116 142
188
256
302 270
-
1,000
2,000
3,000
4,000
5,000
0
100
200
300
400
500
2010 2011 2012 2013 2014 2015
Capital invested
in EUR m
Number of deals closed
259
225
152
121
114
71
53
35 37 34
SaaS Mobile E-Commerce Manufacturing Life Sciences CleanTech FinTech Internet of Things Big Data LOHAS & Wellness

40 PwC’s Accelerator
Top three most active investors investing in German SMEs by ticket size and industry (within last two years)
Deals size
SaaS Mobile Life science
Manu-facturing
Clean-Tech
Big Data FinTech Cyber-security
E-Commerce
0-1m
1m-10m
>10m
Hig
h-Te
ch G
ründ
erfo
nds
Axel
Spr
inge
r Plu
g an
d Pl
ay A
ccel
erat
or
Poin
t Nin
e Ca
pita
l
Targ
et P
artn
ers
Iris
Cap
ital M
mgt
.
Hig
h-Te
ch G
ründ
erfo
nds
Hol
tzbr
inck
Ven
ture
s
Hig
hlan
d Ca
pita
l Par
tner
s Eur
ope
Cava
lry
Vent
ures
Star
tupb
ootc
amp
Inno
vatio
nsst
arte
r Ham
burg
ProS
iebe
nSat
.1 A
ccel
erat
or
Targ
et P
artn
ers
Iris
Cap
ital M
mgt
.
Capn
amic
Ven
ture
s
Hig
hlan
d Ca
pita
l Par
tner
s Eur
ope
Roc
ket I
nter
net
Wel
lingt
on P
artn
ers
Hig
h-Te
ch G
ründ
erfo
nds
Inno
vatio
nsst
arte
r Ham
burg
Busi
ness
Ang
els S
tutt
gart
Reg
ion
Hig
h-Te
ch G
ründ
erfo
nds
Pepp
erm
int V
entu
re P
artn
ers
BioM
Wel
lingt
on P
artn
ers
BioM
edPa
rtne
rs
Life
Sci
ence
s Par
tner
s
Foun
der.o
rg
Euro
pean
Pio
neer
s
Star
tupb
ootc
amp
IBB
SHS
NEO
Inve
stm
ent
Hig
h-Te
ch G
ründ
erfo
nds
Wel
lingt
on P
artn
ers
Rob
ert B
osch
Ven
ture
Cap
ital
Star
tupb
ootc
amp
Hig
h-Te
ch G
ründ
erfo
nds
Foun
der.o
rg
Mun
ich
Vent
ure
IBB
eCAP
ITAL
ent
repr
eneu
rial
Par
tner
s
Wel
lingt
on P
artn
ers
Hig
h-Te
ch G
ründ
erfo
nds
Inno
gy V
entu
re C
apita
l
Hig
h-Te
ch G
ründ
erfo
nds
Kim
a Ve
ntur
es
IBB
Teng
elm
ann
Vent
ures
Kim
a Ve
ntur
es
IBB
Wel
lingt
on P
artn
ers
Poin
t Nin
e Ca
pita
l
Cipi
o Pa
rtne
rs
Poin
t Nin
e Ca
pita
l
Hig
h-Te
ch
Inno
vatio
nsst
arte
r
Red
alpi
ne V
entu
re
Hol
tzbr
inck
Ven
ture
s
Earl
ybir
d Ve
ntur
e Ca
pita
l
Hol
tzbr
inck
Ven
ture
s In
dex
Vent
ures
Phen
omen
Ven
ture
s
Targ
et P
artn
ers
Plug
& P
lay
Axel
Spr
inge
r Ven
ture
Hig
h-Te
ch G
ründ
erfo
nds
LBBW
Ven
ture
Cap
ital
Hol
tzbr
inck
Ven
ture
s
ABR
Y Pa
rtne
rs
ProS
iebe
nSat
.1 A
ccel
erat
or
Hig
h-Te
ch G
ründ
erfo
nds
Plug
and
Pla
y
Hig
h-Te
ch G
ründ
erfo
nds
e.ve
ntur
es
Cher
ry V
entu
res
Roc
ket I
nter
net
Hol
tzbr
inck
Ven
ture
s
Insi
ght V
entu
re P
artn
ers
Example of innovative German SMEs receiving equity in the last two years*
Early stage Later stage
Seerene Blue Yonder
Konux Navvis
Deposit Solutions Kreditech
Gestigon Adjust
Mambu Arago
Zenmate Searchmetrics
Riskmethods Webtrekk
Testbirds Facelift
Treasury Intelligence Solutions Azeti
Source: PitchBook Inc.
Most active investors in German SMEs
* Selection is based on innovativeness and interesting new use cases of the solutions and only represent a small fraction of all firms

41SME Equity Financing Atlas 2017
French equity investment market in SMEs
Degree of Foreign investors 37%
USA
Investor # deals(<EUR 10m)
Bpifrance 58
Kima Ventures 19
Alven Capital Partners 19
Audacia 16
Cap Decisif Management
15
GO Capital 14
Rhône-Alpes Création
12
xAnge Private Equity 11
Seventure Partners 11
Partech Ventures 11
Investor # deals(>EUR 10m)
Bpifrance 20
IDInvest Partners 10
CM-CIC Investissement 4
BNP Paribas Développement
4
Alven Capital Partners
4
Accel Partners 4
Ventech 3
Serena Capital 3
Omnes Capital 3
Naxicap Partners 3
Source: PitchBook Inc.
Location of ten most active investors (last two years)
1
1
1
1
2
2
2
2
33 3
3
4
4
4
4
5
5
5
5
6
6
6
6
7
7
7
7
8
8
8
8
9
9
9
9
10
10
10
10
Most active investors in French SMEs

42 PwC’s Accelerator
Slowdown in deals and volatile capital invested
Capital invested
in EUR m
Number of deals closed
331
325
241
174
163
93
55
53 54
52
SaaS Mobile E-Commerce
Manufacturing Life sciences CleanTech
Marketing Tech AdTech
Internet of Things Big Data
307 328
365
402 432
400
-
1,000
2,000
3,000
4,000
5,000
0
100
200
300
400
500
2010 2011 2012 2013 2014 2015
Ten most important industry verticals (# deals - last five years) for French SMEs Deals and capital invested (French SMEs)
Source: PitchBook Inc.

43SME Equity Financing Atlas 2017
Top three most active investors investing in French SMEs by ticket size and industry (within last two years)
Bpifr
ance
Kim
a Ve
ntur
es
AXA
Stra
tegi
c Ve
ntur
es
Pari
s Inc
ubat
eurs
Fem
mes
Bus
ines
s Ang
els
Cap
Dec
isif
GO
Cap
ital
Seve
ntur
e Pa
rtne
rs
SEB
Allia
nce
New
fund
Bpifr
ance
Auda
cia
PACA
Inve
stis
sem
ent
Scie
ntip
ole
Capi
tal
Ture
nne
Capi
tal P
arte
nair
es W
estT
ech
Vent
ures
Mic
roso
ft Ac
cele
rato
r Pa
ris I
ncub
ateu
rs
AXA
Stra
tegi
c Ve
ntur
es K
ima
Vent
ures
SOR
IDEC
Elai
a Pa
rtne
rs
PACA
Inve
stis
sem
ent
IT-T
rans
latio
n
Kim
a Ve
ntur
es
Part
ech
Vent
ures
Tech
star
s
Bpifr
ance
Alve
n Ca
pita
l Par
tner
s
Kim
a Ve
ntur
es
Bpifr
ance
Alve
n Ca
pita
l Par
tner
s
xAng
e Pr
ivat
e Eq
uity
Cap
Dec
isif
Bpifr
ance
Seve
ntur
e Pa
rtne
rs
Bpifr
ance
Emer
tec
Ges
tion
Dem
eter
Par
tner
s
Entr
epre
neur
Ven
ture
Xer
ys
GO
Cap
ital
Alve
n Ca
pita
l Par
tner
s Se
rena
Cap
ital
Truf
fle C
apita
l
Part
ech
Vent
ures
xAng
e Pr
ivat
e Eq
uity
Tekt
on V
entu
res
xAng
e Pr
ivat
e Eq
uity
SOR
IDEC
Bpifr
ance
CM-C
IC C
apita
l
Alve
n Ca
pita
l Par
tner
s
Part
ech
Vent
ures
Alve
n Ca
pita
l Par
tner
s Ac
cel P
artn
ers
Lead
Edg
e Cap
ital
IDIn
vest
Par
tner
s
Lead
Edg
e Cap
ital
Acce
l Par
tner
s
Bpifr
ance
Edm
ond
de R
oths
child
Inve
stm
ent P
artn
ers
Vers
ant V
entu
res
Bpifr
ance
Sofim
ac P
artn
ers
Robo
lutio
n Ca
pita
l
Bpifr
ance
Xery
s
Om
nes C
apita
l
Vent
ech
Seve
ntur
e Par
tner
s
Sere
na C
apita
l
Prim
e Ven
ture
s
Part
ech
Vent
ures
IDIn
vest
Par
tner
s
Bpifr
ance
Vent
ech
Deals size
SaaS Mobile Life sciences
Manu-facturing
Clean-Tech
Big Data FinTech Cyber-security
E-Commerce
0-1m
1m-10m
>10m
Source: PitchBook Inc.
Example of innovative French SMEs receiving equity in the last two years*
Early stage Later stage
Neotys PeopleDoc
CybelAngel Netatmo
Sqreen SlimPay
Ledger Intersec
Enovacom Talentsoft
Clustree Qowisio
Finalcad Actility
Netwave Augure
* Selection is based on innovativeness and interesting new use cases of the solutions and only represent a small fraction of all firms.

44 PwC’s Accelerator
Part 4

45SME Equity Financing Atlas 2017
Industry in the Spotlight
With the increase of computational power and of the quantity of data generated and stored, more and more machine learning and deep learning approaches are used to build new solutions for important business problems. The majority of these Big Data SMEs are located in the US. Many of the applications are B2B driven, and target big corporates, located in developed economies. Europe (mainly in Germany, France and the UK) has some very interesting ventures in the field of Big Data, while India and China are also on the rise.
Big Data

46 PwC’s Accelerator
• Strong annual growth in Big Data SMEs investments since 2003 (average annual growth: +37% in deals and +56% in capital invested).
• The first signs in the first half of 2016 show that these evolutions are going to continue.
• Equity investors invested EUR 5.2bn in 727 deals in Big Data SMEs in 2015.
• Pre-money valuation of Big Data SMEs is constantly above the global industry average.
• Biggest pre-money valuation premiums in 2014 (+3.2 m) compared to global industry average.
Key information
Equity investments in Big Data SMEs worldwide
20102009200820072006200520042003
20 23 45 48 57
90112
165
235
386
588
680
727
2011 2012 2013 2014 2015
1,000
2,000
3,000
4,000
5,000
6,000
500
750
250
0
Number of deals closed Capital invested in EUR bn
Significant growth of investments in “Big Data” focused SMEs

47SME Equity Financing Atlas 2017
Median pre-money valuation (Big Data vs. global average)
-
-
-
-
-
4.00
8.00
12.00
16.00
2010 2011 2012 2013 2014 2015
Med
ian
pre
-mon
ey v
alu
atio
n in
EU
R m
Big Data median Global median

48 PwC’s Accelerator
Europe
300
<5 SMEs or 0 SMEs > 100 SMEs 100-50 SMEs 49-20 SMEs 19-10 SMEs 9-5 SMEs
North America
1,010
South America
20
Africa
2
Oceania
5
Asia
121
Location of equity investor backed Big Data SMEs worldwide (last five years)

49SME Equity Financing Atlas 2017
Example of innovative Big Data SMEs receiving equity in last two years*
Asi
a an
d
Mid
dle
Eas
t Company name Activity/solution Country of originThetaRay Fraud detection analytics Israel
Wecash Credit scoring platform China
DeepGlint 3D image analytics China
Logz.io Predictive analytics solution Israel
Windward Data analytics for maritime Israel
CB4 Predictive analytics solution Israel
Eu
rop
e
Company name Activity/solution Country of originImport io Data extract solution United Kingdom
Frops Fraud prevention solution United Kingdom
Kreditech Credit scoring platform Germany
Blue Yonder Predictive analytics solution Germany
Onfido Background checking platform United Kingdom
Intersec Data analytics solution France
No
rth
A
mer
ica
Company name Activity/solution Country of originSight Machine Manufacturing analytics USA
Civitas Learning Predictive analytics platform USA
Datavisor Fraud detection analytics USA
Rapidminer Predictive analytics solution USA
DataRobot Machine learning software USA
Datameer Data analytics solution USA
* Selection is based on innovativeness and interesting new use cases of the solutions and only represent a small fraction of all firms

50 PwC’s Accelerator
Most active investors in Big Data SMEs by deal size (last two years)
Source: PitchBook Inc.
Investor # deals(0-1m)
Techstars 12
500 Startups 6
Y Combinator 5
Frost Data Capital 5
Acceleprise 5
DeamIT Ventures 4
Working Capital Accelerator
3
Start-Up Chile 3
Tim Ventures 3
Enterprise Ireland 3
Investor # deals (1-10m)
Data Collective 12
AME Cloud Ventures 12
New Enterprise Associates 9
Khosla Ventures 7
True Ventures 6
Social Starts 6
Redpoint Ventures 6
Plug and Play 6
Marado Venture Partners 6
Blumberg Capital 6
Investor # deals (>10m)
New Enterprise Associates
12
Battery Ventures 10
Accel Partners 9
Data Collective 8
Sequoia Capital 7
Redpoint Ventures 7
Intel Capital 7
General Catalyst Partners
7
Andreesseen Horowitz 7
AME Cloud Ventures 7

51SME Equity Financing Atlas 2017

52 PwC’s Accelerator
PwC’s Accelerator can help
ConnectPwC's Accelerator2, Gerhard MercatorBP 1443 L-1014 Luxembourg
www.pwcaccelerator.com
Follow us on Linkedin
For more detailed and regular updates on SMEs and SME equity financing, please visit www.pwcaccelerator.com
Laurent ProbstNetwork Global Leader,PwC’s Accelerator
[email protected]+352 49 48 48 2199
Cyrille FoillardManaging Director,PwC’s Accelerator
[email protected]+352 49 48 48 4579
For a deeper discussion on these results, please contact us.

53SME Equity Financing Atlas 2017

© 2017 PwC’s Accelerator S.à.r.l. All rights reserved.
PwC Luxembourg (www.pwc.lu) is the largest professional services firm in Luxembourg with 2,700 people employed from 58 different countries. PwC Luxembourg provides audit, tax and advisory services including management consulting, transaction, financing and regulatory advice. The firm provides advice to a wide variety of clients from local and middle market entrepreneurs to large multinational companies operating from Luxembourg and the Greater Region. The firm helps its clients create the value they are looking for by contributing to the smooth operation of the capital markets and providing advice through an industry-focused approach.
The PwC global network is the largest provider of professional services in the audit, tax and management consultancy sectors. We’re a network of independent firms based in 157 countries and employing over 223,000 people. Talk to us about your concerns and find out more by visiting us at www.pwc.com and www.pwc.lu.
PwC’s Accelerator
PwC’s Accelerator is a PwC initiative aimed at assisting fast growing technology companies go global faster and smarter, through tailored services and a privileged access to the PwC network of member firms of PricewaterhouseCoopers International Limited (each of which is a separate legal entity) and to global ecosystem of partners, investors and clients.
www.pwcaccelerator.com