Embed Size (px)
Citation preview
SMEs and Public Equity Financing: A New Dataset of SME
Boards in Emerging-Market and Developing Economies
JohnSchellhaseandJimWoodsome
August2017
IntroductionInrecentyears,anumberofstockexchangesinemerging-marketanddevelopingeconomieshave
establisheddedicatedmarketsegmentsforsmallandmedium-sizedenterprises(SMEs).Themain
purposeoftheseSMEboards,astheyareoftencalled,istoexpandaccesstoequityfinancefor
relativelysmallbutgrowingfirmswiththepotential,asagroup,tosignificantlycontributetoeconomic
growthandemployment.Insomecases,SMEboardsalsoserveasfeederexchanges,incubatingfirms
forlatergraduationtoastockexchange’smainboard.Today,therearound30dedicatedSMEboardsin
emerging-marketanddevelopingeconomies,themajorityofwhichhavebeenestablishedinthelast
decadeorso.
Duetotherolethesefirmscanplayincreatingjobsanddiversifyingeconomies,improvingaccessto
financeforSMEsisalong-standingpolicygoalindevelopedanddevelopingcountriesalike.Asbanks
havecurbedtheirlendingtoSMEsinthewakeoftheglobalfinancialcrisis,policymakersandindustry
bodiesarenowincreasinglyemphasizingnon-bankfinancingalternativesforSMEs.Publicequity
financingisoneoptionthatmaybesuitableforfast-growingSMEswiththecapacitytomeetthelisting
requirements.SMEboardsmaycontributetoexpandingfinancialaccessforSMEsbothdirectly,by
facilitatingaccesstopublicequityfinancing,andindirectly,byincentivizinglistingfirmstoimprovetheir
financialreportingandcorporategovernancepractices,whichmay,inturn,makethemmoreappealing
tocredit-basedlenders.
WhatfollowsisabriefstocktakingofSMEboardsinemerging-marketanddevelopingcountries.The
analysisisbasedonauniquedatasetcreatedjointlybytheMilkenInstituteCenterforFinancialMarkets
andtheWorldFederationofExchanges.Thedatasetcovers26SMEboardsovertheperiod2002-2015.
2
Asfarasweknow,thiswillbethefirsttimethiskindoftime-series,compositedatasetonmultiple
indicatorsforSMEboardshasbeenpublished.Below,weexaminewhethertheseSMEboardshave
managedtomaintainorgrowtheirlistingsovertime,howmuchcapitallistedfirmshaveraised,and
howcommonitisforfirmstodelist.Additionally,weofferaninitialassessmentofhowwellthese
boardshaveperformedasincubatorsforgraduatingfirmstoseniormarkets.Weexpectthatthedata
presentedintheappendixattheendofthispaperwillbeofinterestandofusetopolicymakersand
researcherswhowanttofurtherinvestigateandevaluatetheroleofSMEboardsinexpandingaccessto
capital.
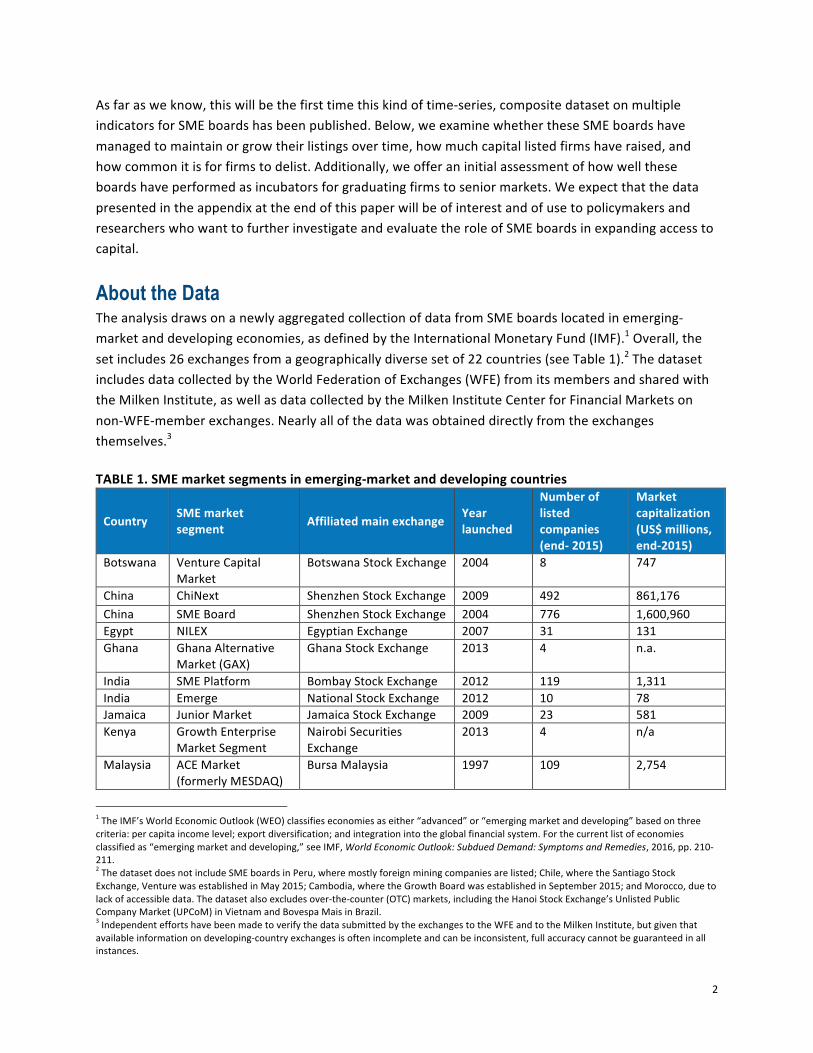
About the DataTheanalysisdrawsonanewlyaggregatedcollectionofdatafromSMEboardslocatedinemerging-
marketanddevelopingeconomies,asdefinedbytheInternationalMonetaryFund(IMF).1Overall,the
setincludes26exchangesfromageographicallydiversesetof22countries(seeTable1).2Thedataset
includesdatacollectedbytheWorldFederationofExchanges(WFE)fromitsmembersandsharedwith
theMilkenInstitute,aswellasdatacollectedbytheMilkenInstituteCenterforFinancialMarketson
non-WFE-memberexchanges.Nearlyallofthedatawasobtaineddirectlyfromtheexchanges
themselves.3
TABLE1.SMEmarketsegmentsinemerging-marketanddevelopingcountries
Country SMEmarketsegment Affiliatedmainexchange Year
launched
Numberoflistedcompanies(end-2015)
Marketcapitalization(US$millions,end-2015)
Botswana VentureCapital
Market
BotswanaStockExchange 2004 8 747
China ChiNext ShenzhenStockExchange 2009 492 861,176
China SMEBoard ShenzhenStockExchange 2004 776 1,600,960
Egypt NILEX EgyptianExchange 2007 31 131
Ghana GhanaAlternative
Market(GAX)
GhanaStockExchange 2013 4 n.a.
India SMEPlatform BombayStockExchange 2012 119 1,311
India Emerge NationalStockExchange 2012 10 78
Jamaica JuniorMarket JamaicaStockExchange 2009 23 581
Kenya GrowthEnterprise
MarketSegment
NairobiSecurities
Exchange
2013 4 n/a
Malaysia ACEMarket
(formerlyMESDAQ)
BursaMalaysia 1997 109 2,754
1TheIMF’sWorldEconomicOutlook(WEO)classifieseconomiesaseither“advanced”or“emergingmarketanddeveloping”basedonthree
criteria:percapitaincomelevel;exportdiversification;andintegrationintotheglobalfinancialsystem.Forthecurrentlistofeconomies
classifiedas“emergingmarketanddeveloping,”seeIMF,WorldEconomicOutlook:SubduedDemand:SymptomsandRemedies,2016,pp.210-211.2ThedatasetdoesnotincludeSMEboardsinPeru,wheremostlyforeignminingcompaniesarelisted;Chile,wheretheSantiagoStock
Exchange,VenturewasestablishedinMay2015;Cambodia,wheretheGrowthBoardwasestablishedinSeptember2015;andMorocco,dueto
lackofaccessibledata.Thedatasetalsoexcludesover-the-counter(OTC)markets,includingtheHanoiStockExchange’sUnlistedPublic
CompanyMarket(UPCoM)inVietnamandBovespaMaisinBrazil.3IndependenteffortshavebeenmadetoverifythedatasubmittedbytheexchangestotheWFEandtotheMilkenInstitute,butgiventhat
availableinformationondeveloping-countryexchangesisoftenincompleteandcanbeinconsistent,fullaccuracycannotbeguaranteedinall
instances.
3
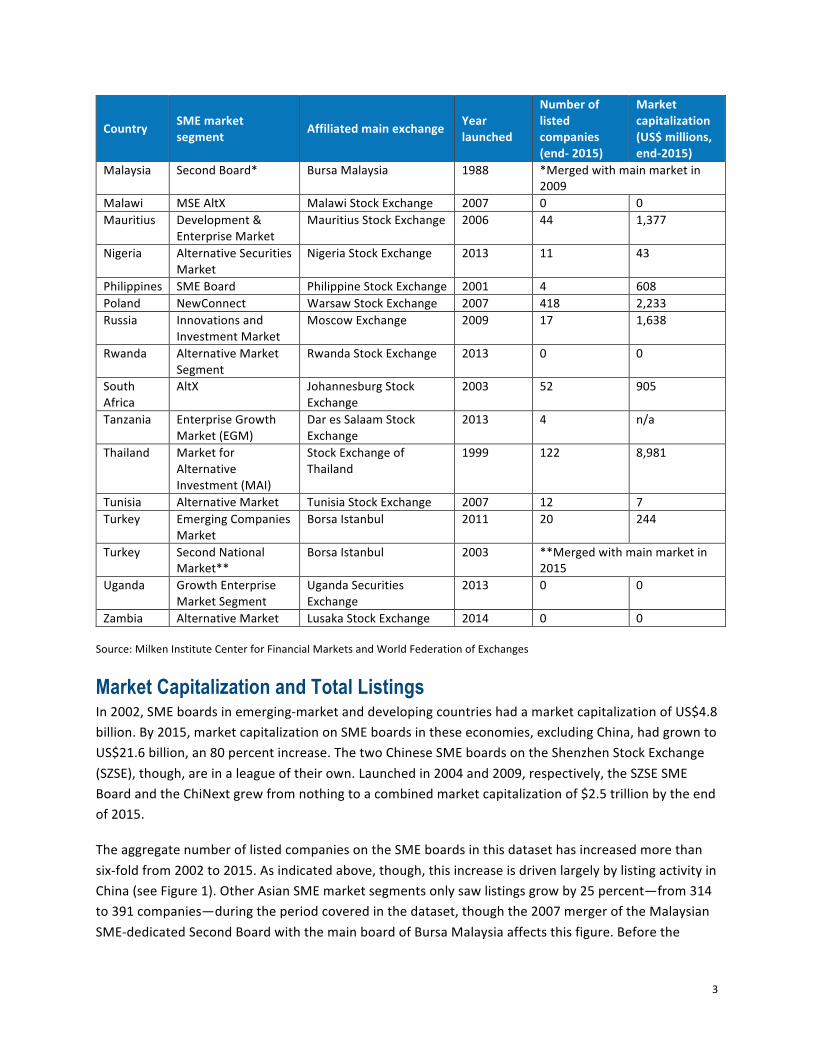
Country SMEmarketsegment Affiliatedmainexchange Year
launched
Numberoflistedcompanies(end-2015)
Marketcapitalization(US$millions,end-2015)
Malaysia SecondBoard* BursaMalaysia 1988
*Mergedwithmainmarketin
2009
Malawi MSEAltX MalawiStockExchange 2007 0 0
Mauritius Development&
EnterpriseMarket
MauritiusStockExchange 2006 44 1,377
Nigeria AlternativeSecurities
Market
NigeriaStockExchange 2013 11 43
Philippines SMEBoard PhilippineStockExchange 2001 4 608
Poland NewConnect WarsawStockExchange 2007 418 2,233
Russia Innovationsand
InvestmentMarket
MoscowExchange 2009 17 1,638
Rwanda AlternativeMarket
Segment
RwandaStockExchange 2013 0 0
South
Africa
AltX JohannesburgStock
Exchange
2003 52 905
Tanzania EnterpriseGrowth
Market(EGM)
DaresSalaamStock
Exchange
2013 4 n/a
Thailand Marketfor
Alternative
Investment(MAI)
StockExchangeof
Thailand
1999 122 8,981
Tunisia AlternativeMarket TunisiaStockExchange 2007 12 7
Turkey EmergingCompanies
Market
BorsaIstanbul 2011 20 244
Turkey SecondNational
Market**
BorsaIstanbul 2003
**Mergedwithmainmarketin
2015
Uganda GrowthEnterprise
MarketSegment
UgandaSecurities
Exchange
2013 0 0
Zambia AlternativeMarket LusakaStockExchange 2014 0 0
Source:MilkenInstituteCenterforFinancialMarketsandWorldFederationofExchanges
Market Capitalization and Total ListingsIn2002,SMEboardsinemerging-marketanddevelopingcountrieshadamarketcapitalizationofUS$4.8
billion.By2015,marketcapitalizationonSMEboardsintheseeconomies,excludingChina,hadgrownto
US$21.6billion,an80percentincrease.ThetwoChineseSMEboardsontheShenzhenStockExchange
(SZSE),though,areinaleagueoftheirown.Launchedin2004and2009,respectively,theSZSESME
BoardandtheChiNextgrewfromnothingtoacombinedmarketcapitalizationof$2.5trillionbytheend
of2015.
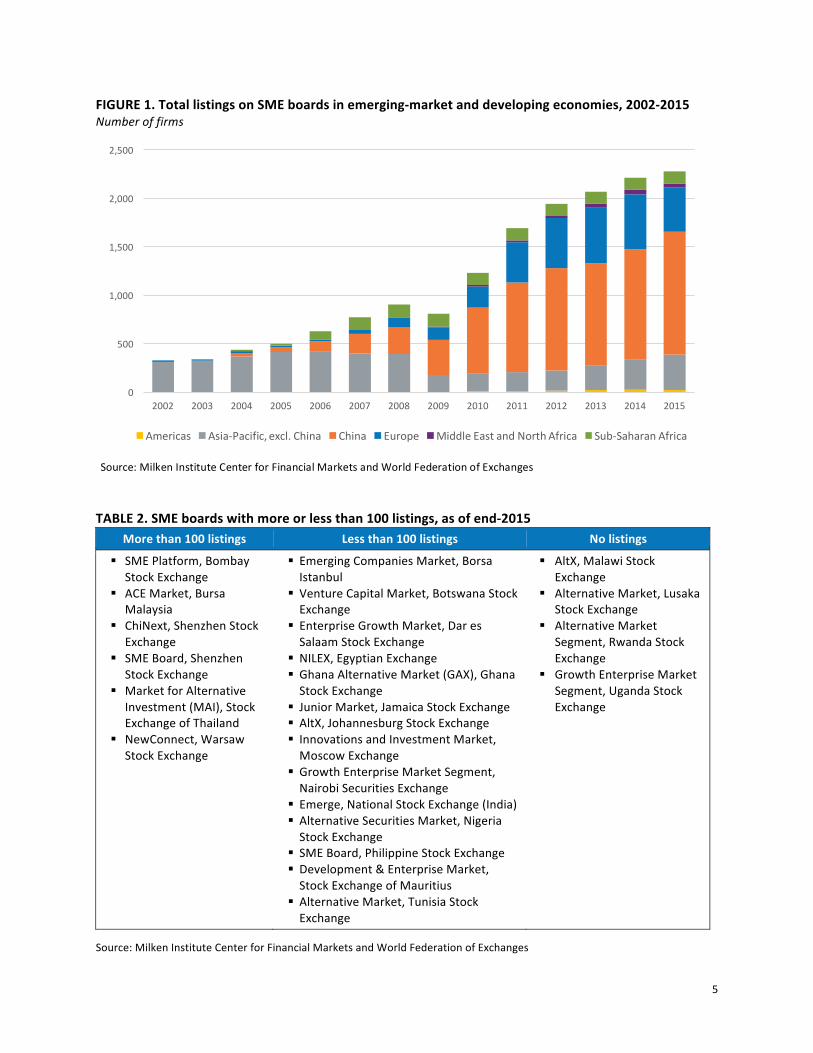
TheaggregatenumberoflistedcompaniesontheSMEboardsinthisdatasethasincreasedmorethan
six-foldfrom2002to2015.Asindicatedabove,though,thisincreaseisdrivenlargelybylistingactivityin
China(seeFigure1).OtherAsianSMEmarketsegmentsonlysawlistingsgrowby25percent—from314
to391companies—duringtheperiodcoveredinthedataset,thoughthe2007mergeroftheMalaysian
SME-dedicatedSecondBoardwiththemainboardofBursaMalaysiaaffectsthisfigure.Beforethe
4
launchoftheAltXinSouthAfricain2003,therewerenoSMEboardsinSub-SaharanAfrica.Bytheend
of2015,though,therewere127listingsacrosssevenactiveSMEboardsinthisregion.4
Fourexchangesinthedataset—mostofthemnewer—didnotreportasinglelistingasofend-2015.
TheseincludedtheMalawiStockExchange’sAltX(foundedin2007),theRwandaStockExchange’s
AlternativeMarketSegment(foundedin2013),theUgandaSecuritiesExchangesGrowthEnterprise
MarketSegment(foundedin2013),andtheLusakaStockExchange’sAlternativeMarket(foundedin
2014).AddressingthelackoflistingsinRwanda,theRwandaCapitalMarketsAuthoritynotedthatmost
SMEsinthecountrywerefamily-runand“arenotusedtohavingoutsidersexaminetheirbusinesses.”5
Similarly,theCEOoftheMalawiStockExchangeattributedthelackoflistings“toissuesofcontrolof
theirentities...[and]issuesofcorporategovernance.”6
Onereasonthenumberoflistedcompaniesisofinterestisthatitmaygivesomeindicationofthe
sustainabilityofanSMEboard’sbusinessmodel.Inastudyofcapital-marketfinancingforSMEsacross
developedanddevelopingcountries,Peterhoff,Romeo,andCalvey(2014)estimatedthat,basedonthe
costsofsettingupSMEplatforms,makingSMEmarketsegmentssustainablerequireshavingacritical
massof100-150listingsinplaceafterfiveyears.7Overall,onlysix—lessthanathird—oftheexamined
SMEboardsnowexceed100listings(seeTable2).However,manySMEboardsaresubsidizedbythe
mainexchange;insuchcases,itmaynotbenecessaryfortheseboardstobecomefinanciallyself-
sufficient.SMEboardsnecessarilyadopttheirbusinessmodelstosuitthelocalcontextandthe
particularSMEpopulationtheyserve,though,inmanysmallermarkets,eventhemainboardsmay
struggletoattractaregularstreamofnewlistings.
4ElevencountriesinSub-SaharanAfricahaveestablishedSMEboards,butfouroftheseboardshavenotlistedasinglecompany.5Gasore,“SMEsShyAwayfromListingontheBourse,”TheNewTimes,April17,20146Chinamulungu,“MSEUrgesSMEstoListonAltXMarket,”TheNation,September17,2016.7Peterhoff,Romeo,andCalvey,“TowardsBetterCapitalMarketsSolutionsforSMEFinancing,”OliverWyman,2014,p.6
5
FIGURE1.TotallistingsonSMEboardsinemerging-marketanddevelopingeconomies,2002-2015Numberoffirms
TABLE2.SMEboardswithmoreorlessthan100listings,asofend-2015Morethan100listings Lessthan100listings Nolistings
§ SMEPlatform,Bombay
StockExchange
§ ACEMarket,Bursa
Malaysia
§ ChiNext,ShenzhenStockExchange
§ SMEBoard,Shenzhen
StockExchange
§ MarketforAlternative
Investment(MAI),Stock
ExchangeofThailand
§ NewConnect,Warsaw
StockExchange
§ EmergingCompaniesMarket,Borsa
Istanbul
§ VentureCapitalMarket,BotswanaStock
Exchange
§ EnterpriseGrowthMarket,Dares
SalaamStockExchange
§ NILEX,EgyptianExchange§ GhanaAlternativeMarket(GAX),Ghana
StockExchange
§ JuniorMarket,JamaicaStockExchange
§ AltX,JohannesburgStockExchange§ InnovationsandInvestmentMarket,
MoscowExchange
§ GrowthEnterpriseMarketSegment,
NairobiSecuritiesExchange
§ Emerge,NationalStockExchange(India)
§ AlternativeSecuritiesMarket,Nigeria
StockExchange
§ SMEBoard,PhilippineStockExchange
§ Development&EnterpriseMarket,
StockExchangeofMauritius
§ AlternativeMarket,TunisiaStock
Exchange
§ AltX,MalawiStock
Exchange
§ AlternativeMarket,Lusaka
StockExchange
§ AlternativeMarket
Segment,RwandaStock
Exchange
§ GrowthEnterpriseMarket
Segment,UgandaStock
Exchange
Source:MilkenInstituteCenterforFinancialMarketsandWorldFederationofExchanges
0
500
1,000
1,500
2,000
2,500
2002 2003 2004 2005 2006 2007 2008 2009 2010 2011 2012 2013 2014 2015
Americas Asia-Pacific,excl.China China Europe MiddleEastandNorthAfrica Sub-SaharanAfrica
Source:MilkenInstituteCenterforFinancialMarketsandWorldFederationofExchanges
6
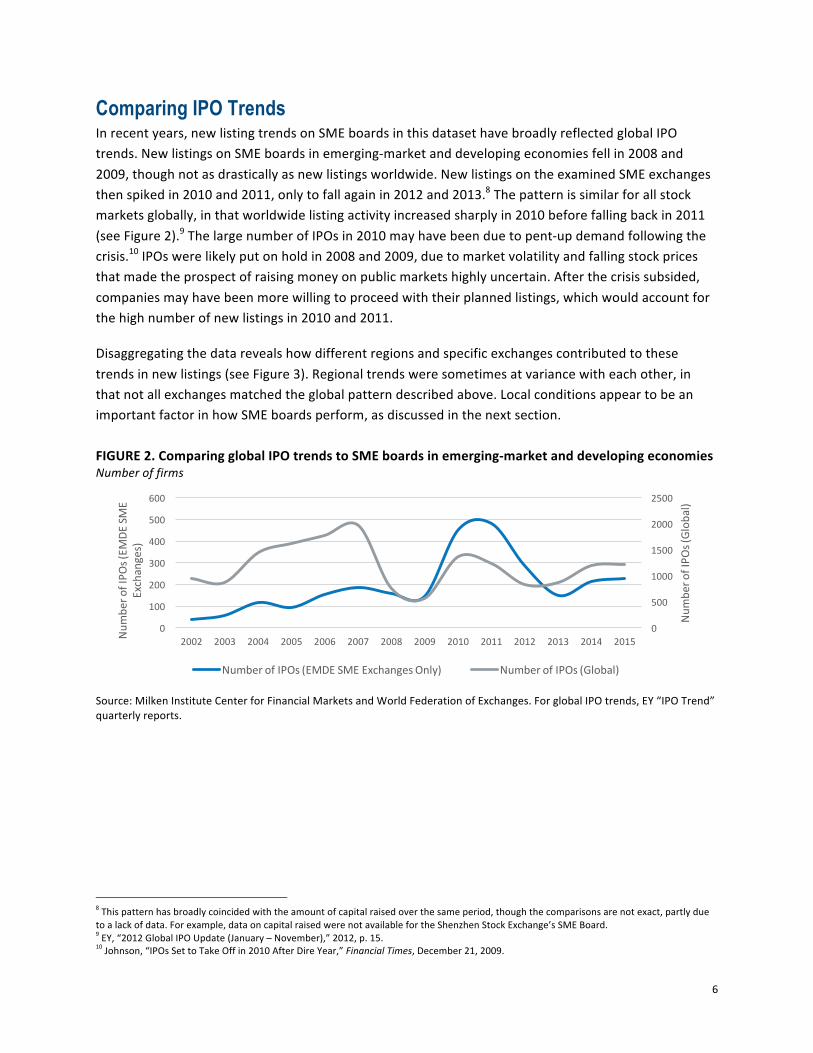
Comparing IPO TrendsInrecentyears,newlistingtrendsonSMEboardsinthisdatasethavebroadlyreflectedglobalIPO
trends.NewlistingsonSMEboardsinemerging-marketanddevelopingeconomiesfellin2008and
2009,thoughnotasdrasticallyasnewlistingsworldwide.NewlistingsontheexaminedSMEexchanges
thenspikedin2010and2011,onlytofallagainin2012and2013.8Thepatternissimilarforallstock
marketsglobally,inthatworldwidelistingactivityincreasedsharplyin2010beforefallingbackin2011
(seeFigure2).9ThelargenumberofIPOsin2010mayhavebeenduetopent-updemandfollowingthe
crisis.10IPOswerelikelyputonholdin2008and2009,duetomarketvolatilityandfallingstockprices
thatmadetheprospectofraisingmoneyonpublicmarketshighlyuncertain.Afterthecrisissubsided,
companiesmayhavebeenmorewillingtoproceedwiththeirplannedlistings,whichwouldaccountfor
thehighnumberofnewlistingsin2010and2011.
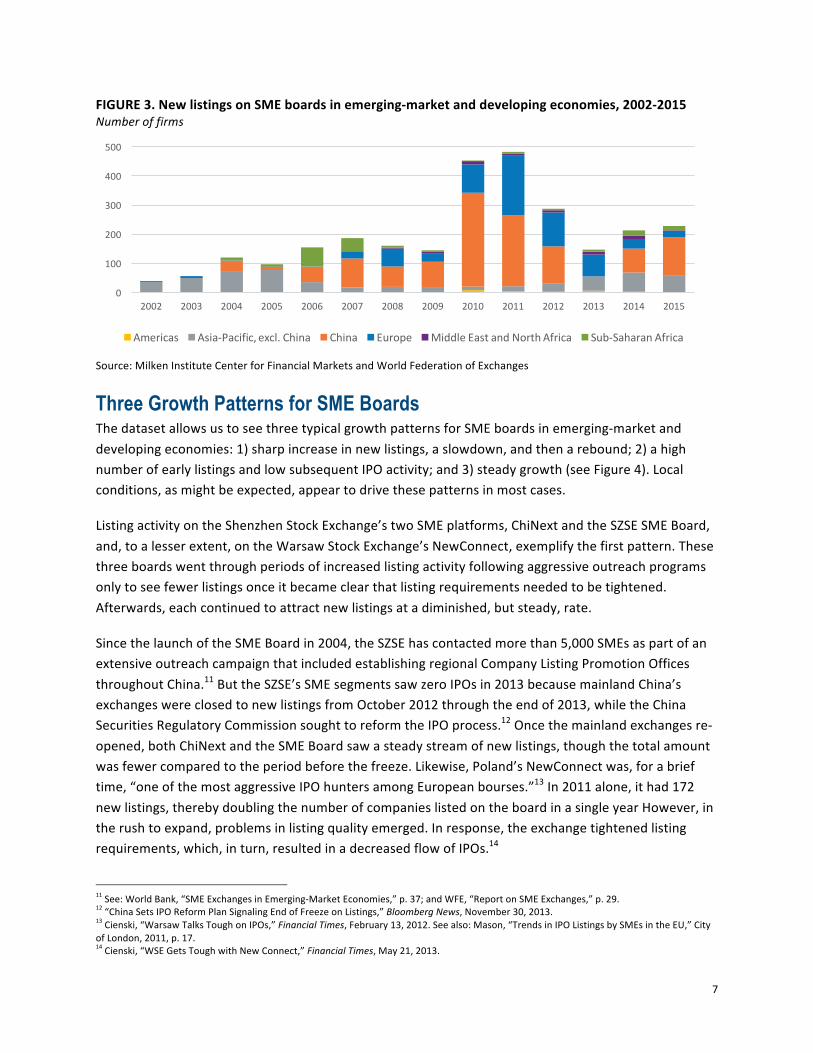
Disaggregatingthedatarevealshowdifferentregionsandspecificexchangescontributedtothese
trendsinnewlistings(seeFigure3).Regionaltrendsweresometimesatvariancewitheachother,in
thatnotallexchangesmatchedtheglobalpatterndescribedabove.Localconditionsappeartobean
importantfactorinhowSMEboardsperform,asdiscussedinthenextsection.
FIGURE2.ComparingglobalIPOtrendstoSMEboardsinemerging-marketanddevelopingeconomiesNumberoffirms
Source:MilkenInstituteCenterforFinancialMarketsandWorldFederationofExchanges.ForglobalIPOtrends,EY“IPOTrend”
quarterlyreports.
8Thispatternhasbroadlycoincidedwiththeamountofcapitalraisedoverthesameperiod,thoughthecomparisonsarenotexact,partlydue
toalackofdata.Forexample,dataoncapitalraisedwerenotavailablefortheShenzhenStockExchange’sSMEBoard.9EY,“2012GlobalIPOUpdate(January–November),”2012,p.15.10Johnson,“IPOsSettoTakeOffin2010AfterDireYear,”FinancialTimes,December21,2009.
0
500
1000
1500
2000
2500
0
100
200
300
400
500
600
2002 2003 2004 2005 2006 2007 2008 2009 2010 2011 2012 2013 2014 2015
NumberofIPOs(Global)
NumberofIPOs(EMDESME
Exchanges)
NumberofIPOs(EMDESMEExchangesOnly) NumberofIPOs(Global)
7
FIGURE3.NewlistingsonSMEboardsinemerging-marketanddevelopingeconomies,2002-2015Numberoffirms
Source:MilkenInstituteCenterforFinancialMarketsandWorldFederationofExchanges
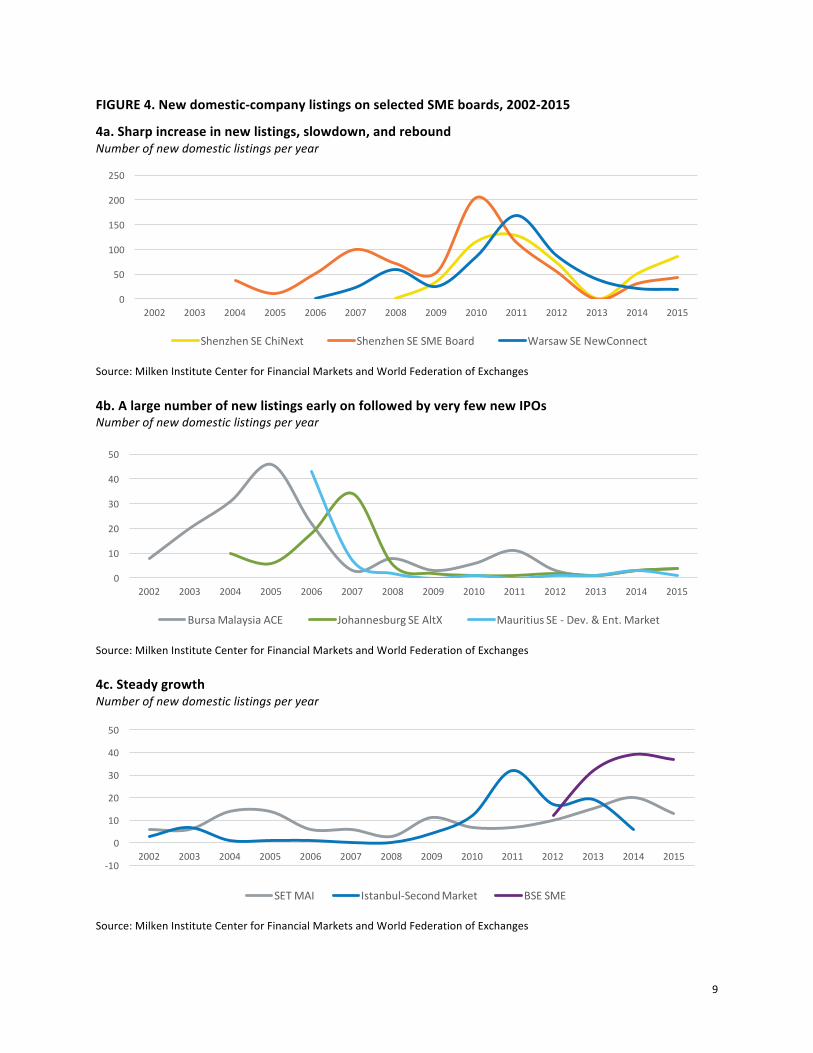
Three Growth Patterns for SME BoardsThedatasetallowsustoseethreetypicalgrowthpatternsforSMEboardsinemerging-marketand
developingeconomies:1)sharpincreaseinnewlistings,aslowdown,andthenarebound;2)ahigh
numberofearlylistingsandlowsubsequentIPOactivity;and3)steadygrowth(seeFigure4).Local
conditions,asmightbeexpected,appeartodrivethesepatternsinmostcases.
ListingactivityontheShenzhenStockExchange’stwoSMEplatforms,ChiNextandtheSZSESMEBoard,
and,toalesserextent,ontheWarsawStockExchange’sNewConnect,exemplifythefirstpattern.These
threeboardswentthroughperiodsofincreasedlistingactivityfollowingaggressiveoutreachprograms
onlytoseefewerlistingsonceitbecameclearthatlistingrequirementsneededtobetightened.
Afterwards,eachcontinuedtoattractnewlistingsatadiminished,butsteady,rate.
SincethelaunchoftheSMEBoardin2004,theSZSEhascontactedmorethan5,000SMEsaspartofan
extensiveoutreachcampaignthatincludedestablishingregionalCompanyListingPromotionOffices
throughoutChina.11ButtheSZSE’sSMEsegmentssawzeroIPOsin2013becausemainlandChina’s
exchangeswereclosedtonewlistingsfromOctober2012throughtheendof2013,whiletheChina
SecuritiesRegulatoryCommissionsoughttoreformtheIPOprocess.12Oncethemainlandexchangesre-
opened,bothChiNextandtheSMEBoardsawasteadystreamofnewlistings,thoughthetotalamount
wasfewercomparedtotheperiodbeforethefreeze.Likewise,Poland’sNewConnectwas,forabrief
time,“oneofthemostaggressiveIPOhuntersamongEuropeanbourses.”13In2011alone,ithad172
newlistings,therebydoublingthenumberofcompanieslistedontheboardinasingleyearHowever,in
therushtoexpand,problemsinlistingqualityemerged.Inresponse,theexchangetightenedlisting
requirements,which,inturn,resultedinadecreasedflowofIPOs.14
11See:WorldBank,“SMEExchangesinEmerging-MarketEconomies,”p.37;andWFE,“ReportonSMEExchanges,”p.29.
12“ChinaSetsIPOReformPlanSignalingEndofFreezeonListings,”BloombergNews,November30,2013.
13Cienski,“WarsawTalksToughonIPOs,”FinancialTimes,February13,2012.Seealso:Mason,“TrendsinIPOListingsbySMEsintheEU,”City
ofLondon,2011,p.17.14Cienski,“WSEGetsToughwithNewConnect,”FinancialTimes,May21,2013.
0
100
200
300
400
500
2002 2003 2004 2005 2006 2007 2008 2009 2010 2011 2012 2013 2014 2015
Americas Asia-Pacific,excl.China China Europe MiddleEastandNorthAfrica Sub-SaharanAfrica
8
IncontrasttotheexperienceoftheShenzhenandWarsawexchanges,anumberofboardsfolloweda
secondpattern:alargenumberoflistingsimmediatelyafterlaunching,followedbydwindlingnumbers
ofnewlistingsovertime.SMEboardsthatfallintothiscategoryincludeBursaMalaysia’sACEmarket
(previouslycalledtheMESDAQ),theJohannesburgStockExchange’sAltX,andtheMauritiusStock
Exchange’sDevelopmentandEnterpriseMarket.Malaysia’sACEMarketsawasharpincreaseinnew
listingsfollowingacorporatemergerwithBursaMalaysiain2002,15butafterwardsthenumberofIPOs
trailedoff.TheJSEAltXsawasteadynumberofnewlistingsduringitsfirstfouryearsofbusiness,but
newlistingscametoasuddenhaltduringtheglobalfinancialcrisis.Delistingsfollowed.Market
capitalizationontheAltXalsopeakedin2007andhasnotrecoveredsince.Evenifthisplateauisdueto
thesteadynumberofgraduationsthatAltXhasfacilitated,asdiscussedbelow,theexchangedoesnot
appeartobeattractingnewSMEstojointheboard.InMauritius,thecreationoftheDevelopmentand
EnterpriseMarketin2006ledtothetransferofcompaniespreviouslylistedontheprivateover-the-
counter(OTC)market.Fewfirmshavelistedsincethen.
Finally,inathirdpattern,afewexchanges,suchastheMAIinThailand,wereabletoachievesteadyor
acceleratedgrowth.TheMAI,interestingly,usedattractivecorporatetaxincentivesforlistingfirmsto
buildupacriticalmassofcompaniesearlyon.16AftertheSMEboardhadestablisheditselfasavenue
forsuccessfulSMEcapitalraises,newcompaniescontinuedtojoin.17TheSecondNationalMarketin
TurkeyfollowedasimilargrowthpatternbeforeeventuallymergingwithBorsaIstanbul’smainboardin
mid-2014.InIndia,theBSESMEPlatformhasalsoperformedstrikinglywellinitsearlyyears,attractinga
steadyflowofnewlistings.Inthisregard,theSMEPlatformbenefitsfromavibrantenvironmentof
intermediariesfinanciallyincentivizedtobringnewcompaniestotheexchange,alargetarget
populationofSMEswithhigh-growthpotential,andavarietyofgovernmentinitiativesaimedat
expandingSMEaccesstofinance.
15WhiletheACEMarketmaintaineditsownlistingstandardsandadistinctbranding,thelegalandcorporatelinkageswiththemainmarket
gavetheSMEboardsaccesstoawidernetworkofbrokersandinvestors,aswellastogreaterfinancialandinstitutionalsupportforfurther
development.16From2001to2009,firmslistingonMAIsawtheircorporateincometaxrateloweredfrom30percentto20percentforasetperiodofyears
followingtheirIPO.17ManagementteamattheStockExchangeofThailand,incorrespondencewiththeMilkenInstitute.
9
FIGURE4.Newdomestic-companylistingsonselectedSMEboards,2002-2015
4a.Sharpincreaseinnewlistings,slowdown,andreboundNumberofnewdomesticlistingsperyear
Source:MilkenInstituteCenterforFinancialMarketsandWorldFederationofExchanges4b.AlargenumberofnewlistingsearlyonfollowedbyveryfewnewIPOsNumberofnewdomesticlistingsperyear
Source:MilkenInstituteCenterforFinancialMarketsandWorldFederationofExchanges4c.SteadygrowthNumberofnewdomesticlistingsperyear
Source:MilkenInstituteCenterforFinancialMarketsandWorldFederationofExchanges
0
50
100
150
200
250
2002 2003 2004 2005 2006 2007 2008 2009 2010 2011 2012 2013 2014 2015
ShenzhenSEChiNext ShenzhenSESMEBoard WarsawSENewConnect
0
10
20
30
40
50
2002 2003 2004 2005 2006 2007 2008 2009 2010 2011 2012 2013 2014 2015
BursaMalaysiaACE JohannesburgSEAltX MauritiusSE- Dev.&Ent.Market
-10
0
10
20
30
40
50
2002 2003 2004 2005 2006 2007 2008 2009 2010 2011 2012 2013 2014 2015
SETMAI Istanbul-SecondMarket BSESME

10
Liquidity Remains a ChallengeTheabilitytotransactshareseasilyandwithoutcausingpricestoshiftisanimportantfeatureofall
successfulstockexchanges.Mostfundamentally,stockmarketsprovidereal-timeinformationonthe
valueofafirm,andthisinformationvalueisunderminedifsharesdonottrade.Second,lackofliquidity
makesitmoredifficultforinvestorstoexittheirpositions,andtherefore,moreunlikelytoinvestinthe
firstplace.Unfortunately,manystockexchangesinemerging-marketanddevelopingeconomies
strugglewithlowlevelsofliquidity,particularlythoseservingsmalleconomieswithfewpublic
companies.ManySMEboardsfaceevengreaterdifficultiesinthisregard,owingtothelownumberof
listingsandthesmallfloatsize,meaningfewsharesareavailablefortrading.
AsthedatasetcompiledbytheMilkenInstituteandtheWFEshows,liquidityremainsachallengeto
marketdevelopmentformostSMEboards.TheNASDAQintheUnitedStatesseesmorevaluetradedon
adaily–andevenhourly–basisthanmanySMEboardsdoinayear.AhandfulofthelargerSME
exchanges,mostlyinAsia,havemanagedtoachieveannualturnoverratiosofgreaterthan100percent
ofmarketcapitalization(seeFigure5).Notably,alloftheexchangesthathaveachievedtheserelatively
highturnoverratioshavemorethan100listedcompanies.Incontrast,exchangeswithveryfewlisted
companieshaveexperiencedturnoverratesof50percentorlower.Thosewiththefewestcompanies,
suchasthePhilippineStockExchange’sSMEBoard,havebarelyanyliquidityatall,withturnoverratios
oflessthan10percent.
Figure5.LiquidityonSMEboardsinemerging-marketanddevelopingeconomiesTurnoverratiosversusnumberoflistedcompanies(latestyearavailable)
Source:MilkenInstituteCenterforFinancialMarketsandWorldFederationofExchanges
DelistingsTheoccasionaldepartureoflistedcompaniesisanormaloccurrenceinstockexchangesinadvancedand
developingmarkets,ascompaniesmaydelistforanumberofreasons.First,theymaybeforcibly
delistediftheygobankruptorfailtomeetthestockexchange’slistingrequirements.Theymayalso
delistasaresultofamergeroraleveragedbuyout.
ChiNext2013
ACEMarket2015ThaiMAI2015
SHZNSMEBoard2007
IstanbulEmerging2015
MalaysiaSecondBoard2008
NILEX2015
NewConnect2014
0
100
200
300
400
500
0% 50% 100% 150% 200% 250% 300% 350%

11
AccordingtoIOSCO(2015),withfewexceptions,involuntarydelistingsweretypicallyloweronSME
boardsthanonmainboardsworldwide.18Theprecisereasonforthisdifferenceisunclear,thoughitmay
resultfromlowerlistingrequirements,lackofenforcementofthoselistingrequirements,awillingness
ofexchangesand/orintermediariestoworkwithcompaniestoavoiddelisting,orsomecombinationof
thesefactors.Thereareexceptions,ofcourse.InMalaysia,anumberoffirmsontheSecondBoard
(whichlatermergedwiththemainboard)delistedduetobankruptcyintheearly2000s.Likewise,
bankruptcyandviolationsofcompliancestandardsaccountedforabout80percentofdelistingsfrom
thePolishNewConnectboardsince2008.19InSouthAfrica,ontheotherhand,themainfactorbehind
the27AltXdelistingsbetween2008and2015wasM&Aactivity.20
Surprisingly,giventhelargenumberoffirmslistedonthesemarketsegments,theShenzhenStock
Exchange’sChiNextandSMEBoarddidnotdelistasinglefirmthrough2015.Alackofenforcementis
perhapsthemostpersuasiveexplanation.Morerecently,though,theChinaSecuritiesRegulatory
Commissionhassignaleditsintenttomorestrictlyenforcesecuritiesregulationsbyforciblydelistinga
ChiNextcompanyinAugust2016forsecuritiesfraud.21Thedegreetowhichthisnewfoundconcern
aboutlistingqualitywillpersistremainstobeseen.
GraduationsFormanySMEboards,listedfirmsareallowed,andsometimesevenencouraged,tograduatetothe
stockexchange’smainboardoncetheyreachcertaincriteria.Graduationsareoftenconsidereda
markerofsuccessfortheseSMEboards.Thisistrueinanarrowsenseforboardsthatweredesignedto
feednewlistingstotheirseniorboardaspartofthestockexchange’sbusinessmodel.Itisalsotrueina
broadersense,asitvalidatestheroleofSMEboardsasincubatorsofcompaniesthatmightnothave
otherwisereceivedthefinancingneededtorealizetheirgrowthpotential.22
CriteriaforgraduationmayincludetimespentlistedontheSMEboard,aswellastheattainmentof
specifiedthresholdsforprofitability,size,ornumberofshareholders.23Beyondencouragementor
compulsionfromtheexchange,firmslistedonanSMEboardmaychoosetograduateforanumberof
reasons.Accordingtorecent,survey-basedworkfromtheMilkenInstitute,commonmotivationsto
graduateincludegreaterliquidity,accesstoabroaderandmorestableinvestorbase,andanenhanced
reputation,asfirmsoftenbelievealistingontheseniorboardwillleadtogreatervisibilityanda
strongerbrand.
Graduationdataarenotcollectedsystematicallyforallemerging-marketanddevelopingcountry
exchanges,soacomprehensiveviewofgraduationtrendsisnotyetavailable.Thatsaid,ahandfulof
18ISOCO,“SMEFinancingthroughCapitalMarkets,”2015,p.39.
19NewConnectReport2015,WarsawStockExchange;calculationsbyMilkenInstitutestaff.
20JSEstaff,incorrespondencewiththeMilkenInstitute.
21“China’sFirstSmall-CapStockDelistingSpursSpeculativeFrenzy,”BloombergNews,August4,2016.
22Mostboardsallowforgraduation,thoughnotall.Importantly,China’sShenzhenStockExchangedoesnothaveaprocessforcompaniesto
graduatefromChiNextortheSMEBoardtothemainboard.Thismaychange,though.23AfewverySMEboardsallowfirmstomigratedownfromthemainboardtotheSMEboard.Thepurposebehindsuchmigrationistoallow
thefirmtoremainlistedatalowercostand,perhaps,therebytoavoiddelistingorfirmclosure.Theonlydownwardmigrations(“demotions”?)
ofthissortintheWFE-MilkenInstitutedatasethaveoccurredontheStockExchangeofThailand,wheresixfirmshavemoveddownfromthe
seniorboardtotheMAI.

12
boardshaveseensignificantgraduationactivity.TheWarsawStockExchange’sNewConnect,for
example,reported38graduationsfrom2011to2015.AnotheristheJSEAltX,whichreported17
graduationsoverthesameperiod,and31sinceitsinception(seeFigure6).AltXgraduatesrepresent
about10percentofalllistingsontheJSE’smainboard,asignificantnumberandasignthatSME
segmentscanserveaseffectiveincubators.Likewise,theStockExchangeofThailand’sMAIhas
facilitated15graduationsfromitsinceptionin2007to2015,earningareputationas“apreparatory
venueforSMEstotaptheregularmarketofthestockexchange.”24
Manynewerexchangeshaveseenonlyahandful—ifany—graduations.Theformerincludesthe
MauritiusStockExchange’sDevelopmentandEnterpriseMarket(1graduationin2014)andthe
PhilippineStockExchange’sSMEBoard(3since2003).Meanwhile,severalnewboardsthatencourage
graduationbuthavenotfacilitatedanyto-datearelikelytodosointhefutureastheymature.Thisis
especiallytrueofJamaica’sJuniorMarket,aswellastheBSESMEplatformandtheNSEEmergein
India—allofwhichrequiregraduationoncecompaniesmeetcertaincriteria.TheJamaicaStock
Exchange’sJuniorMarket,forexample,requiresgraduationafterlistedSMEscompletetwotiers,each
ofwhichlastsfiveyears.TheNSEEmergesegmentrequiresgraduationtothemainboardoncea
company’sequitycapitalreaches$400million.25
FIGURE6.AnnualgraduationsfromSMEboardstoseniorboardsinPoland,SouthAfrica,andThailandNumberoffirms
Source:MilkenInstituteCenterforFinancialMarketsandWorldFederationofExchanges
ConclusionPublicequityfinancingisnotasolutionforall,orevenmost,SMEs,butitmaybeappropriatefora
certainsubsetofSMEswithspecificcharacteristics—namely,SMEsthatareyoung,havestronggrowth
prospects,andlimitedcollateral.26SuchSMEsaretheminority,buttheymakeadisproportionate
contributiontoemploymentandproductivitygrowth;indevelopingcountries,theyrepresentan
estimated16percentofSMEsbutaccountfor38percentofnetjobcreation.27Therefore,evenifpublic
24ADB,AsiaSMEFinanceMonitor2014,p.231
25WorldBank,“SMEExchangesinEmerging-MarketEconomies,”p.17.
26OECD,“OpportunitiesandConstraintsofMarket-BasedFinancingforSMEs,”2015,p.12.
27IFC,“SmallandMediumEnterpriseFinance:NewFindings,Trends,andG-20/GlobalPartnershipforFinancialInclusionProgress,”2013,p.7.
0
2
4
6
8
10
12
14
2005 2006 2007 2008 2009 2010 2011 2012 2013 2014 2015
WarsawSENewConnect JSEAltX SETMAI
13
equityfinancingdoesnotrepresentabroadsolutiontotheSMEfinancinggap,SMEboardscan
potentiallymakeanoutsizedcontributiontoeconomicgrowthandemployment.
ToadvancethecurrentunderstandingofwhetherSMEboardscanexpandaccesstofinancein
emerging-marketanddevelopingcountries,theMilkenInstitute,inpartnershipwiththeWorld
FederationofExchanges,collectedandorganizeddataforavarietyofindicatorsfor26SMEboards
acrossanumberofcountries.Thisdatasethasallowedustoconductaninitialstocktakingofmarket
activityontheseboardsduringtheperiodof2002to2015,atimeperiodthatincludestheglobal
financialcrisisandtheestablishmentofanumberofnewSME-dedicatedmarketsegments.
Overall,thisinitialreviewofavailabledatashowsthatovertwo-thousandcompaniesinemerging-
marketanddevelopingeconomieshaveturnedtoSMEboardsforfinancingoverthepastdecade,witha
peakofactivityoccurringaround2010-2011,intheimmediateaftermathoftheglobalfinancialcrisis.
Totallistingsontheexaminedexchangeshaveincreasedsteadilysince2002,thoughthetrackrecordsof
individualexchangeshavevarieddramatically.Someexchangeshaveseenasteadyincreaseinnew
listings,whileothersexperiencedaninitialburstofactivityfollowedbyverylowsubsequentIPOactivity.
Delistingsdataaremorefragmentary,buttheavailabledatashowthatheightenedperiodsofdelistings
aremoreoftenassociatedwithatighteningoflisteningrequirementsbytheexchangesthemselves,as
wasthecase,forinstance,forPoland’sNewConnect.Finally,whilegraduationdataarealsoincomplete,
theavailabledatasuggestthatatleastforolder,moreestablishedSMEboardsinmiddle-income
countries—suchasPoland,SouthAfrica,andThailand—suchboardshaveindeedservedasincubators
forfirmstoeventuallylistonthemainboardsoftheirexchanges.
Earlyevidence,though,alsounderlinestherealitythatestablishinganSMEexchangedoesnot
guaranteenewmarketactivity.Thoughsomeexchangeshavedonewell,othershavefloundered.
Policymakersmustconsidertheopportunitycostsofthepoliticalandfinancialcapitalrequiredto
establishanSMEboardandthesubsequentworkrequiredtoattractlistingsandincubatecompaniesfor
graduation.ThequestionofwhetheritiseconomicallyrationaltoestablishandthensubsidizeSME-
dedicatedmarketsegmentsiftheyarenotabletobecomeself-sustainingisthereforeworthexamining
infurtherresearch.FutureresearchmayalsousefullyexplorehowtheperformanceofSMEboards
relatestolocalmacroeconomicconditions,financialsectordevelopment,industrycomposition,and
SMEs’accesstootherformsoffinance.
14
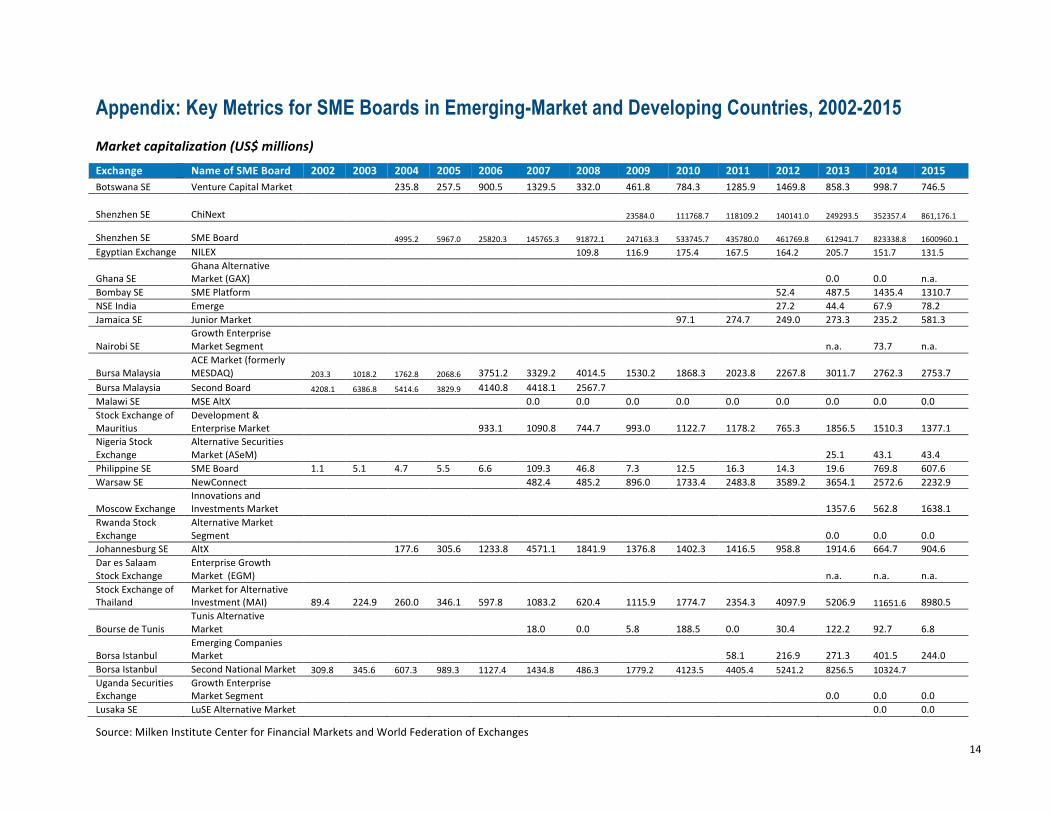
Appendix: Key Metrics for SME Boards in Emerging-Market and Developing Countries, 2002-2015 Marketcapitalization(US$millions)
Exchange NameofSMEBoard 2002 2003 2004 2005 2006 2007 2008 2009 2010 2011 2012 2013 2014 2015BotswanaSE VentureCapitalMarket 235.8 257.5 900.5 1329.5 332.0 461.8 784.3 1285.9 1469.8 858.3 998.7 746.5
ShenzhenSE ChiNext 23584.0 111768.7 118109.2 140141.0 249293.5 352357.4 861,176.1
ShenzhenSE SMEBoard 4995.2 5967.0 25820.3 145765.3 91872.1 247163.3 533745.7 435780.0 461769.8 612941.7 823338.8 1600960.1EgyptianExchange NILEX 109.8 116.9 175.4 167.5 164.2 205.7 151.7 131.5
GhanaSEGhanaAlternativeMarket(GAX) 0.0 0.0 n.a.
BombaySE SMEPlatform 52.4 487.5 1435.4 1310.7NSEIndia Emerge 27.2 44.4 67.9 78.2JamaicaSE JuniorMarket 97.1 274.7 249.0 273.3 235.2 581.3
NairobiSEGrowthEnterpriseMarketSegment n.a. 73.7 n.a.
BursaMalaysiaACEMarket(formerlyMESDAQ) 203.3 1018.2 1762.8 2068.6 3751.2 3329.2 4014.5 1530.2 1868.3 2023.8 2267.8 3011.7 2762.3 2753.7
BursaMalaysia SecondBoard 4208.1 6386.8 5414.6 3829.9 4140.8 4418.1 2567.7 MalawiSE MSEAltX 0.0 0.0 0.0 0.0 0.0 0.0 0.0 0.0 0.0StockExchangeofMauritius
Development&EnterpriseMarket 933.1 1090.8 744.7 993.0 1122.7 1178.2 765.3 1856.5 1510.3 1377.1
NigeriaStockExchange
AlternativeSecuritiesMarket(ASeM) 25.1 43.1 43.4
PhilippineSE SMEBoard 1.1 5.1 4.7 5.5 6.6 109.3 46.8 7.3 12.5 16.3 14.3 19.6 769.8 607.6WarsawSE NewConnect 482.4 485.2 896.0 1733.4 2483.8 3589.2 3654.1 2572.6 2232.9
MoscowExchangeInnovationsandInvestmentsMarket 1357.6 562.8 1638.1
RwandaStockExchange
AlternativeMarketSegment 0.0 0.0 0.0
JohannesburgSE AltX 177.6 305.6 1233.8 4571.1 1841.9 1376.8 1402.3 1416.5 958.8 1914.6 664.7 904.6DaresSalaamStockExchange
EnterpriseGrowthMarket(EGM) n.a. n.a. n.a.
StockExchangeofThailand
MarketforAlternativeInvestment(MAI) 89.4 224.9 260.0 346.1 597.8 1083.2 620.4 1115.9 1774.7 2354.3 4097.9 5206.9 11651.6 8980.5
BoursedeTunisTunisAlternativeMarket 18.0 0.0 5.8 188.5 0.0 30.4 122.2 92.7 6.8
BorsaIstanbulEmergingCompaniesMarket 58.1 216.9 271.3 401.5 244.0
BorsaIstanbul SecondNationalMarket 309.8 345.6 607.3 989.3 1127.4 1434.8 486.3 1779.2 4123.5 4405.4 5241.2 8256.5 10324.7 UgandaSecuritiesExchange
GrowthEnterpriseMarketSegment 0.0 0.0 0.0
LusakaSE LuSEAlternativeMarket 0.0 0.0
Source:MilkenInstituteCenterforFinancialMarketsandWorldFederationofExchanges
15
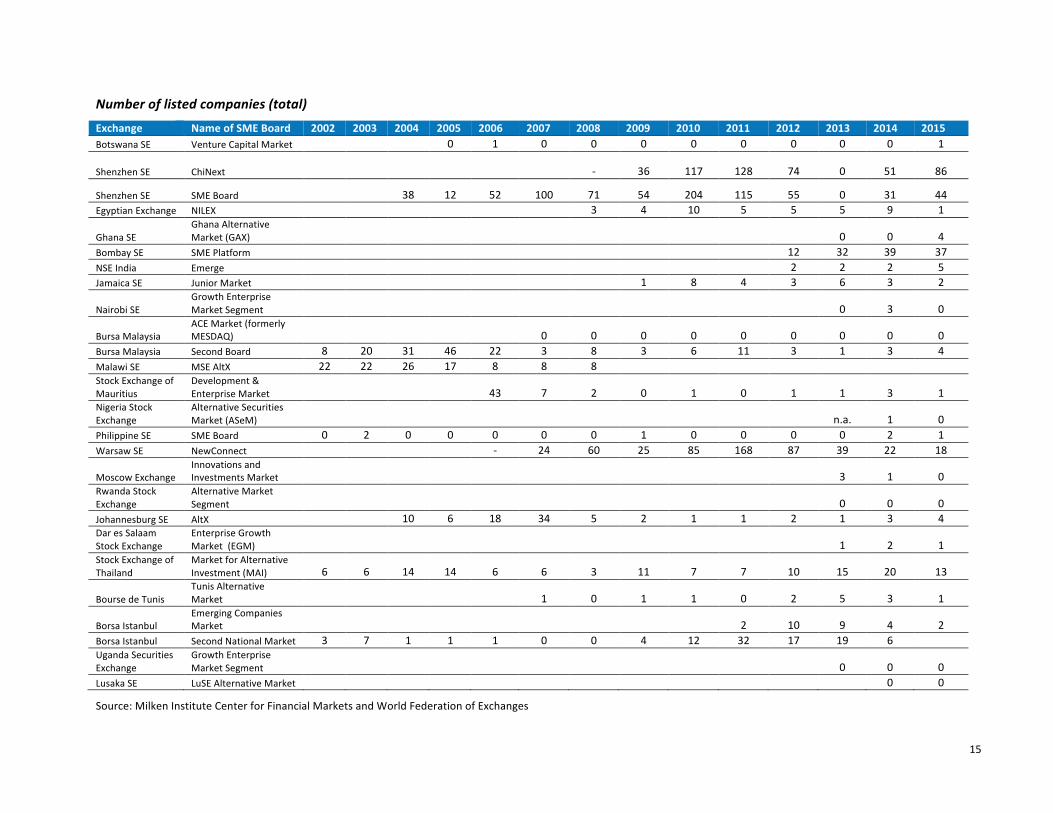
Numberoflistedcompanies(total)
Exchange NameofSMEBoard 2002 2003 2004 2005 2006 2007 2008 2009 2010 2011 2012 2013 2014 2015BotswanaSE VentureCapitalMarket 0 1 0 0 0 0 0 0 0 0 1
ShenzhenSE ChiNext - 36 117 128 74 0 51 86
ShenzhenSE SMEBoard 38 12 52 100 71 54 204 115 55 0 31 44EgyptianExchange NILEX 3 4 10 5 5 5 9 1
GhanaSEGhanaAlternativeMarket(GAX) 0 0 4
BombaySE SMEPlatform 12 32 39 37NSEIndia Emerge 2 2 2 5JamaicaSE JuniorMarket 1 8 4 3 6 3 2
NairobiSEGrowthEnterpriseMarketSegment 0 3 0
BursaMalaysiaACEMarket(formerlyMESDAQ) 0 0 0 0 0 0 0 0 0
BursaMalaysia SecondBoard 8 20 31 46 22 3 8 3 6 11 3 1 3 4MalawiSE MSEAltX 22 22 26 17 8 8 8 StockExchangeofMauritius
Development&EnterpriseMarket 43 7 2 0 1 0 1 1 3 1
NigeriaStockExchange
AlternativeSecuritiesMarket(ASeM) n.a. 1 0
PhilippineSE SMEBoard 0 2 0 0 0 0 0 1 0 0 0 0 2 1WarsawSE NewConnect - 24 60 25 85 168 87 39 22 18
MoscowExchangeInnovationsandInvestmentsMarket 3 1 0
RwandaStockExchange
AlternativeMarketSegment 0 0 0
JohannesburgSE AltX 10 6 18 34 5 2 1 1 2 1 3 4DaresSalaamStockExchange
EnterpriseGrowthMarket(EGM) 1 2 1
StockExchangeofThailand
MarketforAlternativeInvestment(MAI) 6 6 14 14 6 6 3 11 7 7 10 15 20 13
BoursedeTunisTunisAlternativeMarket 1 0 1 1 0 2 5 3 1
BorsaIstanbulEmergingCompaniesMarket 2 10 9 4 2
BorsaIstanbul SecondNationalMarket 3 7 1 1 1 0 0 4 12 32 17 19 6 UgandaSecuritiesExchange
GrowthEnterpriseMarketSegment 0 0 0
LusakaSE LuSEAlternativeMarket 0 0
Source:MilkenInstituteCenterforFinancialMarketsandWorldFederationofExchanges
16
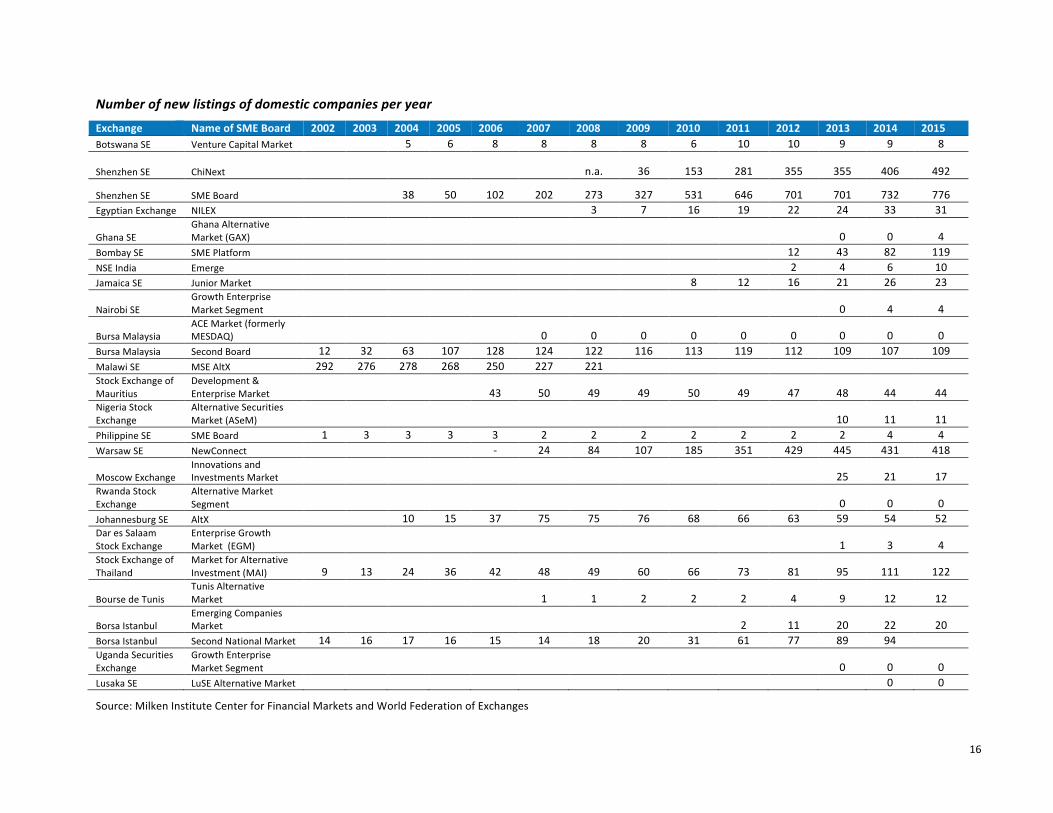
Numberofnewlistingsofdomesticcompaniesperyear
Exchange NameofSMEBoard 2002 2003 2004 2005 2006 2007 2008 2009 2010 2011 2012 2013 2014 2015BotswanaSE VentureCapitalMarket 5 6 8 8 8 8 6 10 10 9 9 8
ShenzhenSE ChiNext n.a. 36 153 281 355 355 406 492
ShenzhenSE SMEBoard 38 50 102 202 273 327 531 646 701 701 732 776EgyptianExchange NILEX 3 7 16 19 22 24 33 31
GhanaSEGhanaAlternativeMarket(GAX) 0 0 4
BombaySE SMEPlatform 12 43 82 119NSEIndia Emerge 2 4 6 10JamaicaSE JuniorMarket 8 12 16 21 26 23
NairobiSEGrowthEnterpriseMarketSegment 0 4 4
BursaMalaysiaACEMarket(formerlyMESDAQ) 0 0 0 0 0 0 0 0 0
BursaMalaysia SecondBoard 12 32 63 107 128 124 122 116 113 119 112 109 107 109MalawiSE MSEAltX 292 276 278 268 250 227 221 StockExchangeofMauritius
Development&EnterpriseMarket 43 50 49 49 50 49 47 48 44 44
NigeriaStockExchange
AlternativeSecuritiesMarket(ASeM) 10 11 11
PhilippineSE SMEBoard 1 3 3 3 3 2 2 2 2 2 2 2 4 4WarsawSE NewConnect - 24 84 107 185 351 429 445 431 418
MoscowExchangeInnovationsandInvestmentsMarket 25 21 17
RwandaStockExchange
AlternativeMarketSegment 0 0 0
JohannesburgSE AltX 10 15 37 75 75 76 68 66 63 59 54 52DaresSalaamStockExchange
EnterpriseGrowthMarket(EGM) 1 3 4
StockExchangeofThailand
MarketforAlternativeInvestment(MAI) 9 13 24 36 42 48 49 60 66 73 81 95 111 122
BoursedeTunisTunisAlternativeMarket 1 1 2 2 2 4 9 12 12
BorsaIstanbulEmergingCompaniesMarket 2 11 20 22 20
BorsaIstanbul SecondNationalMarket 14 16 17 16 15 14 18 20 31 61 77 89 94 UgandaSecuritiesExchange
GrowthEnterpriseMarketSegment 0 0 0
LusakaSE LuSEAlternativeMarket 0 0
Source:MilkenInstituteCenterforFinancialMarketsandWorldFederationofExchanges
17
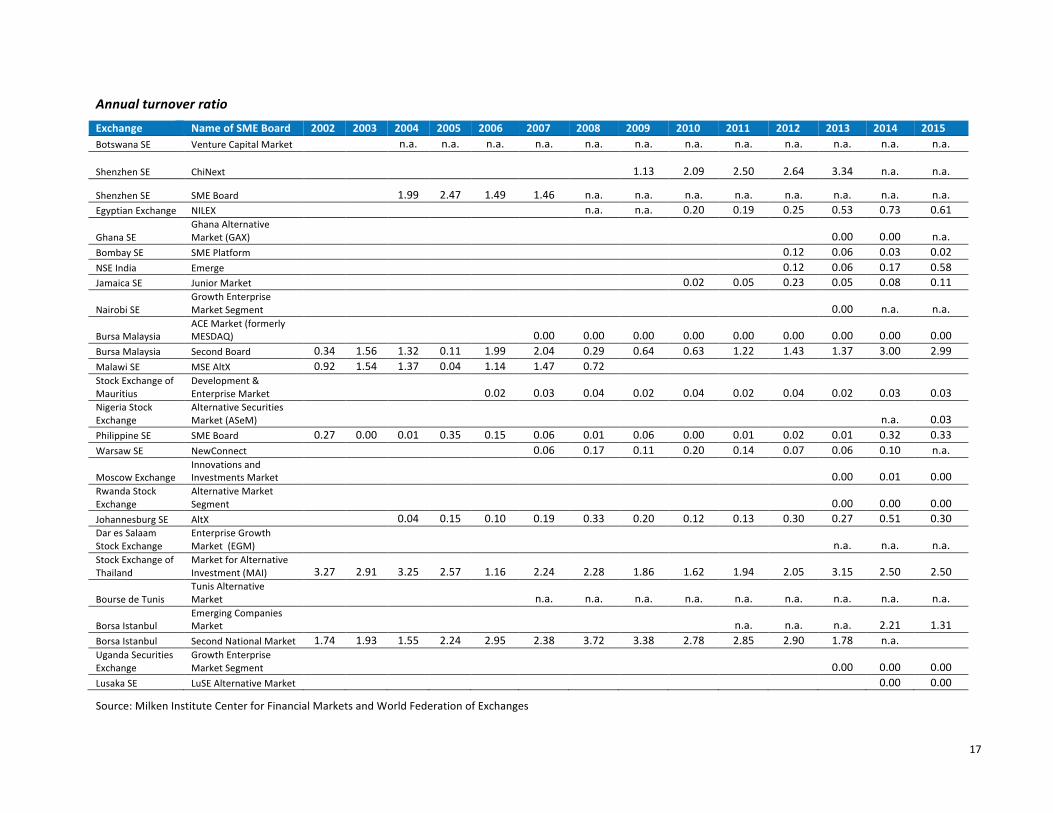
Annualturnoverratio
Exchange NameofSMEBoard 2002 2003 2004 2005 2006 2007 2008 2009 2010 2011 2012 2013 2014 2015BotswanaSE VentureCapitalMarket n.a. n.a. n.a. n.a. n.a. n.a. n.a. n.a. n.a. n.a. n.a. n.a.
ShenzhenSE ChiNext 1.13 2.09 2.50 2.64 3.34 n.a. n.a.
ShenzhenSE SMEBoard 1.99 2.47 1.49 1.46 n.a. n.a. n.a. n.a. n.a. n.a. n.a. n.a.EgyptianExchange NILEX n.a. n.a. 0.20 0.19 0.25 0.53 0.73 0.61
GhanaSEGhanaAlternativeMarket(GAX) 0.00 0.00 n.a.
BombaySE SMEPlatform 0.12 0.06 0.03 0.02NSEIndia Emerge 0.12 0.06 0.17 0.58JamaicaSE JuniorMarket 0.02 0.05 0.23 0.05 0.08 0.11
NairobiSEGrowthEnterpriseMarketSegment 0.00 n.a. n.a.
BursaMalaysiaACEMarket(formerlyMESDAQ) 0.00 0.00 0.00 0.00 0.00 0.00 0.00 0.00 0.00
BursaMalaysia SecondBoard 0.34 1.56 1.32 0.11 1.99 2.04 0.29 0.64 0.63 1.22 1.43 1.37 3.00 2.99MalawiSE MSEAltX 0.92 1.54 1.37 0.04 1.14 1.47 0.72 StockExchangeofMauritius
Development&EnterpriseMarket 0.02 0.03 0.04 0.02 0.04 0.02 0.04 0.02 0.03 0.03
NigeriaStockExchange
AlternativeSecuritiesMarket(ASeM) n.a. 0.03
PhilippineSE SMEBoard 0.27 0.00 0.01 0.35 0.15 0.06 0.01 0.06 0.00 0.01 0.02 0.01 0.32 0.33WarsawSE NewConnect 0.06 0.17 0.11 0.20 0.14 0.07 0.06 0.10 n.a.
MoscowExchangeInnovationsandInvestmentsMarket 0.00 0.01 0.00
RwandaStockExchange
AlternativeMarketSegment 0.00 0.00 0.00
JohannesburgSE AltX 0.04 0.15 0.10 0.19 0.33 0.20 0.12 0.13 0.30 0.27 0.51 0.30DaresSalaamStockExchange
EnterpriseGrowthMarket(EGM) n.a. n.a. n.a.
StockExchangeofThailand
MarketforAlternativeInvestment(MAI) 3.27 2.91 3.25 2.57 1.16 2.24 2.28 1.86 1.62 1.94 2.05 3.15 2.50 2.50
BoursedeTunisTunisAlternativeMarket n.a. n.a. n.a. n.a. n.a. n.a. n.a. n.a. n.a.
BorsaIstanbulEmergingCompaniesMarket n.a. n.a. n.a. 2.21 1.31
BorsaIstanbul SecondNationalMarket 1.74 1.93 1.55 2.24 2.95 2.38 3.72 3.38 2.78 2.85 2.90 1.78 n.a. UgandaSecuritiesExchange
GrowthEnterpriseMarketSegment 0.00 0.00 0.00
LusakaSE LuSEAlternativeMarket 0.00 0.00
Source:MilkenInstituteCenterforFinancialMarketsandWorldFederationofExchanges
18
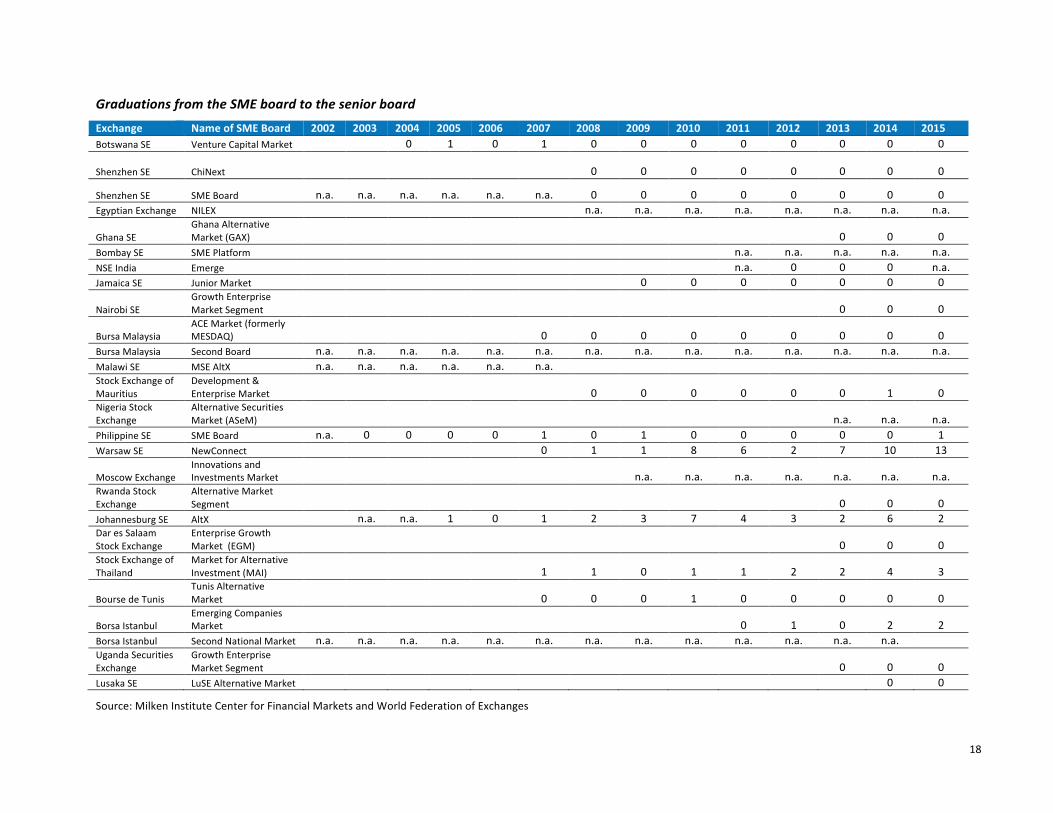
GraduationsfromtheSMEboardtotheseniorboard
Exchange NameofSMEBoard 2002 2003 2004 2005 2006 2007 2008 2009 2010 2011 2012 2013 2014 2015BotswanaSE VentureCapitalMarket 0 1 0 1 0 0 0 0 0 0 0 0
ShenzhenSE ChiNext 0 0 0 0 0 0 0 0
ShenzhenSE SMEBoard n.a. n.a. n.a. n.a. n.a. n.a. 0 0 0 0 0 0 0 0EgyptianExchange NILEX n.a. n.a. n.a. n.a. n.a. n.a. n.a. n.a.
GhanaSEGhanaAlternativeMarket(GAX) 0 0 0
BombaySE SMEPlatform n.a. n.a. n.a. n.a. n.a.NSEIndia Emerge n.a. 0 0 0 n.a.JamaicaSE JuniorMarket 0 0 0 0 0 0 0
NairobiSEGrowthEnterpriseMarketSegment 0 0 0
BursaMalaysiaACEMarket(formerlyMESDAQ) 0 0 0 0 0 0 0 0 0
BursaMalaysia SecondBoard n.a. n.a. n.a. n.a. n.a. n.a. n.a. n.a. n.a. n.a. n.a. n.a. n.a. n.a.MalawiSE MSEAltX n.a. n.a. n.a. n.a. n.a. n.a. StockExchangeofMauritius
Development&EnterpriseMarket 0 0 0 0 0 0 1 0
NigeriaStockExchange
AlternativeSecuritiesMarket(ASeM) n.a. n.a. n.a.
PhilippineSE SMEBoard n.a. 0 0 0 0 1 0 1 0 0 0 0 0 1WarsawSE NewConnect 0 1 1 8 6 2 7 10 13
MoscowExchangeInnovationsandInvestmentsMarket n.a. n.a. n.a. n.a. n.a. n.a. n.a.
RwandaStockExchange
AlternativeMarketSegment 0 0 0
JohannesburgSE AltX n.a. n.a. 1 0 1 2 3 7 4 3 2 6 2DaresSalaamStockExchange
EnterpriseGrowthMarket(EGM) 0 0 0
StockExchangeofThailand
MarketforAlternativeInvestment(MAI) 1 1 0 1 1 2 2 4 3
BoursedeTunisTunisAlternativeMarket 0 0 0 1 0 0 0 0 0
BorsaIstanbulEmergingCompaniesMarket 0 1 0 2 2
BorsaIstanbul SecondNationalMarket n.a. n.a. n.a. n.a. n.a. n.a. n.a. n.a. n.a. n.a. n.a. n.a. n.a. UgandaSecuritiesExchange
GrowthEnterpriseMarketSegment 0 0 0
LusakaSE LuSEAlternativeMarket 0 0
Source:MilkenInstituteCenterforFinancialMarketsandWorldFederationofExchanges
19
AcknowledgmentsThispaperwaspreparedfortheMilkenInstituteCenterforFinancialMarketsbyJohnSchellhase,associate
director,andJimWoodsome,seniorassociate.DuringinternshipsattheMilkenInstitute,Christopher
BensonandAtulMenonassistedincollectingandorganizingsomedatapresentedhere.Theauthorswishto
thankJacquelineIrving,director,andStaciWarden,executivedirectorattheMilkenInstituteCenterfor
FinancialMarkets,fortheirsupportofthisprojectandtheircommentsondraftsofthispaper.
TheauthorsalsowishtothankSiobhanCleary,headofresearchandpublicpolicy,andStefanoAlderighi,
senioreconomist,attheWorldFederationofExchangesfortheirpartnershipincreatingthedataset
describedinthispaperandfortheirfurthercollaborationonresearchinitiativestoexploretheroleofSME
boardsinemerging-marketanddevelopingcountries.TatianaChekanova,previouslyaneconomistatthe
WFE,alsocontributedtothecreationofthisnewdataset.
About the Authors JohnSchellhaseisanassociatedirectorattheCenterforFinancialMarketsattheMilkenInstitute.His
workprimarilyfocusesonfinancial-marketdevelopmentindevelopingcountries.
JimWoodsomewasaseniorprogramresearchanalystwiththeMilkenInstituteCenterforFinancial
Markets,wherehesupportedtheresearcheffortsandinitiativesrelatedtothecenter’sCapitalMarketsfor
Developmentprogram.Hecurrentlyworksasanindependentconsultantonfinancial-sectorissuesaffecting
developingcountries.
About the Center for Financial Markets BasedinWashington,D.C.,theMilkenInstituteCenterforFinancialMarketspromotesfinancialmarket
understandingandworkstoexpandaccesstocapital,strengthen—anddeepen—financialmarkets,and
developinnovativefinancialsolutionstothemostpressingglobalchallenges.
About the Milken Institute TheMilkenInstituteisanonprofit,nonpartisanthinktankdeterminedtoincreaseglobalprosperityby
advancingcollaborativesolutionsthatwidenaccesstocapital,createjobsandimprovehealth.Wedothis
throughindependent,data-drivenresearch,action-orientedmeetingsandmeaningfulpolicyinitiatives.
©2017MilkenInstitute
ThisworkismadeavailableunderthetermsoftheCreativeCommonsAttribution-NonCommercial-
NoDerivs3.0UnportedLicense,availableatcreativecommons.org/licenses/by-nc-nd/3.0/