Embed Size (px)
Citation preview

Engineering
HG-CIL FEED OPTIMIZATION AT THE
RAAHE LAIVA GOLD MINE
Joakim Colpaert
Master’s thesis
Department of Process and Environmental Engineering
February 2014

TIIVISTELMÄ
OPINNÄYTETYÖSTÄ Oulun yliopisto Teknillinen tiedekunta
Pääaineopintojen ala Diplomityö Tuotantotalous
Tekijä Työn ohjaaja yliopistolla
Joakim Colpaert Hannu Kuopanportti
Työn nimi HG-CIL feed optimization at the Raahe Laiva gold mine
Opintosuunta Työn laji Aika Sivumäärä Prosessitekniikka Diplomityö Helmikuu 2014 104 + Liitteet
Tiivistelmä
Diplomityön tavoitteena oli Nordic Mines Oy:n Laivan kaivoksen rikastamon
HG-liuotuspiirin syötteen optimointi. Optimoinnissa pyrittiin nostamaan kullan saantia
HG-liuotuspiiriin ja sitä kautta kullan kokonaissaannon parantumiseen. Tavoitteena oli
myös lisätä ympäristöä kuormittavien sulfidien saantia suljettuun HG-varastoaltaaseen.
Työn aikana pyrittiin myös löytämään korvaava vaahdotuskemikaali Aerophine
3418A:lle sen huonon saatavuuden ja kalliin hinnan vuoksi. Vaahdotuskemikaalien
syöttömäärän säätösysteemi tehtiin, jotta vaahdotusprosessin optimointi olisi
mahdollista.
Tavoitteisiin pyrittiin optimoimalla vaahdotusprosessi sekä painovoimapiiri.
Kirjallisuuskatsaus käsittelee pääosin vaahdotuksen ja painovoimaerotuksen
teknologiaa kullan rikastamisessa. Työssä käydään läpi Laivan kaivoksen rikastamolla
käytettävä karkeavaahdotuskenno sekä Knelson- ja spiraalipainovoimaerotuslaitteet.
Tavoitteen saavuttaminen vaati laboratoriokokeita, joissa pyrittiin löytämään
vaihtoehtoinen vaahdotuskemikaali korvaamaan Aerophine 3418A sen kalliin
markkinahinnan ja huonon saatavuuden vuoksi. Laboratoriovaahdotuskokeilla pyrittiin
myös selvittämään käytettävien vaahdotuskemikaalien syöttömäärän vaikutusta kullan
saantiin sekä kuparisulfaatin vaikutusta kullan ja sulfidien saantiin.
Kullan kokonaissaanto vaahdotuksessa ja painovoimapiirissä saatiin kasvatettua noin
15% työn aikana. Parantunut saanti vaahdotuskennosta sekä painovoimapiiristä myös
nostaa rikastamon kullan kokonaissantoa useita prosentteja. Parantunut kullan saanti
vaahdotuskennosta ja painovoimapiiristä indikoi myös sulfidien saannin paranemista
suljettuun HG-varastoaltaaseen.
Tehtäessä kirjallisuuskatsausta ja tutkimalla muita samantapaisia kullan rikastus
prosesseja maailmalla tuli esiin mahdollinen kuparisulfaatin käytön hyöty
vaahdotuksessa kullan saannin kannalta. Kuparisulfaatin avulla voidaan aktivoida
arsenopyriitti mahdollistaen kokoojakemikaalin tarttumisen sen pintaan. Kulta Laivan
kaivoksella esiintyy arseenikiisumineraalin läheisyydessä. Laboratorio
vaahdotustesteissä kuparisulfaatin käyttö paransi kullan saantia keskimäärin 5,4%.
Kuparisulfaatin vaikutusta kullan saantiin vaahdotuksessa kokeiltiin myös laitos
mittakaavassa, mutta merkittäviä tuloksia ei saatu todistettua. Kuparisulfaatin
käyttäminen voisi nostaa arseenin saantia vaahdotuksessa ja sitä kautta suurempi osa
arseenista saataisiin talteen suljettuun HG-altaaseen. Kuparisulfaatin käyttö tekisi
prosessista enemmän ympäristöä säästävän.
Muita tietoja

ABSTRACT
FOR THESIS University of Oulu Faculty of Technology
Degree Programme (Master’s Thesis) Major Subject Department of Process- and Environmental Engineering Industrial Engineering and Management
Author Thesis Supervisor
Joakim Colpaert Hannu Kuopanportti
Title of Thesis HG-CIL feed optimization at the Raahe laiva gold mine
Major Subject Type of Thesis Submission Date Number of Pages Process Engineering Master’s Thesis February 2014 104 + Appendix
Abstract
The main object of the work was to optimize the HG leaching feed at the Laiva mine.
The targets of the optimization were to increase the gold recovery to the HG leaching
circulation and promote the recovery of unwanted sulphides and direct these to the
closed Hg pond. One task of the work was to find an alternative flotation chemical to
replace Aerophine 3418A because its expensive price and poor availability in the
markets. Implementing a flotation chemical addition rate control into the main operating
system was done at the beginning of the plant optimization phase.
The objectives were pursued by optimizing the flotation process and the gravity circuit.
The literature review mainly concerned with the flotation process and gravity separation
of gold enrichment technology. In this work the process of Laiva mine is explained and
focuses on the flash flotation and gravity separation process.
Achieving the goals required laboratory tests. Different flotation chemicals were tested
in a laboratory scale batch flotation test to find an alternative flotation chemical for
Aerophine 3418A. Different addition rates of flotation chemicals and the responses for
gold recovery from flotation were tested in laboratory flotation tests. Also the effect of
using copper sulfate as an activator and the responses to gold recovery and sulfide
recovery were tested in laboratory flotation tests.
The combined total recovery from gold flotation and gravity separation circuit was
increased approximately 15% during this work. Improved recoveries from the flotation
cell and gravity circuit seem to have notable positive effect on the total recovery of gold
and recovery of sulphides to the closed HG pond.
Conducting the literature review and benchmarking of other similar gold enrichment
processes in the world came up an idea that adding copper sulfate to the feed would
increase the gold recovery in flotation. Copper sulphate activates arsenopyrite and this
enables the collector to adsorb on the surface of a mineral particle where arsenopyrite is
present. Gold occurs with arsenopyrite in Laiva gold mineralization. In laboratory scale
flotation tests copper sulphate improved the gold recovery by on average of 5,4%.
Copper sulfate was tested also in the plant, but no significant results were not
established. The copper sulfate would make the process more environmental friendly. Additional Information

Alkusanat
Diplomityö on tehty Nordic Mines Oy:n Raahen kultakaivokselle. Työ tehtiin pääosin
kesän ja syksyn 2013 aikana.
Ensiksi haluan kiittää professori Hannu Kuopanporttia diplomityöni ohjaamisesta ja
laadukkaasta opetuksesta opintojeni aikana. Iso kiitos diplomi-insinööri Mikko
Joensuulle mielenkiintoisesta aiheesta, työhön liittyvistä kommenteista ja elämän
opetuksista. Haluan myös kiittää toista ohjaajaani tutkijatohtori Jari Ruuskaa
palautteesta ja ohjauksesta.
Erityisesti haluan kiittää Raahen kultakaivoksen prosessi-insinöörejä Marko Kukkosta
ja Joni Rahusta, jotka jaksoivat vastailla kysymyksiini ja neuvoa tarvittaessa. Iso kiitos
myös kaikille kaivoksen työntekijöille, joiden kanssa kaksi kesää oli erittäin mukava
kultaa rikastaa. Haluan myös kiittää Raimo Anttilaa, Ville Anttilaa ja koko CRS-
tutkimuslaboratorion henkilökuntaa näytteiden laadukkaasta analysoinnista ja opeista,
joita työn ohessa sain. Paljon kiitoksia GTK:n erikoistutkija Hannu Klemetille ja
erikoistutkija Pekka Mörskylle ohjeista ja mahdollisuudesta tutustua GTK:n
laboratoriomenetelmiin ja käytäntöihin.
Haluan myös kiittää omaopettajaani tekniikan tohtori Juha Jaakoa esimerkillisestä
ohjauksesta opintojeni aikana.
Kiitos Jennalle avusta opinnoissani tuesta ja diplomityötä tehdessäni!
Oulussa, 1.2.2014 Joakim Colpaert

TABLE OF CONTENTS
1 INTRODUCTION ............................................................................................................ 10
1.1 Background ................................................................................................................ 10
1.2 Objectives of the work ............................................................................................... 10
1.3 Thesis outline ............................................................................................................. 11
2 BACKGROUND .............................................................................................................. 12
2.1 The production plant process ..................................................................................... 12
2.2 The Mineralization of Laiva Mine ............................................................................. 16
2.3 Flotation fundamentals ............................................................................................... 19
2.3.1 Polarity and hydrophobicity/hydrophilicity of minerals ................................... 22
2.3.2 Adsorption ........................................................................................................ 23
2.3.3 Contact angle .................................................................................................... 24
2.4 Reagent ....................................................................................................................... 25
2.4.1 Collectors .......................................................................................................... 25
2.4.2 Anionic collectors ............................................................................................. 27
2.4.3 Cationic Collectors ........................................................................................... 29
2.4.4 Frothers ............................................................................................................. 30
2.4.5 Modifiers ........................................................................................................... 31
2.4.6 Activators .......................................................................................................... 31
2.4.7 Depressants ....................................................................................................... 32
2.4.8 pH-Modifiers .................................................................................................... 33
2.5 Flotation chemistry of gold ........................................................................................ 34
2.6 Factors affecting the gold recovery in flotation ......................................................... 36
2.6.1 Liberation .......................................................................................................... 36
2.6.2 Coating .............................................................................................................. 37
2.6.3 Particle size and shape ...................................................................................... 37
2.7 Flash flotation............................................................................................................. 38
2.8 Flotation in Laiva site ................................................................................................. 40
2.9 Flash flotation cell in Laiva site ................................................................................. 44
2.10 Flotation stabilization and optimization principles .................................................. 47
2.11 Optimization of the flotation process in Laiva site .................................................. 49
2.12 Vision-based control of flotation ............................................................................. 52
2.13 Gravity concentration and gravity circuit in the Laiva site ...................................... 53

2.14 Knelson concentrator ............................................................................................... 54
2.15 Spiral concentrator ................................................................................................... 57
3 EXPERIMENTAL STUDY .............................................................................................. 61
3.1 Introduction ................................................................................................................ 61
3.2 Materials ..................................................................................................................... 62
3.2.1 Frother ............................................................................................................... 62
3.2.2 Collectors .......................................................................................................... 62
3.2.3 Modifier ............................................................................................................ 63
3.2.4 Slurry samples for laboratory scale batch flotation tests .................................. 63
3.3 Equipment and methods ............................................................................................. 64
3.3.1 Laboratory scale batch flotation tests ............................................................... 64
3.3.2 Flotation recovery calculations ......................................................................... 66
3.4 Plant copper sulfate test ............................................................................................. 67
3.5 Effect of the flotation chemicals to carbon activity ................................................... 68
3.6 Upgrading a flotation chemical flow rate control ...................................................... 69
3.7 HG-CIL feed optimization ......................................................................................... 70
3.8 Minitab 16 statistical software tool ............................................................................ 71
4 RESULTS ......................................................................................................................... 72
4.1 Results of laboratory scale batch flotation tests ......................................................... 72
4.2 Results of carbon activity test .................................................................................... 78
4.3 Results of plant copper sulfate tests ........................................................................... 80
4.4 Results of flotation chemical flow rate control implementation ................................ 81
4.5 HG-CIL feed optimization ......................................................................................... 82
4.5.1 Gold percentage to HG-CIL tanks .................................................................... 82
4.5.2 Total recovery of gold ...................................................................................... 84
4.5.3 Gold grade in LG tails ...................................................................................... 86
4.5.4 Head grade from January 2013 to September 2013 .......................................... 87
4.5.5 One-way ANOVA for increased combined recovery from the flash flotation
and spiral concentrator ..................................................................................... 88
4.5.6 Flash flotation concentrate ................................................................................ 90
4.5.7 Knelson concentrate .......................................................................................... 91
4.5.8 HG CIL feed volume ........................................................................................ 93
4.5.9 The flotation unit and gravity circuit recovery vs total recovery of gold ......... 95
5 CONCLUCIONS .............................................................................................................. 96
RECOMMENDATIONS FOR FUTURE WORK .............................................................. 98

6 REFERENGES ................................................................................................................. 99
7 APPENDIX ..................................................................................................................... 104

Notation
C concentrate
c grade in concentration
E0
standard reduction potential
F feed
f grade in feed
g/t grams per ton
H0 null hypothesis
H1 alternative hypothesis
K flotation rate
ppm part per million
P80 the mill circuit product size in micrometers
R recovery %
T tailings
t grade in tailings
V volt
AG autogenous
Am amyl (C5) alkyl group
CMC Carboxymethylcellulose
CVD continuous variable-dischagre
CIL cyanide in leach
DTP Dithiophosphates
DTPI Dithiophosphinates
Et ethyl (C2) alkyl group
GRG gravity-recoverable gold
HG high grade
HGR gold recovered from HG leaching
HGRT gold in total HG tails
LG low grade

LGR gold recovered from LG leaching
LGRT gold in total LG tails
MBC Mercaptobenzothiolates
Rhg Recovery % of Au in HG-CIL tanks
Rf heterocoagulation (true flotation)
Re entrainment
surface energy between solid and vapor
surface energy between solid and liquid
surface energy between liquid and vapor
θ contact angle

10
1 INTRODUCTION
1.1 Background
Laiva gold mine is located in Raahe, in the north-western part of the Raahe-Ladoga
zone in Finland. Mine is owned by Nordic Mines AB and Nordic Mines Oy operates the
Laiva site. Nordic Mines AB is listed in the Stockholm OMX-list. Nordic Mines AB
claimed the gold deposit in Laiva 2005 and in spring 2010, the company started
construction work of the company’s first mine. In the late summer 2011 the gold
production started.
The mineralization is hosted in a silicified quartz diorite and mafic volcanic host. Fine
grained gold occurs primarily as sub-microscopic inclusions hosted by quartz,
arsenopyrite, and lollongite. Using a 0.8g/t Au cut-off the pit constrained Measured and
Indicated resource is 16,9 Kt grading 1.6 g/t Au, containing 27,00 kilos of gold and the
waste to ore strip ratio is 5.15 to 1. (O’Connor and Reeves 2012)
The gold deposit at the Laiva mine is mined in an open pit. The ore from the open pit is
crushed and then grinded in two stages. The grinded ore goes through a leaching
process and gold is recovered on carbon in leach (CIL) process. Gold is recovered from
the loaded carbon and later precipitated by electrolysis. Finally, doré bars are casted.
1.2 Objectives of the work
The main objective of this study was to optimize the high grade cyanide leaching feed,
in other words, maximizing the gold concentration of the HG-CIL (high grade-cyanide
in leaching) feed and increase the recovery of unwanted sulphides to the closed HG
pond. The objective includes familiarizing with a flash flotation, a Knelson concentrator
and a spiral concentrator process and to investigate, if there were any possibilities to
improve the efficiency of this process as a whole.
This study focuses on to the optimum operating conditions in order to achieve the
maximum flotation performance of gold in the flash flotation process. The flotation
reagent dosage levels were studied to identify the conditions providing the optimum

11
performance. Also the influence of copper sulfate as an activator was studied and how it
effects on the flotation performance and the recovery of gold.
The secondary objective was to search an alternative flotation chemical for Aerophine
3418A Promoter. This includes a review of existing gold flotation chemicals and the
goal was to find cheaper and/or more effective chemical to replace Aerophine 3418A.
The theory part is constructed in a way that it can be used as education material for the
employees in Laiva mine. English was selected as a writing language because the
company is Swedish and for personal learning.
1.3 Thesis outline
The first chapter in this thesis introduces the problems in high grade leaching feed
optimization. The plant design of Laiva mine and mineralization of the ore is introduced
in Chapter Two. This chapter contains a summary of a flotation principles and a
Knelson and spiral concentrator are also briefly explained. A detailed description of
sample collection, laboratory equipment, and experiment procedures is described in
Chapter Four. Chapter Five presents the results of the study and discusses the results in
a fundamental content. A summary of the study and the resulting conclusions are
highlighted in Chapter Six and Seven along with the recommendations for future work.

12
2 BACKGROUND
2.1 The production plant process
Ore is mined from an open pit one kilometer away from the production plant. The ore is
taken to the crushing plant in haul trucks where it is crushed into smaller size that can
be transported along the conveyor belt to the stock pile. A haul truck dumps the ore
straight to the crushing plant and a jaw crusher crushes the ore to size under 200mm.
The capacity of the crushing plant is 600 tons per hour. The capacity of the ore stock
pile is 25000 tons, in practice there is live capacity for 15 hour production.
A mobile crusher is processing ore under 200mm from the stock pile to size less than
25mm and the feed of the mobile crusher is between 60 and 90 tons per hour, around 30
to 40 percent of the total refinery feed. The product from the mobile crusher is fed to the
belt conveyor and into the refinery. There are four feeders under the stock pile feeding
the material to the belt conveyor of the refinery. First the ore is processed in the
autogenous mill, (AG-mill), and the average feed rate is between 200 and 250 tons per
hour.
The product of the AG-mill is sorted out by a trommel, and the inner screen openings
are 80mm times 35mm and the outer ring openings are in size 12mm times 20mm. An
overflow of the inner screen goes to a secondary crushing circulation and the underflow
to the pebble mill when pebbles are needed and the power intake of the pebble mill
enables it, and the underflow of outer ring screen is directed to the pebble mill discharge
box. The feed to the pebble mill consists of a primary cyclone underflow and pebbles
from an AG-mill when needed.
The secondary crushing circulation load is processed in two cone crushers. The first
cone crusher makes particles size P80 between 17mm and 20mm and the second crusher
particle size P80 is between 10mm and 12mm. The secondary crushing circulation
product goes to the AG-mill and the feed rate is between 50 – 80 tons per hour. Feed to
the primary screen consists of a dewatering cyclone overflow, pebble mill discharge and
AG mill underflow. The sizes of the openings in the primary screen are 1,6mm times
2,2mm. A primary screen underflow goes to a flash flotation cell. The concentrate of a
flash flotation cell is directed to the ball mill discharge box. Partly, the underflow of a

13
flash flotation cell is directed to a Knelson concentrator. Concentrate of the Knelson is
directed to the spiral concentrators. The underflow of the Knelson concentration is
directed partly back to the gravity circulation. Concentrate of the spirals is going to the
ball mill. Discharge of the spiral concentrator is going back to the gravity circulation. A
primary cyclone feed consists of a flash flotation underflow and gravity circulation
discharge. Overflow of a primary cyclone is directed to the dewatering cyclone. Low-
grade leaching feed consists of dewatering cyclone underflow. High-grade leaching feed
consists of a flash flotation cell concentrate and spiral concentrate. Production plant
model is illustrated in Figure 1.
Figure 1. Production plant (Nordic Mines)
The leaching process of the gold is done in two separate circulations, High-grade- and
Low-grade circulation. Two separate leaching circuits enable using the paste technology
for the tailings. The flotation concentrate and spirals concentrate advances on a
thickener where some water is removed to achieve 45 weight-% of solids. The slurry is
then pumped to a cascade of nine tanks. The first tank is used to set the pH to target
value and to condition the slurry with oxygen. Pure oxygen is added to every HG-CIL
tank. Before leaching the pH of the pulp is adjusted to a pH-value between 9,5 to 11 to
ensure the minimum loss of cyanide as hydrogen cyanide. Slurry continues to flow by
gravity to the following tank. There is a cascade of eight carbon in leach (CIL) tanks.

14
Lime is added to the first, second, fourth and sixth tank. Cyanide (NaCN) is added to
the second, third and fifth tank to achieve a target concentration of 2000 ppm of free
cyanide in the solution. Lead(II) nitrate Pb(NO3)2 is added to the first tank in HG
circulation. According to the Deschênes et al. (2003) the use of lead nitrate increases the
gold dissolution kinetics considerably. Each tank is charged with a target concentration
of 15,0 g/l of carbon. Carbon is moved counter current of the slurry in eight CIL tanks
on a 12 hour basis. The recovery of the gold and the maldonite is around 98 percent in
the HG-CIL circuit. After CIL tanks the slurry is directed to four detoxifying tanks.
Slurry from the HG detox tanks is directed to a closed pond. The low grade leaching
circuit consists of seven CIL tanks and two detox tanks. Cyanide is added to the tanks
one, two and five to achieve the target concentration of 200 ppm of free cyanide in the
solution. Lime is added in the same tanks as cyanide and to the detox tanks. Copper
sulphate is also added to the detox tanks. The recovery of gold and maldonite is between
65% to 85% in LG-CIL tanks and the total recovery of the acting plant is between 75%
and 90%. The tailings of LG circulation are directed to a paste plant.
The striping circuit consists of an acid leaching column, followed by an elution column
operated in a closed circuit with two electro winning cells. The stripped carbon is
regenerated in a rotary kiln prior to being returned to the CIL circuit. The electro won
gold slurry is recovered after three strips and melted to produce the Doré bullion. The
acting plant process is illustrated in Figure 2.

15
Figure 2. Flow sheet of acting plant (Modified from Metso flow sheet 2011)

16
2.2 The Mineralization of Laiva Mine
The Laiva mine is located 15 km south-south-east of the town of Raahe in Mattilanperä,
in the NW part of the Ladoka-Perämeri –zone, close to the coast of Pohjanlahti (Mäkelä
1984). According to Simonen (1980) the Laiva mine is located on the Vihanti-
mineralization zone. Outokumpu Oy was the first company to explore the site of Laiva
after P. Jämbeck sent a boulder sample consisting of gold to Outokumpu Oy and started
the exploration of the sight in the year 1981. (Mäkelä 1984, Pratt 2010)
The quartz-arsenopyrite-gold mineralization of the Laiva mine is a sulphide-associated
mineralization hosted by shear zones. The area of Laiva mine is located in the contact of
a volcanic zone and the major rock types are quartz diorites whose composition varies
from mela quartz diorite and quartz monzonite, volcanic rock, mainly mafic uralite
porphyrites and microcline granites that cut both volcanites and the quartz diorites.
(Mäkelä 1984, Pratt 2010)
Gold and maldonite occur in quartz-rich shear zones and in deformed quartz veins. Gold
and maldonite occur primarily as sub microscopic inclusions hosted by arsenopyrite,
quartz and loellingite and therefore they were probably crystallized in the early stage of
mineralization. Metallic bismuth and hedlegite may be found in association with the
gold. Gold is found in sizes between 1 -50 micrometers. Arsenopyrite and loellingite are
the most common ore minerals in Laivakangas, but also abundant pyrrhotite and
chalcopyrite are present. A normal SiO2-content of the unaltered rock is 45,7% – 50,5%
but in the shear zones it is 55,1% on average. Shear zones vary from a few millimeters
to several meters in width and the quartz-arsenopyrite-gold-mineralization cuts both the
metavolcanics and the quartz diorites. (Mäkelä 1984, Pratt 2010)

17
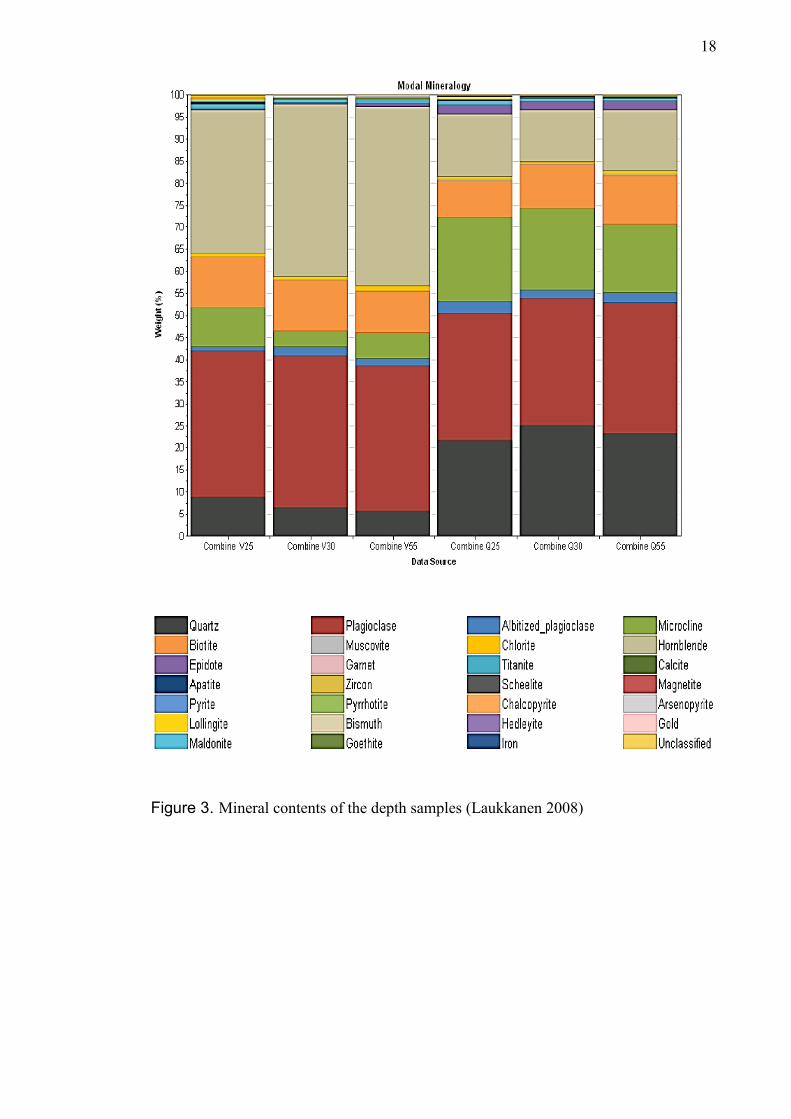
Table 1. Mineral contents of depth samples (Laukkanen 2008)
18
Figure 3. Mineral contents of the depth samples (Laukkanen 2008)

19
2.3 Flotation fundamentals
The earliest patented invention related to the flotation process is from the year 1860.
The flotation process was originally patented in 1960 and ever since it has been the
most important and utilized mineral processing technique. A froth flotation enabled the
mining of low-grade and complex ore bodies which have otherwise been impossible to
mine economically. In the past gravity plants had higher grades in the tailings than ore
processed in modern flotation plants. (Wills 2006, Hukki 1963)
Froth flotation is a versatile processing method for physically separating minerals based
on differences in surface properties. Flotation is a physic-chemical separation process,
involving three phases (solids, water and froth) with many interactions listed in Figure
7. Separation is based on the ability of air bubbles to selectively adhere to wanted
mineral surface and separate valuable mineral from unwanted gangue minerals. There
are three mechanisms that recover the material by flotation from pulp:
Selective attachment to air bubbles, also known as "true flotation".
Entrainment in the water which passes through the froth.
Physical entrapment between particles in the froth attached to air bubbles, also
known as "aggregation".
These three mechanisms are illustrated in Figures 4 and 5.
Figure 4. Flotation recovery by heterocoagulation (true flotation) Rf, and entrainment
Re (Schubert 1999)

20
Figure 5. Entrainment, full bubble loading and partial bubble loading (Colpaert 2013)
The particles attached to air bubbles are drifted to the surface forming a froth layer on
top of the slurry phase. The mineral particles can only attach to the air bubbles if they
are hydrophobic. A hydrophobic mineral surface means that the mineral rejects water.
The mineral rich froth is then removed and gathered. Particles that remain wetted stay in
the liquid phase. Figure 6 illustrates the principle of a mechanical flotation cell.
The most important mechanism in flotation is the attachment of the valuable mineral to
air bubbles and this mechanism recover most of the valuable mineral in the froth. The
separation efficiency between the valuable mineral and the gangue mineral depends also
on the degree of entrainment and physical entrapment. Both the valuable mineral and
the gangue mineral can be recovered to the froth by entrainment and entrapment. True
flotation is more selective to the valuable mineral which has the requisite surface
properties. (Wills 2006, Hukki 1963)
21
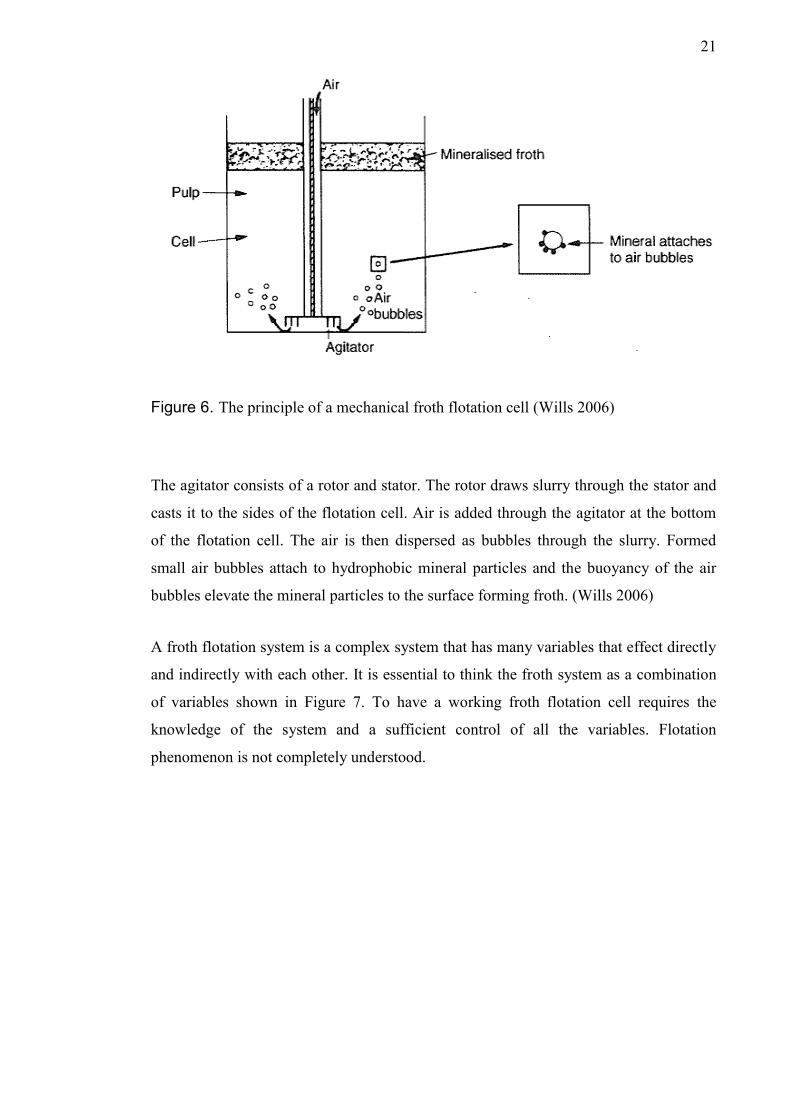
Figure 6. The principle of a mechanical froth flotation cell (Wills 2006)
The agitator consists of a rotor and stator. The rotor draws slurry through the stator and
casts it to the sides of the flotation cell. Air is added through the agitator at the bottom
of the flotation cell. The air is then dispersed as bubbles through the slurry. Formed
small air bubbles attach to hydrophobic mineral particles and the buoyancy of the air
bubbles elevate the mineral particles to the surface forming froth. (Wills 2006)
A froth flotation system is a complex system that has many variables that effect directly
and indirectly with each other. It is essential to think the froth system as a combination
of variables shown in Figure 7. To have a working froth flotation cell requires the
knowledge of the system and a sufficient control of all the variables. Flotation
phenomenon is not completely understood.

22
Figure 7. The flotation system includes many interrelated components (Klimpel 1995)
The chances in the system can cause imbalance in the flotation, as an example a changes
in the feed rate of the flotation cell have a direct demand to change the chemical input to
the flotation system. A froth flotation system is a very difficult process to study because
it is hard to isolate the effects of one factor. This is the reason that makes developing
new predictive models for froth flotation difficult. (Wills 2006, Hukki 1964)
2.3.1 Polarity and hydrophobicity/hydrophilicity of minerals
The basis of froth flotation is in the differences in wettabilities of minerals. All minerals
are classified into the polar or non-polar minerals according to their surface
characteristics. Nonpolar minerals have weak molecular bonds on their surface. Non-
polar minerals are hydrophobic because non-polar surfaces do not readily attach to the
water dipoles. Particles can be naturally hydrophobic, or hydrophobicity can be
achieved with specific chemicals. The non-polar minerals are composed of covalent
molecules held together by Van der Waals forces. The minerals with strong covalent or
ionic surface bonding are known as polar minerals. The surfaces of polar minerals react
strongly with water molecules, and this is why polar minerals are naturally hydrophilic.
A mixture of hydrophilic and hydrophobic particles reacts with the air bubbles in a way

23
that only the hydrophobic particle surfaces attach air bubbles, as shown in Figure 8. The
froth layer that forms on the slurry will be saturated with the hydrophobic particles and
it can be recovered as a separate concentration of the hydrophobic particles. Hydrophilic
particles will remain in the suspension. (Wills 2006)
Figure 8. Air bubble attachment (Wills 2006)
Air bubbles attach to hydrophobic particle surfaces and the buoyancy of the bubbles
transport these particles to the surface forming froth. This is a selective attachment to
the air bubbles, also known as "true flotation". Hydrophilic particles that do not react
with the air bubbles are left in the pulp and are sinking. (Wills 2006)
2.3.2 Adsorption
Adsorption is generally defined as a change in the chemical content of phases at an
interface, most commonly the accumulation of one component ether from the solution
or gaseous phase. Adsorption can be detected as a chance in the concentration of a
certain component in the solution. (Bulatovic 2007: 99)
There are two main cases of adsorption, physisorption and chemisorption. Physisorption
is the phenomenon that occurs when the free energy of the surface is reduced. In
mineral processing, the physical adsorption of gases is measured and used to determine
the specific surface area of fine solids such as porous minerals or clay. In
chemisorption, a chemical reaction is involved. The chemisorption is used to explain the

24
adsorption of certain reagents, like carboxylates on oxide minerals such as the hematite-
oleic acid system. Chemisorption is not limited to sulfides, the lead-xanthate system
may also involve chemisorption’s. (Bulatovic 2007: 100)
2.3.3 Contact angle
The attachment of the bubbles to the surface of mineral particle is determined by the
interfacial energies between gas, solid and liquid phases. This interfacial energies are
determined by the Young/Dupre in Equation (1),
, (1)
where is surface energies between solid and air
is surface energies between solid and water
is surface energies between water and air
θ contact is angle between the mineral surface and the bubble
If a contact angle is too small, the bubble does not attach to the mineral
particle, while a big contact angle build a very strong bubble attachment. A
contact angle near 90° is adequate for effective froth flotation. (Wills 2006)
Figure 9. Contact angle between bubble and a solid mineral particle surface in liquid
(Wills 2006)
d

25
2.4 Reagent
The success of any froth flotation system depends considerably on the used reagents to
control the surface behavior of the mineral particles. Mineral particles are originally
seldom suitable for froth flotation. Chemicals are needed both to control the surface
behavior of the minerals, and to maintain the proper froth characteristics. Thus far there
are a wide range of chemicals used in flotation systems and new are invented
continuously. The frother is added to control the bubble size and froth stability.
Collectors are surface-active organic reagents that attach to the surface of mineral
particles and modify the mineral surface to hydrophobic. The functions of all other
reagents are to optimize the best possible selective separation of the mineral on ore.
(Wills 2006) According to Fuerstenau et al. (2007) the flotation reagents can be
separated in to six broad types:
frothers
collectors
modifiers
activators
depressants
flocculants
The frother is added to control the bubble size and froth stability. Collectors are surface-
active organic reagents that attach to the surface of mineral particles and modify the
mineral surface to hydrophobic. The functions of all other reagents are to optimize the
best possible selective separation of the mineral on ore.
2.4.1 Collectors
Collectors are a fairly large group of organic chemical compounds. Collectors are
heterogeneous compounds that contain an active inorganic group coupled with a
hydrocarbon chain. Collectors selectively adsorb onto the surfaces of mineral particles.
According to King (1982) the inorganic group is the part of the collector molecule that
adsorbs on the mineral particle surface, while the hydrocarbon chain provides
hydrophobicity for the mineral particle surface after collector adsorption. Collectors
form a monolayer on the mineral particle surface that forms a thin film of non-polar

26
hydrophobic hydrocarbons and thus provide conditions for the attachment of the
hydrophobic mineral particles to air bubbles, as shown in Figure 10. (Wills 2006)
Figure 10. Collector adsorption on the surface of a mineral particle (Wills 2006)
The collectors are added to the pulp and the time is allowed for adsorption during
agitation is called the conditioning period. The collectors increase the contact angle
between air bubble and solid mineral particle so that bubbles will adhere to the surface.
Collectors are classified into ionic (anionic and cationic) and a non-ionic surfactants, as
shown in Figure 11. (Wills 2006)
Figure 11. Basic collector types (Bulatovic 2007)

27
The nonionic collectors are simple hydrocarbon oils. The anionic and cationic consist of
a polar component that selectively attaches to the surface of a mineral particle, and non-
polar component of the collector takes up a position towards to the solution and makes
the mineral surface hydrophobic, as shown in Figure 10. Collectors can attach to the
mineral particle surfaces by chemisorption, or be held on the surface by physical
adsorption. (Wills 2006, Fuerstenau et al. 2007)
2.4.2 Anionic collectors
Anionic collectors are the most utilized collector types in the froth flotation industry.
Anionic collectors may be classified into two types by their structure of the polar croup.
The principle of anionic- and cationic attachment on the mineral particle is shown in
Figure 12. Oxyhydryl collectors have organic and sulpho-acid anions as their polar
groups and the cation do not partake in the reagent-mineral reaction. According to King
(1982) the collectors that fall into the anionic collectors group are the carboxylates
(fatty acids), alkyl suplhates, and certain chelating agents (sulphonates), presented in
Figure 13. (Wills 2006)
The hydrocarbon chain length quantifies how powerful the water-repulsion is produced,
the longer the hydrocarbon chain length is the more powerful the water-repulsion is. At
the same time, solubility decreases the power of the water-repulsion, excluding soaps
(the salts of fatty acids), are soluble even if the hydrocarbon chain length is long.
According to Marsden and House (2006) as the hydrocarbon chain length increases, the
collector strength and mineral recovery increase, but the selectivity decreases because
the minerals of lower initial hydrophobicity may also adsorb the collector. The
carboxylates are relatively strong types of collectors, but they have low selectivity. The
sulphates and sulphonates are rarely used. These types of collector have greater
selectivity, but have lower collecting power than fatty acids. (Wills 2006)
Figure 12. Attachment of a) anionic collector and b) cationic collector on the mineral
surface (Hukki 1964)

28
The most exploited type of collectors is the sulphydryls. In the sulphydryl, the polar
group contains bivalent sulphur (thio compounds). According to Avotins et al. (1994)
the sulphydryls are powerful and selective collectors in the flotation of sulphide
minerals. The most used sulphyryl anionic collectors are the xanthogenants (xanthates)
and the dithiophosphates (Aerofloat collectors). The xanthates are produced by reacting
an alkali hydroxide, an alcohol and carbon disulphide. Structure of sodium ethyl
xanthate is illustrated in Figure 13. (Marshden and House 2006, King 1982)
Figure 13. Structure of sodium ethyl xanthate The OCSS-group attaches irreversibly
to the sulfide mineral surface (Wills 2006)
The general formula of the xanthate (alkyl dithiocarbonate) ion is ROCS2 -, where R is a
hydrocarbon chain, shown schematically for sodium ethyl xanthate in Figure 13. The
solubilities of xanthates in water decrease from ethyl to pentyl xanthate. Yoon and
Basilio (1993) proposed that the reaction between sulphide minerals and sulphyryl
collectors is complex and many different mechanisms join the reaction. The principle
that xanthates adsorb on sulphide mineral surfaces is that chemical forces between the
polar group and the mineral surface react, resulting in insoluble metal xanthates, which
are strongly hydrophobic. (Marshden and House 2006, King 1982)
Dithiophosphates (DTP) are important collectors though they are comparatively weak
collectors (Wills 2006). DTPs are commonly used together with xanthates and DTPs are
more stable under acidic conditions than xanthates. DTPs give a lower recovery of
wanted sulphide minerals, but can give higher selectivity than the corresponding
xanthate. The dithiophosphates have pentavalent phosphorus in the polar group, as
shown in Figure 14. DTPs are selective for copper sulphide minerals. Using DTPs

29
combined with xanthates can give the more selective separation of sulphide minerals
than using only xanthates. (Marshden and House 2006)
Figure 14. Dithiophosphates (Wills 2006)
2.4.3 Cationic Collectors
Cationic collectors attach to mineral surfaces by their positively charged amine group,
as shown in Figure 15. The most used cationic collector group consists of amines.
According to King (1982) the cationic collectors used in the flotation industry are amine
and organic ammonium and pyridium salts, organic sulphonium, phosponium and
arsonium compounds. The amine group can attach to negatively-charged mineral
surfaces. The water-repulsion in the amines is produced by the cation where the polar
group consists of pentavalent nitrogen, as shown in Figure 15.
Figure 15. Cationic amine collector (Wills 2006)
The amines adsorb on the mineral surfaces by electrostatic attraction between the polar
end of the collector and the charged electrical double layer on the mineral surface.
Forces that cationic collectors produce are not as strong or irreversible as the chemical
forces of anionic collectors. (Wills 2006)

30
2.4.4 Frothers
Frothers are usually nonionic surface active molecules whose function in the flotation
system is to provide a large, stable air-water interface to ensure that the wanted mineral
remains in the froth when floated and the particle does not fall back into the flotation
pulp before it can be recovered to concentrate (King 1982). Frothers are added to
stabilize bubble formation in the pulp phase, to create a reasonably stable froth to allow
a selective flotation of the wanted mineral, and to increase flotation kinetics (Wills
2006).
A frother is added to the pulp before a flotation unit and desirable froth is achieved by
the following according to Marshden and House (2006):
Reducing the size of bubbles formed in the flotation pulp and create stabile the
froth
Amplify the approach of the bubble and the mineral particle
Making the water film thinner between the bubble and mineral particle until
rupture occurs
Establishing equilibrium contact
Attachment of an air bubble stabilized by frother and surface active mineral particle is
illustrated in Figure 16.
Figure 16. Attachment of surface active mineral particle and air bubble stabilized by
frother (Hukki 1964)
A good frother should not have any collecting power towards both sulphides and other
minerals and form a froth which is stable enough to recover the floated mineral to the

31
collecting launder. Froth should also burst when entering the froth collecting launder to
ensure that there are no problems from the froth in further process stages. A frother
should work equally well in an acid or an alkaline medium and be intensive to salts, also
in high concentration. A frother should not be affected by collectors used and must
readily emulsify and disperse any insoluble collector used.
According to Klimpel (1995) different frothers have different influence in the flotation
rate (K) and recovery (R). When the collector dosage is increased, while the frother
dosage is held constant, the flotation rate goes through a maximum and then decreased
in all particle size fractions. Klimpel also state that increasing the frother dosages
always cause less selective flotation with all the frother types.
2.4.5 Modifiers
Modifiers, or regulators, can be divided as:
activators
depressants
and pH modifiers
Modifiers influence the way the collectors attach to the mineral surface or may also
increase the adsorption of the collector onto a wanted mineral. Modifiers like
depressants prevent collectors from adsorbing onto a certain mineral surface. Basically,
modifiers make collector action more selective towards certain minerals. Pulp alkality
play a very important role in flotation and selectivity in complex separations is highly
dependent on the balance between reagent concentrations and pH. Same modifiers can
act differently between different mineral and collector combinations. (Wills 2006)
2.4.6 Activators
The main function of an activator is to enable the collector to adsorb onto the mineral
surfaces that they could not otherwise attach to. Activators modulate the chemical
nature of the mineral surfaces to hydrophobic due to the action of the collector, and
generally are inorganic compounds. Activators ionize in solution and are normally
soluble salts. The activator ions in the solution react with the mineral surface. (Wills
2006)

32
A classic example of an activator is copper sulphate (CuSO4). Copper sulphate is water
soluble salt which forms Cu (II) ions in the solution, and activates minerals such as
sphalerite (ZnS), pyrite (FeS2), pyrrhotite (FeS), stibnite (Sb2S3), and arsenopyrite
(FeAsS). The addition of sulfide ions used in flotation to activate carbonate and
oxidized and partially oxidized minerals are also called sulfidization. (Marshden and
House 2006)
Activators are added to the pulp before collectors to create the best possible conditions
for collectors to attach to the mineral surface (Marshden and House 2006). Roger’s
(1962) explains the phenomenon pseudodepression as follows: “adding too much
activator, the activator may precipitate the collector, the concentration of which may fall
below that is needed for good flotation." To prevent pseudodepression the amount of
activator requires careful control.
2.4.7 Depressants
Depressants are used to increase the selectivity of the wanted mineral in flotation by
modifying certain minerals to hydrophilic, in other words not floatable (Wills 2006).
Depressants act in a way which is the opposite to the use of activators.
King (1982) divides depressants into inorganic and organic compounds. By example of
inorganic depressant is cyanide (as sodium or calcium cyanide) which depresses the
sulphides of Zn, Cu, Ag, Cd, Ni and Sb because of the greater stability of the cyano-
complexes of these metals over the corresponding thiolates. The organic depressants are
usually natural products or modified natural products of high molecular weight and
contain numbers of strongly hydrated polar groups which are the basis of their ability to
depress minerals. King (1982) divides organic depressants into three groups, polyglycol
ethers, polysaccharides, and polyphenols.
Carboxymethylcellulose (CMC) and natural gums are the most well-known
polysaccharide depressants. CMC is mostly used to depress talc and natural gums to
depress talc and siliceous minerals. Gum Arabic, gum tragacanth and guar are the most
well-known natural gums used as depressants. (King 1982)

33
2.4.8 pH-Modifiers
Usually, the pH affects the surface chemistry of most minerals. Some minerals can have
a positive surface charge under acidic conditions and a negative charge under alkaline
conditions. Surface charge essentially affects the flotation chemical reactions. (Wills
2006)
According to King (1982) there are four kinds of reagents that are used as pH-modifiers,
lime, or slaked lime
soda ash
caustic soda (sodium hydroxide)
sulphuric acid
Marshden and House (2006) add two more groups to pH-modifiers, alkaline silicates
and alkaline phosphates.
The lime depresses iron sulfides, lead, marmatic zinc and certain copper minerals. The
lime depresses gold, but has a little effect on silver sulfides. Soda ash assists the
separation of sulphides from each other by dispersing gangue slimes from the surface of
minerals. Soda ash increases the recovery of arsenopyrite when used with copper
sulfate. The soda ash can assist the flotation of precious metals and sulfides. (Marshden
and House 2006)
Caustic soda disperses gangue slimes. With copper sulfate caustic soda activates
arsenopyrite. Caustic soda can have some assistance to the recovery of free gold.
Sulfuric acid assists the recovery of iron sulfides and is more effective after using
depressants like lime or cyanide. (Marshden and House 2006)
Sulfuric acid assists the recovery of gold in a dilute pulp and is less beneficial in thick
pulp. Alkaline silicates disperse gangue slimes and so increase the gold recovery and
grade. Using alkaline silicates brittle-type froth is formed. Alkaline silicates depress
quarts and silicates. Alkaline phosphates improve the grade particularly sulfide ores
which contain iron-oxide slimes. (Marshden and House 2006)

34
2.5 Flotation chemistry of gold
Free gold is generally easy to recover by flotation. Pure gold surfaces are naturally
hydrophilic, but less than a monolayer of carbonaceous cover in the gold surface can be
enough to modify the gold surface hydrophobic. Free gold can be recovered without the
collector addition due to the adsorption of hydrocarbons and deposition of sulphur,
which are dependent on the high electrical conductivity of gold, which endorse surface
electrochemical reactions to occur catalytically and selectively. (Marshden and House
2006, 422-423)
The only valuable mineral in the quartz-arsenopyrite-gold –mineralization of the Laiva
mine is gold. However the gold in Laiva mine is not only free gold, it is partly free gold
with a sulfide gangue and partly unliberated gold in a sulfide gangue, where gold is very
fine under 10µm. Other gangue minerals are shown in Table 1. The grade of gold in
Laiva ore is around 1 gram per ton. The gangue minerals in Laiva ore have no economic
value so the target is selectively recover the gold from the sulfide and silicate gangue.
The gold in the Laiva flotation process is impossible to recover without any gangue
minerals.
Like in Laiva mine gold is recovered together with sulfide minerals, where gold (Au)
and maldonite (Au2Bi) occur primarily as sub microscopic inclusions hosted by
arsenopyrite (FeAsS), quartz (SiO4) and lollongite, in other words iron arsenide, (FeAs2)
(Pratt 2010, Mäkelä 1984). Gold is found in sizes between 1 -50 micrometers
(Matikainen 2013).
Gold hydrophobicity is achieved by adding flotation collectors such as xanthates (X)
and dithiophosphates (DTP), dithiophosphinates (DTPI), mercaptobenzothiolates
(MBC). In Laiva mine used flotation chemicals are
potassium amyl xanthates (PAX)
sodium-diisobutyl dithiophosphinate (Aerophine 3418A)
ploypropylene glycol methyl ether (Dow Froth 250)
Collector chemicals are PAX and Aerophine 3418A and frother used is Dow Froth 250.
The mechanism how the hydrophobicity of the gold surface is achieved according to

35
Marshden and House (2006, page 422) is similar to that certain sulfides. Xanthate ions
are oxidized on the gold surface to form the neutral dimer dixanthogen (X2):
(EtX)2 + 2e ↔ 2EtX- ; E
0 =0.057 (V) (2)
(AmX)2 + 2e ↔ 2AmX-; E
0=0.159 (V) (3)
O2 + H2O + 2e ↔ 4OH -; E
0=0.401 (V) , (4)
where Et is ethyl (C2) alkyl group
Am is amyl (C5) alkyl group
The non-polar solution, (X2), forms an oily surface coating on gold surfaces, rendering
them hydrophobic. The conducting surface of the gold migitates the transfer of
electrons, sustaining the redox couple described by equations 2, 3 and 4, thus catalyzing
the otherwise slow oxidation of xanthate ions in bulk solution. The previous catalytic
oxidation of xanthate happens also on pyrite mineral surfaces, and has no selectivity of
gold flotation against pyrite. Cyclic voltammetry has also shown that gold can be
rendered hydrophobic by the deposition of a surface layer of sulphur from S2-and HS-
solutions (Walkeret al. 1984). Twenty monolayers of sulphur were required to produce a
hydrophobic gold surface. Increasing the hydrocarbon chain length of xanthate the
needed monolayer to achieve floatability in flotation is reduced, which reduces the
reagent addition requirements. (Marshden and House 2006: 422-423)
In flotation systems where collectors are used, the rate of flotation reaches a maximum
when the amounts of collectors are increased, and decreases after this maximum. The
flotation maximum depends on the used collector or collector types, and so it is
important to control the addition of collectors to the flotation system. The overdosing of
any surface-active reagents to the flotation system where free gold is floated can lead to
significant negative effect on the gold recovery and the concentration grade, because it
may increase the flotation of unwanted gangue minerals. It is a common way in the
flotation of free gold and gold associated with sulfides, to use dual-collector systems.
Also dual-frother systems are used when stable froth is difficult to achieve by using one
frother type. (Marshden and House 2006: 423)

36
2.6 Factors affecting the gold recovery in flotation
2.6.1 Liberation
The basic principle of effective gold flotation is that the gold particle is liberated, as free
gold grains, or in composite particles in minerals that are floatable, look Figure 17. In
composite gold particle, the dominant element or majority of the particles should be
some floatable mineral surface. When a composite particle consists of oxides or
silicates, then floatability would be lower and highly dependent on the particle surface
area and surface chemistry properties. (Marshden and House 2006: 423)
In order to separate the valuable mineral from gangue minerals, it is necessary to reduce
the particle size of minerals. Crushing and grinding are generally used to unlock or
liberate the valuable minerals from gangue minerals so that they are partially or fully
exposed.
Figure 17. Schematic representation of types of gold associated with sulfide minerals
(Marshden and House 2006: 44)
The process of size reduction is called comminution, shown in Figure 18. The
comminution process begins from the mining process and continues in crushing and

37
grinding. The comminution process will produce a range of particles with the varying
degrees of liberation. (Marshden and House 2006, page 423)
Figure 18. The action of comminution (Colpaert 2013)
2.6.2 Coating
The flotation recovery of gold is depending on the coatings in free gold particles and
coatings in composite particles that contain gold. Hydrophilic metal salts may have
adhered on the surface of particles containing gold, reducing the overall surface
hydrophobicity and may reduce the recovery of gold in flotation. Common coating is Fe
(III) oxides or hydroxides, which may be generated during ore formation, from iron
minerals in the ore or grinding media loss. Grinding media loss generally is between 0.5
and 1 kg Fe/t ore. In Laiva mine there is two autogenous mills which add iron to the
pulp from liner and ceiling loss. Silver and copper are more reactive than gold and so
they can form hydrophilic surface phases on gold particles. Gangue slimes decrease the
floatability of wanted minerals. Gangue mineral can be prevented from floating only if
the correct depressant be discovered. (Marshden and House 2006: 423-424)
2.6.3 Particle size and shape
Gold has high density (19,300 kg/m3), so the particle size has a notable effect on
recovery in flotation. Flotation is an effective process to recover gold between particle
sizes 20µm to 200µm. The finer particles have faster flotation kinetics than coarser
particles of gold. Gold particles smaller than 20µm cannot be so selectively recovered
by flotation because co-flotation of gangue minerals decreases the recovery of gold
although finer gold particles can be recovered more effectively by controlling the
gangue slime formation or with correct depressants. Coarser gold particles should be
floated in higher pulp densities to prevent particle sedimentation. Gold particles can be
flattened during grinding, but this makes the gold particle more floatable. (Marshden
and House 2006: 424)

38
2.7 Flash flotation
The flash flotation concept dates from the 1930s and the flash flotation cell is developed
from Maxwell or Denver unit cells (Lynch et al. 2010). The first modern flash flotation
cell became operational in 1982 at the Hammaslahti plant in Finland (Bourke 1995).
The basic operation of flash flotation is to “flash of” fast floating and liberated high
grade particles from the recirculating load in the grinding circuit. Since 1982, the flash
flotation system has been recognized as an advantageous technology to recover a
significant proportion of the valuable mineral in the milling circuit.
Generally, a flash flotation cell is used to remove coarse valuable minerals from the
milling circuits to increase the overall gold recovery, as shown if Figure 20. Benefits of
a flash flotation cell when used in milling circuits according to Marshden and House
(2006: 437):
reduced gold lockups in milling circuits
faster flotation of coarse particles
avoiding overgrinding of gold and sulfides
removal of coarse gold, which require long leach times
higher recovery over gravity concentration
A flash flotation cell acts both a classifier and a flotation device. Very coarse particles
and rocks go directly to the tailings of flash cell, while finer particles are transferred to
the mixing zone of the cell, where flotation phenomenon occurs, as presented in Figure
19.
There are a few separating factors between the flash flotation process and the other
flotation systems. The major design difference between a conventional flotation cell and
a flash flotation cell is the conical lower part for discharge. The design for inlet location
and the lower discharge part of the cell is optimized to handle the particularly coarse
particles in the flash cell feed. This coarse material is circuited directly to the conical
bottom discharge outlet and this prevents the coarse material disturbing the flotation
phenomenon, as shown in Figure 21. Air is added through the impeller shaft to form the
bubbles that carry the valuable hydrophobic particles to the froth eventually to the

39
concentrate launder. Feed material to the flash flotation is very coarse, normally the
underflow of a classifying cyclone and consists of a very high percentage of solids in
slurry. There is short residence time, typically under 3 minutes. Bypass of coarser
material is assisted by lower power input to the slurry from the impeller. Normally flash
flotation cells have very high feed rates. (Newcombe et al. 2012b, Mackinnon et al.
2003)
Figure 19. Schematic of a flash flotation cell, showing division of “flotation zone”
into mixing and settling zones (Modified from Newcombe et al. 2012b)
There is no conditioning tanks used in flash flotation circuits and so the contact with
reagents is limited. Reagents are added to the stream in two ways: all chemicals
simultaneously in the same spot in the process or separately in steps to different spots in
the process circuit. Generally, an activator or a collector is added before other chemicals
are added. The chemical addition is depending of the ore and used mineral processing
process. (Newcombe et al. 2012b)

40
Figure 20. Location of flash flotation in a typical grinding/flotation plant
(Newcombe et al. 2012a)
2.8 Flotation in Laiva site
The only valuable mineral in the quartz-arsenopyrite-gold –mineralization of the Laiva
mine is gold. Gold in Laiva mine is partly free gold and partly unliberated gold in a
sulfide and silicate gangue, where gold is very fine under 10µm. The grade of gold in
Laiva ore is around 1 gram per ton. The gangue minerals in Laiva ore have no economic
value so the target is to selectively recover the gold from the sulfide and silicate gangue.
It is impossible to recover the gold in Laiva without any gangue minerals. In Laiva mine
there is one flash flotation cell used for bulk flotation to maximize the recovery of all
minerals that contain gold.
The investigative work of a gold flotation is mostly of a free gold flotation or flotation
of gold-bearing sulfide minerals, but not both together. Laiva ore is a difficult case
when considering effective flotation because of the presence of the possible free gold
and composite mineral particles of gold-arsenopyrite, gold-loellingite, and gold-quartz.
When free gold is floated at the same time as the composite minerals there is
competition for bubble surface area to attach. Under conditions where free gold
flotation is optimized the sulfide associated gold particle recovery can be decreased.
41
Previous effect can aggravate in finer particle sizes under 10µm, because the relative
degree of hydrophobicity between different mineral particles is reduced. (Marshden and
House 2006, pages 424-426)
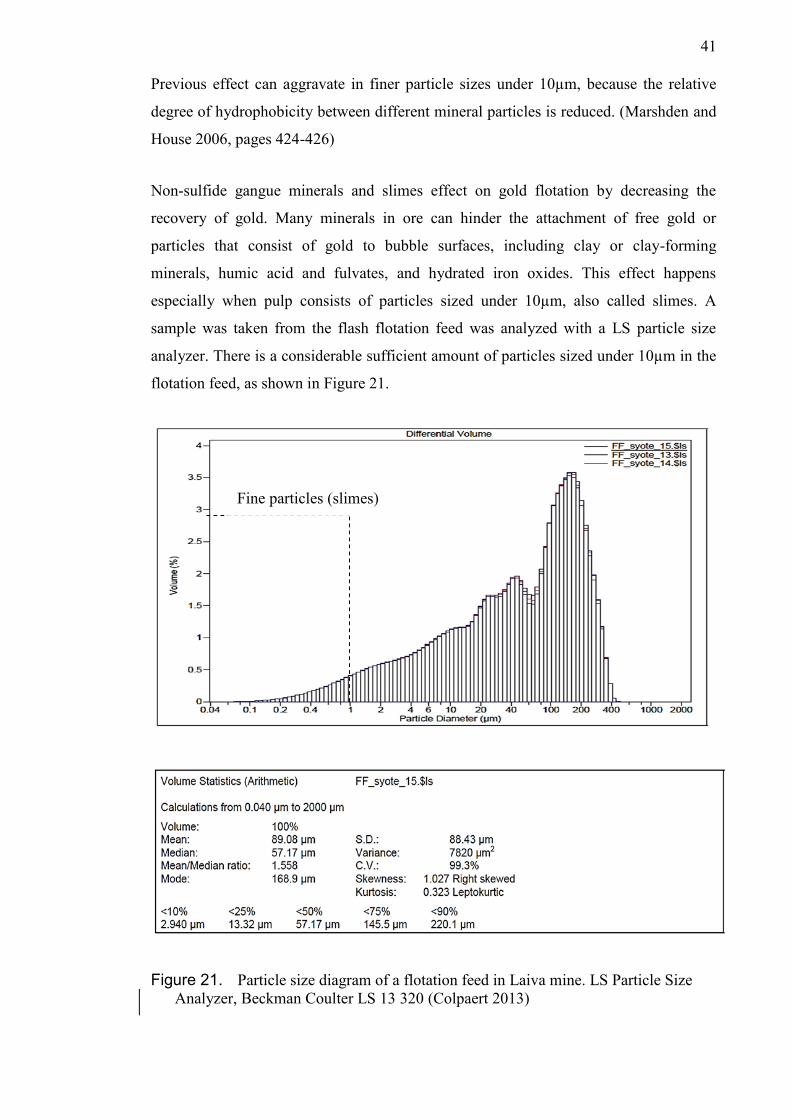
Non-sulfide gangue minerals and slimes effect on gold flotation by decreasing the
recovery of gold. Many minerals in ore can hinder the attachment of free gold or
particles that consist of gold to bubble surfaces, including clay or clay-forming
minerals, humic acid and fulvates, and hydrated iron oxides. This effect happens
especially when pulp consists of particles sized under 10µm, also called slimes. A
sample was taken from the flash flotation feed was analyzed with a LS particle size
analyzer. There is a considerable sufficient amount of particles sized under 10µm in the
flotation feed, as shown in Figure 21.
Figure 21. Particle size diagram of a flotation feed in Laiva mine. LS Particle Size
Analyzer, Beckman Coulter LS 13 320 (Colpaert 2013)
Fine particles (slimes)

42
This may indicate that slimes in the pulp of Laiva mine can have a negative effect on
the flotation recovery of gold. These slimes are entrained in the froth and occupy the
bubble surface by attaching to the bubble. Slimes can also coat particles and reduce the
floatability of the coated particle. In some cases, adding dispersants to the pulp before
flotation may have a positive impact on flotation rate and overall gold recovery.
Possible dispersants could be such as sodium polyacrylate, or sodium silicate. Adding
polyacrylate in amounts of (10 to 25 g/t), and sodium silicate (25 to 250 g/t).
Effects of dispersants should be carefully tested to know how the dispersants react with
other flotation chemicals and reagents. Soda ash can also assist the separation of
sulfides from each other by dispersing the gangue slimes, and aids recovery of
arsenopyrite when used with copper sulfate. The usual addition of soda ash is from (250
g/t to 1500 g/t). Sodium hydroxide with copper sulfate activates arsenopyrite and works
as a gangue slime regulator. Normal amount used is between (200 to 250 g/t). Alkaline
phosphates disperse gangue slimes particularly on ores containing iron-oxide slimes.
The usual addition of alkaline phosphate is between (100 to 250 g/t). Dispersants listed
earlier give some assistance to the recovery and selectivity of free gold and gold-bearing
sulfides in slimy ores. (Marshden and House 2006: 418-426)
Organic modifiers such as citric and oxalic acids could be beneficial for increasing the
gold recovery used in amounts of (200 to 300 g/t). Used with xanthate and DTPs
collectors for flotation on a copper-gold ores, showed over 10% benefit to gold recovery
according to Ketchum et al. (1993). Hydrocarbon oils, such as diesel oil or kerosene
added in amounts of (200 to 300) g/t has demonstrated to increase the gold recovery by
more than 25%. (Marshden and House 2006: 426)
A dual-collector flotation system is used in Laiva mine. The beneficial effect of
applying dual-collector schemes for the recovery of gold-bearing sulfides and free gold
is well known but poorly understood. In the Laiva mine for example, two collector
types are used. Potassium amyl xanthate (PAX) is added with sodium-di-isobutyl
dithiophosphinate (Aerophine 3418A). Generally, two collectors used yield higher
overall gold recovery, sometimes more than 20% higher, than in the case each is used
separately. The combined collector addition can be optimized in lower amounts than
required for either collector used separately. The addition order of these collectors has

43
significant effect on gold recovery. In Laiva flotation process (Aerophine 3418A) is
added before (PAX). (Marshden and House 2006: 426)
Copper sulfate (CuSO4) is used as an activator to promote free gold flotation, but the
exact role and mechanism is not fully understood. Copper sulfate increases the true
flotation of sulfides when added before PAX and decreases the free gold floatability,
and added after PAX copper sulfate increases the flotation of free gold but decreases the
flotation of sulfides. A copper sulfate added to pulp forms Cu(II) ions in the solution
which activate minerals such as sphalerite (ZnS), pyrite (FeS2), pyrrhotite (FeS), stibnite
(Sb2S3), and arsenopyrite (FeAsS). Adding copper sulfate to the process of Laiva mine
would be beneficial increasing the total gold recovery. Copper sulfate was tested in
batch flotation tests with Laiva ore and results gave a positive response to gold
recovery. Copper sulfate was also tested in the process plant and results were not so
articulate than batch test results were. Results are more discussed in the Chapter 5.
(Marshden and House 2006: 426)
Froth stability has a significant effect of gold recovery in a froth flotation system. Stable
froth is achieved by using frother chemicals. Particles can reach the froth layer by
different mechanism, true flotation and entrainment. In true flotation, a mineral particle
is carried into the froth, but attachment to an air bubble, and in entrainment a particle is
suspended in the water trapped between the air bubbles. Particles that are finer than a
few micrometers are recovered into the froth by entrainment at the same rate that the
water is recovered in the froth. So if 15% of water entering a flotation cell is carried into
the froth, then 15% of finer particles entering the flotation cell will be recovered in the
froth by entrainment. Coarser particles drain from the froth so the entrainments of
coarser particles are less than 15%. True flotation is selective between hydrophobic and
hydrophilic mineral surfaces, entrainment is not selective, and so entrained particles can
be any particles from the pulp. In some cases dual-frother systems are used to achieve a
more stable froth layer. For example, (pine oil) with (polypropylene glycol methyl
ether) may be beneficial. (Marshden and House 2006: 427)

44
2.9 Flash flotation cell in Laiva site
One flash flotation cell is used in the mineral processing plant in Laiva mine. The
flotation cell is made by Metso Minerals and the model is RCS 30, as shown in Figure
22 and Figure 23.
Table 2. Specifications of flotation cell (Metso maintenance manual 2011)
Figure 22. Photo of Metso flash flotation cell in Laiva processing plant
(Photo: Colpaert 2013)
Flotation Cell
Tank Diameter 3700 mm
Tank Height 5977 mm
Tank Volume 43,5 m3
Total Weight 12014 kg
Motor List
Rated Power 75 kW
Rated Speed 740 rpm
Manufacturer WEG
Model 315 S/M

45
Main components of the flash flotation cell are shown in Figure 23.
Figure 23. Metso flash flotation cell (Metso maintenance manual 2011)
The location of the flash flotation cell in the Laiva processing plant differs from a
conventional installation of flash cells. The installation in the Laiva processing plant of
the flash cell is illustrated in Figure 26. The function of the flash cell in the Laiva
process is to direct free gold and gold-bearing sulfides and other composite particles
that include gold in the high grade leaching feed. The high grade leaching feed consists
of a flotation concentrate and a spiral concentrate. Knelson concentrate is directed to the
spirals and is divided into discharge and concentrate, as shown in Figure 24.

46
Figure 24. Part of flowsheet of Laiva processing plant (Modified after Metso
Preliminary – Flowsheet 2011)
Reagents are added in two stages, first collector (Aerophine 3418A) is added to the
stream under the primary screen, as shown in Figure 26. Frother (Dow Froth 250) and
collector (PAX) is added to the feed box of the flash cell simultaneously, as shown in
Figure 26. The conditioning time is less than one minute with all chemicals added to the
pulp. There are residuals of flotation chemicals in the process stream, but the amounts
are difficult to estimate. Figure 25 shows the concentration froth from the flash flotation
cell at Laiva site.

47
Figure 25. A picture of the concentrate froth from the flash flotation at Laiva site
(photo: Colpaert 2013)
2.10 Flotation stabilization and optimization principles
Flotation is one of the most interactive mineral processing operations. The interactive
nature of flotation parameters makes the flotation process challenging to control.
Flotation is a process with many inputs and complex interactions and for example, poor
level set point tracking and disturbances in plant process streams have negative effect
on grades and recoveries from the flotation units. A successful stabilization of the plant
is the basics for the optimization of flotation.
Improved efficiency of flotation can be achieved by improved control in terms of
stabilization, regulation and optimization of the plant. The stable operation conditions in
the plant enable scoping the flotation process without any effects of disturbances and
fluctuations. When the stable conditions are achieved this allows for the optimum
conditions to be more easily identified. Only when proper stabilization of the plant and

48
the flotation inputs are achieved can the application of an optimizing strategy be
applied.
The first step towards better efficiency from flotation process is to check the installation
and design of the cell. All operations in flotation cell should work properly, for example
valves and measuring instruments, check the chemical addition pumps, air compressors
and any input lines to the flotation cell. Disturbances that have effect on flotation
efficiency are:
variations in feed rate
pulp density
particle size distribution, and
variations in mineralization
If the grinding circuit control is effective, variation in feed rate, pulp density and
particle size distribution is under control and the prime function of flotation control is to
compensate for variations in mineralization and floatability. The variables which are
controlled in flotation unit are:
mass flows
reagent addition rate
air addition rate
pulp level
froth level
pH
If the grinding circuit control is poorly controlled, this increases the disturbances and
makes the controlling of flotation challenging. (Wills 2006. pages: 320-322)
When optimizing a flotation process best practice is to establish the basic control
objectives, such as stabilizing control of the pulp and sump levels, air flow, and reagent
flows. After this more advanced stabilizing control can be done, such as pH, reagent
ratio control, pulp flow, circulating load, concentrate grade, and recovery. Finally, true
optimizing control and management can be done, such as maximum recovery at a target
grade. According to McKee (1992) higher level optimizing is not possible until stable

49
operation has been achieved. Figure 26 illustrates the hierarchy of flotation unit
optimization. (Wills 2006: 321)
Figure 26. The process control hierarchy (Colpaert 2013)
2.11 Optimization of the flotation process in Laiva site
The recovery of gold in high grade leaching is almost 100%, in normal conditions from
97% to 99%, and in low grade leaching the recovery of gold is between 70% and 85%.
The bigger amount of gold is directed to the high grade leaching circulation, the higher
may be the total recovery of gold.
The flotation chemical addition is controlled from the control room and the only way to
control the addition of flotation chemicals is to change the strike rate of the piston of the
chemical pump. The scale is from 0% to 100% of the full strike speed. One task of this
work was to integrate an adjustment to the operating system that shows how many
grams of flotation chemicals are added per ton of ore. There are no flow meters in the
chemical pumps or in the pipelines so the calculations were made manually. It is much
easier to control the flotation process when you know how much you are adding the
flotation chemicals.
The flash flotation cell in the Laiva processing plant it is a unique type of installation.
As a whole, the flotation unit is very difficult to control. There are no flowmeters in the
flotation feed, tailings or concentrate streams and also there are no samplers in these
streams. The only automatic sampler in the high grade circulation is in the high grade
leaching feed line. Control of the flotation is done manually by human operators, who
base most of their decisions on the visual appearance of the froth using “calibrated
eyeball”. In the control room there is one screen showing a live video from the top of
the flotation cell where the operator can see the froth surface, shown in Figure 27. The
Improving
performance

50
camera picture quality is rather poor and this leads to sub-optimal control, owing to
factors such as operator inexperience, or the inability to act in the right way at the first
sign of differences from the plant behavior.
Figure 27. A screen showing a live video from the top of the flotation cell where the
operator can see the froth surface (Photo: Colpaert 2013)
The feed rate to the flotation cell differs together with the ore intake of the plant and for
the plant operator it is almost impossible to keep up with this variation and maintain the
optimum conditions in the flash cell. The main problem comes when the ore intake to
the AG-mill is reduced and the flow rate reduces simultaneously to the flash cell, the
amount of needed flotation chemicals lead to the rapid increase of froth volume to the
concentration launder of the flash cell which causes problems further in the process. The
increasing volume at slurry is straining the slurry pumps and the power intake of the
slurry pumps increase to the upper limit, causing the pumps to stop. A flowmeter in the
flotation concentration line connected with automation connected with the flotation
chemical feed would prevent these pumps from falling.
The ore composition varies significantly and the demand of operating the flotation cell
effectively varies as well. There is no information on the quality of the material coming
through the plant and this makes the control of flotation even more difficult. Tools such
as the XRF (X-ray fluorescence) and XRD (X-ray diffraction) exist for on-line
measurement of mineral compositions, and these can assist in plant control, but these
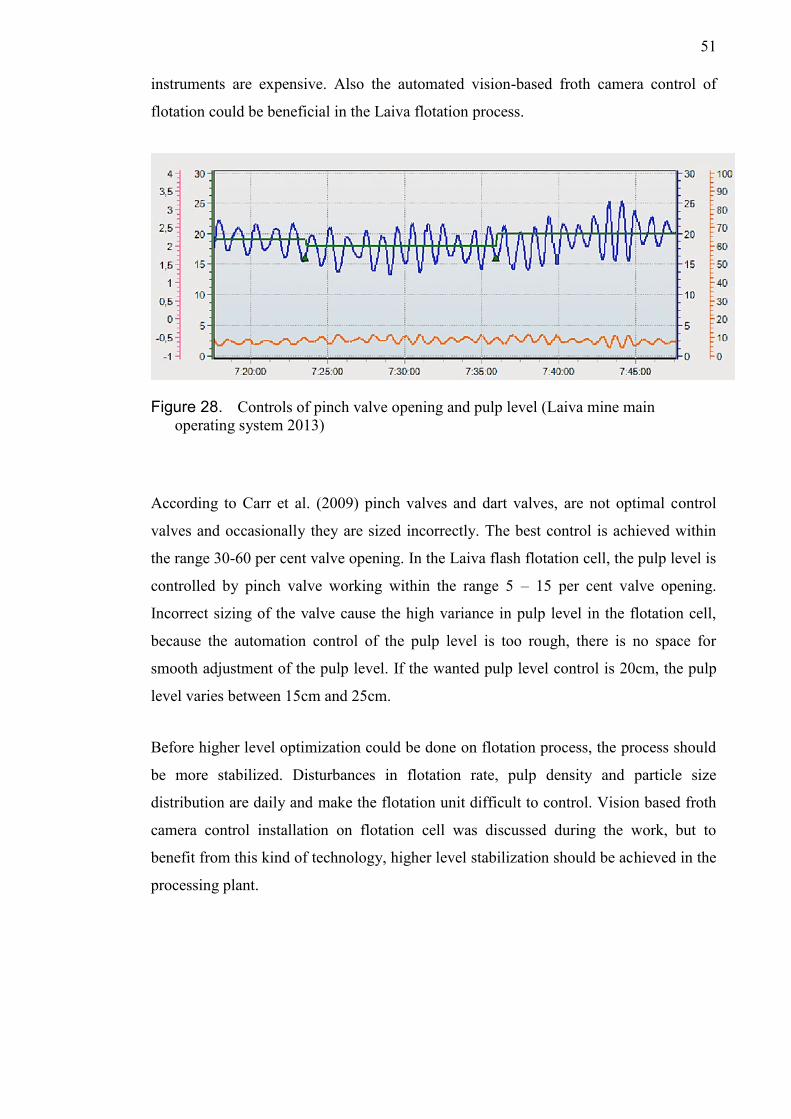
51
instruments are expensive. Also the automated vision-based froth camera control of
flotation could be beneficial in the Laiva flotation process.
Figure 28. Controls of pinch valve opening and pulp level (Laiva mine main
operating system 2013)
According to Carr et al. (2009) pinch valves and dart valves, are not optimal control
valves and occasionally they are sized incorrectly. The best control is achieved within
the range 30-60 per cent valve opening. In the Laiva flash flotation cell, the pulp level is
controlled by pinch valve working within the range 5 – 15 per cent valve opening.
Incorrect sizing of the valve cause the high variance in pulp level in the flotation cell,
because the automation control of the pulp level is too rough, there is no space for
smooth adjustment of the pulp level. If the wanted pulp level control is 20cm, the pulp
level varies between 15cm and 25cm.
Before higher level optimization could be done on flotation process, the process should
be more stabilized. Disturbances in flotation rate, pulp density and particle size
distribution are daily and make the flotation unit difficult to control. Vision based froth
camera control installation on flotation cell was discussed during the work, but to
benefit from this kind of technology, higher level stabilization should be achieved in the
processing plant.

52
2.12 Vision-based control of flotation
The appearance of the froth layer on the surface of a flotation cell contains useful
information which may describe the grade, mineral content, and recovery of the
valuable minerals in the concentrate (Moolman et al. 1995). The primary source of the
disturbances in froth flotation comes from the variation of ore quality. Similarly to
Laiva mine the ore is fed to the refinery as a mixture of many types of ore coming from
different parts of the mine pit. The variation in the mineral content of the ore causes
need for the continuous adjustment of flotation chemicals. Also under- or overdose of
flotation chemicals can be a secondary source of disturbances in the flotation process
because corrective control actions cannot be seen immediately.
Recent year’s visual inspection of the froth is used as the basis for flotation control.
Moolman et al. (1994, 1995), Oestreich et al. (1995) and Guarini et al. (1995) have
developed instrumental vision based methods for analyzing the properties of the froth.
Froth analyzers can be used to classify the froth by physical features, like the average
size, the size distribution and shape the parameters of the bubbles in the froth, froth
speed and color differences in the froth. The vision based froth analyzers are based on
the technology of statistical signal processing techniques like histograms, Fourier
transforms, power spectrums and gray level dependence matrices (Moolman et al. 1994,
1995b).
Key benefits that are achieved with vision based froth controller:
improved recovery
good control of concentrate grade
reduced consumption of flotation chemicals
operators available for other tasks

53
2.13 Gravity concentration and gravity circuit in the Laiva site
Before the development of a froth flotation process the gravity methods of separation
were primarily used for mineral separation processes. The simplicity of gravity
separation processes is one reason for the great popularity for mineral processing. Also
the gravity processes are environment friendly compared with the froth flotation
processes, because in gravity separation excessive chemicals are not needed. Gravity
processes are usually relatively cost efficient which still have good recoveries for
minerals. The increasing prices of the flotation chemicals have also influenced to re-
evaluate the opportunities for gravity processes. (Wills 2006: 225)
A gravity concentrator utilizes the differences in density of minerals in order to manage
separation. Also the size of the particle has an effect on the motion of the particle in
fluid; large particles will be affected more than finer particles. The efficiency of gravity
processes increases when particle sizes increase. Gravity concentrators may use natural
gravity, such as spirals. In a spiral concentrator, the denser materials flow down along
the inner section of the trough, and the less dense material flows along the outer section.
To improve the separation at the fine particle sizes, or in the low concentration of value
material, such as gold, a centrifugal force can be directed to the slurry, increasing the
gravitational force on the particles in slurry to improve the separation.
In Laiva site, a Knelson gravity concentrator is used with spiral concentrators, as shown
in Figure 26. A gravity circuit together with a flash flotation unit divides process flow
into the high-grade leaching. The purpose of the gravity circuit in the Laiva plant is to
collect coarse free gold, coarse sulfide bearing gold and other composite particles
containing gold to the high grade circuit. According to Wills (2006) sulphide minerals
should be removed before gravity concentration, because sulphides reduce the
performance of spirals and Knelson concentrator.

54
2.14 Knelson concentrator
Knelson- and Falcon concentrators are the main two centrifugal gravity separators that
are used in the mineral processing industry. LaPlante et al. developed the Gravity
Recoverable Gold (GRG) Test which is still in use today (Laplante et al. 1995a, 1995b
and 1996).
One Knelson concentrator, model KC-CVD64, is used in the Laiva process plant. The
patented Knelson Continuous Variable-Dischagre (CVD) concentrator was developed to
process ores that contain minerals that are able to collect by gravity concentrators, but
are not practical to collect with conventional batch-type gravity concentration methods.
The CVD concentrator can handle relatively large amounts of feed material compared
with conventional batch concentrators. A Knelson concentrator is placed in a partly
closed circuit to process the flotation tailings and discharge of the spirals and Knelson,
as shown in Figure 24. A Knelson is used to collect coarse free gold and coarse gold
associated sulfides to concentrate which is directed to the spiral concentration process.
A Knelson concentrator is a centrifuge device used to concentrate GRG. The standard
Knelson concentrator utilizes gravitational force in conjunction with a process of
liquefaction. The force of gravity separates particles based on their density. The main
components of the Knelson concentrator are a cone-shaped basin, an electric motor, and
pressurized water covering that envelops the basin, as shown in Figure 29.
Figure 29. Main components of the Knelson gravity cone (Knelson user manual
2011)

55
The selectivity and separation efficiency depending on the ore processed. In Laiva ore
mineralogical studies show that the gold is associated with sulphides, loellingite and
quartz. Compared with the sulphide and silicate minerals, the specific gravity of gold is
comparatively high (19.3 g/cm3). A small amount of gold in the composite particle can
change the specific gravity of the particle, so those particles can drift to the concentrate
of Knelson concentrator. The efficiency of separation in Knelson depends on the
differences of particle density and particle size. The efficiency of separation gets the
worse independent of density at the small particle sizes. Therefore, the Knelson
concentrate with relatively high gold content can be achieved using a Knelson
concentrator, yet provide a low recovery. Quartz particles that contain a little amount of
gold can show up in the tailings because of the low density of quartz.
Figure 30. Water and slurry circulation in Knelson concentrator (Knelson user
manual 2011)
Gravity separators are especially sensitive to the presence of gangue slimes, which
increase the viscosity of the slurry and decrease the sharpness of separation. Commonly,
particles under 10µm are removed from the gravity concentrator feed. Correct water
balance is also one of the most important aspects of gravity circuit operations. Gravity
concentrators have an optimum feed pulp-density and a relatively small error from this
optimum affects the separation efficiency. Accurate pulp-density control is there-fore
essential. (Wills 2006: 226 – 227)

56
Slurry feed is directed to the cone through a vertical feed tube on top of the machine and
slurry disperses radially on the cone wall when reaching the bottom of the cone (2). The
slurry continues to travel towards concentration ring and the g-forces that the particles
experience is depending on the rotor speed. The slurry starts to rotate on the wall of the
inner cone and grooves covered catches the heavier particles. Pressurized water is
directed through fluidization holes into the in the concentrate ring (1). The heavier
particles against the cone wall are captured into the concentrate bed, as shown in Figure
31. Pressured water from the fluidization holes prevents lower density particles
coagulating into the concentrate bed, and higher density particles sink on to the bed
concentration bed. The lower density particles continue out from the cone into the
tailings launder (3) and (4).
Figure 31. Operation of concentrate pinch valve (Knelson user manual 2011)
Pressured water from the fluidization holes prevents lower density particles coagulating
into the concentrate bed, and higher density particles sink on to the bed concentration
bed. The lower density particles continue out from the cone into the tailings launder (3)
and (4).
When, the concentrate pinch valve is closed the concentrate bed is forming and
pressured water fluidizes the bed. When pinch valve opens the concentration bed
formed is directed to the concentrate launder, as shown in Figure 32. The pinch valve
timing (open/close) varies depending on application. Increasing the pinch valve open
time produces the high recoveries of the low-grade concentrate. Decreasing the pinch

57
valve open time produces the low recoveries of high-grade concentrate. The entire
process is typically conducted with large amounts of slurry, and the machine is
sporadically cleaned out with water while the lighter particles leave the cone.
Figure 32. Operation of concentrate pinch valve (Knelson user manual 2011)
2.15 Spiral concentrator
In this chapter the principles of spiral concentration are introduced briefly and some
attention has given to spirals in Laiva site.
Spiral concentrators are used globally in many varied applications in mineral processing
industry, but they are mostly used in the separating of heavy minerals, especially coarse
gold. The Humphreys spiral was introduced in 1943 and it was the first application used
on processing chrome-bearing sands (Hubbard et al. 1953).
In Laiva site there is a spiral concentrators to process the Knelson concentrate. The total
number of spiral used in Laiva plant is 18. The spirals consist of an open through that
twist downward in helix configuration about a central axis. Slurry is fed on the top of
the spiral concentrator and the particles in the slurry are separated radially on the basis
of specific gravity and sizes of the particles as the slurry gravitates downward. Spiral
concentrators used in Laiva site is illustrated in Figure 33.
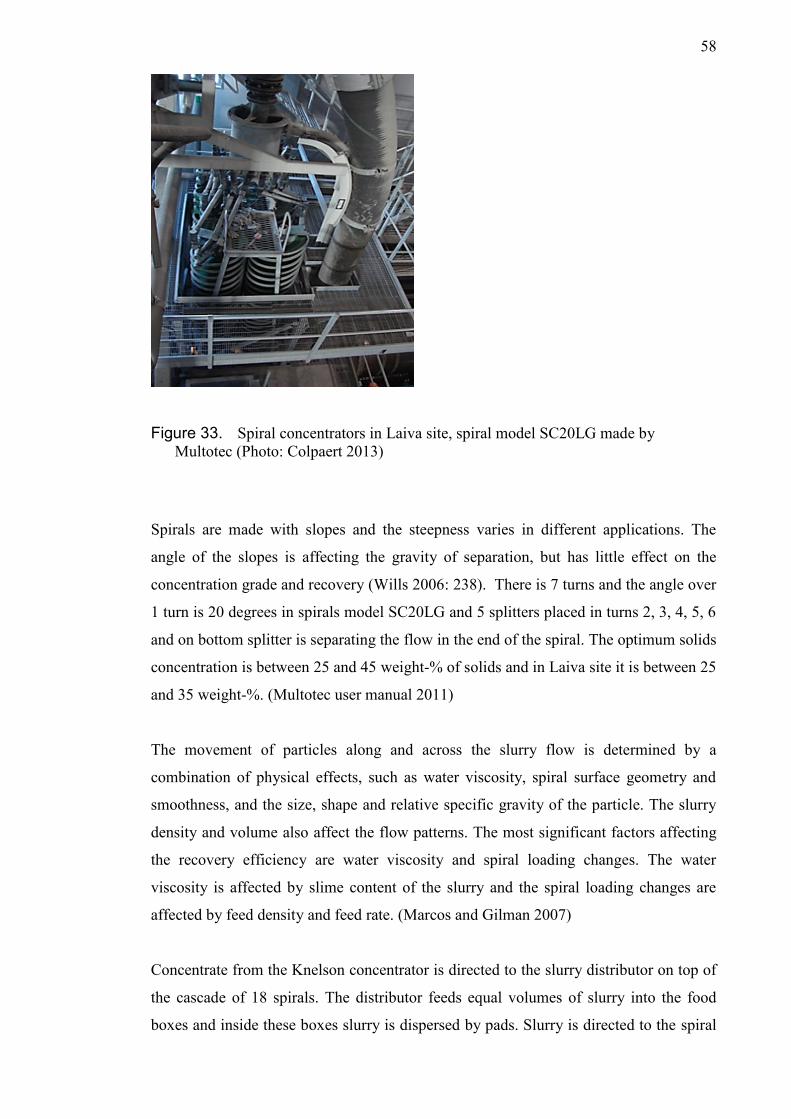
58
Figure 33. Spiral concentrators in Laiva site, spiral model SC20LG made by
Multotec (Photo: Colpaert 2013)
Spirals are made with slopes and the steepness varies in different applications. The
angle of the slopes is affecting the gravity of separation, but has little effect on the
concentration grade and recovery (Wills 2006: 238). There is 7 turns and the angle over
1 turn is 20 degrees in spirals model SC20LG and 5 splitters placed in turns 2, 3, 4, 5, 6
and on bottom splitter is separating the flow in the end of the spiral. The optimum solids
concentration is between 25 and 45 weight-% of solids and in Laiva site it is between 25
and 35 weight-%. (Multotec user manual 2011)
The movement of particles along and across the slurry flow is determined by a
combination of physical effects, such as water viscosity, spiral surface geometry and
smoothness, and the size, shape and relative specific gravity of the particle. The slurry
density and volume also affect the flow patterns. The most significant factors affecting
the recovery efficiency are water viscosity and spiral loading changes. The water
viscosity is affected by slime content of the slurry and the spiral loading changes are
affected by feed density and feed rate. (Marcos and Gilman 2007)
Concentrate from the Knelson concentrator is directed to the slurry distributor on top of
the cascade of 18 spirals. The distributor feeds equal volumes of slurry into the food
boxes and inside these boxes slurry is dispersed by pads. Slurry is directed to the spiral

59
through from the feed box and the slurry flows down the through by gravity force. The
particles with smaller specific gravity and size stay suspended in the water and are
drafted to the outer edge of the trough by centrifugal force created by the circular
movement, as shown in Figure 34.
The particles with higher specific gravity are drafted to the inner edge of the trough
where drag, created by friction slows them down. The 20 degrees sloped trough profile
forges these heavier particles to inner route of the trough. The five product splitters are
separating the heavier particles to the concentrate launder. When slurry reaches the
bottom of the spirals, the feed is completely separated into two different products,
concentrate and tailings. (Multotec user manual, Wills 2006: 237-238)
Slimes in the slurry cause decreased mineral recovery from spiral concentrators. Slurry
in Laiva includes slimes, particles under ten microns and according to Marcos and
Gilman (2007) often particles under 53 microns are defined as slimes. The slimes
increase the viscosity of the slurry and affect the movement of mineral particles.
Increasing slime content in the slurry increases the drifting of heavy mineral particles to
the tailings. Spiral feed consist of The Knelson concentrate the slime content may be
lower than in the main process stream. (Marcos and Gilman 2007)
Figure 34. Light particles in suspension travel outwards and heavy particles settle on
the through and slide inwards (Wills 2006)
Spiral cleaning is the most important task to maintain the efficiency from spiral
concentrator, because buildup of slimes and solid particles on spirals, especially in the

60
center of the spiral and on the product splitters disturb the slurry flow and reduce the
recovery of gold. Spirals require a clean surface to work efficiently. In Figures 35 and
39 are shown the condition of spirals when cleaning had not been done in on day.
Figure 35. One day without cleaning the spirals leads to total blockage of the product
splitter (Photo: Colpaert 2013)
Cleaning of the spirals is a time consuming and often difficult task to do, but it is vital
to do. In Laiva site cleaning of the spirals is made by toilet brushes and pressure washer
and the guideline is to clean the spirals in every shift. In Laiva the space between spirals
is really small and it makes the cleaning even more difficult, as shown in Figure 39. The
space between spirals and walking level was increased to help the cleaning, but it is still
overly hard to reach to all parts of the spirals.
Figure 36. Slimes are buildup in the center of the spirals disturbing the slurry flow
(Photo: Colpaert 2013)

61
3 EXPERIMENTAL STUDY
3.1 Introduction
The experimental program of this project was split into three parts. First different
collectors were studied for their properties and effects on gold recovery in flotation by a
laboratory scale batch flotation machine. During the literature review and benchmarking
other gold mines come up an idea that adding copper sulfate to the pulp might increase
the recovery of gold in flotation. The effect of copper sulfate was also tested with
laboratory scale batch flotation tests. The effects of flotation chemicals on carbon
activity were also tested in laboratory circumstances.
The second part of the experimental program involved applying the laboratory results to
the plant process. However before any laboratory batch flotation test the flotation
chemical flow rate control was implemented into to the process plant main control
system to see what amounts of flotation chemicals are used. After implementing the
flotation chemical control, some bottlenecking tests were done in the process plant and
limitations from the chemical addition rate were found. Copper sulfate was also tested
in the actual plant process.
The third part of the experimental phase was to discover the effects of manipulating the
variables in flotation and spiral concentrator to explore the effects on gold recovery.
Process workers had collected slurry samples from the flotation concentrate Knelson
concentrate and spiral concentrate flows from January 2013 until June 2013 and
analyzed for Au. Data from these samples were used to analyze the development of the
process plant. Mill production report was also used to study the effects from plant
optimization. Minitab 16 statistical software tool was used to analyze the results.
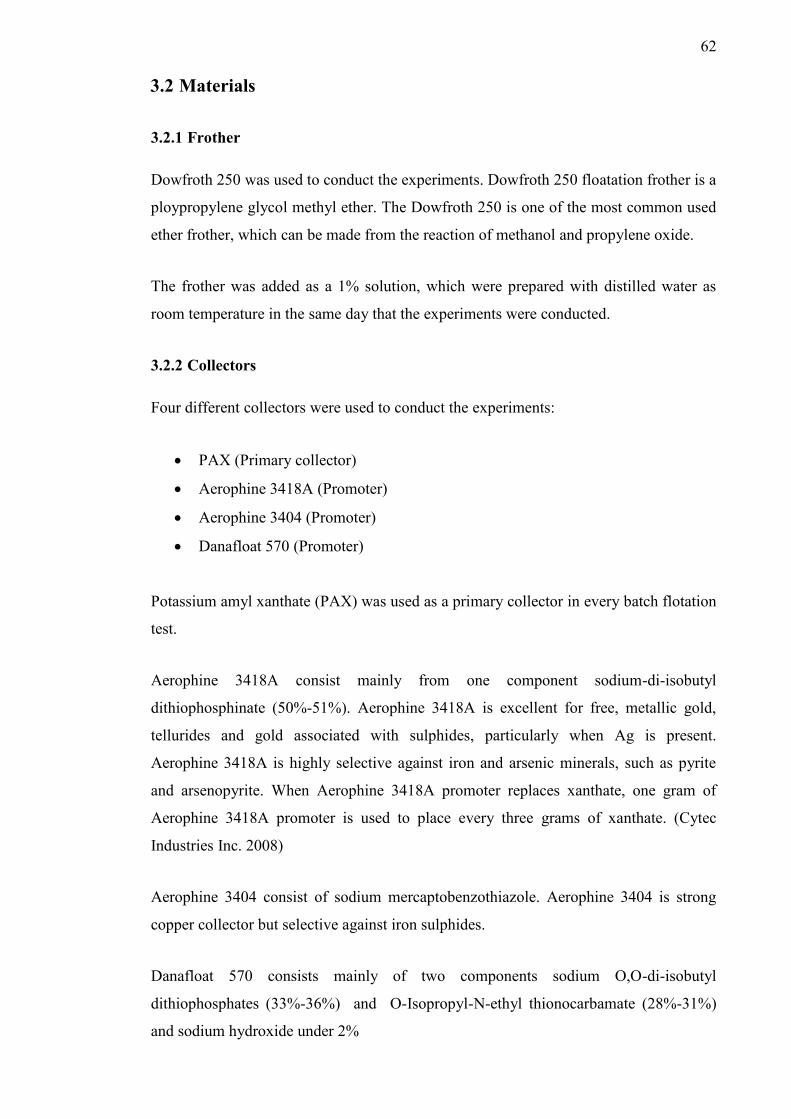
62
3.2 Materials
3.2.1 Frother
Dowfroth 250 was used to conduct the experiments. Dowfroth 250 floatation frother is a
ploypropylene glycol methyl ether. The Dowfroth 250 is one of the most common used
ether frother, which can be made from the reaction of methanol and propylene oxide.
The frother was added as a 1% solution, which were prepared with distilled water as
room temperature in the same day that the experiments were conducted.
3.2.2 Collectors
Four different collectors were used to conduct the experiments:
PAX (Primary collector)
Aerophine 3418A (Promoter)
Aerophine 3404 (Promoter)
Danafloat 570 (Promoter)
Potassium amyl xanthate (PAX) was used as a primary collector in every batch flotation
test.
Aerophine 3418A consist mainly from one component sodium-di-isobutyl
dithiophosphinate (50%-51%). Aerophine 3418A is excellent for free, metallic gold,
tellurides and gold associated with sulphides, particularly when Ag is present.
Aerophine 3418A is highly selective against iron and arsenic minerals, such as pyrite
and arsenopyrite. When Aerophine 3418A promoter replaces xanthate, one gram of
Aerophine 3418A promoter is used to place every three grams of xanthate. (Cytec
Industries Inc. 2008)
Aerophine 3404 consist of sodium mercaptobenzothiazole. Aerophine 3404 is strong
copper collector but selective against iron sulphides.
Danafloat 570 consists mainly of two components sodium O,O-di-isobutyl
dithiophosphates (33%-36%) and O-Isopropyl-N-ethyl thionocarbamate (28%-31%)
and sodium hydroxide under 2%

63
3.2.3 Modifier
Copper sulphate (CuSO4) was selected as activator for the flotation process. Copper
sulphate is water soluble salt which forms Cu(II) ions in the solution, and activates
minerals such as arsenopyrite (FeAsS).
3.2.4 Slurry samples for laboratory scale batch flotation tests
Used feed material in laboratory scale batch flotation tests was collected from the
process plant, using the discharge of the pebble mill. Samples were carefully taken and
trying to minimize the variation in collecting. The flotation chemical addition was
turned off three hours before collecting the samples for batch flotation tests to ensure
that the feed is free from flotation chemicals. Samples were poured through a sieve
system which allows only particle under 300 microns to drain in a 2 liter sample vessel.
Separating the particles over 300 microns from the batch flotation feed was essential
because particles over 300 microns plug the air pipe and also particles of that size settle
on the bottom of the mixing vessel of the flotation machine. Sample variation can be
seen in the Figure 40.
Figure 37. Variation in batch flotation test feed samples collected
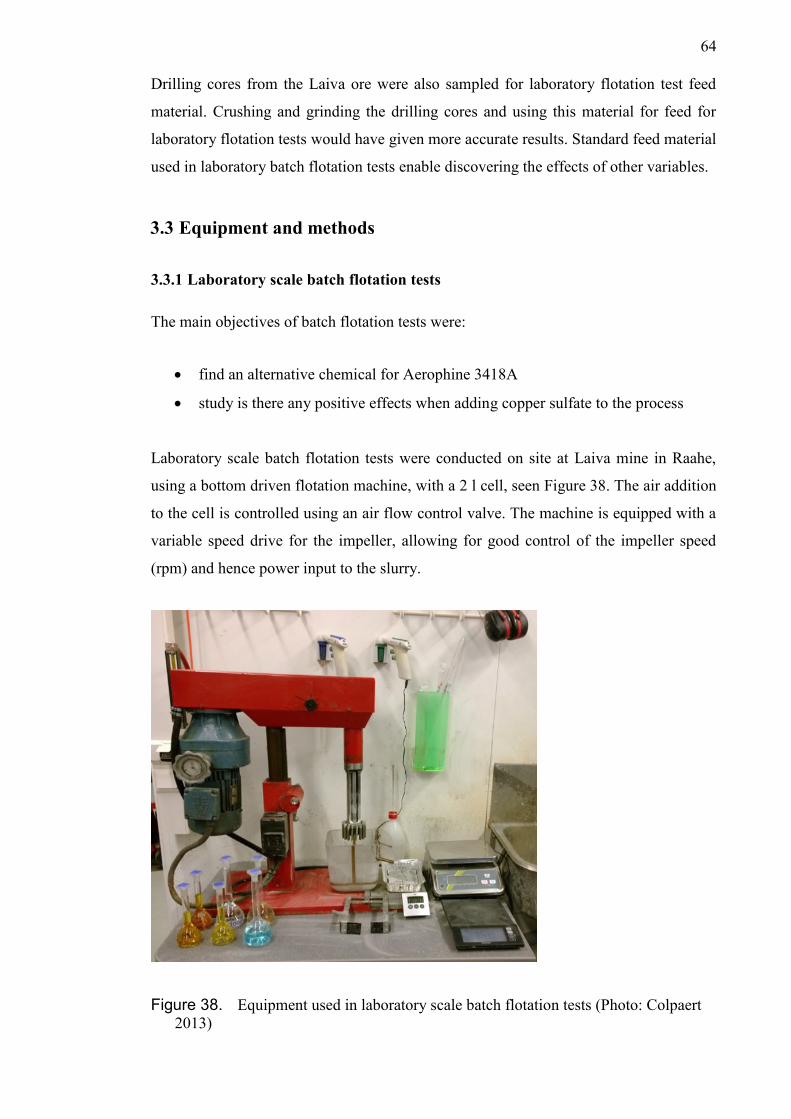
64
Drilling cores from the Laiva ore were also sampled for laboratory flotation test feed
material. Crushing and grinding the drilling cores and using this material for feed for
laboratory flotation tests would have given more accurate results. Standard feed material
used in laboratory batch flotation tests enable discovering the effects of other variables.
3.3 Equipment and methods
3.3.1 Laboratory scale batch flotation tests
The main objectives of batch flotation tests were:
find an alternative chemical for Aerophine 3418A
study is there any positive effects when adding copper sulfate to the process
Laboratory scale batch flotation tests were conducted on site at Laiva mine in Raahe,
using a bottom driven flotation machine, with a 2 l cell, seen Figure 38. The air addition
to the cell is controlled using an air flow control valve. The machine is equipped with a
variable speed drive for the impeller, allowing for good control of the impeller speed
(rpm) and hence power input to the slurry.
Figure 38. Equipment used in laboratory scale batch flotation tests (Photo: Colpaert
2013)

65
All batch flotation tests were done on the same day that the samples were gathered to
avoid oxidization and agglomeration in samples used. The actual temperature of the
slurry in the process is around 40ºC, but the slurry cooled to 25ºC during the day. After
each test, the produced concentrate was weighted with all solids and water and then
dried and weighted again the solids. The same procedure was done also to the material
left to the flotation cell after flotation was completed. All concentrations were assayed
for Au. Feed material what was left to the flotation cell, also assayed for Au in every
test accomplished.
2 liter flotation cell was used in every test run and the height of the lip where froth can
flow to the collection vessel is 2 cm. The agitator speed used in every test was 1800rpm
and the air flow was 7 l/min. Value of pH was 9.1 in every sample collected and particle
size distribution D80 was 125µm ± 10µm. The specific test procedure is shown in Table
5.
Used chemicals in batch flotation tests were Dow Froth 250 (frother), PAX (primary
collector), copper sulfate (activator), and several secondary collectors or promoters were
Danafloat 570, Aerophine 3404, and Aerophine 3418A.
Feed was conditioned for 2minutes before adding firstly tested promoter (Aerophine
3418A, Aerophine 3404 or Danafloat 570) and conditioned for 1minute. Second added
chemical was PAX and also conditioned for 1 minute and last Dow Froth was added
and froth was scraped for 1 minute in 5 second sequences. Copper sulfate was added 5
minutes before any other chemicals were added.
Used dosages were selected respecting the limitations from plant bottlenecking
conducted before laboratory batch flotation tests.

66
Table 3. Flotation test procedure
3.3.2 Flotation recovery calculations
% Metal Recovery (R%) or the percentage of the metal in the original feed that is
recovered in the concentrate can be calculated using weights and assays from the Feed
(F), Concentrate (C) and Tailings (T).
By weights F and C, plus assays c and t, recovery % can be calculated from equation
(5).
R = 100% x Cc / (Cc+t(F–C)) = recovery%, (5)
where R is metal recovery %
F is feed weight-%
f is % grade in feed
C is concentrate weight-%
c is % grade in concentration
T is tailings weight-%
t is % grade in tailings

67
3.4 Plant copper sulfate test
Using a copper sulfate as activator was tested to the plant after laboratory batch flotation
tests showed positive effect on gold recovery. Also theory review supported the usage
of copper sulfate as activator to increase the gold recovery in flotation.
Copper sulfate solution is made in the Laiva sight and is used in detoxifying tanks.
Copper sulfate prepared in Laiva sight has the concentration of 10% in solution and this
premade solution was used in the plant test.
1000 liter tank was used as storage tank for the copper sulfate solution and the copper
sulfate was added to the plant stream by a chemical pump, equipment is shown in
Figure 39.
Figure 39. Equipment used in copper sulfate adding to the plant stream (Photo:
Colpaert 2013)
The flow rate of copper sulfate added to the stream was 15 l/h. In the first test copper
sulfate was added to the pebble-mill discharge box and in the second test copper sulfate
was added to the pebble-mill feed.
First copper sulfate test took 16 days and copper sulfate was added two shift in a row
and then three shifts without copper sulfate. Second test was to add copper sulfate three
days in a row and then three shifts without.

68
Collecting samples before and during the copper sulfate adding was done to explore the
effects on gold recovery in flotation. Samples were collected from the feed, underflow
and concentration streams of the flash flotation cell. Also the daily mill report was used
to find the effects of copper sulfate adding.
The feed, underflow and concentrate of the flash cell were assayed for Au and particle
size distribution was examined.
Copper was analyzed from the LG feed and HG feed doing copper analyze from the
solution and solids to see where the added copper is drifted.
3.5 Effect of the flotation chemicals to carbon activity
When gold recovery from flotation and gravity circulation increases (more gold to the
HG CIL) the LH CIL recovery decreases, like seen in Figure 40. This may indicate that
more coarse particles that contain gold are going to the HG circulation where one ball
mill grind the particles smaller and increases the level of liberation.
Figure 40. LG CIL recovery% and Au to HG CIL% in the same graph
(Nordic Mines Oy. 2013)
Increasing the addition rate of the flotation chemicals to the plant seemed to increase the
recovery of gold in flotation unit. Some portion of flotation chemicals is going to the

69
tailings of flotation unit and to the LG CIL tanks. The effects of the flotation chemicals
to carbon activity were examined to understand how they effect to the carbon activity to
adsorb gold.
The test was made using a new Pica carbon. The test was “bottle rotating” test using 1
liter bottle and 5 grams of new carbons was added with solution which contains 5ppm
of gold. Four 10 ml samples were taken after 0, 15, 30, and 60 min from the start of the
test. Three samples were tested simultaneously. Sample No 1 was pure from flotation
chemicals, Sample No 2 was added 1ml Dow Froth 250, 1ml PAX, and 1ml Aerophine
3418A and Sample No 3 was added 3 ml the same chemicals that in the Sample No 2.
Sample No 1 was used as a reference sample for the two others. The results from the
test are show in the Chapter four.
3.6 Upgrading a flotation chemical flow rate control
Upgrading a flotation chemical flow rate control, which shows how much chemicals are
added comparison with the tonnage of processed ore, was essential for this work and
more beneficial for the company. This task had to be done first in the beginning of the
experimental phase. There was no information for the plant operator to see how much
flotation chemicals are added to the process. The only way for the process operator to
control the flotation cell was to look from the screen picture from the top of the flotation
cell and use his/her “calibrated eyeball”, looking the flow rate to the HG CIL slurry
concentrator and regulate the percentage of a chemical pump piston rate. All the plant
operators had learned to control the flotation process surprisingly good considering the
circumstances, but this leads to a sub-optimal control.
The chemical pumps did not include a flow meter so the parameters for the flow control
had to be calculated manually from the end of the chemical addition line. The
parameters were calculated taking time how many seconds it takes to fill 100 ml
measuring cup. The piston strike length was adjusted to 40% of the maximum length in
Aerophine 3418A and Dow Froth 250 chemical pumps and in PAX pump to 75% of the
maximum piston strike length. Then time what takes to fill 100ml measuring cup was
taken three times and taking the measurements with 10%, 20% and 30% of the
maximum piston strike speed.

70
After calculations, the created parameters show how much is the chemical flow to the
process with the certain speed rate of the chemical pump piston. When, this was
completed the parameters were used to upgrade flow rate control compared with the ore
feed rate to the mill, showing how many grams of each chemical are added to the
process compared with the ore intake tonnages (g/t).
3.7 HG-CIL feed optimization
After applying flotation chemical flow rate control to the main operating system of the
plant we started testing different chemical dosages and mixtures. Intention of was to
explore the response of flotation in different chemical mixtures and find any limitations
and bottlenecks in the process.
Variables manipulated in flash flotation unit were:
pulp level
froth level
reagent addition rate and mixture
air addition rate
Splitter opening sizes from the spiral concentrator were changed during the
experimental program.
Process workers had collected slurry samples from the flotation concentrate, Knelson
concentrate and spiral concentrate flows from January 2013 until June 2013 and
analyzed for Au. Data from these samples were used to analyze the development of the
process plant. Mill production report was also used to explore the effects of plant
optimization.

71
3.8 Minitab 16 statistical software tool
Minitab 16 was used to analyze the data from HG CIL feed optimization and produce
most of the figures shown in this work.
An ANOVA table is the analysis of variance, and is a test for difference in means. So
we have the null hypothesis and alternative hypotheses:
Null hypothesis, H0: The means between treatments are equal.
Alternative hypothesis, H1: At least one of the means is not equal to the others.
In a one-way ANOVA there are some assumptions which should be met. According to
Kubiak and Benbow (2009) these are:
The data should be normally distributed, at least approximately.
Homogeneity, this means the variances for each population should be equal.
The population should be independent of each other.
The box plot uses high and low values of the data as well as the quartiles. This is
illustrated in Figure 41.
Figure 41. Box plot with key points labeled (Kubiak and Benbow 2009)

72
4 RESULTS
4.1 Results of laboratory scale batch flotation tests
The results of the batch flotation tests give some information on the efficiency of tested
chemicals. The variance in the feed material may cause the disturbances in the recovery
and lowering the scientific value of the results. To achieve more accurate results feed
material should be manufactured from the beginning crushing and grinding, for example
from the drilling cores from the ore. Nevertheless some conclusions can be made based
on these batch flotation tests. The target for these flotation tests was to explore the
differences between selected flotation chemicals.
Table 4. Results of laboratory scale batch flotation tests

73
Figure 42. Results of batch flotation test series A, B, C and D
Figure 42. shows that there is no significant difference between tested chemicals in
series B, C and D except Aerophine 3404 is superior in test number two with dosages
2ml (13,8 g/t). Using only frother and PAX gave better results in amounts of 2 ml and 4
ml which may indicate that in test series C and D there is too much collector present and
it decreases the recovery of gold. Frother with PAX in amounts of 3ml gave the best
recovery of gold in series A, B, C and D. Notable result is also teat O1 where is only
Dow Froth 250 in dosages 4,5 g/t and it gives the recovery of 60% when

74
Figure 43. Results of batch flotation test series B, C and D
Figure 43. shows the difference between chemicals Aerophine 3418A, Aerophine 3404
and Danafloat 570. Aerophine 3404 was superior in dosages 2ml and Danafloat 570 in
dosages 3ml. According to Cytec Aerophine 3818A is selective against arsenopyrite and
this may explain the lower recoveries of gold. Also both Aerophine promoters are very
strong collectors and the reduction of gold recovery in higher dosages can be explained
by overdosing the collector.
Aerophine 3404 had the lowest characteristics to produce froth and Danafloat 570 the
highest of these three promoters. Aerophine 3418A is the most expensive of these three
promoters and also the availability from the market is the poorest. Danafloat 570 is the
cheapest flotation chemical of these three and availability is good.

75
Figure 44. Results of batch flotation test series B and E
Figure 44. shows the effect of copper sulfate to the recovery of gold. Figure 45 shows
that adding copper sulfate has a clear response to the gold recovery. Copper sulfate was
added in in amounts of 28.9 g/t.
Copper sulfate activates the arsenopyrite and in Laiva ore gold is associated in
arsenopyrite. Aerophine 3418A is selective against arsenopyrite and Figure 47 supports
the argument that Aerophine 3418A is selective against arsenopyrite because
arsenopyrite covered with copper ions enables the Aerophine 3418A collector to attach
on the mineral particle where arsenopyrite is present. Aerophine 3418A is very selective
towards copper and copper activated minerals. Combined with the pH of 9, pyrites will
not float well.
Copper sulfate increases the recovery of gold when using Dow Froth 250, PAX and
Aerophine 3418A with approximately 5,39%, which can be seen from Table 5.

76
Table 5. One-way ANOVA: Serie B versus Serie E
Figure 45. Results of batch flotation test series B, C, D and E
Adding copper sulfate gave the highest recoveries of gold compared to other tests where
copper sulfate was not included. This also indicates that adding copper sulfate increases
the recovery of gold.
According to Wills (2007: 322) increase in collector dosage increases mineral recovery
until a plateau is reached, beyond this maximum further addition may either have no
practical effect, or a reduction in recovery may occur. The gangue recovery also
increases when increasing the collector addition and selectivity is then reduced.

77
Figure 46. Results of copper sulfate test
Figure 46. illustrates the effect of different amounts of added copper sulfate to the feed.
Adding approximately 30 g/t gave the best recoveries of gold. In every test Dow Froth
was added in amounts of 1ml. PAX 2ml and Aerophine 3418A 2ml.

78
4.2 Results of carbon activity test
The results show that the carbon activity is affected by flotation chemicals, reducing the
activity of carbon used to adsorb gold in leaching. The results are shown in Tables 6 and
in Figures 47 and 48.
Table 6. Results A of carbon activity test
Time
(min)
Sample 1
Au (ppm)
Sample 1
Au in
Carbon
(g/t)
Sample 2
Au (ppm)
Sample 2
Au in
Carbon
(g/t)
Sample 3
Au (ppm)
Sample 3
Au in
Carbon
(g/t)
0 4,91 4,84 4,80
15 1,96 584 2,60 442 3,10 338
30 0,89 787 1,69 616 2,48 456
60 0,20 913 0,78 787 1,74 595
The flotation chemicals have an impact on carbon activity. Adding floatation chemicals
reduce the carbon activity and its capability to adsorb gold as shown in Figure 47.
Results indicate that the flotation chemicals reduce the kinetics of carbon to adsorb the
gold.
Figure 47. Results of flotation chemical effects on carbon activity

79
Figure 48. Results of carbon activity test
Increasing the amount of the flotation chemicals reduce the activity of carbon in leach,
as shown in Figure 48. When increasing the dosages of the flotation chemicals the
recovery in flash flotation cell increases, but this increases also the quantity of flotation
chemicals are directed to the LG CIL which may reduce the adsorbed amount of gold in
LG CIL.

80
4.3 Results of plant copper sulfate tests
Used equipment in plant copper sulfate test allowed only 5g/t addition of copper sulfate
to the process because of the chemical pump limitations. Used chemical pump allowed
maximum flow of 10 l/min. Copper sulfate test did not shown any major increases in
gold recovery in the flash flotation cell in Laiva process plant. Also these quantities of
copper sulfate did not show any major response to gold recovery in laboratory scale
batch flotation tests. However some observations were done.
When copper sulfate addition was started to the plant the froth surface decreased
and almost disappeared, this indicates that more minerals were entering froth.
This phenomenon was fixed with adding more frother.
The color of the froth also changed to more dark after adding copper sulfate.
Using a copper sulfate as an activator this would promote the flotation of gold bearing
sulfates, especially gold associated with arsenopyrite. The copper sulfate would also
promote the flotation of many unwanted impurities like arsenic compounds and make
the process more environmental friendly.
81
4.4 Results of flotation chemical flow rate control implementation
Flotation chemical addition flow rate control was made and implemented in the process
plant main operating system, as shown in Figure 49. This upgrade to the operating
system worked as a base for the whole experimental work.
Figure 49. Implementation of flotation chemical flow rate (Operating system of Laiva
mine)
Before implementing the flow rate control for the flotation chemical addition to the
process the amount of chemicals was unknown. The controls of the flotation chemicals
were made based on the outlook of the froth looked from the camera on top of the
flotation cell. After the flow rate control was implemented into the main operating
system the basic adjustments for the flotation chemicals addition could be started.
An automatic air valve was broken and could be used only opened to 100%. The control
of the air addition rate was controlled by changing the power of the air compressor.

82
4.5 HG-CIL feed optimization
4.5.1 Gold percentage to HG-CIL tanks
Table 7. Means and standard deviations for Au in HG (%) from January 2013 to
September 2013 (Nordic Mines Oy. 2013)
Table 8. shows the means of the HG CIL feed concentrations from January 2013 to
October 2013. Data is approximately normally distributed as shown in Figure 50.
Figure 50. Residual plots for Au in Hg (%) from January 2013 to September 2013
(Nordic Mines Oy. 2013)

83
Figure 51. Boxplot of Au in HG (%) from January 2013 to September 2013
(Nordic Mines Oy. 2013)
The combined gold recovery increased after May when flotation chemical addition
control was implemented to the plant operating system. Flotation chemical addition was
increased and the mixture of chemicals was changed. Froth level was degreased from
25cm to 15cm to promote rougher particles to enter the froth collecting launder. Results
can be seen from the Figure 51.
The increased recovery was maintained even though the head grade of gold was
reducing after June 2013, as shown in Figure 54. Remedial actions to compensate the
head grade reduction were to increase the spiral concentrator product splitter opening.
RFS = ((HGR + HGRT) / (HGR + HGRT + LGR + LGRT)), (6)
where HGR is gold recovered from HG leaching
HGRT is gold in total HG tails
LGR is gold recovered from LG leaching
LGRT is gold in total LG tails

84
4.5.2 Total recovery of gold
Rtot AugRtot JulyRtot JuneRtot MayRtot AprRtot MarRtot FebRtot Jan
95
90
85
80
75
70
Re
vo
ve
ry (
%)
Boxplot of total gold recovery (%) of acting plant from Jan. 2013 to Aug 2013
Figure 52. Results of total recovery of gold from January 2013 to August 2013
(Nordic Mines Oy. 2013)
Figure 51 shows the improvement of recoveries from flotation cell and gravity circuit
which might have effect on total recovery of gold. Figure 54 shows that the mean value
of head grade has been approximately 1,10 g/t in March and the mean value of total
recovery has been 86,7 %. In May mean value of total recovery was 87,9% though the
mean value of head grade was 1,076 g/t. In June and July the total gold recoveries have
been higher though the head grades have been lower than in March. In July the mean
value of head grade was 0,831 g/t and the mean value of total recovery is 86,95%
higher, still higher than in March. In September 2012 mean value of head grade was
0,87 g/t and then total recovery of gold was 83%. It seems according to these results that
improvement in recoveries from flotation cell and gravity circuit has positive effect on
total gold recovery. It is hard to calculate the improvement of total gold recovery but
according to these results it is several percentages. More unliberated gold is directed to
the HG circuit the ball mill grinds the particles smaller and draws the level of liberation
higher. Figure 54 shows that there is notable decrease of gold grade in solids of LG tails
which may explain partially the improvement of total recovery.

85
Table 9. Means of total gold recoveries from January 2013 to August 2013
(Nordic Mines Oy. 2013)
Table 8 shows the means of total gold recoveries from January 2013 to August 2013.
Figure 53 shows that the data is normally distributed.
100-10
99,99
99
90
50
10
1
0,01
Residual
Pe
rce
nt
8886848280
10
0
-10
Fitted Value
Re
sid
ua
l
840-4-8-12
80
60
40
20
0
Residual
Fre
qu
en
cy
Normal Probability Plot Versus Fits
Histogram
Residual Plots for total gold recoveries from Jan. 2013 to Aug 2013
Figure 53. Residual plots for total recoveries of gold from January 2013 to August
2013 (Nordic Mines Oy. 2013)

86
4.5.3 Gold grade in LG tails
SepAugJulyJuneMayAprMarFebJan
0,4
0,3
0,2
0,1
0,0
Au
in
so
lids (
g/
t)
Boxplot of Au grade (g/t) in solids of LG tails
Figure 54. Data of Au grade in solids of LG tails from January 2013 to September
2013 (Nordic Mines Oy. 2013)
Figure 54 shows that that the gold grade in solids of LG tails is decreasing notably in
May and even more in July and August. Starting from May a higher percentage of gold
was directed to the HG circulation and this may indicate that more unliberated gold was
directed throw a ball mill decreasing the particle size of the feed and this raise the level
of liberated gold, look Figure 51.
In May product splitter of the spiral concentrator were adjusted to 35mm. In July the
splitter openings were increased to 45mm and in August to 55mm to increase the
amount of coarse particles directed to the HG circulation. Goal was to increase the
amount unliberated gold particles to enter Hg circulation and processed with ball mill to
decrease the particle size increasing the level of gold liberation. Look Figure 63 where
the feed volume is illustrated from January 2013 to August 2013.
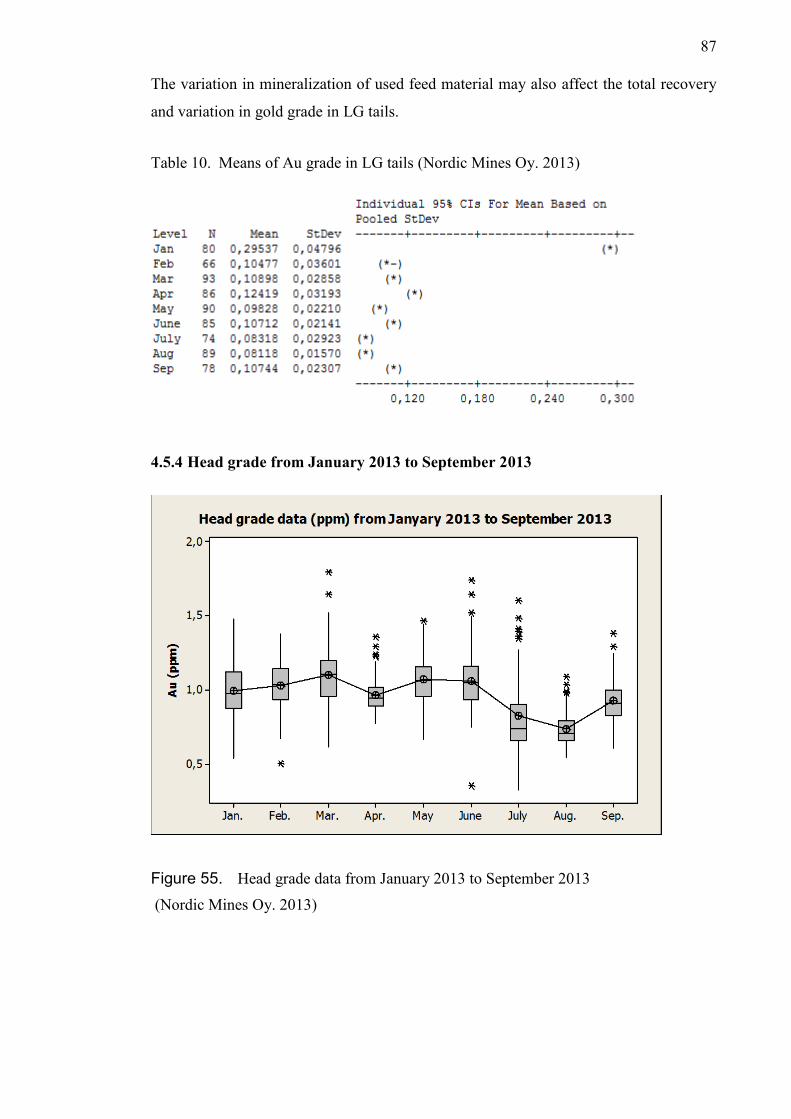
87
The variation in mineralization of used feed material may also affect the total recovery
and variation in gold grade in LG tails.
Table 10. Means of Au grade in LG tails (Nordic Mines Oy. 2013)
4.5.4 Head grade from January 2013 to September 2013
Figure 55. Head grade data from January 2013 to September 2013
(Nordic Mines Oy. 2013)

88
Head grade is approximately 1 g/t from January 2013 to June 2013 but decreases from
July to September. Table 9 shows the mean of head grades from January 2013 to
September 2013.
Table 11. Head grade mean and standard deviation from January 2013 to September
2013 (Nordic Mines Oy. 2013)
4.5.5 One-way ANOVA for increased combined recovery from the flash flotation
and spiral concentrator
Figure 56. Boxplot comparison of Au in Hg (%) between Jan. to Apr. and May to
(Nordic Mines Oy. 2013)
Figure 55 shows the box plot data for the increased recovery from the flash flotation cell
and spiral concentrator. Data is normally distributed as shown in Figure 56.

89
Figure 57. Residual plots for comparison of Au in HG (%) Between time period of
Jan. to Apr. and May To Sep. (Mill production report 2013)
Table 12. One-way Anova for comparison of Au in Hg (%) between Jan. to Apr. and
May to Sep. (Nordic Mines Oy. 2013)
The average combined recovery from flotation and spirals was 30,11% during time
period from January 2013 to April 2013 and the average combined recovery during May
to September 2013 was 42,89%, total increase of 14,78%, shown in Table 10.

90
4.5.6 Flash flotation concentrate
Table 13. Means of flotation concentrates from Jan. 2013 to June 2013
(Nordic Mines Oy. 2013)
Table 11 shows the means of the flash flotation concentrations from January 2013 to
June 2013. Data is approximately normally distributed as shown in Figure 57. Gold
concentrations over 400ppm are cleaned from the flotation concentrate data. Gold
concentrations over 400ppm, refer to gold nuggets in the sample and this is why it is
considered as a fault in sample.
Figure 58. Residual plots for flotation concentrations from Jan. 2013 to June 2013
(Nordic Mines Oy. 2013)

91
Figure 59. Boxplot of flotation concentrates from January 2013 to June 2013
(Nordic Mines Oy. 2013)
In May the flotation chemical flow rate control was implemented to the plant operating
system and flotation chemical addition was increased. After May the mean of gold
concentration in flash flotation concentrate was increasing and increased flotation
chemical addition could be one explaining factor.
4.5.7 Knelson concentrate
Table 14. Knelson concentrations from Jan 2013 to June 2013 (Nordic Mines Oy.
2013)
Table 12 shows the means of Knelson concentrations from January 2013 to June 2013.
data is approximately normally distributed as shown in Figure 59. Gold concentrations
over 40 ppm are cleaned from the Knelson concentrate data. Gold concentrations over

92
40ppm refer to gold nuggets in the sample and this is why it is considered as a fault in
sample.
Figure 60. Residual plots for Knelson concentrations from January 2013 to June 2013
(Nordic Mines Oy. 2013)
Figure 61. Boxplot of Knelson concentrations from Jan. 2013 to June 2013
(Nordic Mines Oy. 2013)

93
Gold concentration reduces significantly after April which may refer to reduction of
gold flow through Knelson Concentrator. In May flotation chemical addition control
was implemented to the plant operating system and flotation chemical addition rate was
increased. Data supports the conclusion that more gold was recovered in flash flotation
cell and less gold was directed through Knelson concentrator. Coarse gold that is not
recovered in the flash flotation cell was directed to the Knelson concentrator.
4.5.8 HG CIL feed volume
Table 15. Means and standard deviations for High Grade feed (tonnes per shift) from
Jan. 2013 to June 2013 (Nordic Mines Oy. 2013)
Table 12 shows the means of the HG CIL feed concentrations from January 2013 to
October 2013. Data is approximately normally distributed as shown in Figure 61.
Figure 62. Residual plots for High Grade feed (tonnes per shift) from Jan. 2013 to
June 2013 (Nordic Mines Oy. 2013)

94
Figure 63. Boxplot of High Grade feed (tonnes per shift) from Jan. 2013 to June 2013
(Nordic Mines Oy. 2013)
Figure 62 shows the average tonnage flow of slurry to the HG CIL tanks per shift. In
beginning of May the spiral product splitter openings were reduced to 35mm and the
reduction of HG CIL feed rate in May can be partly explained with that operation. The
purpose for decreasing the product splitter openings was to reduce the amount of slurry
from Knelson and spiral concentrator and make more room for concentrate from the
flash flotation cell concentrate to achieve higher concentration of gold in HG CIL feed.
In July the spiral product splitter openings were increased to 45mm and the goal was to
increase the amount of coarse feed material directed to the GH circulation. In August
spiral product splitter openings were increased more to 55mm to increase the mass flow
to HG circulation. The flash flotation concentrate mass flow to the HG CIL tanks did
not increased as much as forecasted and to increase the total amount of gold flow to the
HG CIL tanks the flow from the spiral concentrator was increased. In September and
October the spiral product splitters were decreased back to 35mm to reduce the
fulfilling of the HG waste pond.
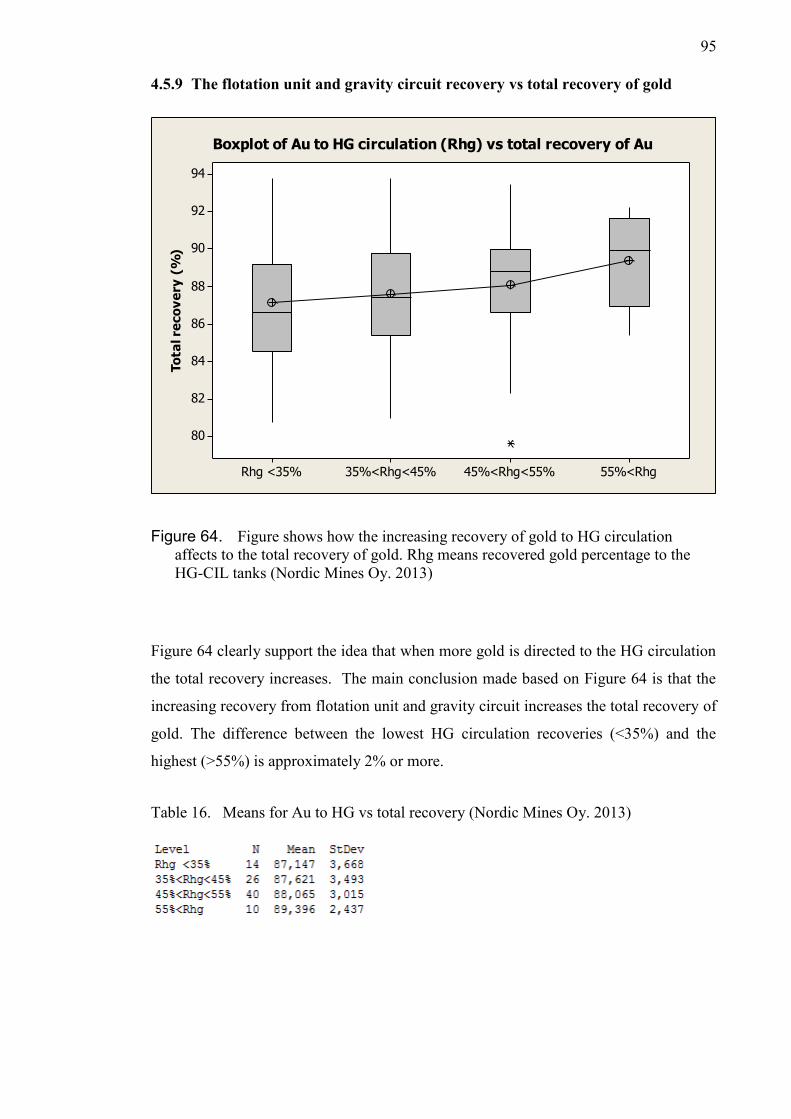
95
4.5.9 The flotation unit and gravity circuit recovery vs total recovery of gold
55%<Rhg45%<Rhg<55%35%<Rhg<45%Rhg <35%
94
92
90
88
86
84
82
80
To
tal re
co
ve
ry (
%)
Boxplot of Au to HG circulation (Rhg) vs total recovery of Au
Figure 64. Figure shows how the increasing recovery of gold to HG circulation
affects to the total recovery of gold. Rhg means recovered gold percentage to the
HG-CIL tanks (Nordic Mines Oy. 2013)
Figure 64 clearly support the idea that when more gold is directed to the HG circulation
the total recovery increases. The main conclusion made based on Figure 64 is that the
increasing recovery from flotation unit and gravity circuit increases the total recovery of
gold. The difference between the lowest HG circulation recoveries (<35%) and the
highest (>55%) is approximately 2% or more.
Table 16. Means for Au to HG vs total recovery (Nordic Mines Oy. 2013)
96
5 CONCLUCIONS
The average combined recovery from the flash flotation and spiral concentrator was
increased approximately 15% during the time period from January 2013 to September
2013. The growth of the gold recovery is explained by optimizing the flash flotation cell
variables. Implementing the flotation chemical addition control into the main operating
system, enabled to optimize the flash flotation process and made possible to achieve
higher flotation efficiency. Improvements in flotation and gravity circuit recoveries
have notable positive effect on the total recovery of gold and recovery of unwanted
sulphides.
Differences between collectors Aerophine 3418A, Aerophine 3404 and Danafloat 570
were not undisputed. Aerophine 3404 had the lowest foamability and was also cheaper
than Aerophine 3418A. Aerophine 3418A indicated lower gold recoveries that the
Aerophine 3404 and Danafloat 570. With regard to the Aerophine 3418A characteristic
to be selective against arsenopyrite do not promote the usage of Aerophine 3418A in
Laiva process. Danafloat 570 is the cheapest chemical of these three but has the highest
foamibility which is a disadvantage in the Laiva process.
Using copper sulfate 30g/t with Aerophine 3418A, PAX and Dow Froth 250 gave
approximately 5,4% higher gold recoveries than without copper sulfate in laboratory
batch flotation tests. Some effects were noticed when adding copper sulfate to the plant
process. The froth color chanced darker and after adding copper sulfate froth level
decreased and higher amounts of frother was needed to obtain the mass flow to the
flotation concentrate launder. Adding a copper sulfate to the process might also
contribute the flotation of arsenic compounds like arsenopyrite and thus make the
process more environmental friendly. The flash flotation cell in Laiva site can be used
as extractor for the arsenic compound like arsenopyrite. When arsenopyrite is collected
in the flotation unit can it be directed to the closed HG pond.
Higher level optimization is not possible until a stable operation of the acting plant has
been achieved. There are too many daily disturbances in the process which may
drawback the total efficiency of the plant. Also the lack of process instruments makes
the process hard to control. An example a flow meter in the flotation cell concentration
line would enable the better control of the flotation process. Also a continuous sampler

97
placed in flotation concentrate line would enable monitoring the process and would
work as a basis for further process optimization. Collecting samples manually from the
process streams would be better than doing nothing. Continuous data collection is
essential to control the process variations and process performance.
Unliberated particles should be directed to the HG circulation because there is one ball
mill which grind the particles and raise the level of liberated particles. This would have
a positive effect on the total recovery of gold. The level of an optimum liberation size
should be identified and use this knowledge to control the feed to the HG circulation.
To achieve a high performance from the flotation cell at the Laiva site it requires a close
attention from the operator. The feed rate varies constantly and makes it impossible for
a human operator to control the flotation process efficiently. The air valve control was
broken and could not be repaired, the air addition rate was controlled by changing the
air compressor power. The basic controls should be working before thinking about any
further optimization. The highest recoveries from the flotation unit were achieved by
keeping the froth level low, between 10 to 15cm, to promote the recovery of coarse
particles; pushing the flotation chemical addition rates close to the maximum to achieve
stable froth and maximum mass recovery and checking the appearance of the froth from
the top of the flotation cell.
Cleaning the spiral concentrator is the most important task to maintain the efficiency,
because buildup of slimes and solid particles on spirals, especially in the center of the
spiral and on the product splitters disturb the slurry flow and reduce the recovery of
gold. The flash flotation cell requires cleaning to maintain its efficiency. Cleaning the
lip of the froth launder prevents the buildup of shit on the lip which disturbs the froth
flowing over it. The cleaning of the spiral concentrator and flotation unit should be done
in every shift.
Key benefits that could be achieved with vision based froth controller are better control
of the concentration grade, reduced consumption of flotation chemicals, improved
recovery and operators would be more available for other tasks.
98
RECOMMENDATIONS FOR FUTURE WORK
Doing experimental study how two or more flotation units would increase the total
recovery of gold. Using a rougher and cleaner flotation stages would hence the recovery
of coarse unliberated gold and gold bearing sulphides with higher grade. Conditioning
tank may be necessary if installing more flotation units. Existing flash flotation cell
could be used to remove coarse valuable liberated high grade particles from the primary
cyclone underflow away from the milling circuit. Conditioning tank would work as
buffer to level the variation in process slurry flow.
Doing laboratory scale flotation test with different flotation chemicals and with copper
sulfate is to find the best possible combination of the flotation chemical.
The presence of slimes in the process stream gives the reason for studying if the usage
of depressant would be beneficial for improving the flotation effectiveness. Dispersing
the slimes could be also beneficial for the efficiency of the Knelson concentrator.
For research a vision based froth analyzer would provide a profitable improvement. Key
benefits that could be achieved with vision based froth analyzer are better control of the
concentration grade, reduced consumption of flotation chemicals, improved recovery
and operators would be more available for other tasks.
Doing experimental study how the arsenic compounds can be extracted in the flotation
process. Removing the sulphides and especially arsenic compounds away from the LG
circuit would make the process more environmental friendly. The impurities directed to
the closed HG pond are the key factor that affects the environmental improvement of
the process.

99
6 REFERENGES
Arnold J.R. (1990) Gold recovery as Gold Field’s Chimney Greeg. Pages 251-260 in
Proceedings of Gold Forum on Technology and Practice-World Gold’89. Edited by
R.B. Bhabbu, and R.J. Harden. Littleton, CO:SME.
Avotins P.V., Wang S. and Nagaraj D.R. (1994) Recent advances in sulfide collector
development, in Reagents for Better Metallyrgy, ed. P.S. Mulukutla, SME, Inc.,
Littleton.
Bianca Newcombe B., Bradshaw D., Wightman E. (2012b) Development of a
laboratory method to predict plant flash flotation performance. Minerals Engineering
39 (2012b) 228–238JKMRC – The University of Queensland, 40 Isles Rd,
Indooroopilly, QLD 4068, Australia
Bourke P. (1995) Flash flotation in the gold industry.
Bulatovic S. M. (2007) Handbook of Flotation Reagents. Chemistry, Theory and
practice: Flotation of Sulfide Ores. Elsevier Science & Technology Books.
Carr D., Dixon A. Tiili O. (2009) Optimising Large Flotation Cell Performance
Through Advanced. Chemical Engineering Science, 50 (22), 3501-3513.
Cytec Industries Inc. (2008) Use of AEROPHINE 3418A Promoter in the Flotation of
Complex Lead, Copper and Zinc Minerals with High Silver ContentCytec. Summary of
CYTEC Reagents for Au Ores.
http://rivs2010.rivs.ru/wpcontent/uploads/2010/12/12cytec.pdf
Deschênes G., Hall D, Fulton M. (2003) Cyanidation of a pyrrhotite-bearing gold ore.
Fuerstenau M.C., Jameson G., Yoon R-H. (2007) Froth Flotation: A Century of
Innovation. Society for Mining, Metallurgy, and Exploration, Inc. SME. USA.
Glembotskii, V.A., Klassen V. I. and Plaksin I. N. (1972) Flotation, Primary Sources,
New York.
100
Guarini M., Cipriano A., Soto A. and Cuesalaga A. (1995) Using image processing
techniques to evaluate the quality of mineral flotation process. In proceedings of the 6th
International Conference on Signal Processing, Applications and Technology, 24-25
October 1995, Boston.
Gül A., Kangal O., Ayhan A., Önal A., Önal G. (2012) Beneficiation of the gold bearing
ore by gravity and flotation. International Journal of Minerals, Metallurgy and
Materials, Volume 19, Number 2, Feb 2012, Page 106. Mineral Processing Engineering
Department Istanbul, Faculty of Mines, Technical University, Istanbul 34469, Turkey
Hubbard J.S., Humphreys I.B. and Brown E.W. (1953) How Humpreys spiral
concentrator is improves concentrate grade and recovery at Newcrest Mining’s Cadia.
Instrumentation and Control used in modern dressing practice. Mining World.
Ketchum V.J., O’Riley J.F., Vardil W.D. (1993) The Lihir Gold Project: Process plant
design. Minerals Engineering 6(8-10):1037-1065.
King R. P. Principles of Flotation (1982) South African Institute if Mining and
Metallurgy.
Klimpel, R. R. (1995) The Influence of Frother Structure on Industrial Coal Flotation,
High- Efficiency Coal Preparation. Society for Mining, Metallurgy, and Exploration –
SME.
Knelson user manual (1992–2011). Model KC-CVD64
Koksal1 E., Ormanoglu G. Devuyst E.A. (2002) Cyanide destruction: full-scale
operation at Ovacik gold mine. The European Journal of Mineral Processing and
Environmental Protection
Exploration, Littleton, CO, pp. 141-151, Forum, Perth 1995, pp. 61–71.
Kubiak T.M., Benbow D. W. (2009) Six Sigma Black Belt Handbook, second
edition.AsQ Quality Press, USA.

101
Laplante, A.R., Huang, L., Noaparast, M., Nickelotopoulos, N. (1995a) A philosohper’s
stone: turning tungsten and lead into gold – the use of synthetic ores to study gold
gravity separation. In: Proceedings of the 27th Annual Canadian Mineral Processors
Conference, Canada, pp. 379–382.
Laplante A.R., Woodcock F., Noaparast M. (1995b) Predicting gravity separation gold
recoveries. Minerals and Metallurgical Processing, 12 (1995), pp. 74–79
Laplante A.R., Vincent F., Luinstra W.F. (1996) A laboratory procedure to determine
the amount of gravity recoverable gold – a case study at Hemlo gold mines. In:
Proceedings of the 28th Annual Canadian Mineral Processors Conference, Ottawa, ON,
Canada, pp. 69–82
Laukkanen J. (2008) MINERAL CONTENTS OF DEPTH SAMPLES –
LAIVAKANGAS. GTK Mineral Processing. Finland.
Lynch, A.J., Harbort, G.J., Nelson, M.G. (2010) History of Flotation, Australia.
Mackinnon S., Yan D., Dunne R. (2003) The interaction of flash flotation with closed
circuit grinding. Minerals Engineering 16 (2003) 1149–1160. WA School of Mines,
Curtin University, LB 22 Kalgoorlie, WA 6433. Newcrest Mining Ltd. Australia.
Mäkelä M. (2005) The Quartz-Arsenopyrite-Gold Mineralization of Laivakangas,
Raahe, Finland. Master Thesis, University of Turku, Department of Geology and
Mineralogy. Finland.
Mäkelä M (1984) Raahen Laivakankaan kvartsi-arseenikiisu-kultaesiintymä. Finland.
Marcos P.S. and Gilman S.K. (2007) ‘Old tricks for new dogs’ Areas for focus in
mineral sand processing. The 6th International Heavy Minerals Conference ‘Back to
Basics’,The Southern African Institute of Mining and Metallurgy. TZ Minerals
International.
Marsden J.O., House C.I. (2006) The Chemistry of Gold Exraction. Society for Mining,
Metallyrgy, and Exploration, Inc. SME. USA.

102
Matikainen K. (2013) Raahen Laivan kaivoksen South shear zone-hiertovyöhykkeen
kullan minerologia. Bachelor thesis. Univercity of Oulu, Department of geology.
Finland.
Mckee D.J. (1991) Automatic flotation control – a review of the last 20 years effort,
Minerals Engineering, 4(7-11), 635-666.
Moolman D.W., Aldrich C., Van Deventer J.S.J., Bradshaw D.B. (1995a) The
classification of froth structures in a copper flotation plant by means of a neural net.
Department of Chemical Engineering, University of Stellenbosch, Private Bag X5018,
Stellenbosch, 7599, South Africa.
Moolman D.W., Aldrich C., Van Deventer J.S.J., Bradshaw D.B. (1995b) The
interpretation of flotation froth surfaces by using digital image analysis and neural
networks. Department of Chemical Engineering, University of Stellenbosch, Private
Bag X5018, Stellenbosch, 7599, South Africa. Department of Chemical Engineering,
University of Witwatersrand, P.O. Wits, Johannesburg, 2050, South Africa.
Moolman D.W., Aldrich C., Van Deventer J.S.J., Stange W.W. (1994) Digital image
processing as a tool for on-line monitoring of froth in flotation plants. Mineral
Engineering, 7 (9), 1149-1164. Department of Chemical Engineering, University of
Stellenbosch, Private Bag X5018, Stellenbosch, 7599, South Africa. Department of
Chemical Engineering, University of Witwatersrand, P.O. Wits, Johannesburg, 2050,
South Africa.
Newcombe B., Bradshaw D., Wightman E. (2012a) Flash flotation. and the plight of the
coarse particle. Minerals Engineering 34 1-10. The University of Queensland, 40 Isles
Rd., Indooroopilly, QLD 4068, Australia.
O´Connor M. and Reeves C. (2012) Nordic Mines AB: Summary Report –Mineral
Resource and Ore Reserve Update- Laiva Gold Deposit Finland. CSA Global (UK) Ltd
(CSA) for Nordic Mines AB. Finland.
Outotec (2000) Case Study: Minerals processing solutions. FrothMaster™ froth
analyzer system

103
Outotec (2009) Laiva Gold Plant Feasibility Study Volume 1
Pratt W. (2010) Controls on gold mineralization at Laiva mine, Finland. Specialized
geological mappin Ltd.
Hukki R. T. (1964) Mineraalien hienonnus ja rikastus. Teknillisten Tieteiden Akatemia.
Finland.
Rao S.R. (2004) Surface Chemistry of Froth Flotation, Second Edition, Volume 1,
Fundamentals. Kluwer Academic/Plenum Publishers, New York, USA.
Rogers J. (1962) Principles of Sulphide Mineral flotation. Froth Flotaion 50th
Anniversary Volume. Editor Fuerstenau D.W.. Minerals Benefication Division of the
Society of Mining Engineers, AIME. The American Institute of Mining, Metallurgical,
and Petroleum Engineers, Inc. Usa.
Schubert H. (1999) On the turbulence-controlled microprocesses in flotation machines.
Int. J. Miner. Process. 56 1999 257–276.
Simonen. A. (1980) The Precambrian in Finland. Geol. Sur. of Finland Bull.
Substech. http://www.substech.com/dokuwiki/doku.php?id=stabilization_of_colloids
The characterisation of froth surfaces and relation to process performance by using
connectionist image processing techniques. Mineral Engineering, 8 (1-2), 23-30.
Yoon R. H. and Basilo C. I. (1993) Adsorption of thiol colelctors on sulphide minerals
and precious metals – a new perpective, Proceeding of XVII int. Miner. Process. Cong.
Australia.
Walker, G.W., Walters, C.P. and Richardson, P.E. (1984) Correlation of the
electrosorption of sulphur and thiol collectors with contact angle and flotat ion.
Electrochemistry in Mineral and Metals Processing, pp. 202-217.
Wills B.A., Napier-Mun T.J. (2006) Wills mineral Processing Technology. Seventh
Edition

104
7 APPENDIX

105
Table 17. Laboratory flotation test calculations