Embed Size (px)
Citation preview
Heart and Circulatory Disease Statistics 2019
Published by the BHF in collaboration with the Institute of Applied Health Research at the University of Birmingham First published April 2019. Revised September 2019. There are five chapters presented here (mortality, morbidity, treatment, costs and risk factors) Original Excel spreadsheets, graphs and tables can be found at bhf.org.uk/statistics BHF Health Statistic Factsheets are available for the UK, England, Scotland, Wales and Northern Ireland.
For any enquiries please contact the BHF – mark for the attention of the Health Intelligence team – we will do our best to help.
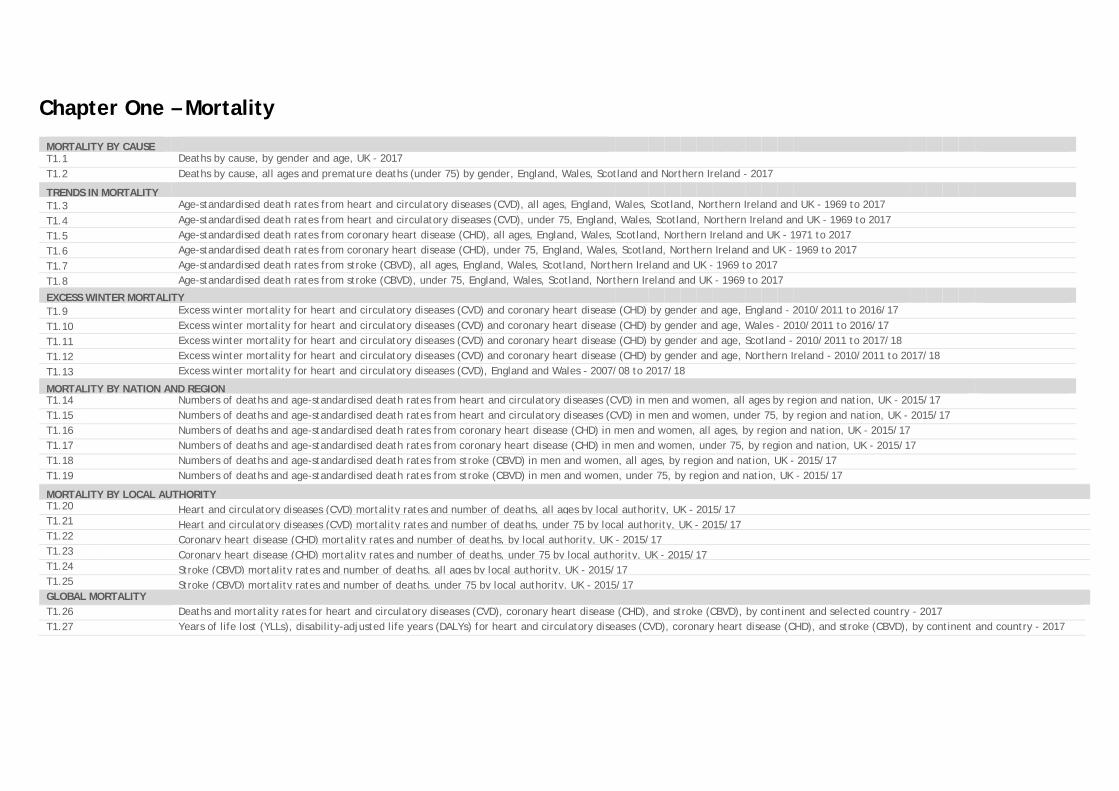
Chapter One – Mortality
MORTALITY BY CAUSE T1.1 Deaths by cause, by gender and age, UK - 2017 T1.2 Deaths by cause, all ages and premature deaths (under 75) by gender, England, Wales, Scotland and Northern Ireland - 2017
TRENDS IN MORTALITY
T1.3 Age-standardised death rates from heart and circulatory diseases (CVD), all ages, England, Wales, Scotland, Northern Ireland and UK - 1969 to 2017
T1.4 Age-standardised death rates from heart and circulatory diseases (CVD), under 75, England, Wales, Scotland, Northern Ireland and UK - 1969 to 2017
T1.5 Age-standardised death rates from coronary heart disease (CHD), all ages, England, Wales, Scotland, Northern Ireland and UK - 1971 to 2017
T1.6 Age-standardised death rates from coronary heart disease (CHD), under 75, England, Wales, Scotland, Northern Ireland and UK - 1969 to 2017
T1.7 Age-standardised death rates from stroke (CBVD), all ages, England, Wales, Scotland, Northern Ireland and UK - 1969 to 2017
T1.8 Age-standardised death rates from stroke (CBVD), under 75, England, Wales, Scotland, Northern Ireland and UK - 1969 to 2017
EXCESS WINTER MORTALITY
T1.9 Excess winter mortality for heart and circulatory diseases (CVD) and coronary heart disease (CHD) by gender and age, England - 2010/2011 to 2016/17
T1.10 Excess winter mortality for heart and circulatory diseases (CVD) and coronary heart disease (CHD) by gender and age, Wales - 2010/2011 to 2016/17
T1.11 Excess winter mortality for heart and circulatory diseases (CVD) and coronary heart disease (CHD) by gender and age, Scotland - 2010/2011 to 2017/18
T1.12 Excess winter mortality for heart and circulatory diseases (CVD) and coronary heart disease (CHD) by gender and age, Northern Ireland - 2010/2011 to 2017/18
T1.13 Excess winter mortality for heart and circulatory diseases (CVD), England and Wales - 2007/08 to 2017/18
MORTALITY BY NATION AND REGION T1.14 Numbers of deaths and age-standardised death rates from heart and circulatory diseases (CVD) in men and women, all ages by region and nation, UK - 2015/17 T1.15 Numbers of deaths and age-standardised death rates from heart and circulatory diseases (CVD) in men and women, under 75, by region and nation, UK - 2015/17 T1.16 Numbers of deaths and age-standardised death rates from coronary heart disease (CHD) in men and women, all ages, by region and nation, UK - 2015/17 T1.17 Numbers of deaths and age-standardised death rates from coronary heart disease (CHD) in men and women, under 75, by region and nation, UK - 2015/17 T1.18 Numbers of deaths and age-standardised death rates from stroke (CBVD) in men and women, all ages, by region and nation, UK - 2015/17 T1.19 Numbers of deaths and age-standardised death rates from stroke (CBVD) in men and women, under 75, by region and nation, UK - 2015/17
MORTALITY BY LOCAL AUTHORITY T1.20 Heart and circulatory diseases (CVD) mortality rates and number of deaths, all ages by local authority, UK - 2015/17 T1.21 Heart and circulatory diseases (CVD) mortality rates and number of deaths, under 75 by local authority, UK - 2015/17 T1.22 Coronary heart disease (CHD) mortality rates and number of deaths, by local authority, UK - 2015/17 T1.23 Coronary heart disease (CHD) mortality rates and number of deaths, under 75 by local authority, UK - 2015/17 T1.24
Stroke (CBVD) mortality rates and number of deaths, all ages by local authority, UK - 2015/17
T1.25
Stroke (CBVD) mortality rates and number of deaths, under 75 by local authority, UK - 2015/17 GLOBAL MORTALITY T1.26 Deaths and mortality rates for heart and circulatory diseases (CVD), coronary heart disease (CHD), and stroke (CBVD), by continent and selected country - 2017 T1.27 Years of life lost (YLLs), disability-adjusted life years (DALYs) for heart and circulatory diseases (CVD), coronary heart disease (CHD), and stroke (CBVD), by continent and country - 2017
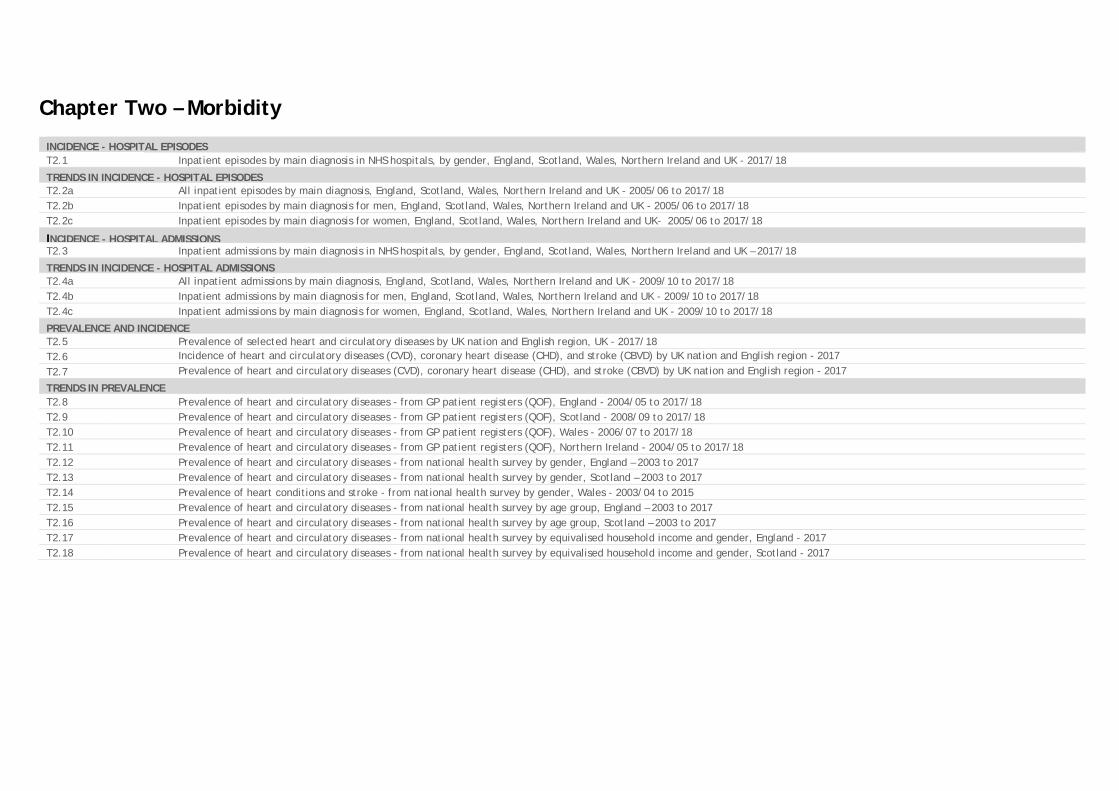
Chapter Two – Morbidity
INCIDENCE - HOSPITAL EPISODES T2.1 Inpatient episodes by main diagnosis in NHS hospitals, by gender, England, Scotland, Wales, Northern Ireland and UK - 2017/18
TRENDS IN INCIDENCE - HOSPITAL EPISODES T2.2a All inpatient episodes by main diagnosis, England, Scotland, Wales, Northern Ireland and UK - 2005/06 to 2017/18 T2.2b Inpatient episodes by main diagnosis for men, England, Scotland, Wales, Northern Ireland and UK - 2005/06 to 2017/18 T2.2c Inpatient episodes by main diagnosis for women, England, Scotland, Wales, Northern Ireland and UK- 2005/06 to 2017/18
INCIDENCE - HOSPITAL ADMISSIONS T2.3 Inpatient admissions by main diagnosis in NHS hospitals, by gender, England, Scotland, Wales, Northern Ireland and UK – 2017/18
TRENDS IN INCIDENCE - HOSPITAL ADMISSIONS T2.4a All inpatient admissions by main diagnosis, England, Scotland, Wales, Northern Ireland and UK - 2009/10 to 2017/18 T2.4b Inpatient admissions by main diagnosis for men, England, Scotland, Wales, Northern Ireland and UK - 2009/10 to 2017/18 T2.4c Inpatient admissions by main diagnosis for women, England, Scotland, Wales, Northern Ireland and UK - 2009/10 to 2017/18
PREVALENCE AND INCIDENCE T2.5 Prevalence of selected heart and circulatory diseases by UK nation and English region, UK - 2017/18 T2.6 Incidence of heart and circulatory diseases (CVD), coronary heart disease (CHD), and stroke (CBVD) by UK nation and English region - 2017
T2.7 Prevalence of heart and circulatory diseases (CVD), coronary heart disease (CHD), and stroke (CBVD) by UK nation and English region - 2017
TRENDS IN PREVALENCE T2.8 Prevalence of heart and circulatory diseases - from GP patient registers (QOF), England - 2004/05 to 2017/18 T2.9 Prevalence of heart and circulatory diseases - from GP patient registers (QOF), Scotland - 2008/09 to 2017/18 T2.10 Prevalence of heart and circulatory diseases - from GP patient registers (QOF), Wales - 2006/07 to 2017/18 T2.11 Prevalence of heart and circulatory diseases - from GP patient registers (QOF), Northern Ireland - 2004/05 to 2017/18 T2.12 Prevalence of heart and circulatory diseases - from national health survey by gender, England – 2003 to 2017 T2.13 Prevalence of heart and circulatory diseases - from national health survey by gender, Scotland – 2003 to 2017 T2.14 Prevalence of heart conditions and stroke - from national health survey by gender, Wales - 2003/04 to 2015 T2.15 Prevalence of heart and circulatory diseases - from national health survey by age group, England – 2003 to 2017 T2.16 Prevalence of heart and circulatory diseases - from national health survey by age group, Scotland – 2003 to 2017 T2.17 Prevalence of heart and circulatory diseases - from national health survey by equivalised household income and gender, England - 2017 T2.18 Prevalence of heart and circulatory diseases - from national health survey by equivalised household income and gender, Scotland - 2017
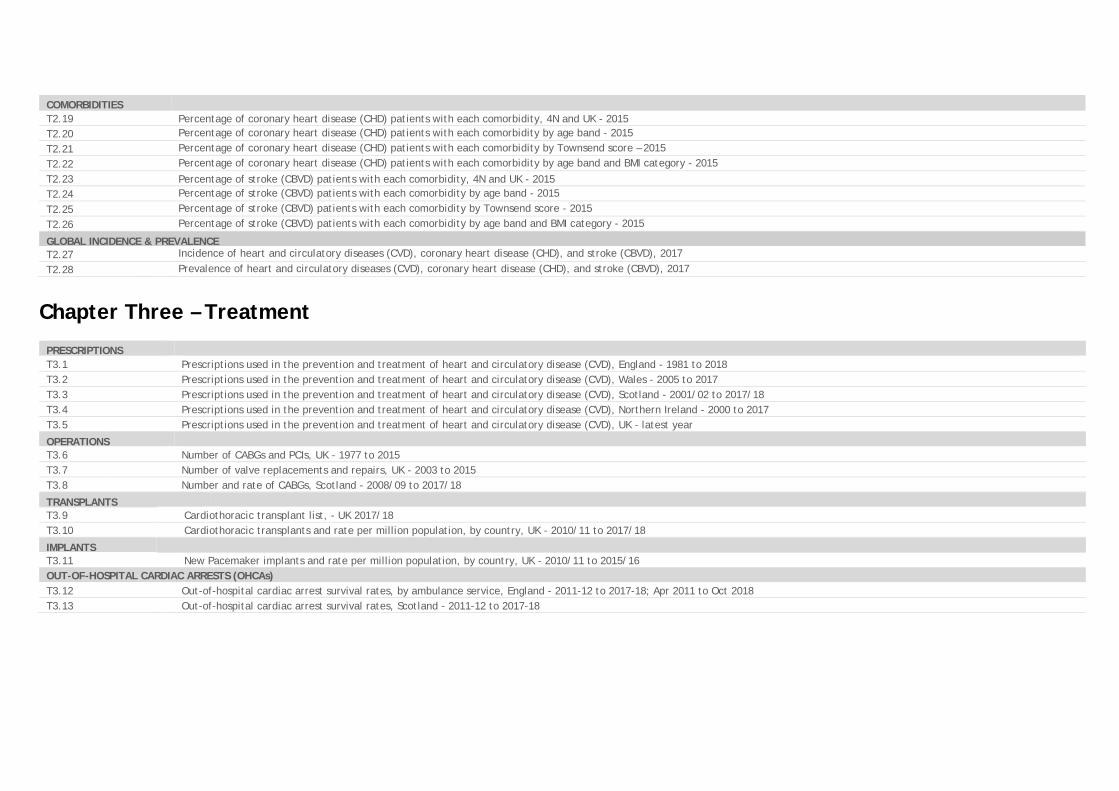
COMORBIDITIES T2.19
Percentage of coronary heart disease (CHD) patients with each comorbidity, 4N and UK - 2015
T2.20
Percentage of coronary heart disease (CHD) patients with each comorbidity by age band - 2015
T2.21
Percentage of coronary heart disease (CHD) patients with each comorbidity by Townsend score – 2015
T2.22
Percentage of coronary heart disease (CHD) patients with each comorbidity by age band and BMI category - 2015
T2.23
Percentage of stroke (CBVD) patients with each comorbidity, 4N and UK - 2015 T2.24
Percentage of stroke (CBVD) patients with each comorbidity by age band - 2015
T2.25
Percentage of stroke (CBVD) patients with each comorbidity by Townsend score - 2015
T2.26
Percentage of stroke (CBVD) patients with each comorbidity by age band and BMI category - 2015
GLOBAL INCIDENCE & PREVALENCE T2.27
Incidence of heart and circulatory diseases (CVD), coronary heart disease (CHD), and stroke (CBVD), 2017
T2.28
Prevalence of heart and circulatory diseases (CVD), coronary heart disease (CHD), and stroke (CBVD), 2017
Chapter Three – Treatment
PRESCRIPTIONS T3.1 Prescriptions used in the prevention and treatment of heart and circulatory disease (CVD), England - 1981 to 2018 T3.2 Prescriptions used in the prevention and treatment of heart and circulatory disease (CVD), Wales - 2005 to 2017 T3.3 Prescriptions used in the prevention and treatment of heart and circulatory disease (CVD), Scotland - 2001/02 to 2017/18 T3.4
Prescriptions used in the prevention and treatment of heart and circulatory disease (CVD), Northern Ireland - 2000 to 2017
T3.5 Prescriptions used in the prevention and treatment of heart and circulatory disease (CVD), UK - latest year
OPERATIONS T3.6
Number of CABGs and PCIs, UK - 1977 to 2015
T3.7 Number of valve replacements and repairs, UK - 2003 to 2015 T3.8 Number and rate of CABGs, Scotland - 2008/09 to 2017/18
TRANSPLANTS T3.9 Cardiothoracic transplant list, - UK 2017/18 T3.10 Cardiothoracic transplants and rate per million population, by country, UK - 2010/11 to 2017/18
IMPLANTS
T3.11 New Pacemaker implants and rate per million population, by country, UK - 2010/11 to 2015/16 OUT-OF-HOSPITAL CARDIAC ARRESTS (OHCAs) T3.12 Out-of-hospital cardiac arrest survival rates, by ambulance service, England - 2011-12 to 2017-18; Apr 2011 to Oct 2018 T3.13 Out-of-hospital cardiac arrest survival rates, Scotland - 2011-12 to 2017-18
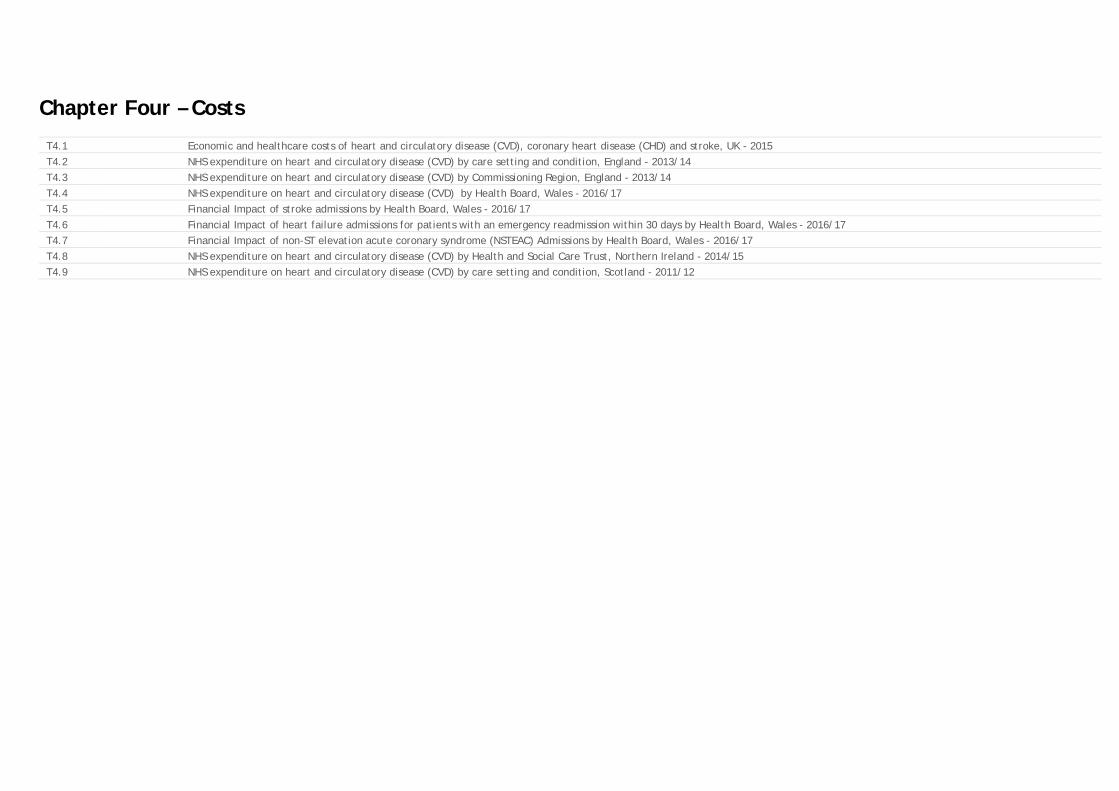
Chapter Four – Costs
T4.1 Economic and healthcare costs of heart and circulatory disease (CVD), coronary heart disease (CHD) and stroke, UK - 2015 T4.2
NHS expenditure on heart and circulatory disease (CVD) by care setting and condition, England - 2013/14
T4.3 NHS expenditure on heart and circulatory disease (CVD) by Commissioning Region, England - 2013/14 T4.4 NHS expenditure on heart and circulatory disease (CVD) by Health Board, Wales - 2016/17 T4.5 Financial Impact of stroke admissions by Health Board, Wales - 2016/17 T4.6 Financial Impact of heart failure admissions for patients with an emergency readmission within 30 days by Health Board, Wales - 2016/17 T4.7 Financial Impact of non-ST elevation acute coronary syndrome (NSTEAC) Admissions by Health Board, Wales - 2016/17 T4.8 NHS expenditure on heart and circulatory disease (CVD) by Health and Social Care Trust, Northern Ireland - 2014/15 T4.9 NHS expenditure on heart and circulatory disease (CVD) by care setting and condition, Scotland - 2011/12
Chapter Five – Risk Factors
IMPACT OF RISK FACTORS ON HEART AND CIRCULATORY DISEASES IN UK T5.1 Percentage of heart and circulatory disease (CVD), coronary heart disease (CHD), and stroke (CBVD) attributable to selected risk factors in the UK, 2017 HIGH BLOOD PRESSURE (HYPERTENSION) T5.2 Prevalence of high blood pressure in adults by age and gender, England, Scotland, Wales and Northern Ireland, latest available
T5.3 Prevalence of untreated high blood pressure in adults by age and gender, England, Scotland, latest available DIABETES T5.4 Prevalence of doctor-diagnosed diabetes in adults by age and gender, England, Scotland and Wales, latest available T5.5 Prevalence of diabetes by nation and region, UK 2017/18
RAISED CHOLESTEROL T5.6 Percentage of adults with raised cholesterol by age and gender, England and Scotland, latest available
OVERWEIGHT AND OBESITY T5.7 Prevalence of overweight (including obese) in adults by age and gender, England, Scotland, Wales, Northern Ireland and UK, latest available
T5.8 Prevalence of obesity in adults by age and gender, England, Scotland, Wales, Northern Ireland and UK, latest available
PHYSICAL INACTIVITY T5.9 Percentage of adults NOT meeting physical activity recommendations by age and gender, England, Scotland, Wales, Northern Ireland and UK, latest available SMOKING T5.10 Prevalence of cigarette smoking among adults by age and gender, England, Scotland, Wales, Northern Ireland and UK, latest available
ALCOHOL CONSUMPTION T5.11 Percentage of adults exceeding weekly alcohol consumption guidelines by age and gender, England, Scotland, Wales, Northern Ireland and UK, latest available FRUIT AND VEGETETABLE CONSUMPTION T5.12 Percentage of adults NOT meeting 5-a-day fruit and vegetable recommendations by age and gender, England, Scotland, Wales, Northern Ireland and UK, latest available
T5.13 Average number of portions of fruit and vegetables consumed per day by adults by age and gender, England, Scotland, Wales and Northern Ireland, by latest available GLOBAL IMPACT OF RISK FACTORS ON HEART AND CIRCULATORY DISEASES T5.14 Percentage of heart and circulatory disease (CVD), coronary heart disease (CHD), and stroke (CBVD) attributable to selected risk factors - global estimates, 2017
GLOSSARY Definitions for the terms used in this compendium Acute coronary syndrome (ACS) – ischaemic (coronary) heart disease, a term usually used to describe a heart attack but also unstable angina. Age-standardised rate – a measure of the rate that a population would experience if it had a standard age structure. It is useful to present rates as age-standardised, as it allows for comparisons between populations with very different age structures. Angioplasty – a technique to widen a narrowed or obstructed blood vessel by inflating tightly folded balloons that have been passed into the narrowed location via a catheter. This technique squashes the fatty tissue that has caused the narrowing, hence widening the artery. Atherosclerosis – a build-up of fatty deposits inside the arteries. The disease is commonly referred to as ‘hardening’ or ‘furring’ of the arteries. Atrial fibrillation (AF) – a heart condition that causes an irregular and often abnormally fast heart rate. Blood pressure – a measure of the force that your heart uses to pump blood around your body. It is measured in millimetres of mercury (mmHg). See also systolic/diastolic pressure, hypertension (high blood pressure). Body mass index (BMI) – a formula relating body weight to height to assess whether a person is overweight. Adult BMI is calculated by dividing a person’s weight (in kilograms) by their height (in metres) squared, e.g. a man who is 1.8m tall and weighs 90kg has a BMI of 28 (90/(1.8x1.8)). Adults with a BMI of 25-30 are considered to be overweight. Those with a BMI of over 30 are considered obese. Children’s BMI is calculated differently, taking age and gender, as well as height and weight, into account, and then compares the results with children who took part in national surveys. British National Formulary (BNF) – a publication that provides key information on the selection, prescribing, dispensing and administration of all medicines that are generally prescribed in the UK. Cardiovascular disease (CVD) – the collective term for all diseases affecting the heart and blood vessels – also referred to here as heart and circulatory diseases. Cerebrovascular disease (CBVD) – the collective term for all diseases affecting blood vessels that supply the brain. Technically, stroke (and the many sub-types of stroke) is a subset of cerebrovascular disease, but the two terms are often used interchangeably.
Congenital heart disease - a heart condition or defect that develops in the womb before a baby is born. Coronary artery bypass graft (CABG) – an operation to bypass a narrowed section of a coronary artery and improve the blood supply to the heart muscle. Coronary heart disease (CHD) – the collective term for diseases that occur when the walls of the coronary arteries become narrowed by a gradual build-up of fatty material called atheroma. The two main forms of CHD are heart attack (also known as myocardial infarction) and angina. Also known as ischaemic heart disease (IHD). Diabetes – a disease characterised by high blood sugar levels in blood. There are two main types: Type 1 - caused by body being unable to make the hormone insulin; Type 2 – your body does not use insulin properly. Also called insulin resistance. The resulting chronic high blood glucose levels (hyperglycaemia) are associated with long-term damage, dysfunction and failure of various organs, especially the eyes, kidneys, nerves, heart and blood vessels. Diastolic pressure – the pressure when your heart rests between beats (see blood pressure). Disability-Adjusted Life Years (DALYs) - the sum of years lost due to premature death (YLLs) and years lived with disability (YLDs). DALYs take into account both premature death and health-related suffering (disability) to portray the total years of healthy life lost to a disease or condition. Features in the Global Burden of Disease (GBD), a detailed analysis of international health that models the burden of diseases and their risk factors. European Standard Population (ESP) – an artificial population structure, which is used in the weighting of mortality or incidence data to produce age‑standardised rates. The ESP was updated in 2013 to better reflect the age distribution of Europe. Heart attack – also referred to as myocardial infarction (MI) - a condition where the heart muscle is starved of oxygen, most commonly caused by a blockage of one of the coronary arteries. A heart attack usually causes severe pain in the centre of the chest. The pain usually feels like a heaviness or tightness which may also spread to the arms, neck, jaw, face, back or stomach. There may also be sweating, light-headedness, nausea and/or shortness of breath. Sometimes a heart attack can be ‘silent’ and produce little or no discomfort. Heart failure – a chronic condition which occurs when the heart is unable to pump blood as efficiently around the body. It occurs because the heart is damaged or overworked. Some people with minor heart failure may have few or no symptoms. People with moderate or severe heart failure often suffer from a number of problems, including shortness of
breath, general tiredness and swelling of the feet and ankles. Hospital inpatient episodes – periods of continuous admitted patient care under the same consultant. These figures usually include day cases, i.e. an admission or overnight stay is not required. Hypertension – a clinical condition of having a high blood pressure. Mostly it is considered blood pressures of 140/90 mmHg and greater to be high although this is influenced by other factors. Incidence – a measure of morbidity based on the number of new episodes of an illness arising in a population over a defined time period. International Classification of Disease (ICD) – a coding system published by the World Health Organization that provides an internationally recognised method of coding diseases in order to categorise mortality and morbidity statistics. Cardiovascular diseases in ICD-10 are I00-99 but some heart and circulatory conditions (e.g. congenital heart disease, vascular dementia) are coded elsewhere. Myocardial infarction (MI) – see heart attack. Out-of-hospital cardiac arrest (OHCA) - a critical medical emergency, where the heart stops pumping blood around the body. Unless treated immediately, it leads to death within minutes. Percutaneous coronary intervention (PCI) – a procedure that uses a catheter (a thin flexible tube) to place a stent to open narrowed coronary arteries in the heart that have been narrowed by atherosclerosis. Previously known as angioplasty with stent. Peripheral arterial disease (PAD) – a condition in which a build-up of fatty deposits in the arteries restricting the blood supply to parts of the body, most commonly the legs. Also known as peripheral vascular disease (PVD). Prevalence – a measure of morbidity based on the current level of a disease in the population at any particular time. Stent – a short tube of expandable mesh which is inserted at the part of the artery that is to be widened by coronary angioplasty. It helps to keep the artery open and prevent re-narrowing. Stroke – the consequence of an interruption to the flow of blood to the brain. A stroke can vary in severity from a passing weakness or tingling of a limb to a profound paralysis, coma and/or death. Systolic pressure – the pressure when your heart pushes blood out (see blood pressure). THIN - The Health Improvement Network – a very large dataset with anonymised data from millions of
patient records held by GPs; considered to be broadly representative of the UK population. Townsend score - a measure of deprivation within a population, usually based on postcode. Transient ischaemic attacks (TIA) – a temporary disruption in the blood supply to part of the brain. Sometimes called a mini-stroke, a TIA does not last as long as a stroke. The effects are usually fully resolved within 24 hours. Vascular dementia - a type of dementia caused by a reduced blood supply to an area of the brain. The cells in the affected area of the brain don’t get enough oxygen or nutrients and start to die. This leads to symptoms such as concentration problems and personality changes. Years of Life Lost (YLLs) - the number of years of life that are lost due to premature mortality. Features in the Global Burden of Disease (GBD), a detailed analysis of international health that models the burden of diseases and their risk factors. ABOUT THE BRITISH HEART FOUNDATION One in four of us in the UK and one in three globally die from heart and circulatory diseases. That’s why the British Heart Foundation funds world-leading research into their causes, prevention, treatment and cure.
Advances from our research have saved and improved millions of lives, but heart diseases, stroke, vascular dementia and their risk factors such as diabetes still cause heartbreak on every street. With the public’s support, our funding will drive the new discoveries to end that heartbreak.
We are the biggest independent funder of heart and circulatory disease research in the UK.
Find out more at bhf.org.uk
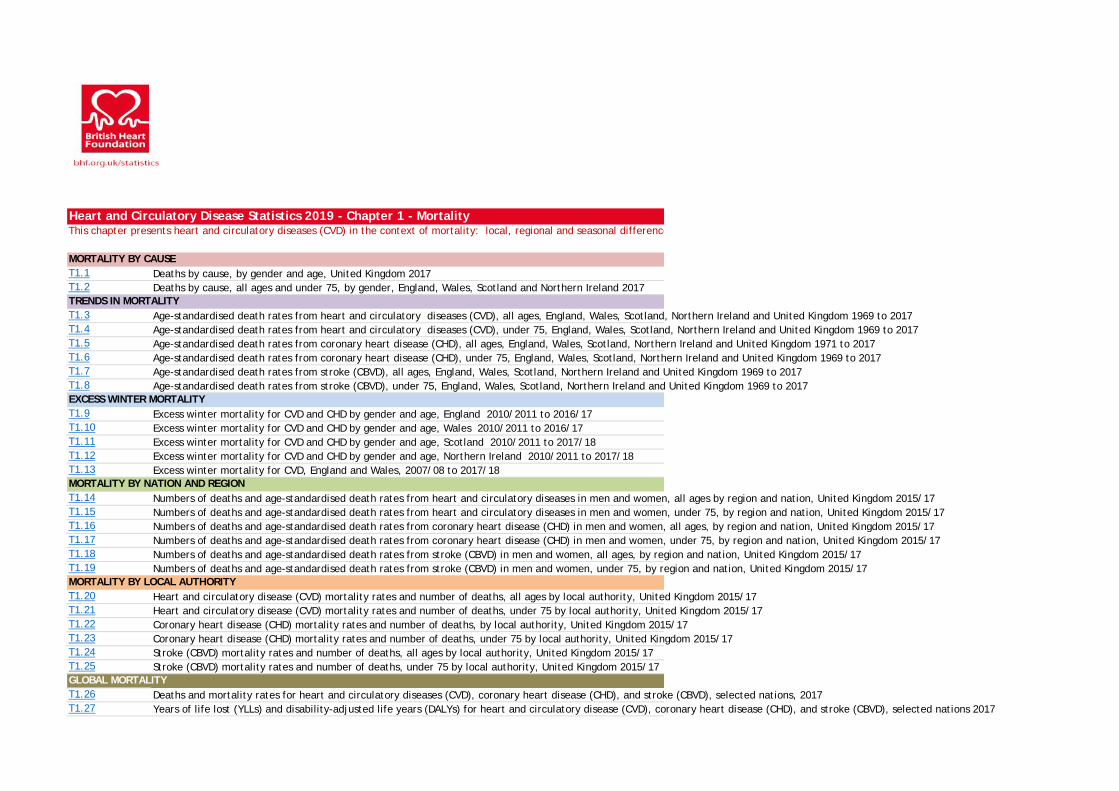
T1.1 Deaths by cause, by gender and age, United Kingdom 2017T1.2 Deaths by cause, all ages and under 75, by gender, England, Wales, Scotland and Northern Ireland 2017
T1.3 Age-standardised death rates from heart and circulatory diseases (CVD), all ages, England, Wales, Scotland, Northern Ireland and United Kingdom 1969 to 2017T1.4 Age-standardised death rates from heart and circulatory diseases (CVD), under 75, England, Wales, Scotland, Northern Ireland and United Kingdom 1969 to 2017T1.5 Age-standardised death rates from coronary heart disease (CHD), all ages, England, Wales, Scotland, Northern Ireland and United Kingdom 1971 to 2017T1.6 Age-standardised death rates from coronary heart disease (CHD), under 75, England, Wales, Scotland, Northern Ireland and United Kingdom 1969 to 2017T1.7 Age-standardised death rates from stroke (CBVD), all ages, England, Wales, Scotland, Northern Ireland and United Kingdom 1969 to 2017T1.8 Age-standardised death rates from stroke (CBVD), under 75, England, Wales, Scotland, Northern Ireland and United Kingdom 1969 to 2017
T1.9 Excess winter mortality for CVD and CHD by gender and age, England 2010/2011 to 2016/17T1.10 Excess winter mortality for CVD and CHD by gender and age, Wales 2010/2011 to 2016/17T1.11 Excess winter mortality for CVD and CHD by gender and age, Scotland 2010/2011 to 2017/18T1.12 Excess winter mortality for CVD and CHD by gender and age, Northern Ireland 2010/2011 to 2017/18T1.13 Excess winter mortality for CVD, England and Wales, 2007/08 to 2017/18
T1.14 Numbers of deaths and age-standardised death rates from heart and circulatory diseases in men and women, all ages by region and nation, United Kingdom 2015/17T1.15 Numbers of deaths and age-standardised death rates from heart and circulatory diseases in men and women, under 75, by region and nation, United Kingdom 2015/17T1.16 Numbers of deaths and age-standardised death rates from coronary heart disease (CHD) in men and women, all ages, by region and nation, United Kingdom 2015/17T1.17 Numbers of deaths and age-standardised death rates from coronary heart disease (CHD) in men and women, under 75, by region and nation, United Kingdom 2015/17T1.18 Numbers of deaths and age-standardised death rates from stroke (CBVD) in men and women, all ages, by region and nation, United Kingdom 2015/17T1.19 Numbers of deaths and age-standardised death rates from stroke (CBVD) in men and women, under 75, by region and nation, United Kingdom 2015/17
T1.20 Heart and circulatory disease (CVD) mortality rates and number of deaths, all ages by local authority, United Kingdom 2015/17T1.21 Heart and circulatory disease (CVD) mortality rates and number of deaths, under 75 by local authority, United Kingdom 2015/17T1.22 Coronary heart disease (CHD) mortality rates and number of deaths, by local authority, United Kingdom 2015/17T1.23 Coronary heart disease (CHD) mortality rates and number of deaths, under 75 by local authority, United Kingdom 2015/17T1.24 Stroke (CBVD) mortality rates and number of deaths, all ages by local authority, United Kingdom 2015/17T1.25 Stroke (CBVD) mortality rates and number of deaths, under 75 by local authority, United Kingdom 2015/17
T1.26 Deaths and mortality rates for heart and circulatory diseases (CVD), coronary heart disease (CHD), and stroke (CBVD), selected nations, 2017T1.27 Years of life lost (YLLs) and disability-adjusted life years (DALYs) for heart and circulatory disease (CVD), coronary heart disease (CHD), and stroke (CBVD), selected nations 2017
MORTALITY BY LOCAL AUTHORITY
GLOBAL MORTALITY
TRENDS IN MORTALITY
Heart and Circulatory Disease Statistics 2019 - Chapter 1 - MortalityThis chapter presents heart and circulatory diseases (CVD) in the context of mortality: local, regional and seasonal difference
MORTALITY BY CAUSE
EXCESS WINTER MORTALITY
MORTALITY BY NATION AND REGION
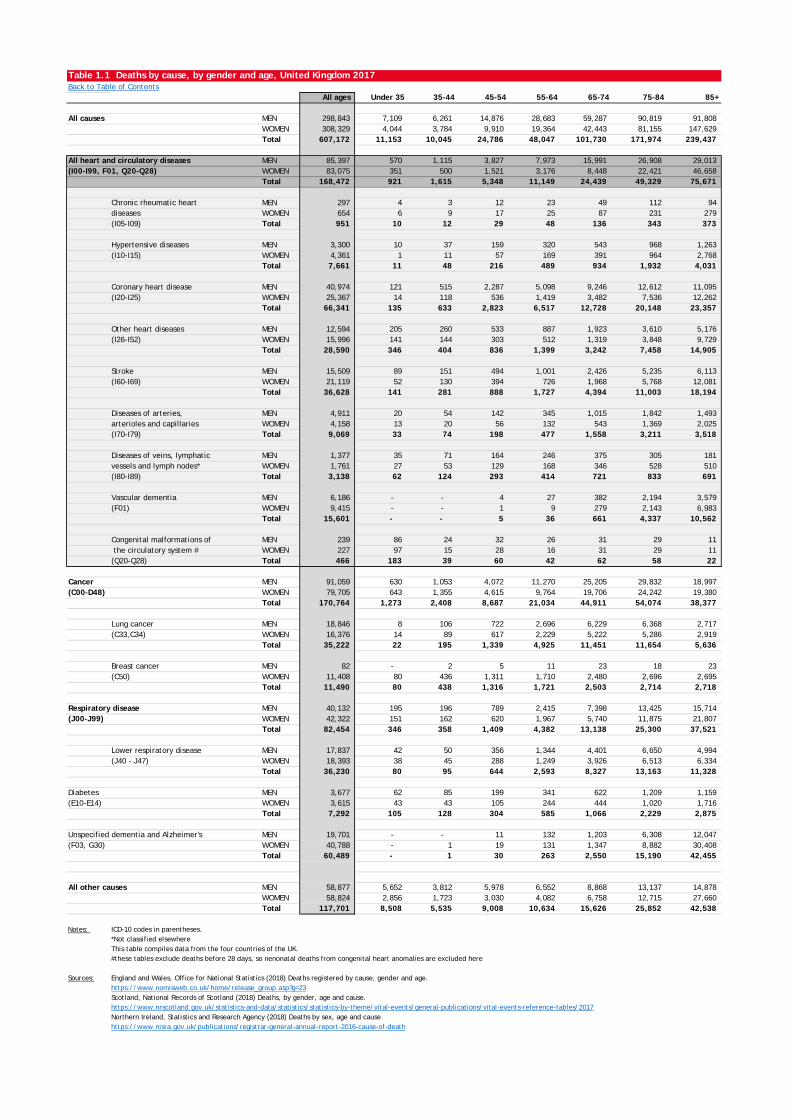
Table 1.1 Deaths by cause, by gender and age, United Kingdom 2017Back to Table of Contents TOTAL_20 3 25 26 27 28 29 30 31
TOTAL_20 All ages Under 35 35-44 45-54 55-64 65-74 75-84 85+5 28 29 30 31 32 33 34
All causes MEN 298,843 7,109 6,261 14,876 28,683 59,287 90,819 91,808 WOMEN 308,329 4,044 3,784 9,910 19,364 42,443 81,155 147,629 Total 607,172 11,153 10,045 24,786 48,047 101,730 171,974 239,437
All heart and circulatory diseases MEN 85,397 570 1,115 3,827 7,973 15,991 26,908 29,013 (I00-I99, F01, Q20-Q28) WOMEN 83,075 351 500 1,521 3,176 8,448 22,421 46,658
Total 168,472 921 1,615 5,348 11,149 24,439 49,329 75,671
Chronic rheumatic heart MEN 297 4 3 12 23 49 112 94 diseases WOMEN 654 6 9 17 25 87 231 279 (I05-I09) Total 951 10 12 29 48 136 343 373
Hypertensive diseases MEN 3,300 10 37 159 320 543 968 1,263 (I10-I15) WOMEN 4,361 1 11 57 169 391 964 2,768
Total 7,661 11 48 216 489 934 1,932 4,031
Coronary heart disease MEN 40,974 121 515 2,287 5,098 9,246 12,612 11,095 (I20-I25) WOMEN 25,367 14 118 536 1,419 3,482 7,536 12,262
Total 66,341 135 633 2,823 6,517 12,728 20,148 23,357
Other heart diseases MEN 12,594 205 260 533 887 1,923 3,610 5,176 (I26-I52) WOMEN 15,996 141 144 303 512 1,319 3,848 9,729
Total 28,590 346 404 836 1,399 3,242 7,458 14,905
Stroke MEN 15,509 89 151 494 1,001 2,426 5,235 6,113 (I60-I69) WOMEN 21,119 52 130 394 726 1,968 5,768 12,081
Total 36,628 141 281 888 1,727 4,394 11,003 18,194
Diseases of arteries, MEN 4,911 20 54 142 345 1,015 1,842 1,493 arterioles and capillaries WOMEN 4,158 13 20 56 132 543 1,369 2,025 (I70-I79) Total 9,069 33 74 198 477 1,558 3,211 3,518
Diseases of veins, lymphatic MEN 1,377 35 71 164 246 375 305 181 vessels and lymph nodes* WOMEN 1,761 27 53 129 168 346 528 510 (I80-I89) Total 3,138 62 124 293 414 721 833 691
Vascular dementia MEN 6,186 - - 4 27 382 2,194 3,579 (F01) WOMEN 9,415 - - 1 9 279 2,143 6,983
Total 15,601 - - 5 36 661 4,337 10,562
Congenital malformations of MEN 239 86 24 32 26 31 29 11 the circulatory system # WOMEN 227 97 15 28 16 31 29 11 (Q20-Q28) Total 466 183 39 60 42 62 58 22
Cancer MEN 91,059 630 1,053 4,072 11,270 25,205 29,832 18,997 (C00-D48) WOMEN 79,705 643 1,355 4,615 9,764 19,706 24,242 19,380
Total 170,764 1,273 2,408 8,687 21,034 44,911 54,074 38,377
Lung cancer MEN 18,846 8 106 722 2,696 6,229 6,368 2,717 (C33,C34) WOMEN 16,376 14 89 617 2,229 5,222 5,286 2,919
Total 35,222 22 195 1,339 4,925 11,451 11,654 5,636
Breast cancer MEN 82 - 2 5 11 23 18 23 (C50) WOMEN 11,408 80 436 1,311 1,710 2,480 2,696 2,695
Total 11,490 80 438 1,316 1,721 2,503 2,714 2,718
Respiratory disease MEN 40,132 195 196 789 2,415 7,398 13,425 15,714 (J00-J99) WOMEN 42,322 151 162 620 1,967 5,740 11,875 21,807
Total 82,454 346 358 1,409 4,382 13,138 25,300 37,521
Lower respiratory disease MEN 17,837 42 50 356 1,344 4,401 6,650 4,994 (J40 - J47) WOMEN 18,393 38 45 288 1,249 3,926 6,513 6,334
Total 36,230 80 95 644 2,593 8,327 13,163 11,328
Diabetes MEN 3,677 62 85 199 341 622 1,209 1,159 (E10-E14) WOMEN 3,615 43 43 105 244 444 1,020 1,716
Total 7,292 105 128 304 585 1,066 2,229 2,875
Unspecified dementia and Alzheimer's MEN 19,701 - - 11 132 1,203 6,308 12,047 (F03, G30) WOMEN 40,788 - 1 19 131 1,347 8,882 30,408
Total 60,489 - 1 30 263 2,550 15,190 42,455
All other causes MEN 58,877 5,652 3,812 5,978 6,552 8,868 13,137 14,878 WOMEN 58,824 2,856 1,723 3,030 4,082 6,758 12,715 27,660 Total 117,701 8,508 5,535 9,008 10,634 15,626 25,852 42,538
Notes: ICD-10 codes in parentheses. *Not classified elsewhereThis table compiles data from the four countries of the UK.#these tables exclude deaths before 28 days, so nenonatal deaths from congenital heart anomalies are excluded here
Sources: England and Wales, Office for National Statistics (2018) Deaths registered by cause, gender and age. https://www.nomisweb.co.uk/home/release_group.asp?g=23Scotland, National Records of Scotland (2018) Deaths, by gender, age and cause. https://www.nrscotland.gov.uk/statistics-and-data/statistics/statistics-by-theme/vital-events/general-publications/vital-events-reference-tables/2017Northern Ireland, Statistics and Research Agency (2018) Deaths by sex, age and cause https://www.nisra.gov.uk/publications/registrar-general-annual-report-2016-cause-of-death
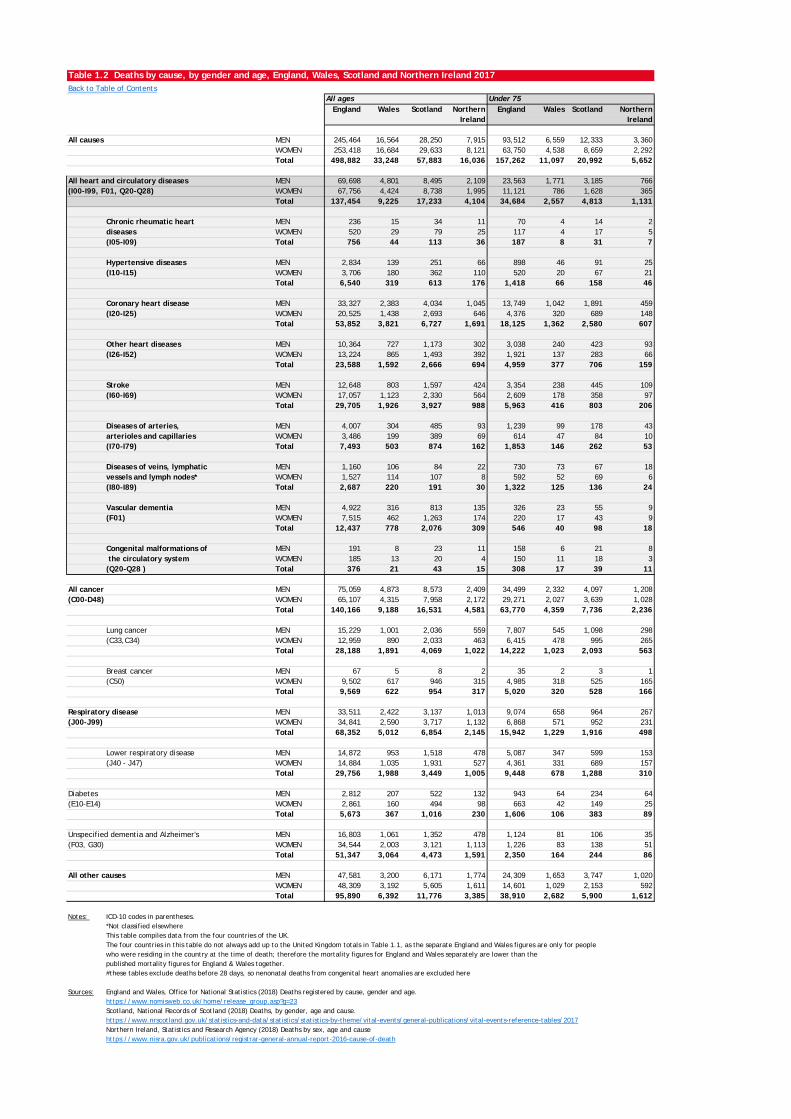
Table 1.2 Deaths by cause, by gender and age, England, Wales, Scotland and Northern Ireland 2017Back to Table of Contents
2017 All ages Under 75England Wales Scotland Northern England Wales Scotland Northern
Ireland Ireland
All causes MEN 245,464 16,564 28,250 7,915 93,512 6,559 12,333 3,360WOMEN 253,418 16,684 29,633 8,121 63,750 4,538 8,659 2,292Total 498,882 33,248 57,883 16,036 157,262 11,097 20,992 5,652
All heart and circulatory diseases MEN 69,698 4,801 8,495 2,109 23,563 1,771 3,185 766(I00-I99, F01, Q20-Q28) WOMEN 67,756 4,424 8,738 1,995 11,121 786 1,628 365
Total 137,454 9,225 17,233 4,104 34,684 2,557 4,813 1,131
Chronic rheumatic heart MEN 236 15 34 11 70 4 14 2diseases WOMEN 520 29 79 25 117 4 17 5(I05-I09) Total 756 44 113 36 187 8 31 7
Hypertensive diseases MEN 2,834 139 251 66 898 46 91 25(I10-I15) WOMEN 3,706 180 362 110 520 20 67 21
Total 6,540 319 613 176 1,418 66 158 46
Coronary heart disease MEN 33,327 2,383 4,034 1,045 13,749 1,042 1,891 459(I20-I25) WOMEN 20,525 1,438 2,693 646 4,376 320 689 148
Total 53,852 3,821 6,727 1,691 18,125 1,362 2,580 607
Other heart diseases MEN 10,364 727 1,173 302 3,038 240 423 93(I26-I52) WOMEN 13,224 865 1,493 392 1,921 137 283 66
Total 23,588 1,592 2,666 694 4,959 377 706 159
Stroke MEN 12,648 803 1,597 424 3,354 238 445 109(I60-I69) WOMEN 17,057 1,123 2,330 564 2,609 178 358 97
Total 29,705 1,926 3,927 988 5,963 416 803 206
Diseases of arteries, MEN 4,007 304 485 93 1,239 99 178 43arterioles and capillaries WOMEN 3,486 199 389 69 614 47 84 10(I70-I79) Total 7,493 503 874 162 1,853 146 262 53
Diseases of veins, lymphatic MEN 1,160 106 84 22 730 73 67 18vessels and lymph nodes* WOMEN 1,527 114 107 8 592 52 69 6(I80-I89) Total 2,687 220 191 30 1,322 125 136 24
Vascular dementia MEN 4,922 316 813 135 326 23 55 9(F01) WOMEN 7,515 462 1,263 174 220 17 43 9
Total 12,437 778 2,076 309 546 40 98 18
Congenital malformations of MEN 191 8 23 11 158 6 21 8 the circulatory system WOMEN 185 13 20 4 150 11 18 3(Q20-Q28 ) Total 376 21 43 15 308 17 39 11
All cancer MEN 75,059 4,873 8,573 2,409 34,499 2,332 4,097 1,208(C00-D48) WOMEN 65,107 4,315 7,958 2,172 29,271 2,027 3,639 1,028
Total 140,166 9,188 16,531 4,581 63,770 4,359 7,736 2,236
Lung cancer MEN 15,229 1,001 2,036 559 7,807 545 1,098 298(C33,C34) WOMEN 12,959 890 2,033 463 6,415 478 995 265
Total 28,188 1,891 4,069 1,022 14,222 1,023 2,093 563
Breast cancer MEN 67 5 8 2 35 2 3 1(C50) WOMEN 9,502 617 946 315 4,985 318 525 165
Total 9,569 622 954 317 5,020 320 528 166
Respiratory disease MEN 33,511 2,422 3,137 1,013 9,074 658 964 267(J00-J99) WOMEN 34,841 2,590 3,717 1,132 6,868 571 952 231
Total 68,352 5,012 6,854 2,145 15,942 1,229 1,916 498
Lower respiratory disease MEN 14,872 953 1,518 478 5,087 347 599 153(J40 - J47) WOMEN 14,884 1,035 1,931 527 4,361 331 689 157
Total 29,756 1,988 3,449 1,005 9,448 678 1,288 310
Diabetes MEN 2,812 207 522 132 943 64 234 64(E10-E14) WOMEN 2,861 160 494 98 663 42 149 25
Total 5,673 367 1,016 230 1,606 106 383 89
Unspecified dementia and Alzheimer's MEN 16,803 1,061 1,352 478 1,124 81 106 35(F03, G30) WOMEN 34,544 2,003 3,121 1,113 1,226 83 138 51
Total 51,347 3,064 4,473 1,591 2,350 164 244 86
All other causes MEN 47,581 3,200 6,171 1,774 24,309 1,653 3,747 1,020WOMEN 48,309 3,192 5,605 1,611 14,601 1,029 2,153 592Total 95,890 6,392 11,776 3,385 38,910 2,682 5,900 1,612
Notes: ICD-10 codes in parentheses. *Not classified elsewhereThis table compiles data from the four countries of the UK. The four countries in this table do not always add up to the United Kingdom totals in Table 1.1, as the separate England and Wales figures are only for people who were residing in the country at the time of death; therefore the mortality figures for England and Wales separately are lower than thepublished mortality figures for England & Wales together.#these tables exclude deaths before 28 days, so nenonatal deaths from congenital heart anomalies are excluded here
Sources: England and Wales, Office for National Statistics (2018) Deaths registered by cause, gender and age. https://www.nomisweb.co.uk/home/release_group.asp?g=23Scotland, National Records of Scotland (2018) Deaths, by gender, age and cause. https://www.nrscotland.gov.uk/statistics-and-data/statistics/statistics-by-theme/vital-events/general-publications/vital-events-reference-tables/2017Northern Ireland, Statistics and Research Agency (2018) Deaths by sex, age and cause https://www.nisra.gov.uk/publications/registrar-general-annual-report-2016-cause-of-death
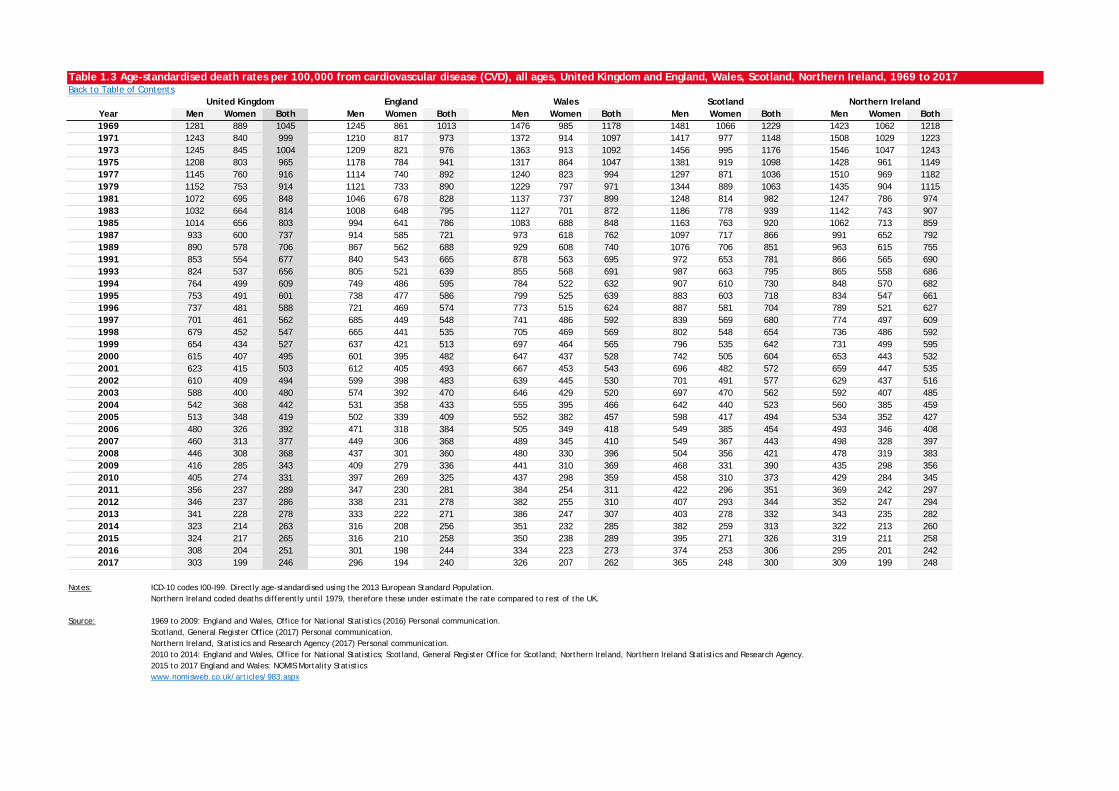
Table 1.3 Age-standardised death rates per 100,000 from cardiovascular disease (CVD), all ages, United Kingdom and England, Wales, Scotland, Northern Ireland, 1969 to 2017Back to Table of Contents
Year Men Women Both Men Women Both Men Women Both Men Women Both Men Women Both1969 1281 889 1045 1245 861 1013 1476 985 1178 1481 1066 1229 1423 1062 12181971 1243 840 999 1210 817 973 1372 914 1097 1417 977 1148 1508 1029 12231973 1245 845 1004 1209 821 976 1363 913 1092 1456 995 1176 1546 1047 12431975 1208 803 965 1178 784 941 1317 864 1047 1381 919 1098 1428 961 11491977 1145 760 916 1114 740 892 1240 823 994 1297 871 1036 1510 969 11821979 1152 753 914 1121 733 890 1229 797 971 1344 889 1063 1435 904 11151981 1072 695 848 1046 678 828 1137 737 899 1248 814 982 1247 786 9741983 1032 664 814 1008 648 795 1127 701 872 1186 778 939 1142 743 9071985 1014 656 803 994 641 786 1083 688 848 1163 763 920 1062 713 8591987 933 600 737 914 585 721 973 618 762 1097 717 866 991 652 7921989 890 578 706 867 562 688 929 608 740 1076 706 851 963 615 7551991 853 554 677 840 543 665 878 563 695 972 653 781 866 565 6901993 824 537 656 805 521 639 855 568 691 987 663 795 865 558 6861994 764 499 609 749 486 595 784 522 632 907 610 730 848 570 6821995 753 491 601 738 477 586 799 525 639 883 603 718 834 547 6611996 737 481 588 721 469 574 773 515 624 887 581 704 789 521 6271997 701 461 562 685 449 548 741 486 592 839 569 680 774 497 6091998 679 452 547 665 441 535 705 469 569 802 548 654 736 486 5921999 654 434 527 637 421 513 697 464 565 796 535 642 731 499 5952000 615 407 495 601 395 482 647 437 528 742 505 604 653 443 5322001 623 415 503 612 405 493 667 453 543 696 482 572 659 447 5352002 610 409 494 599 398 483 639 445 530 701 491 577 629 437 5162003 588 400 480 574 392 470 646 429 520 697 470 562 592 407 4852004 542 368 442 531 358 433 555 395 466 642 440 523 560 385 4592005 513 348 419 502 339 409 552 382 457 598 417 494 534 352 4272006 480 326 392 471 318 384 505 349 418 549 385 454 493 346 4082007 460 313 377 449 306 368 489 345 410 549 367 443 498 328 3972008 446 308 368 437 301 360 480 330 396 504 356 421 478 319 3832009 416 285 343 409 279 336 441 310 369 468 331 390 435 298 3562010 405 274 331 397 269 325 437 298 359 458 310 373 429 284 3452011 356 237 289 347 230 281 384 254 311 422 296 351 369 242 2972012 346 237 286 338 231 278 382 255 310 407 293 344 352 247 2942013 341 228 278 333 222 271 386 247 307 403 278 332 343 235 2822014 323 214 263 316 208 256 351 232 285 382 259 313 322 213 2602015 324 217 265 316 210 258 350 238 289 395 271 326 319 211 2582016 308 204 251 301 198 244 334 223 273 374 253 306 295 201 2422017 303 199 246 296 194 240 326 207 262 365 248 300 309 199 248
Notes: ICD-10 codes I00-I99. Directly age-standardised using the 2013 European Standard Population.Northern Ireland coded deaths differently until 1979, therefore these under estimate the rate compared to rest of the UK.
Source: 1969 to 2009: England and Wales, Office for National Statistics (2016) Personal communication. Scotland, General Register Office (2017) Personal communication.Northern Ireland, Statistics and Research Agency (2017) Personal communication.2010 to 2014: England and Wales, Office for National Statistics; Scotland, General Register Office for Scotland; Northern Ireland, Northern Ireland Statistics and Research Agency.2015 to 2017 England and Wales: NOMIS Mortality Statisticswww.nomisweb.co.uk/articles/983.aspx
United Kingdom England ScotlandWales Northern Ireland
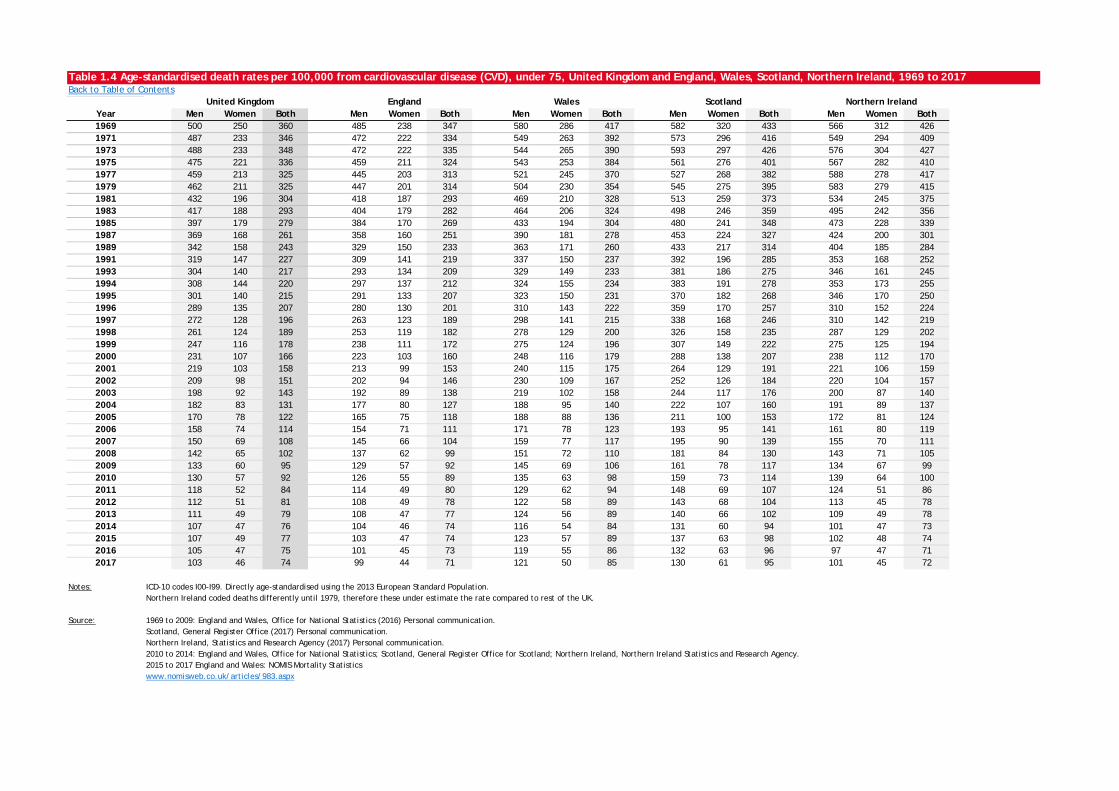
Table 1.4 Age-standardised death rates per 100,000 from cardiovascular disease (CVD), under 75, United Kingdom and England, Wales, Scotland, Northern Ireland, 1969 to 2017Back to Table of Contents
Year Men Women Both Men Women Both Men Women Both Men Women Both Men Women Both1969 500 250 360 485 238 347 580 286 417 582 320 433 566 312 4261971 487 233 346 472 222 334 549 263 392 573 296 416 549 294 4091973 488 233 348 472 222 335 544 265 390 593 297 426 576 304 4271975 475 221 336 459 211 324 543 253 384 561 276 401 567 282 4101977 459 213 325 445 203 313 521 245 370 527 268 382 588 278 4171979 462 211 325 447 201 314 504 230 354 545 275 395 583 279 4151981 432 196 304 418 187 293 469 210 328 513 259 373 534 245 3751983 417 188 293 404 179 282 464 206 324 498 246 359 495 242 3561985 397 179 279 384 170 269 433 194 304 480 241 348 473 228 3391987 369 168 261 358 160 251 390 181 278 453 224 327 424 200 3011989 342 158 243 329 150 233 363 171 260 433 217 314 404 185 2841991 319 147 227 309 141 219 337 150 237 392 196 285 353 168 2521993 304 140 217 293 134 209 329 149 233 381 186 275 346 161 2451994 308 144 220 297 137 212 324 155 234 383 191 278 353 173 2551995 301 140 215 291 133 207 323 150 231 370 182 268 346 170 2501996 289 135 207 280 130 201 310 143 222 359 170 257 310 152 2241997 272 128 196 263 123 189 298 141 215 338 168 246 310 142 2191998 261 124 189 253 119 182 278 129 200 326 158 235 287 129 2021999 247 116 178 238 111 172 275 124 196 307 149 222 275 125 1942000 231 107 166 223 103 160 248 116 179 288 138 207 238 112 1702001 219 103 158 213 99 153 240 115 175 264 129 191 221 106 1592002 209 98 151 202 94 146 230 109 167 252 126 184 220 104 1572003 198 92 143 192 89 138 219 102 158 244 117 176 200 87 1402004 182 83 131 177 80 127 188 95 140 222 107 160 191 89 1372005 170 78 122 165 75 118 188 88 136 211 100 153 172 81 1242006 158 74 114 154 71 111 171 78 123 193 95 141 161 80 1192007 150 69 108 145 66 104 159 77 117 195 90 139 155 70 1112008 142 65 102 137 62 99 151 72 110 181 84 130 143 71 1052009 133 60 95 129 57 92 145 69 106 161 78 117 134 67 992010 130 57 92 126 55 89 135 63 98 159 73 114 139 64 1002011 118 52 84 114 49 80 129 62 94 148 69 107 124 51 862012 112 51 81 108 49 78 122 58 89 143 68 104 113 45 782013 111 49 79 108 47 77 124 56 89 140 66 102 109 49 782014 107 47 76 104 46 74 116 54 84 131 60 94 101 47 732015 107 49 77 103 47 74 123 57 89 137 63 98 102 48 742016 105 47 75 101 45 73 119 55 86 132 63 96 97 47 712017 103 46 74 99 44 71 121 50 85 130 61 95 101 45 72
Notes: ICD-10 codes I00-I99. Directly age-standardised using the 2013 European Standard Population.Northern Ireland coded deaths differently until 1979, therefore these under estimate the rate compared to rest of the UK.
Source: 1969 to 2009: England and Wales, Office for National Statistics (2016) Personal communication. Scotland, General Register Office (2017) Personal communication.Northern Ireland, Statistics and Research Agency (2017) Personal communication.2010 to 2014: England and Wales, Office for National Statistics; Scotland, General Register Office for Scotland; Northern Ireland, Northern Ireland Statistics and Research Agency.2015 to 2017 England and Wales: NOMIS Mortality Statisticswww.nomisweb.co.uk/articles/983.aspx
United Kingdom England Wales Scotland Northern Ireland
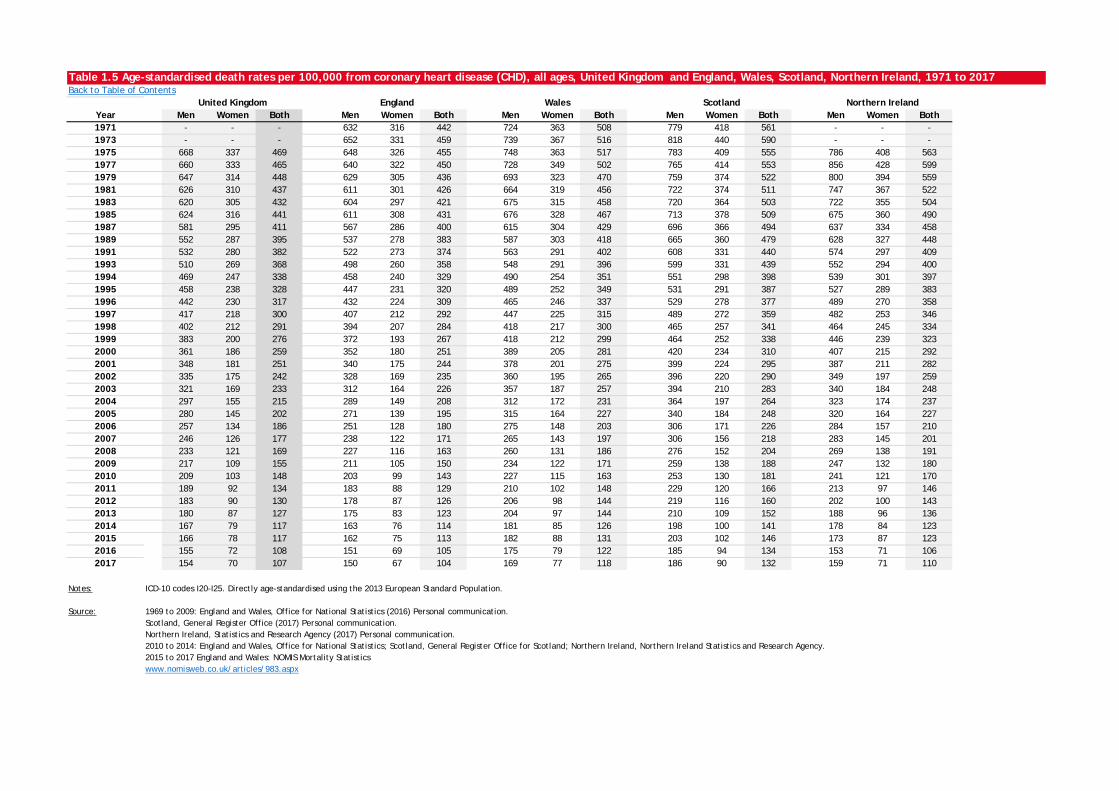
Table 1.5 Age-standardised death rates per 100,000 from coronary heart disease (CHD), all ages, United Kingdom and England, Wales, Scotland, Northern Ireland, 1971 to 2017Back to Table of Contents
Year Men Women Both Men Women Both Men Women Both Men Women Both Men Women Both1971 - - - 632 316 442 724 363 508 779 418 561 - - -1973 - - - 652 331 459 739 367 516 818 440 590 - - -1975 668 337 469 648 326 455 748 363 517 783 409 555 786 408 5631977 660 333 465 640 322 450 728 349 502 765 414 553 856 428 5991979 647 314 448 629 305 436 693 323 470 759 374 522 800 394 5591981 626 310 437 611 301 426 664 319 456 722 374 511 747 367 5221983 620 305 432 604 297 421 675 315 458 720 364 503 722 355 5041985 624 316 441 611 308 431 676 328 467 713 378 509 675 360 4901987 581 295 411 567 286 400 615 304 429 696 366 494 637 334 4581989 552 287 395 537 278 383 587 303 418 665 360 479 628 327 4481991 532 280 382 522 273 374 563 291 402 608 331 440 574 297 4091993 510 269 368 498 260 358 548 291 396 599 331 439 552 294 4001994 469 247 338 458 240 329 490 254 351 551 298 398 539 301 3971995 458 238 328 447 231 320 489 252 349 531 291 387 527 289 3831996 442 230 317 432 224 309 465 246 337 529 278 377 489 270 3581997 417 218 300 407 212 292 447 225 315 489 272 359 482 253 3461998 402 212 291 394 207 284 418 217 300 465 257 341 464 245 3341999 383 200 276 372 193 267 418 212 299 464 252 338 446 239 3232000 361 186 259 352 180 251 389 205 281 420 234 310 407 215 2922001 348 181 251 340 175 244 378 201 275 399 224 295 387 211 2822002 335 175 242 328 169 235 360 195 265 396 220 290 349 197 2592003 321 169 233 312 164 226 357 187 257 394 210 283 340 184 2482004 297 155 215 289 149 208 312 172 231 364 197 264 323 174 2372005 280 145 202 271 139 195 315 164 227 340 184 248 320 164 2272006 257 134 186 251 128 180 275 148 203 306 171 226 284 157 2102007 246 126 177 238 122 171 265 143 197 306 156 218 283 145 2012008 233 121 169 227 116 163 260 131 186 276 152 204 269 138 1912009 217 109 155 211 105 150 234 122 171 259 138 188 247 132 1802010 209 103 148 203 99 143 227 115 163 253 130 181 241 121 1702011 189 92 134 183 88 129 210 102 148 229 120 166 213 97 1462012 183 90 130 178 87 126 206 98 144 219 116 160 202 100 1432013 180 87 127 175 83 123 204 97 144 210 109 152 188 96 1362014 167 79 117 163 76 114 181 85 126 198 100 141 178 84 1232015 166 78 117 162 75 113 182 88 131 203 102 146 173 87 1232016 155 72 108 151 69 105 175 79 122 185 94 134 153 71 1062017 154 70 107 150 67 104 169 77 118 186 90 132 159 71 110
Notes: ICD-10 codes I20-I25. Directly age-standardised using the 2013 European Standard Population.
Source: 1969 to 2009: England and Wales, Office for National Statistics (2016) Personal communication. Scotland, General Register Office (2017) Personal communication.Northern Ireland, Statistics and Research Agency (2017) Personal communication.2010 to 2014: England and Wales, Office for National Statistics; Scotland, General Register Office for Scotland; Northern Ireland, Northern Ireland Statistics and Research Agency.2015 to 2017 England and Wales: NOMIS Mortality Statisticswww.nomisweb.co.uk/articles/983.aspx
United Kingdom England Wales Scotland Northern Ireland
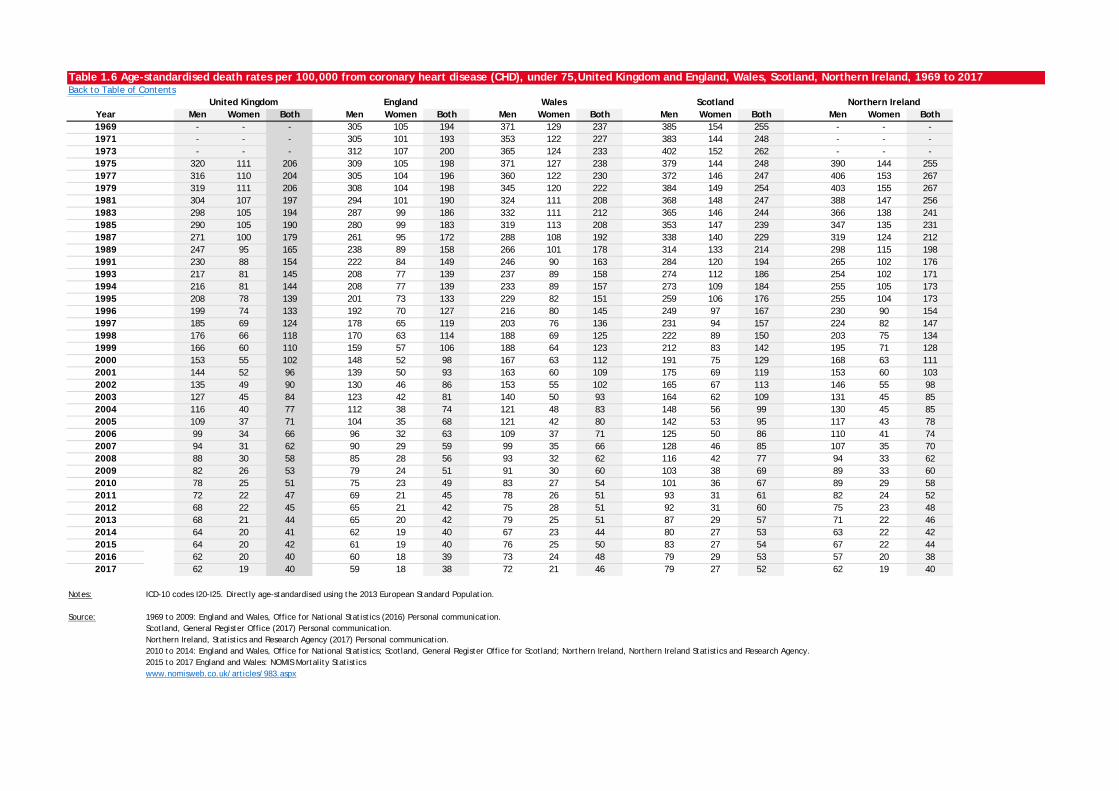
Table 1.6 Age-standardised death rates per 100,000 from coronary heart disease (CHD), under 75,United Kingdom and England, Wales, Scotland, Northern Ireland, 1969 to 2017Back to Table of Contents
Year Men Women Both Men Women Both Men Women Both Men Women Both Men Women Both1969 - - - 305 105 194 371 129 237 385 154 255 - - -1971 - - - 305 101 193 353 122 227 383 144 248 - - -1973 - - - 312 107 200 365 124 233 402 152 262 - - -1975 320 111 206 309 105 198 371 127 238 379 144 248 390 144 2551977 316 110 204 305 104 196 360 122 230 372 146 247 406 153 2671979 319 111 206 308 104 198 345 120 222 384 149 254 403 155 2671981 304 107 197 294 101 190 324 111 208 368 148 247 388 147 2561983 298 105 194 287 99 186 332 111 212 365 146 244 366 138 2411985 290 105 190 280 99 183 319 113 208 353 147 239 347 135 2311987 271 100 179 261 95 172 288 108 192 338 140 229 319 124 2121989 247 95 165 238 89 158 266 101 178 314 133 214 298 115 1981991 230 88 154 222 84 149 246 90 163 284 120 194 265 102 1761993 217 81 145 208 77 139 237 89 158 274 112 186 254 102 1711994 216 81 144 208 77 139 233 89 157 273 109 184 255 105 1731995 208 78 139 201 73 133 229 82 151 259 106 176 255 104 1731996 199 74 133 192 70 127 216 80 145 249 97 167 230 90 1541997 185 69 124 178 65 119 203 76 136 231 94 157 224 82 1471998 176 66 118 170 63 114 188 69 125 222 89 150 203 75 1341999 166 60 110 159 57 106 188 64 123 212 83 142 195 71 1282000 153 55 102 148 52 98 167 63 112 191 75 129 168 63 1112001 144 52 96 139 50 93 163 60 109 175 69 119 153 60 1032002 135 49 90 130 46 86 153 55 102 165 67 113 146 55 982003 127 45 84 123 42 81 140 50 93 164 62 109 131 45 852004 116 40 77 112 38 74 121 48 83 148 56 99 130 45 852005 109 37 71 104 35 68 121 42 80 142 53 95 117 43 782006 99 34 66 96 32 63 109 37 71 125 50 86 110 41 742007 94 31 62 90 29 59 99 35 66 128 46 85 107 35 702008 88 30 58 85 28 56 93 32 62 116 42 77 94 33 622009 82 26 53 79 24 51 91 30 60 103 38 69 89 33 602010 78 25 51 75 23 49 83 27 54 101 36 67 89 29 582011 72 22 47 69 21 45 78 26 51 93 31 61 82 24 522012 68 22 45 65 21 42 75 28 51 92 31 60 75 23 482013 68 21 44 65 20 42 79 25 51 87 29 57 71 22 462014 64 20 41 62 19 40 67 23 44 80 27 53 63 22 422015 64 20 42 61 19 40 76 25 50 83 27 54 67 22 442016 62 20 40 60 18 39 73 24 48 79 29 53 57 20 382017 62 19 40 59 18 38 72 21 46 79 27 52 62 19 40
Notes: ICD-10 codes I20-I25. Directly age-standardised using the 2013 European Standard Population.
Source: 1969 to 2009: England and Wales, Office for National Statistics (2016) Personal communication. Scotland, General Register Office (2017) Personal communication.Northern Ireland, Statistics and Research Agency (2017) Personal communication.2010 to 2014: England and Wales, Office for National Statistics; Scotland, General Register Office for Scotland; Northern Ireland, Northern Ireland Statistics and Research Agency.2015 to 2017 England and Wales: NOMIS Mortality Statisticswww.nomisweb.co.uk/articles/983.aspx
United Kingdom England Wales Scotland Northern Ireland
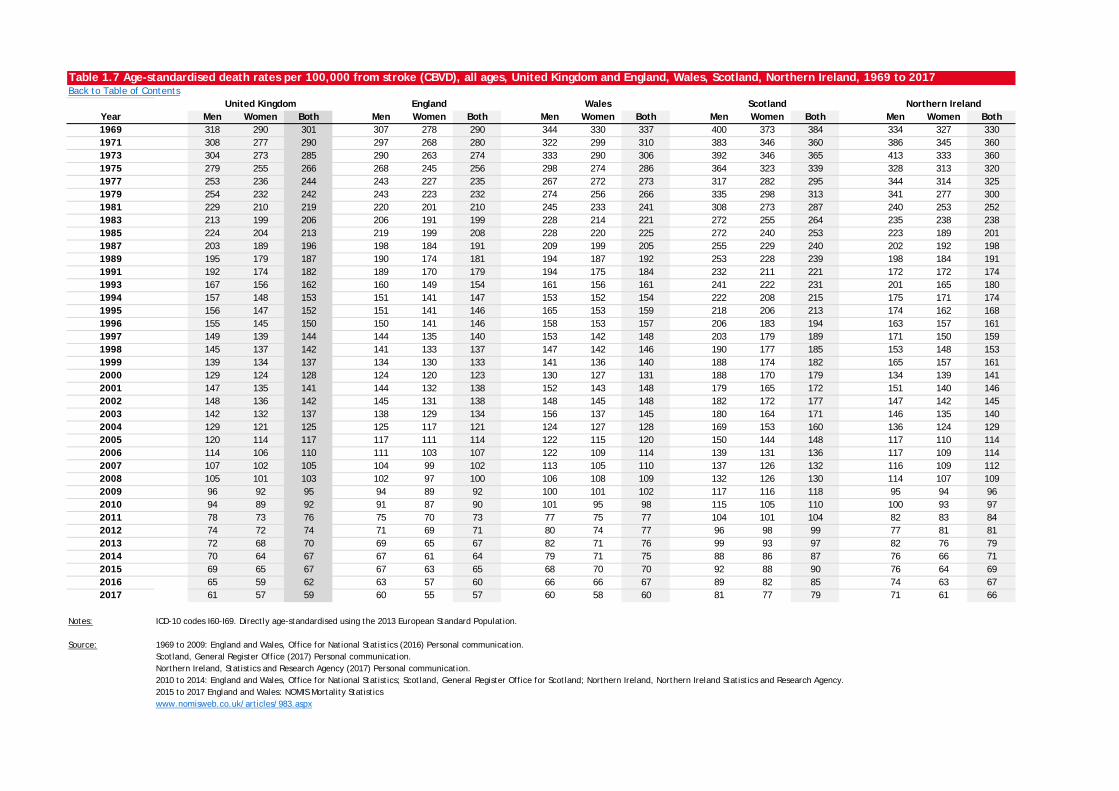
Table 1.7 Age-standardised death rates per 100,000 from stroke (CBVD), all ages, United Kingdom and England, Wales, Scotland, Northern Ireland, 1969 to 2017Back to Table of Contents
Year Men Women Both Men Women Both Men Women Both Men Women Both Men Women Both1969 318 290 301 307 278 290 344 330 337 400 373 384 334 327 3301971 308 277 290 297 268 280 322 299 310 383 346 360 386 345 3601973 304 273 285 290 263 274 333 290 306 392 346 365 413 333 3601975 279 255 266 268 245 256 298 274 286 364 323 339 328 313 3201977 253 236 244 243 227 235 267 272 273 317 282 295 344 314 3251979 254 232 242 243 223 232 274 256 266 335 298 313 341 277 3001981 229 210 219 220 201 210 245 233 241 308 273 287 240 253 2521983 213 199 206 206 191 199 228 214 221 272 255 264 235 238 2381985 224 204 213 219 199 208 228 220 225 272 240 253 223 189 2011987 203 189 196 198 184 191 209 199 205 255 229 240 202 192 1981989 195 179 187 190 174 181 194 187 192 253 228 239 198 184 1911991 192 174 182 189 170 179 194 175 184 232 211 221 172 172 1741993 167 156 162 160 149 154 161 156 161 241 222 231 201 165 1801994 157 148 153 151 141 147 153 152 154 222 208 215 175 171 1741995 156 147 152 151 141 146 165 153 159 218 206 213 174 162 1681996 155 145 150 150 141 146 158 153 157 206 183 194 163 157 1611997 149 139 144 144 135 140 153 142 148 203 179 189 171 150 1591998 145 137 142 141 133 137 147 142 146 190 177 185 153 148 1531999 139 134 137 134 130 133 141 136 140 188 174 182 165 157 1612000 129 124 128 124 120 123 130 127 131 188 170 179 134 139 1412001 147 135 141 144 132 138 152 143 148 179 165 172 151 140 1462002 148 136 142 145 131 138 148 145 148 182 172 177 147 142 1452003 142 132 137 138 129 134 156 137 145 180 164 171 146 135 1402004 129 121 125 125 117 121 124 127 128 169 153 160 136 124 1292005 120 114 117 117 111 114 122 115 120 150 144 148 117 110 1142006 114 106 110 111 103 107 122 109 114 139 131 136 117 109 1142007 107 102 105 104 99 102 113 105 110 137 126 132 116 109 1122008 105 101 103 102 97 100 106 108 109 132 126 130 114 107 1092009 96 92 95 94 89 92 100 101 102 117 116 118 95 94 962010 94 89 92 91 87 90 101 95 98 115 105 110 100 93 972011 78 73 76 75 70 73 77 75 77 104 101 104 82 83 842012 74 72 74 71 69 71 80 74 77 96 98 99 77 81 812013 72 68 70 69 65 67 82 71 76 99 93 97 82 76 792014 70 64 67 67 61 64 79 71 75 88 86 87 76 66 712015 69 65 67 67 63 65 68 70 70 92 88 90 76 64 692016 65 59 62 63 57 60 66 66 67 89 82 85 74 63 672017 61 57 59 60 55 57 60 58 60 81 77 79 71 61 66
Notes: ICD-10 codes I60-I69. Directly age-standardised using the 2013 European Standard Population.
Source: 1969 to 2009: England and Wales, Office for National Statistics (2016) Personal communication. Scotland, General Register Office (2017) Personal communication.Northern Ireland, Statistics and Research Agency (2017) Personal communication.2010 to 2014: England and Wales, Office for National Statistics; Scotland, General Register Office for Scotland; Northern Ireland, Northern Ireland Statistics and Research Agency.2015 to 2017 England and Wales: NOMIS Mortality Statisticswww.nomisweb.co.uk/articles/983.aspx
United Kingdom England Wales Scotland Northern Ireland
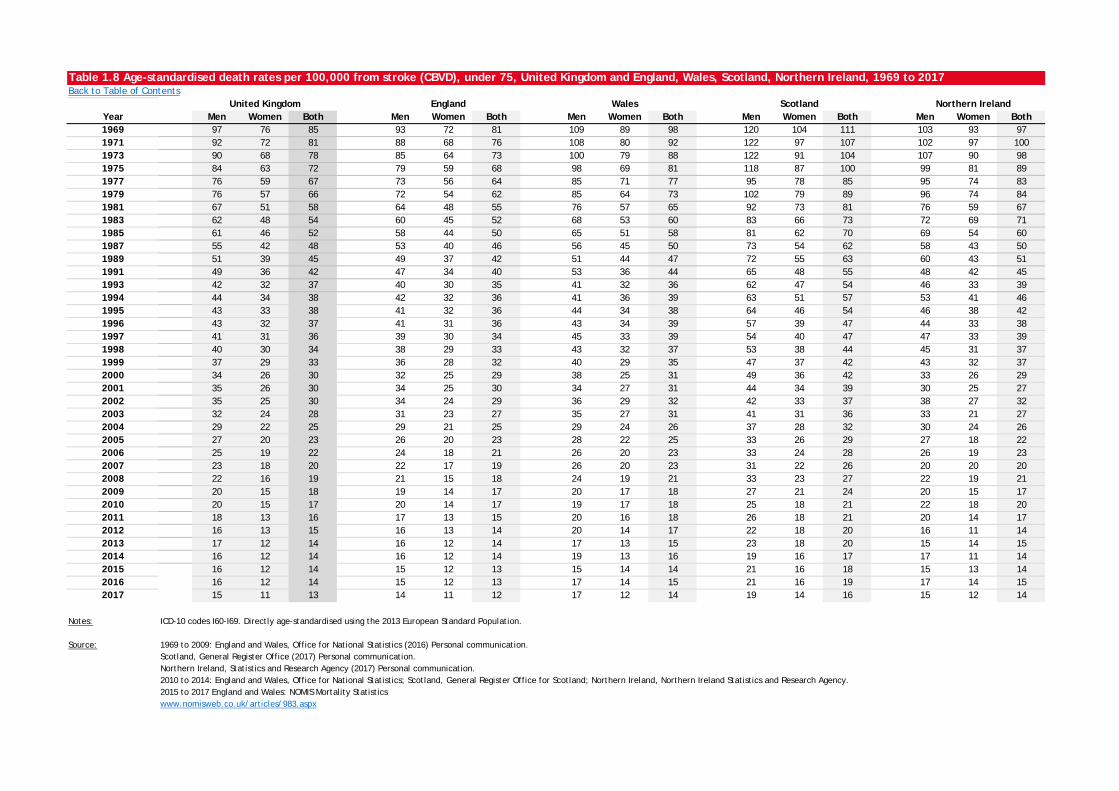
Table 1.8 Age-standardised death rates per 100,000 from stroke (CBVD), under 75, United Kingdom and England, Wales, Scotland, Northern Ireland, 1969 to 2017Back to Table of Contents
Year Men Women Both Men Women Both Men Women Both Men Women Both Men Women Both1969 97 76 85 93 72 81 109 89 98 120 104 111 103 93 971971 92 72 81 88 68 76 108 80 92 122 97 107 102 97 1001973 90 68 78 85 64 73 100 79 88 122 91 104 107 90 981975 84 63 72 79 59 68 98 69 81 118 87 100 99 81 891977 76 59 67 73 56 64 85 71 77 95 78 85 95 74 831979 76 57 66 72 54 62 85 64 73 102 79 89 96 74 841981 67 51 58 64 48 55 76 57 65 92 73 81 76 59 671983 62 48 54 60 45 52 68 53 60 83 66 73 72 69 711985 61 46 52 58 44 50 65 51 58 81 62 70 69 54 601987 55 42 48 53 40 46 56 45 50 73 54 62 58 43 501989 51 39 45 49 37 42 51 44 47 72 55 63 60 43 511991 49 36 42 47 34 40 53 36 44 65 48 55 48 42 451993 42 32 37 40 30 35 41 32 36 62 47 54 46 33 391994 44 34 38 42 32 36 41 36 39 63 51 57 53 41 461995 43 33 38 41 32 36 44 34 38 64 46 54 46 38 421996 43 32 37 41 31 36 43 34 39 57 39 47 44 33 381997 41 31 36 39 30 34 45 33 39 54 40 47 47 33 391998 40 30 34 38 29 33 43 32 37 53 38 44 45 31 371999 37 29 33 36 28 32 40 29 35 47 37 42 43 32 372000 34 26 30 32 25 29 38 25 31 49 36 42 33 26 292001 35 26 30 34 25 30 34 27 31 44 34 39 30 25 272002 35 25 30 34 24 29 36 29 32 42 33 37 38 27 322003 32 24 28 31 23 27 35 27 31 41 31 36 33 21 272004 29 22 25 29 21 25 29 24 26 37 28 32 30 24 262005 27 20 23 26 20 23 28 22 25 33 26 29 27 18 222006 25 19 22 24 18 21 26 20 23 33 24 28 26 19 232007 23 18 20 22 17 19 26 20 23 31 22 26 20 20 202008 22 16 19 21 15 18 24 19 21 33 23 27 22 19 212009 20 15 18 19 14 17 20 17 18 27 21 24 20 15 172010 20 15 17 20 14 17 19 17 18 25 18 21 22 18 202011 18 13 16 17 13 15 20 16 18 26 18 21 20 14 172012 16 13 15 16 13 14 20 14 17 22 18 20 16 11 142013 17 12 14 16 12 14 17 13 15 23 18 20 15 14 152014 16 12 14 16 12 14 19 13 16 19 16 17 17 11 142015 16 12 14 15 12 13 15 14 14 21 16 18 15 13 142016 16 12 14 15 12 13 17 14 15 21 16 19 17 14 152017 15 11 13 14 11 12 17 12 14 19 14 16 15 12 14
Notes: ICD-10 codes I60-I69. Directly age-standardised using the 2013 European Standard Population.
Source: 1969 to 2009: England and Wales, Office for National Statistics (2016) Personal communication. Scotland, General Register Office (2017) Personal communication.Northern Ireland, Statistics and Research Agency (2017) Personal communication.2010 to 2014: England and Wales, Office for National Statistics; Scotland, General Register Office for Scotland; Northern Ireland, Northern Ireland Statistics and Research Agency.2015 to 2017 England and Wales: NOMIS Mortality Statisticswww.nomisweb.co.uk/articles/983.aspx
United Kingdom England Wales Scotland Northern Ireland
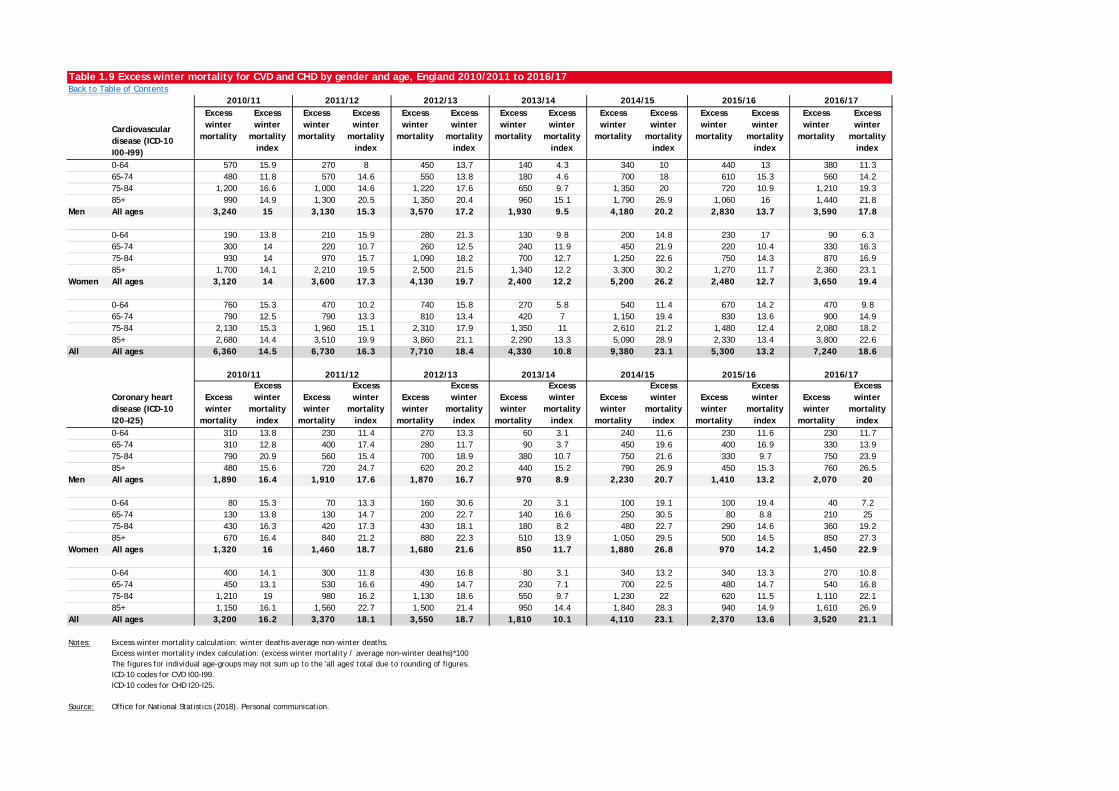
Table 1.9 Excess winter mortality for CVD and CHD by gender and age, England 2010/2011 to 2016/17Back to Table of Contents
Cardiovascular disease (ICD-10 I00–I99)
Excess winter
mortality
Excess winter
mortality index
Excess winter
mortality
Excess winter
mortality index
Excess winter
mortality
Excess winter
mortality index
Excess winter
mortality
Excess winter
mortality index
Excess winter
mortality
Excess winter
mortality index
Excess winter
mortality
Excess winter
mortality index
Excess winter
mortality
Excess winter
mortality index
0-64 570 15.9 270 8 450 13.7 140 4.3 340 10 440 13 380 11.365-74 480 11.8 570 14.6 550 13.8 180 4.6 700 18 610 15.3 560 14.275-84 1,200 16.6 1,000 14.6 1,220 17.6 650 9.7 1,350 20 720 10.9 1,210 19.385+ 990 14.9 1,300 20.5 1,350 20.4 960 15.1 1,790 26.9 1,060 16 1,440 21.8
Men All ages 3,240 15 3,130 15.3 3,570 17.2 1,930 9.5 4,180 20.2 2,830 13.7 3,590 17.8
0-64 190 13.8 210 15.9 280 21.3 130 9.8 200 14.8 230 17 90 6.365-74 300 14 220 10.7 260 12.5 240 11.9 450 21.9 220 10.4 330 16.375-84 930 14 970 15.7 1,090 18.2 700 12.7 1,250 22.6 750 14.3 870 16.985+ 1,700 14.1 2,210 19.5 2,500 21.5 1,340 12.2 3,300 30.2 1,270 11.7 2,360 23.1
Women All ages 3,120 14 3,600 17.3 4,130 19.7 2,400 12.2 5,200 26.2 2,480 12.7 3,650 19.4
0-64 760 15.3 470 10.2 740 15.8 270 5.8 540 11.4 670 14.2 470 9.865-74 790 12.5 790 13.3 810 13.4 420 7 1,150 19.4 830 13.6 900 14.975-84 2,130 15.3 1,960 15.1 2,310 17.9 1,350 11 2,610 21.2 1,480 12.4 2,080 18.285+ 2,680 14.4 3,510 19.9 3,860 21.1 2,290 13.3 5,090 28.9 2,330 13.4 3,800 22.6
All All ages 6,360 14.5 6,730 16.3 7,710 18.4 4,330 10.8 9,380 23.1 5,300 13.2 7,240 18.6
Coronary heart disease (ICD-10 I20–I25)
Excess winter
mortality
Excess winter
mortality index
Excess winter
mortality
Excess winter
mortality index
Excess winter
mortality
Excess winter
mortality index
Excess winter
mortality
Excess winter
mortality index
Excess winter
mortality
Excess winter
mortality index
Excess winter
mortality
Excess winter
mortality index
Excess winter
mortality
Excess winter
mortality index
0-64 310 13.8 230 11.4 270 13.3 60 3.1 240 11.6 230 11.6 230 11.765-74 310 12.8 400 17.4 280 11.7 90 3.7 450 19.6 400 16.9 330 13.975-84 790 20.9 560 15.4 700 18.9 380 10.7 750 21.6 330 9.7 750 23.985+ 480 15.6 720 24.7 620 20.2 440 15.2 790 26.9 450 15.3 760 26.5
Men All ages 1,890 16.4 1,910 17.6 1,870 16.7 970 8.9 2,230 20.7 1,410 13.2 2,070 20
0-64 80 15.3 70 13.3 160 30.6 20 3.1 100 19.1 100 19.4 40 7.265-74 130 13.8 130 14.7 200 22.7 140 16.6 250 30.5 80 8.8 210 2575-84 430 16.3 420 17.3 430 18.1 180 8.2 480 22.7 290 14.6 360 19.285+ 670 16.4 840 21.2 880 22.3 510 13.9 1,050 29.5 500 14.5 850 27.3
Women All ages 1,320 16 1,460 18.7 1,680 21.6 850 11.7 1,880 26.8 970 14.2 1,450 22.9
0-64 400 14.1 300 11.8 430 16.8 80 3.1 340 13.2 340 13.3 270 10.865-74 450 13.1 530 16.6 490 14.7 230 7.1 700 22.5 480 14.7 540 16.875-84 1,210 19 980 16.2 1,130 18.6 550 9.7 1,230 22 620 11.5 1,110 22.185+ 1,150 16.1 1,560 22.7 1,500 21.4 950 14.4 1,840 28.3 940 14.9 1,610 26.9
All All ages 3,200 16.2 3,370 18.1 3,550 18.7 1,810 10.1 4,110 23.1 2,370 13.6 3,520 21.1
Notes: Excess winter mortality calculation: winter deaths-average non-winter deaths.Excess winter mortality index calculation: (excess winter mortality / average non-winter deaths)*100The figures for individual age-groups may not sum up to the 'all ages' total due to rounding of figures.ICD-10 codes for CVD I00-I99.ICD-10 codes for CHD I20-I25.
Source: Office for National Statistics (2018). Personal communication.
2016/17
2016/17
2010/11 2011/12 2012/13
2010/11 2011/12 2012/13
2014/15
2014/15
2015/16
2015/16
2013/14
2013/14
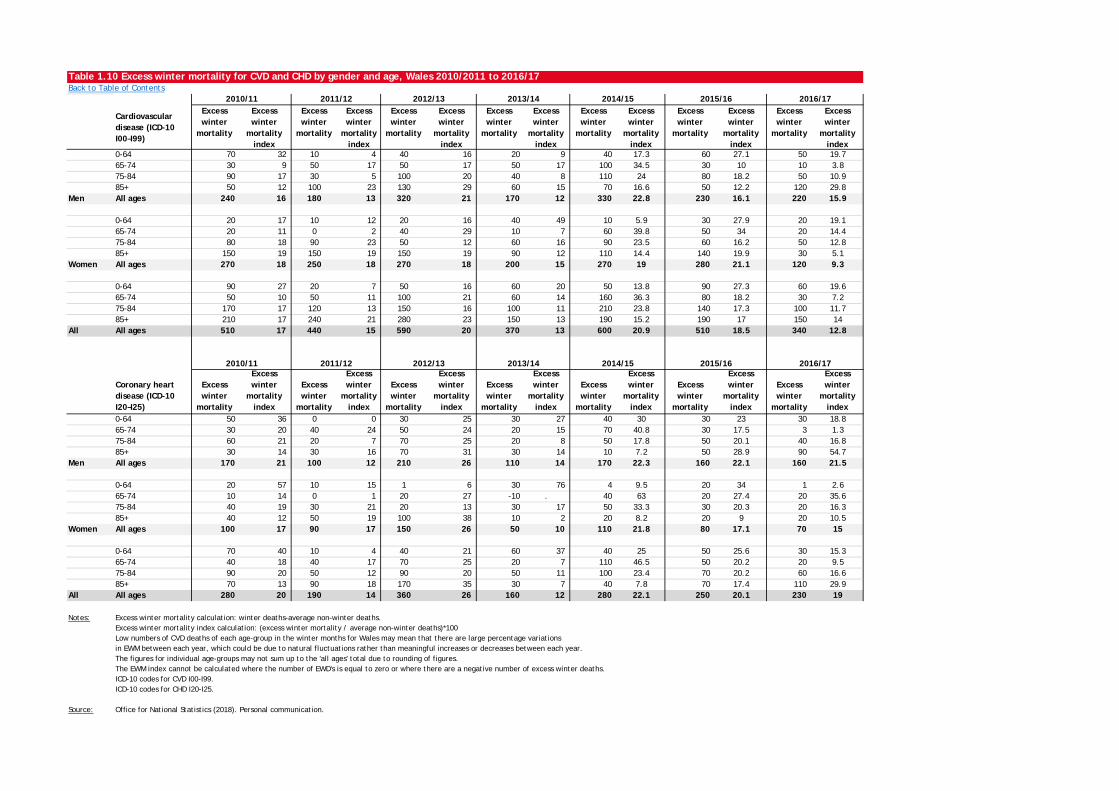
Table 1.10 Excess winter mortality for CVD and CHD by gender and age, Wales 2010/2011 to 2016/17Back to Table of Contents
Cardiovascular disease (ICD-10 I00–I99)
Excess winter
mortality
Excess winter
mortality index
Excess winter
mortality
Excess winter
mortality index
Excess winter
mortality
Excess winter
mortality index
Excess winter
mortality
Excess winter
mortality index
Excess winter
mortality
Excess winter
mortality index
Excess winter
mortality
Excess winter
mortality index
Excess winter
mortality
Excess winter
mortality index
0-64 70 32 10 4 40 16 20 9 40 17.3 60 27.1 50 19.765-74 30 9 50 17 50 17 50 17 100 34.5 30 10 10 3.875-84 90 17 30 5 100 20 40 8 110 24 80 18.2 50 10.985+ 50 12 100 23 130 29 60 15 70 16.6 50 12.2 120 29.8
Men All ages 240 16 180 13 320 21 170 12 330 22.8 230 16.1 220 15.9
0-64 20 17 10 12 20 16 40 49 10 5.9 30 27.9 20 19.165-74 20 11 0 2 40 29 10 7 60 39.8 50 34 20 14.475-84 80 18 90 23 50 12 60 16 90 23.5 60 16.2 50 12.885+ 150 19 150 19 150 19 90 12 110 14.4 140 19.9 30 5.1
Women All ages 270 18 250 18 270 18 200 15 270 19 280 21.1 120 9.3
0-64 90 27 20 7 50 16 60 20 50 13.8 90 27.3 60 19.665-74 50 10 50 11 100 21 60 14 160 36.3 80 18.2 30 7.275-84 170 17 120 13 150 16 100 11 210 23.8 140 17.3 100 11.785+ 210 17 240 21 280 23 150 13 190 15.2 190 17 150 14
All All ages 510 17 440 15 590 20 370 13 600 20.9 510 18.5 340 12.8
Coronary heart disease (ICD-10 I20–I25)
Excess winter
mortality
Excess winter
mortality index
Excess winter
mortality
Excess winter
mortality index
Excess winter
mortality
Excess winter
mortality index
Excess winter
mortality
Excess winter
mortality index
Excess winter
mortality
Excess winter
mortality index
Excess winter
mortality
Excess winter
mortality index
Excess winter
mortality
Excess winter
mortality index
0-64 50 36 0 0 30 25 30 27 40 30 30 23 30 18.865-74 30 20 40 24 50 24 20 15 70 40.8 30 17.5 3 1.375-84 60 21 20 7 70 25 20 8 50 17.8 50 20.1 40 16.885+ 30 14 30 16 70 31 30 14 10 7.2 50 28.9 90 54.7
Men All ages 170 21 100 12 210 26 110 14 170 22.3 160 22.1 160 21.5
0-64 20 57 10 15 1 6 30 76 4 9.5 20 34 1 2.665-74 10 14 0 1 20 27 -10 . 40 63 20 27.4 20 35.675-84 40 19 30 21 20 13 30 17 50 33.3 30 20.3 20 16.385+ 40 12 50 19 100 38 10 2 20 8.2 20 9 20 10.5
Women All ages 100 17 90 17 150 26 50 10 110 21.8 80 17.1 70 15
0-64 70 40 10 4 40 21 60 37 40 25 50 25.6 30 15.365-74 40 18 40 17 70 25 20 7 110 46.5 50 20.2 20 9.575-84 90 20 50 12 90 20 50 11 100 23.4 70 20.2 60 16.685+ 70 13 90 18 170 35 30 7 40 7.8 70 17.4 110 29.9
All All ages 280 20 190 14 360 26 160 12 280 22.1 250 20.1 230 19
Notes: Excess winter mortality calculation: winter deaths-average non-winter deaths.Excess winter mortality index calculation: (excess winter mortality / average non-winter deaths)*100Low numbers of CVD deaths of each age-group in the winter months for Wales may mean that there are large percentage variationsin EWM between each year, which could be due to natural fluctuations rather than meaningful increases or decreases between each year.The figures for individual age-groups may not sum up to the 'all ages' total due to rounding of figures.The EWM index cannot be calculated where the number of EWD's is equal to zero or where there are a negative number of excess winter deaths.ICD-10 codes for CVD I00-I99.ICD-10 codes for CHD I20-I25.
Source: Office for National Statistics (2018). Personal communication.
2016/17
2016/17
2012/13
2012/13
2010/11 2011/12
2010/11 2011/12
2014/15 2015/16
2014/15 2015/16
2013/14
2013/14
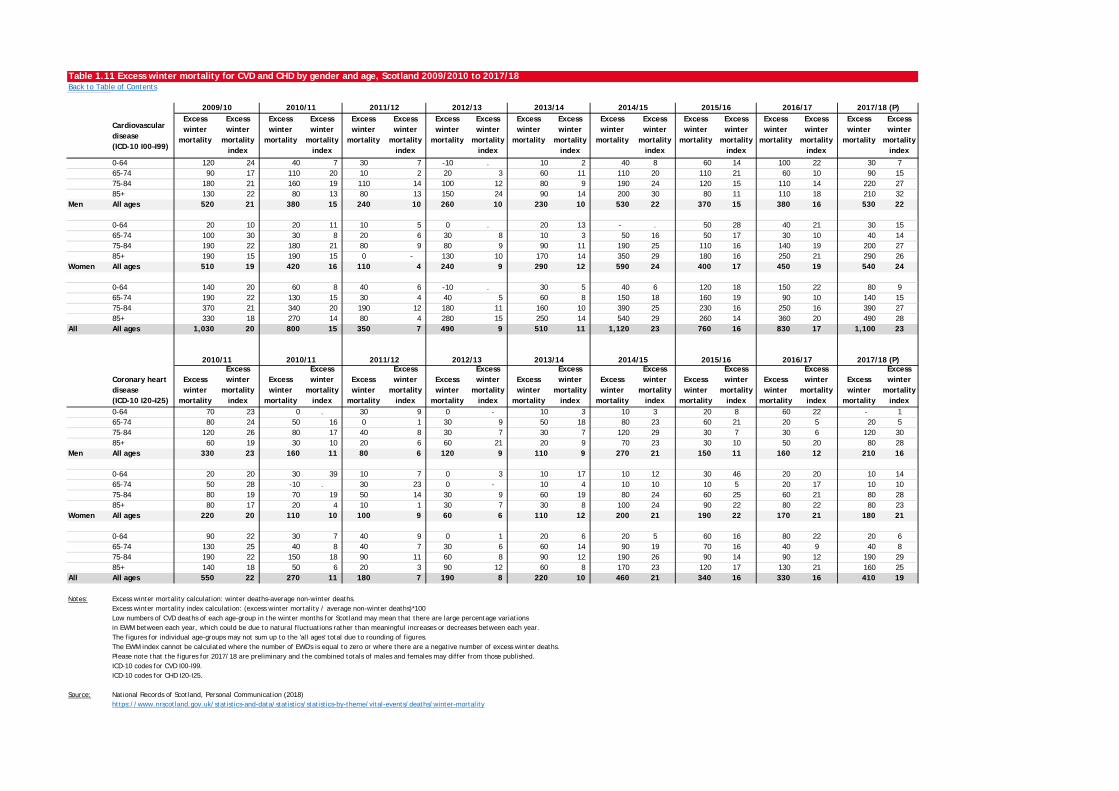
Table 1.11 Excess winter mortality for CVD and CHD by gender and age, Scotland 2009/2010 to 2017/18Back to Table of Contents
Cardiovascular disease (ICD-10 I00–I99)
Excess winter
mortality
Excess winter
mortality index
Excess winter
mortality
Excess winter
mortality index
Excess winter
mortality
Excess winter
mortality index
Excess winter
mortality
Excess winter
mortality index
Excess winter
mortality
Excess winter
mortality index
Excess winter
mortality
Excess winter
mortality index
Excess winter
mortality
Excess winter
mortality index
Excess winter
mortality
Excess winter
mortality index
Excess winter
mortality
Excess winter
mortality index
0-64 120 24 40 7 30 7 -10 . 10 2 40 8 60 14 100 22 30 765-74 90 17 110 20 10 2 20 3 60 11 110 20 110 21 60 10 90 1575-84 180 21 160 19 110 14 100 12 80 9 190 24 120 15 110 14 220 2785+ 130 22 80 13 80 13 150 24 90 14 200 30 80 11 110 18 210 32
Men All ages 520 21 380 15 240 10 260 10 230 10 530 22 370 15 380 16 530 22
0-64 20 10 20 11 10 5 0 . 20 13 - . 50 28 40 21 30 1565-74 100 30 30 8 20 6 30 8 10 3 50 16 50 17 30 10 40 1475-84 190 22 180 21 80 9 80 9 90 11 190 25 110 16 140 19 200 2785+ 190 15 190 15 0 - 130 10 170 14 350 29 180 16 250 21 290 26
Women All ages 510 19 420 16 110 4 240 9 290 12 590 24 400 17 450 19 540 24
0-64 140 20 60 8 40 6 -10 . 30 5 40 6 120 18 150 22 80 965-74 190 22 130 15 30 4 40 5 60 8 150 18 160 19 90 10 140 1575-84 370 21 340 20 190 12 180 11 160 10 390 25 230 16 250 16 390 2785+ 330 18 270 14 80 4 280 15 250 14 540 29 260 14 360 20 490 28
All All ages 1,030 20 800 15 350 7 490 9 510 11 1,120 23 760 16 830 17 1,100 23
Coronary heart disease (ICD-10 I20–I25)
Excess winter
mortality
Excess winter
mortality index
Excess winter
mortality
Excess winter
mortality index
Excess winter
mortality
Excess winter
mortality index
Excess winter
mortality
Excess winter
mortality index
Excess winter
mortality
Excess winter
mortality index
Excess winter
mortality
Excess winter
mortality index
Excess winter
mortality
Excess winter
mortality index
Excess winter
mortality
Excess winter
mortality index
Excess winter
mortality
Excess winter
mortality index
0-64 70 23 0 . 30 9 0 - 10 3 10 3 20 8 60 22 - 165-74 80 24 50 16 0 1 30 9 50 18 80 23 60 21 20 5 20 575-84 120 26 80 17 40 8 30 7 30 7 120 29 30 7 30 6 120 3085+ 60 19 30 10 20 6 60 21 20 9 70 23 30 10 50 20 80 28
Men All ages 330 23 160 11 80 6 120 9 110 9 270 21 150 11 160 12 210 16
0-64 20 20 30 39 10 7 0 3 10 17 10 12 30 46 20 20 10 1465-74 50 28 -10 . 30 23 0 - 10 4 10 10 10 5 20 17 10 1075-84 80 19 70 19 50 14 30 9 60 19 80 24 60 25 60 21 80 2885+ 80 17 20 4 10 1 30 7 30 8 100 24 90 22 80 22 80 23
Women All ages 220 20 110 10 100 9 60 6 110 12 200 21 190 22 170 21 180 21
0-64 90 22 30 7 40 9 0 1 20 6 20 5 60 16 80 22 20 665-74 130 25 40 8 40 7 30 6 60 14 90 19 70 16 40 9 40 875-84 190 22 150 18 90 11 60 8 90 12 190 26 90 14 90 12 190 2985+ 140 18 50 6 20 3 90 12 60 8 170 23 120 17 130 21 160 25
All All ages 550 22 270 11 180 7 190 8 220 10 460 21 340 16 330 16 410 19
Notes: Excess winter mortality calculation: winter deaths-average non-winter deaths.Excess winter mortality index calculation: (excess winter mortality / average non-winter deaths)*100Low numbers of CVD deaths of each age-group in the winter months for Scotland may mean that there are large percentage variationsin EWM between each year, which could be due to natural fluctuations rather than meaningful increases or decreases between each year.The figures for individual age-groups may not sum up to the 'all ages' total due to rounding of figures.The EWM index cannot be calculated where the number of EWD's is equal to zero or where there are a negative number of excess winter deaths.Please note that the figures for 2017/18 are preliminary and the combined totals of males and females may differ from those published.ICD-10 codes for CVD I00-I99.ICD-10 codes for CHD I20-I25.
Source: National Records of Scotland, Personal Communication (2018)https://www.nrscotland.gov.uk/statistics-and-data/statistics/statistics-by-theme/vital-events/deaths/winter-mortality
2017/18 (P)
2017/18 (P)
2010/11 2011/12 2012/13 2013/142009/10
2010/11
2016/17
2016/17
2015/16
2010/11 2011/12 2012/13 2013/14 2014/15 2015/16
2014/15
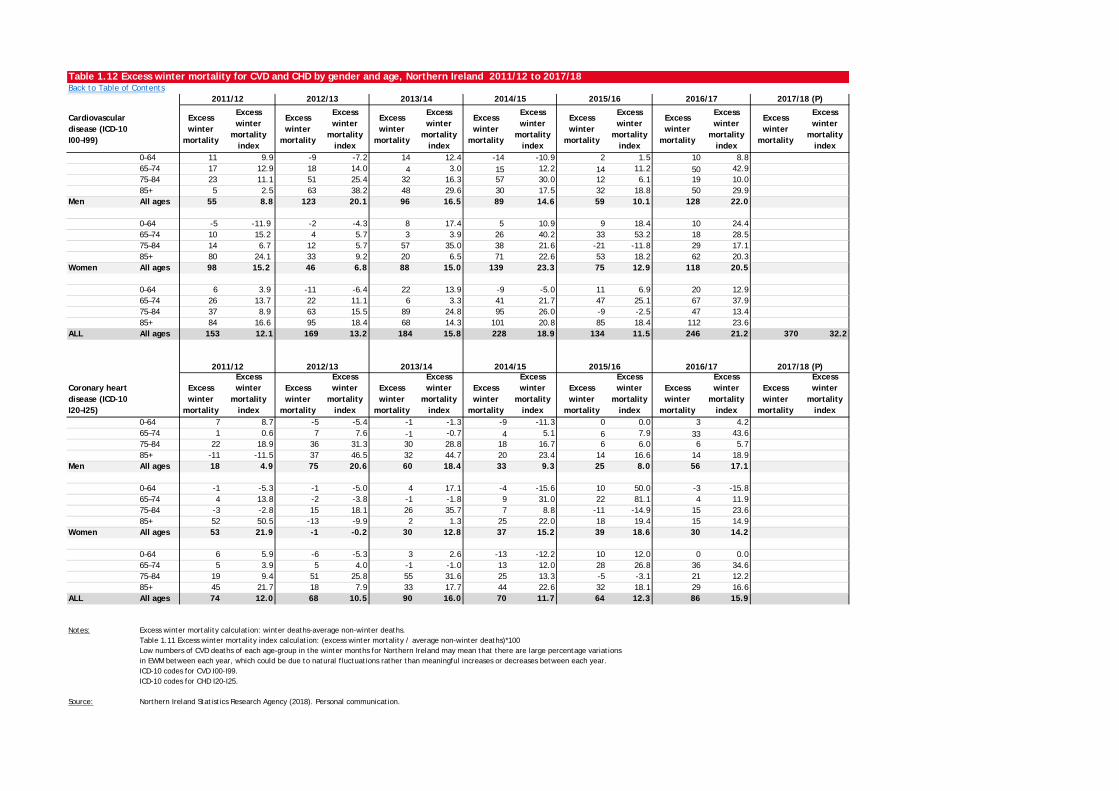
Table 1.12 Excess winter mortality for CVD and CHD by gender and age, Northern Ireland 2011/12 to 2017/18Back to Table of Contents
Cardiovascular disease (ICD-10 I00–I99)
Excess winter
mortality
Excess winter
mortality index
Excess winter
mortality
Excess winter
mortality index
Excess winter
mortality
Excess winter
mortality index
Excess winter
mortality
Excess winter
mortality index
Excess winter
mortality
Excess winter
mortality index
Excess winter
mortality
Excess winter
mortality index
Excess winter
mortality
Excess winter
mortality index
0–64 11 9.9 -9 -7.2 14 12.4 -14 -10.9 2 1.5 10 8.865–74 17 12.9 18 14.0 4 3.0 15 12.2 14 11.2 50 42.975–84 23 11.1 51 25.4 32 16.3 57 30.0 12 6.1 19 10.085+ 5 2.5 63 38.2 48 29.6 30 17.5 32 18.8 50 29.9
Men All ages 55 8.8 123 20.1 96 16.5 89 14.6 59 10.1 128 22.0
0–64 -5 -11.9 -2 -4.3 8 17.4 5 10.9 9 18.4 10 24.465–74 10 15.2 4 5.7 3 3.9 26 40.2 33 53.2 18 28.575–84 14 6.7 12 5.7 57 35.0 38 21.6 -21 -11.8 29 17.185+ 80 24.1 33 9.2 20 6.5 71 22.6 53 18.2 62 20.3
Women All ages 98 15.2 46 6.8 88 15.0 139 23.3 75 12.9 118 20.5
0–64 6 3.9 -11 -6.4 22 13.9 -9 -5.0 11 6.9 20 12.965–74 26 13.7 22 11.1 6 3.3 41 21.7 47 25.1 67 37.975–84 37 8.9 63 15.5 89 24.8 95 26.0 -9 -2.5 47 13.485+ 84 16.6 95 18.4 68 14.3 101 20.8 85 18.4 112 23.6
ALL All ages 153 12.1 169 13.2 184 15.8 228 18.9 134 11.5 246 21.2 370 32.2
Coronary heart disease (ICD-10 I20–I25)
Excess winter
mortality
Excess winter
mortality index
Excess winter
mortality
Excess winter
mortality index
Excess winter
mortality
Excess winter
mortality index
Excess winter
mortality
Excess winter
mortality index
Excess winter
mortality
Excess winter
mortality index
Excess winter
mortality
Excess winter
mortality index
Excess winter
mortality
Excess winter
mortality index
0–64 7 8.7 -5 -5.4 -1 -1.3 -9 -11.3 0 0.0 3 4.265–74 1 0.6 7 7.6 -1 -0.7 4 5.1 6 7.9 33 43.675–84 22 18.9 36 31.3 30 28.8 18 16.7 6 6.0 6 5.785+ -11 -11.5 37 46.5 32 44.7 20 23.4 14 16.6 14 18.9
Men All ages 18 4.9 75 20.6 60 18.4 33 9.3 25 8.0 56 17.1
0–64 -1 -5.3 -1 -5.0 4 17.1 -4 -15.6 10 50.0 -3 -15.865–74 4 13.8 -2 -3.8 -1 -1.8 9 31.0 22 81.1 4 11.975–84 -3 -2.8 15 18.1 26 35.7 7 8.8 -11 -14.9 15 23.685+ 52 50.5 -13 -9.9 2 1.3 25 22.0 18 19.4 15 14.9
Women All ages 53 21.9 -1 -0.2 30 12.8 37 15.2 39 18.6 30 14.2
0–64 6 5.9 -6 -5.3 3 2.6 -13 -12.2 10 12.0 0 0.065–74 5 3.9 5 4.0 -1 -1.0 13 12.0 28 26.8 36 34.675–84 19 9.4 51 25.8 55 31.6 25 13.3 -5 -3.1 21 12.285+ 45 21.7 18 7.9 33 17.7 44 22.6 32 18.1 29 16.6
ALL All ages 74 12.0 68 10.5 90 16.0 70 11.7 64 12.3 86 15.9
Notes: Excess winter mortality calculation: winter deaths-average non-winter deaths.Table 1.11 Excess winter mortality index calculation: (excess winter mortality / average non-winter deaths)*100Low numbers of CVD deaths of each age-group in the winter months for Northern Ireland may mean that there are large percentage variationsin EWM between each year, which could be due to natural fluctuations rather than meaningful increases or decreases between each year.ICD-10 codes for CVD I00-I99.ICD-10 codes for CHD I20-I25.
Source: Northern Ireland Statistics Research Agency (2018). Personal communication.
2017/18 (P)
2017/18 (P)
2016/17
2016/17
2015/16
2015/16
2014/15
2014/152011/12 2012/13 2013/14
2011/12 2012/13 2013/14
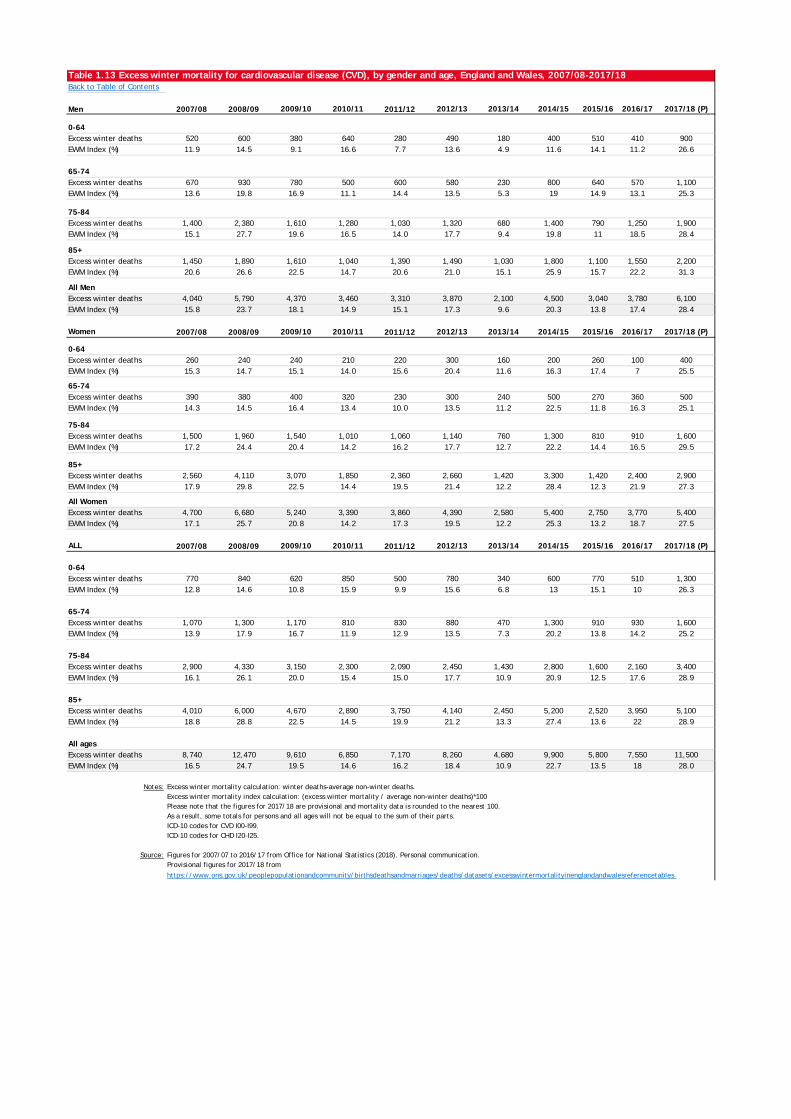
Table 1.13 Excess winter mortality for cardiovascular disease (CVD), by gender and age, England and Wales, 2007/08-2017/18Back to Table of Contents
Men 2007/08 2008/09 2009/10 2010/11 2011/12 2012/13 2013/14 2014/15 2015/16 2016/17 2017/18 (P)
0-64Excess winter deaths 520 600 380 640 280 490 180 400 510 410 900EWM Index (%) 11.9 14.5 9.1 16.6 7.7 13.6 4.9 11.6 14.1 11.2 26.6
65-74Excess winter deaths 670 930 780 500 600 580 230 800 640 570 1,100EWM Index (%) 13.6 19.8 16.9 11.1 14.4 13.5 5.3 19 14.9 13.1 25.3
75-84Excess winter deaths 1,400 2,380 1,610 1,280 1,030 1,320 680 1,400 790 1,250 1,900EWM Index (%) 15.1 27.7 19.6 16.5 14.0 17.7 9.4 19.8 11 18.5 28.4
85+Excess winter deaths 1,450 1,890 1,610 1,040 1,390 1,490 1,030 1,800 1,100 1,550 2,200EWM Index (%) 20.6 26.6 22.5 14.7 20.6 21.0 15.1 25.9 15.7 22.2 31.3
All MenExcess winter deaths 4,040 5,790 4,370 3,460 3,310 3,870 2,100 4,500 3,040 3,780 6,100EWM Index (%) 15.8 23.7 18.1 14.9 15.1 17.3 9.6 20.3 13.8 17.4 28.4
Women 2007/08 2008/09 2009/10 2010/11 2011/12 2012/13 2013/14 2014/15 2015/16 2016/17 2017/18 (P)
0-64Excess winter deaths 260 240 240 210 220 300 160 200 260 100 400EWM Index (%) 15.3 14.7 15.1 14.0 15.6 20.4 11.6 16.3 17.4 7 25.5
65-74Excess winter deaths 390 380 400 320 230 300 240 500 270 360 500EWM Index (%) 14.3 14.5 16.4 13.4 10.0 13.5 11.2 22.5 11.8 16.3 25.1
75-84Excess winter deaths 1,500 1,960 1,540 1,010 1,060 1,140 760 1,300 810 910 1,600EWM Index (%) 17.2 24.4 20.4 14.2 16.2 17.7 12.7 22.2 14.4 16.5 29.5
85+Excess winter deaths 2,560 4,110 3,070 1,850 2,360 2,660 1,420 3,300 1,420 2,400 2,900EWM Index (%) 17.9 29.8 22.5 14.4 19.5 21.4 12.2 28.4 12.3 21.9 27.3
All WomenExcess winter deaths 4,700 6,680 5,240 3,390 3,860 4,390 2,580 5,400 2,750 3,770 5,400EWM Index (%) 17.1 25.7 20.8 14.2 17.3 19.5 12.2 25.3 13.2 18.7 27.5
ALL 2007/08 2008/09 2009/10 2010/11 2011/12 2012/13 2013/14 2014/15 2015/16 2016/17 2017/18 (P)
0-64Excess winter deaths 770 840 620 850 500 780 340 600 770 510 1,300EWM Index (%) 12.8 14.6 10.8 15.9 9.9 15.6 6.8 13 15.1 10 26.3
65-74Excess winter deaths 1,070 1,300 1,170 810 830 880 470 1,300 910 930 1,600EWM Index (%) 13.9 17.9 16.7 11.9 12.9 13.5 7.3 20.2 13.8 14.2 25.2
75-84Excess winter deaths 2,900 4,330 3,150 2,300 2,090 2,450 1,430 2,800 1,600 2,160 3,400EWM Index (%) 16.1 26.1 20.0 15.4 15.0 17.7 10.9 20.9 12.5 17.6 28.9
85+Excess winter deaths 4,010 6,000 4,670 2,890 3,750 4,140 2,450 5,200 2,520 3,950 5,100EWM Index (%) 18.8 28.8 22.5 14.5 19.9 21.2 13.3 27.4 13.6 22 28.9
All agesExcess winter deaths 8,740 12,470 9,610 6,850 7,170 8,260 4,680 9,900 5,800 7,550 11,500EWM Index (%) 16.5 24.7 19.5 14.6 16.2 18.4 10.9 22.7 13.5 18 28.0
Notes: Excess winter mortality calculation: winter deaths-average non-winter deaths.Excess winter mortality index calculation: (excess winter mortality / average non-winter deaths)*100Please note that the figures for 2017/18 are provisional and mortality data is rounded to the nearest 100. As a result, some totals for persons and all ages will not be equal to the sum of their parts.ICD-10 codes for CVD I00-I99.ICD-10 codes for CHD I20-I25.
Source: Figures for 2007/07 to 2016/17 from Office for National Statistics (2018). Personal communication.Provisional figures for 2017/18 from https://www.ons.gov.uk/peoplepopulationandcommunity/birthsdeathsandmarriages/deaths/datasets/excesswintermortalityinenglandandwalesreferencetables
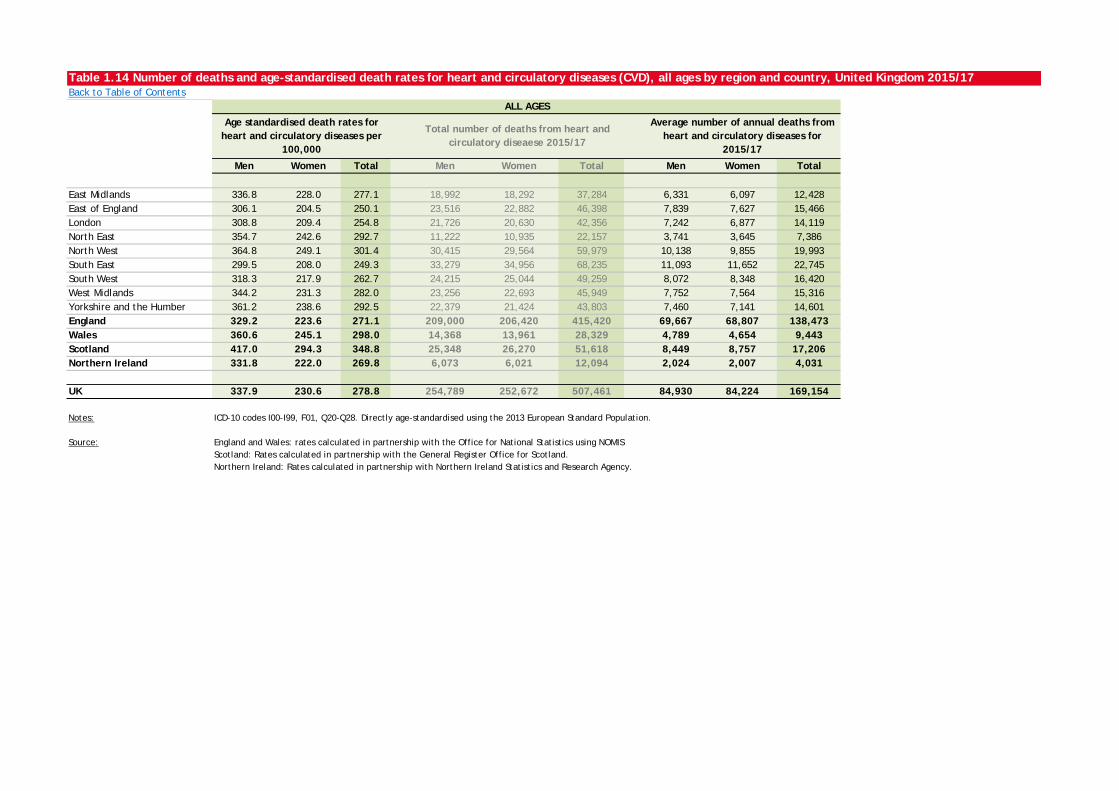
Table 1.14 Number of deaths and age-standardised death rates for heart and circulatory diseases (CVD), all ages by region and country, United Kingdom 2015/17Back to Table of Contents
Men Women Total Men Women Total Men Women Total
East Midlands 336.8 228.0 277.1 18,992 18,292 37,284 6,331 6,097 12,428East of England 306.1 204.5 250.1 23,516 22,882 46,398 7,839 7,627 15,466London 308.8 209.4 254.8 21,726 20,630 42,356 7,242 6,877 14,119North East 354.7 242.6 292.7 11,222 10,935 22,157 3,741 3,645 7,386North West 364.8 249.1 301.4 30,415 29,564 59,979 10,138 9,855 19,993South East 299.5 208.0 249.3 33,279 34,956 68,235 11,093 11,652 22,745South West 318.3 217.9 262.7 24,215 25,044 49,259 8,072 8,348 16,420West Midlands 344.2 231.3 282.0 23,256 22,693 45,949 7,752 7,564 15,316Yorkshire and the Humber 361.2 238.6 292.5 22,379 21,424 43,803 7,460 7,141 14,601England 329.2 223.6 271.1 209,000 206,420 415,420 69,667 68,807 138,473Wales 360.6 245.1 298.0 14,368 13,961 28,329 4,789 4,654 9,443Scotland 417.0 294.3 348.8 25,348 26,270 51,618 8,449 8,757 17,206Northern Ireland 331.8 222.0 269.8 6,073 6,021 12,094 2,024 2,007 4,031
UK 337.9 230.6 278.8 254,789 252,672 507,461 84,930 84,224 169,154
Notes: ICD-10 codes I00-I99, F01, Q20-Q28. Directly age-standardised using the 2013 European Standard Population.
Source: England and Wales: rates calculated in partnership with the Office for National Statistics using NOMISScotland: Rates calculated in partnership with the General Register Office for Scotland.Northern Ireland: Rates calculated in partnership with Northern Ireland Statistics and Research Agency.
ALL AGES
Age standardised death rates for heart and circulatory diseases per
100,000
Total number of deaths from heart and circulatory diseaese 2015/17
Average number of annual deaths from heart and circulatory diseases for
2015/17
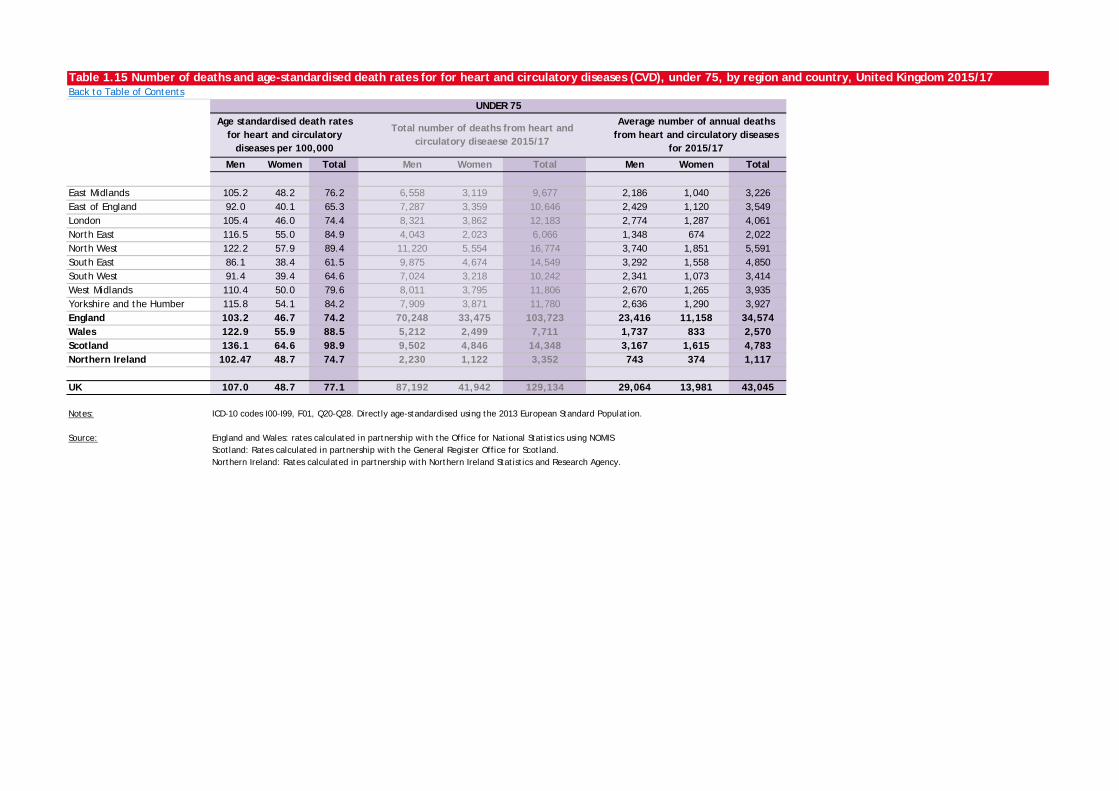
Table 1.15 Number of deaths and age-standardised death rates for for heart and circulatory diseases (CVD), under 75, by region and country, United Kingdom 2015/17Back to Table of Contents
Men Women Total Men Women Total Men Women Total
East Midlands 105.2 48.2 76.2 6,558 3,119 9,677 2,186 1,040 3,226East of England 92.0 40.1 65.3 7,287 3,359 10,646 2,429 1,120 3,549London 105.4 46.0 74.4 8,321 3,862 12,183 2,774 1,287 4,061North East 116.5 55.0 84.9 4,043 2,023 6,066 1,348 674 2,022North West 122.2 57.9 89.4 11,220 5,554 16,774 3,740 1,851 5,591South East 86.1 38.4 61.5 9,875 4,674 14,549 3,292 1,558 4,850South West 91.4 39.4 64.6 7,024 3,218 10,242 2,341 1,073 3,414West Midlands 110.4 50.0 79.6 8,011 3,795 11,806 2,670 1,265 3,935Yorkshire and the Humber 115.8 54.1 84.2 7,909 3,871 11,780 2,636 1,290 3,927England 103.2 46.7 74.2 70,248 33,475 103,723 23,416 11,158 34,574Wales 122.9 55.9 88.5 5,212 2,499 7,711 1,737 833 2,570Scotland 136.1 64.6 98.9 9,502 4,846 14,348 3,167 1,615 4,783Northern Ireland 102.47 48.7 74.7 2,230 1,122 3,352 743 374 1,117
UK 107.0 48.7 77.1 87,192 41,942 129,134 29,064 13,981 43,045
Notes: ICD-10 codes I00-I99, F01, Q20-Q28. Directly age-standardised using the 2013 European Standard Population.
Source: England and Wales: rates calculated in partnership with the Office for National Statistics using NOMISScotland: Rates calculated in partnership with the General Register Office for Scotland.Northern Ireland: Rates calculated in partnership with Northern Ireland Statistics and Research Agency.
UNDER 75
Age standardised death rates for heart and circulatory
diseases per 100,000
Total number of deaths from heart and circulatory diseaese 2015/17
Average number of annual deaths from heart and circulatory diseases
for 2015/17
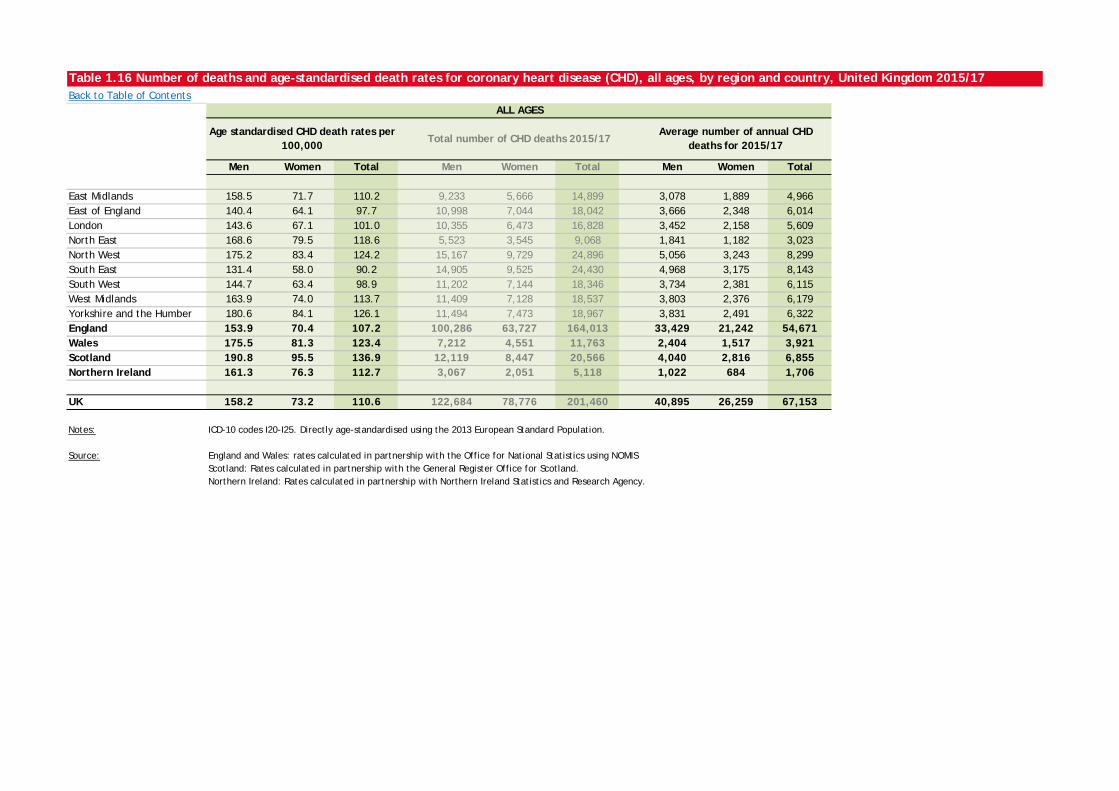
Table 1.16 Number of deaths and age-standardised death rates for coronary heart disease (CHD), all ages, by region and country, United Kingdom 2015/17Back to Table of Contents
Men Women Total Men Women Total Men Women Total
East Midlands 158.5 71.7 110.2 9,233 5,666 14,899 3,078 1,889 4,966East of England 140.4 64.1 97.7 10,998 7,044 18,042 3,666 2,348 6,014London 143.6 67.1 101.0 10,355 6,473 16,828 3,452 2,158 5,609North East 168.6 79.5 118.6 5,523 3,545 9,068 1,841 1,182 3,023North West 175.2 83.4 124.2 15,167 9,729 24,896 5,056 3,243 8,299South East 131.4 58.0 90.2 14,905 9,525 24,430 4,968 3,175 8,143South West 144.7 63.4 98.9 11,202 7,144 18,346 3,734 2,381 6,115West Midlands 163.9 74.0 113.7 11,409 7,128 18,537 3,803 2,376 6,179Yorkshire and the Humber 180.6 84.1 126.1 11,494 7,473 18,967 3,831 2,491 6,322England 153.9 70.4 107.2 100,286 63,727 164,013 33,429 21,242 54,671Wales 175.5 81.3 123.4 7,212 4,551 11,763 2,404 1,517 3,921Scotland 190.8 95.5 136.9 12,119 8,447 20,566 4,040 2,816 6,855Northern Ireland 161.3 76.3 112.7 3,067 2,051 5,118 1,022 684 1,706
UK 158.2 73.2 110.6 122,684 78,776 201,460 40,895 26,259 67,153
Notes: ICD-10 codes I20-I25. Directly age-standardised using the 2013 European Standard Population.
Source: England and Wales: rates calculated in partnership with the Office for National Statistics using NOMISScotland: Rates calculated in partnership with the General Register Office for Scotland.Northern Ireland: Rates calculated in partnership with Northern Ireland Statistics and Research Agency.
ALL AGES
Age standardised CHD death rates per 100,000
Total number of CHD deaths 2015/17Average number of annual CHD
deaths for 2015/17
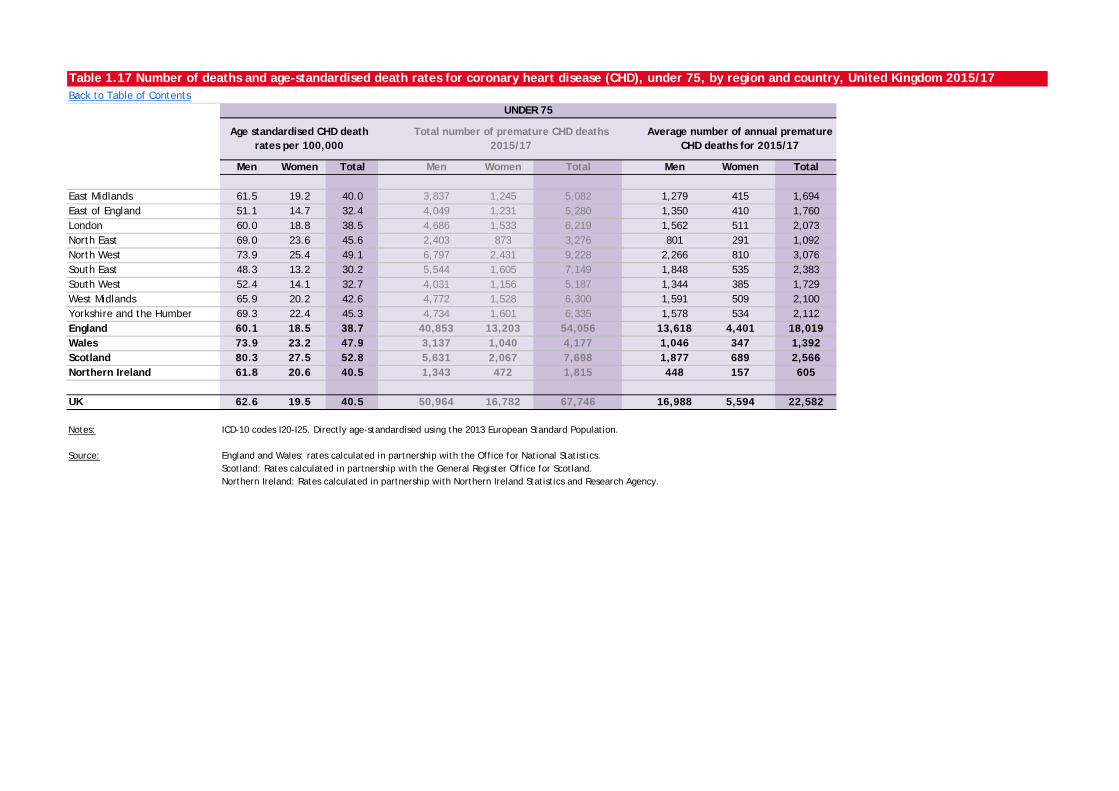
Table 1.17 Number of deaths and age-standardised death rates for coronary heart disease (CHD), under 75, by region and country, United Kingdom 2015/17Back to Table of Contents
Men Women Total Men Women Total Men Women Total
East Midlands 61.5 19.2 40.0 3,837 1,245 5,082 1,279 415 1,694East of England 51.1 14.7 32.4 4,049 1,231 5,280 1,350 410 1,760London 60.0 18.8 38.5 4,686 1,533 6,219 1,562 511 2,073North East 69.0 23.6 45.6 2,403 873 3,276 801 291 1,092North West 73.9 25.4 49.1 6,797 2,431 9,228 2,266 810 3,076South East 48.3 13.2 30.2 5,544 1,605 7,149 1,848 535 2,383South West 52.4 14.1 32.7 4,031 1,156 5,187 1,344 385 1,729West Midlands 65.9 20.2 42.6 4,772 1,528 6,300 1,591 509 2,100Yorkshire and the Humber 69.3 22.4 45.3 4,734 1,601 6,335 1,578 534 2,112England 60.1 18.5 38.7 40,853 13,203 54,056 13,618 4,401 18,019Wales 73.9 23.2 47.9 3,137 1,040 4,177 1,046 347 1,392Scotland 80.3 27.5 52.8 5,631 2,067 7,698 1,877 689 2,566Northern Ireland 61.8 20.6 40.5 1,343 472 1,815 448 157 605
UK 62.6 19.5 40.5 50,964 16,782 67,746 16,988 5,594 22,582
Notes: ICD-10 codes I20-I25. Directly age-standardised using the 2013 European Standard Population.
Source: England and Wales: rates calculated in partnership with the Office for National Statistics.Scotland: Rates calculated in partnership with the General Register Office for Scotland.Northern Ireland: Rates calculated in partnership with Northern Ireland Statistics and Research Agency.
UNDER 75
Age standardised CHD death rates per 100,000
Total number of premature CHD deaths 2015/17
Average number of annual premature CHD deaths for 2015/17
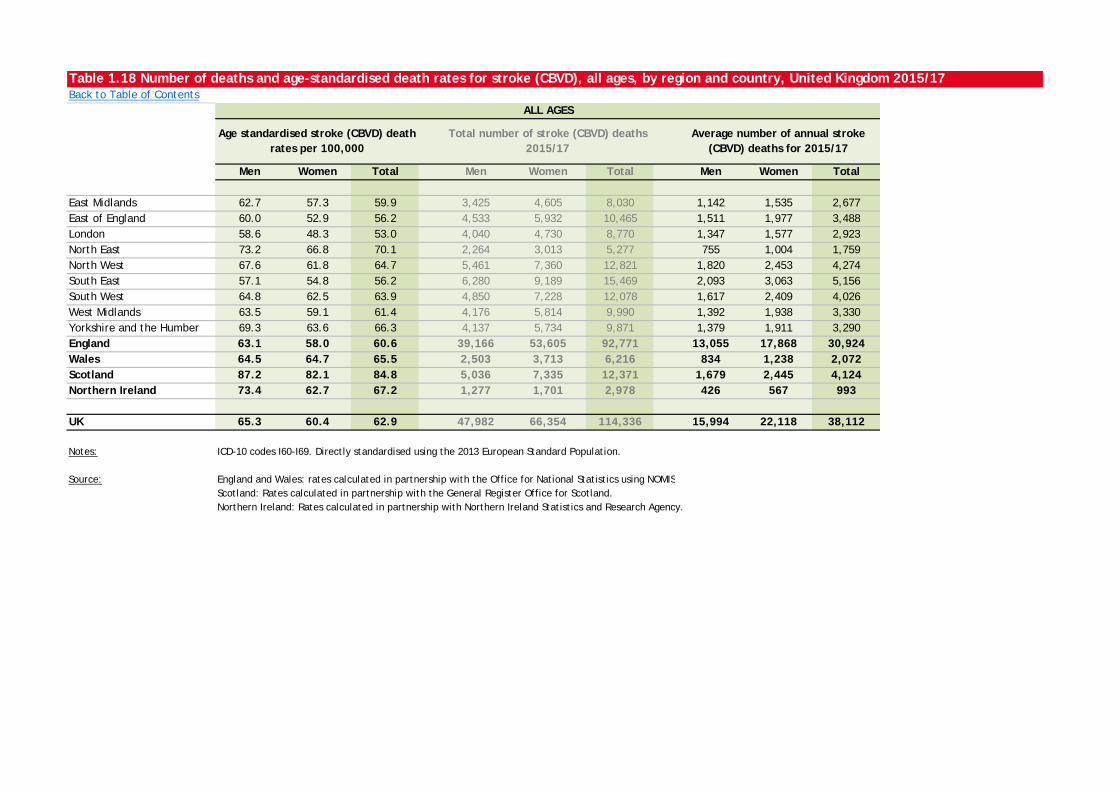
Table 1.18 Number of deaths and age-standardised death rates for stroke (CBVD), all ages, by region and country, United Kingdom 2015/17Back to Table of Contents
Men Women Total Men Women Total Men Women Total
East Midlands 62.7 57.3 59.9 3,425 4,605 8,030 1,142 1,535 2,677East of England 60.0 52.9 56.2 4,533 5,932 10,465 1,511 1,977 3,488London 58.6 48.3 53.0 4,040 4,730 8,770 1,347 1,577 2,923North East 73.2 66.8 70.1 2,264 3,013 5,277 755 1,004 1,759North West 67.6 61.8 64.7 5,461 7,360 12,821 1,820 2,453 4,274South East 57.1 54.8 56.2 6,280 9,189 15,469 2,093 3,063 5,156South West 64.8 62.5 63.9 4,850 7,228 12,078 1,617 2,409 4,026West Midlands 63.5 59.1 61.4 4,176 5,814 9,990 1,392 1,938 3,330Yorkshire and the Humber 69.3 63.6 66.3 4,137 5,734 9,871 1,379 1,911 3,290England 63.1 58.0 60.6 39,166 53,605 92,771 13,055 17,868 30,924Wales 64.5 64.7 65.5 2,503 3,713 6,216 834 1,238 2,072Scotland 87.2 82.1 84.8 5,036 7,335 12,371 1,679 2,445 4,124Northern Ireland 73.4 62.7 67.2 1,277 1,701 2,978 426 567 993
UK 65.3 60.4 62.9 47,982 66,354 114,336 15,994 22,118 38,112
Notes: ICD-10 codes I60-I69. Directly standardised using the 2013 European Standard Population.
Source: England and Wales: rates calculated in partnership with the Office for National Statistics using NOMISScotland: Rates calculated in partnership with the General Register Office for Scotland.Northern Ireland: Rates calculated in partnership with Northern Ireland Statistics and Research Agency.
ALL AGES
Age standardised stroke (CBVD) death rates per 100,000
Total number of stroke (CBVD) deaths 2015/17
Average number of annual stroke (CBVD) deaths for 2015/17
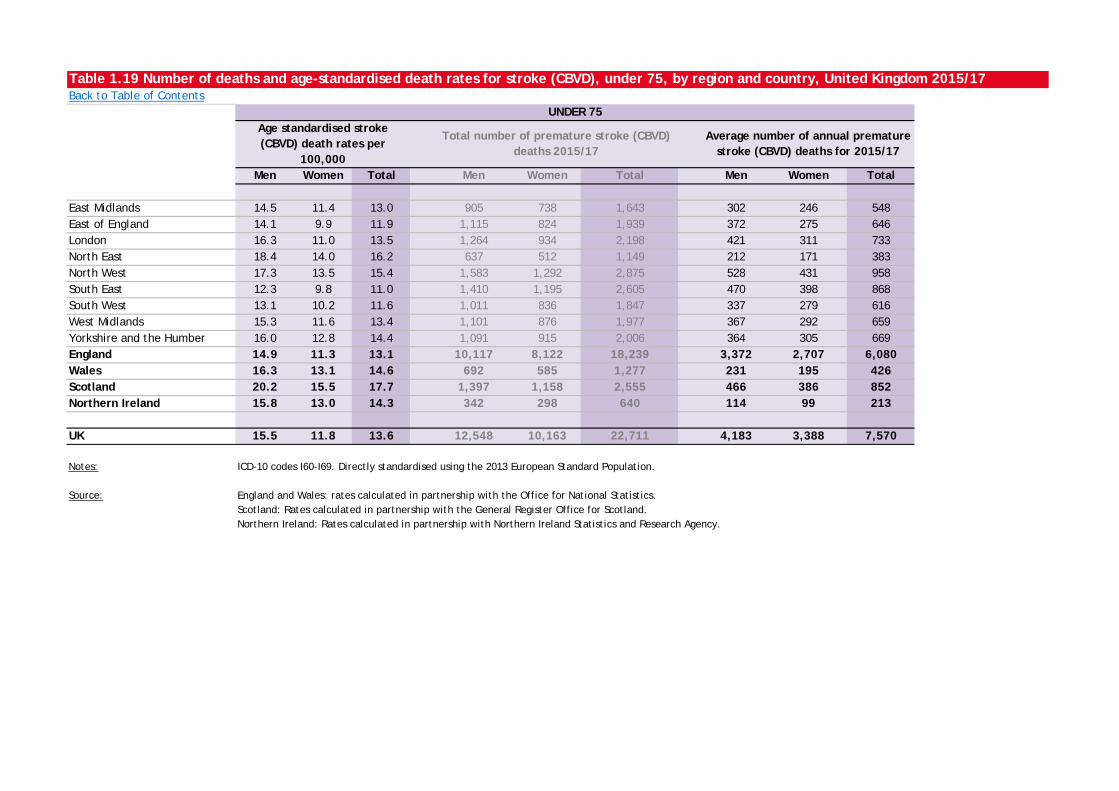
Table 1.19 Number of deaths and age-standardised death rates for stroke (CBVD), under 75, by region and country, United Kingdom 2015/17Back to Table of Contents
Men Women Total Men Women Total Men Women Total
East Midlands 14.5 11.4 13.0 905 738 1,643 302 246 548East of England 14.1 9.9 11.9 1,115 824 1,939 372 275 646London 16.3 11.0 13.5 1,264 934 2,198 421 311 733North East 18.4 14.0 16.2 637 512 1,149 212 171 383North West 17.3 13.5 15.4 1,583 1,292 2,875 528 431 958South East 12.3 9.8 11.0 1,410 1,195 2,605 470 398 868South West 13.1 10.2 11.6 1,011 836 1,847 337 279 616West Midlands 15.3 11.6 13.4 1,101 876 1,977 367 292 659Yorkshire and the Humber 16.0 12.8 14.4 1,091 915 2,006 364 305 669England 14.9 11.3 13.1 10,117 8,122 18,239 3,372 2,707 6,080Wales 16.3 13.1 14.6 692 585 1,277 231 195 426Scotland 20.2 15.5 17.7 1,397 1,158 2,555 466 386 852Northern Ireland 15.8 13.0 14.3 342 298 640 114 99 213
UK 15.5 11.8 13.6 12,548 10,163 22,711 4,183 3,388 7,570
Notes: ICD-10 codes I60-I69. Directly standardised using the 2013 European Standard Population.
Source: England and Wales: rates calculated in partnership with the Office for National Statistics.Scotland: Rates calculated in partnership with the General Register Office for Scotland.Northern Ireland: Rates calculated in partnership with Northern Ireland Statistics and Research Agency.
UNDER 75Age standardised stroke (CBVD) death rates per
100,000
Total number of premature stroke (CBVD) deaths 2015/17
Average number of annual premature stroke (CBVD) deaths for 2015/17
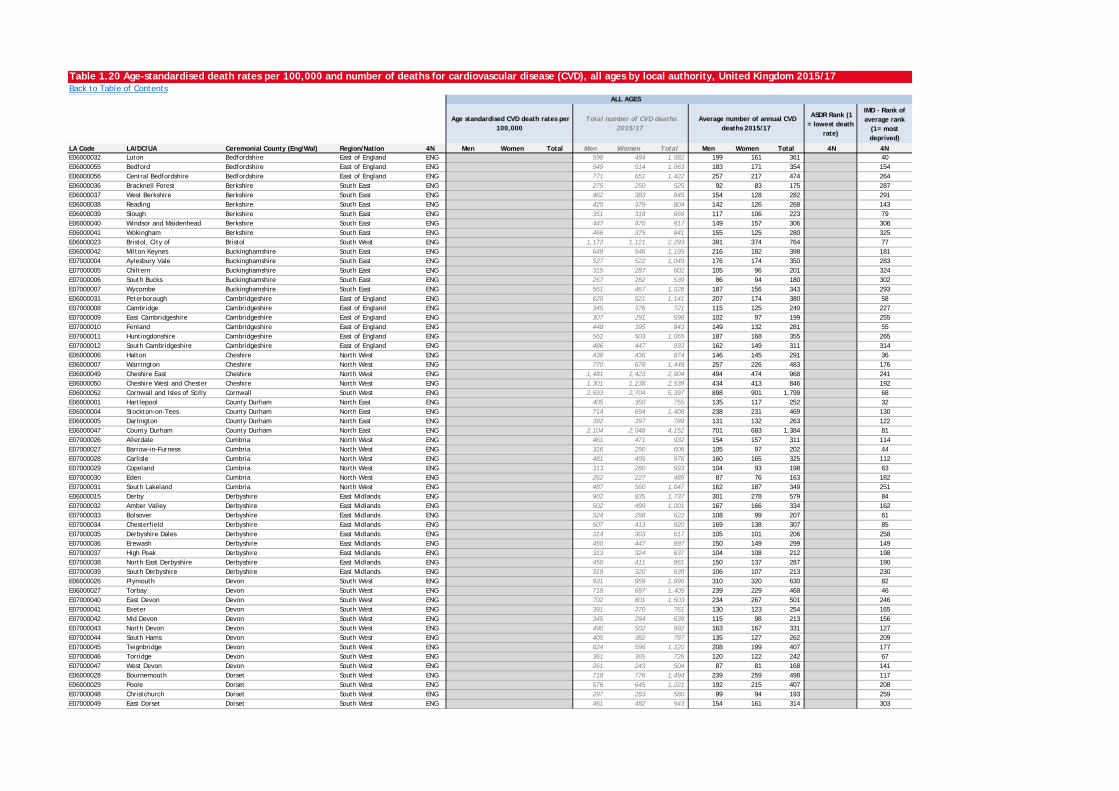
Table 1.20 Age-standardised death rates per 100,000 and number of deaths for cardiovascular disease (CVD), all ages by local authority, United Kingdom 2015/17Back to Table of Contents
ASDR Rank (1 = lowest death
rate)
IMD - Rank of average rank
(1= most deprived)
LA Code LA/DC/UA Ceremonial County (Eng/Wal) Region/Nation 4N Men Women Total Men Women Total Men Women Total 4N 4NE06000032 Luton Bedfordshire East of England ENG 598 484 1,082 199 161 361 40E06000055 Bedford Bedfordshire East of England ENG 549 514 1,063 183 171 354 154E06000056 Central Bedfordshire Bedfordshire East of England ENG 771 651 1,422 257 217 474 264E06000036 Bracknell Forest Berkshire South East ENG 275 250 525 92 83 175 287E06000037 West Berkshire Berkshire South East ENG 462 383 845 154 128 282 291E06000038 Reading Berkshire South East ENG 425 379 804 142 126 268 143E06000039 Slough Berkshire South East ENG 351 318 669 117 106 223 79E06000040 Windsor and Maidenhead Berkshire South East ENG 447 470 917 149 157 306 306E06000041 Wokingham Berkshire South East ENG 466 375 841 155 125 280 325E06000023 Bristol, City of Bristol South West ENG 1,172 1,121 2,293 391 374 764 77E06000042 Milton Keynes Buckinghamshire South East ENG 649 546 1,195 216 182 398 181E07000004 Aylesbury Vale Buckinghamshire South East ENG 527 522 1,049 176 174 350 283E07000005 Chiltern Buckinghamshire South East ENG 315 287 602 105 96 201 324E07000006 South Bucks Buckinghamshire South East ENG 257 282 539 86 94 180 302E07000007 Wycombe Buckinghamshire South East ENG 561 467 1,028 187 156 343 293E06000031 Peterborough Cambridgeshire East of England ENG 620 521 1,141 207 174 380 58E07000008 Cambridge Cambridgeshire East of England ENG 345 376 721 115 125 240 227E07000009 East Cambridgeshire Cambridgeshire East of England ENG 307 291 598 102 97 199 255E07000010 Fenland Cambridgeshire East of England ENG 448 395 843 149 132 281 55E07000011 Huntingdonshire Cambridgeshire East of England ENG 562 503 1,065 187 168 355 265E07000012 South Cambridgeshire Cambridgeshire East of England ENG 486 447 933 162 149 311 314E06000006 Halton Cheshire North West ENG 438 436 874 146 145 291 36E06000007 Warrington Cheshire North West ENG 770 678 1,448 257 226 483 176E06000049 Cheshire East Cheshire North West ENG 1,481 1,423 2,904 494 474 968 241E06000050 Cheshire West and Chester Cheshire North West ENG 1,301 1,238 2,539 434 413 846 192E06000052 Cornwall and Isles of Scilly Cornwall South West ENG 2,693 2,704 5,397 898 901 1,799 68E06000001 Hartlepool County Durham North East ENG 405 350 755 135 117 252 32E06000004 Stockton-on-Tees County Durham North East ENG 714 694 1,408 238 231 469 130E06000005 Darlington County Durham North East ENG 392 397 789 131 132 263 122E06000047 County Durham County Durham North East ENG 2,104 2,048 4,152 701 683 1,384 81E07000026 Allerdale Cumbria North West ENG 461 471 932 154 157 311 114E07000027 Barrow-in-Furness Cumbria North West ENG 316 290 606 105 97 202 44E07000028 Carlisle Cumbria North West ENG 481 495 976 160 165 325 112E07000029 Copeland Cumbria North West ENG 313 280 593 104 93 198 63E07000030 Eden Cumbria North West ENG 262 227 489 87 76 163 182E07000031 South Lakeland Cumbria North West ENG 487 560 1,047 162 187 349 251E06000015 Derby Derbyshire East Midlands ENG 902 835 1,737 301 278 579 84E07000032 Amber Valley Derbyshire East Midlands ENG 502 499 1,001 167 166 334 162E07000033 Bolsover Derbyshire East Midlands ENG 324 298 622 108 99 207 61E07000034 Chesterfield Derbyshire East Midlands ENG 507 413 920 169 138 307 85E07000035 Derbyshire Dales Derbyshire East Midlands ENG 314 303 617 105 101 206 258E07000036 Erewash Derbyshire East Midlands ENG 450 447 897 150 149 299 149E07000037 High Peak Derbyshire East Midlands ENG 313 324 637 104 108 212 198E07000038 North East Derbyshire Derbyshire East Midlands ENG 450 411 861 150 137 287 190E07000039 South Derbyshire Derbyshire East Midlands ENG 319 320 639 106 107 213 230E06000026 Plymouth Devon South West ENG 931 959 1,890 310 320 630 82E06000027 Torbay Devon South West ENG 718 687 1,405 239 229 468 46E07000040 East Devon Devon South West ENG 702 801 1,503 234 267 501 246E07000041 Exeter Devon South West ENG 391 370 761 130 123 254 165E07000042 Mid Devon Devon South West ENG 345 294 639 115 98 213 156E07000043 North Devon Devon South West ENG 490 502 992 163 167 331 127E07000044 South Hams Devon South West ENG 405 382 787 135 127 262 209E07000045 Teignbridge Devon South West ENG 624 596 1,220 208 199 407 177E07000046 Torridge Devon South West ENG 361 365 726 120 122 242 67E07000047 West Devon Devon South West ENG 261 243 504 87 81 168 141E06000028 Bournemouth Dorset South West ENG 718 776 1,494 239 259 498 117E06000029 Poole Dorset South West ENG 576 645 1,221 192 215 407 208E07000048 Christchurch Dorset South West ENG 297 283 580 99 94 193 259E07000049 East Dorset Dorset South West ENG 461 482 943 154 161 314 303
ALL AGES
Age standardised CVD death rates per 100,000
Total number of CVD deaths 2015/17
Average number of annual CVD deaths 2015/17
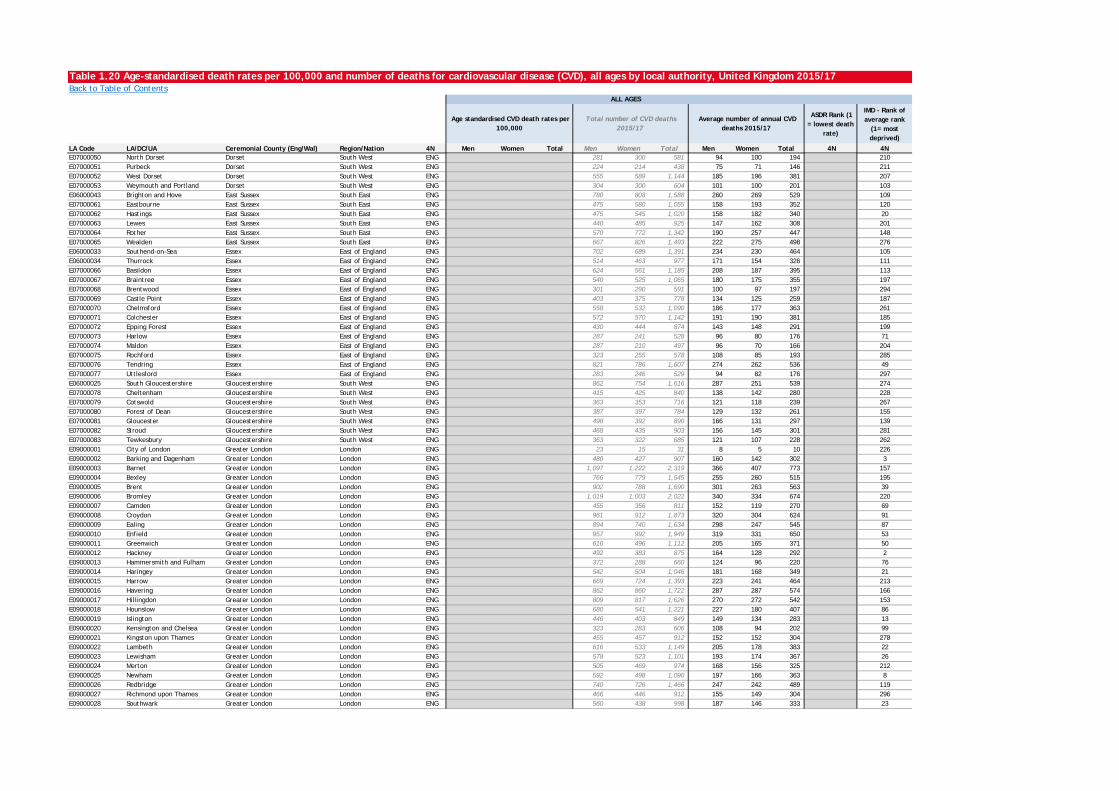
Table 1.20 Age-standardised death rates per 100,000 and number of deaths for cardiovascular disease (CVD), all ages by local authority, United Kingdom 2015/17Back to Table of Contents
ASDR Rank (1 = lowest death
rate)
IMD - Rank of average rank
(1= most deprived)
LA Code LA/DC/UA Ceremonial County (Eng/Wal) Region/Nation 4N Men Women Total Men Women Total Men Women Total 4N 4N
ALL AGES
Age standardised CVD death rates per 100,000
Total number of CVD deaths 2015/17
Average number of annual CVD deaths 2015/17
E07000050 North Dorset Dorset South West ENG 281 300 581 94 100 194 210E07000051 Purbeck Dorset South West ENG 224 214 438 75 71 146 211E07000052 West Dorset Dorset South West ENG 555 589 1,144 185 196 381 207E07000053 Weymouth and Portland Dorset South West ENG 304 300 604 101 100 201 103E06000043 Brighton and Hove East Sussex South East ENG 780 808 1,588 260 269 529 109E07000061 Eastbourne East Sussex South East ENG 475 580 1,055 158 193 352 120E07000062 Hastings East Sussex South East ENG 475 545 1,020 158 182 340 20E07000063 Lewes East Sussex South East ENG 440 485 925 147 162 308 201E07000064 Rother East Sussex South East ENG 570 772 1,342 190 257 447 148E07000065 Wealden East Sussex South East ENG 667 826 1,493 222 275 498 276E06000033 Southend-on-Sea Essex East of England ENG 702 689 1,391 234 230 464 105E06000034 Thurrock Essex East of England ENG 514 463 977 171 154 326 111E07000066 Basildon Essex East of England ENG 624 561 1,185 208 187 395 113E07000067 Braintree Essex East of England ENG 540 525 1,065 180 175 355 197E07000068 Brentwood Essex East of England ENG 301 290 591 100 97 197 294E07000069 Castle Point Essex East of England ENG 403 375 778 134 125 259 187E07000070 Chelmsford Essex East of England ENG 558 532 1,090 186 177 363 261E07000071 Colchester Essex East of England ENG 572 570 1,142 191 190 381 185E07000072 Epping Forest Essex East of England ENG 430 444 874 143 148 291 199E07000073 Harlow Essex East of England ENG 287 241 528 96 80 176 71E07000074 Maldon Essex East of England ENG 287 210 497 96 70 166 204E07000075 Rochford Essex East of England ENG 323 255 578 108 85 193 285E07000076 Tendring Essex East of England ENG 821 786 1,607 274 262 536 49E07000077 Uttlesford Essex East of England ENG 283 246 529 94 82 176 297E06000025 South Gloucestershire Gloucestershire South West ENG 862 754 1,616 287 251 539 274E07000078 Cheltenham Gloucestershire South West ENG 415 425 840 138 142 280 228E07000079 Cotswold Gloucestershire South West ENG 363 353 716 121 118 239 267E07000080 Forest of Dean Gloucestershire South West ENG 387 397 784 129 132 261 155E07000081 Gloucester Gloucestershire South West ENG 498 392 890 166 131 297 139E07000082 Stroud Gloucestershire South West ENG 468 435 903 156 145 301 281E07000083 Tewkesbury Gloucestershire South West ENG 363 322 685 121 107 228 262E09000001 City of London Greater London London ENG 23 15 31 8 5 10 226E09000002 Barking and Dagenham Greater London London ENG 480 427 907 160 142 302 3E09000003 Barnet Greater London London ENG 1,097 1,222 2,319 366 407 773 157E09000004 Bexley Greater London London ENG 766 779 1,545 255 260 515 195E09000005 Brent Greater London London ENG 902 788 1,690 301 263 563 39E09000006 Bromley Greater London London ENG 1,019 1,003 2,022 340 334 674 220E09000007 Camden Greater London London ENG 455 356 811 152 119 270 69E09000008 Croydon Greater London London ENG 961 912 1,873 320 304 624 91E09000009 Ealing Greater London London ENG 894 740 1,634 298 247 545 87E09000010 Enfield Greater London London ENG 957 992 1,949 319 331 650 53E09000011 Greenwich Greater London London ENG 616 496 1,112 205 165 371 50E09000012 Hackney Greater London London ENG 492 383 875 164 128 292 2E09000013 Hammersmith and Fulham Greater London London ENG 372 288 660 124 96 220 76E09000014 Haringey Greater London London ENG 542 504 1,046 181 168 349 21E09000015 Harrow Greater London London ENG 669 724 1,393 223 241 464 213E09000016 Havering Greater London London ENG 862 860 1,722 287 287 574 166E09000017 Hillingdon Greater London London ENG 809 817 1,626 270 272 542 153E09000018 Hounslow Greater London London ENG 680 541 1,221 227 180 407 86E09000019 Islington Greater London London ENG 446 403 849 149 134 283 13E09000020 Kensington and Chelsea Greater London London ENG 323 283 606 108 94 202 99E09000021 Kingston upon Thames Greater London London ENG 455 457 912 152 152 304 278E09000022 Lambeth Greater London London ENG 616 533 1,149 205 178 383 22E09000023 Lewisham Greater London London ENG 578 523 1,101 193 174 367 26E09000024 Merton Greater London London ENG 505 469 974 168 156 325 212E09000025 Newham Greater London London ENG 592 498 1,090 197 166 363 8E09000026 Redbridge Greater London London ENG 740 726 1,466 247 242 489 119E09000027 Richmond upon Thames Greater London London ENG 466 446 912 155 149 304 296E09000028 Southwark Greater London London ENG 560 438 998 187 146 333 23
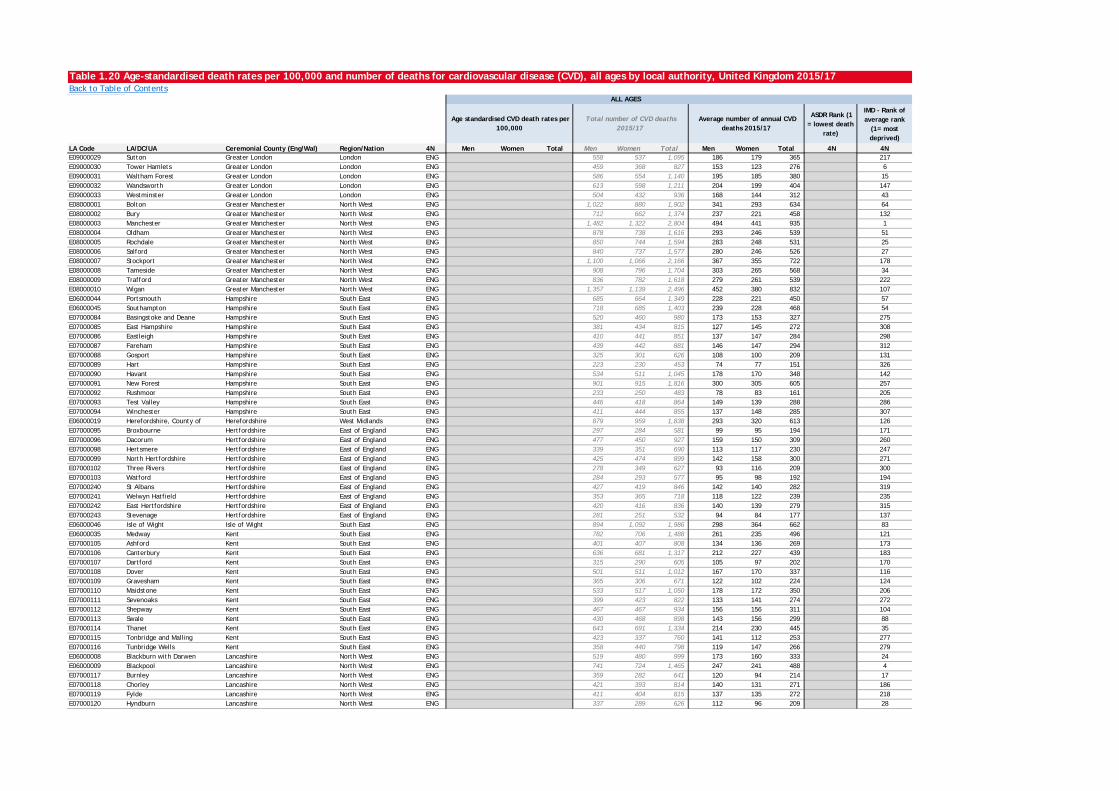
Table 1.20 Age-standardised death rates per 100,000 and number of deaths for cardiovascular disease (CVD), all ages by local authority, United Kingdom 2015/17Back to Table of Contents
ASDR Rank (1 = lowest death
rate)
IMD - Rank of average rank
(1= most deprived)
LA Code LA/DC/UA Ceremonial County (Eng/Wal) Region/Nation 4N Men Women Total Men Women Total Men Women Total 4N 4N
ALL AGES
Age standardised CVD death rates per 100,000
Total number of CVD deaths 2015/17
Average number of annual CVD deaths 2015/17
E09000029 Sutton Greater London London ENG 558 537 1,095 186 179 365 217E09000030 Tower Hamlets Greater London London ENG 459 368 827 153 123 276 6E09000031 Waltham Forest Greater London London ENG 586 554 1,140 195 185 380 15E09000032 Wandsworth Greater London London ENG 613 598 1,211 204 199 404 147E09000033 Westminster Greater London London ENG 504 432 936 168 144 312 43E08000001 Bolton Greater Manchester North West ENG 1,022 880 1,902 341 293 634 64E08000002 Bury Greater Manchester North West ENG 712 662 1,374 237 221 458 132E08000003 Manchester Greater Manchester North West ENG 1,482 1,322 2,804 494 441 935 1E08000004 Oldham Greater Manchester North West ENG 878 738 1,616 293 246 539 51E08000005 Rochdale Greater Manchester North West ENG 850 744 1,594 283 248 531 25E08000006 Salford Greater Manchester North West ENG 840 737 1,577 280 246 526 27E08000007 Stockport Greater Manchester North West ENG 1,100 1,066 2,166 367 355 722 178E08000008 Tameside Greater Manchester North West ENG 908 796 1,704 303 265 568 34E08000009 Trafford Greater Manchester North West ENG 836 782 1,618 279 261 539 222E08000010 Wigan Greater Manchester North West ENG 1,357 1,139 2,496 452 380 832 107E06000044 Portsmouth Hampshire South East ENG 685 664 1,349 228 221 450 57E06000045 Southampton Hampshire South East ENG 718 685 1,403 239 228 468 54E07000084 Basingstoke and Deane Hampshire South East ENG 520 460 980 173 153 327 275E07000085 East Hampshire Hampshire South East ENG 381 434 815 127 145 272 308E07000086 Eastleigh Hampshire South East ENG 410 441 851 137 147 284 298E07000087 Fareham Hampshire South East ENG 439 442 881 146 147 294 312E07000088 Gosport Hampshire South East ENG 325 301 626 108 100 209 131E07000089 Hart Hampshire South East ENG 223 230 453 74 77 151 326E07000090 Havant Hampshire South East ENG 534 511 1,045 178 170 348 142E07000091 New Forest Hampshire South East ENG 901 915 1,816 300 305 605 257E07000092 Rushmoor Hampshire South East ENG 233 250 483 78 83 161 205E07000093 Test Valley Hampshire South East ENG 446 418 864 149 139 288 286E07000094 Winchester Hampshire South East ENG 411 444 855 137 148 285 307E06000019 Herefordshire, County of Herefordshire West Midlands ENG 879 959 1,838 293 320 613 126E07000095 Broxbourne Hertfordshire East of England ENG 297 284 581 99 95 194 171E07000096 Dacorum Hertfordshire East of England ENG 477 450 927 159 150 309 260E07000098 Hertsmere Hertfordshire East of England ENG 339 351 690 113 117 230 247E07000099 North Hertfordshire Hertfordshire East of England ENG 425 474 899 142 158 300 271E07000102 Three Rivers Hertfordshire East of England ENG 278 349 627 93 116 209 300E07000103 Watford Hertfordshire East of England ENG 284 293 577 95 98 192 194E07000240 St Albans Hertfordshire East of England ENG 427 419 846 142 140 282 319E07000241 Welwyn Hatfield Hertfordshire East of England ENG 353 365 718 118 122 239 235E07000242 East Hertfordshire Hertfordshire East of England ENG 420 416 836 140 139 279 315E07000243 Stevenage Hertfordshire East of England ENG 281 251 532 94 84 177 137E06000046 Isle of Wight Isle of Wight South East ENG 894 1,092 1,986 298 364 662 83E06000035 Medway Kent South East ENG 782 706 1,488 261 235 496 121E07000105 Ashford Kent South East ENG 401 407 808 134 136 269 173E07000106 Canterbury Kent South East ENG 636 681 1,317 212 227 439 183E07000107 Dartford Kent South East ENG 315 290 605 105 97 202 170E07000108 Dover Kent South East ENG 501 511 1,012 167 170 337 116E07000109 Gravesham Kent South East ENG 365 306 671 122 102 224 124E07000110 Maidstone Kent South East ENG 533 517 1,050 178 172 350 206E07000111 Sevenoaks Kent South East ENG 399 423 822 133 141 274 272E07000112 Shepway Kent South East ENG 467 467 934 156 156 311 104E07000113 Swale Kent South East ENG 430 468 898 143 156 299 88E07000114 Thanet Kent South East ENG 643 691 1,334 214 230 445 35E07000115 Tonbridge and Malling Kent South East ENG 423 337 760 141 112 253 277E07000116 Tunbridge Wells Kent South East ENG 358 440 798 119 147 266 279E06000008 Blackburn with Darwen Lancashire North West ENG 519 480 999 173 160 333 24E06000009 Blackpool Lancashire North West ENG 741 724 1,465 247 241 488 4E07000117 Burnley Lancashire North West ENG 359 282 641 120 94 214 17E07000118 Chorley Lancashire North West ENG 421 393 814 140 131 271 186E07000119 Fylde Lancashire North West ENG 411 404 815 137 135 272 218E07000120 Hyndburn Lancashire North West ENG 337 289 626 112 96 209 28
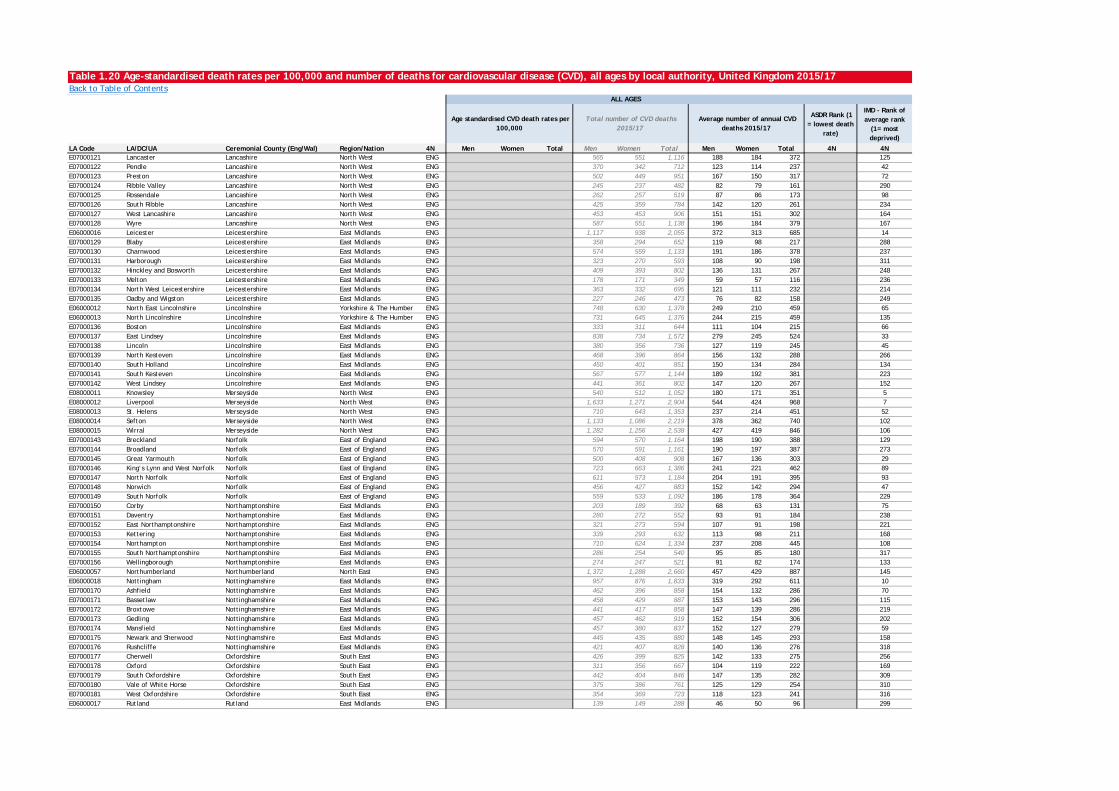
Table 1.20 Age-standardised death rates per 100,000 and number of deaths for cardiovascular disease (CVD), all ages by local authority, United Kingdom 2015/17Back to Table of Contents
ASDR Rank (1 = lowest death
rate)
IMD - Rank of average rank
(1= most deprived)
LA Code LA/DC/UA Ceremonial County (Eng/Wal) Region/Nation 4N Men Women Total Men Women Total Men Women Total 4N 4N
ALL AGES
Age standardised CVD death rates per 100,000
Total number of CVD deaths 2015/17
Average number of annual CVD deaths 2015/17
E07000121 Lancaster Lancashire North West ENG 565 551 1,116 188 184 372 125E07000122 Pendle Lancashire North West ENG 370 342 712 123 114 237 42E07000123 Preston Lancashire North West ENG 502 449 951 167 150 317 72E07000124 Ribble Valley Lancashire North West ENG 245 237 482 82 79 161 290E07000125 Rossendale Lancashire North West ENG 262 257 519 87 86 173 98E07000126 South Ribble Lancashire North West ENG 425 359 784 142 120 261 234E07000127 West Lancashire Lancashire North West ENG 453 453 906 151 151 302 164E07000128 Wyre Lancashire North West ENG 587 551 1,138 196 184 379 167E06000016 Leicester Leicestershire East Midlands ENG 1,117 938 2,055 372 313 685 14E07000129 Blaby Leicestershire East Midlands ENG 358 294 652 119 98 217 288E07000130 Charnwood Leicestershire East Midlands ENG 574 559 1,133 191 186 378 237E07000131 Harborough Leicestershire East Midlands ENG 323 270 593 108 90 198 311E07000132 Hinckley and Bosworth Leicestershire East Midlands ENG 409 393 802 136 131 267 248E07000133 Melton Leicestershire East Midlands ENG 178 171 349 59 57 116 236E07000134 North West Leicestershire Leicestershire East Midlands ENG 363 332 695 121 111 232 214E07000135 Oadby and Wigston Leicestershire East Midlands ENG 227 246 473 76 82 158 249E06000012 North East Lincolnshire Lincolnshire Yorkshire & The Humber ENG 748 630 1,378 249 210 459 65E06000013 North Lincolnshire Lincolnshire Yorkshire & The Humber ENG 731 645 1,376 244 215 459 135E07000136 Boston Lincolnshire East Midlands ENG 333 311 644 111 104 215 66E07000137 East Lindsey Lincolnshire East Midlands ENG 838 734 1,572 279 245 524 33E07000138 Lincoln Lincolnshire East Midlands ENG 380 356 736 127 119 245 45E07000139 North Kesteven Lincolnshire East Midlands ENG 468 396 864 156 132 288 266E07000140 South Holland Lincolnshire East Midlands ENG 450 401 851 150 134 284 134E07000141 South Kesteven Lincolnshire East Midlands ENG 567 577 1,144 189 192 381 223E07000142 West Lindsey Lincolnshire East Midlands ENG 441 361 802 147 120 267 152E08000011 Knowsley Merseyside North West ENG 540 512 1,052 180 171 351 5E08000012 Liverpool Merseyside North West ENG 1,633 1,271 2,904 544 424 968 7E08000013 St. Helens Merseyside North West ENG 710 643 1,353 237 214 451 52E08000014 Sefton Merseyside North West ENG 1,133 1,086 2,219 378 362 740 102E08000015 Wirral Merseyside North West ENG 1,282 1,256 2,538 427 419 846 106E07000143 Breckland Norfolk East of England ENG 594 570 1,164 198 190 388 129E07000144 Broadland Norfolk East of England ENG 570 591 1,161 190 197 387 273E07000145 Great Yarmouth Norfolk East of England ENG 500 408 908 167 136 303 29E07000146 King’s Lynn and West Norfolk Norfolk East of England ENG 723 663 1,386 241 221 462 89E07000147 North Norfolk Norfolk East of England ENG 611 573 1,184 204 191 395 93E07000148 Norwich Norfolk East of England ENG 456 427 883 152 142 294 47E07000149 South Norfolk Norfolk East of England ENG 559 533 1,092 186 178 364 229E07000150 Corby Northamptonshire East Midlands ENG 203 189 392 68 63 131 75E07000151 Daventry Northamptonshire East Midlands ENG 280 272 552 93 91 184 238E07000152 East Northamptonshire Northamptonshire East Midlands ENG 321 273 594 107 91 198 221E07000153 Kettering Northamptonshire East Midlands ENG 339 293 632 113 98 211 168E07000154 Northampton Northamptonshire East Midlands ENG 710 624 1,334 237 208 445 108E07000155 South Northamptonshire Northamptonshire East Midlands ENG 286 254 540 95 85 180 317E07000156 Wellingborough Northamptonshire East Midlands ENG 274 247 521 91 82 174 133E06000057 Northumberland Northumberland North East ENG 1,372 1,288 2,660 457 429 887 145E06000018 Nottingham Nottinghamshire East Midlands ENG 957 876 1,833 319 292 611 10E07000170 Ashfield Nottinghamshire East Midlands ENG 462 396 858 154 132 286 70E07000171 Bassetlaw Nottinghamshire East Midlands ENG 458 429 887 153 143 296 115E07000172 Broxtowe Nottinghamshire East Midlands ENG 441 417 858 147 139 286 219E07000173 Gedling Nottinghamshire East Midlands ENG 457 462 919 152 154 306 202E07000174 Mansfield Nottinghamshire East Midlands ENG 457 380 837 152 127 279 59E07000175 Newark and Sherwood Nottinghamshire East Midlands ENG 445 435 880 148 145 293 158E07000176 Rushcliffe Nottinghamshire East Midlands ENG 421 407 828 140 136 276 318E07000177 Cherwell Oxfordshire South East ENG 426 399 825 142 133 275 256E07000178 Oxford Oxfordshire South East ENG 311 356 667 104 119 222 169E07000179 South Oxfordshire Oxfordshire South East ENG 442 404 846 147 135 282 309E07000180 Vale of White Horse Oxfordshire South East ENG 375 386 761 125 129 254 310E07000181 West Oxfordshire Oxfordshire South East ENG 354 369 723 118 123 241 316E06000017 Rutland Rutland East Midlands ENG 139 149 288 46 50 96 299
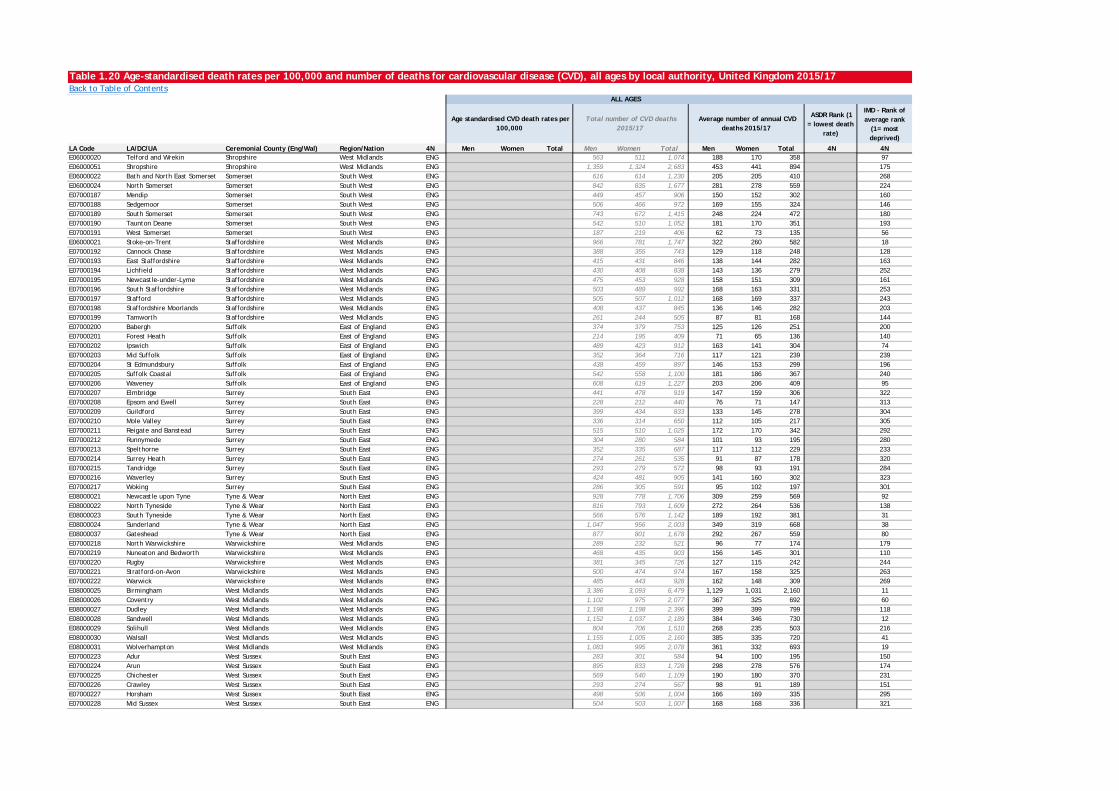
Table 1.20 Age-standardised death rates per 100,000 and number of deaths for cardiovascular disease (CVD), all ages by local authority, United Kingdom 2015/17Back to Table of Contents
ASDR Rank (1 = lowest death
rate)
IMD - Rank of average rank
(1= most deprived)
LA Code LA/DC/UA Ceremonial County (Eng/Wal) Region/Nation 4N Men Women Total Men Women Total Men Women Total 4N 4N
ALL AGES
Age standardised CVD death rates per 100,000
Total number of CVD deaths 2015/17
Average number of annual CVD deaths 2015/17
E06000020 Telford and Wrekin Shropshire West Midlands ENG 563 511 1,074 188 170 358 97E06000051 Shropshire Shropshire West Midlands ENG 1,359 1,324 2,683 453 441 894 175E06000022 Bath and North East Somerset Somerset South West ENG 616 614 1,230 205 205 410 268E06000024 North Somerset Somerset South West ENG 842 835 1,677 281 278 559 224E07000187 Mendip Somerset South West ENG 449 457 906 150 152 302 160E07000188 Sedgemoor Somerset South West ENG 506 466 972 169 155 324 146E07000189 South Somerset Somerset South West ENG 743 672 1,415 248 224 472 180E07000190 Taunton Deane Somerset South West ENG 542 510 1,052 181 170 351 193E07000191 West Somerset Somerset South West ENG 187 219 406 62 73 135 56E06000021 Stoke-on-Trent Staffordshire West Midlands ENG 966 781 1,747 322 260 582 18E07000192 Cannock Chase Staffordshire West Midlands ENG 388 355 743 129 118 248 128E07000193 East Staffordshire Staffordshire West Midlands ENG 415 431 846 138 144 282 163E07000194 Lichfield Staffordshire West Midlands ENG 430 408 838 143 136 279 252E07000195 Newcastle-under-Lyme Staffordshire West Midlands ENG 475 453 928 158 151 309 161E07000196 South Staffordshire Staffordshire West Midlands ENG 503 489 992 168 163 331 253E07000197 Stafford Staffordshire West Midlands ENG 505 507 1,012 168 169 337 243E07000198 Staffordshire Moorlands Staffordshire West Midlands ENG 408 437 845 136 146 282 203E07000199 Tamworth Staffordshire West Midlands ENG 261 244 505 87 81 168 144E07000200 Babergh Suffolk East of England ENG 374 379 753 125 126 251 200E07000201 Forest Heath Suffolk East of England ENG 214 195 409 71 65 136 140E07000202 Ipswich Suffolk East of England ENG 489 423 912 163 141 304 74E07000203 Mid Suffolk Suffolk East of England ENG 352 364 716 117 121 239 239E07000204 St Edmundsbury Suffolk East of England ENG 438 459 897 146 153 299 196E07000205 Suffolk Coastal Suffolk East of England ENG 542 558 1,100 181 186 367 240E07000206 Waveney Suffolk East of England ENG 608 619 1,227 203 206 409 95E07000207 Elmbridge Surrey South East ENG 441 478 919 147 159 306 322E07000208 Epsom and Ewell Surrey South East ENG 228 212 440 76 71 147 313E07000209 Guildford Surrey South East ENG 399 434 833 133 145 278 304E07000210 Mole Valley Surrey South East ENG 336 314 650 112 105 217 305E07000211 Reigate and Banstead Surrey South East ENG 515 510 1,025 172 170 342 292E07000212 Runnymede Surrey South East ENG 304 280 584 101 93 195 280E07000213 Spelthorne Surrey South East ENG 352 335 687 117 112 229 233E07000214 Surrey Heath Surrey South East ENG 274 261 535 91 87 178 320E07000215 Tandridge Surrey South East ENG 293 279 572 98 93 191 284E07000216 Waverley Surrey South East ENG 424 481 905 141 160 302 323E07000217 Woking Surrey South East ENG 286 305 591 95 102 197 301E08000021 Newcastle upon Tyne Tyne & Wear North East ENG 928 778 1,706 309 259 569 92E08000022 North Tyneside Tyne & Wear North East ENG 816 793 1,609 272 264 536 138E08000023 South Tyneside Tyne & Wear North East ENG 566 576 1,142 189 192 381 31E08000024 Sunderland Tyne & Wear North East ENG 1,047 956 2,003 349 319 668 38E08000037 Gateshead Tyne & Wear North East ENG 877 801 1,678 292 267 559 80E07000218 North Warwickshire Warwickshire West Midlands ENG 289 232 521 96 77 174 179E07000219 Nuneaton and Bedworth Warwickshire West Midlands ENG 468 435 903 156 145 301 110E07000220 Rugby Warwickshire West Midlands ENG 381 345 726 127 115 242 244E07000221 Stratford-on-Avon Warwickshire West Midlands ENG 500 474 974 167 158 325 263E07000222 Warwick Warwickshire West Midlands ENG 485 443 928 162 148 309 269E08000025 Birmingham West Midlands West Midlands ENG 3,386 3,093 6,479 1,129 1,031 2,160 11E08000026 Coventry West Midlands West Midlands ENG 1,102 975 2,077 367 325 692 60E08000027 Dudley West Midlands West Midlands ENG 1,198 1,198 2,396 399 399 799 118E08000028 Sandwell West Midlands West Midlands ENG 1,152 1,037 2,189 384 346 730 12E08000029 Solihull West Midlands West Midlands ENG 804 706 1,510 268 235 503 216E08000030 Walsall West Midlands West Midlands ENG 1,155 1,005 2,160 385 335 720 41E08000031 Wolverhampton West Midlands West Midlands ENG 1,083 995 2,078 361 332 693 19E07000223 Adur West Sussex South East ENG 283 301 584 94 100 195 150E07000224 Arun West Sussex South East ENG 895 833 1,728 298 278 576 174E07000225 Chichester West Sussex South East ENG 569 540 1,109 190 180 370 231E07000226 Crawley West Sussex South East ENG 293 274 567 98 91 189 151E07000227 Horsham West Sussex South East ENG 498 506 1,004 166 169 335 295E07000228 Mid Sussex West Sussex South East ENG 504 503 1,007 168 168 336 321
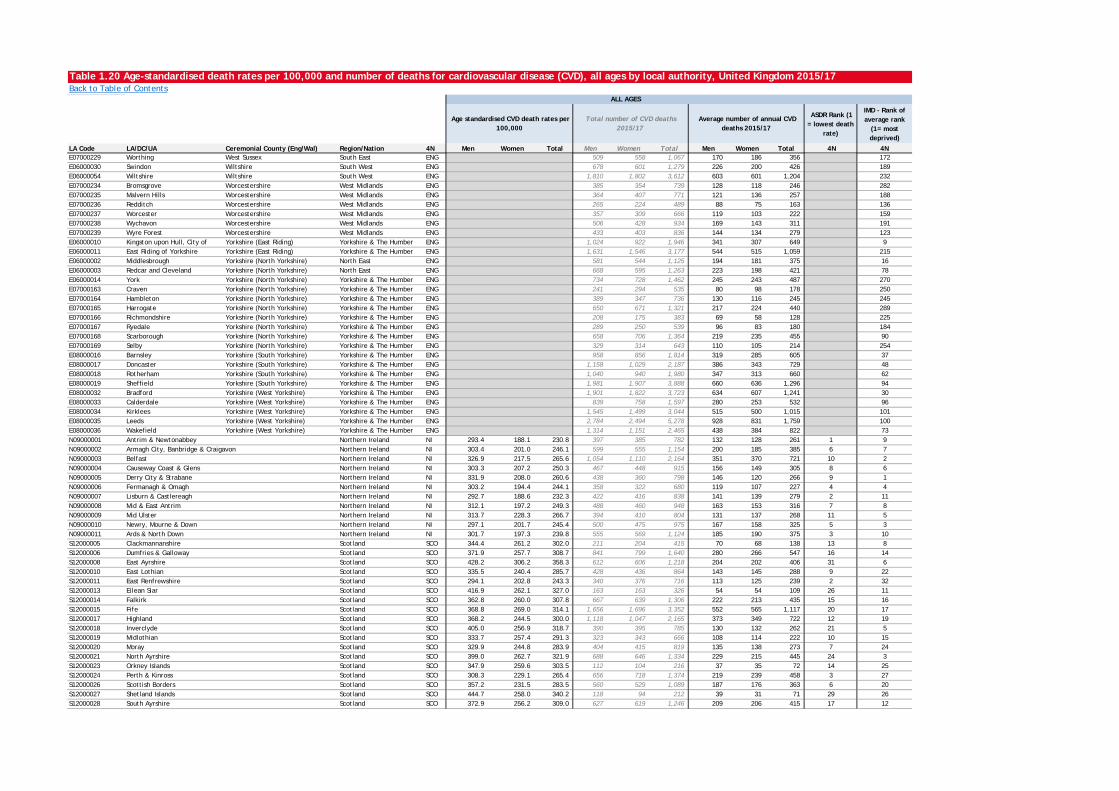
Table 1.20 Age-standardised death rates per 100,000 and number of deaths for cardiovascular disease (CVD), all ages by local authority, United Kingdom 2015/17Back to Table of Contents
ASDR Rank (1 = lowest death
rate)
IMD - Rank of average rank
(1= most deprived)
LA Code LA/DC/UA Ceremonial County (Eng/Wal) Region/Nation 4N Men Women Total Men Women Total Men Women Total 4N 4N
ALL AGES
Age standardised CVD death rates per 100,000
Total number of CVD deaths 2015/17
Average number of annual CVD deaths 2015/17
E07000229 Worthing West Sussex South East ENG 509 558 1,067 170 186 356 172E06000030 Swindon Wiltshire South West ENG 678 601 1,279 226 200 426 189E06000054 Wiltshire Wiltshire South West ENG 1,810 1,802 3,612 603 601 1,204 232E07000234 Bromsgrove Worcestershire West Midlands ENG 385 354 739 128 118 246 282E07000235 Malvern Hills Worcestershire West Midlands ENG 364 407 771 121 136 257 188E07000236 Redditch Worcestershire West Midlands ENG 265 224 489 88 75 163 136E07000237 Worcester Worcestershire West Midlands ENG 357 309 666 119 103 222 159E07000238 Wychavon Worcestershire West Midlands ENG 506 428 934 169 143 311 191E07000239 Wyre Forest Worcestershire West Midlands ENG 433 403 836 144 134 279 123E06000010 Kingston upon Hull, City of Yorkshire (East Riding) Yorkshire & The Humber ENG 1,024 922 1,946 341 307 649 9E06000011 East Riding of Yorkshire Yorkshire (East Riding) Yorkshire & The Humber ENG 1,631 1,546 3,177 544 515 1,059 215E06000002 Middlesbrough Yorkshire (North Yorkshire) North East ENG 581 544 1,125 194 181 375 16E06000003 Redcar and Cleveland Yorkshire (North Yorkshire) North East ENG 668 595 1,263 223 198 421 78E06000014 York Yorkshire (North Yorkshire) Yorkshire & The Humber ENG 734 728 1,462 245 243 487 270E07000163 Craven Yorkshire (North Yorkshire) Yorkshire & The Humber ENG 241 294 535 80 98 178 250E07000164 Hambleton Yorkshire (North Yorkshire) Yorkshire & The Humber ENG 389 347 736 130 116 245 245E07000165 Harrogate Yorkshire (North Yorkshire) Yorkshire & The Humber ENG 650 671 1,321 217 224 440 289E07000166 Richmondshire Yorkshire (North Yorkshire) Yorkshire & The Humber ENG 208 175 383 69 58 128 225E07000167 Ryedale Yorkshire (North Yorkshire) Yorkshire & The Humber ENG 289 250 539 96 83 180 184E07000168 Scarborough Yorkshire (North Yorkshire) Yorkshire & The Humber ENG 658 706 1,364 219 235 455 90E07000169 Selby Yorkshire (North Yorkshire) Yorkshire & The Humber ENG 329 314 643 110 105 214 254E08000016 Barnsley Yorkshire (South Yorkshire) Yorkshire & The Humber ENG 958 856 1,814 319 285 605 37E08000017 Doncaster Yorkshire (South Yorkshire) Yorkshire & The Humber ENG 1,158 1,029 2,187 386 343 729 48E08000018 Rotherham Yorkshire (South Yorkshire) Yorkshire & The Humber ENG 1,040 940 1,980 347 313 660 62E08000019 Sheffield Yorkshire (South Yorkshire) Yorkshire & The Humber ENG 1,981 1,907 3,888 660 636 1,296 94E08000032 Bradford Yorkshire (West Yorkshire) Yorkshire & The Humber ENG 1,901 1,822 3,723 634 607 1,241 30E08000033 Calderdale Yorkshire (West Yorkshire) Yorkshire & The Humber ENG 839 758 1,597 280 253 532 96E08000034 Kirklees Yorkshire (West Yorkshire) Yorkshire & The Humber ENG 1,545 1,499 3,044 515 500 1,015 101E08000035 Leeds Yorkshire (West Yorkshire) Yorkshire & The Humber ENG 2,784 2,494 5,278 928 831 1,759 100E08000036 Wakefield Yorkshire (West Yorkshire) Yorkshire & The Humber ENG 1,314 1,151 2,465 438 384 822 73N09000001 Antrim & Newtonabbey Northern Ireland NI 293.4 188.1 230.8 397 385 782 132 128 261 1 9N09000002 Armagh City, Banbridge & Craigavon Northern Ireland NI 303.4 201.0 246.1 599 555 1,154 200 185 385 6 7N09000003 Belfast Northern Ireland NI 326.9 217.5 265.6 1,054 1,110 2,164 351 370 721 10 2N09000004 Causeway Coast & Glens Northern Ireland NI 303.3 207.2 250.3 467 448 915 156 149 305 8 6N09000005 Derry City & Strabane Northern Ireland NI 331.9 208.0 260.6 438 360 798 146 120 266 9 1N09000006 Fermanagh & Omagh Northern Ireland NI 303.2 194.4 244.1 358 322 680 119 107 227 4 4N09000007 Lisburn & Castlereagh Northern Ireland NI 292.7 188.6 232.3 422 416 838 141 139 279 2 11N09000008 Mid & East Antrim Northern Ireland NI 312.1 197.2 249.3 488 460 948 163 153 316 7 8N09000009 Mid Ulster Northern Ireland NI 313.7 228.3 266.7 394 410 804 131 137 268 11 5N09000010 Newry, Mourne & Down Northern Ireland NI 297.1 201.7 245.4 500 475 975 167 158 325 5 3N09000011 Ards & North Down Northern Ireland NI 301.7 197.3 239.8 555 569 1,124 185 190 375 3 10S12000005 Clackmannanshire Scotland SCO 344.4 261.2 302.0 211 204 415 70 68 138 13 8S12000006 Dumfries & Galloway Scotland SCO 371.9 257.7 308.7 841 799 1,640 280 266 547 16 14S12000008 East Ayrshire Scotland SCO 428.2 306.2 358.3 612 606 1,218 204 202 406 31 6S12000010 East Lothian Scotland SCO 335.5 240.4 285.7 428 436 864 143 145 288 9 22S12000011 East Renfrewshire Scotland SCO 294.1 202.8 243.3 340 376 716 113 125 239 2 32S12000013 Eilean Siar Scotland SCO 416.9 262.1 327.0 163 163 326 54 54 109 26 11S12000014 Falkirk Scotland SCO 362.8 260.0 307.8 667 639 1,306 222 213 435 15 16S12000015 Fife Scotland SCO 368.8 269.0 314.1 1,656 1,696 3,352 552 565 1,117 20 17S12000017 Highland Scotland SCO 368.2 244.5 300.0 1,118 1,047 2,165 373 349 722 12 19S12000018 Inverclyde Scotland SCO 405.0 256.9 318.7 390 395 785 130 132 262 21 5S12000019 Midlothian Scotland SCO 333.7 257.4 291.3 323 343 666 108 114 222 10 15S12000020 Moray Scotland SCO 329.9 244.8 283.9 404 415 819 135 138 273 7 24S12000021 North Ayrshire Scotland SCO 399.0 262.7 321.9 688 646 1,334 229 215 445 24 3S12000023 Orkney Islands Scotland SCO 347.9 259.6 303.5 112 104 216 37 35 72 14 25S12000024 Perth & Kinross Scotland SCO 308.3 229.1 265.4 656 718 1,374 219 239 458 3 27S12000026 Scottish Borders Scotland SCO 357.2 231.5 283.5 560 529 1,089 187 176 363 6 20S12000027 Shetland Islands Scotland SCO 444.7 258.0 340.2 118 94 212 39 31 71 29 26S12000028 South Ayrshire Scotland SCO 372.9 256.2 309.0 627 619 1,246 209 206 415 17 12
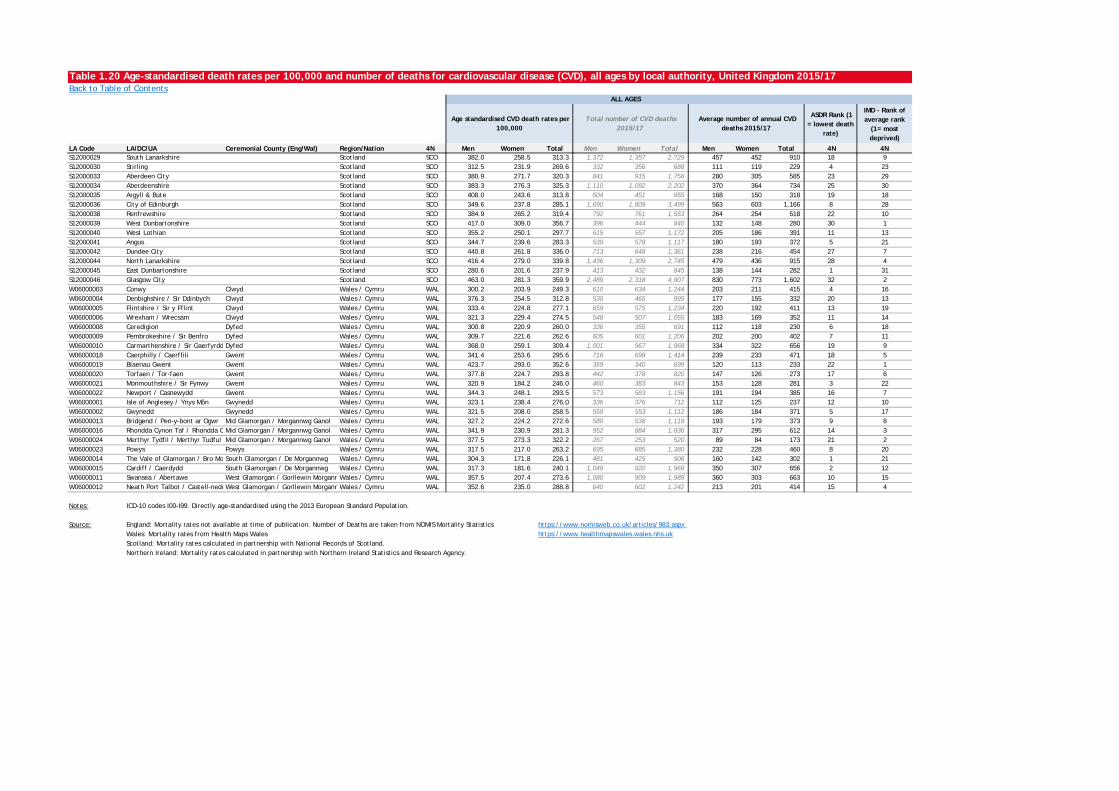
Table 1.20 Age-standardised death rates per 100,000 and number of deaths for cardiovascular disease (CVD), all ages by local authority, United Kingdom 2015/17Back to Table of Contents
ASDR Rank (1 = lowest death
rate)
IMD - Rank of average rank
(1= most deprived)
LA Code LA/DC/UA Ceremonial County (Eng/Wal) Region/Nation 4N Men Women Total Men Women Total Men Women Total 4N 4N
ALL AGES
Age standardised CVD death rates per 100,000
Total number of CVD deaths 2015/17
Average number of annual CVD deaths 2015/17
S12000029 South Lanarkshire Scotland SCO 382.0 258.5 313.3 1,372 1,357 2,729 457 452 910 18 9S12000030 Stirling Scotland SCO 312.5 231.9 269.6 332 356 688 111 119 229 4 23S12000033 Aberdeen City Scotland SCO 380.9 271.7 320.3 841 915 1,756 280 305 585 23 29S12000034 Aberdeenshire Scotland SCO 383.3 276.3 325.3 1,110 1,092 2,202 370 364 734 25 30S12000035 Argyll & Bute Scotland SCO 408.0 243.6 313.8 504 451 955 168 150 318 19 18S12000036 City of Edinburgh Scotland SCO 349.6 237.8 285.1 1,690 1,809 3,499 563 603 1,166 8 28S12000038 Renfrewshire Scotland SCO 384.9 265.2 319.4 792 761 1,553 264 254 518 22 10S12000039 West Dunbartonshire Scotland SCO 417.0 309.0 356.7 396 444 840 132 148 280 30 1S12000040 West Lothian Scotland SCO 355.2 250.1 297.7 615 557 1,172 205 186 391 11 13S12000041 Angus Scotland SCO 344.7 239.6 283.3 539 578 1,117 180 193 372 5 21S12000042 Dundee City Scotland SCO 440.8 261.8 336.0 713 648 1,361 238 216 454 27 7S12000044 North Lanarkshire Scotland SCO 416.4 279.0 339.8 1,436 1,309 2,745 479 436 915 28 4S12000045 East Dunbartonshire Scotland SCO 280.6 201.6 237.9 413 432 845 138 144 282 1 31S12000046 Glasgow City Scotland SCO 463.0 281.3 359.9 2,489 2,318 4,807 830 773 1,602 32 2W06000003 Conwy Clwyd Wales / Cymru WAL 300.2 203.9 249.3 610 634 1,244 203 211 415 4 16W06000004 Denbighshire / Sir Ddinbych Clwyd Wales / Cymru WAL 376.3 254.5 312.8 530 465 995 177 155 332 20 13W06000005 Flintshire / Sir y Fflint Clwyd Wales / Cymru WAL 333.4 224.8 277.1 659 575 1,234 220 192 411 13 19W06000006 Wrexham / Wrecsam Clwyd Wales / Cymru WAL 321.3 229.4 274.5 548 507 1,055 183 169 352 11 14W06000008 Ceredigion Dyfed Wales / Cymru WAL 300.8 220.9 260.0 336 355 691 112 118 230 6 18W06000009 Pembrokeshire / Sir Benfro Dyfed Wales / Cymru WAL 309.7 221.6 262.6 605 601 1,206 202 200 402 7 11W06000010 Carmarthenshire / Sir Gaerfyrdd Dyfed Wales / Cymru WAL 368.0 259.1 309.4 1,001 967 1,968 334 322 656 19 9W06000018 Caerphilly / Caerffili Gwent Wales / Cymru WAL 341.4 253.6 295.6 716 698 1,414 239 233 471 18 5W06000019 Blaenau Gwent Gwent Wales / Cymru WAL 423.7 293.0 352.6 359 340 699 120 113 233 22 1W06000020 Torfaen / Tor-faen Gwent Wales / Cymru WAL 377.8 224.7 293.8 442 378 820 147 126 273 17 6W06000021 Monmouthshire / Sir Fynwy Gwent Wales / Cymru WAL 320.9 184.2 246.0 460 383 843 153 128 281 3 22W06000022 Newport / Casnewydd Gwent Wales / Cymru WAL 344.3 248.1 293.5 573 583 1,156 191 194 385 16 7W06000001 Isle of Anglesey / Ynys Môn Gwynedd Wales / Cymru WAL 323.1 238.4 276.0 336 376 712 112 125 237 12 10W06000002 Gwynedd Gwynedd Wales / Cymru WAL 321.5 208.0 258.5 559 553 1,112 186 184 371 5 17W06000013 Bridgend / Pen-y-bont ar Ogwr Mid Glamorgan / Morgannwg Ganol Wales / Cymru WAL 327.2 224.2 272.6 580 538 1,118 193 179 373 9 8W06000016 Rhondda Cynon Taf / Rhondda C Mid Glamorgan / Morgannwg Ganol Wales / Cymru WAL 341.9 230.9 281.3 952 884 1,836 317 295 612 14 3W06000024 Merthyr Tydfil / Merthyr Tudful Mid Glamorgan / Morgannwg Ganol Wales / Cymru WAL 377.5 273.3 322.2 267 253 520 89 84 173 21 2W06000023 Powys Powys Wales / Cymru WAL 317.5 217.0 263.2 695 685 1,380 232 228 460 8 20W06000014 The Vale of Glamorgan / Bro Mo South Glamorgan / De Morgannwg Wales / Cymru WAL 304.3 171.8 226.1 481 425 906 160 142 302 1 21W06000015 Cardiff / Caerdydd South Glamorgan / De Morgannwg Wales / Cymru WAL 317.3 181.6 240.1 1,049 920 1,969 350 307 656 2 12W06000011 Swansea / Abertawe West Glamorgan / Gorllewin Morgann Wales / Cymru WAL 357.5 207.4 273.6 1,080 909 1,989 360 303 663 10 15W06000012 Neath Port Talbot / Castell-nedd West Glamorgan / Gorllewin Morgann Wales / Cymru WAL 352.6 235.0 288.8 640 602 1,242 213 201 414 15 4
Notes: ICD-10 codes I00-I99. Directly age-standardised using the 2013 European Standard Population.
Source: England: Mortality rates not available at time of publication. Number of Deaths are taken from NOMIS Mortality Statistics https://www.nomisweb.co.uk/articles/983.aspx Wales: Mortality rates from Health Maps Wales https://www.healthmapswales.wales.nhs.ukScotland: Mortality rates calculated in partnership with National Records of Scotland.Northern Ireland: Mortality rates calculated in partnership with Northern Ireland Statistics and Research Agency.
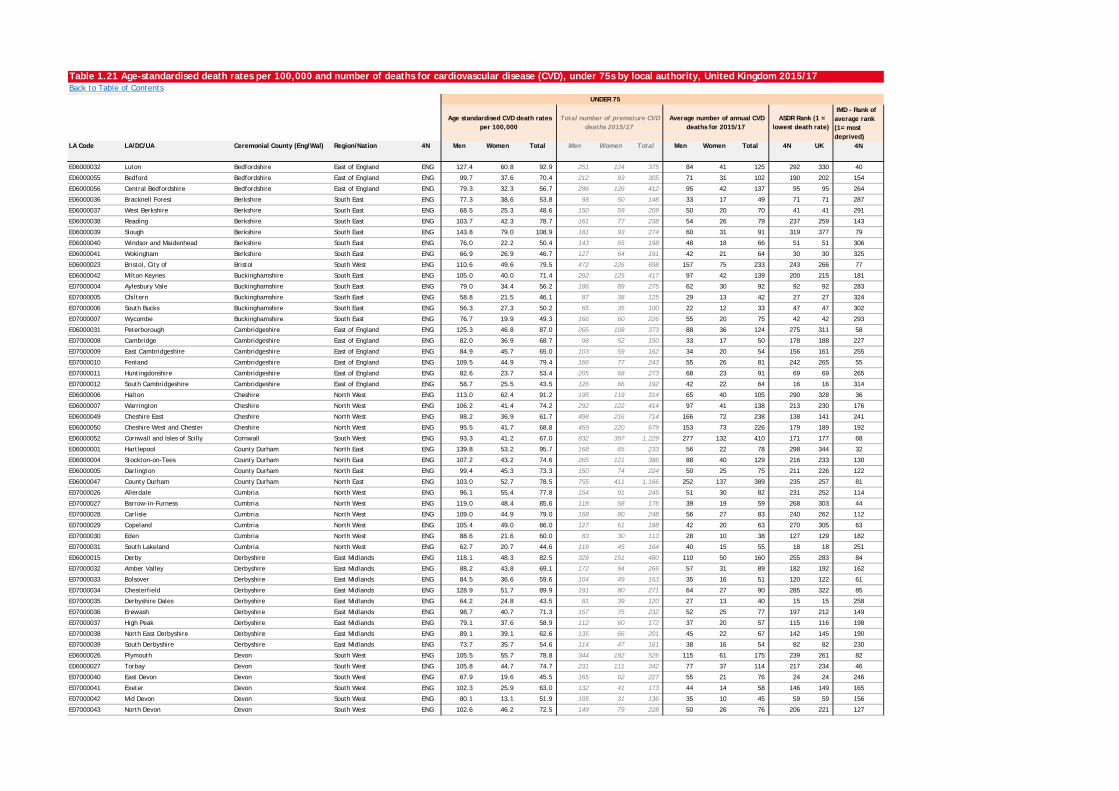
Table 1.21 Age-standardised death rates per 100,000 and number of deaths for cardiovascular disease (CVD), under 75s by local authority, United Kingdom 2015/17Back to Table of Contents
IMD - Rank of average rank (1= most deprived)
LA Code LA/DC/UA Ceremonial County (Eng/Wal) Region/Nation 4N Men Women Total Men Women Total Men Women Total 4N UK 4N
E06000032 Luton Bedfordshire East of England ENG 127.4 60.8 92.9 251 124 375 84 41 125 292 330 40
E06000055 Bedford Bedfordshire East of England ENG 99.7 37.6 70.4 212 93 305 71 31 102 190 202 154
E06000056 Central Bedfordshire Bedfordshire East of England ENG 79.3 32.3 56.7 286 126 412 95 42 137 95 95 264
E06000036 Bracknell Forest Berkshire South East ENG 77.3 38.6 53.8 98 50 148 33 17 49 71 71 287
E06000037 West Berkshire Berkshire South East ENG 68.5 25.3 48.6 150 59 209 50 20 70 41 41 291
E06000038 Reading Berkshire South East ENG 103.7 42.3 78.7 161 77 238 54 26 79 237 259 143
E06000039 Slough Berkshire South East ENG 143.8 79.0 108.9 181 93 274 60 31 91 319 377 79
E06000040 Windsor and Maidenhead Berkshire South East ENG 76.0 22.2 50.4 143 55 198 48 18 66 51 51 306
E06000041 Wokingham Berkshire South East ENG 66.9 26.9 46.7 127 64 191 42 21 64 30 30 325
E06000023 Bristol, City of Bristol South West ENG 110.6 49.6 79.5 472 226 698 157 75 233 243 266 77
E06000042 Milton Keynes Buckinghamshire South East ENG 105.0 40.0 71.4 292 125 417 97 42 139 200 215 181
E07000004 Aylesbury Vale Buckinghamshire South East ENG 79.0 34.4 56.2 186 89 275 62 30 92 92 92 283
E07000005 Chiltern Buckinghamshire South East ENG 58.8 21.5 46.1 87 38 125 29 13 42 27 27 324
E07000006 South Bucks Buckinghamshire South East ENG 56.3 27.3 50.2 65 35 100 22 12 33 47 47 302
E07000007 Wycombe Buckinghamshire South East ENG 76.7 19.9 49.3 166 60 226 55 20 75 42 42 293
E06000031 Peterborough Cambridgeshire East of England ENG 125.3 46.8 87.0 265 108 373 88 36 124 275 311 58
E07000008 Cambridge Cambridgeshire East of England ENG 82.0 36.9 68.7 98 52 150 33 17 50 178 188 227
E07000009 East Cambridgeshire Cambridgeshire East of England ENG 84.9 45.7 65.0 103 59 162 34 20 54 156 161 255
E07000010 Fenland Cambridgeshire East of England ENG 109.5 44.9 79.4 166 77 243 55 26 81 242 265 55
E07000011 Huntingdonshire Cambridgeshire East of England ENG 82.6 23.7 53.4 205 68 273 68 23 91 69 69 265
E07000012 South Cambridgeshire Cambridgeshire East of England ENG 58.7 25.5 43.5 126 66 192 42 22 64 16 16 314
E06000006 Halton Cheshire North West ENG 113.0 62.4 91.2 195 119 314 65 40 105 290 328 36
E06000007 Warrington Cheshire North West ENG 106.2 41.4 74.2 292 122 414 97 41 138 213 230 176
E06000049 Cheshire East Cheshire North West ENG 88.2 36.9 61.7 498 216 714 166 72 238 138 141 241
E06000050 Cheshire West and Chester Cheshire North West ENG 95.5 41.7 68.8 459 220 679 153 73 226 179 189 192
E06000052 Cornwall and Isles of Scilly Cornwall South West ENG 93.3 41.2 67.0 832 397 1,229 277 132 410 171 177 68
E06000001 Hartlepool County Durham North East ENG 139.8 53.2 95.7 168 65 233 56 22 78 298 344 32
E06000004 Stockton-on-Tees County Durham North East ENG 107.2 43.2 74.6 265 121 386 88 40 129 216 233 130
E06000005 Darlington County Durham North East ENG 99.4 45.3 73.3 150 74 224 50 25 75 211 226 122
E06000047 County Durham County Durham North East ENG 103.0 52.7 78.5 755 411 1,166 252 137 389 235 257 81
E07000026 Allerdale Cumbria North West ENG 96.1 55.4 77.8 154 91 245 51 30 82 231 252 114
E07000027 Barrow-in-Furness Cumbria North West ENG 119.0 48.4 85.6 118 58 176 39 19 59 268 303 44
E07000028 Carlisle Cumbria North West ENG 109.0 44.9 79.0 168 80 248 56 27 83 240 262 112
E07000029 Copeland Cumbria North West ENG 105.4 49.0 86.0 127 61 188 42 20 63 270 305 63
E07000030 Eden Cumbria North West ENG 88.6 21.6 60.0 83 30 113 28 10 38 127 129 182
E07000031 South Lakeland Cumbria North West ENG 62.7 20.7 44.6 119 45 164 40 15 55 18 18 251
E06000015 Derby Derbyshire East Midlands ENG 118.1 48.3 82.5 329 151 480 110 50 160 255 283 84
E07000032 Amber Valley Derbyshire East Midlands ENG 88.2 43.8 69.1 172 94 266 57 31 89 182 192 162
E07000033 Bolsover Derbyshire East Midlands ENG 84.5 36.6 59.6 104 49 153 35 16 51 120 122 61
E07000034 Chesterfield Derbyshire East Midlands ENG 128.9 51.7 89.9 191 80 271 64 27 90 285 322 85
E07000035 Derbyshire Dales Derbyshire East Midlands ENG 64.2 24.8 43.5 81 39 120 27 13 40 15 15 258
E07000036 Erewash Derbyshire East Midlands ENG 98.7 40.7 71.3 157 75 232 52 25 77 197 212 149
E07000037 High Peak Derbyshire East Midlands ENG 79.1 37.6 58.9 112 60 172 37 20 57 115 116 198
E07000038 North East Derbyshire Derbyshire East Midlands ENG 89.1 39.1 62.6 135 66 201 45 22 67 142 145 190
E07000039 South Derbyshire Derbyshire East Midlands ENG 73.7 35.7 54.6 114 47 161 38 16 54 82 82 230
E06000026 Plymouth Devon South West ENG 105.5 55.7 78.8 344 182 526 115 61 175 239 261 82
E06000027 Torbay Devon South West ENG 105.8 44.7 74.7 231 111 342 77 37 114 217 234 46
E07000040 East Devon Devon South West ENG 67.9 19.6 45.5 165 62 227 55 21 76 24 24 246
E07000041 Exeter Devon South West ENG 102.3 25.9 63.0 132 41 173 44 14 58 146 149 165
E07000042 Mid Devon Devon South West ENG 80.1 13.1 51.9 105 31 136 35 10 45 59 59 156
E07000043 North Devon Devon South West ENG 102.6 46.2 72.5 149 79 228 50 26 76 206 221 127
UNDER 75
Age standardised CVD death rates per 100,000
Total number of premature CVD deaths 2015/17
Average number of annual CVD deaths for 2015/17
ASDR Rank (1 = lowest death rate)
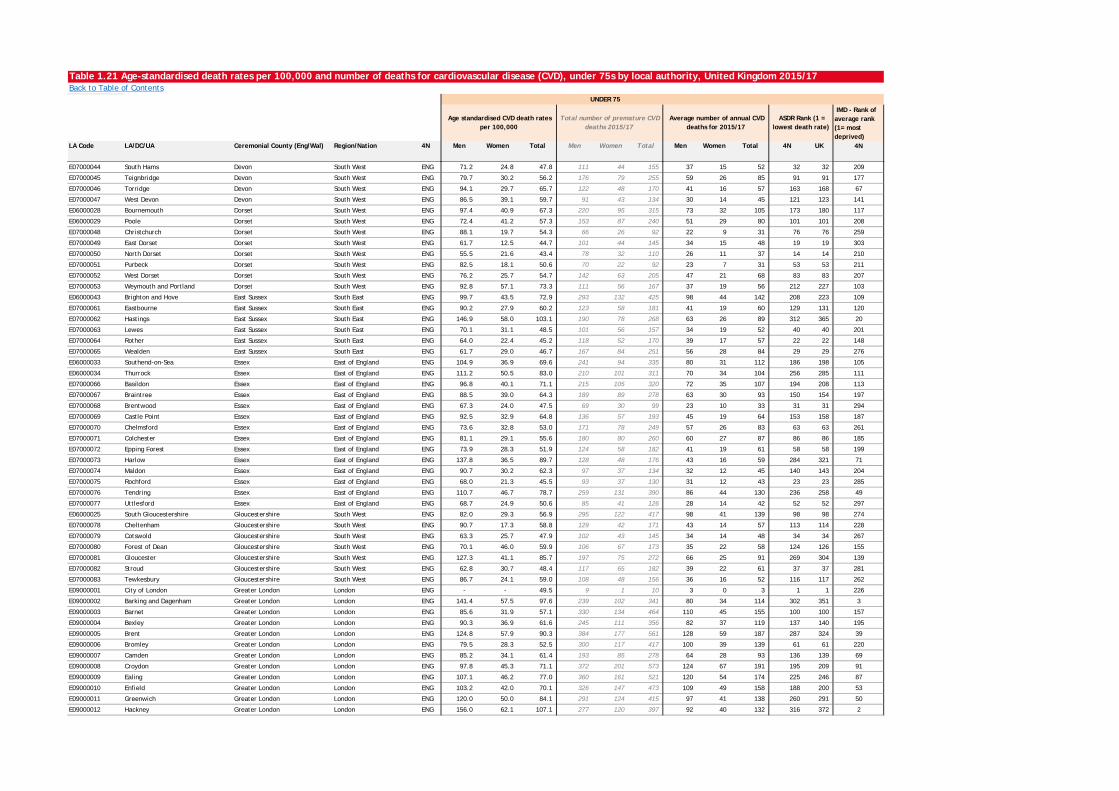
Table 1.21 Age-standardised death rates per 100,000 and number of deaths for cardiovascular disease (CVD), under 75s by local authority, United Kingdom 2015/17Back to Table of Contents
IMD - Rank of average rank (1= most deprived)
LA Code LA/DC/UA Ceremonial County (Eng/Wal) Region/Nation 4N Men Women Total Men Women Total Men Women Total 4N UK 4N
UNDER 75
Age standardised CVD death rates per 100,000
Total number of premature CVD deaths 2015/17
Average number of annual CVD deaths for 2015/17
ASDR Rank (1 = lowest death rate)
E07000044 South Hams Devon South West ENG 71.2 24.8 47.8 111 44 155 37 15 52 32 32 209
E07000045 Teignbridge Devon South West ENG 79.7 30.2 56.2 176 79 255 59 26 85 91 91 177
E07000046 Torridge Devon South West ENG 94.1 29.7 65.7 122 48 170 41 16 57 163 168 67
E07000047 West Devon Devon South West ENG 86.5 39.1 59.7 91 43 134 30 14 45 121 123 141
E06000028 Bournemouth Dorset South West ENG 97.4 40.9 67.3 220 95 315 73 32 105 173 180 117
E06000029 Poole Dorset South West ENG 72.4 41.2 57.3 153 87 240 51 29 80 101 101 208
E07000048 Christchurch Dorset South West ENG 88.1 19.7 54.3 66 26 92 22 9 31 76 76 259
E07000049 East Dorset Dorset South West ENG 61.7 12.5 44.7 101 44 145 34 15 48 19 19 303
E07000050 North Dorset Dorset South West ENG 55.5 21.6 43.4 78 32 110 26 11 37 14 14 210
E07000051 Purbeck Dorset South West ENG 82.5 18.1 50.6 70 22 92 23 7 31 53 53 211
E07000052 West Dorset Dorset South West ENG 76.2 25.7 54.7 142 63 205 47 21 68 83 83 207
E07000053 Weymouth and Portland Dorset South West ENG 92.8 57.1 73.3 111 56 167 37 19 56 212 227 103
E06000043 Brighton and Hove East Sussex South East ENG 99.7 43.5 72.9 293 132 425 98 44 142 208 223 109
E07000061 Eastbourne East Sussex South East ENG 90.2 27.9 60.2 123 58 181 41 19 60 129 131 120
E07000062 Hastings East Sussex South East ENG 146.9 58.0 103.1 190 78 268 63 26 89 312 365 20
E07000063 Lewes East Sussex South East ENG 70.1 31.1 48.5 101 56 157 34 19 52 40 40 201
E07000064 Rother East Sussex South East ENG 64.0 22.4 45.2 118 52 170 39 17 57 22 22 148
E07000065 Wealden East Sussex South East ENG 61.7 29.0 46.7 167 84 251 56 28 84 29 29 276
E06000033 Southend-on-Sea Essex East of England ENG 104.9 36.9 69.6 241 94 335 80 31 112 186 198 105
E06000034 Thurrock Essex East of England ENG 111.2 50.5 83.0 210 101 311 70 34 104 256 285 111
E07000066 Basildon Essex East of England ENG 96.8 40.1 71.1 215 105 320 72 35 107 194 208 113
E07000067 Braintree Essex East of England ENG 88.5 39.0 64.3 189 89 278 63 30 93 150 154 197
E07000068 Brentwood Essex East of England ENG 67.3 24.0 47.5 69 30 99 23 10 33 31 31 294
E07000069 Castle Point Essex East of England ENG 92.5 32.9 64.8 136 57 193 45 19 64 153 158 187
E07000070 Chelmsford Essex East of England ENG 73.6 32.8 53.0 171 78 249 57 26 83 63 63 261
E07000071 Colchester Essex East of England ENG 81.1 29.1 55.6 180 80 260 60 27 87 86 86 185
E07000072 Epping Forest Essex East of England ENG 73.9 28.3 51.9 124 58 182 41 19 61 58 58 199
E07000073 Harlow Essex East of England ENG 137.8 36.5 89.7 128 48 176 43 16 59 284 321 71
E07000074 Maldon Essex East of England ENG 90.7 30.2 62.3 97 37 134 32 12 45 140 143 204
E07000075 Rochford Essex East of England ENG 68.0 21.3 45.5 93 37 130 31 12 43 23 23 285
E07000076 Tendring Essex East of England ENG 110.7 46.7 78.7 259 131 390 86 44 130 236 258 49
E07000077 Uttlesford Essex East of England ENG 68.7 24.9 50.6 85 41 126 28 14 42 52 52 297
E06000025 South Gloucestershire Gloucestershire South West ENG 82.0 29.3 56.9 295 122 417 98 41 139 98 98 274
E07000078 Cheltenham Gloucestershire South West ENG 90.7 17.3 58.8 129 42 171 43 14 57 113 114 228
E07000079 Cotswold Gloucestershire South West ENG 63.3 25.7 47.9 102 43 145 34 14 48 34 34 267
E07000080 Forest of Dean Gloucestershire South West ENG 70.1 46.0 59.9 106 67 173 35 22 58 124 126 155
E07000081 Gloucester Gloucestershire South West ENG 127.3 41.1 85.7 197 75 272 66 25 91 269 304 139
E07000082 Stroud Gloucestershire South West ENG 62.8 30.7 48.4 117 65 182 39 22 61 37 37 281
E07000083 Tewkesbury Gloucestershire South West ENG 86.7 24.1 59.0 108 48 156 36 16 52 116 117 262
E09000001 City of London Greater London London ENG - - 49.5 9 1 10 3 0 3 1 1 226
E09000002 Barking and Dagenham Greater London London ENG 141.4 57.5 97.6 239 102 341 80 34 114 302 351 3
E09000003 Barnet Greater London London ENG 85.6 31.9 57.1 330 134 464 110 45 155 100 100 157
E09000004 Bexley Greater London London ENG 90.3 36.9 61.6 245 111 356 82 37 119 137 140 195
E09000005 Brent Greater London London ENG 124.8 57.9 90.3 384 177 561 128 59 187 287 324 39
E09000006 Bromley Greater London London ENG 79.5 28.3 52.5 300 117 417 100 39 139 61 61 220
E09000007 Camden Greater London London ENG 85.2 34.1 61.4 193 85 278 64 28 93 136 139 69
E09000008 Croydon Greater London London ENG 97.8 45.3 71.1 372 201 573 124 67 191 195 209 91
E09000009 Ealing Greater London London ENG 107.1 46.2 77.0 360 161 521 120 54 174 225 246 87
E09000010 Enfield Greater London London ENG 103.2 42.0 70.1 326 147 473 109 49 158 188 200 53
E09000011 Greenwich Greater London London ENG 120.0 50.0 84.1 291 124 415 97 41 138 260 291 50
E09000012 Hackney Greater London London ENG 156.0 62.1 107.1 277 120 397 92 40 132 316 372 2
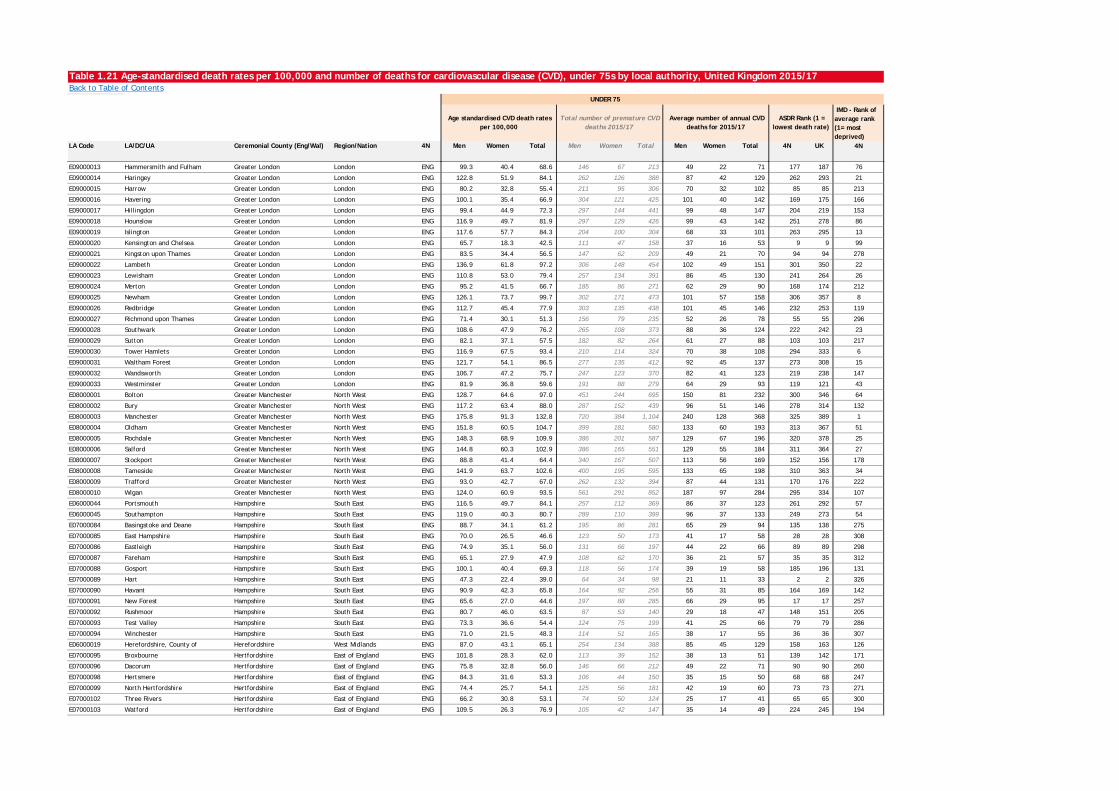
Table 1.21 Age-standardised death rates per 100,000 and number of deaths for cardiovascular disease (CVD), under 75s by local authority, United Kingdom 2015/17Back to Table of Contents
IMD - Rank of average rank (1= most deprived)
LA Code LA/DC/UA Ceremonial County (Eng/Wal) Region/Nation 4N Men Women Total Men Women Total Men Women Total 4N UK 4N
UNDER 75
Age standardised CVD death rates per 100,000
Total number of premature CVD deaths 2015/17
Average number of annual CVD deaths for 2015/17
ASDR Rank (1 = lowest death rate)
E09000013 Hammersmith and Fulham Greater London London ENG 99.3 40.4 68.6 146 67 213 49 22 71 177 187 76
E09000014 Haringey Greater London London ENG 122.8 51.9 84.1 262 126 388 87 42 129 262 293 21
E09000015 Harrow Greater London London ENG 80.2 32.8 55.4 211 95 306 70 32 102 85 85 213
E09000016 Havering Greater London London ENG 100.1 35.4 66.9 304 121 425 101 40 142 169 175 166
E09000017 Hillingdon Greater London London ENG 99.4 44.9 72.3 297 144 441 99 48 147 204 219 153
E09000018 Hounslow Greater London London ENG 116.9 49.7 81.9 297 129 426 99 43 142 251 278 86
E09000019 Islington Greater London London ENG 117.6 57.7 84.3 204 100 304 68 33 101 263 295 13
E09000020 Kensington and Chelsea Greater London London ENG 65.7 18.3 42.5 111 47 158 37 16 53 9 9 99
E09000021 Kingston upon Thames Greater London London ENG 83.5 34.4 56.5 147 62 209 49 21 70 94 94 278
E09000022 Lambeth Greater London London ENG 136.9 61.8 97.2 306 148 454 102 49 151 301 350 22
E09000023 Lewisham Greater London London ENG 110.8 53.0 79.4 257 134 391 86 45 130 241 264 26
E09000024 Merton Greater London London ENG 95.2 41.5 66.7 185 86 271 62 29 90 168 174 212
E09000025 Newham Greater London London ENG 126.1 73.7 99.7 302 171 473 101 57 158 306 357 8
E09000026 Redbridge Greater London London ENG 112.7 45.4 77.9 303 135 438 101 45 146 232 253 119
E09000027 Richmond upon Thames Greater London London ENG 71.4 30.1 51.3 156 79 235 52 26 78 55 55 296
E09000028 Southwark Greater London London ENG 108.6 47.9 76.2 265 108 373 88 36 124 222 242 23
E09000029 Sutton Greater London London ENG 82.1 37.1 57.5 182 82 264 61 27 88 103 103 217
E09000030 Tower Hamlets Greater London London ENG 116.9 67.5 93.4 210 114 324 70 38 108 294 333 6
E09000031 Waltham Forest Greater London London ENG 121.7 54.1 86.5 277 135 412 92 45 137 273 308 15
E09000032 Wandsworth Greater London London ENG 106.7 47.2 75.7 247 123 370 82 41 123 219 238 147
E09000033 Westminster Greater London London ENG 81.9 36.8 59.6 191 88 279 64 29 93 119 121 43
E08000001 Bolton Greater Manchester North West ENG 128.7 64.6 97.0 451 244 695 150 81 232 300 346 64
E08000002 Bury Greater Manchester North West ENG 117.2 63.4 88.0 287 152 439 96 51 146 278 314 132
E08000003 Manchester Greater Manchester North West ENG 175.8 91.3 132.8 720 384 1,104 240 128 368 325 389 1
E08000004 Oldham Greater Manchester North West ENG 151.8 60.5 104.7 399 181 580 133 60 193 313 367 51
E08000005 Rochdale Greater Manchester North West ENG 148.3 68.9 109.9 386 201 587 129 67 196 320 378 25
E08000006 Salford Greater Manchester North West ENG 144.8 60.3 102.9 386 165 551 129 55 184 311 364 27
E08000007 Stockport Greater Manchester North West ENG 88.8 41.4 64.4 340 167 507 113 56 169 152 156 178
E08000008 Tameside Greater Manchester North West ENG 141.9 63.7 102.6 400 195 595 133 65 198 310 363 34
E08000009 Trafford Greater Manchester North West ENG 93.0 42.7 67.0 262 132 394 87 44 131 170 176 222
E08000010 Wigan Greater Manchester North West ENG 124.0 60.9 93.5 561 291 852 187 97 284 295 334 107
E06000044 Portsmouth Hampshire South East ENG 116.5 49.7 84.1 257 112 369 86 37 123 261 292 57
E06000045 Southampton Hampshire South East ENG 119.0 40.3 80.7 289 110 399 96 37 133 249 273 54
E07000084 Basingstoke and Deane Hampshire South East ENG 88.7 34.1 61.2 195 86 281 65 29 94 135 138 275
E07000085 East Hampshire Hampshire South East ENG 70.0 26.5 46.6 123 50 173 41 17 58 28 28 308
E07000086 Eastleigh Hampshire South East ENG 74.9 35.1 56.0 131 66 197 44 22 66 89 89 298
E07000087 Fareham Hampshire South East ENG 65.1 27.9 47.9 108 62 170 36 21 57 35 35 312
E07000088 Gosport Hampshire South East ENG 100.1 40.4 69.3 118 56 174 39 19 58 185 196 131
E07000089 Hart Hampshire South East ENG 47.3 22.4 39.0 64 34 98 21 11 33 2 2 326
E07000090 Havant Hampshire South East ENG 90.9 42.3 65.8 164 92 256 55 31 85 164 169 142
E07000091 New Forest Hampshire South East ENG 65.6 27.0 44.6 197 88 285 66 29 95 17 17 257
E07000092 Rushmoor Hampshire South East ENG 80.7 46.0 63.5 87 53 140 29 18 47 148 151 205
E07000093 Test Valley Hampshire South East ENG 73.3 36.6 54.4 124 75 199 41 25 66 79 79 286
E07000094 Winchester Hampshire South East ENG 71.0 21.5 48.3 114 51 165 38 17 55 36 36 307
E06000019 Herefordshire, County of Herefordshire West Midlands ENG 87.0 43.1 65.1 254 134 388 85 45 129 158 163 126
E07000095 Broxbourne Hertfordshire East of England ENG 101.8 28.3 62.0 113 39 152 38 13 51 139 142 171
E07000096 Dacorum Hertfordshire East of England ENG 75.8 32.8 56.0 146 66 212 49 22 71 90 90 260
E07000098 Hertsmere Hertfordshire East of England ENG 84.3 31.6 53.3 106 44 150 35 15 50 68 68 247
E07000099 North Hertfordshire Hertfordshire East of England ENG 74.4 25.7 54.1 125 56 181 42 19 60 73 73 271
E07000102 Three Rivers Hertfordshire East of England ENG 66.2 30.8 53.1 74 50 124 25 17 41 65 65 300
E07000103 Watford Hertfordshire East of England ENG 109.5 26.3 76.9 105 42 147 35 14 49 224 245 194
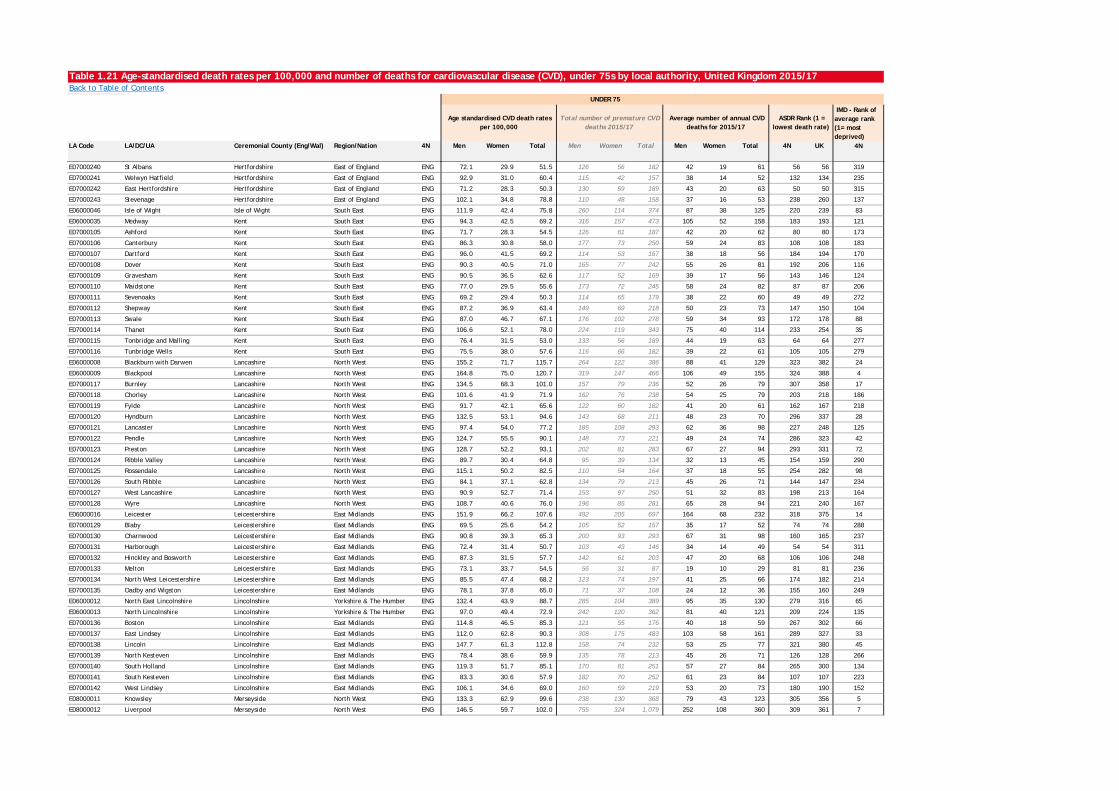
Table 1.21 Age-standardised death rates per 100,000 and number of deaths for cardiovascular disease (CVD), under 75s by local authority, United Kingdom 2015/17Back to Table of Contents
IMD - Rank of average rank (1= most deprived)
LA Code LA/DC/UA Ceremonial County (Eng/Wal) Region/Nation 4N Men Women Total Men Women Total Men Women Total 4N UK 4N
UNDER 75
Age standardised CVD death rates per 100,000
Total number of premature CVD deaths 2015/17
Average number of annual CVD deaths for 2015/17
ASDR Rank (1 = lowest death rate)
E07000240 St Albans Hertfordshire East of England ENG 72.1 29.9 51.5 126 56 182 42 19 61 56 56 319
E07000241 Welwyn Hatfield Hertfordshire East of England ENG 92.9 31.0 60.4 115 42 157 38 14 52 132 134 235
E07000242 East Hertfordshire Hertfordshire East of England ENG 71.2 28.3 50.3 130 59 189 43 20 63 50 50 315
E07000243 Stevenage Hertfordshire East of England ENG 102.1 34.8 78.8 110 48 158 37 16 53 238 260 137
E06000046 Isle of Wight Isle of Wight South East ENG 111.9 42.4 75.8 260 114 374 87 38 125 220 239 83
E06000035 Medway Kent South East ENG 94.3 42.5 69.2 316 157 473 105 52 158 183 193 121
E07000105 Ashford Kent South East ENG 71.7 28.3 54.5 126 61 187 42 20 62 80 80 173
E07000106 Canterbury Kent South East ENG 86.3 30.8 58.0 177 73 250 59 24 83 108 108 183
E07000107 Dartford Kent South East ENG 96.0 41.5 69.2 114 53 167 38 18 56 184 194 170
E07000108 Dover Kent South East ENG 90.3 40.5 71.0 165 77 242 55 26 81 192 206 116
E07000109 Gravesham Kent South East ENG 90.5 36.5 62.6 117 52 169 39 17 56 143 146 124
E07000110 Maidstone Kent South East ENG 77.0 29.5 55.6 173 72 245 58 24 82 87 87 206
E07000111 Sevenoaks Kent South East ENG 69.2 29.4 50.3 114 65 179 38 22 60 49 49 272
E07000112 Shepway Kent South East ENG 87.2 36.9 63.4 149 69 218 50 23 73 147 150 104
E07000113 Swale Kent South East ENG 87.0 46.7 67.1 176 102 278 59 34 93 172 178 88
E07000114 Thanet Kent South East ENG 106.6 52.1 78.0 224 119 343 75 40 114 233 254 35
E07000115 Tonbridge and Malling Kent South East ENG 76.4 31.5 53.0 133 56 189 44 19 63 64 64 277
E07000116 Tunbridge Wells Kent South East ENG 75.5 38.0 57.6 116 66 182 39 22 61 105 105 279
E06000008 Blackburn with Darwen Lancashire North West ENG 155.2 71.7 115.7 264 122 386 88 41 129 323 382 24
E06000009 Blackpool Lancashire North West ENG 164.8 75.0 120.7 319 147 466 106 49 155 324 388 4
E07000117 Burnley Lancashire North West ENG 134.5 68.3 101.0 157 79 236 52 26 79 307 358 17
E07000118 Chorley Lancashire North West ENG 101.6 41.9 71.9 162 76 238 54 25 79 203 218 186
E07000119 Fylde Lancashire North West ENG 91.7 42.1 65.6 122 60 182 41 20 61 162 167 218
E07000120 Hyndburn Lancashire North West ENG 132.5 53.1 94.6 143 68 211 48 23 70 296 337 28
E07000121 Lancaster Lancashire North West ENG 97.4 54.0 77.2 185 108 293 62 36 98 227 248 125
E07000122 Pendle Lancashire North West ENG 124.7 55.5 90.1 148 73 221 49 24 74 286 323 42
E07000123 Preston Lancashire North West ENG 128.7 52.2 93.1 202 81 283 67 27 94 293 331 72
E07000124 Ribble Valley Lancashire North West ENG 89.7 30.4 64.8 95 39 134 32 13 45 154 159 290
E07000125 Rossendale Lancashire North West ENG 115.1 50.2 82.5 110 54 164 37 18 55 254 282 98
E07000126 South Ribble Lancashire North West ENG 84.1 37.1 62.8 134 79 213 45 26 71 144 147 234
E07000127 West Lancashire Lancashire North West ENG 90.9 52.7 71.4 153 97 250 51 32 83 198 213 164
E07000128 Wyre Lancashire North West ENG 108.7 40.6 76.0 196 85 281 65 28 94 221 240 167
E06000016 Leicester Leicestershire East Midlands ENG 151.9 66.2 107.6 492 205 697 164 68 232 318 375 14
E07000129 Blaby Leicestershire East Midlands ENG 69.5 25.6 54.2 105 52 157 35 17 52 74 74 288
E07000130 Charnwood Leicestershire East Midlands ENG 90.8 39.3 65.3 200 93 293 67 31 98 160 165 237
E07000131 Harborough Leicestershire East Midlands ENG 72.4 31.4 50.7 103 43 146 34 14 49 54 54 311
E07000132 Hinckley and Bosworth Leicestershire East Midlands ENG 87.3 31.5 57.7 142 61 203 47 20 68 106 106 248
E07000133 Melton Leicestershire East Midlands ENG 73.1 33.7 54.5 56 31 87 19 10 29 81 81 236
E07000134 North West Leicestershire Leicestershire East Midlands ENG 85.5 47.4 68.2 123 74 197 41 25 66 174 182 214
E07000135 Oadby and Wigston Leicestershire East Midlands ENG 78.1 37.8 65.0 71 37 108 24 12 36 155 160 249
E06000012 North East Lincolnshire Lincolnshire Yorkshire & The Humber ENG 132.4 43.9 88.7 285 104 389 95 35 130 279 316 65
E06000013 North Lincolnshire Lincolnshire Yorkshire & The Humber ENG 97.0 49.4 72.9 242 120 362 81 40 121 209 224 135
E07000136 Boston Lincolnshire East Midlands ENG 114.8 46.5 85.3 121 55 176 40 18 59 267 302 66
E07000137 East Lindsey Lincolnshire East Midlands ENG 112.0 62.8 90.3 308 175 483 103 58 161 289 327 33
E07000138 Lincoln Lincolnshire East Midlands ENG 147.7 61.3 112.8 158 74 232 53 25 77 321 380 45
E07000139 North Kesteven Lincolnshire East Midlands ENG 78.4 38.6 59.9 135 78 213 45 26 71 126 128 266
E07000140 South Holland Lincolnshire East Midlands ENG 119.3 51.7 85.1 170 81 251 57 27 84 265 300 134
E07000141 South Kesteven Lincolnshire East Midlands ENG 83.3 30.6 57.9 182 70 252 61 23 84 107 107 223
E07000142 West Lindsey Lincolnshire East Midlands ENG 106.1 34.6 69.0 160 59 219 53 20 73 180 190 152
E08000011 Knowsley Merseyside North West ENG 133.3 62.9 99.6 238 130 368 79 43 123 305 356 5
E08000012 Liverpool Merseyside North West ENG 146.5 59.7 102.0 755 324 1,079 252 108 360 309 361 7
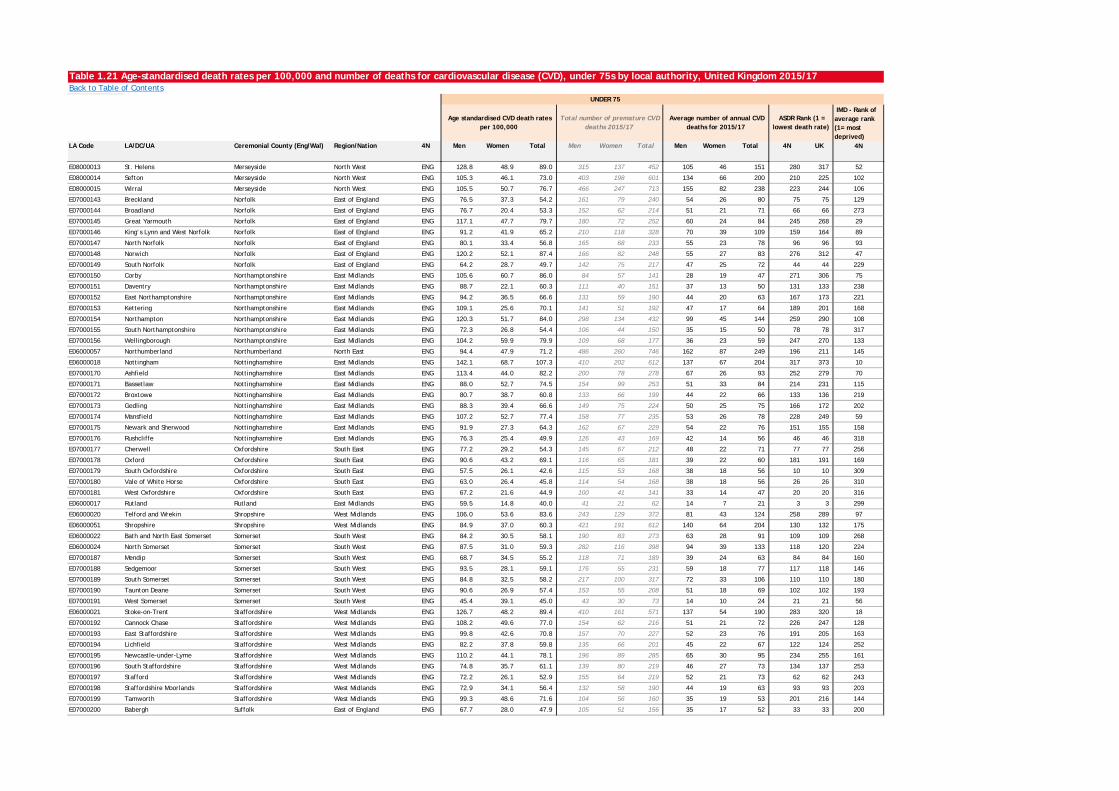
Table 1.21 Age-standardised death rates per 100,000 and number of deaths for cardiovascular disease (CVD), under 75s by local authority, United Kingdom 2015/17Back to Table of Contents
IMD - Rank of average rank (1= most deprived)
LA Code LA/DC/UA Ceremonial County (Eng/Wal) Region/Nation 4N Men Women Total Men Women Total Men Women Total 4N UK 4N
UNDER 75
Age standardised CVD death rates per 100,000
Total number of premature CVD deaths 2015/17
Average number of annual CVD deaths for 2015/17
ASDR Rank (1 = lowest death rate)
E08000013 St. Helens Merseyside North West ENG 128.8 48.9 89.0 315 137 452 105 46 151 280 317 52
E08000014 Sefton Merseyside North West ENG 105.3 46.1 73.0 403 198 601 134 66 200 210 225 102
E08000015 Wirral Merseyside North West ENG 105.5 50.7 76.7 466 247 713 155 82 238 223 244 106
E07000143 Breckland Norfolk East of England ENG 76.5 37.3 54.2 161 79 240 54 26 80 75 75 129
E07000144 Broadland Norfolk East of England ENG 76.7 20.4 53.3 152 62 214 51 21 71 66 66 273
E07000145 Great Yarmouth Norfolk East of England ENG 117.1 47.7 79.7 180 72 252 60 24 84 245 268 29
E07000146 King’s Lynn and West Norfolk Norfolk East of England ENG 91.2 41.9 65.2 210 118 328 70 39 109 159 164 89
E07000147 North Norfolk Norfolk East of England ENG 80.1 33.4 56.8 165 68 233 55 23 78 96 96 93
E07000148 Norwich Norfolk East of England ENG 120.2 52.1 87.4 166 82 248 55 27 83 276 312 47
E07000149 South Norfolk Norfolk East of England ENG 64.2 28.7 49.7 142 75 217 47 25 72 44 44 229
E07000150 Corby Northamptonshire East Midlands ENG 105.6 60.7 86.0 84 57 141 28 19 47 271 306 75
E07000151 Daventry Northamptonshire East Midlands ENG 88.7 22.1 60.3 111 40 151 37 13 50 131 133 238
E07000152 East Northamptonshire Northamptonshire East Midlands ENG 94.2 36.5 66.6 131 59 190 44 20 63 167 173 221
E07000153 Kettering Northamptonshire East Midlands ENG 109.1 25.6 70.1 141 51 192 47 17 64 189 201 168
E07000154 Northampton Northamptonshire East Midlands ENG 120.3 51.7 84.0 298 134 432 99 45 144 259 290 108
E07000155 South Northamptonshire Northamptonshire East Midlands ENG 72.3 26.8 54.4 106 44 150 35 15 50 78 78 317
E07000156 Wellingborough Northamptonshire East Midlands ENG 104.2 59.9 79.9 109 68 177 36 23 59 247 270 133
E06000057 Northumberland Northumberland North East ENG 94.4 47.9 71.2 486 260 746 162 87 249 196 211 145
E06000018 Nottingham Nottinghamshire East Midlands ENG 142.1 68.7 107.3 410 202 612 137 67 204 317 373 10
E07000170 Ashfield Nottinghamshire East Midlands ENG 113.4 44.0 82.2 200 78 278 67 26 93 252 279 70
E07000171 Bassetlaw Nottinghamshire East Midlands ENG 88.0 52.7 74.5 154 99 253 51 33 84 214 231 115
E07000172 Broxtowe Nottinghamshire East Midlands ENG 80.7 38.7 60.8 133 66 199 44 22 66 133 136 219
E07000173 Gedling Nottinghamshire East Midlands ENG 88.3 39.4 66.6 149 75 224 50 25 75 166 172 202
E07000174 Mansfield Nottinghamshire East Midlands ENG 107.2 52.7 77.4 158 77 235 53 26 78 228 249 59
E07000175 Newark and Sherwood Nottinghamshire East Midlands ENG 91.9 27.3 64.3 162 67 229 54 22 76 151 155 158
E07000176 Rushcliffe Nottinghamshire East Midlands ENG 76.3 25.4 49.9 126 43 169 42 14 56 46 46 318
E07000177 Cherwell Oxfordshire South East ENG 77.2 29.2 54.3 145 67 212 48 22 71 77 77 256
E07000178 Oxford Oxfordshire South East ENG 90.6 43.2 69.1 116 65 181 39 22 60 181 191 169
E07000179 South Oxfordshire Oxfordshire South East ENG 57.5 26.1 42.6 115 53 168 38 18 56 10 10 309
E07000180 Vale of White Horse Oxfordshire South East ENG 63.0 26.4 45.8 114 54 168 38 18 56 26 26 310
E07000181 West Oxfordshire Oxfordshire South East ENG 67.2 21.6 44.9 100 41 141 33 14 47 20 20 316
E06000017 Rutland Rutland East Midlands ENG 59.5 14.8 40.0 41 21 62 14 7 21 3 3 299
E06000020 Telford and Wrekin Shropshire West Midlands ENG 106.0 53.6 83.6 243 129 372 81 43 124 258 289 97
E06000051 Shropshire Shropshire West Midlands ENG 84.9 37.0 60.3 421 191 612 140 64 204 130 132 175
E06000022 Bath and North East Somerset Somerset South West ENG 84.2 30.5 58.1 190 83 273 63 28 91 109 109 268
E06000024 North Somerset Somerset South West ENG 87.5 31.0 59.3 282 116 398 94 39 133 118 120 224
E07000187 Mendip Somerset South West ENG 68.7 34.5 55.2 118 71 189 39 24 63 84 84 160
E07000188 Sedgemoor Somerset South West ENG 93.5 28.1 59.1 176 55 231 59 18 77 117 118 146
E07000189 South Somerset Somerset South West ENG 84.8 32.5 58.2 217 100 317 72 33 106 110 110 180
E07000190 Taunton Deane Somerset South West ENG 90.6 26.9 57.4 153 55 208 51 18 69 102 102 193
E07000191 West Somerset Somerset South West ENG 45.4 39.1 45.0 43 30 73 14 10 24 21 21 56
E06000021 Stoke-on-Trent Staffordshire West Midlands ENG 126.7 48.2 89.4 410 161 571 137 54 190 283 320 18
E07000192 Cannock Chase Staffordshire West Midlands ENG 108.2 49.6 77.0 154 62 216 51 21 72 226 247 128
E07000193 East Staffordshire Staffordshire West Midlands ENG 99.8 42.6 70.8 157 70 227 52 23 76 191 205 163
E07000194 Lichfield Staffordshire West Midlands ENG 82.2 37.8 59.8 135 66 201 45 22 67 122 124 252
E07000195 Newcastle-under-Lyme Staffordshire West Midlands ENG 110.2 44.1 78.1 196 89 285 65 30 95 234 255 161
E07000196 South Staffordshire Staffordshire West Midlands ENG 74.8 35.7 61.1 139 80 219 46 27 73 134 137 253
E07000197 Stafford Staffordshire West Midlands ENG 72.2 26.1 52.9 155 64 219 52 21 73 62 62 243
E07000198 Staffordshire Moorlands Staffordshire West Midlands ENG 72.9 34.1 56.4 132 58 190 44 19 63 93 93 203
E07000199 Tamworth Staffordshire West Midlands ENG 99.3 48.6 71.6 104 56 160 35 19 53 201 216 144
E07000200 Babergh Suffolk East of England ENG 67.7 28.0 47.9 105 51 156 35 17 52 33 33 200
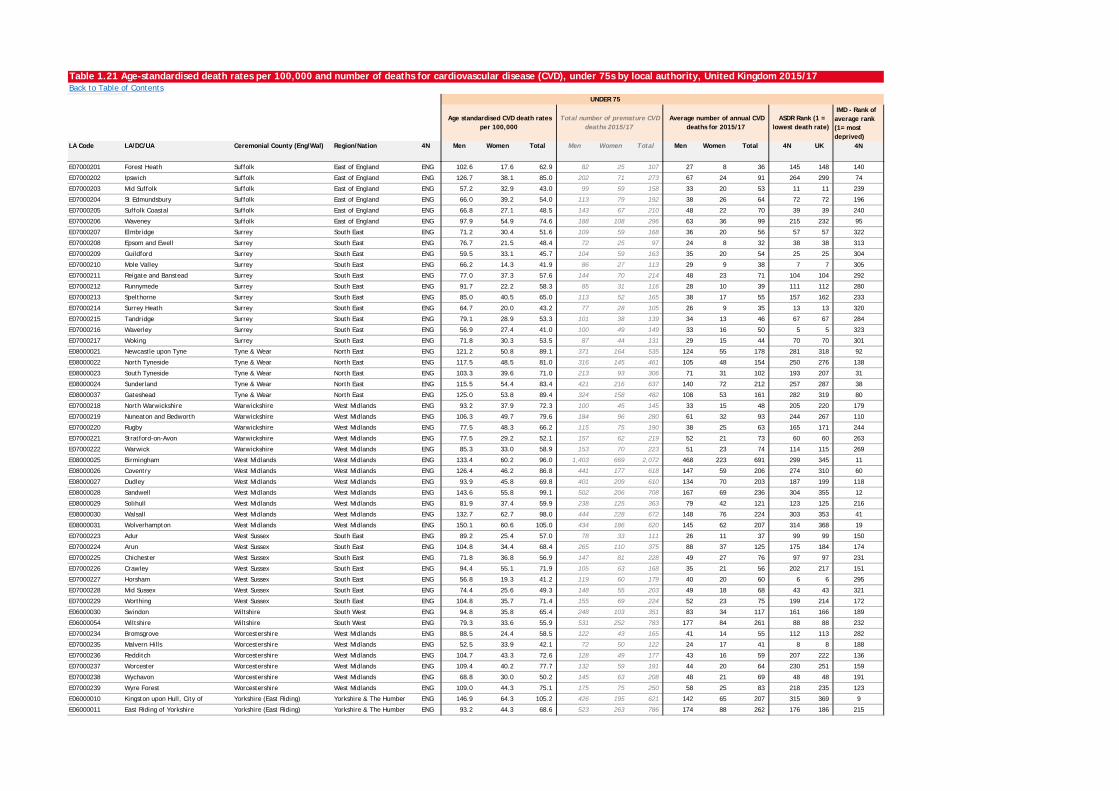
Table 1.21 Age-standardised death rates per 100,000 and number of deaths for cardiovascular disease (CVD), under 75s by local authority, United Kingdom 2015/17Back to Table of Contents
IMD - Rank of average rank (1= most deprived)
LA Code LA/DC/UA Ceremonial County (Eng/Wal) Region/Nation 4N Men Women Total Men Women Total Men Women Total 4N UK 4N
UNDER 75
Age standardised CVD death rates per 100,000
Total number of premature CVD deaths 2015/17
Average number of annual CVD deaths for 2015/17
ASDR Rank (1 = lowest death rate)
E07000201 Forest Heath Suffolk East of England ENG 102.6 17.6 62.9 82 25 107 27 8 36 145 148 140
E07000202 Ipswich Suffolk East of England ENG 126.7 38.1 85.0 202 71 273 67 24 91 264 299 74
E07000203 Mid Suffolk Suffolk East of England ENG 57.2 32.9 43.0 99 59 158 33 20 53 11 11 239
E07000204 St Edmundsbury Suffolk East of England ENG 66.0 39.2 54.0 113 79 192 38 26 64 72 72 196
E07000205 Suffolk Coastal Suffolk East of England ENG 66.8 27.1 48.5 143 67 210 48 22 70 39 39 240
E07000206 Waveney Suffolk East of England ENG 97.9 54.9 74.6 188 108 296 63 36 99 215 232 95
E07000207 Elmbridge Surrey South East ENG 71.2 30.4 51.6 109 59 168 36 20 56 57 57 322
E07000208 Epsom and Ewell Surrey South East ENG 76.7 21.5 48.4 72 25 97 24 8 32 38 38 313
E07000209 Guildford Surrey South East ENG 59.5 33.1 45.7 104 59 163 35 20 54 25 25 304
E07000210 Mole Valley Surrey South East ENG 66.2 14.3 41.9 86 27 113 29 9 38 7 7 305
E07000211 Reigate and Banstead Surrey South East ENG 77.0 37.3 57.6 144 70 214 48 23 71 104 104 292
E07000212 Runnymede Surrey South East ENG 91.7 22.2 58.3 85 31 116 28 10 39 111 112 280
E07000213 Spelthorne Surrey South East ENG 85.0 40.5 65.0 113 52 165 38 17 55 157 162 233
E07000214 Surrey Heath Surrey South East ENG 64.7 20.0 43.2 77 28 105 26 9 35 13 13 320
E07000215 Tandridge Surrey South East ENG 79.1 28.9 53.3 101 38 139 34 13 46 67 67 284
E07000216 Waverley Surrey South East ENG 56.9 27.4 41.0 100 49 149 33 16 50 5 5 323
E07000217 Woking Surrey South East ENG 71.8 30.3 53.5 87 44 131 29 15 44 70 70 301
E08000021 Newcastle upon Tyne Tyne & Wear North East ENG 121.2 50.8 89.1 371 164 535 124 55 178 281 318 92
E08000022 North Tyneside Tyne & Wear North East ENG 117.5 48.5 81.0 316 145 461 105 48 154 250 276 138
E08000023 South Tyneside Tyne & Wear North East ENG 103.3 39.6 71.0 213 93 306 71 31 102 193 207 31
E08000024 Sunderland Tyne & Wear North East ENG 115.5 54.4 83.4 421 216 637 140 72 212 257 287 38
E08000037 Gateshead Tyne & Wear North East ENG 125.0 53.8 89.4 324 158 482 108 53 161 282 319 80
E07000218 North Warwickshire Warwickshire West Midlands ENG 93.2 37.9 72.3 100 45 145 33 15 48 205 220 179
E07000219 Nuneaton and Bedworth Warwickshire West Midlands ENG 106.3 49.7 79.6 184 96 280 61 32 93 244 267 110
E07000220 Rugby Warwickshire West Midlands ENG 77.5 48.3 66.2 115 75 190 38 25 63 165 171 244
E07000221 Stratford-on-Avon Warwickshire West Midlands ENG 77.5 29.2 52.1 157 62 219 52 21 73 60 60 263
E07000222 Warwick Warwickshire West Midlands ENG 85.3 33.0 58.9 153 70 223 51 23 74 114 115 269
E08000025 Birmingham West Midlands West Midlands ENG 133.4 60.2 96.0 1,403 669 2,072 468 223 691 299 345 11
E08000026 Coventry West Midlands West Midlands ENG 126.4 46.2 86.8 441 177 618 147 59 206 274 310 60
E08000027 Dudley West Midlands West Midlands ENG 93.9 45.8 69.8 401 209 610 134 70 203 187 199 118
E08000028 Sandwell West Midlands West Midlands ENG 143.6 55.8 99.1 502 206 708 167 69 236 304 355 12
E08000029 Solihull West Midlands West Midlands ENG 81.9 37.4 59.9 238 125 363 79 42 121 123 125 216
E08000030 Walsall West Midlands West Midlands ENG 132.7 62.7 98.0 444 228 672 148 76 224 303 353 41
E08000031 Wolverhampton West Midlands West Midlands ENG 150.1 60.6 105.0 434 186 620 145 62 207 314 368 19
E07000223 Adur West Sussex South East ENG 89.2 25.4 57.0 78 33 111 26 11 37 99 99 150
E07000224 Arun West Sussex South East ENG 104.8 34.4 68.4 265 110 375 88 37 125 175 184 174
E07000225 Chichester West Sussex South East ENG 71.8 36.8 56.9 147 81 228 49 27 76 97 97 231
E07000226 Crawley West Sussex South East ENG 94.4 55.1 71.9 105 63 168 35 21 56 202 217 151
E07000227 Horsham West Sussex South East ENG 56.8 19.3 41.2 119 60 179 40 20 60 6 6 295
E07000228 Mid Sussex West Sussex South East ENG 74.4 25.6 49.3 148 55 203 49 18 68 43 43 321
E07000229 Worthing West Sussex South East ENG 104.8 35.7 71.4 155 69 224 52 23 75 199 214 172
E06000030 Swindon Wiltshire South West ENG 94.8 35.8 65.4 248 103 351 83 34 117 161 166 189
E06000054 Wiltshire Wiltshire South West ENG 79.3 33.6 55.9 531 252 783 177 84 261 88 88 232
E07000234 Bromsgrove Worcestershire West Midlands ENG 88.5 24.4 58.5 122 43 165 41 14 55 112 113 282
E07000235 Malvern Hills Worcestershire West Midlands ENG 52.5 33.9 42.1 72 50 122 24 17 41 8 8 188
E07000236 Redditch Worcestershire West Midlands ENG 104.7 43.3 72.6 128 49 177 43 16 59 207 222 136
E07000237 Worcester Worcestershire West Midlands ENG 109.4 40.2 77.7 132 59 191 44 20 64 230 251 159
E07000238 Wychavon Worcestershire West Midlands ENG 68.8 30.0 50.2 145 63 208 48 21 69 48 48 191
E07000239 Wyre Forest Worcestershire West Midlands ENG 109.0 44.3 75.1 175 75 250 58 25 83 218 235 123
E06000010 Kingston upon Hull, City of Yorkshire (East Riding) Yorkshire & The Humber ENG 146.9 64.3 105.2 426 195 621 142 65 207 315 369 9
E06000011 East Riding of Yorkshire Yorkshire (East Riding) Yorkshire & The Humber ENG 93.2 44.3 68.6 523 263 786 174 88 262 176 186 215
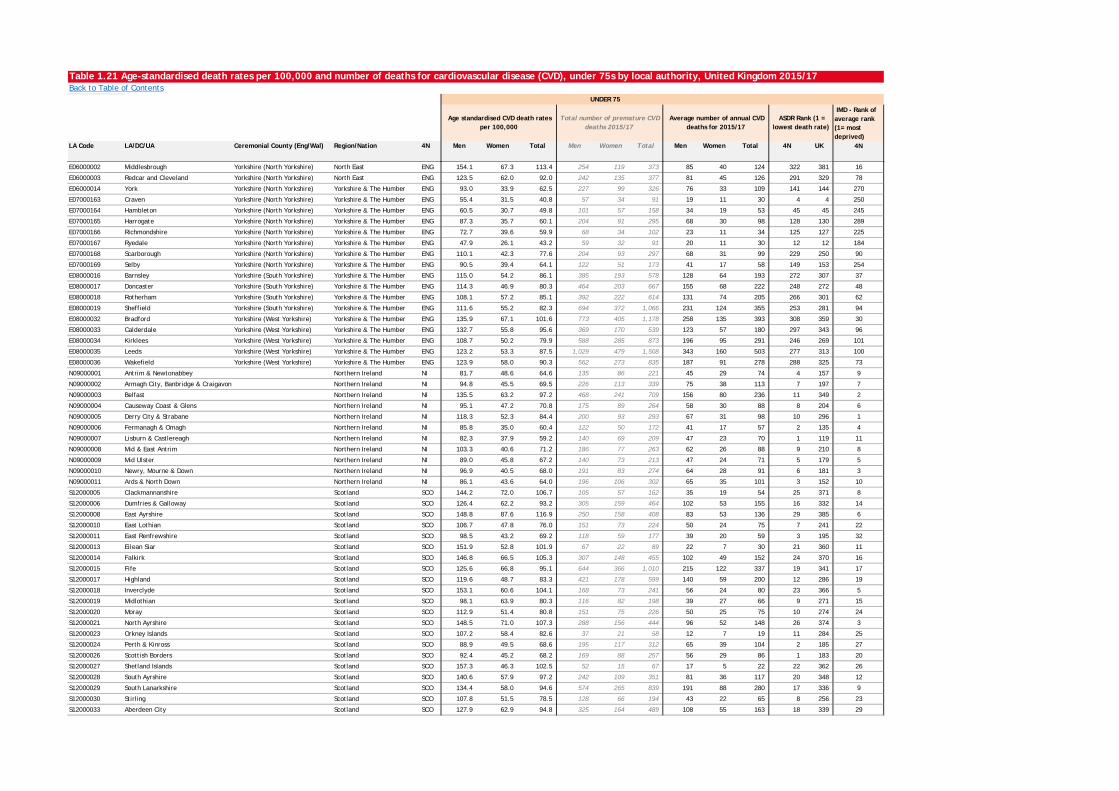
Table 1.21 Age-standardised death rates per 100,000 and number of deaths for cardiovascular disease (CVD), under 75s by local authority, United Kingdom 2015/17Back to Table of Contents
IMD - Rank of average rank (1= most deprived)
LA Code LA/DC/UA Ceremonial County (Eng/Wal) Region/Nation 4N Men Women Total Men Women Total Men Women Total 4N UK 4N
UNDER 75
Age standardised CVD death rates per 100,000
Total number of premature CVD deaths 2015/17
Average number of annual CVD deaths for 2015/17
ASDR Rank (1 = lowest death rate)
E06000002 Middlesbrough Yorkshire (North Yorkshire) North East ENG 154.1 67.3 113.4 254 119 373 85 40 124 322 381 16
E06000003 Redcar and Cleveland Yorkshire (North Yorkshire) North East ENG 123.5 62.0 92.0 242 135 377 81 45 126 291 329 78
E06000014 York Yorkshire (North Yorkshire) Yorkshire & The Humber ENG 93.0 33.9 62.5 227 99 326 76 33 109 141 144 270
E07000163 Craven Yorkshire (North Yorkshire) Yorkshire & The Humber ENG 55.4 31.5 40.8 57 34 91 19 11 30 4 4 250
E07000164 Hambleton Yorkshire (North Yorkshire) Yorkshire & The Humber ENG 60.5 30.7 49.8 101 57 158 34 19 53 45 45 245
E07000165 Harrogate Yorkshire (North Yorkshire) Yorkshire & The Humber ENG 87.3 35.7 60.1 204 91 295 68 30 98 128 130 289
E07000166 Richmondshire Yorkshire (North Yorkshire) Yorkshire & The Humber ENG 72.7 39.6 59.9 68 34 102 23 11 34 125 127 225
E07000167 Ryedale Yorkshire (North Yorkshire) Yorkshire & The Humber ENG 47.9 26.1 43.2 59 32 91 20 11 30 12 12 184
E07000168 Scarborough Yorkshire (North Yorkshire) Yorkshire & The Humber ENG 110.1 42.3 77.6 204 93 297 68 31 99 229 250 90
E07000169 Selby Yorkshire (North Yorkshire) Yorkshire & The Humber ENG 90.5 39.4 64.1 122 51 173 41 17 58 149 153 254
E08000016 Barnsley Yorkshire (South Yorkshire) Yorkshire & The Humber ENG 115.0 54.2 86.1 385 193 578 128 64 193 272 307 37
E08000017 Doncaster Yorkshire (South Yorkshire) Yorkshire & The Humber ENG 114.3 46.9 80.3 464 203 667 155 68 222 248 272 48
E08000018 Rotherham Yorkshire (South Yorkshire) Yorkshire & The Humber ENG 108.1 57.2 85.1 392 222 614 131 74 205 266 301 62
E08000019 Sheffield Yorkshire (South Yorkshire) Yorkshire & The Humber ENG 111.6 55.2 82.3 694 372 1,066 231 124 355 253 281 94
E08000032 Bradford Yorkshire (West Yorkshire) Yorkshire & The Humber ENG 135.9 67.1 101.6 773 405 1,178 258 135 393 308 359 30
E08000033 Calderdale Yorkshire (West Yorkshire) Yorkshire & The Humber ENG 132.7 55.8 95.6 369 170 539 123 57 180 297 343 96
E08000034 Kirklees Yorkshire (West Yorkshire) Yorkshire & The Humber ENG 108.7 50.2 79.9 588 285 873 196 95 291 246 269 101
E08000035 Leeds Yorkshire (West Yorkshire) Yorkshire & The Humber ENG 123.2 53.3 87.5 1,029 479 1,508 343 160 503 277 313 100
E08000036 Wakefield Yorkshire (West Yorkshire) Yorkshire & The Humber ENG 123.9 58.0 90.3 562 273 835 187 91 278 288 325 73
N09000001 Antrim & Newtonabbey Northern Ireland NI 81.7 48.6 64.6 135 86 221 45 29 74 4 157 9
N09000002 Armagh City, Banbridge & Craigavon Northern Ireland NI 94.8 45.5 69.5 226 113 339 75 38 113 7 197 7
N09000003 Belfast Northern Ireland NI 135.5 63.2 97.2 468 241 709 156 80 236 11 349 2
N09000004 Causeway Coast & Glens Northern Ireland NI 95.1 47.2 70.8 175 89 264 58 30 88 8 204 6
N09000005 Derry City & Strabane Northern Ireland NI 118.3 52.3 84.4 200 93 293 67 31 98 10 296 1
N09000006 Fermanagh & Omagh Northern Ireland NI 85.8 35.0 60.4 122 50 172 41 17 57 2 135 4
N09000007 Lisburn & Castlereagh Northern Ireland NI 82.3 37.9 59.2 140 69 209 47 23 70 1 119 11
N09000008 Mid & East Antrim Northern Ireland NI 103.3 40.6 71.2 186 77 263 62 26 88 9 210 8
N09000009 Mid Ulster Northern Ireland NI 89.0 45.8 67.2 140 73 213 47 24 71 5 179 5
N09000010 Newry, Mourne & Down Northern Ireland NI 96.9 40.5 68.0 191 83 274 64 28 91 6 181 3
N09000011 Ards & North Down Northern Ireland NI 86.1 43.6 64.0 196 106 302 65 35 101 3 152 10
S12000005 Clackmannanshire Scotland SCO 144.2 72.0 106.7 105 57 162 35 19 54 25 371 8
S12000006 Dumfries & Galloway Scotland SCO 126.4 62.2 93.2 305 159 464 102 53 155 16 332 14
S12000008 East Ayrshire Scotland SCO 148.8 87.6 116.9 250 158 408 83 53 136 29 385 6
S12000010 East Lothian Scotland SCO 106.7 47.8 76.0 151 73 224 50 24 75 7 241 22
S12000011 East Renfrewshire Scotland SCO 98.5 43.2 69.2 118 59 177 39 20 59 3 195 32
S12000013 Eilean Siar Scotland SCO 151.9 52.8 101.9 67 22 89 22 7 30 21 360 11
S12000014 Falkirk Scotland SCO 146.8 66.5 105.3 307 148 455 102 49 152 24 370 16
S12000015 Fife Scotland SCO 125.6 66.8 95.1 644 366 1,010 215 122 337 19 341 17
S12000017 Highland Scotland SCO 119.6 48.7 83.3 421 178 599 140 59 200 12 286 19
S12000018 Inverclyde Scotland SCO 153.1 60.6 104.1 168 73 241 56 24 80 23 366 5
S12000019 Midlothian Scotland SCO 98.1 63.9 80.3 116 82 198 39 27 66 9 271 15
S12000020 Moray Scotland SCO 112.9 51.4 80.8 151 75 226 50 25 75 10 274 24
S12000021 North Ayrshire Scotland SCO 148.5 71.0 107.3 288 156 444 96 52 148 26 374 3
S12000023 Orkney Islands Scotland SCO 107.2 58.4 82.6 37 21 58 12 7 19 11 284 25
S12000024 Perth & Kinross Scotland SCO 88.9 49.5 68.6 195 117 312 65 39 104 2 185 27
S12000026 Scottish Borders Scotland SCO 92.4 45.2 68.2 169 88 257 56 29 86 1 183 20
S12000027 Shetland Islands Scotland SCO 157.3 46.3 102.5 52 15 67 17 5 22 22 362 26
S12000028 South Ayrshire Scotland SCO 140.6 57.9 97.2 242 109 351 81 36 117 20 348 12
S12000029 South Lanarkshire Scotland SCO 134.4 58.0 94.6 574 265 839 191 88 280 17 336 9
S12000030 Stirling Scotland SCO 107.8 51.5 78.5 128 66 194 43 22 65 8 256 23
S12000033 Aberdeen City Scotland SCO 127.9 62.9 94.8 325 164 489 108 55 163 18 339 29
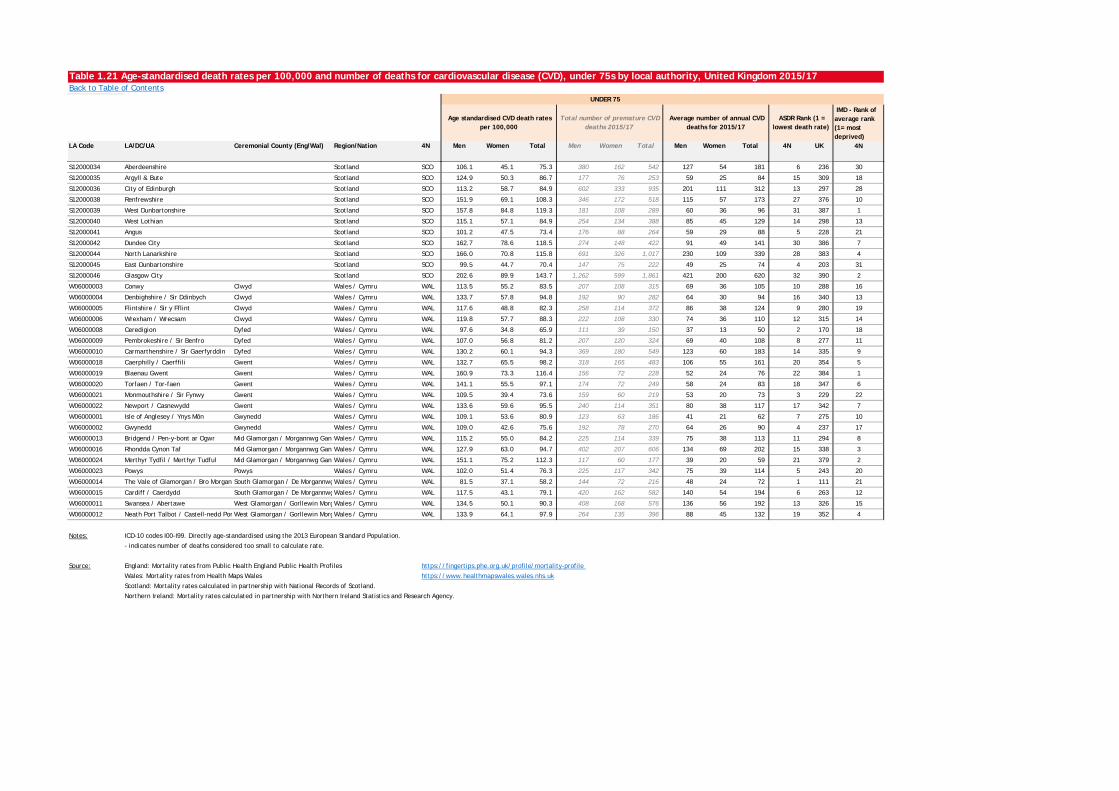
Table 1.21 Age-standardised death rates per 100,000 and number of deaths for cardiovascular disease (CVD), under 75s by local authority, United Kingdom 2015/17Back to Table of Contents
IMD - Rank of average rank (1= most deprived)
LA Code LA/DC/UA Ceremonial County (Eng/Wal) Region/Nation 4N Men Women Total Men Women Total Men Women Total 4N UK 4N
UNDER 75
Age standardised CVD death rates per 100,000
Total number of premature CVD deaths 2015/17
Average number of annual CVD deaths for 2015/17
ASDR Rank (1 = lowest death rate)
S12000034 Aberdeenshire Scotland SCO 106.1 45.1 75.3 380 162 542 127 54 181 6 236 30
S12000035 Argyll & Bute Scotland SCO 124.9 50.3 86.7 177 76 253 59 25 84 15 309 18
S12000036 City of Edinburgh Scotland SCO 113.2 58.7 84.9 602 333 935 201 111 312 13 297 28
S12000038 Renfrewshire Scotland SCO 151.9 69.1 108.3 346 172 518 115 57 173 27 376 10
S12000039 West Dunbartonshire Scotland SCO 157.8 84.8 119.3 181 108 289 60 36 96 31 387 1
S12000040 West Lothian Scotland SCO 115.1 57.1 84.9 254 134 388 85 45 129 14 298 13
S12000041 Angus Scotland SCO 101.2 47.5 73.4 176 88 264 59 29 88 5 228 21
S12000042 Dundee City Scotland SCO 162.7 78.6 118.5 274 148 422 91 49 141 30 386 7
S12000044 North Lanarkshire Scotland SCO 166.0 70.8 115.8 691 326 1,017 230 109 339 28 383 4
S12000045 East Dunbartonshire Scotland SCO 99.5 44.7 70.4 147 75 222 49 25 74 4 203 31
S12000046 Glasgow City Scotland SCO 202.6 89.9 143.7 1,262 599 1,861 421 200 620 32 390 2
W06000003 Conwy Clwyd Wales / Cymru WAL 113.5 55.2 83.5 207 108 315 69 36 105 10 288 16
W06000004 Denbighshire / Sir Ddinbych Clwyd Wales / Cymru WAL 133.7 57.8 94.8 192 90 282 64 30 94 16 340 13
W06000005 Flintshire / Sir y Fflint Clwyd Wales / Cymru WAL 117.6 48.8 82.3 258 114 372 86 38 124 9 280 19
W06000006 Wrexham / Wrecsam Clwyd Wales / Cymru WAL 119.8 57.7 88.3 222 108 330 74 36 110 12 315 14
W06000008 Ceredigion Dyfed Wales / Cymru WAL 97.6 34.8 65.9 111 39 150 37 13 50 2 170 18
W06000009 Pembrokeshire / Sir Benfro Dyfed Wales / Cymru WAL 107.0 56.8 81.2 207 120 324 69 40 108 8 277 11
W06000010 Carmarthenshire / Sir Gaerfyrddin Dyfed Wales / Cymru WAL 130.2 60.1 94.3 369 180 549 123 60 183 14 335 9
W06000018 Caerphilly / Caerffili Gwent Wales / Cymru WAL 132.7 65.5 98.2 318 165 483 106 55 161 20 354 5
W06000019 Blaenau Gwent Gwent Wales / Cymru WAL 160.9 73.3 116.4 156 72 228 52 24 76 22 384 1
W06000020 Torfaen / Tor-faen Gwent Wales / Cymru WAL 141.1 55.5 97.1 174 72 249 58 24 83 18 347 6
W06000021 Monmouthshire / Sir Fynwy Gwent Wales / Cymru WAL 109.5 39.4 73.6 159 60 219 53 20 73 3 229 22
W06000022 Newport / Casnewydd Gwent Wales / Cymru WAL 133.6 59.6 95.5 240 114 351 80 38 117 17 342 7
W06000001 Isle of Anglesey / Ynys Môn Gwynedd Wales / Cymru WAL 109.1 53.6 80.9 123 63 186 41 21 62 7 275 10
W06000002 Gwynedd Gwynedd Wales / Cymru WAL 109.0 42.6 75.6 192 78 270 64 26 90 4 237 17
W06000013 Bridgend / Pen-y-bont ar Ogwr Mid Glamorgan / Morgannwg Gan Wales / Cymru WAL 115.2 55.0 84.2 225 114 339 75 38 113 11 294 8
W06000016 Rhondda Cynon Taf Mid Glamorgan / Morgannwg Gan Wales / Cymru WAL 127.9 63.0 94.7 402 207 606 134 69 202 15 338 3
W06000024 Merthyr Tydfil / Merthyr Tudful Mid Glamorgan / Morgannwg Gan Wales / Cymru WAL 151.1 75.2 112.3 117 60 177 39 20 59 21 379 2
W06000023 Powys Powys Wales / Cymru WAL 102.0 51.4 76.3 225 117 342 75 39 114 5 243 20
W06000014 The Vale of Glamorgan / Bro Morgan South Glamorgan / De MorgannwgWales / Cymru WAL 81.5 37.1 58.2 144 72 216 48 24 72 1 111 21
W06000015 Cardiff / Caerdydd South Glamorgan / De MorgannwgWales / Cymru WAL 117.5 43.1 79.1 420 162 582 140 54 194 6 263 12
W06000011 Swansea / Abertawe West Glamorgan / Gorllewin MorgWales / Cymru WAL 134.5 50.1 90.3 408 168 576 136 56 192 13 326 15
W06000012 Neath Port Talbot / Castell-nedd Por West Glamorgan / Gorllewin MorgWales / Cymru WAL 133.9 64.1 97.9 264 135 396 88 45 132 19 352 4
Notes: ICD-10 codes I00-I99. Directly age-standardised using the 2013 European Standard Population.
- indicates number of deaths considered too small to calculate rate.
Source: England: Mortality rates from Public Health England Public Health Profiles https://fingertips.phe.org.uk/profile/mortality-profile
Wales: Mortality rates from Health Maps Wales https://www.healthmapswales.wales.nhs.uk
Scotland: Mortality rates calculated in partnership with National Records of Scotland.
Northern Ireland: Mortality rates calculated in partnership with Northern Ireland Statistics and Research Agency.
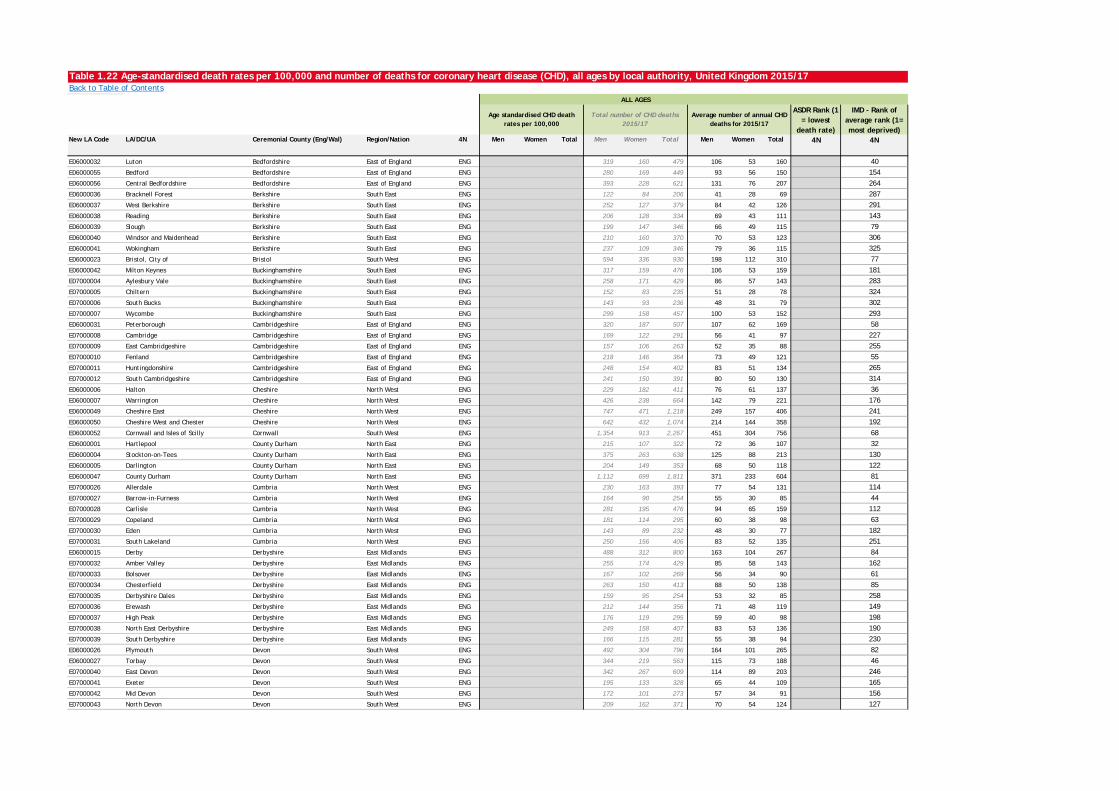
Table 1.22 Age-standardised death rates per 100,000 and number of deaths for coronary heart disease (CHD), all ages by local authority, United Kingdom 2015/17Back to Table of Contents
ASDR Rank (1 = lowest
death rate)
IMD - Rank of average rank (1= most deprived)
New LA Code LA/DC/UA Ceremonial County (Eng/Wal) Region/Nation 4N Men Women Total Men Women Total Men Women Total 4N 4N
E06000032 Luton Bedfordshire East of England ENG 319 160 479 106 53 160 40E06000055 Bedford Bedfordshire East of England ENG 280 169 449 93 56 150 154E06000056 Central Bedfordshire Bedfordshire East of England ENG 393 228 621 131 76 207 264E06000036 Bracknell Forest Berkshire South East ENG 122 84 206 41 28 69 287E06000037 West Berkshire Berkshire South East ENG 252 127 379 84 42 126 291E06000038 Reading Berkshire South East ENG 206 128 334 69 43 111 143E06000039 Slough Berkshire South East ENG 199 147 346 66 49 115 79E06000040 Windsor and Maidenhead Berkshire South East ENG 210 160 370 70 53 123 306E06000041 Wokingham Berkshire South East ENG 237 109 346 79 36 115 325E06000023 Bristol, City of Bristol South West ENG 594 336 930 198 112 310 77E06000042 Milton Keynes Buckinghamshire South East ENG 317 159 476 106 53 159 181E07000004 Aylesbury Vale Buckinghamshire South East ENG 258 171 429 86 57 143 283E07000005 Chiltern Buckinghamshire South East ENG 152 83 235 51 28 78 324E07000006 South Bucks Buckinghamshire South East ENG 143 93 236 48 31 79 302E07000007 Wycombe Buckinghamshire South East ENG 299 158 457 100 53 152 293E06000031 Peterborough Cambridgeshire East of England ENG 320 187 507 107 62 169 58E07000008 Cambridge Cambridgeshire East of England ENG 169 122 291 56 41 97 227E07000009 East Cambridgeshire Cambridgeshire East of England ENG 157 106 263 52 35 88 255E07000010 Fenland Cambridgeshire East of England ENG 218 146 364 73 49 121 55E07000011 Huntingdonshire Cambridgeshire East of England ENG 248 154 402 83 51 134 265E07000012 South Cambridgeshire Cambridgeshire East of England ENG 241 150 391 80 50 130 314E06000006 Halton Cheshire North West ENG 229 182 411 76 61 137 36E06000007 Warrington Cheshire North West ENG 426 238 664 142 79 221 176E06000049 Cheshire East Cheshire North West ENG 747 471 1,218 249 157 406 241E06000050 Cheshire West and Chester Cheshire North West ENG 642 432 1,074 214 144 358 192E06000052 Cornwall and Isles of Scilly Cornwall South West ENG 1,354 913 2,267 451 304 756 68E06000001 Hartlepool County Durham North East ENG 215 107 322 72 36 107 32E06000004 Stockton-on-Tees County Durham North East ENG 375 263 638 125 88 213 130E06000005 Darlington County Durham North East ENG 204 149 353 68 50 118 122E06000047 County Durham County Durham North East ENG 1,112 699 1,811 371 233 604 81E07000026 Allerdale Cumbria North West ENG 230 163 393 77 54 131 114E07000027 Barrow-in-Furness Cumbria North West ENG 164 90 254 55 30 85 44E07000028 Carlisle Cumbria North West ENG 281 195 476 94 65 159 112E07000029 Copeland Cumbria North West ENG 181 114 295 60 38 98 63E07000030 Eden Cumbria North West ENG 143 89 232 48 30 77 182E07000031 South Lakeland Cumbria North West ENG 250 156 406 83 52 135 251E06000015 Derby Derbyshire East Midlands ENG 488 312 800 163 104 267 84E07000032 Amber Valley Derbyshire East Midlands ENG 255 174 429 85 58 143 162E07000033 Bolsover Derbyshire East Midlands ENG 167 102 269 56 34 90 61E07000034 Chesterfield Derbyshire East Midlands ENG 263 150 413 88 50 138 85E07000035 Derbyshire Dales Derbyshire East Midlands ENG 159 95 254 53 32 85 258E07000036 Erewash Derbyshire East Midlands ENG 212 144 356 71 48 119 149E07000037 High Peak Derbyshire East Midlands ENG 176 119 295 59 40 98 198E07000038 North East Derbyshire Derbyshire East Midlands ENG 249 158 407 83 53 136 190E07000039 South Derbyshire Derbyshire East Midlands ENG 166 115 281 55 38 94 230E06000026 Plymouth Devon South West ENG 492 304 796 164 101 265 82E06000027 Torbay Devon South West ENG 344 219 563 115 73 188 46E07000040 East Devon Devon South West ENG 342 267 609 114 89 203 246E07000041 Exeter Devon South West ENG 195 133 328 65 44 109 165E07000042 Mid Devon Devon South West ENG 172 101 273 57 34 91 156E07000043 North Devon Devon South West ENG 209 162 371 70 54 124 127
ALL AGES
Age standardised CHD death rates per 100,000
Total number of CHD deaths 2015/17
Average number of annual CHD deaths for 2015/17
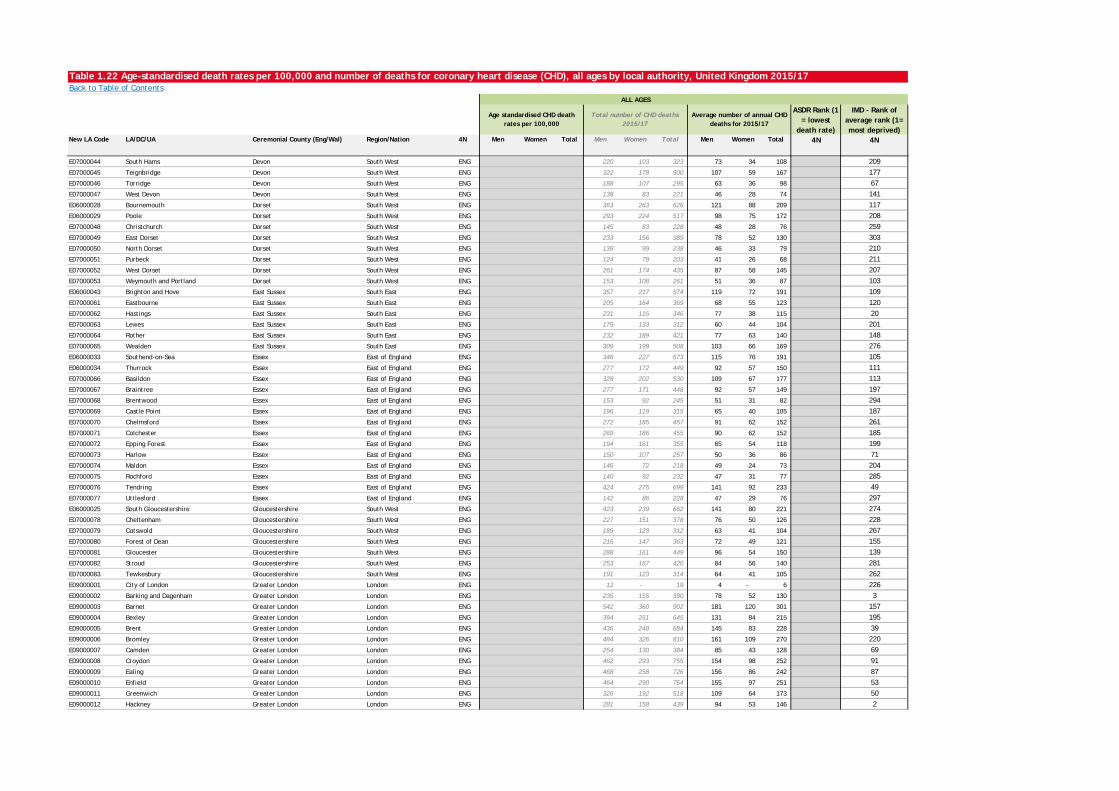
Table 1.22 Age-standardised death rates per 100,000 and number of deaths for coronary heart disease (CHD), all ages by local authority, United Kingdom 2015/17Back to Table of Contents
ASDR Rank (1 = lowest
death rate)
IMD - Rank of average rank (1= most deprived)
New LA Code LA/DC/UA Ceremonial County (Eng/Wal) Region/Nation 4N Men Women Total Men Women Total Men Women Total 4N 4N
ALL AGES
Age standardised CHD death rates per 100,000
Total number of CHD deaths 2015/17
Average number of annual CHD deaths for 2015/17
E07000044 South Hams Devon South West ENG 220 103 323 73 34 108 209E07000045 Teignbridge Devon South West ENG 322 178 500 107 59 167 177E07000046 Torridge Devon South West ENG 188 107 295 63 36 98 67E07000047 West Devon Devon South West ENG 138 83 221 46 28 74 141E06000028 Bournemouth Dorset South West ENG 363 263 626 121 88 209 117E06000029 Poole Dorset South West ENG 293 224 517 98 75 172 208E07000048 Christchurch Dorset South West ENG 145 83 228 48 28 76 259E07000049 East Dorset Dorset South West ENG 233 156 389 78 52 130 303E07000050 North Dorset Dorset South West ENG 139 99 238 46 33 79 210E07000051 Purbeck Dorset South West ENG 124 79 203 41 26 68 211E07000052 West Dorset Dorset South West ENG 261 174 435 87 58 145 207E07000053 Weymouth and Portland Dorset South West ENG 153 108 261 51 36 87 103E06000043 Brighton and Hove East Sussex South East ENG 357 217 574 119 72 191 109E07000061 Eastbourne East Sussex South East ENG 205 164 369 68 55 123 120E07000062 Hastings East Sussex South East ENG 231 115 346 77 38 115 20E07000063 Lewes East Sussex South East ENG 179 133 312 60 44 104 201E07000064 Rother East Sussex South East ENG 232 189 421 77 63 140 148E07000065 Wealden East Sussex South East ENG 309 199 508 103 66 169 276E06000033 Southend-on-Sea Essex East of England ENG 346 227 573 115 76 191 105E06000034 Thurrock Essex East of England ENG 277 172 449 92 57 150 111E07000066 Basildon Essex East of England ENG 328 202 530 109 67 177 113E07000067 Braintree Essex East of England ENG 277 171 448 92 57 149 197E07000068 Brentwood Essex East of England ENG 153 92 245 51 31 82 294E07000069 Castle Point Essex East of England ENG 196 119 315 65 40 105 187E07000070 Chelmsford Essex East of England ENG 272 185 457 91 62 152 261E07000071 Colchester Essex East of England ENG 269 186 455 90 62 152 185E07000072 Epping Forest Essex East of England ENG 194 161 355 65 54 118 199E07000073 Harlow Essex East of England ENG 150 107 257 50 36 86 71E07000074 Maldon Essex East of England ENG 146 72 218 49 24 73 204E07000075 Rochford Essex East of England ENG 140 92 232 47 31 77 285E07000076 Tendring Essex East of England ENG 424 275 699 141 92 233 49E07000077 Uttlesford Essex East of England ENG 142 86 228 47 29 76 297E06000025 South Gloucestershire Gloucestershire South West ENG 423 239 662 141 80 221 274E07000078 Cheltenham Gloucestershire South West ENG 227 151 378 76 50 126 228E07000079 Cotswold Gloucestershire South West ENG 189 123 312 63 41 104 267E07000080 Forest of Dean Gloucestershire South West ENG 216 147 363 72 49 121 155E07000081 Gloucester Gloucestershire South West ENG 288 161 449 96 54 150 139E07000082 Stroud Gloucestershire South West ENG 253 167 420 84 56 140 281E07000083 Tewkesbury Gloucestershire South West ENG 191 123 314 64 41 105 262E09000001 City of London Greater London London ENG 12 - 19 4 - 6 226E09000002 Barking and Dagenham Greater London London ENG 235 155 390 78 52 130 3E09000003 Barnet Greater London London ENG 542 360 902 181 120 301 157E09000004 Bexley Greater London London ENG 394 251 645 131 84 215 195E09000005 Brent Greater London London ENG 436 248 684 145 83 228 39E09000006 Bromley Greater London London ENG 484 326 810 161 109 270 220E09000007 Camden Greater London London ENG 254 130 384 85 43 128 69E09000008 Croydon Greater London London ENG 462 293 755 154 98 252 91E09000009 Ealing Greater London London ENG 468 258 726 156 86 242 87E09000010 Enfield Greater London London ENG 464 290 754 155 97 251 53E09000011 Greenwich Greater London London ENG 326 192 518 109 64 173 50E09000012 Hackney Greater London London ENG 281 158 439 94 53 146 2
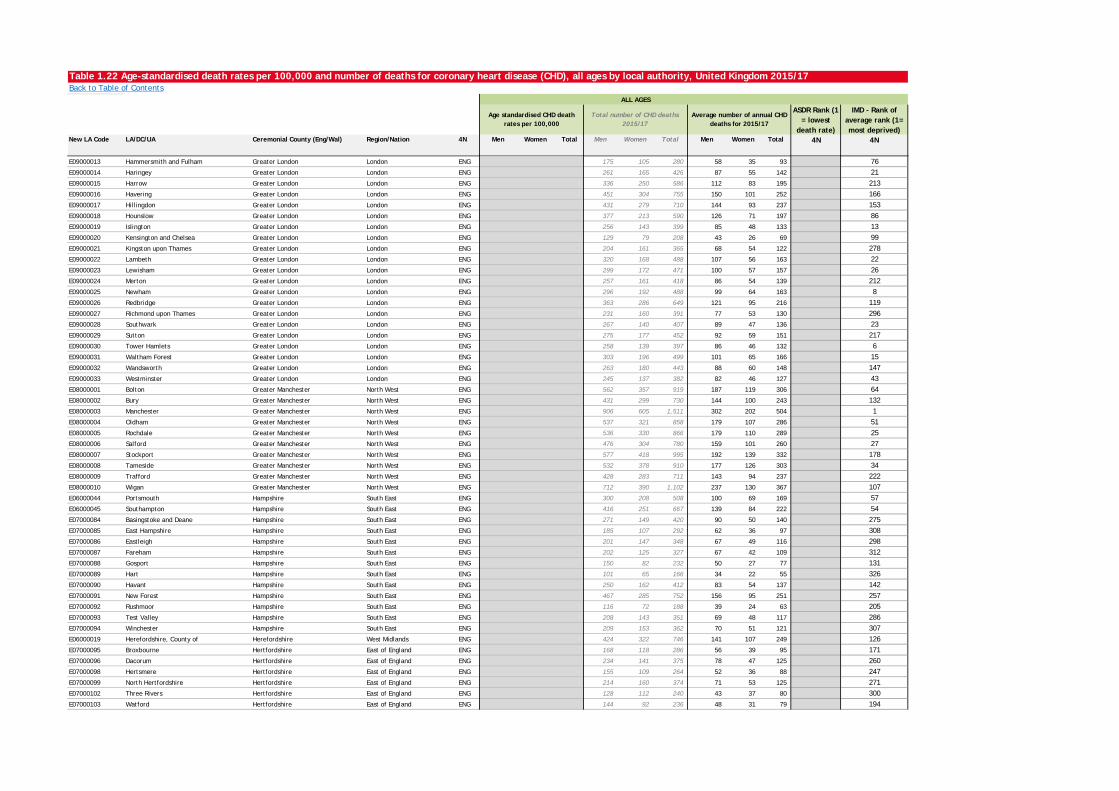
Table 1.22 Age-standardised death rates per 100,000 and number of deaths for coronary heart disease (CHD), all ages by local authority, United Kingdom 2015/17Back to Table of Contents
ASDR Rank (1 = lowest
death rate)
IMD - Rank of average rank (1= most deprived)
New LA Code LA/DC/UA Ceremonial County (Eng/Wal) Region/Nation 4N Men Women Total Men Women Total Men Women Total 4N 4N
ALL AGES
Age standardised CHD death rates per 100,000
Total number of CHD deaths 2015/17
Average number of annual CHD deaths for 2015/17
E09000013 Hammersmith and Fulham Greater London London ENG 175 105 280 58 35 93 76E09000014 Haringey Greater London London ENG 261 165 426 87 55 142 21E09000015 Harrow Greater London London ENG 336 250 586 112 83 195 213E09000016 Havering Greater London London ENG 451 304 755 150 101 252 166E09000017 Hillingdon Greater London London ENG 431 279 710 144 93 237 153E09000018 Hounslow Greater London London ENG 377 213 590 126 71 197 86E09000019 Islington Greater London London ENG 256 143 399 85 48 133 13E09000020 Kensington and Chelsea Greater London London ENG 129 79 208 43 26 69 99E09000021 Kingston upon Thames Greater London London ENG 204 161 365 68 54 122 278E09000022 Lambeth Greater London London ENG 320 168 488 107 56 163 22E09000023 Lewisham Greater London London ENG 299 172 471 100 57 157 26E09000024 Merton Greater London London ENG 257 161 418 86 54 139 212E09000025 Newham Greater London London ENG 296 192 488 99 64 163 8E09000026 Redbridge Greater London London ENG 363 286 649 121 95 216 119E09000027 Richmond upon Thames Greater London London ENG 231 160 391 77 53 130 296E09000028 Southwark Greater London London ENG 267 140 407 89 47 136 23E09000029 Sutton Greater London London ENG 275 177 452 92 59 151 217E09000030 Tower Hamlets Greater London London ENG 258 139 397 86 46 132 6E09000031 Waltham Forest Greater London London ENG 303 196 499 101 65 166 15E09000032 Wandsworth Greater London London ENG 263 180 443 88 60 148 147E09000033 Westminster Greater London London ENG 245 137 382 82 46 127 43E08000001 Bolton Greater Manchester North West ENG 562 357 919 187 119 306 64E08000002 Bury Greater Manchester North West ENG 431 299 730 144 100 243 132E08000003 Manchester Greater Manchester North West ENG 906 605 1,511 302 202 504 1E08000004 Oldham Greater Manchester North West ENG 537 321 858 179 107 286 51E08000005 Rochdale Greater Manchester North West ENG 536 330 866 179 110 289 25E08000006 Salford Greater Manchester North West ENG 476 304 780 159 101 260 27E08000007 Stockport Greater Manchester North West ENG 577 418 995 192 139 332 178E08000008 Tameside Greater Manchester North West ENG 532 378 910 177 126 303 34E08000009 Trafford Greater Manchester North West ENG 428 283 711 143 94 237 222E08000010 Wigan Greater Manchester North West ENG 712 390 1,102 237 130 367 107E06000044 Portsmouth Hampshire South East ENG 300 208 508 100 69 169 57E06000045 Southampton Hampshire South East ENG 416 251 667 139 84 222 54E07000084 Basingstoke and Deane Hampshire South East ENG 271 149 420 90 50 140 275E07000085 East Hampshire Hampshire South East ENG 185 107 292 62 36 97 308E07000086 Eastleigh Hampshire South East ENG 201 147 348 67 49 116 298E07000087 Fareham Hampshire South East ENG 202 125 327 67 42 109 312E07000088 Gosport Hampshire South East ENG 150 82 232 50 27 77 131E07000089 Hart Hampshire South East ENG 101 65 166 34 22 55 326E07000090 Havant Hampshire South East ENG 250 162 412 83 54 137 142E07000091 New Forest Hampshire South East ENG 467 285 752 156 95 251 257E07000092 Rushmoor Hampshire South East ENG 116 72 188 39 24 63 205E07000093 Test Valley Hampshire South East ENG 208 143 351 69 48 117 286E07000094 Winchester Hampshire South East ENG 209 153 362 70 51 121 307E06000019 Herefordshire, County of Herefordshire West Midlands ENG 424 322 746 141 107 249 126E07000095 Broxbourne Hertfordshire East of England ENG 168 118 286 56 39 95 171E07000096 Dacorum Hertfordshire East of England ENG 234 141 375 78 47 125 260E07000098 Hertsmere Hertfordshire East of England ENG 155 109 264 52 36 88 247E07000099 North Hertfordshire Hertfordshire East of England ENG 214 160 374 71 53 125 271E07000102 Three Rivers Hertfordshire East of England ENG 128 112 240 43 37 80 300E07000103 Watford Hertfordshire East of England ENG 144 92 236 48 31 79 194
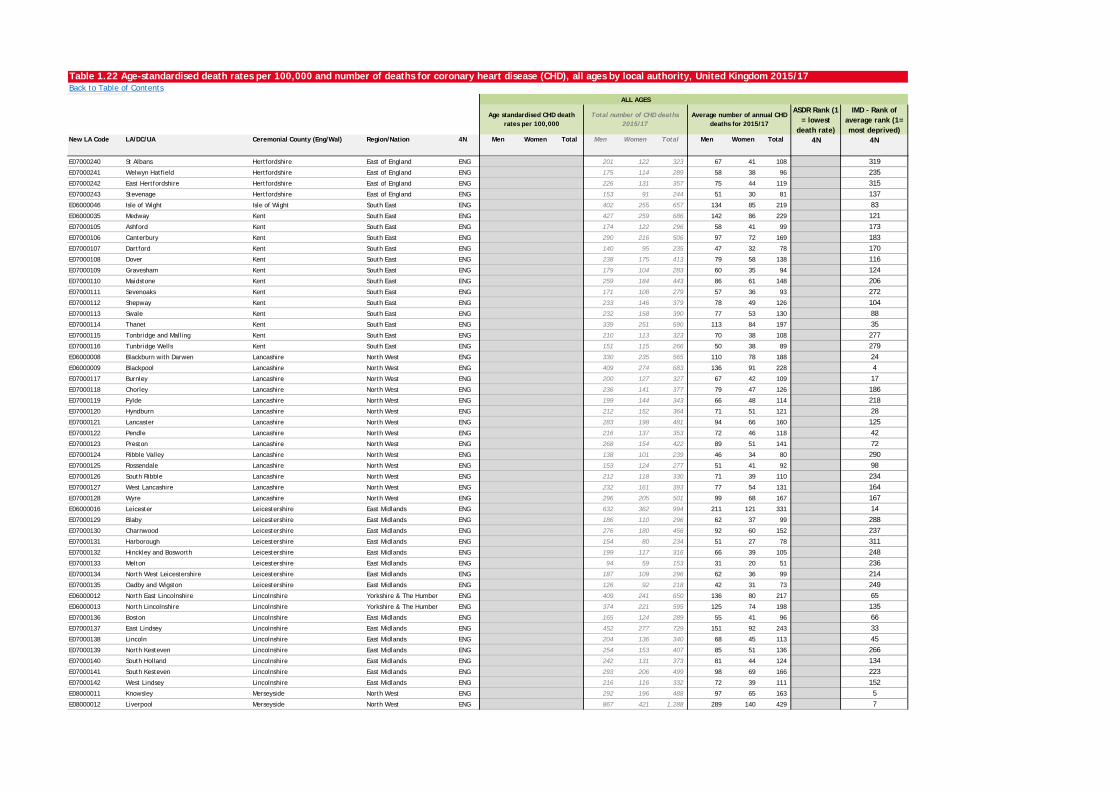
Table 1.22 Age-standardised death rates per 100,000 and number of deaths for coronary heart disease (CHD), all ages by local authority, United Kingdom 2015/17Back to Table of Contents
ASDR Rank (1 = lowest
death rate)
IMD - Rank of average rank (1= most deprived)
New LA Code LA/DC/UA Ceremonial County (Eng/Wal) Region/Nation 4N Men Women Total Men Women Total Men Women Total 4N 4N
ALL AGES
Age standardised CHD death rates per 100,000
Total number of CHD deaths 2015/17
Average number of annual CHD deaths for 2015/17
E07000240 St Albans Hertfordshire East of England ENG 201 122 323 67 41 108 319E07000241 Welwyn Hatfield Hertfordshire East of England ENG 175 114 289 58 38 96 235E07000242 East Hertfordshire Hertfordshire East of England ENG 226 131 357 75 44 119 315E07000243 Stevenage Hertfordshire East of England ENG 153 91 244 51 30 81 137E06000046 Isle of Wight Isle of Wight South East ENG 402 255 657 134 85 219 83E06000035 Medway Kent South East ENG 427 259 686 142 86 229 121E07000105 Ashford Kent South East ENG 174 122 296 58 41 99 173E07000106 Canterbury Kent South East ENG 290 216 506 97 72 169 183E07000107 Dartford Kent South East ENG 140 95 235 47 32 78 170E07000108 Dover Kent South East ENG 238 175 413 79 58 138 116E07000109 Gravesham Kent South East ENG 179 104 283 60 35 94 124E07000110 Maidstone Kent South East ENG 259 184 443 86 61 148 206E07000111 Sevenoaks Kent South East ENG 171 108 279 57 36 93 272E07000112 Shepway Kent South East ENG 233 146 379 78 49 126 104E07000113 Swale Kent South East ENG 232 158 390 77 53 130 88E07000114 Thanet Kent South East ENG 339 251 590 113 84 197 35E07000115 Tonbridge and Malling Kent South East ENG 210 113 323 70 38 108 277E07000116 Tunbridge Wells Kent South East ENG 151 115 266 50 38 89 279E06000008 Blackburn with Darwen Lancashire North West ENG 330 235 565 110 78 188 24E06000009 Blackpool Lancashire North West ENG 409 274 683 136 91 228 4E07000117 Burnley Lancashire North West ENG 200 127 327 67 42 109 17E07000118 Chorley Lancashire North West ENG 236 141 377 79 47 126 186E07000119 Fylde Lancashire North West ENG 199 144 343 66 48 114 218E07000120 Hyndburn Lancashire North West ENG 212 152 364 71 51 121 28E07000121 Lancaster Lancashire North West ENG 283 198 481 94 66 160 125E07000122 Pendle Lancashire North West ENG 216 137 353 72 46 118 42E07000123 Preston Lancashire North West ENG 268 154 422 89 51 141 72E07000124 Ribble Valley Lancashire North West ENG 138 101 239 46 34 80 290E07000125 Rossendale Lancashire North West ENG 153 124 277 51 41 92 98E07000126 South Ribble Lancashire North West ENG 212 118 330 71 39 110 234E07000127 West Lancashire Lancashire North West ENG 232 161 393 77 54 131 164E07000128 Wyre Lancashire North West ENG 296 205 501 99 68 167 167E06000016 Leicester Leicestershire East Midlands ENG 632 362 994 211 121 331 14E07000129 Blaby Leicestershire East Midlands ENG 186 110 296 62 37 99 288E07000130 Charnwood Leicestershire East Midlands ENG 276 180 456 92 60 152 237E07000131 Harborough Leicestershire East Midlands ENG 154 80 234 51 27 78 311E07000132 Hinckley and Bosworth Leicestershire East Midlands ENG 199 117 316 66 39 105 248E07000133 Melton Leicestershire East Midlands ENG 94 59 153 31 20 51 236E07000134 North West Leicestershire Leicestershire East Midlands ENG 187 109 296 62 36 99 214E07000135 Oadby and Wigston Leicestershire East Midlands ENG 126 92 218 42 31 73 249E06000012 North East Lincolnshire Lincolnshire Yorkshire & The Humber ENG 409 241 650 136 80 217 65E06000013 North Lincolnshire Lincolnshire Yorkshire & The Humber ENG 374 221 595 125 74 198 135E07000136 Boston Lincolnshire East Midlands ENG 165 124 289 55 41 96 66E07000137 East Lindsey Lincolnshire East Midlands ENG 452 277 729 151 92 243 33E07000138 Lincoln Lincolnshire East Midlands ENG 204 136 340 68 45 113 45E07000139 North Kesteven Lincolnshire East Midlands ENG 254 153 407 85 51 136 266E07000140 South Holland Lincolnshire East Midlands ENG 242 131 373 81 44 124 134E07000141 South Kesteven Lincolnshire East Midlands ENG 293 206 499 98 69 166 223E07000142 West Lindsey Lincolnshire East Midlands ENG 216 116 332 72 39 111 152E08000011 Knowsley Merseyside North West ENG 292 196 488 97 65 163 5E08000012 Liverpool Merseyside North West ENG 867 421 1,288 289 140 429 7
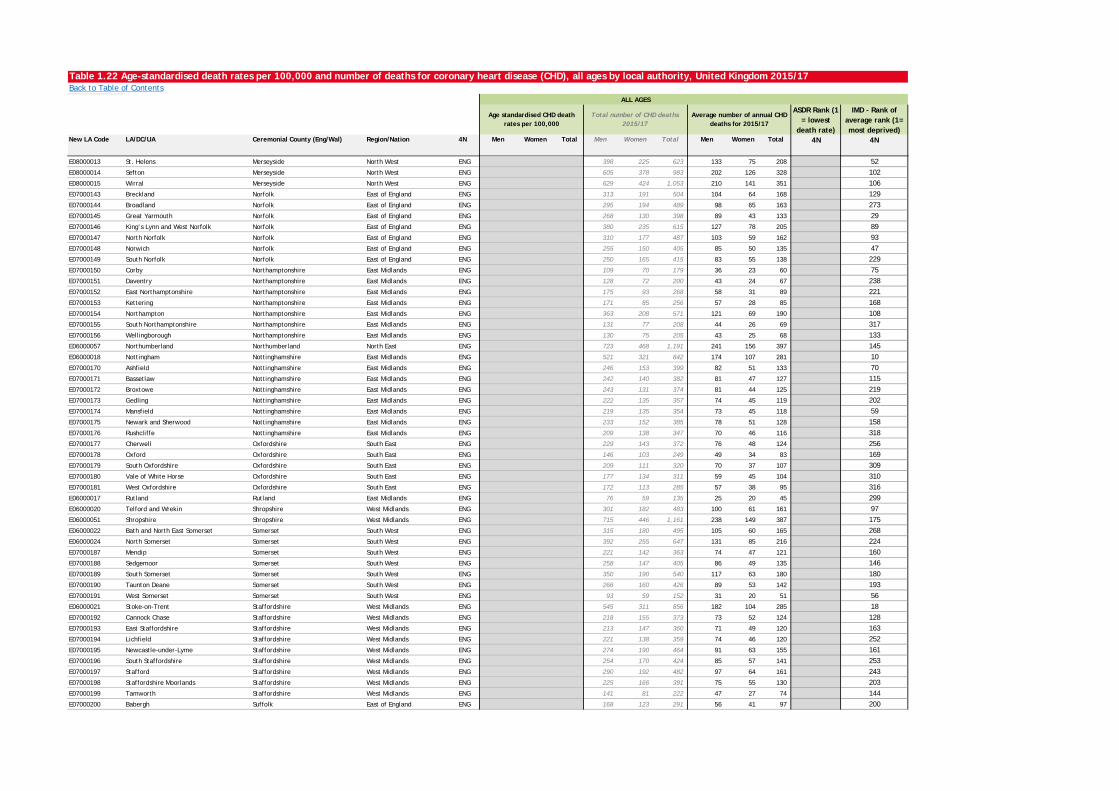
Table 1.22 Age-standardised death rates per 100,000 and number of deaths for coronary heart disease (CHD), all ages by local authority, United Kingdom 2015/17Back to Table of Contents
ASDR Rank (1 = lowest
death rate)
IMD - Rank of average rank (1= most deprived)
New LA Code LA/DC/UA Ceremonial County (Eng/Wal) Region/Nation 4N Men Women Total Men Women Total Men Women Total 4N 4N
ALL AGES
Age standardised CHD death rates per 100,000
Total number of CHD deaths 2015/17
Average number of annual CHD deaths for 2015/17
E08000013 St. Helens Merseyside North West ENG 398 225 623 133 75 208 52E08000014 Sefton Merseyside North West ENG 605 378 983 202 126 328 102E08000015 Wirral Merseyside North West ENG 629 424 1,053 210 141 351 106E07000143 Breckland Norfolk East of England ENG 313 191 504 104 64 168 129E07000144 Broadland Norfolk East of England ENG 295 194 489 98 65 163 273E07000145 Great Yarmouth Norfolk East of England ENG 268 130 398 89 43 133 29E07000146 King’s Lynn and West Norfolk Norfolk East of England ENG 380 235 615 127 78 205 89E07000147 North Norfolk Norfolk East of England ENG 310 177 487 103 59 162 93E07000148 Norwich Norfolk East of England ENG 255 150 405 85 50 135 47E07000149 South Norfolk Norfolk East of England ENG 250 165 415 83 55 138 229E07000150 Corby Northamptonshire East Midlands ENG 109 70 179 36 23 60 75E07000151 Daventry Northamptonshire East Midlands ENG 128 72 200 43 24 67 238E07000152 East Northamptonshire Northamptonshire East Midlands ENG 175 93 268 58 31 89 221E07000153 Kettering Northamptonshire East Midlands ENG 171 85 256 57 28 85 168E07000154 Northampton Northamptonshire East Midlands ENG 363 208 571 121 69 190 108E07000155 South Northamptonshire Northamptonshire East Midlands ENG 131 77 208 44 26 69 317E07000156 Wellingborough Northamptonshire East Midlands ENG 130 75 205 43 25 68 133E06000057 Northumberland Northumberland North East ENG 723 468 1,191 241 156 397 145E06000018 Nottingham Nottinghamshire East Midlands ENG 521 321 842 174 107 281 10E07000170 Ashfield Nottinghamshire East Midlands ENG 246 153 399 82 51 133 70E07000171 Bassetlaw Nottinghamshire East Midlands ENG 242 140 382 81 47 127 115E07000172 Broxtowe Nottinghamshire East Midlands ENG 243 131 374 81 44 125 219E07000173 Gedling Nottinghamshire East Midlands ENG 222 135 357 74 45 119 202E07000174 Mansfield Nottinghamshire East Midlands ENG 219 135 354 73 45 118 59E07000175 Newark and Sherwood Nottinghamshire East Midlands ENG 233 152 385 78 51 128 158E07000176 Rushcliffe Nottinghamshire East Midlands ENG 209 138 347 70 46 116 318E07000177 Cherwell Oxfordshire South East ENG 229 143 372 76 48 124 256E07000178 Oxford Oxfordshire South East ENG 146 103 249 49 34 83 169E07000179 South Oxfordshire Oxfordshire South East ENG 209 111 320 70 37 107 309E07000180 Vale of White Horse Oxfordshire South East ENG 177 134 311 59 45 104 310E07000181 West Oxfordshire Oxfordshire South East ENG 172 113 285 57 38 95 316E06000017 Rutland Rutland East Midlands ENG 76 59 135 25 20 45 299E06000020 Telford and Wrekin Shropshire West Midlands ENG 301 182 483 100 61 161 97E06000051 Shropshire Shropshire West Midlands ENG 715 446 1,161 238 149 387 175E06000022 Bath and North East Somerset Somerset South West ENG 315 180 495 105 60 165 268E06000024 North Somerset Somerset South West ENG 392 255 647 131 85 216 224E07000187 Mendip Somerset South West ENG 221 142 363 74 47 121 160E07000188 Sedgemoor Somerset South West ENG 258 147 405 86 49 135 146E07000189 South Somerset Somerset South West ENG 350 190 540 117 63 180 180E07000190 Taunton Deane Somerset South West ENG 266 160 426 89 53 142 193E07000191 West Somerset Somerset South West ENG 93 59 152 31 20 51 56E06000021 Stoke-on-Trent Staffordshire West Midlands ENG 545 311 856 182 104 285 18E07000192 Cannock Chase Staffordshire West Midlands ENG 218 155 373 73 52 124 128E07000193 East Staffordshire Staffordshire West Midlands ENG 213 147 360 71 49 120 163E07000194 Lichfield Staffordshire West Midlands ENG 221 138 359 74 46 120 252E07000195 Newcastle-under-Lyme Staffordshire West Midlands ENG 274 190 464 91 63 155 161E07000196 South Staffordshire Staffordshire West Midlands ENG 254 170 424 85 57 141 253E07000197 Stafford Staffordshire West Midlands ENG 290 192 482 97 64 161 243E07000198 Staffordshire Moorlands Staffordshire West Midlands ENG 225 166 391 75 55 130 203E07000199 Tamworth Staffordshire West Midlands ENG 141 81 222 47 27 74 144E07000200 Babergh Suffolk East of England ENG 168 123 291 56 41 97 200
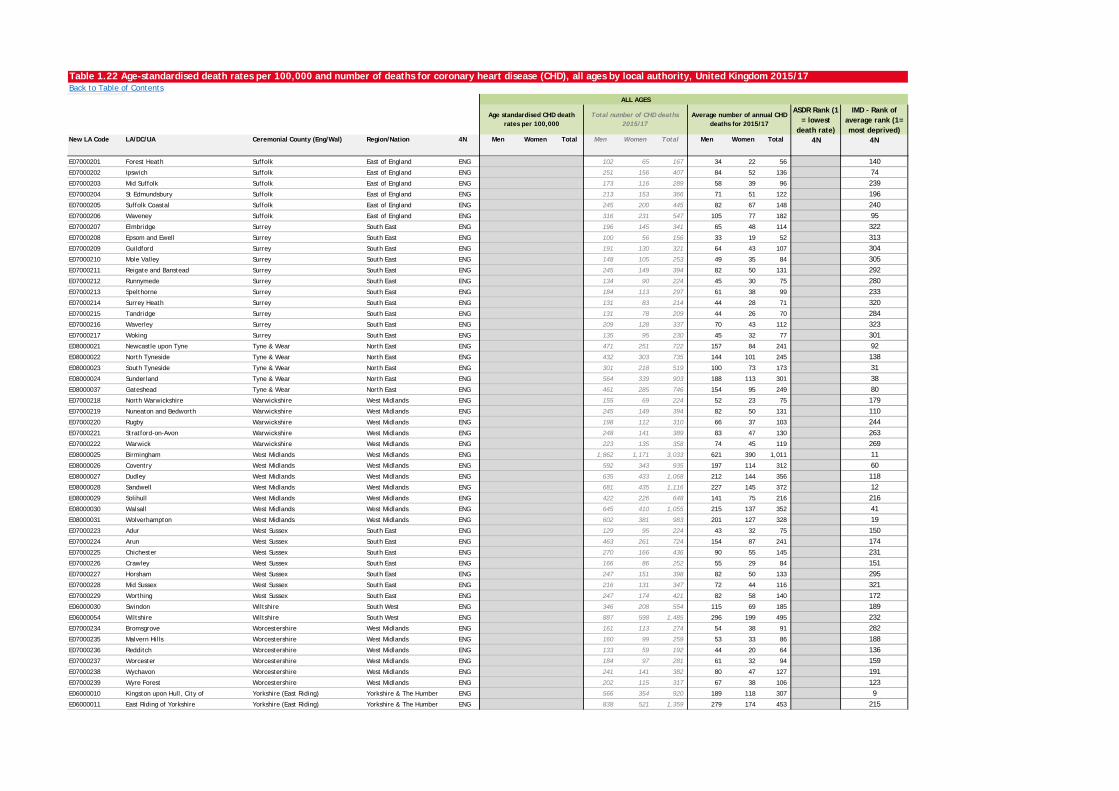
Table 1.22 Age-standardised death rates per 100,000 and number of deaths for coronary heart disease (CHD), all ages by local authority, United Kingdom 2015/17Back to Table of Contents
ASDR Rank (1 = lowest
death rate)
IMD - Rank of average rank (1= most deprived)
New LA Code LA/DC/UA Ceremonial County (Eng/Wal) Region/Nation 4N Men Women Total Men Women Total Men Women Total 4N 4N
ALL AGES
Age standardised CHD death rates per 100,000
Total number of CHD deaths 2015/17
Average number of annual CHD deaths for 2015/17
E07000201 Forest Heath Suffolk East of England ENG 102 65 167 34 22 56 140E07000202 Ipswich Suffolk East of England ENG 251 156 407 84 52 136 74E07000203 Mid Suffolk Suffolk East of England ENG 173 116 289 58 39 96 239E07000204 St Edmundsbury Suffolk East of England ENG 213 153 366 71 51 122 196E07000205 Suffolk Coastal Suffolk East of England ENG 245 200 445 82 67 148 240E07000206 Waveney Suffolk East of England ENG 316 231 547 105 77 182 95E07000207 Elmbridge Surrey South East ENG 196 145 341 65 48 114 322E07000208 Epsom and Ewell Surrey South East ENG 100 56 156 33 19 52 313E07000209 Guildford Surrey South East ENG 191 130 321 64 43 107 304E07000210 Mole Valley Surrey South East ENG 148 105 253 49 35 84 305E07000211 Reigate and Banstead Surrey South East ENG 245 149 394 82 50 131 292E07000212 Runnymede Surrey South East ENG 134 90 224 45 30 75 280E07000213 Spelthorne Surrey South East ENG 184 113 297 61 38 99 233E07000214 Surrey Heath Surrey South East ENG 131 83 214 44 28 71 320E07000215 Tandridge Surrey South East ENG 131 78 209 44 26 70 284E07000216 Waverley Surrey South East ENG 209 128 337 70 43 112 323E07000217 Woking Surrey South East ENG 135 95 230 45 32 77 301E08000021 Newcastle upon Tyne Tyne & Wear North East ENG 471 251 722 157 84 241 92E08000022 North Tyneside Tyne & Wear North East ENG 432 303 735 144 101 245 138E08000023 South Tyneside Tyne & Wear North East ENG 301 218 519 100 73 173 31E08000024 Sunderland Tyne & Wear North East ENG 564 339 903 188 113 301 38E08000037 Gateshead Tyne & Wear North East ENG 461 285 746 154 95 249 80E07000218 North Warwickshire Warwickshire West Midlands ENG 155 69 224 52 23 75 179E07000219 Nuneaton and Bedworth Warwickshire West Midlands ENG 245 149 394 82 50 131 110E07000220 Rugby Warwickshire West Midlands ENG 198 112 310 66 37 103 244E07000221 Stratford-on-Avon Warwickshire West Midlands ENG 248 141 389 83 47 130 263E07000222 Warwick Warwickshire West Midlands ENG 223 135 358 74 45 119 269E08000025 Birmingham West Midlands West Midlands ENG 1,862 1,171 3,033 621 390 1,011 11E08000026 Coventry West Midlands West Midlands ENG 592 343 935 197 114 312 60E08000027 Dudley West Midlands West Midlands ENG 635 433 1,068 212 144 356 118E08000028 Sandwell West Midlands West Midlands ENG 681 435 1,116 227 145 372 12E08000029 Solihull West Midlands West Midlands ENG 422 226 648 141 75 216 216E08000030 Walsall West Midlands West Midlands ENG 645 410 1,055 215 137 352 41E08000031 Wolverhampton West Midlands West Midlands ENG 602 381 983 201 127 328 19E07000223 Adur West Sussex South East ENG 129 95 224 43 32 75 150E07000224 Arun West Sussex South East ENG 463 261 724 154 87 241 174E07000225 Chichester West Sussex South East ENG 270 166 436 90 55 145 231E07000226 Crawley West Sussex South East ENG 166 86 252 55 29 84 151E07000227 Horsham West Sussex South East ENG 247 151 398 82 50 133 295E07000228 Mid Sussex West Sussex South East ENG 216 131 347 72 44 116 321E07000229 Worthing West Sussex South East ENG 247 174 421 82 58 140 172E06000030 Swindon Wiltshire South West ENG 346 208 554 115 69 185 189E06000054 Wiltshire Wiltshire South West ENG 887 598 1,485 296 199 495 232E07000234 Bromsgrove Worcestershire West Midlands ENG 161 113 274 54 38 91 282E07000235 Malvern Hills Worcestershire West Midlands ENG 160 99 259 53 33 86 188E07000236 Redditch Worcestershire West Midlands ENG 133 59 192 44 20 64 136E07000237 Worcester Worcestershire West Midlands ENG 184 97 281 61 32 94 159E07000238 Wychavon Worcestershire West Midlands ENG 241 141 382 80 47 127 191E07000239 Wyre Forest Worcestershire West Midlands ENG 202 115 317 67 38 106 123E06000010 Kingston upon Hull, City of Yorkshire (East Riding) Yorkshire & The Humber ENG 566 354 920 189 118 307 9E06000011 East Riding of Yorkshire Yorkshire (East Riding) Yorkshire & The Humber ENG 838 521 1,359 279 174 453 215
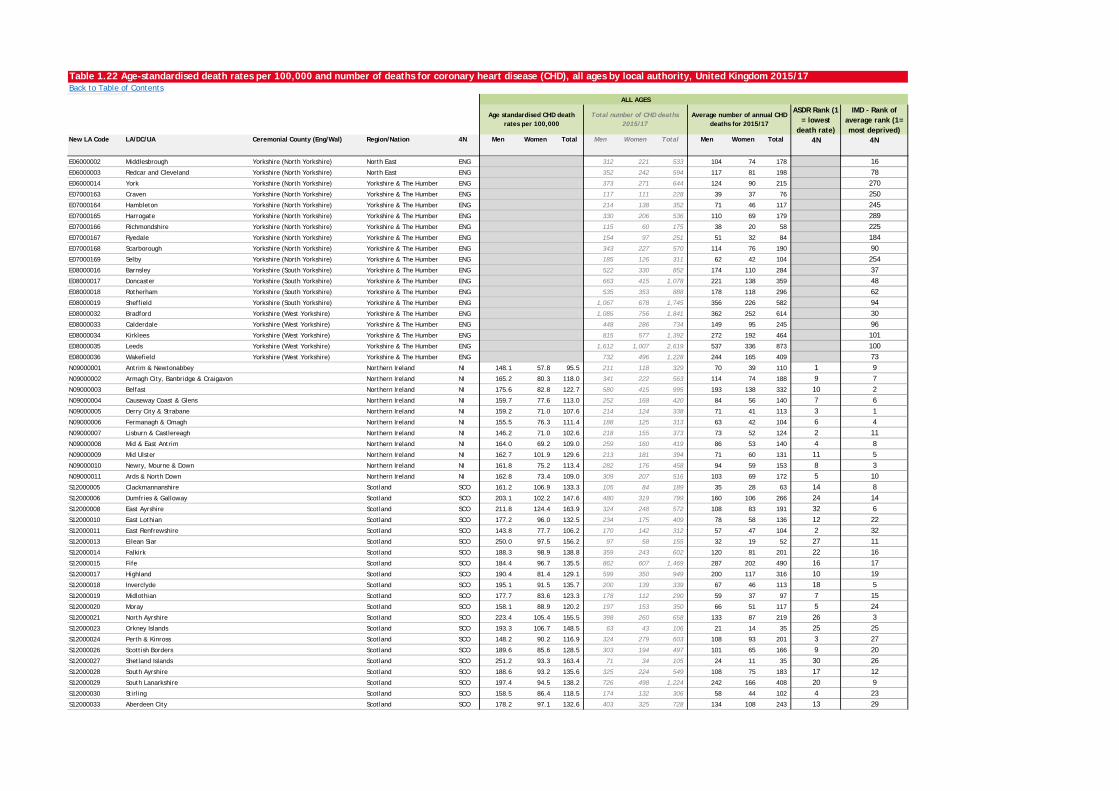
Table 1.22 Age-standardised death rates per 100,000 and number of deaths for coronary heart disease (CHD), all ages by local authority, United Kingdom 2015/17Back to Table of Contents
ASDR Rank (1 = lowest
death rate)
IMD - Rank of average rank (1= most deprived)
New LA Code LA/DC/UA Ceremonial County (Eng/Wal) Region/Nation 4N Men Women Total Men Women Total Men Women Total 4N 4N
ALL AGES
Age standardised CHD death rates per 100,000
Total number of CHD deaths 2015/17
Average number of annual CHD deaths for 2015/17
E06000002 Middlesbrough Yorkshire (North Yorkshire) North East ENG 312 221 533 104 74 178 16E06000003 Redcar and Cleveland Yorkshire (North Yorkshire) North East ENG 352 242 594 117 81 198 78E06000014 York Yorkshire (North Yorkshire) Yorkshire & The Humber ENG 373 271 644 124 90 215 270E07000163 Craven Yorkshire (North Yorkshire) Yorkshire & The Humber ENG 117 111 228 39 37 76 250E07000164 Hambleton Yorkshire (North Yorkshire) Yorkshire & The Humber ENG 214 138 352 71 46 117 245E07000165 Harrogate Yorkshire (North Yorkshire) Yorkshire & The Humber ENG 330 206 536 110 69 179 289E07000166 Richmondshire Yorkshire (North Yorkshire) Yorkshire & The Humber ENG 115 60 175 38 20 58 225E07000167 Ryedale Yorkshire (North Yorkshire) Yorkshire & The Humber ENG 154 97 251 51 32 84 184E07000168 Scarborough Yorkshire (North Yorkshire) Yorkshire & The Humber ENG 343 227 570 114 76 190 90E07000169 Selby Yorkshire (North Yorkshire) Yorkshire & The Humber ENG 185 126 311 62 42 104 254E08000016 Barnsley Yorkshire (South Yorkshire) Yorkshire & The Humber ENG 522 330 852 174 110 284 37E08000017 Doncaster Yorkshire (South Yorkshire) Yorkshire & The Humber ENG 663 415 1,078 221 138 359 48E08000018 Rotherham Yorkshire (South Yorkshire) Yorkshire & The Humber ENG 535 353 888 178 118 296 62E08000019 Sheffield Yorkshire (South Yorkshire) Yorkshire & The Humber ENG 1,067 678 1,745 356 226 582 94E08000032 Bradford Yorkshire (West Yorkshire) Yorkshire & The Humber ENG 1,085 756 1,841 362 252 614 30E08000033 Calderdale Yorkshire (West Yorkshire) Yorkshire & The Humber ENG 448 286 734 149 95 245 96E08000034 Kirklees Yorkshire (West Yorkshire) Yorkshire & The Humber ENG 815 577 1,392 272 192 464 101E08000035 Leeds Yorkshire (West Yorkshire) Yorkshire & The Humber ENG 1,612 1,007 2,619 537 336 873 100E08000036 Wakefield Yorkshire (West Yorkshire) Yorkshire & The Humber ENG 732 496 1,228 244 165 409 73N09000001 Antrim & Newtonabbey Northern Ireland NI 148.1 57.8 95.5 211 118 329 70 39 110 1 9N09000002 Armagh City, Banbridge & Craigavon Northern Ireland NI 165.2 80.3 118.0 341 222 563 114 74 188 9 7N09000003 Belfast Northern Ireland NI 175.6 82.8 122.7 580 415 995 193 138 332 10 2N09000004 Causeway Coast & Glens Northern Ireland NI 159.7 77.6 113.0 252 168 420 84 56 140 7 6N09000005 Derry City & Strabane Northern Ireland NI 159.2 71.0 107.6 214 124 338 71 41 113 3 1N09000006 Fermanagh & Omagh Northern Ireland NI 155.5 76.3 111.4 188 125 313 63 42 104 6 4N09000007 Lisburn & Castlereagh Northern Ireland NI 146.2 71.0 102.6 218 155 373 73 52 124 2 11N09000008 Mid & East Antrim Northern Ireland NI 164.0 69.2 109.0 259 160 419 86 53 140 4 8N09000009 Mid Ulster Northern Ireland NI 162.7 101.9 129.6 213 181 394 71 60 131 11 5N09000010 Newry, Mourne & Down Northern Ireland NI 161.8 75.2 113.4 282 176 458 94 59 153 8 3N09000011 Ards & North Down Northern Ireland NI 162.8 73.4 109.0 309 207 516 103 69 172 5 10S12000005 Clackmannanshire Scotland SCO 161.2 106.9 133.3 105 84 189 35 28 63 14 8S12000006 Dumfries & Galloway Scotland SCO 203.1 102.2 147.6 480 319 799 160 106 266 24 14S12000008 East Ayrshire Scotland SCO 211.8 124.4 163.9 324 248 572 108 83 191 32 6S12000010 East Lothian Scotland SCO 177.2 96.0 132.5 234 175 409 78 58 136 12 22S12000011 East Renfrewshire Scotland SCO 143.8 77.7 106.2 170 142 312 57 47 104 2 32S12000013 Eilean Siar Scotland SCO 250.0 97.5 156.2 97 58 155 32 19 52 27 11S12000014 Falkirk Scotland SCO 188.3 98.9 138.8 359 243 602 120 81 201 22 16S12000015 Fife Scotland SCO 184.4 96.7 135.5 862 607 1,469 287 202 490 16 17S12000017 Highland Scotland SCO 190.4 81.4 129.1 599 350 949 200 117 316 10 19S12000018 Inverclyde Scotland SCO 195.1 91.5 135.7 200 139 339 67 46 113 18 5S12000019 Midlothian Scotland SCO 177.7 83.6 123.3 178 112 290 59 37 97 7 15S12000020 Moray Scotland SCO 158.1 88.9 120.2 197 153 350 66 51 117 5 24S12000021 North Ayrshire Scotland SCO 223.4 105.4 155.5 398 260 658 133 87 219 26 3S12000023 Orkney Islands Scotland SCO 193.3 106.7 148.5 63 43 106 21 14 35 25 25S12000024 Perth & Kinross Scotland SCO 148.2 90.2 116.9 324 279 603 108 93 201 3 27S12000026 Scottish Borders Scotland SCO 189.6 85.6 128.5 303 194 497 101 65 166 9 20S12000027 Shetland Islands Scotland SCO 251.2 93.3 163.4 71 34 105 24 11 35 30 26S12000028 South Ayrshire Scotland SCO 188.6 93.2 135.6 325 224 549 108 75 183 17 12S12000029 South Lanarkshire Scotland SCO 197.4 94.5 138.2 726 498 1,224 242 166 408 20 9S12000030 Stirling Scotland SCO 158.5 86.4 118.5 174 132 306 58 44 102 4 23S12000033 Aberdeen City Scotland SCO 178.2 97.1 132.6 403 325 728 134 108 243 13 29
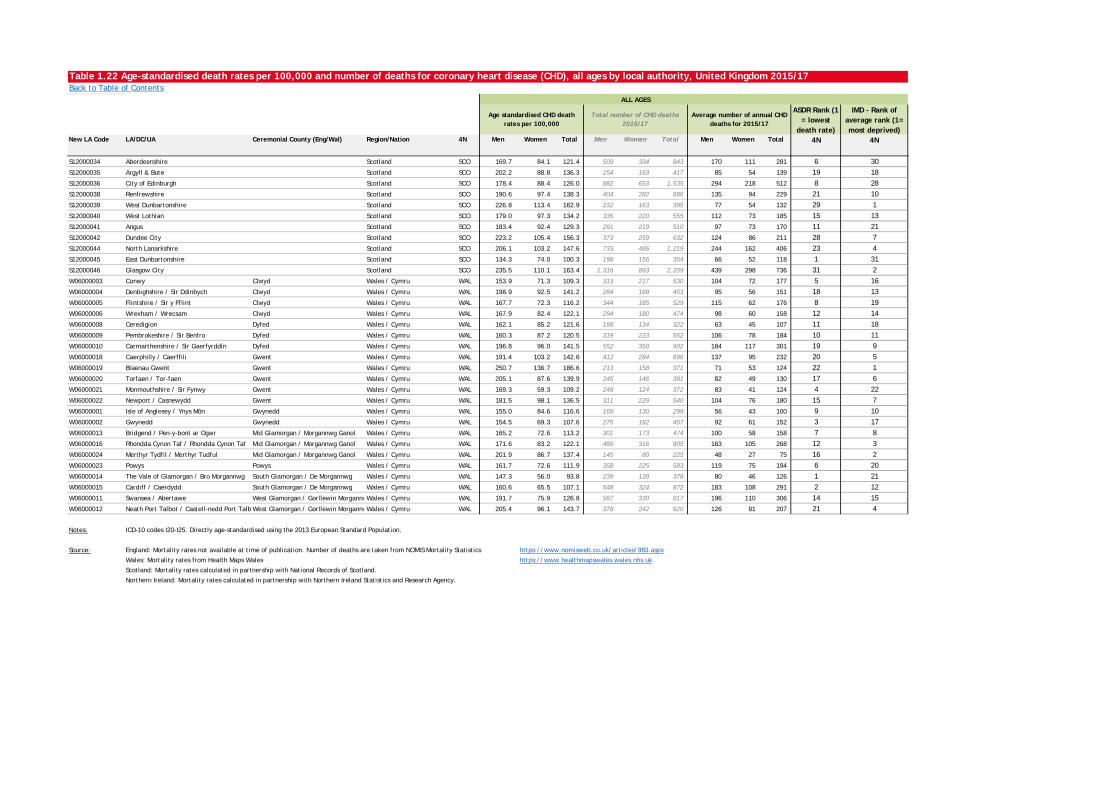
Table 1.22 Age-standardised death rates per 100,000 and number of deaths for coronary heart disease (CHD), all ages by local authority, United Kingdom 2015/17Back to Table of Contents
ASDR Rank (1 = lowest
death rate)
IMD - Rank of average rank (1= most deprived)
New LA Code LA/DC/UA Ceremonial County (Eng/Wal) Region/Nation 4N Men Women Total Men Women Total Men Women Total 4N 4N
ALL AGES
Age standardised CHD death rates per 100,000
Total number of CHD deaths 2015/17
Average number of annual CHD deaths for 2015/17
S12000034 Aberdeenshire Scotland SCO 169.7 84.1 121.4 509 334 843 170 111 281 6 30S12000035 Argyll & Bute Scotland SCO 202.2 88.8 136.3 254 163 417 85 54 139 19 18S12000036 City of Edinburgh Scotland SCO 178.4 88.4 126.0 882 653 1,535 294 218 512 8 28S12000038 Renfrewshire Scotland SCO 190.6 97.4 138.3 404 282 686 135 94 229 21 10S12000039 West Dunbartonshire Scotland SCO 226.8 113.4 162.9 232 163 395 77 54 132 29 1S12000040 West Lothian Scotland SCO 179.0 97.3 134.2 335 220 555 112 73 185 15 13S12000041 Angus Scotland SCO 183.4 92.4 129.3 291 219 510 97 73 170 11 21S12000042 Dundee City Scotland SCO 223.2 105.4 156.3 373 259 632 124 86 211 28 7S12000044 North Lanarkshire Scotland SCO 206.1 103.2 147.6 733 486 1,219 244 162 406 23 4S12000045 East Dunbartonshire Scotland SCO 134.3 74.0 100.3 198 156 354 66 52 118 1 31S12000046 Glasgow City Scotland SCO 235.5 110.1 163.4 1,316 893 2,209 439 298 736 31 2W06000003 Conwy Clwyd Wales / Cymru WAL 153.9 71.3 109.3 313 217 530 104 72 177 5 16W06000004 Denbighshire / Sir Ddinbych Clwyd Wales / Cymru WAL 198.9 92.5 141.2 284 169 453 95 56 151 18 13W06000005 Flintshire / Sir y Fflint Clwyd Wales / Cymru WAL 167.7 72.3 116.2 344 185 529 115 62 176 8 19W06000006 Wrexham / Wrecsam Clwyd Wales / Cymru WAL 167.9 82.4 122.1 294 180 474 98 60 158 12 14W06000008 Ceredigion Dyfed Wales / Cymru WAL 162.1 85.2 121.6 188 134 322 63 45 107 11 18W06000009 Pembrokeshire / Sir Benfro Dyfed Wales / Cymru WAL 160.3 87.2 120.5 319 233 552 106 78 184 10 11W06000010 Carmarthenshire / Sir Gaerfyrddin Dyfed Wales / Cymru WAL 196.8 96.0 141.5 552 350 902 184 117 301 19 9W06000018 Caerphilly / Caerffili Gwent Wales / Cymru WAL 191.4 103.2 142.6 412 284 696 137 95 232 20 5W06000019 Blaenau Gwent Gwent Wales / Cymru WAL 250.7 136.7 186.6 213 158 371 71 53 124 22 1W06000020 Torfaen / Tor-faen Gwent Wales / Cymru WAL 205.1 87.6 139.9 245 146 391 82 49 130 17 6W06000021 Monmouthshire / Sir Fynwy Gwent Wales / Cymru WAL 169.3 59.3 109.2 248 124 372 83 41 124 4 22W06000022 Newport / Casnewydd Gwent Wales / Cymru WAL 181.5 98.1 136.5 311 229 540 104 76 180 15 7W06000001 Isle of Anglesey / Ynys Môn Gwynedd Wales / Cymru WAL 155.0 84.6 116.6 169 130 299 56 43 100 9 10W06000002 Gwynedd Gwynedd Wales / Cymru WAL 154.5 69.3 107.6 275 182 457 92 61 152 3 17W06000013 Bridgend / Pen-y-bont ar Ogwr Mid Glamorgan / Morgannwg Ganol Wales / Cymru WAL 165.2 72.6 113.2 301 173 474 100 58 158 7 8W06000016 Rhondda Cynon Taf / Rhondda Cynon Taf Mid Glamorgan / Morgannwg Ganol Wales / Cymru WAL 171.6 83.2 122.1 489 316 805 163 105 268 12 3W06000024 Merthyr Tydfil / Merthyr Tudful Mid Glamorgan / Morgannwg Ganol Wales / Cymru WAL 201.9 86.7 137.4 145 80 225 48 27 75 16 2W06000023 Powys Powys Wales / Cymru WAL 161.7 72.6 111.9 358 225 583 119 75 194 6 20W06000014 The Vale of Glamorgan / Bro Morgannwg South Glamorgan / De Morgannwg Wales / Cymru WAL 147.3 56.0 93.8 239 139 378 80 46 126 1 21W06000015 Cardiff / Caerdydd South Glamorgan / De Morgannwg Wales / Cymru WAL 160.6 65.5 107.1 548 324 872 183 108 291 2 12W06000011 Swansea / Abertawe West Glamorgan / Gorllewin MorgannwWales / Cymru WAL 191.7 75.9 126.8 587 330 917 196 110 306 14 15W06000012 Neath Port Talbot / Castell-nedd Port Talb West Glamorgan / Gorllewin MorgannwWales / Cymru WAL 205.4 96.1 143.7 378 242 620 126 81 207 21 4
Notes: ICD-10 codes I20-I25. Directly age-standardised using the 2013 European Standard Population.
Source: England: Mortality rates not available at time of publication. Number of deaths are taken from NOMIS Mortality Statistics https://www.nomisweb.co.uk/articles/983.aspx
Wales: Mortality rates from Health Maps Wales https://www.healthmapswales.wales.nhs.uk
Scotland: Mortality rates calculated in partnership with National Records of Scotland.
Northern Ireland: Mortality rates calculated in partnership with Northern Ireland Statistics and Research Agency.
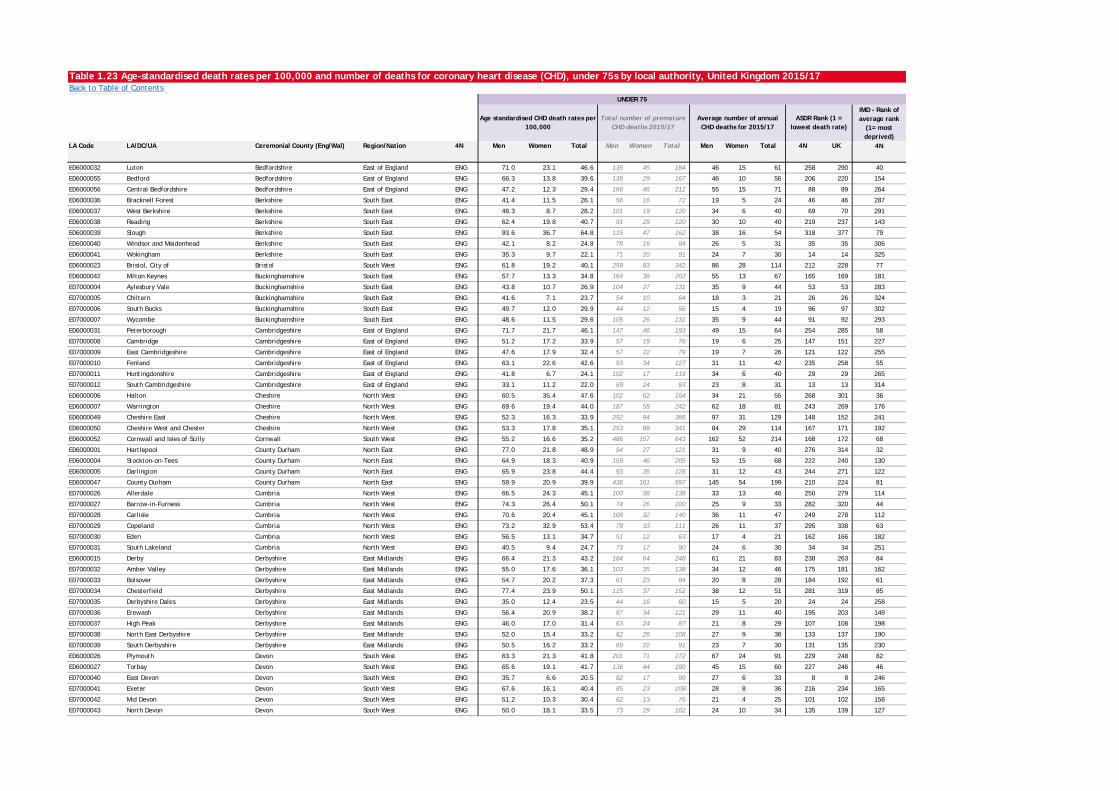
Table 1.23 Age-standardised death rates per 100,000 and number of deaths for coronary heart disease (CHD), under 75s by local authority, United Kingdom 2015/17Back to Table of Contents
IMD - Rank of average rank
(1= most deprived)
LA Code LA/DC/UA Ceremonial County (Eng/Wal) Region/Nation 4N Men Women Total Men Women Total Men Women Total 4N UK 4N
E06000032 Luton Bedfordshire East of England ENG 71.0 23.1 46.6 139 45 184 46 15 61 258 290 40
E06000055 Bedford Bedfordshire East of England ENG 66.3 13.8 39.6 138 29 167 46 10 56 206 220 154
E06000056 Central Bedfordshire Bedfordshire East of England ENG 47.2 12.3 29.4 166 46 212 55 15 71 88 89 264
E06000036 Bracknell Forest Berkshire South East ENG 41.4 11.5 26.1 56 16 72 19 5 24 46 46 287
E06000037 West Berkshire Berkshire South East ENG 48.3 8.7 28.2 101 19 120 34 6 40 69 70 291
E06000038 Reading Berkshire South East ENG 62.4 19.8 40.7 91 29 120 30 10 40 219 237 143
E06000039 Slough Berkshire South East ENG 93.6 36.7 64.8 115 47 162 38 16 54 318 377 79
E06000040 Windsor and Maidenhead Berkshire South East ENG 42.1 8.2 24.8 78 16 94 26 5 31 35 35 306
E06000041 Wokingham Berkshire South East ENG 35.3 9.7 22.1 71 20 91 24 7 30 14 14 325
E06000023 Bristol, City of Bristol South West ENG 61.8 19.2 40.1 259 83 342 86 28 114 212 228 77
E06000042 Milton Keynes Buckinghamshire South East ENG 57.7 13.3 34.8 164 38 202 55 13 67 165 169 181
E07000004 Aylesbury Vale Buckinghamshire South East ENG 43.8 10.7 26.9 104 27 131 35 9 44 53 53 283
E07000005 Chiltern Buckinghamshire South East ENG 41.6 7.1 23.7 54 10 64 18 3 21 26 26 324
E07000006 South Bucks Buckinghamshire South East ENG 49.7 12.0 29.9 44 12 56 15 4 19 96 97 302
E07000007 Wycombe Buckinghamshire South East ENG 48.6 11.5 29.6 105 26 131 35 9 44 91 92 293
E06000031 Peterborough Cambridgeshire East of England ENG 71.7 21.7 46.1 147 46 193 49 15 64 254 285 58
E07000008 Cambridge Cambridgeshire East of England ENG 51.2 17.2 33.9 57 19 76 19 6 25 147 151 227
E07000009 East Cambridgeshire Cambridgeshire East of England ENG 47.6 17.9 32.4 57 22 79 19 7 26 121 122 255
E07000010 Fenland Cambridgeshire East of England ENG 63.1 22.6 42.6 93 34 127 31 11 42 235 258 55
E07000011 Huntingdonshire Cambridgeshire East of England ENG 41.8 6.7 24.1 102 17 119 34 6 40 29 29 265
E07000012 South Cambridgeshire Cambridgeshire East of England ENG 33.1 11.2 22.0 69 24 93 23 8 31 13 13 314
E06000006 Halton Cheshire North West ENG 60.5 35.4 47.6 102 62 164 34 21 55 268 301 36
E06000007 Warrington Cheshire North West ENG 69.6 19.4 44.0 187 55 242 62 18 81 243 269 176
E06000049 Cheshire East Cheshire North West ENG 52.3 16.3 33.9 292 94 386 97 31 129 148 152 241
E06000050 Cheshire West and Chester Cheshire North West ENG 53.3 17.8 35.1 253 88 341 84 29 114 167 171 192
E06000052 Cornwall and Isles of Scilly Cornwall South West ENG 55.2 16.6 35.2 486 157 643 162 52 214 168 172 68
E06000001 Hartlepool County Durham North East ENG 77.0 21.8 48.9 94 27 121 31 9 40 276 314 32
E06000004 Stockton-on-Tees County Durham North East ENG 64.9 18.3 40.9 159 46 205 53 15 68 222 240 130
E06000005 Darlington County Durham North East ENG 65.9 23.8 44.4 93 35 128 31 12 43 244 271 122
E06000047 County Durham County Durham North East ENG 59.9 20.9 39.9 436 161 597 145 54 199 210 224 81
E07000026 Allerdale Cumbria North West ENG 66.5 24.3 45.1 100 38 138 33 13 46 250 279 114
E07000027 Barrow-in-Furness Cumbria North West ENG 74.3 26.4 50.1 74 26 100 25 9 33 282 320 44
E07000028 Carlisle Cumbria North West ENG 70.6 20.4 45.1 108 32 140 36 11 47 249 278 112
E07000029 Copeland Cumbria North West ENG 73.2 32.9 53.4 78 33 111 26 11 37 295 338 63
E07000030 Eden Cumbria North West ENG 56.5 13.1 34.7 51 12 63 17 4 21 162 166 182
E07000031 South Lakeland Cumbria North West ENG 40.5 9.4 24.7 73 17 90 24 6 30 34 34 251
E06000015 Derby Derbyshire East Midlands ENG 66.4 21.3 43.2 184 64 248 61 21 83 238 263 84
E07000032 Amber Valley Derbyshire East Midlands ENG 55.0 17.6 36.1 103 35 138 34 12 46 175 181 162
E07000033 Bolsover Derbyshire East Midlands ENG 54.7 20.2 37.3 61 23 84 20 8 28 184 192 61
E07000034 Chesterfield Derbyshire East Midlands ENG 77.4 23.9 50.1 115 37 152 38 12 51 281 319 85
E07000035 Derbyshire Dales Derbyshire East Midlands ENG 35.0 12.4 23.5 44 16 60 15 5 20 24 24 258
E07000036 Erewash Derbyshire East Midlands ENG 56.4 20.9 38.2 87 34 121 29 11 40 195 203 149
E07000037 High Peak Derbyshire East Midlands ENG 46.0 17.0 31.4 63 24 87 21 8 29 107 108 198
E07000038 North East Derbyshire Derbyshire East Midlands ENG 52.0 15.4 33.2 82 26 108 27 9 36 133 137 190
E07000039 South Derbyshire Derbyshire East Midlands ENG 50.5 16.2 33.2 69 22 91 23 7 30 131 135 230
E06000026 Plymouth Devon South West ENG 63.3 21.3 41.8 201 71 272 67 24 91 229 248 82
E06000027 Torbay Devon South West ENG 65.6 19.1 41.7 136 44 180 45 15 60 227 246 46
E07000040 East Devon Devon South West ENG 35.7 6.6 20.5 82 17 99 27 6 33 8 8 246
E07000041 Exeter Devon South West ENG 67.6 16.1 40.4 85 23 108 28 8 36 216 234 165
E07000042 Mid Devon Devon South West ENG 51.2 10.3 30.4 62 13 75 21 4 25 101 102 156
E07000043 North Devon Devon South West ENG 50.0 18.1 33.5 73 29 102 24 10 34 135 139 127
UNDER 75
Age standardised CHD death rates per 100,000
Total number of premature CHD deaths 2015/17
Average number of annual CHD deaths for 2015/17
ASDR Rank (1 = lowest death rate)
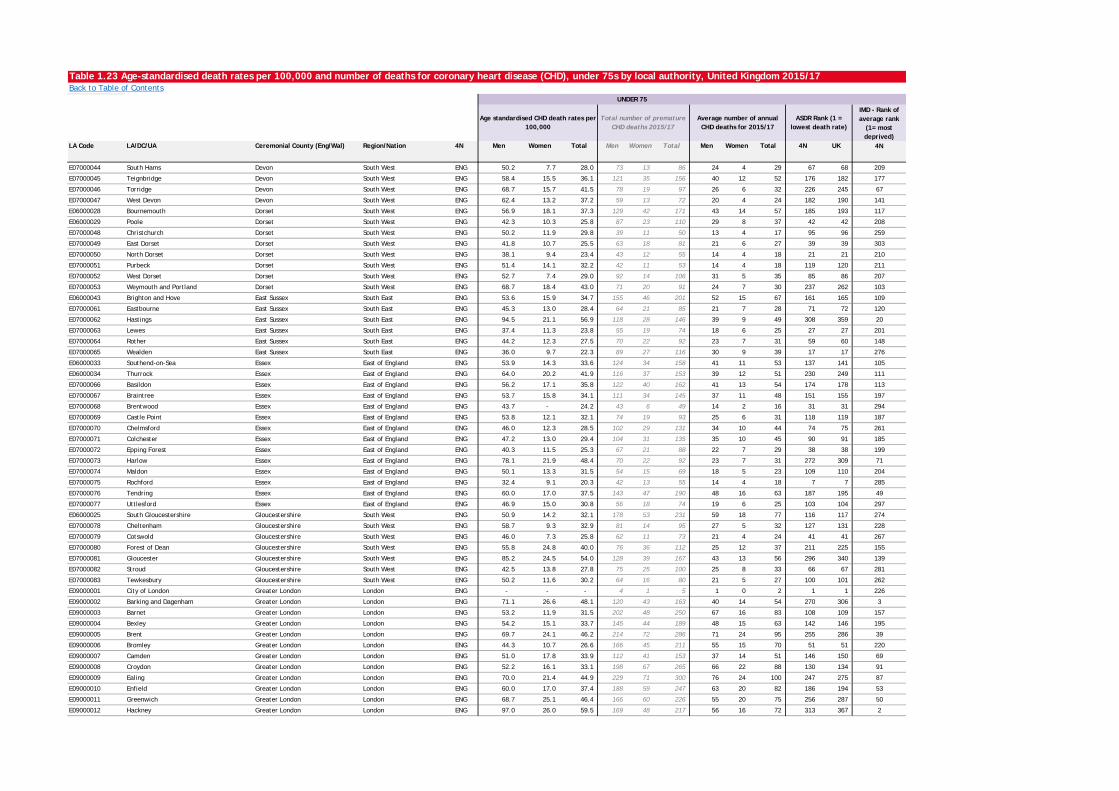
Table 1.23 Age-standardised death rates per 100,000 and number of deaths for coronary heart disease (CHD), under 75s by local authority, United Kingdom 2015/17Back to Table of Contents
IMD - Rank of average rank
(1= most deprived)
LA Code LA/DC/UA Ceremonial County (Eng/Wal) Region/Nation 4N Men Women Total Men Women Total Men Women Total 4N UK 4N
UNDER 75
Age standardised CHD death rates per 100,000
Total number of premature CHD deaths 2015/17
Average number of annual CHD deaths for 2015/17
ASDR Rank (1 = lowest death rate)
E07000044 South Hams Devon South West ENG 50.2 7.7 28.0 73 13 86 24 4 29 67 68 209
E07000045 Teignbridge Devon South West ENG 58.4 15.5 36.1 121 35 156 40 12 52 176 182 177
E07000046 Torridge Devon South West ENG 68.7 15.7 41.5 78 19 97 26 6 32 226 245 67
E07000047 West Devon Devon South West ENG 62.4 13.2 37.2 59 13 72 20 4 24 182 190 141
E06000028 Bournemouth Dorset South West ENG 56.9 18.1 37.3 129 42 171 43 14 57 185 193 117
E06000029 Poole Dorset South West ENG 42.3 10.3 25.8 87 23 110 29 8 37 42 42 208
E07000048 Christchurch Dorset South West ENG 50.2 11.9 29.8 39 11 50 13 4 17 95 96 259
E07000049 East Dorset Dorset South West ENG 41.8 10.7 25.5 63 18 81 21 6 27 39 39 303
E07000050 North Dorset Dorset South West ENG 38.1 9.4 23.4 43 12 55 14 4 18 21 21 210
E07000051 Purbeck Dorset South West ENG 51.4 14.1 32.2 42 11 53 14 4 18 119 120 211
E07000052 West Dorset Dorset South West ENG 52.7 7.4 29.0 92 14 106 31 5 35 85 86 207
E07000053 Weymouth and Portland Dorset South West ENG 68.7 18.4 43.0 71 20 91 24 7 30 237 262 103
E06000043 Brighton and Hove East Sussex South East ENG 53.6 15.9 34.7 155 46 201 52 15 67 161 165 109
E07000061 Eastbourne East Sussex South East ENG 45.3 13.0 28.4 64 21 85 21 7 28 71 72 120
E07000062 Hastings East Sussex South East ENG 94.5 21.1 56.9 118 28 146 39 9 49 308 359 20
E07000063 Lewes East Sussex South East ENG 37.4 11.3 23.8 55 19 74 18 6 25 27 27 201
E07000064 Rother East Sussex South East ENG 44.2 12.3 27.5 70 22 92 23 7 31 59 60 148
E07000065 Wealden East Sussex South East ENG 36.0 9.7 22.3 89 27 116 30 9 39 17 17 276
E06000033 Southend-on-Sea Essex East of England ENG 53.9 14.3 33.6 124 34 158 41 11 53 137 141 105
E06000034 Thurrock Essex East of England ENG 64.0 20.2 41.9 116 37 153 39 12 51 230 249 111
E07000066 Basildon Essex East of England ENG 56.2 17.1 35.8 122 40 162 41 13 54 174 178 113
E07000067 Braintree Essex East of England ENG 53.7 15.8 34.1 111 34 145 37 11 48 151 155 197
E07000068 Brentwood Essex East of England ENG 43.7 - 24.2 43 6 49 14 2 16 31 31 294
E07000069 Castle Point Essex East of England ENG 53.8 12.1 32.1 74 19 93 25 6 31 118 119 187
E07000070 Chelmsford Essex East of England ENG 46.0 12.3 28.5 102 29 131 34 10 44 74 75 261
E07000071 Colchester Essex East of England ENG 47.2 13.0 29.4 104 31 135 35 10 45 90 91 185
E07000072 Epping Forest Essex East of England ENG 40.3 11.5 25.3 67 21 88 22 7 29 38 38 199
E07000073 Harlow Essex East of England ENG 78.1 21.9 48.4 70 22 92 23 7 31 272 309 71
E07000074 Maldon Essex East of England ENG 50.1 13.3 31.5 54 15 69 18 5 23 109 110 204
E07000075 Rochford Essex East of England ENG 32.4 9.1 20.3 42 13 55 14 4 18 7 7 285
E07000076 Tendring Essex East of England ENG 60.0 17.0 37.5 143 47 190 48 16 63 187 195 49
E07000077 Uttlesford Essex East of England ENG 46.9 15.0 30.8 56 18 74 19 6 25 103 104 297
E06000025 South Gloucestershire Gloucestershire South West ENG 50.9 14.2 32.1 178 53 231 59 18 77 116 117 274
E07000078 Cheltenham Gloucestershire South West ENG 58.7 9.3 32.9 81 14 95 27 5 32 127 131 228
E07000079 Cotswold Gloucestershire South West ENG 46.0 7.3 25.8 62 11 73 21 4 24 41 41 267
E07000080 Forest of Dean Gloucestershire South West ENG 55.8 24.8 40.0 76 36 112 25 12 37 211 225 155
E07000081 Gloucester Gloucestershire South West ENG 85.2 24.5 54.0 128 39 167 43 13 56 296 340 139
E07000082 Stroud Gloucestershire South West ENG 42.5 13.8 27.8 75 25 100 25 8 33 66 67 281
E07000083 Tewkesbury Gloucestershire South West ENG 50.2 11.6 30.2 64 16 80 21 5 27 100 101 262
E09000001 City of London Greater London London ENG - - - 4 1 5 1 0 2 1 1 226
E09000002 Barking and Dagenham Greater London London ENG 71.1 26.6 48.1 120 43 163 40 14 54 270 306 3
E09000003 Barnet Greater London London ENG 53.2 11.9 31.5 202 48 250 67 16 83 108 109 157
E09000004 Bexley Greater London London ENG 54.2 15.1 33.7 145 44 189 48 15 63 142 146 195
E09000005 Brent Greater London London ENG 69.7 24.1 46.2 214 72 286 71 24 95 255 286 39
E09000006 Bromley Greater London London ENG 44.3 10.7 26.6 166 45 211 55 15 70 51 51 220
E09000007 Camden Greater London London ENG 51.0 17.8 33.9 112 41 153 37 14 51 146 150 69
E09000008 Croydon Greater London London ENG 52.2 16.1 33.1 198 67 265 66 22 88 130 134 91
E09000009 Ealing Greater London London ENG 70.0 21.4 44.9 229 71 300 76 24 100 247 275 87
E09000010 Enfield Greater London London ENG 60.0 17.0 37.4 188 59 247 63 20 82 186 194 53
E09000011 Greenwich Greater London London ENG 68.7 25.1 46.4 166 60 226 55 20 75 256 287 50
E09000012 Hackney Greater London London ENG 97.0 26.0 59.5 169 48 217 56 16 72 313 367 2
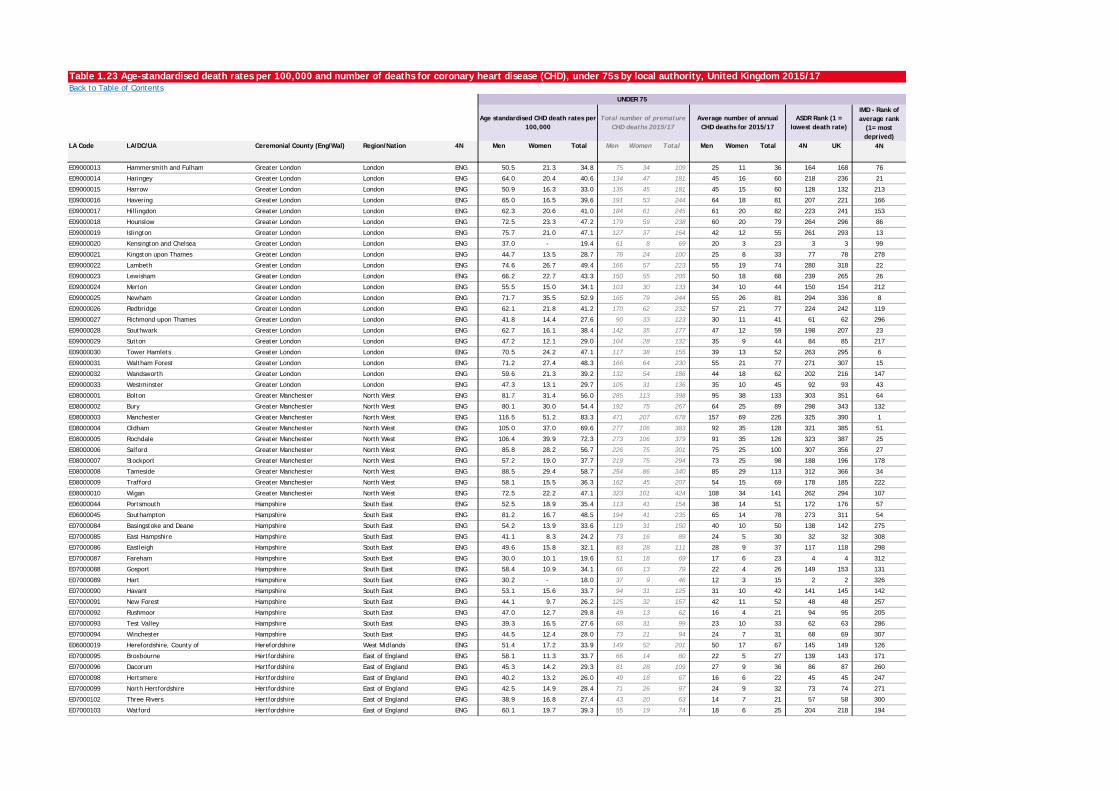
Table 1.23 Age-standardised death rates per 100,000 and number of deaths for coronary heart disease (CHD), under 75s by local authority, United Kingdom 2015/17Back to Table of Contents
IMD - Rank of average rank
(1= most deprived)
LA Code LA/DC/UA Ceremonial County (Eng/Wal) Region/Nation 4N Men Women Total Men Women Total Men Women Total 4N UK 4N
UNDER 75
Age standardised CHD death rates per 100,000
Total number of premature CHD deaths 2015/17
Average number of annual CHD deaths for 2015/17
ASDR Rank (1 = lowest death rate)
E09000013 Hammersmith and Fulham Greater London London ENG 50.5 21.3 34.8 75 34 109 25 11 36 164 168 76
E09000014 Haringey Greater London London ENG 64.0 20.4 40.6 134 47 181 45 16 60 218 236 21
E09000015 Harrow Greater London London ENG 50.9 16.3 33.0 136 45 181 45 15 60 128 132 213
E09000016 Havering Greater London London ENG 65.0 16.5 39.6 191 53 244 64 18 81 207 221 166
E09000017 Hillingdon Greater London London ENG 62.3 20.6 41.0 184 61 245 61 20 82 223 241 153
E09000018 Hounslow Greater London London ENG 72.5 23.3 47.2 179 59 238 60 20 79 264 296 86
E09000019 Islington Greater London London ENG 75.7 21.0 47.1 127 37 164 42 12 55 261 293 13
E09000020 Kensington and Chelsea Greater London London ENG 37.0 - 19.4 61 8 69 20 3 23 3 3 99
E09000021 Kingston upon Thames Greater London London ENG 44.7 13.5 28.7 76 24 100 25 8 33 77 78 278
E09000022 Lambeth Greater London London ENG 74.6 26.7 49.4 166 57 223 55 19 74 280 318 22
E09000023 Lewisham Greater London London ENG 66.2 22.7 43.3 150 55 205 50 18 68 239 265 26
E09000024 Merton Greater London London ENG 55.5 15.0 34.1 103 30 133 34 10 44 150 154 212
E09000025 Newham Greater London London ENG 71.7 35.5 52.9 165 79 244 55 26 81 294 336 8
E09000026 Redbridge Greater London London ENG 62.1 21.8 41.2 170 62 232 57 21 77 224 242 119
E09000027 Richmond upon Thames Greater London London ENG 41.8 14.4 27.6 90 33 123 30 11 41 61 62 296
E09000028 Southwark Greater London London ENG 62.7 16.1 38.4 142 35 177 47 12 59 198 207 23
E09000029 Sutton Greater London London ENG 47.2 12.1 29.0 104 28 132 35 9 44 84 85 217
E09000030 Tower Hamlets Greater London London ENG 70.5 24.2 47.1 117 38 155 39 13 52 263 295 6
E09000031 Waltham Forest Greater London London ENG 71.2 27.4 48.3 166 64 230 55 21 77 271 307 15
E09000032 Wandsworth Greater London London ENG 59.6 21.3 39.2 132 54 186 44 18 62 202 216 147
E09000033 Westminster Greater London London ENG 47.3 13.1 29.7 105 31 136 35 10 45 92 93 43
E08000001 Bolton Greater Manchester North West ENG 81.7 31.4 56.0 285 113 398 95 38 133 303 351 64
E08000002 Bury Greater Manchester North West ENG 80.1 30.0 54.4 192 75 267 64 25 89 298 343 132
E08000003 Manchester Greater Manchester North West ENG 116.5 51.2 83.3 471 207 678 157 69 226 325 390 1
E08000004 Oldham Greater Manchester North West ENG 105.0 37.0 69.6 277 106 383 92 35 128 321 385 51
E08000005 Rochdale Greater Manchester North West ENG 106.4 39.9 72.3 273 106 379 91 35 126 323 387 25
E08000006 Salford Greater Manchester North West ENG 85.8 28.2 56.7 226 75 301 75 25 100 307 356 27
E08000007 Stockport Greater Manchester North West ENG 57.2 19.0 37.7 219 75 294 73 25 98 188 196 178
E08000008 Tameside Greater Manchester North West ENG 88.5 29.4 58.7 254 86 340 85 29 113 312 366 34
E08000009 Trafford Greater Manchester North West ENG 58.1 15.5 36.3 162 45 207 54 15 69 178 185 222
E08000010 Wigan Greater Manchester North West ENG 72.5 22.2 47.1 323 101 424 108 34 141 262 294 107
E06000044 Portsmouth Hampshire South East ENG 52.5 18.9 35.4 113 41 154 38 14 51 172 176 57
E06000045 Southampton Hampshire South East ENG 81.2 16.7 48.5 194 41 235 65 14 78 273 311 54
E07000084 Basingstoke and Deane Hampshire South East ENG 54.2 13.9 33.6 119 31 150 40 10 50 138 142 275
E07000085 East Hampshire Hampshire South East ENG 41.1 8.3 24.2 73 16 89 24 5 30 32 32 308
E07000086 Eastleigh Hampshire South East ENG 49.6 15.8 32.1 83 28 111 28 9 37 117 118 298
E07000087 Fareham Hampshire South East ENG 30.0 10.1 19.6 51 18 69 17 6 23 4 4 312
E07000088 Gosport Hampshire South East ENG 58.4 10.9 34.1 66 13 79 22 4 26 149 153 131
E07000089 Hart Hampshire South East ENG 30.2 - 18.0 37 9 46 12 3 15 2 2 326
E07000090 Havant Hampshire South East ENG 53.1 15.6 33.7 94 31 125 31 10 42 141 145 142
E07000091 New Forest Hampshire South East ENG 44.1 9.7 26.2 125 32 157 42 11 52 48 48 257
E07000092 Rushmoor Hampshire South East ENG 47.0 12.7 29.8 49 13 62 16 4 21 94 95 205
E07000093 Test Valley Hampshire South East ENG 39.3 16.5 27.6 68 31 99 23 10 33 62 63 286
E07000094 Winchester Hampshire South East ENG 44.5 12.4 28.0 73 21 94 24 7 31 68 69 307
E06000019 Herefordshire, County of Herefordshire West Midlands ENG 51.4 17.2 33.9 149 52 201 50 17 67 145 149 126
E07000095 Broxbourne Hertfordshire East of England ENG 58.1 11.3 33.7 66 14 80 22 5 27 139 143 171
E07000096 Dacorum Hertfordshire East of England ENG 45.3 14.2 29.3 81 28 109 27 9 36 86 87 260
E07000098 Hertsmere Hertfordshire East of England ENG 40.2 13.2 26.0 49 18 67 16 6 22 45 45 247
E07000099 North Hertfordshire Hertfordshire East of England ENG 42.5 14.9 28.4 71 26 97 24 9 32 73 74 271
E07000102 Three Rivers Hertfordshire East of England ENG 38.9 16.8 27.4 43 20 63 14 7 21 57 58 300
E07000103 Watford Hertfordshire East of England ENG 60.1 19.7 39.3 55 19 74 18 6 25 204 218 194
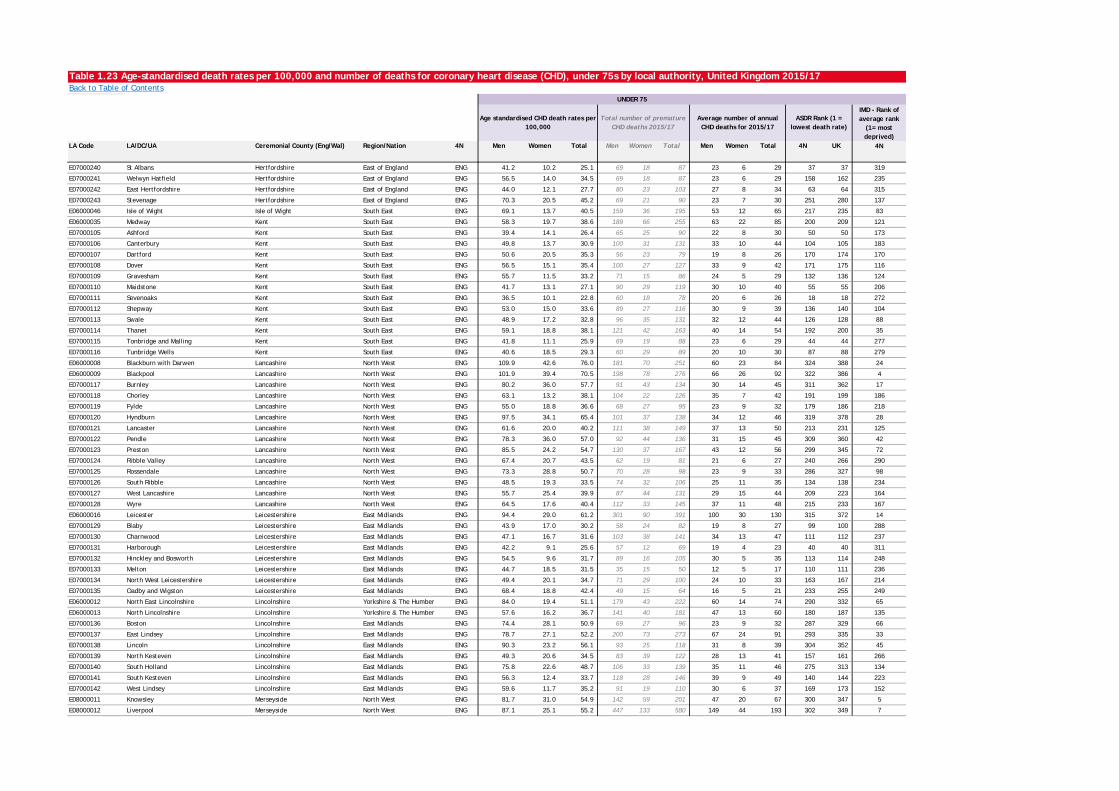
Table 1.23 Age-standardised death rates per 100,000 and number of deaths for coronary heart disease (CHD), under 75s by local authority, United Kingdom 2015/17Back to Table of Contents
IMD - Rank of average rank
(1= most deprived)
LA Code LA/DC/UA Ceremonial County (Eng/Wal) Region/Nation 4N Men Women Total Men Women Total Men Women Total 4N UK 4N
UNDER 75
Age standardised CHD death rates per 100,000
Total number of premature CHD deaths 2015/17
Average number of annual CHD deaths for 2015/17
ASDR Rank (1 = lowest death rate)
E07000240 St Albans Hertfordshire East of England ENG 41.2 10.2 25.1 69 18 87 23 6 29 37 37 319
E07000241 Welwyn Hatfield Hertfordshire East of England ENG 56.5 14.0 34.5 69 18 87 23 6 29 158 162 235
E07000242 East Hertfordshire Hertfordshire East of England ENG 44.0 12.1 27.7 80 23 103 27 8 34 63 64 315
E07000243 Stevenage Hertfordshire East of England ENG 70.3 20.5 45.2 69 21 90 23 7 30 251 280 137
E06000046 Isle of Wight Isle of Wight South East ENG 69.1 13.7 40.5 159 36 195 53 12 65 217 235 83
E06000035 Medway Kent South East ENG 58.3 19.7 38.6 189 66 255 63 22 85 200 209 121
E07000105 Ashford Kent South East ENG 39.4 14.1 26.4 65 25 90 22 8 30 50 50 173
E07000106 Canterbury Kent South East ENG 49.8 13.7 30.9 100 31 131 33 10 44 104 105 183
E07000107 Dartford Kent South East ENG 50.6 20.5 35.3 56 23 79 19 8 26 170 174 170
E07000108 Dover Kent South East ENG 56.5 15.1 35.4 100 27 127 33 9 42 171 175 116
E07000109 Gravesham Kent South East ENG 55.7 11.5 33.2 71 15 86 24 5 29 132 136 124
E07000110 Maidstone Kent South East ENG 41.7 13.1 27.1 90 29 119 30 10 40 55 55 206
E07000111 Sevenoaks Kent South East ENG 36.5 10.1 22.8 60 18 78 20 6 26 18 18 272
E07000112 Shepway Kent South East ENG 53.0 15.0 33.6 89 27 116 30 9 39 136 140 104
E07000113 Swale Kent South East ENG 48.9 17.2 32.8 96 35 131 32 12 44 126 128 88
E07000114 Thanet Kent South East ENG 59.1 18.8 38.1 121 42 163 40 14 54 192 200 35
E07000115 Tonbridge and Malling Kent South East ENG 41.8 11.1 25.9 69 19 88 23 6 29 44 44 277
E07000116 Tunbridge Wells Kent South East ENG 40.6 18.5 29.3 60 29 89 20 10 30 87 88 279
E06000008 Blackburn with Darwen Lancashire North West ENG 109.9 42.6 76.0 181 70 251 60 23 84 324 388 24
E06000009 Blackpool Lancashire North West ENG 101.9 39.4 70.5 198 78 276 66 26 92 322 386 4
E07000117 Burnley Lancashire North West ENG 80.2 36.0 57.7 91 43 134 30 14 45 311 362 17
E07000118 Chorley Lancashire North West ENG 63.1 13.2 38.1 104 22 126 35 7 42 191 199 186
E07000119 Fylde Lancashire North West ENG 55.0 18.8 36.6 68 27 95 23 9 32 179 186 218
E07000120 Hyndburn Lancashire North West ENG 97.5 34.1 65.4 101 37 138 34 12 46 319 378 28
E07000121 Lancaster Lancashire North West ENG 61.6 20.0 40.2 111 38 149 37 13 50 213 231 125
E07000122 Pendle Lancashire North West ENG 78.3 36.0 57.0 92 44 136 31 15 45 309 360 42
E07000123 Preston Lancashire North West ENG 85.5 24.2 54.7 130 37 167 43 12 56 299 345 72
E07000124 Ribble Valley Lancashire North West ENG 67.4 20.7 43.5 62 19 81 21 6 27 240 266 290
E07000125 Rossendale Lancashire North West ENG 73.3 28.8 50.7 70 28 98 23 9 33 286 327 98
E07000126 South Ribble Lancashire North West ENG 48.5 19.3 33.5 74 32 106 25 11 35 134 138 234
E07000127 West Lancashire Lancashire North West ENG 55.7 25.4 39.9 87 44 131 29 15 44 209 223 164
E07000128 Wyre Lancashire North West ENG 64.5 17.6 40.4 112 33 145 37 11 48 215 233 167
E06000016 Leicester Leicestershire East Midlands ENG 94.4 29.0 61.2 301 90 391 100 30 130 315 372 14
E07000129 Blaby Leicestershire East Midlands ENG 43.9 17.0 30.2 58 24 82 19 8 27 99 100 288
E07000130 Charnwood Leicestershire East Midlands ENG 47.1 16.7 31.6 103 38 141 34 13 47 111 112 237
E07000131 Harborough Leicestershire East Midlands ENG 42.2 9.1 25.6 57 12 69 19 4 23 40 40 311
E07000132 Hinckley and Bosworth Leicestershire East Midlands ENG 54.5 9.6 31.7 89 16 105 30 5 35 113 114 248
E07000133 Melton Leicestershire East Midlands ENG 44.7 18.5 31.5 35 15 50 12 5 17 110 111 236
E07000134 North West Leicestershire Leicestershire East Midlands ENG 49.4 20.1 34.7 71 29 100 24 10 33 163 167 214
E07000135 Oadby and Wigston Leicestershire East Midlands ENG 68.4 18.8 42.4 49 15 64 16 5 21 233 255 249
E06000012 North East Lincolnshire Lincolnshire Yorkshire & The Humber ENG 84.0 19.4 51.1 179 43 222 60 14 74 290 332 65
E06000013 North Lincolnshire Lincolnshire Yorkshire & The Humber ENG 57.6 16.2 36.7 141 40 181 47 13 60 180 187 135
E07000136 Boston Lincolnshire East Midlands ENG 74.4 28.1 50.9 69 27 96 23 9 32 287 329 66
E07000137 East Lindsey Lincolnshire East Midlands ENG 78.7 27.1 52.2 200 73 273 67 24 91 293 335 33
E07000138 Lincoln Lincolnshire East Midlands ENG 90.3 23.2 56.1 93 25 118 31 8 39 304 352 45
E07000139 North Kesteven Lincolnshire East Midlands ENG 49.3 20.6 34.5 83 39 122 28 13 41 157 161 266
E07000140 South Holland Lincolnshire East Midlands ENG 75.8 22.6 48.7 106 33 139 35 11 46 275 313 134
E07000141 South Kesteven Lincolnshire East Midlands ENG 56.3 12.4 33.7 118 28 146 39 9 49 140 144 223
E07000142 West Lindsey Lincolnshire East Midlands ENG 59.6 11.7 35.2 91 19 110 30 6 37 169 173 152
E08000011 Knowsley Merseyside North West ENG 81.7 31.0 54.9 142 59 201 47 20 67 300 347 5
E08000012 Liverpool Merseyside North West ENG 87.1 25.1 55.2 447 133 580 149 44 193 302 349 7
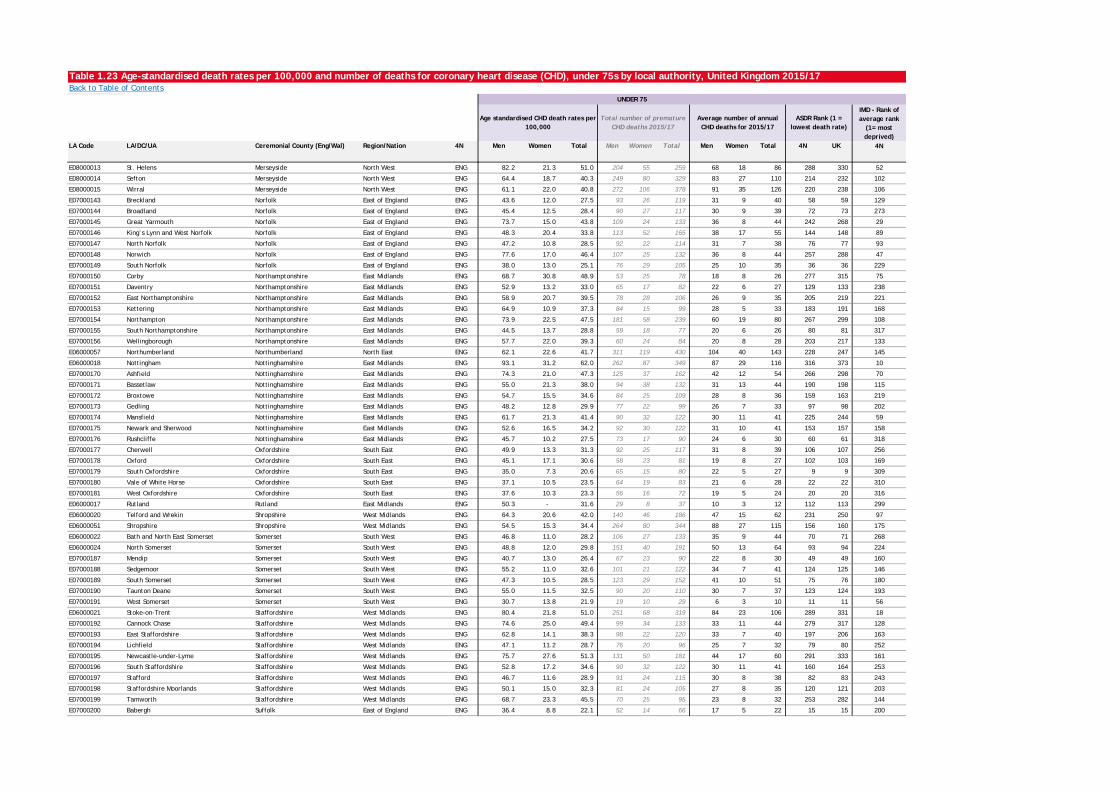
Table 1.23 Age-standardised death rates per 100,000 and number of deaths for coronary heart disease (CHD), under 75s by local authority, United Kingdom 2015/17Back to Table of Contents
IMD - Rank of average rank
(1= most deprived)
LA Code LA/DC/UA Ceremonial County (Eng/Wal) Region/Nation 4N Men Women Total Men Women Total Men Women Total 4N UK 4N
UNDER 75
Age standardised CHD death rates per 100,000
Total number of premature CHD deaths 2015/17
Average number of annual CHD deaths for 2015/17
ASDR Rank (1 = lowest death rate)
E08000013 St. Helens Merseyside North West ENG 82.2 21.3 51.0 204 55 259 68 18 86 288 330 52
E08000014 Sefton Merseyside North West ENG 64.4 18.7 40.3 249 80 329 83 27 110 214 232 102
E08000015 Wirral Merseyside North West ENG 61.1 22.0 40.8 272 106 378 91 35 126 220 238 106
E07000143 Breckland Norfolk East of England ENG 43.6 12.0 27.5 93 26 119 31 9 40 58 59 129
E07000144 Broadland Norfolk East of England ENG 45.4 12.5 28.4 90 27 117 30 9 39 72 73 273
E07000145 Great Yarmouth Norfolk East of England ENG 73.7 15.0 43.8 109 24 133 36 8 44 242 268 29
E07000146 King’s Lynn and West Norfolk Norfolk East of England ENG 48.3 20.4 33.8 113 52 165 38 17 55 144 148 89
E07000147 North Norfolk Norfolk East of England ENG 47.2 10.8 28.5 92 22 114 31 7 38 76 77 93
E07000148 Norwich Norfolk East of England ENG 77.6 17.0 46.4 107 25 132 36 8 44 257 288 47
E07000149 South Norfolk Norfolk East of England ENG 38.0 13.0 25.1 76 29 105 25 10 35 36 36 229
E07000150 Corby Northamptonshire East Midlands ENG 68.7 30.8 48.9 53 25 78 18 8 26 277 315 75
E07000151 Daventry Northamptonshire East Midlands ENG 52.9 13.2 33.0 65 17 82 22 6 27 129 133 238
E07000152 East Northamptonshire Northamptonshire East Midlands ENG 58.9 20.7 39.5 78 28 106 26 9 35 205 219 221
E07000153 Kettering Northamptonshire East Midlands ENG 64.9 10.9 37.3 84 15 99 28 5 33 183 191 168
E07000154 Northampton Northamptonshire East Midlands ENG 73.9 22.5 47.5 181 58 239 60 19 80 267 299 108
E07000155 South Northamptonshire Northamptonshire East Midlands ENG 44.5 13.7 28.8 59 18 77 20 6 26 80 81 317
E07000156 Wellingborough Northamptonshire East Midlands ENG 57.7 22.0 39.3 60 24 84 20 8 28 203 217 133
E06000057 Northumberland Northumberland North East ENG 62.1 22.6 41.7 311 119 430 104 40 143 228 247 145
E06000018 Nottingham Nottinghamshire East Midlands ENG 93.1 31.2 62.0 262 87 349 87 29 116 316 373 10
E07000170 Ashfield Nottinghamshire East Midlands ENG 74.3 21.0 47.3 125 37 162 42 12 54 266 298 70
E07000171 Bassetlaw Nottinghamshire East Midlands ENG 55.0 21.3 38.0 94 38 132 31 13 44 190 198 115
E07000172 Broxtowe Nottinghamshire East Midlands ENG 54.7 15.5 34.6 84 25 109 28 8 36 159 163 219
E07000173 Gedling Nottinghamshire East Midlands ENG 48.2 12.8 29.9 77 22 99 26 7 33 97 98 202
E07000174 Mansfield Nottinghamshire East Midlands ENG 61.7 21.3 41.4 90 32 122 30 11 41 225 244 59
E07000175 Newark and Sherwood Nottinghamshire East Midlands ENG 52.6 16.5 34.2 92 30 122 31 10 41 153 157 158
E07000176 Rushcliffe Nottinghamshire East Midlands ENG 45.7 10.2 27.5 73 17 90 24 6 30 60 61 318
E07000177 Cherwell Oxfordshire South East ENG 49.9 13.3 31.3 92 25 117 31 8 39 106 107 256
E07000178 Oxford Oxfordshire South East ENG 45.1 17.1 30.6 58 23 81 19 8 27 102 103 169
E07000179 South Oxfordshire Oxfordshire South East ENG 35.0 7.3 20.6 65 15 80 22 5 27 9 9 309
E07000180 Vale of White Horse Oxfordshire South East ENG 37.1 10.5 23.5 64 19 83 21 6 28 22 22 310
E07000181 West Oxfordshire Oxfordshire South East ENG 37.6 10.3 23.3 56 16 72 19 5 24 20 20 316
E06000017 Rutland Rutland East Midlands ENG 50.3 - 31.6 29 8 37 10 3 12 112 113 299
E06000020 Telford and Wrekin Shropshire West Midlands ENG 64.3 20.6 42.0 140 46 186 47 15 62 231 250 97
E06000051 Shropshire Shropshire West Midlands ENG 54.5 15.3 34.4 264 80 344 88 27 115 156 160 175
E06000022 Bath and North East Somerset Somerset South West ENG 46.8 11.0 28.2 106 27 133 35 9 44 70 71 268
E06000024 North Somerset Somerset South West ENG 48.8 12.0 29.8 151 40 191 50 13 64 93 94 224
E07000187 Mendip Somerset South West ENG 40.7 13.0 26.4 67 23 90 22 8 30 49 49 160
E07000188 Sedgemoor Somerset South West ENG 55.2 11.0 32.6 101 21 122 34 7 41 124 125 146
E07000189 South Somerset Somerset South West ENG 47.3 10.5 28.5 123 29 152 41 10 51 75 76 180
E07000190 Taunton Deane Somerset South West ENG 55.0 11.5 32.5 90 20 110 30 7 37 123 124 193
E07000191 West Somerset Somerset South West ENG 30.7 13.8 21.9 19 10 29 6 3 10 11 11 56
E06000021 Stoke-on-Trent Staffordshire West Midlands ENG 80.4 21.8 51.0 251 68 319 84 23 106 289 331 18
E07000192 Cannock Chase Staffordshire West Midlands ENG 74.6 25.0 49.4 99 34 133 33 11 44 279 317 128
E07000193 East Staffordshire Staffordshire West Midlands ENG 62.8 14.1 38.3 98 22 120 33 7 40 197 206 163
E07000194 Lichfield Staffordshire West Midlands ENG 47.1 11.2 28.7 76 20 96 25 7 32 79 80 252
E07000195 Newcastle-under-Lyme Staffordshire West Midlands ENG 75.7 27.6 51.3 131 50 181 44 17 60 291 333 161
E07000196 South Staffordshire Staffordshire West Midlands ENG 52.8 17.2 34.6 90 32 122 30 11 41 160 164 253
E07000197 Stafford Staffordshire West Midlands ENG 46.7 11.6 28.9 91 24 115 30 8 38 82 83 243
E07000198 Staffordshire Moorlands Staffordshire West Midlands ENG 50.1 15.0 32.3 81 24 105 27 8 35 120 121 203
E07000199 Tamworth Staffordshire West Midlands ENG 68.7 23.3 45.5 70 25 95 23 8 32 253 282 144
E07000200 Babergh Suffolk East of England ENG 36.4 8.8 22.1 52 14 66 17 5 22 15 15 200
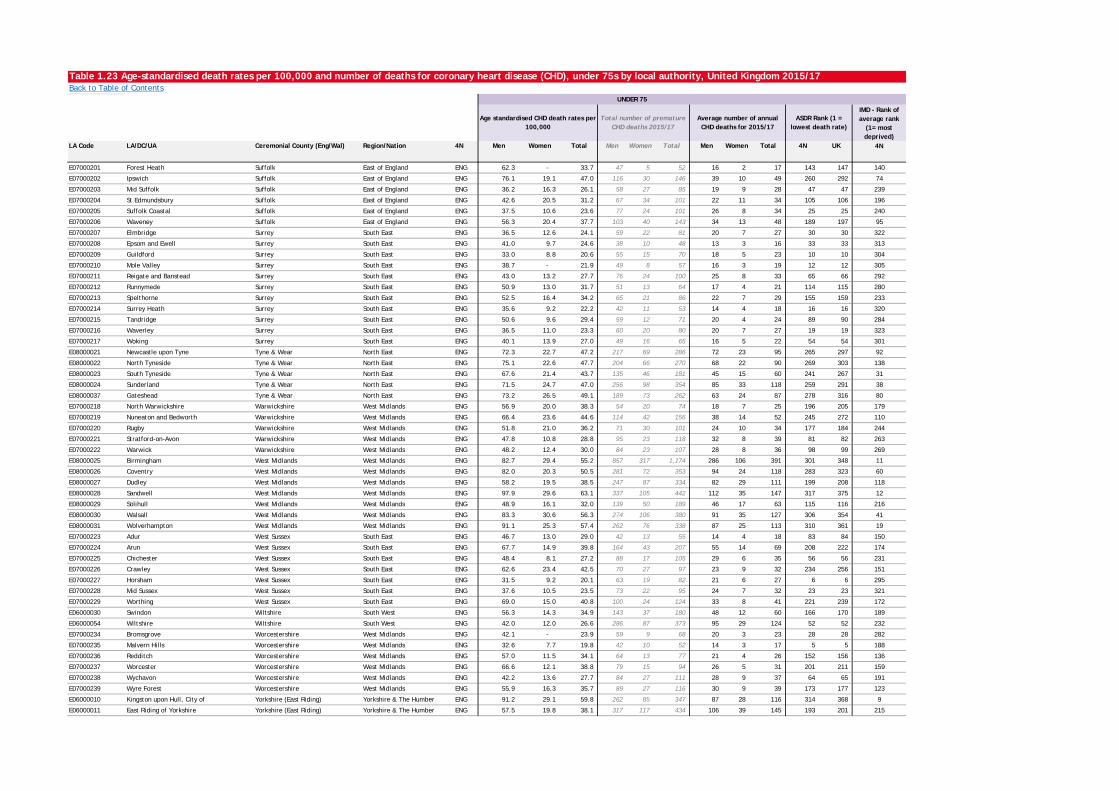
Table 1.23 Age-standardised death rates per 100,000 and number of deaths for coronary heart disease (CHD), under 75s by local authority, United Kingdom 2015/17Back to Table of Contents
IMD - Rank of average rank
(1= most deprived)
LA Code LA/DC/UA Ceremonial County (Eng/Wal) Region/Nation 4N Men Women Total Men Women Total Men Women Total 4N UK 4N
UNDER 75
Age standardised CHD death rates per 100,000
Total number of premature CHD deaths 2015/17
Average number of annual CHD deaths for 2015/17
ASDR Rank (1 = lowest death rate)
E07000201 Forest Heath Suffolk East of England ENG 62.3 - 33.7 47 5 52 16 2 17 143 147 140
E07000202 Ipswich Suffolk East of England ENG 76.1 19.1 47.0 116 30 146 39 10 49 260 292 74
E07000203 Mid Suffolk Suffolk East of England ENG 36.2 16.3 26.1 58 27 85 19 9 28 47 47 239
E07000204 St Edmundsbury Suffolk East of England ENG 42.6 20.5 31.2 67 34 101 22 11 34 105 106 196
E07000205 Suffolk Coastal Suffolk East of England ENG 37.5 10.6 23.6 77 24 101 26 8 34 25 25 240
E07000206 Waveney Suffolk East of England ENG 56.3 20.4 37.7 103 40 143 34 13 48 189 197 95
E07000207 Elmbridge Surrey South East ENG 36.5 12.6 24.1 59 22 81 20 7 27 30 30 322
E07000208 Epsom and Ewell Surrey South East ENG 41.0 9.7 24.6 38 10 48 13 3 16 33 33 313
E07000209 Guildford Surrey South East ENG 33.0 8.8 20.6 55 15 70 18 5 23 10 10 304
E07000210 Mole Valley Surrey South East ENG 38.7 - 21.9 49 8 57 16 3 19 12 12 305
E07000211 Reigate and Banstead Surrey South East ENG 43.0 13.2 27.7 76 24 100 25 8 33 65 66 292
E07000212 Runnymede Surrey South East ENG 50.9 13.0 31.7 51 13 64 17 4 21 114 115 280
E07000213 Spelthorne Surrey South East ENG 52.5 16.4 34.2 65 21 86 22 7 29 155 159 233
E07000214 Surrey Heath Surrey South East ENG 35.6 9.2 22.2 42 11 53 14 4 18 16 16 320
E07000215 Tandridge Surrey South East ENG 50.6 9.6 29.4 59 12 71 20 4 24 89 90 284
E07000216 Waverley Surrey South East ENG 36.5 11.0 23.3 60 20 80 20 7 27 19 19 323
E07000217 Woking Surrey South East ENG 40.1 13.9 27.0 49 16 65 16 5 22 54 54 301
E08000021 Newcastle upon Tyne Tyne & Wear North East ENG 72.3 22.7 47.2 217 69 286 72 23 95 265 297 92
E08000022 North Tyneside Tyne & Wear North East ENG 75.1 22.6 47.7 204 66 270 68 22 90 269 303 138
E08000023 South Tyneside Tyne & Wear North East ENG 67.6 21.4 43.7 135 46 181 45 15 60 241 267 31
E08000024 Sunderland Tyne & Wear North East ENG 71.5 24.7 47.0 256 98 354 85 33 118 259 291 38
E08000037 Gateshead Tyne & Wear North East ENG 73.2 26.5 49.1 189 73 262 63 24 87 278 316 80
E07000218 North Warwickshire Warwickshire West Midlands ENG 56.9 20.0 38.3 54 20 74 18 7 25 196 205 179
E07000219 Nuneaton and Bedworth Warwickshire West Midlands ENG 66.4 23.6 44.6 114 42 156 38 14 52 245 272 110
E07000220 Rugby Warwickshire West Midlands ENG 51.8 21.0 36.2 71 30 101 24 10 34 177 184 244
E07000221 Stratford-on-Avon Warwickshire West Midlands ENG 47.8 10.8 28.8 95 23 118 32 8 39 81 82 263
E07000222 Warwick Warwickshire West Midlands ENG 48.2 12.4 30.0 84 23 107 28 8 36 98 99 269
E08000025 Birmingham West Midlands West Midlands ENG 82.7 29.4 55.2 857 317 1,174 286 106 391 301 348 11
E08000026 Coventry West Midlands West Midlands ENG 82.0 20.3 50.5 281 72 353 94 24 118 283 323 60
E08000027 Dudley West Midlands West Midlands ENG 58.2 19.5 38.5 247 87 334 82 29 111 199 208 118
E08000028 Sandwell West Midlands West Midlands ENG 97.9 29.6 63.1 337 105 442 112 35 147 317 375 12
E08000029 Solihull West Midlands West Midlands ENG 48.9 16.1 32.0 139 50 189 46 17 63 115 116 216
E08000030 Walsall West Midlands West Midlands ENG 83.3 30.6 56.3 274 106 380 91 35 127 306 354 41
E08000031 Wolverhampton West Midlands West Midlands ENG 91.1 25.3 57.4 262 76 338 87 25 113 310 361 19
E07000223 Adur West Sussex South East ENG 46.7 13.0 29.0 42 13 55 14 4 18 83 84 150
E07000224 Arun West Sussex South East ENG 67.7 14.9 39.8 164 43 207 55 14 69 208 222 174
E07000225 Chichester West Sussex South East ENG 48.4 8.1 27.2 88 17 105 29 6 35 56 56 231
E07000226 Crawley West Sussex South East ENG 62.6 23.4 42.5 70 27 97 23 9 32 234 256 151
E07000227 Horsham West Sussex South East ENG 31.5 9.2 20.1 63 19 82 21 6 27 6 6 295
E07000228 Mid Sussex West Sussex South East ENG 37.6 10.5 23.5 73 22 95 24 7 32 23 23 321
E07000229 Worthing West Sussex South East ENG 69.0 15.0 40.8 100 24 124 33 8 41 221 239 172
E06000030 Swindon Wiltshire South West ENG 56.3 14.3 34.9 143 37 180 48 12 60 166 170 189
E06000054 Wiltshire Wiltshire South West ENG 42.0 12.0 26.6 286 87 373 95 29 124 52 52 232
E07000234 Bromsgrove Worcestershire West Midlands ENG 42.1 - 23.9 59 9 68 20 3 23 28 28 282
E07000235 Malvern Hills Worcestershire West Midlands ENG 32.6 7.7 19.8 42 10 52 14 3 17 5 5 188
E07000236 Redditch Worcestershire West Midlands ENG 57.0 11.5 34.1 64 13 77 21 4 26 152 156 136
E07000237 Worcester Worcestershire West Midlands ENG 66.6 12.1 38.8 79 15 94 26 5 31 201 211 159
E07000238 Wychavon Worcestershire West Midlands ENG 42.2 13.6 27.7 84 27 111 28 9 37 64 65 191
E07000239 Wyre Forest Worcestershire West Midlands ENG 55.9 16.3 35.7 89 27 116 30 9 39 173 177 123
E06000010 Kingston upon Hull, City of Yorkshire (East Riding) Yorkshire & The Humber ENG 91.2 29.1 59.8 262 85 347 87 28 116 314 368 9
E06000011 East Riding of Yorkshire Yorkshire (East Riding) Yorkshire & The Humber ENG 57.5 19.8 38.1 317 117 434 106 39 145 193 201 215
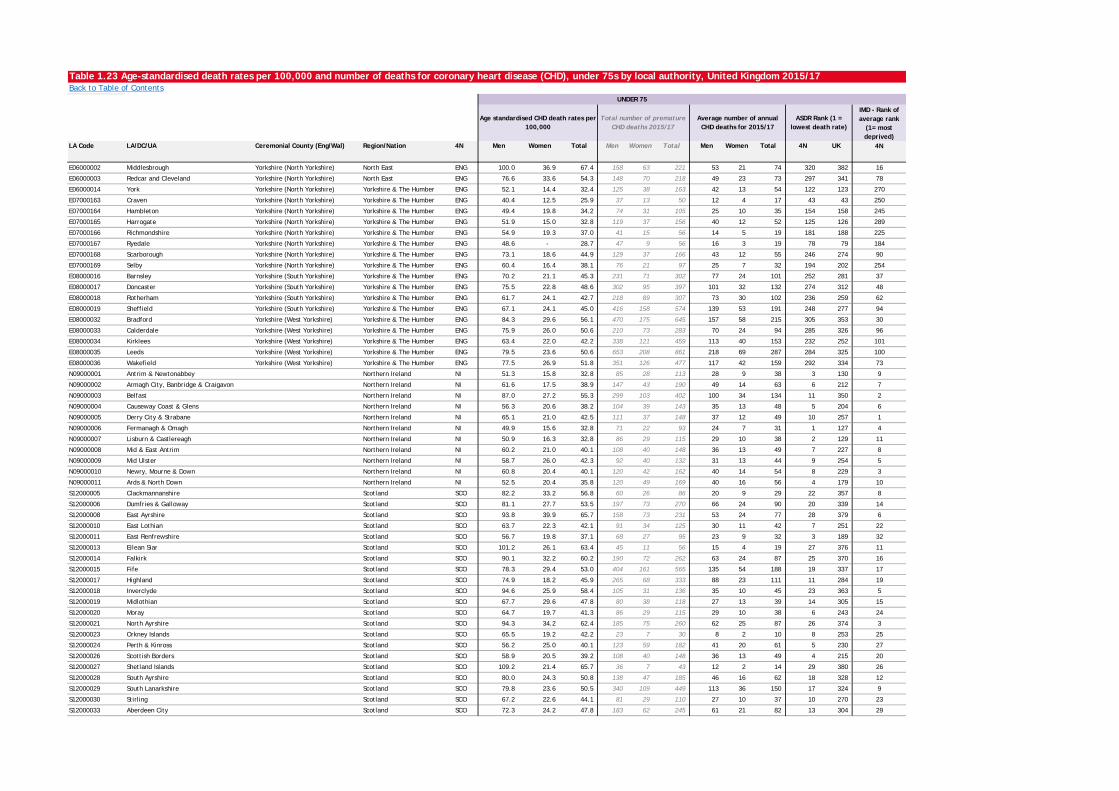
Table 1.23 Age-standardised death rates per 100,000 and number of deaths for coronary heart disease (CHD), under 75s by local authority, United Kingdom 2015/17Back to Table of Contents
IMD - Rank of average rank
(1= most deprived)
LA Code LA/DC/UA Ceremonial County (Eng/Wal) Region/Nation 4N Men Women Total Men Women Total Men Women Total 4N UK 4N
UNDER 75
Age standardised CHD death rates per 100,000
Total number of premature CHD deaths 2015/17
Average number of annual CHD deaths for 2015/17
ASDR Rank (1 = lowest death rate)
E06000002 Middlesbrough Yorkshire (North Yorkshire) North East ENG 100.0 36.9 67.4 158 63 221 53 21 74 320 382 16
E06000003 Redcar and Cleveland Yorkshire (North Yorkshire) North East ENG 76.6 33.6 54.3 148 70 218 49 23 73 297 341 78
E06000014 York Yorkshire (North Yorkshire) Yorkshire & The Humber ENG 52.1 14.4 32.4 125 38 163 42 13 54 122 123 270
E07000163 Craven Yorkshire (North Yorkshire) Yorkshire & The Humber ENG 40.4 12.5 25.9 37 13 50 12 4 17 43 43 250
E07000164 Hambleton Yorkshire (North Yorkshire) Yorkshire & The Humber ENG 49.4 19.8 34.2 74 31 105 25 10 35 154 158 245
E07000165 Harrogate Yorkshire (North Yorkshire) Yorkshire & The Humber ENG 51.9 15.0 32.8 119 37 156 40 12 52 125 126 289
E07000166 Richmondshire Yorkshire (North Yorkshire) Yorkshire & The Humber ENG 54.9 19.3 37.0 41 15 56 14 5 19 181 188 225
E07000167 Ryedale Yorkshire (North Yorkshire) Yorkshire & The Humber ENG 48.6 - 28.7 47 9 56 16 3 19 78 79 184
E07000168 Scarborough Yorkshire (North Yorkshire) Yorkshire & The Humber ENG 73.1 18.6 44.9 129 37 166 43 12 55 246 274 90
E07000169 Selby Yorkshire (North Yorkshire) Yorkshire & The Humber ENG 60.4 16.4 38.1 76 21 97 25 7 32 194 202 254
E08000016 Barnsley Yorkshire (South Yorkshire) Yorkshire & The Humber ENG 70.2 21.1 45.3 231 71 302 77 24 101 252 281 37
E08000017 Doncaster Yorkshire (South Yorkshire) Yorkshire & The Humber ENG 75.5 22.8 48.6 302 95 397 101 32 132 274 312 48
E08000018 Rotherham Yorkshire (South Yorkshire) Yorkshire & The Humber ENG 61.7 24.1 42.7 218 89 307 73 30 102 236 259 62
E08000019 Sheffield Yorkshire (South Yorkshire) Yorkshire & The Humber ENG 67.1 24.1 45.0 416 158 574 139 53 191 248 277 94
E08000032 Bradford Yorkshire (West Yorkshire) Yorkshire & The Humber ENG 84.3 29.6 56.1 470 175 645 157 58 215 305 353 30
E08000033 Calderdale Yorkshire (West Yorkshire) Yorkshire & The Humber ENG 75.9 26.0 50.6 210 73 283 70 24 94 285 326 96
E08000034 Kirklees Yorkshire (West Yorkshire) Yorkshire & The Humber ENG 63.4 22.0 42.2 338 121 459 113 40 153 232 252 101
E08000035 Leeds Yorkshire (West Yorkshire) Yorkshire & The Humber ENG 79.5 23.6 50.6 653 208 861 218 69 287 284 325 100
E08000036 Wakefield Yorkshire (West Yorkshire) Yorkshire & The Humber ENG 77.5 26.9 51.8 351 126 477 117 42 159 292 334 73
N09000001 Antrim & Newtonabbey Northern Ireland NI 51.3 15.8 32.8 85 28 113 28 9 38 3 130 9
N09000002 Armagh City, Banbridge & Craigavon Northern Ireland NI 61.6 17.5 38.9 147 43 190 49 14 63 6 212 7
N09000003 Belfast Northern Ireland NI 87.0 27.2 55.3 299 103 402 100 34 134 11 350 2
N09000004 Causeway Coast & Glens Northern Ireland NI 56.3 20.6 38.2 104 39 143 35 13 48 5 204 6
N09000005 Derry City & Strabane Northern Ireland NI 65.1 21.0 42.5 111 37 148 37 12 49 10 257 1
N09000006 Fermanagh & Omagh Northern Ireland NI 49.9 15.6 32.8 71 22 93 24 7 31 1 127 4
N09000007 Lisburn & Castlereagh Northern Ireland NI 50.9 16.3 32.8 86 29 115 29 10 38 2 129 11
N09000008 Mid & East Antrim Northern Ireland NI 60.2 21.0 40.1 108 40 148 36 13 49 7 227 8
N09000009 Mid Ulster Northern Ireland NI 58.7 26.0 42.3 92 40 132 31 13 44 9 254 5
N09000010 Newry, Mourne & Down Northern Ireland NI 60.8 20.4 40.1 120 42 162 40 14 54 8 229 3
N09000011 Ards & North Down Northern Ireland NI 52.5 20.4 35.8 120 49 169 40 16 56 4 179 10
S12000005 Clackmannanshire Scotland SCO 82.2 33.2 56.8 60 26 86 20 9 29 22 357 8
S12000006 Dumfries & Galloway Scotland SCO 81.1 27.7 53.5 197 73 270 66 24 90 20 339 14
S12000008 East Ayrshire Scotland SCO 93.8 39.9 65.7 158 73 231 53 24 77 28 379 6
S12000010 East Lothian Scotland SCO 63.7 22.3 42.1 91 34 125 30 11 42 7 251 22
S12000011 East Renfrewshire Scotland SCO 56.7 19.8 37.1 68 27 95 23 9 32 3 189 32
S12000013 Eilean Siar Scotland SCO 101.2 26.1 63.4 45 11 56 15 4 19 27 376 11
S12000014 Falkirk Scotland SCO 90.1 32.2 60.2 190 72 262 63 24 87 25 370 16
S12000015 Fife Scotland SCO 78.3 29.4 53.0 404 161 565 135 54 188 19 337 17
S12000017 Highland Scotland SCO 74.9 18.2 45.9 265 68 333 88 23 111 11 284 19
S12000018 Inverclyde Scotland SCO 94.6 25.9 58.4 105 31 136 35 10 45 23 363 5
S12000019 Midlothian Scotland SCO 67.7 29.6 47.8 80 38 118 27 13 39 14 305 15
S12000020 Moray Scotland SCO 64.7 19.7 41.3 86 29 115 29 10 38 6 243 24
S12000021 North Ayrshire Scotland SCO 94.3 34.2 62.4 185 75 260 62 25 87 26 374 3
S12000023 Orkney Islands Scotland SCO 65.5 19.2 42.2 23 7 30 8 2 10 8 253 25
S12000024 Perth & Kinross Scotland SCO 56.2 25.0 40.1 123 59 182 41 20 61 5 230 27
S12000026 Scottish Borders Scotland SCO 58.9 20.5 39.2 108 40 148 36 13 49 4 215 20
S12000027 Shetland Islands Scotland SCO 109.2 21.4 65.7 36 7 43 12 2 14 29 380 26
S12000028 South Ayrshire Scotland SCO 80.0 24.3 50.8 138 47 185 46 16 62 18 328 12
S12000029 South Lanarkshire Scotland SCO 79.8 23.6 50.5 340 109 449 113 36 150 17 324 9
S12000030 Stirling Scotland SCO 67.2 22.6 44.1 81 29 110 27 10 37 10 270 23
S12000033 Aberdeen City Scotland SCO 72.3 24.2 47.8 183 62 245 61 21 82 13 304 29
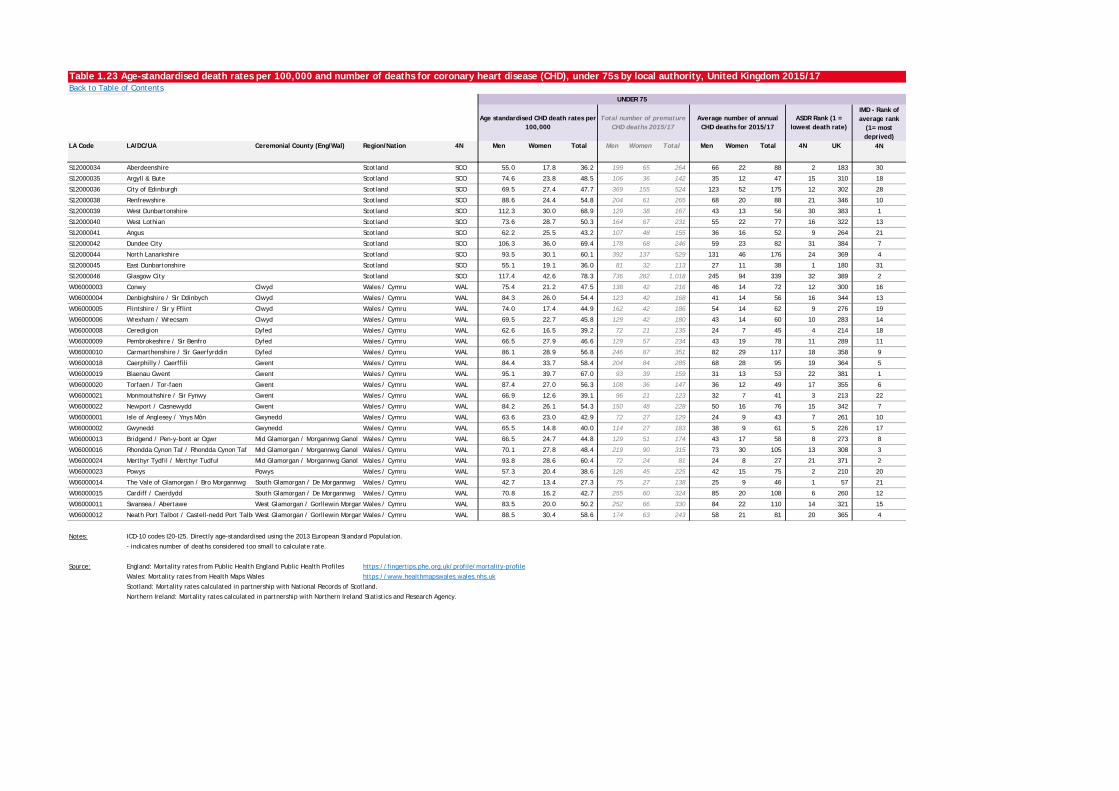
Table 1.23 Age-standardised death rates per 100,000 and number of deaths for coronary heart disease (CHD), under 75s by local authority, United Kingdom 2015/17Back to Table of Contents
IMD - Rank of average rank
(1= most deprived)
LA Code LA/DC/UA Ceremonial County (Eng/Wal) Region/Nation 4N Men Women Total Men Women Total Men Women Total 4N UK 4N
UNDER 75
Age standardised CHD death rates per 100,000
Total number of premature CHD deaths 2015/17
Average number of annual CHD deaths for 2015/17
ASDR Rank (1 = lowest death rate)
S12000034 Aberdeenshire Scotland SCO 55.0 17.8 36.2 199 65 264 66 22 88 2 183 30
S12000035 Argyll & Bute Scotland SCO 74.6 23.8 48.5 106 36 142 35 12 47 15 310 18
S12000036 City of Edinburgh Scotland SCO 69.5 27.4 47.7 369 155 524 123 52 175 12 302 28
S12000038 Renfrewshire Scotland SCO 88.6 24.4 54.8 204 61 265 68 20 88 21 346 10
S12000039 West Dunbartonshire Scotland SCO 112.3 30.0 68.9 129 38 167 43 13 56 30 383 1
S12000040 West Lothian Scotland SCO 73.6 28.7 50.3 164 67 231 55 22 77 16 322 13
S12000041 Angus Scotland SCO 62.2 25.5 43.2 107 48 155 36 16 52 9 264 21
S12000042 Dundee City Scotland SCO 106.3 36.0 69.4 178 68 246 59 23 82 31 384 7
S12000044 North Lanarkshire Scotland SCO 93.5 30.1 60.1 392 137 529 131 46 176 24 369 4
S12000045 East Dunbartonshire Scotland SCO 55.1 19.1 36.0 81 32 113 27 11 38 1 180 31
S12000046 Glasgow City Scotland SCO 117.4 42.6 78.3 736 282 1,018 245 94 339 32 389 2
W06000003 Conwy Clwyd Wales / Cymru WAL 75.4 21.2 47.5 138 42 216 46 14 72 12 300 16
W06000004 Denbighshire / Sir Ddinbych Clwyd Wales / Cymru WAL 84.3 26.0 54.4 123 42 168 41 14 56 16 344 13
W06000005 Flintshire / Sir y Fflint Clwyd Wales / Cymru WAL 74.0 17.4 44.9 162 42 186 54 14 62 9 276 19
W06000006 Wrexham / Wrecsam Clwyd Wales / Cymru WAL 69.5 22.7 45.8 129 42 180 43 14 60 10 283 14
W06000008 Ceredigion Dyfed Wales / Cymru WAL 62.6 16.5 39.2 72 21 135 24 7 45 4 214 18
W06000009 Pembrokeshire / Sir Benfro Dyfed Wales / Cymru WAL 66.5 27.9 46.6 129 57 234 43 19 78 11 289 11
W06000010 Carmarthenshire / Sir Gaerfyrddin Dyfed Wales / Cymru WAL 86.1 28.9 56.8 246 87 351 82 29 117 18 358 9
W06000018 Caerphilly / Caerffili Gwent Wales / Cymru WAL 84.4 33.7 58.4 204 84 285 68 28 95 19 364 5
W06000019 Blaenau Gwent Gwent Wales / Cymru WAL 95.1 39.7 67.0 93 39 159 31 13 53 22 381 1
W06000020 Torfaen / Tor-faen Gwent Wales / Cymru WAL 87.4 27.0 56.3 108 36 147 36 12 49 17 355 6
W06000021 Monmouthshire / Sir Fynwy Gwent Wales / Cymru WAL 66.9 12.6 39.1 96 21 123 32 7 41 3 213 22
W06000022 Newport / Casnewydd Gwent Wales / Cymru WAL 84.2 26.1 54.3 150 48 228 50 16 76 15 342 7
W06000001 Isle of Anglesey / Ynys Môn Gwynedd Wales / Cymru WAL 63.6 23.0 42.9 72 27 129 24 9 43 7 261 10
W06000002 Gwynedd Gwynedd Wales / Cymru WAL 65.5 14.8 40.0 114 27 183 38 9 61 5 226 17
W06000013 Bridgend / Pen-y-bont ar Ogwr Mid Glamorgan / Morgannwg Ganol Wales / Cymru WAL 66.5 24.7 44.8 129 51 174 43 17 58 8 273 8
W06000016 Rhondda Cynon Taf / Rhondda Cynon Taf Mid Glamorgan / Morgannwg Ganol Wales / Cymru WAL 70.1 27.8 48.4 219 90 315 73 30 105 13 308 3
W06000024 Merthyr Tydfil / Merthyr Tudful Mid Glamorgan / Morgannwg Ganol Wales / Cymru WAL 93.8 28.6 60.4 72 24 81 24 8 27 21 371 2
W06000023 Powys Powys Wales / Cymru WAL 57.3 20.4 38.6 126 45 225 42 15 75 2 210 20
W06000014 The Vale of Glamorgan / Bro Morgannwg South Glamorgan / De Morgannwg Wales / Cymru WAL 42.7 13.4 27.3 75 27 138 25 9 46 1 57 21
W06000015 Cardiff / Caerdydd South Glamorgan / De Morgannwg Wales / Cymru WAL 70.8 16.2 42.7 255 60 324 85 20 108 6 260 12
W06000011 Swansea / Abertawe West Glamorgan / Gorllewin Morgan Wales / Cymru WAL 83.5 20.0 50.2 252 66 330 84 22 110 14 321 15
W06000012 Neath Port Talbot / Castell-nedd Port TalboWest Glamorgan / Gorllewin Morgan Wales / Cymru WAL 88.5 30.4 58.6 174 63 243 58 21 81 20 365 4
Notes: ICD-10 codes I20-I25. Directly age-standardised using the 2013 European Standard Population.
- indicates number of deaths considered too small to calculate rate.
Source: England: Mortality rates from Public Health England Public Health Profiles https://fingertips.phe.org.uk/profile/mortality-profile
Wales: Mortality rates from Health Maps Wales https://www.healthmapswales.wales.nhs.uk
Scotland: Mortality rates calculated in partnership with National Records of Scotland.
Northern Ireland: Mortality rates calculated in partnership with Northern Ireland Statistics and Research Agency.
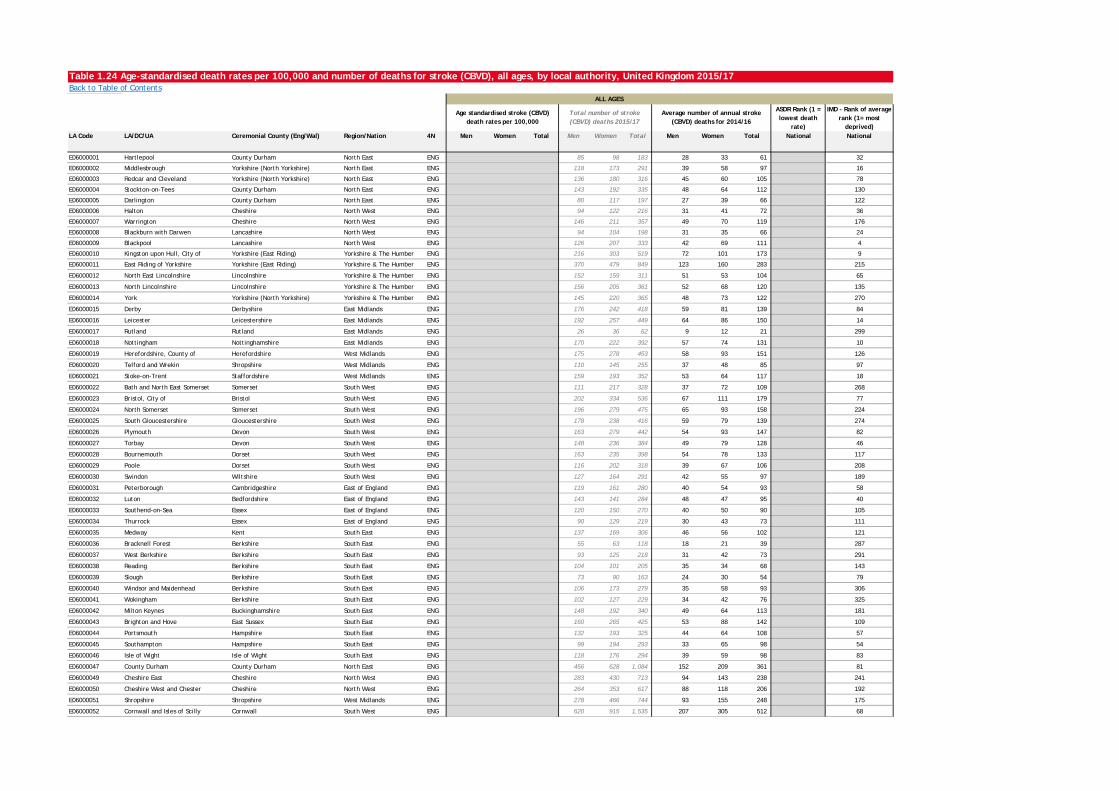
Table 1.24 Age-standardised death rates per 100,000 and number of deaths for stroke (CBVD), all ages, by local authority, United Kingdom 2015/17Back to Table of Contents
ASDR Rank (1 = lowest death
rate)
IMD - Rank of average rank (1= most
deprived)LA Code LA/DC/UA Ceremonial County (Eng/Wal) Region/Nation 4N Men Women Total Men Women Total Men Women Total National National
E06000001 Hartlepool County Durham North East ENG 85 98 183 28 33 61 32
E06000002 Middlesbrough Yorkshire (North Yorkshire) North East ENG 118 173 291 39 58 97 16
E06000003 Redcar and Cleveland Yorkshire (North Yorkshire) North East ENG 136 180 316 45 60 105 78
E06000004 Stockton-on-Tees County Durham North East ENG 143 192 335 48 64 112 130
E06000005 Darlington County Durham North East ENG 80 117 197 27 39 66 122
E06000006 Halton Cheshire North West ENG 94 122 216 31 41 72 36
E06000007 Warrington Cheshire North West ENG 146 211 357 49 70 119 176
E06000008 Blackburn with Darwen Lancashire North West ENG 94 104 198 31 35 66 24
E06000009 Blackpool Lancashire North West ENG 126 207 333 42 69 111 4
E06000010 Kingston upon Hull, City of Yorkshire (East Riding) Yorkshire & The Humber ENG 216 303 519 72 101 173 9
E06000011 East Riding of Yorkshire Yorkshire (East Riding) Yorkshire & The Humber ENG 370 479 849 123 160 283 215
E06000012 North East Lincolnshire Lincolnshire Yorkshire & The Humber ENG 152 159 311 51 53 104 65
E06000013 North Lincolnshire Lincolnshire Yorkshire & The Humber ENG 156 205 361 52 68 120 135
E06000014 York Yorkshire (North Yorkshire) Yorkshire & The Humber ENG 145 220 365 48 73 122 270
E06000015 Derby Derbyshire East Midlands ENG 176 242 418 59 81 139 84
E06000016 Leicester Leicestershire East Midlands ENG 192 257 449 64 86 150 14
E06000017 Rutland Rutland East Midlands ENG 26 36 62 9 12 21 299
E06000018 Nottingham Nottinghamshire East Midlands ENG 170 222 392 57 74 131 10
E06000019 Herefordshire, County of Herefordshire West Midlands ENG 175 278 453 58 93 151 126
E06000020 Telford and Wrekin Shropshire West Midlands ENG 110 145 255 37 48 85 97
E06000021 Stoke-on-Trent Staffordshire West Midlands ENG 159 193 352 53 64 117 18
E06000022 Bath and North East Somerset Somerset South West ENG 111 217 328 37 72 109 268
E06000023 Bristol, City of Bristol South West ENG 202 334 536 67 111 179 77
E06000024 North Somerset Somerset South West ENG 196 279 475 65 93 158 224
E06000025 South Gloucestershire Gloucestershire South West ENG 178 238 416 59 79 139 274
E06000026 Plymouth Devon South West ENG 163 279 442 54 93 147 82
E06000027 Torbay Devon South West ENG 148 236 384 49 79 128 46
E06000028 Bournemouth Dorset South West ENG 163 235 398 54 78 133 117
E06000029 Poole Dorset South West ENG 116 202 318 39 67 106 208
E06000030 Swindon Wiltshire South West ENG 127 164 291 42 55 97 189
E06000031 Peterborough Cambridgeshire East of England ENG 119 161 280 40 54 93 58
E06000032 Luton Bedfordshire East of England ENG 143 141 284 48 47 95 40
E06000033 Southend-on-Sea Essex East of England ENG 120 150 270 40 50 90 105
E06000034 Thurrock Essex East of England ENG 90 129 219 30 43 73 111
E06000035 Medway Kent South East ENG 137 169 306 46 56 102 121
E06000036 Bracknell Forest Berkshire South East ENG 55 63 118 18 21 39 287
E06000037 West Berkshire Berkshire South East ENG 93 125 218 31 42 73 291
E06000038 Reading Berkshire South East ENG 104 101 205 35 34 68 143
E06000039 Slough Berkshire South East ENG 73 90 163 24 30 54 79
E06000040 Windsor and Maidenhead Berkshire South East ENG 106 173 279 35 58 93 306
E06000041 Wokingham Berkshire South East ENG 102 127 229 34 42 76 325
E06000042 Milton Keynes Buckinghamshire South East ENG 148 192 340 49 64 113 181
E06000043 Brighton and Hove East Sussex South East ENG 160 265 425 53 88 142 109
E06000044 Portsmouth Hampshire South East ENG 132 193 325 44 64 108 57
E06000045 Southampton Hampshire South East ENG 99 194 293 33 65 98 54
E06000046 Isle of Wight Isle of Wight South East ENG 118 176 294 39 59 98 83
E06000047 County Durham County Durham North East ENG 456 628 1,084 152 209 361 81
E06000049 Cheshire East Cheshire North West ENG 283 430 713 94 143 238 241
E06000050 Cheshire West and Chester Cheshire North West ENG 264 353 617 88 118 206 192
E06000051 Shropshire Shropshire West Midlands ENG 278 466 744 93 155 248 175
E06000052 Cornwall and Isles of Scilly Cornwall South West ENG 620 915 1,535 207 305 512 68
ALL AGES
Age standardised stroke (CBVD) death rates per 100,000
Total number of stroke (CBVD) deaths 2015/17
Average number of annual stroke (CBVD) deaths for 2014/16
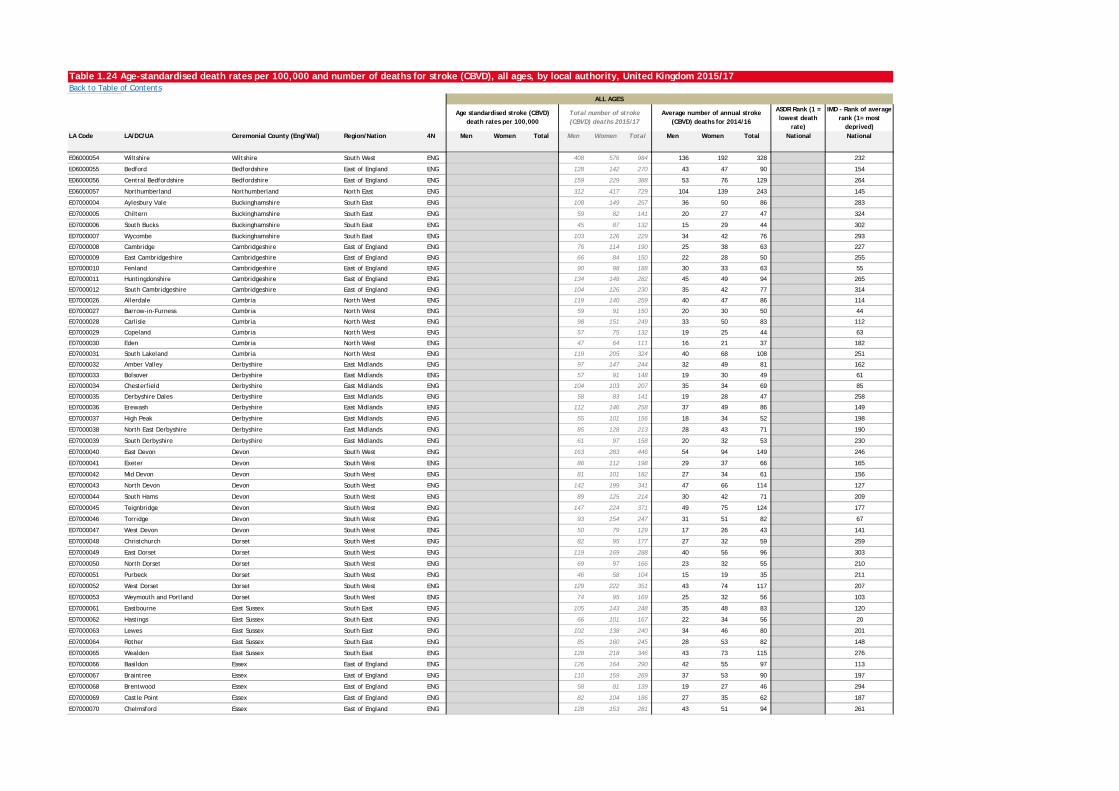
Table 1.24 Age-standardised death rates per 100,000 and number of deaths for stroke (CBVD), all ages, by local authority, United Kingdom 2015/17Back to Table of Contents
ASDR Rank (1 = lowest death
rate)
IMD - Rank of average rank (1= most
deprived)LA Code LA/DC/UA Ceremonial County (Eng/Wal) Region/Nation 4N Men Women Total Men Women Total Men Women Total National National
ALL AGES
Age standardised stroke (CBVD) death rates per 100,000
Total number of stroke (CBVD) deaths 2015/17
Average number of annual stroke (CBVD) deaths for 2014/16
E06000054 Wiltshire Wiltshire South West ENG 408 576 984 136 192 328 232
E06000055 Bedford Bedfordshire East of England ENG 128 142 270 43 47 90 154
E06000056 Central Bedfordshire Bedfordshire East of England ENG 159 229 388 53 76 129 264
E06000057 Northumberland Northumberland North East ENG 312 417 729 104 139 243 145
E07000004 Aylesbury Vale Buckinghamshire South East ENG 108 149 257 36 50 86 283
E07000005 Chiltern Buckinghamshire South East ENG 59 82 141 20 27 47 324
E07000006 South Bucks Buckinghamshire South East ENG 45 87 132 15 29 44 302
E07000007 Wycombe Buckinghamshire South East ENG 103 126 229 34 42 76 293
E07000008 Cambridge Cambridgeshire East of England ENG 76 114 190 25 38 63 227
E07000009 East Cambridgeshire Cambridgeshire East of England ENG 66 84 150 22 28 50 255
E07000010 Fenland Cambridgeshire East of England ENG 90 98 188 30 33 63 55
E07000011 Huntingdonshire Cambridgeshire East of England ENG 134 148 282 45 49 94 265
E07000012 South Cambridgeshire Cambridgeshire East of England ENG 104 126 230 35 42 77 314
E07000026 Allerdale Cumbria North West ENG 119 140 259 40 47 86 114
E07000027 Barrow-in-Furness Cumbria North West ENG 59 91 150 20 30 50 44
E07000028 Carlisle Cumbria North West ENG 98 151 249 33 50 83 112
E07000029 Copeland Cumbria North West ENG 57 75 132 19 25 44 63
E07000030 Eden Cumbria North West ENG 47 64 111 16 21 37 182
E07000031 South Lakeland Cumbria North West ENG 119 205 324 40 68 108 251
E07000032 Amber Valley Derbyshire East Midlands ENG 97 147 244 32 49 81 162
E07000033 Bolsover Derbyshire East Midlands ENG 57 91 148 19 30 49 61
E07000034 Chesterfield Derbyshire East Midlands ENG 104 103 207 35 34 69 85
E07000035 Derbyshire Dales Derbyshire East Midlands ENG 58 83 141 19 28 47 258
E07000036 Erewash Derbyshire East Midlands ENG 112 146 258 37 49 86 149
E07000037 High Peak Derbyshire East Midlands ENG 55 101 156 18 34 52 198
E07000038 North East Derbyshire Derbyshire East Midlands ENG 85 128 213 28 43 71 190
E07000039 South Derbyshire Derbyshire East Midlands ENG 61 97 158 20 32 53 230
E07000040 East Devon Devon South West ENG 163 283 446 54 94 149 246
E07000041 Exeter Devon South West ENG 86 112 198 29 37 66 165
E07000042 Mid Devon Devon South West ENG 81 101 182 27 34 61 156
E07000043 North Devon Devon South West ENG 142 199 341 47 66 114 127
E07000044 South Hams Devon South West ENG 89 125 214 30 42 71 209
E07000045 Teignbridge Devon South West ENG 147 224 371 49 75 124 177
E07000046 Torridge Devon South West ENG 93 154 247 31 51 82 67
E07000047 West Devon Devon South West ENG 50 79 129 17 26 43 141
E07000048 Christchurch Dorset South West ENG 82 95 177 27 32 59 259
E07000049 East Dorset Dorset South West ENG 119 169 288 40 56 96 303
E07000050 North Dorset Dorset South West ENG 69 97 166 23 32 55 210
E07000051 Purbeck Dorset South West ENG 46 58 104 15 19 35 211
E07000052 West Dorset Dorset South West ENG 129 222 351 43 74 117 207
E07000053 Weymouth and Portland Dorset South West ENG 74 95 169 25 32 56 103
E07000061 Eastbourne East Sussex South East ENG 105 143 248 35 48 83 120
E07000062 Hastings East Sussex South East ENG 66 101 167 22 34 56 20
E07000063 Lewes East Sussex South East ENG 102 138 240 34 46 80 201
E07000064 Rother East Sussex South East ENG 85 160 245 28 53 82 148
E07000065 Wealden East Sussex South East ENG 128 218 346 43 73 115 276
E07000066 Basildon Essex East of England ENG 126 164 290 42 55 97 113
E07000067 Braintree Essex East of England ENG 110 159 269 37 53 90 197
E07000068 Brentwood Essex East of England ENG 58 81 139 19 27 46 294
E07000069 Castle Point Essex East of England ENG 82 104 186 27 35 62 187
E07000070 Chelmsford Essex East of England ENG 128 153 281 43 51 94 261
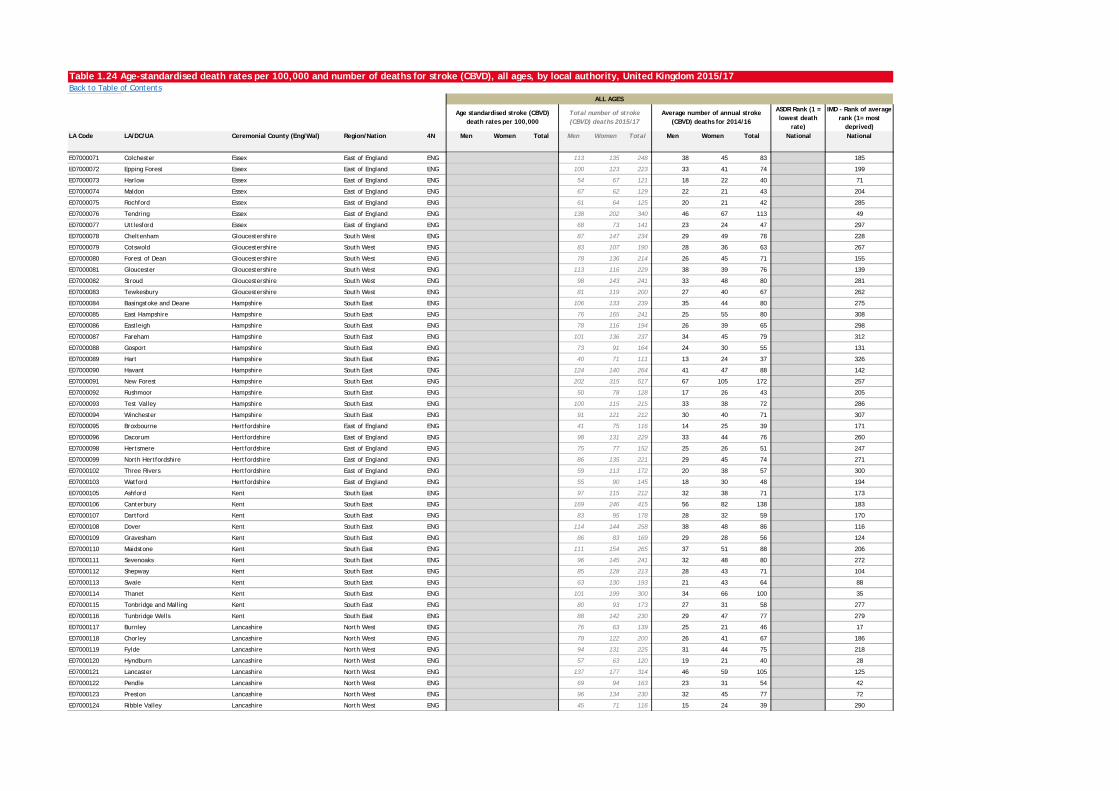
Table 1.24 Age-standardised death rates per 100,000 and number of deaths for stroke (CBVD), all ages, by local authority, United Kingdom 2015/17Back to Table of Contents
ASDR Rank (1 = lowest death
rate)
IMD - Rank of average rank (1= most
deprived)LA Code LA/DC/UA Ceremonial County (Eng/Wal) Region/Nation 4N Men Women Total Men Women Total Men Women Total National National
ALL AGES
Age standardised stroke (CBVD) death rates per 100,000
Total number of stroke (CBVD) deaths 2015/17
Average number of annual stroke (CBVD) deaths for 2014/16
E07000071 Colchester Essex East of England ENG 113 135 248 38 45 83 185
E07000072 Epping Forest Essex East of England ENG 100 123 223 33 41 74 199
E07000073 Harlow Essex East of England ENG 54 67 121 18 22 40 71
E07000074 Maldon Essex East of England ENG 67 62 129 22 21 43 204
E07000075 Rochford Essex East of England ENG 61 64 125 20 21 42 285
E07000076 Tendring Essex East of England ENG 138 202 340 46 67 113 49
E07000077 Uttlesford Essex East of England ENG 68 73 141 23 24 47 297
E07000078 Cheltenham Gloucestershire South West ENG 87 147 234 29 49 78 228
E07000079 Cotswold Gloucestershire South West ENG 83 107 190 28 36 63 267
E07000080 Forest of Dean Gloucestershire South West ENG 78 136 214 26 45 71 155
E07000081 Gloucester Gloucestershire South West ENG 113 116 229 38 39 76 139
E07000082 Stroud Gloucestershire South West ENG 98 143 241 33 48 80 281
E07000083 Tewkesbury Gloucestershire South West ENG 81 119 200 27 40 67 262
E07000084 Basingstoke and Deane Hampshire South East ENG 106 133 239 35 44 80 275
E07000085 East Hampshire Hampshire South East ENG 76 165 241 25 55 80 308
E07000086 Eastleigh Hampshire South East ENG 78 116 194 26 39 65 298
E07000087 Fareham Hampshire South East ENG 101 136 237 34 45 79 312
E07000088 Gosport Hampshire South East ENG 73 91 164 24 30 55 131
E07000089 Hart Hampshire South East ENG 40 71 111 13 24 37 326
E07000090 Havant Hampshire South East ENG 124 140 264 41 47 88 142
E07000091 New Forest Hampshire South East ENG 202 315 517 67 105 172 257
E07000092 Rushmoor Hampshire South East ENG 50 78 128 17 26 43 205
E07000093 Test Valley Hampshire South East ENG 100 115 215 33 38 72 286
E07000094 Winchester Hampshire South East ENG 91 121 212 30 40 71 307
E07000095 Broxbourne Hertfordshire East of England ENG 41 75 116 14 25 39 171
E07000096 Dacorum Hertfordshire East of England ENG 98 131 229 33 44 76 260
E07000098 Hertsmere Hertfordshire East of England ENG 75 77 152 25 26 51 247
E07000099 North Hertfordshire Hertfordshire East of England ENG 86 135 221 29 45 74 271
E07000102 Three Rivers Hertfordshire East of England ENG 59 113 172 20 38 57 300
E07000103 Watford Hertfordshire East of England ENG 55 90 145 18 30 48 194
E07000105 Ashford Kent South East ENG 97 115 212 32 38 71 173
E07000106 Canterbury Kent South East ENG 169 246 415 56 82 138 183
E07000107 Dartford Kent South East ENG 83 95 178 28 32 59 170
E07000108 Dover Kent South East ENG 114 144 258 38 48 86 116
E07000109 Gravesham Kent South East ENG 86 83 169 29 28 56 124
E07000110 Maidstone Kent South East ENG 111 154 265 37 51 88 206
E07000111 Sevenoaks Kent South East ENG 96 145 241 32 48 80 272
E07000112 Shepway Kent South East ENG 85 128 213 28 43 71 104
E07000113 Swale Kent South East ENG 63 130 193 21 43 64 88
E07000114 Thanet Kent South East ENG 101 199 300 34 66 100 35
E07000115 Tonbridge and Malling Kent South East ENG 80 93 173 27 31 58 277
E07000116 Tunbridge Wells Kent South East ENG 88 142 230 29 47 77 279
E07000117 Burnley Lancashire North West ENG 76 63 139 25 21 46 17
E07000118 Chorley Lancashire North West ENG 78 122 200 26 41 67 186
E07000119 Fylde Lancashire North West ENG 94 131 225 31 44 75 218
E07000120 Hyndburn Lancashire North West ENG 57 63 120 19 21 40 28
E07000121 Lancaster Lancashire North West ENG 137 177 314 46 59 105 125
E07000122 Pendle Lancashire North West ENG 69 94 163 23 31 54 42
E07000123 Preston Lancashire North West ENG 96 134 230 32 45 77 72
E07000124 Ribble Valley Lancashire North West ENG 45 71 116 15 24 39 290
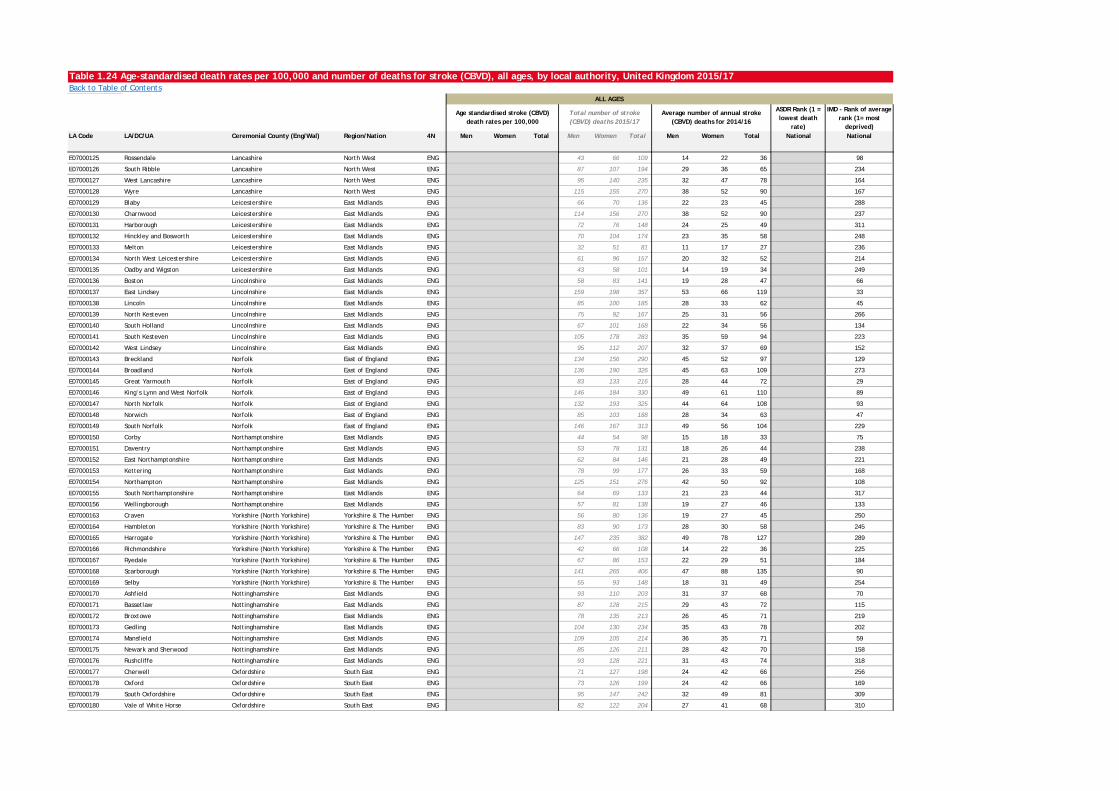
Table 1.24 Age-standardised death rates per 100,000 and number of deaths for stroke (CBVD), all ages, by local authority, United Kingdom 2015/17Back to Table of Contents
ASDR Rank (1 = lowest death
rate)
IMD - Rank of average rank (1= most
deprived)LA Code LA/DC/UA Ceremonial County (Eng/Wal) Region/Nation 4N Men Women Total Men Women Total Men Women Total National National
ALL AGES
Age standardised stroke (CBVD) death rates per 100,000
Total number of stroke (CBVD) deaths 2015/17
Average number of annual stroke (CBVD) deaths for 2014/16
E07000125 Rossendale Lancashire North West ENG 43 66 109 14 22 36 98
E07000126 South Ribble Lancashire North West ENG 87 107 194 29 36 65 234
E07000127 West Lancashire Lancashire North West ENG 95 140 235 32 47 78 164
E07000128 Wyre Lancashire North West ENG 115 155 270 38 52 90 167
E07000129 Blaby Leicestershire East Midlands ENG 66 70 136 22 23 45 288
E07000130 Charnwood Leicestershire East Midlands ENG 114 156 270 38 52 90 237
E07000131 Harborough Leicestershire East Midlands ENG 72 76 148 24 25 49 311
E07000132 Hinckley and Bosworth Leicestershire East Midlands ENG 70 104 174 23 35 58 248
E07000133 Melton Leicestershire East Midlands ENG 32 51 81 11 17 27 236
E07000134 North West Leicestershire Leicestershire East Midlands ENG 61 96 157 20 32 52 214
E07000135 Oadby and Wigston Leicestershire East Midlands ENG 43 58 101 14 19 34 249
E07000136 Boston Lincolnshire East Midlands ENG 58 83 141 19 28 47 66
E07000137 East Lindsey Lincolnshire East Midlands ENG 159 198 357 53 66 119 33
E07000138 Lincoln Lincolnshire East Midlands ENG 85 100 185 28 33 62 45
E07000139 North Kesteven Lincolnshire East Midlands ENG 75 92 167 25 31 56 266
E07000140 South Holland Lincolnshire East Midlands ENG 67 101 168 22 34 56 134
E07000141 South Kesteven Lincolnshire East Midlands ENG 105 178 283 35 59 94 223
E07000142 West Lindsey Lincolnshire East Midlands ENG 95 112 207 32 37 69 152
E07000143 Breckland Norfolk East of England ENG 134 156 290 45 52 97 129
E07000144 Broadland Norfolk East of England ENG 136 190 326 45 63 109 273
E07000145 Great Yarmouth Norfolk East of England ENG 83 133 216 28 44 72 29
E07000146 King’s Lynn and West Norfolk Norfolk East of England ENG 146 184 330 49 61 110 89
E07000147 North Norfolk Norfolk East of England ENG 132 193 325 44 64 108 93
E07000148 Norwich Norfolk East of England ENG 85 103 188 28 34 63 47
E07000149 South Norfolk Norfolk East of England ENG 146 167 313 49 56 104 229
E07000150 Corby Northamptonshire East Midlands ENG 44 54 98 15 18 33 75
E07000151 Daventry Northamptonshire East Midlands ENG 53 78 131 18 26 44 238
E07000152 East Northamptonshire Northamptonshire East Midlands ENG 62 84 146 21 28 49 221
E07000153 Kettering Northamptonshire East Midlands ENG 78 99 177 26 33 59 168
E07000154 Northampton Northamptonshire East Midlands ENG 125 151 276 42 50 92 108
E07000155 South Northamptonshire Northamptonshire East Midlands ENG 64 69 133 21 23 44 317
E07000156 Wellingborough Northamptonshire East Midlands ENG 57 81 138 19 27 46 133
E07000163 Craven Yorkshire (North Yorkshire) Yorkshire & The Humber ENG 56 80 136 19 27 45 250
E07000164 Hambleton Yorkshire (North Yorkshire) Yorkshire & The Humber ENG 83 90 173 28 30 58 245
E07000165 Harrogate Yorkshire (North Yorkshire) Yorkshire & The Humber ENG 147 235 382 49 78 127 289
E07000166 Richmondshire Yorkshire (North Yorkshire) Yorkshire & The Humber ENG 42 66 108 14 22 36 225
E07000167 Ryedale Yorkshire (North Yorkshire) Yorkshire & The Humber ENG 67 86 153 22 29 51 184
E07000168 Scarborough Yorkshire (North Yorkshire) Yorkshire & The Humber ENG 141 265 406 47 88 135 90
E07000169 Selby Yorkshire (North Yorkshire) Yorkshire & The Humber ENG 55 93 148 18 31 49 254
E07000170 Ashfield Nottinghamshire East Midlands ENG 93 110 203 31 37 68 70
E07000171 Bassetlaw Nottinghamshire East Midlands ENG 87 128 215 29 43 72 115
E07000172 Broxtowe Nottinghamshire East Midlands ENG 78 135 213 26 45 71 219
E07000173 Gedling Nottinghamshire East Midlands ENG 104 130 234 35 43 78 202
E07000174 Mansfield Nottinghamshire East Midlands ENG 109 105 214 36 35 71 59
E07000175 Newark and Sherwood Nottinghamshire East Midlands ENG 85 126 211 28 42 70 158
E07000176 Rushcliffe Nottinghamshire East Midlands ENG 93 128 221 31 43 74 318
E07000177 Cherwell Oxfordshire South East ENG 71 127 198 24 42 66 256
E07000178 Oxford Oxfordshire South East ENG 73 126 199 24 42 66 169
E07000179 South Oxfordshire Oxfordshire South East ENG 95 147 242 32 49 81 309
E07000180 Vale of White Horse Oxfordshire South East ENG 82 122 204 27 41 68 310
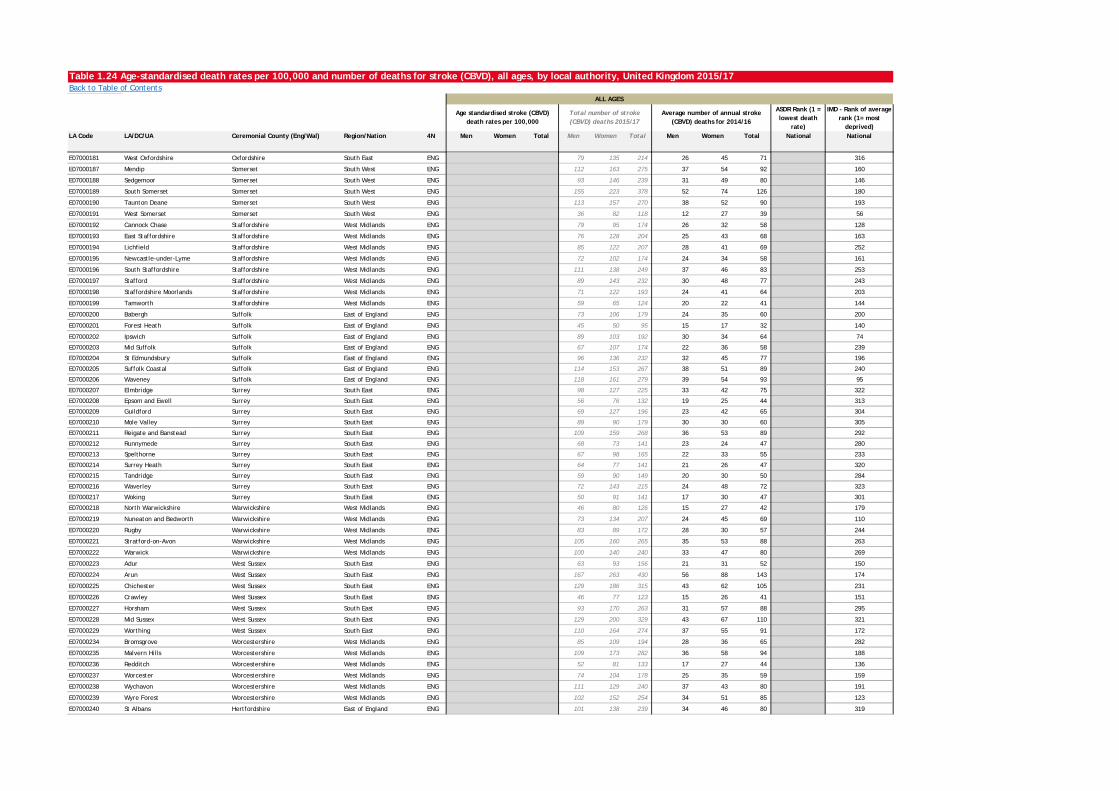
Table 1.24 Age-standardised death rates per 100,000 and number of deaths for stroke (CBVD), all ages, by local authority, United Kingdom 2015/17Back to Table of Contents
ASDR Rank (1 = lowest death
rate)
IMD - Rank of average rank (1= most
deprived)LA Code LA/DC/UA Ceremonial County (Eng/Wal) Region/Nation 4N Men Women Total Men Women Total Men Women Total National National
ALL AGES
Age standardised stroke (CBVD) death rates per 100,000
Total number of stroke (CBVD) deaths 2015/17
Average number of annual stroke (CBVD) deaths for 2014/16
E07000181 West Oxfordshire Oxfordshire South East ENG 79 135 214 26 45 71 316
E07000187 Mendip Somerset South West ENG 112 163 275 37 54 92 160
E07000188 Sedgemoor Somerset South West ENG 93 146 239 31 49 80 146
E07000189 South Somerset Somerset South West ENG 155 223 378 52 74 126 180
E07000190 Taunton Deane Somerset South West ENG 113 157 270 38 52 90 193
E07000191 West Somerset Somerset South West ENG 36 82 118 12 27 39 56
E07000192 Cannock Chase Staffordshire West Midlands ENG 79 95 174 26 32 58 128
E07000193 East Staffordshire Staffordshire West Midlands ENG 76 128 204 25 43 68 163
E07000194 Lichfield Staffordshire West Midlands ENG 85 122 207 28 41 69 252
E07000195 Newcastle-under-Lyme Staffordshire West Midlands ENG 72 102 174 24 34 58 161
E07000196 South Staffordshire Staffordshire West Midlands ENG 111 138 249 37 46 83 253
E07000197 Stafford Staffordshire West Midlands ENG 89 143 232 30 48 77 243
E07000198 Staffordshire Moorlands Staffordshire West Midlands ENG 71 122 193 24 41 64 203
E07000199 Tamworth Staffordshire West Midlands ENG 59 65 124 20 22 41 144
E07000200 Babergh Suffolk East of England ENG 73 106 179 24 35 60 200
E07000201 Forest Heath Suffolk East of England ENG 45 50 95 15 17 32 140
E07000202 Ipswich Suffolk East of England ENG 89 103 192 30 34 64 74
E07000203 Mid Suffolk Suffolk East of England ENG 67 107 174 22 36 58 239
E07000204 St Edmundsbury Suffolk East of England ENG 96 136 232 32 45 77 196
E07000205 Suffolk Coastal Suffolk East of England ENG 114 153 267 38 51 89 240
E07000206 Waveney Suffolk East of England ENG 118 161 279 39 54 93 95
E07000207 Elmbridge Surrey South East ENG 98 127 225 33 42 75 322
E07000208 Epsom and Ewell Surrey South East ENG 56 76 132 19 25 44 313
E07000209 Guildford Surrey South East ENG 69 127 196 23 42 65 304
E07000210 Mole Valley Surrey South East ENG 89 90 179 30 30 60 305
E07000211 Reigate and Banstead Surrey South East ENG 109 159 268 36 53 89 292
E07000212 Runnymede Surrey South East ENG 68 73 141 23 24 47 280
E07000213 Spelthorne Surrey South East ENG 67 98 165 22 33 55 233
E07000214 Surrey Heath Surrey South East ENG 64 77 141 21 26 47 320
E07000215 Tandridge Surrey South East ENG 59 90 149 20 30 50 284
E07000216 Waverley Surrey South East ENG 72 143 215 24 48 72 323
E07000217 Woking Surrey South East ENG 50 91 141 17 30 47 301
E07000218 North Warwickshire Warwickshire West Midlands ENG 46 80 126 15 27 42 179
E07000219 Nuneaton and Bedworth Warwickshire West Midlands ENG 73 134 207 24 45 69 110
E07000220 Rugby Warwickshire West Midlands ENG 83 89 172 28 30 57 244
E07000221 Stratford-on-Avon Warwickshire West Midlands ENG 105 160 265 35 53 88 263
E07000222 Warwick Warwickshire West Midlands ENG 100 140 240 33 47 80 269
E07000223 Adur West Sussex South East ENG 63 93 156 21 31 52 150
E07000224 Arun West Sussex South East ENG 167 263 430 56 88 143 174
E07000225 Chichester West Sussex South East ENG 129 186 315 43 62 105 231
E07000226 Crawley West Sussex South East ENG 46 77 123 15 26 41 151
E07000227 Horsham West Sussex South East ENG 93 170 263 31 57 88 295
E07000228 Mid Sussex West Sussex South East ENG 129 200 329 43 67 110 321
E07000229 Worthing West Sussex South East ENG 110 164 274 37 55 91 172
E07000234 Bromsgrove Worcestershire West Midlands ENG 85 109 194 28 36 65 282
E07000235 Malvern Hills Worcestershire West Midlands ENG 109 173 282 36 58 94 188
E07000236 Redditch Worcestershire West Midlands ENG 52 81 133 17 27 44 136
E07000237 Worcester Worcestershire West Midlands ENG 74 104 178 25 35 59 159
E07000238 Wychavon Worcestershire West Midlands ENG 111 129 240 37 43 80 191
E07000239 Wyre Forest Worcestershire West Midlands ENG 102 152 254 34 51 85 123
E07000240 St Albans Hertfordshire East of England ENG 101 138 239 34 46 80 319
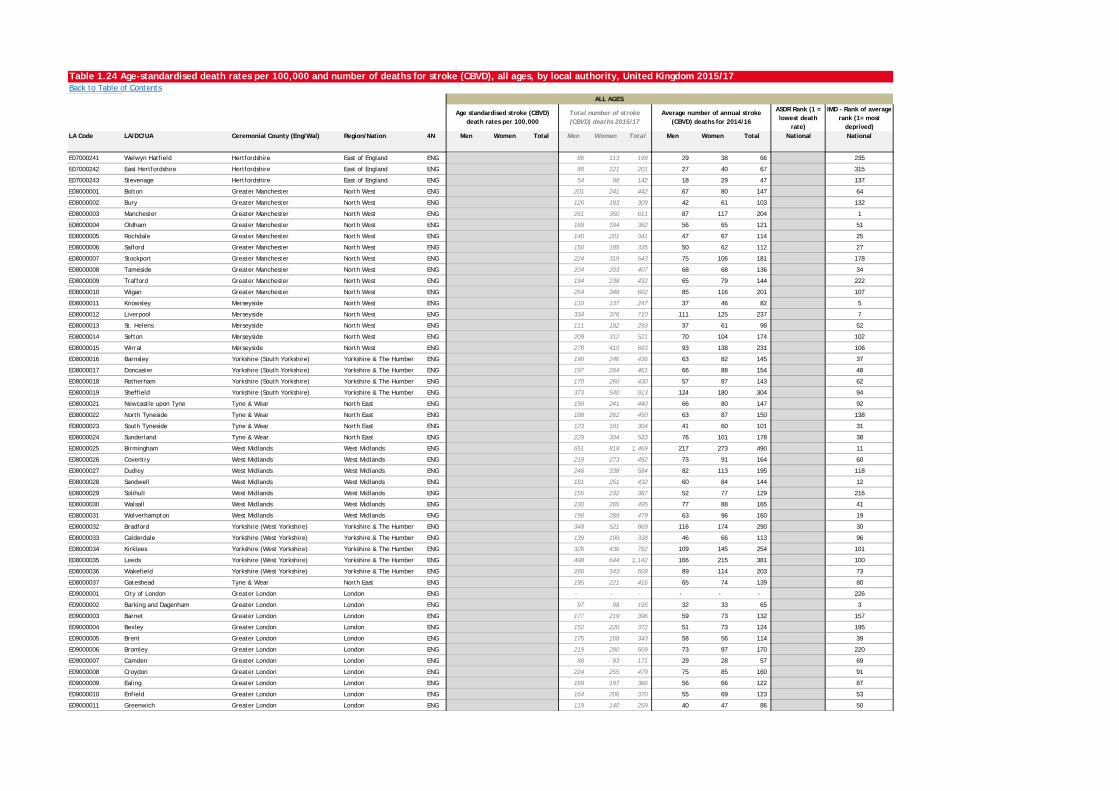
Table 1.24 Age-standardised death rates per 100,000 and number of deaths for stroke (CBVD), all ages, by local authority, United Kingdom 2015/17Back to Table of Contents
ASDR Rank (1 = lowest death
rate)
IMD - Rank of average rank (1= most
deprived)LA Code LA/DC/UA Ceremonial County (Eng/Wal) Region/Nation 4N Men Women Total Men Women Total Men Women Total National National
ALL AGES
Age standardised stroke (CBVD) death rates per 100,000
Total number of stroke (CBVD) deaths 2015/17
Average number of annual stroke (CBVD) deaths for 2014/16
E07000241 Welwyn Hatfield Hertfordshire East of England ENG 86 113 199 29 38 66 235
E07000242 East Hertfordshire Hertfordshire East of England ENG 80 121 201 27 40 67 315
E07000243 Stevenage Hertfordshire East of England ENG 54 88 142 18 29 47 137
E08000001 Bolton Greater Manchester North West ENG 201 241 442 67 80 147 64
E08000002 Bury Greater Manchester North West ENG 126 183 309 42 61 103 132
E08000003 Manchester Greater Manchester North West ENG 261 350 611 87 117 204 1
E08000004 Oldham Greater Manchester North West ENG 168 194 362 56 65 121 51
E08000005 Rochdale Greater Manchester North West ENG 140 201 341 47 67 114 25
E08000006 Salford Greater Manchester North West ENG 150 185 335 50 62 112 27
E08000007 Stockport Greater Manchester North West ENG 224 319 543 75 106 181 178
E08000008 Tameside Greater Manchester North West ENG 204 203 407 68 68 136 34
E08000009 Trafford Greater Manchester North West ENG 194 238 432 65 79 144 222
E08000010 Wigan Greater Manchester North West ENG 254 348 602 85 116 201 107
E08000011 Knowsley Merseyside North West ENG 110 137 247 37 46 82 5
E08000012 Liverpool Merseyside North West ENG 334 376 710 111 125 237 7
E08000013 St. Helens Merseyside North West ENG 111 182 293 37 61 98 52
E08000014 Sefton Merseyside North West ENG 209 312 521 70 104 174 102
E08000015 Wirral Merseyside North West ENG 278 415 693 93 138 231 106
E08000016 Barnsley Yorkshire (South Yorkshire) Yorkshire & The Humber ENG 190 246 436 63 82 145 37
E08000017 Doncaster Yorkshire (South Yorkshire) Yorkshire & The Humber ENG 197 264 461 66 88 154 48
E08000018 Rotherham Yorkshire (South Yorkshire) Yorkshire & The Humber ENG 170 260 430 57 87 143 62
E08000019 Sheffield Yorkshire (South Yorkshire) Yorkshire & The Humber ENG 373 540 913 124 180 304 94
E08000021 Newcastle upon Tyne Tyne & Wear North East ENG 199 241 440 66 80 147 92
E08000022 North Tyneside Tyne & Wear North East ENG 188 262 450 63 87 150 138
E08000023 South Tyneside Tyne & Wear North East ENG 123 181 304 41 60 101 31
E08000024 Sunderland Tyne & Wear North East ENG 229 304 533 76 101 178 38
E08000025 Birmingham West Midlands West Midlands ENG 651 818 1,469 217 273 490 11
E08000026 Coventry West Midlands West Midlands ENG 219 273 492 73 91 164 60
E08000027 Dudley West Midlands West Midlands ENG 246 338 584 82 113 195 118
E08000028 Sandwell West Midlands West Midlands ENG 181 251 432 60 84 144 12
E08000029 Solihull West Midlands West Midlands ENG 155 232 387 52 77 129 216
E08000030 Walsall West Midlands West Midlands ENG 230 265 495 77 88 165 41
E08000031 Wolverhampton West Midlands West Midlands ENG 190 289 479 63 96 160 19
E08000032 Bradford Yorkshire (West Yorkshire) Yorkshire & The Humber ENG 348 521 869 116 174 290 30
E08000033 Calderdale Yorkshire (West Yorkshire) Yorkshire & The Humber ENG 139 199 338 46 66 113 96
E08000034 Kirklees Yorkshire (West Yorkshire) Yorkshire & The Humber ENG 326 436 762 109 145 254 101
E08000035 Leeds Yorkshire (West Yorkshire) Yorkshire & The Humber ENG 498 644 1,142 166 215 381 100
E08000036 Wakefield Yorkshire (West Yorkshire) Yorkshire & The Humber ENG 266 343 609 89 114 203 73
E08000037 Gateshead Tyne & Wear North East ENG 195 221 416 65 74 139 80
E09000001 City of London Greater London London ENG - - - - - - 226
E09000002 Barking and Dagenham Greater London London ENG 97 98 195 32 33 65 3
E09000003 Barnet Greater London London ENG 177 219 396 59 73 132 157
E09000004 Bexley Greater London London ENG 152 220 372 51 73 124 195
E09000005 Brent Greater London London ENG 175 168 343 58 56 114 39
E09000006 Bromley Greater London London ENG 219 290 509 73 97 170 220
E09000007 Camden Greater London London ENG 88 83 171 29 28 57 69
E09000008 Croydon Greater London London ENG 224 255 479 75 85 160 91
E09000009 Ealing Greater London London ENG 169 197 366 56 66 122 87
E09000010 Enfield Greater London London ENG 164 206 370 55 69 123 53
E09000011 Greenwich Greater London London ENG 119 140 259 40 47 86 50
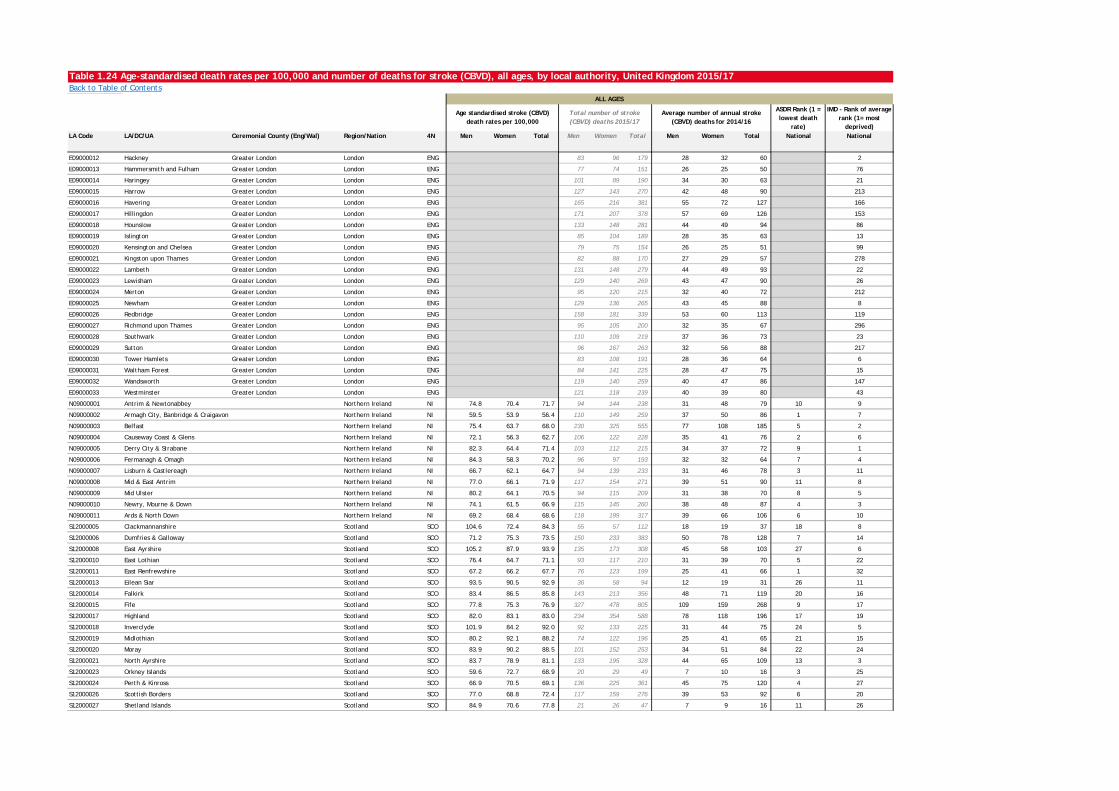
Table 1.24 Age-standardised death rates per 100,000 and number of deaths for stroke (CBVD), all ages, by local authority, United Kingdom 2015/17Back to Table of Contents
ASDR Rank (1 = lowest death
rate)
IMD - Rank of average rank (1= most
deprived)LA Code LA/DC/UA Ceremonial County (Eng/Wal) Region/Nation 4N Men Women Total Men Women Total Men Women Total National National
ALL AGES
Age standardised stroke (CBVD) death rates per 100,000
Total number of stroke (CBVD) deaths 2015/17
Average number of annual stroke (CBVD) deaths for 2014/16
E09000012 Hackney Greater London London ENG 83 96 179 28 32 60 2
E09000013 Hammersmith and Fulham Greater London London ENG 77 74 151 26 25 50 76
E09000014 Haringey Greater London London ENG 101 89 190 34 30 63 21
E09000015 Harrow Greater London London ENG 127 143 270 42 48 90 213
E09000016 Havering Greater London London ENG 165 216 381 55 72 127 166
E09000017 Hillingdon Greater London London ENG 171 207 378 57 69 126 153
E09000018 Hounslow Greater London London ENG 133 148 281 44 49 94 86
E09000019 Islington Greater London London ENG 85 104 189 28 35 63 13
E09000020 Kensington and Chelsea Greater London London ENG 79 75 154 26 25 51 99
E09000021 Kingston upon Thames Greater London London ENG 82 88 170 27 29 57 278
E09000022 Lambeth Greater London London ENG 131 148 279 44 49 93 22
E09000023 Lewisham Greater London London ENG 129 140 269 43 47 90 26
E09000024 Merton Greater London London ENG 95 120 215 32 40 72 212
E09000025 Newham Greater London London ENG 129 136 265 43 45 88 8
E09000026 Redbridge Greater London London ENG 158 181 339 53 60 113 119
E09000027 Richmond upon Thames Greater London London ENG 95 105 200 32 35 67 296
E09000028 Southwark Greater London London ENG 110 109 219 37 36 73 23
E09000029 Sutton Greater London London ENG 96 167 263 32 56 88 217
E09000030 Tower Hamlets Greater London London ENG 83 108 191 28 36 64 6
E09000031 Waltham Forest Greater London London ENG 84 141 225 28 47 75 15
E09000032 Wandsworth Greater London London ENG 119 140 259 40 47 86 147
E09000033 Westminster Greater London London ENG 121 118 239 40 39 80 43
N09000001 Antrim & Newtonabbey Northern Ireland NI 74.8 70.4 71.7 94 144 238 31 48 79 10 9
N09000002 Armagh City, Banbridge & Craigavon Northern Ireland NI 59.5 53.9 56.4 110 149 259 37 50 86 1 7
N09000003 Belfast Northern Ireland NI 75.4 63.7 68.0 230 325 555 77 108 185 5 2
N09000004 Causeway Coast & Glens Northern Ireland NI 72.1 56.3 62.7 106 122 228 35 41 76 2 6
N09000005 Derry City & Strabane Northern Ireland NI 82.3 64.4 71.4 103 112 215 34 37 72 9 1
N09000006 Fermanagh & Omagh Northern Ireland NI 84.3 58.3 70.2 96 97 193 32 32 64 7 4
N09000007 Lisburn & Castlereagh Northern Ireland NI 66.7 62.1 64.7 94 139 233 31 46 78 3 11
N09000008 Mid & East Antrim Northern Ireland NI 77.0 66.1 71.9 117 154 271 39 51 90 11 8
N09000009 Mid Ulster Northern Ireland NI 80.2 64.1 70.5 94 115 209 31 38 70 8 5
N09000010 Newry, Mourne & Down Northern Ireland NI 74.1 61.5 66.9 115 145 260 38 48 87 4 3
N09000011 Ards & North Down Northern Ireland NI 69.2 68.4 68.6 118 199 317 39 66 106 6 10
S12000005 Clackmannanshire Scotland SCO 104.6 72.4 84.3 55 57 112 18 19 37 18 8
S12000006 Dumfries & Galloway Scotland SCO 71.2 75.3 73.5 150 233 383 50 78 128 7 14
S12000008 East Ayrshire Scotland SCO 105.2 87.9 93.9 135 173 308 45 58 103 27 6
S12000010 East Lothian Scotland SCO 76.4 64.7 71.1 93 117 210 31 39 70 5 22
S12000011 East Renfrewshire Scotland SCO 67.2 66.2 67.7 76 123 199 25 41 66 1 32
S12000013 Eilean Siar Scotland SCO 93.5 90.5 92.9 36 58 94 12 19 31 26 11
S12000014 Falkirk Scotland SCO 83.4 86.5 85.8 143 213 356 48 71 119 20 16
S12000015 Fife Scotland SCO 77.8 75.3 76.9 327 478 805 109 159 268 9 17
S12000017 Highland Scotland SCO 82.0 83.1 83.0 234 354 588 78 118 196 17 19
S12000018 Inverclyde Scotland SCO 101.9 84.2 92.0 92 133 225 31 44 75 24 5
S12000019 Midlothian Scotland SCO 80.2 92.1 88.2 74 122 196 25 41 65 21 15
S12000020 Moray Scotland SCO 83.9 90.2 88.5 101 152 253 34 51 84 22 24
S12000021 North Ayrshire Scotland SCO 83.7 78.9 81.1 133 195 328 44 65 109 13 3
S12000023 Orkney Islands Scotland SCO 59.6 72.7 68.9 20 29 49 7 10 16 3 25
S12000024 Perth & Kinross Scotland SCO 66.9 70.5 69.1 136 225 361 45 75 120 4 27
S12000026 Scottish Borders Scotland SCO 77.0 68.8 72.4 117 159 276 39 53 92 6 20
S12000027 Shetland Islands Scotland SCO 84.9 70.6 77.8 21 26 47 7 9 16 11 26
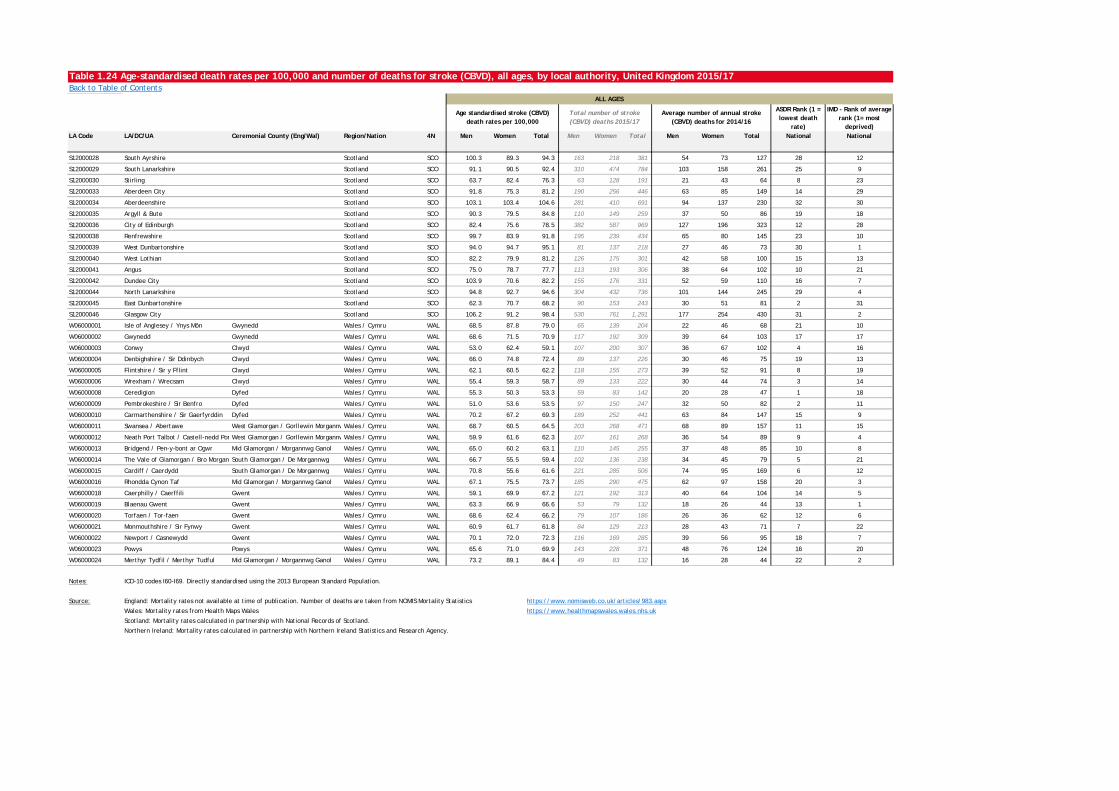
Table 1.24 Age-standardised death rates per 100,000 and number of deaths for stroke (CBVD), all ages, by local authority, United Kingdom 2015/17Back to Table of Contents
ASDR Rank (1 = lowest death
rate)
IMD - Rank of average rank (1= most
deprived)LA Code LA/DC/UA Ceremonial County (Eng/Wal) Region/Nation 4N Men Women Total Men Women Total Men Women Total National National
ALL AGES
Age standardised stroke (CBVD) death rates per 100,000
Total number of stroke (CBVD) deaths 2015/17
Average number of annual stroke (CBVD) deaths for 2014/16
S12000028 South Ayrshire Scotland SCO 100.3 89.3 94.3 163 218 381 54 73 127 28 12
S12000029 South Lanarkshire Scotland SCO 91.1 90.5 92.4 310 474 784 103 158 261 25 9
S12000030 Stirling Scotland SCO 63.7 82.4 76.3 63 128 191 21 43 64 8 23
S12000033 Aberdeen City Scotland SCO 91.8 75.3 81.2 190 256 446 63 85 149 14 29
S12000034 Aberdeenshire Scotland SCO 103.1 103.4 104.6 281 410 691 94 137 230 32 30
S12000035 Argyll & Bute Scotland SCO 90.3 79.5 84.8 110 149 259 37 50 86 19 18
S12000036 City of Edinburgh Scotland SCO 82.4 75.6 78.5 382 587 969 127 196 323 12 28
S12000038 Renfrewshire Scotland SCO 99.7 83.9 91.8 195 239 434 65 80 145 23 10
S12000039 West Dunbartonshire Scotland SCO 94.0 94.7 95.1 81 137 218 27 46 73 30 1
S12000040 West Lothian Scotland SCO 82.2 79.9 81.2 126 175 301 42 58 100 15 13
S12000041 Angus Scotland SCO 75.0 78.7 77.7 113 193 306 38 64 102 10 21
S12000042 Dundee City Scotland SCO 103.9 70.6 82.2 155 176 331 52 59 110 16 7
S12000044 North Lanarkshire Scotland SCO 94.8 92.7 94.6 304 432 736 101 144 245 29 4
S12000045 East Dunbartonshire Scotland SCO 62.3 70.7 68.2 90 153 243 30 51 81 2 31
S12000046 Glasgow City Scotland SCO 106.2 91.2 98.4 530 761 1,291 177 254 430 31 2
W06000001 Isle of Anglesey / Ynys Môn Gwynedd Wales / Cymru WAL 68.5 87.8 79.0 65 139 204 22 46 68 21 10
W06000002 Gwynedd Gwynedd Wales / Cymru WAL 68.6 71.5 70.9 117 192 309 39 64 103 17 17
W06000003 Conwy Clwyd Wales / Cymru WAL 53.0 62.4 59.1 107 200 307 36 67 102 4 16
W06000004 Denbighshire / Sir Ddinbych Clwyd Wales / Cymru WAL 66.0 74.8 72.4 89 137 226 30 46 75 19 13
W06000005 Flintshire / Sir y Fflint Clwyd Wales / Cymru WAL 62.1 60.5 62.2 118 155 273 39 52 91 8 19
W06000006 Wrexham / Wrecsam Clwyd Wales / Cymru WAL 55.4 59.3 58.7 89 133 222 30 44 74 3 14
W06000008 Ceredigion Dyfed Wales / Cymru WAL 55.3 50.3 53.3 59 83 142 20 28 47 1 18
W06000009 Pembrokeshire / Sir Benfro Dyfed Wales / Cymru WAL 51.0 53.6 53.5 97 150 247 32 50 82 2 11
W06000010 Carmarthenshire / Sir Gaerfyrddin Dyfed Wales / Cymru WAL 70.2 67.2 69.3 189 252 441 63 84 147 15 9
W06000011 Swansea / Abertawe West Glamorgan / Gorllewin MorgannwWales / Cymru WAL 68.7 60.5 64.5 203 268 471 68 89 157 11 15
W06000012 Neath Port Talbot / Castell-nedd Por West Glamorgan / Gorllewin MorgannwWales / Cymru WAL 59.9 61.6 62.3 107 161 268 36 54 89 9 4
W06000013 Bridgend / Pen-y-bont ar Ogwr Mid Glamorgan / Morgannwg Ganol Wales / Cymru WAL 65.0 60.2 63.1 110 145 255 37 48 85 10 8
W06000014 The Vale of Glamorgan / Bro MorgannSouth Glamorgan / De Morgannwg Wales / Cymru WAL 66.7 55.5 59.4 102 136 238 34 45 79 5 21
W06000015 Cardiff / Caerdydd South Glamorgan / De Morgannwg Wales / Cymru WAL 70.8 55.6 61.6 221 285 506 74 95 169 6 12
W06000016 Rhondda Cynon Taf Mid Glamorgan / Morgannwg Ganol Wales / Cymru WAL 67.1 75.5 73.7 185 290 475 62 97 158 20 3
W06000018 Caerphilly / Caerffili Gwent Wales / Cymru WAL 59.1 69.9 67.2 121 192 313 40 64 104 14 5
W06000019 Blaenau Gwent Gwent Wales / Cymru WAL 63.3 66.9 66.6 53 79 132 18 26 44 13 1
W06000020 Torfaen / Tor-faen Gwent Wales / Cymru WAL 68.6 62.4 66.2 79 107 186 26 36 62 12 6
W06000021 Monmouthshire / Sir Fynwy Gwent Wales / Cymru WAL 60.9 61.7 61.8 84 129 213 28 43 71 7 22
W06000022 Newport / Casnewydd Gwent Wales / Cymru WAL 70.1 72.0 72.3 116 169 285 39 56 95 18 7
W06000023 Powys Powys Wales / Cymru WAL 65.6 71.0 69.9 143 228 371 48 76 124 16 20
W06000024 Merthyr Tydfil / Merthyr Tudful Mid Glamorgan / Morgannwg Ganol Wales / Cymru WAL 73.2 89.1 84.4 49 83 132 16 28 44 22 2
Notes: ICD-10 codes I60-I69. Directly standardised using the 2013 European Standard Population.
Source: England: Mortality rates not available at time of publication. Number of deaths are taken from NOMIS Mortality Statistics https://www.nomisweb.co.uk/articles/983.aspx
Wales: Mortality rates from Health Maps Wales https://www.healthmapswales.wales.nhs.uk
Scotland: Mortality rates calculated in partnership with National Records of Scotland.
Northern Ireland: Mortality rates calculated in partnership with Northern Ireland Statistics and Research Agency.
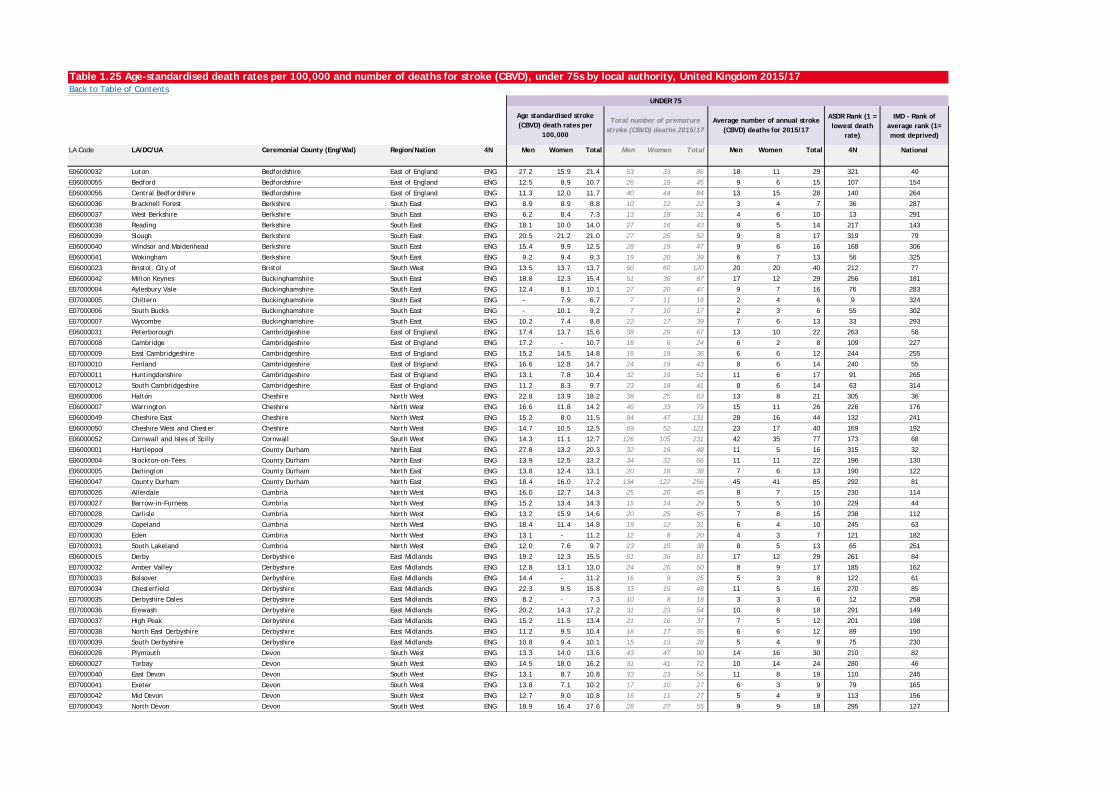
Table 1.25 Age-standardised death rates per 100,000 and number of deaths for stroke (CBVD), under 75s by local authority, United Kingdom 2015/17Back to Table of Contents
ASDR Rank (1 = lowest death
rate)
IMD - Rank of average rank (1= most deprived)
LA Code LA/DC/UA Ceremonial County (Eng/Wal) Region/Nation 4N Men Women Total Men Women Total Men Women Total 4N National
E06000032 Luton Bedfordshire East of England ENG 27.2 15.9 21.4 53 33 86 18 11 29 321 40
E06000055 Bedford Bedfordshire East of England ENG 12.5 8.9 10.7 26 19 45 9 6 15 107 154
E06000056 Central Bedfordshire Bedfordshire East of England ENG 11.3 12.0 11.7 40 44 84 13 15 28 140 264
E06000036 Bracknell Forest Berkshire South East ENG 8.9 8.9 8.8 10 12 22 3 4 7 36 287
E06000037 West Berkshire Berkshire South East ENG 6.2 8.4 7.3 13 18 31 4 6 10 13 291
E06000038 Reading Berkshire South East ENG 18.1 10.0 14.0 27 16 43 9 5 14 217 143
E06000039 Slough Berkshire South East ENG 20.5 21.2 21.0 27 25 52 9 8 17 319 79
E06000040 Windsor and Maidenhead Berkshire South East ENG 15.4 9.9 12.5 28 19 47 9 6 16 168 306
E06000041 Wokingham Berkshire South East ENG 9.2 9.4 9.3 19 20 39 6 7 13 56 325
E06000023 Bristol, City of Bristol South West ENG 13.5 13.7 13.7 60 60 120 20 20 40 212 77
E06000042 Milton Keynes Buckinghamshire South East ENG 18.8 12.3 15.4 51 36 87 17 12 29 256 181
E07000004 Aylesbury Vale Buckinghamshire South East ENG 12.4 8.1 10.1 27 20 47 9 7 16 76 283
E07000005 Chiltern Buckinghamshire South East ENG - 7.9 6.7 7 11 18 2 4 6 9 324
E07000006 South Bucks Buckinghamshire South East ENG - 10.1 9.2 7 10 17 2 3 6 55 302
E07000007 Wycombe Buckinghamshire South East ENG 10.2 7.4 8.8 22 17 39 7 6 13 33 293
E06000031 Peterborough Cambridgeshire East of England ENG 17.4 13.7 15.6 38 29 67 13 10 22 263 58
E07000008 Cambridge Cambridgeshire East of England ENG 17.2 - 10.7 18 6 24 6 2 8 109 227
E07000009 East Cambridgeshire Cambridgeshire East of England ENG 15.2 14.5 14.8 18 18 36 6 6 12 244 255
E07000010 Fenland Cambridgeshire East of England ENG 16.6 12.8 14.7 24 19 43 8 6 14 240 55
E07000011 Huntingdonshire Cambridgeshire East of England ENG 13.1 7.8 10.4 32 19 51 11 6 17 91 265
E07000012 South Cambridgeshire Cambridgeshire East of England ENG 11.2 8.3 9.7 23 18 41 8 6 14 63 314
E06000006 Halton Cheshire North West ENG 22.8 13.9 18.2 38 25 63 13 8 21 305 36
E06000007 Warrington Cheshire North West ENG 16.6 11.8 14.2 46 33 79 15 11 26 226 176
E06000049 Cheshire East Cheshire North West ENG 15.2 8.0 11.5 84 47 131 28 16 44 132 241
E06000050 Cheshire West and Chester Cheshire North West ENG 14.7 10.5 12.5 69 52 121 23 17 40 169 192
E06000052 Cornwall and Isles of Scilly Cornwall South West ENG 14.3 11.1 12.7 126 105 231 42 35 77 173 68
E06000001 Hartlepool County Durham North East ENG 27.8 13.2 20.3 32 16 48 11 5 16 315 32
E06000004 Stockton-on-Tees County Durham North East ENG 13.9 12.5 13.2 34 32 66 11 11 22 196 130
E06000005 Darlington County Durham North East ENG 13.8 12.4 13.1 20 18 38 7 6 13 190 122
E06000047 County Durham County Durham North East ENG 18.4 16.0 17.2 134 122 256 45 41 85 292 81
E07000026 Allerdale Cumbria North West ENG 16.0 12.7 14.3 25 20 45 8 7 15 230 114
E07000027 Barrow-in-Furness Cumbria North West ENG 15.2 13.4 14.3 15 14 29 5 5 10 229 44
E07000028 Carlisle Cumbria North West ENG 13.2 15.9 14.6 20 25 45 7 8 15 238 112
E07000029 Copeland Cumbria North West ENG 18.4 11.4 14.8 19 12 31 6 4 10 245 63
E07000030 Eden Cumbria North West ENG 13.1 - 11.2 12 8 20 4 3 7 121 182
E07000031 South Lakeland Cumbria North West ENG 12.0 7.6 9.7 23 15 38 8 5 13 65 251
E06000015 Derby Derbyshire East Midlands ENG 19.2 12.3 15.5 51 36 87 17 12 29 261 84
E07000032 Amber Valley Derbyshire East Midlands ENG 12.8 13.1 13.0 24 26 50 8 9 17 185 162
E07000033 Bolsover Derbyshire East Midlands ENG 14.4 - 11.2 16 9 25 5 3 8 122 61
E07000034 Chesterfield Derbyshire East Midlands ENG 22.3 9.5 15.8 33 15 48 11 5 16 270 85
E07000035 Derbyshire Dales Derbyshire East Midlands ENG 8.2 - 7.3 10 8 18 3 3 6 12 258
E07000036 Erewash Derbyshire East Midlands ENG 20.2 14.3 17.2 31 23 54 10 8 18 291 149
E07000037 High Peak Derbyshire East Midlands ENG 15.2 11.5 13.4 21 16 37 7 5 12 201 198
E07000038 North East Derbyshire Derbyshire East Midlands ENG 11.2 9.5 10.4 18 17 35 6 6 12 89 190
E07000039 South Derbyshire Derbyshire East Midlands ENG 10.8 9.4 10.1 15 13 28 5 4 9 75 230
E06000026 Plymouth Devon South West ENG 13.3 14.0 13.6 43 47 90 14 16 30 210 82
E06000027 Torbay Devon South West ENG 14.5 18.0 16.2 31 41 72 10 14 24 280 46
E07000040 East Devon Devon South West ENG 13.1 8.7 10.8 33 23 56 11 8 19 110 246
E07000041 Exeter Devon South West ENG 13.8 7.1 10.2 17 10 27 6 3 9 79 165
E07000042 Mid Devon Devon South West ENG 12.7 9.0 10.8 16 11 27 5 4 9 113 156
E07000043 North Devon Devon South West ENG 18.9 16.4 17.6 28 27 55 9 9 18 295 127
UNDER 75
Age standardised stroke (CBVD) death rates per
100,000
Total number of premature stroke (CBVD) deaths 2015/17
Average number of annual stroke (CBVD) deaths for 2015/17
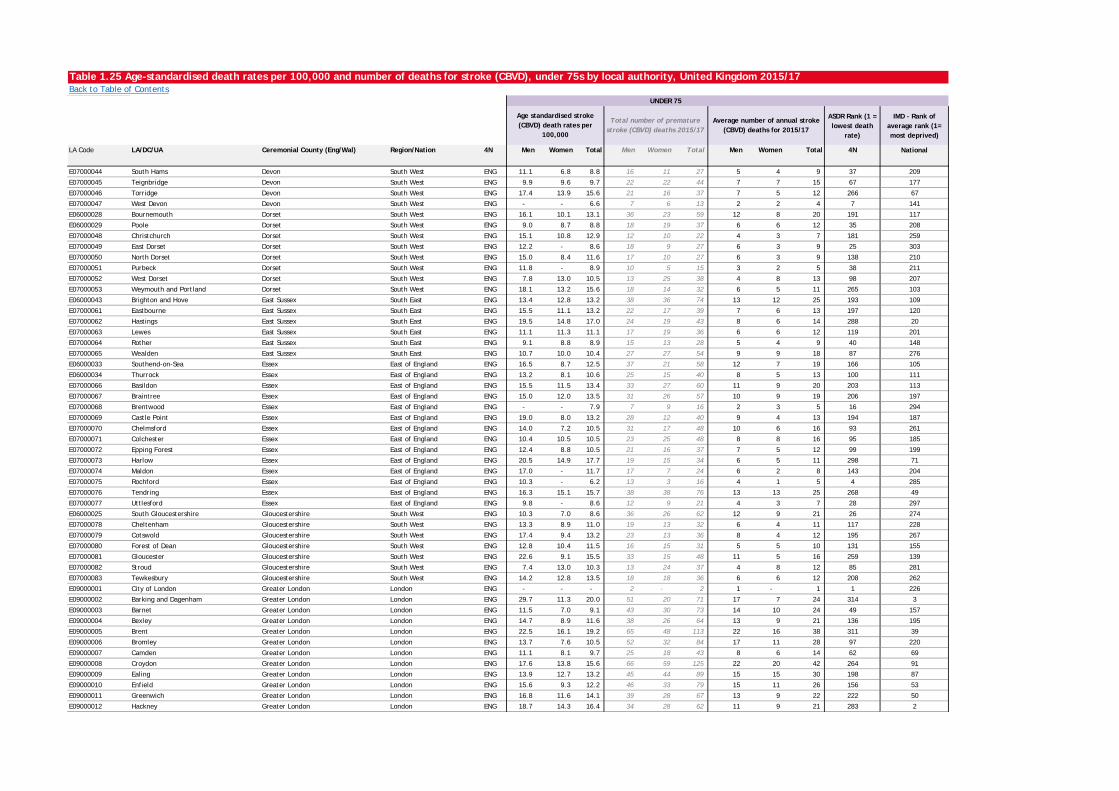
Table 1.25 Age-standardised death rates per 100,000 and number of deaths for stroke (CBVD), under 75s by local authority, United Kingdom 2015/17Back to Table of Contents
ASDR Rank (1 = lowest death
rate)
IMD - Rank of average rank (1= most deprived)
LA Code LA/DC/UA Ceremonial County (Eng/Wal) Region/Nation 4N Men Women Total Men Women Total Men Women Total 4N National
UNDER 75
Age standardised stroke (CBVD) death rates per
100,000
Total number of premature stroke (CBVD) deaths 2015/17
Average number of annual stroke (CBVD) deaths for 2015/17
E07000044 South Hams Devon South West ENG 11.1 6.8 8.8 16 11 27 5 4 9 37 209
E07000045 Teignbridge Devon South West ENG 9.9 9.6 9.7 22 22 44 7 7 15 67 177
E07000046 Torridge Devon South West ENG 17.4 13.9 15.6 21 16 37 7 5 12 266 67
E07000047 West Devon Devon South West ENG - - 6.6 7 6 13 2 2 4 7 141
E06000028 Bournemouth Dorset South West ENG 16.1 10.1 13.1 36 23 59 12 8 20 191 117
E06000029 Poole Dorset South West ENG 9.0 8.7 8.8 18 19 37 6 6 12 35 208
E07000048 Christchurch Dorset South West ENG 15.1 10.8 12.9 12 10 22 4 3 7 181 259
E07000049 East Dorset Dorset South West ENG 12.2 - 8.6 18 9 27 6 3 9 25 303
E07000050 North Dorset Dorset South West ENG 15.0 8.4 11.6 17 10 27 6 3 9 138 210
E07000051 Purbeck Dorset South West ENG 11.8 - 8.9 10 5 15 3 2 5 38 211
E07000052 West Dorset Dorset South West ENG 7.8 13.0 10.5 13 25 38 4 8 13 98 207
E07000053 Weymouth and Portland Dorset South West ENG 18.1 13.2 15.6 18 14 32 6 5 11 265 103
E06000043 Brighton and Hove East Sussex South East ENG 13.4 12.8 13.2 38 36 74 13 12 25 193 109
E07000061 Eastbourne East Sussex South East ENG 15.5 11.1 13.2 22 17 39 7 6 13 197 120
E07000062 Hastings East Sussex South East ENG 19.5 14.8 17.0 24 19 43 8 6 14 288 20
E07000063 Lewes East Sussex South East ENG 11.1 11.3 11.1 17 19 36 6 6 12 119 201
E07000064 Rother East Sussex South East ENG 9.1 8.8 8.9 15 13 28 5 4 9 40 148
E07000065 Wealden East Sussex South East ENG 10.7 10.0 10.4 27 27 54 9 9 18 87 276
E06000033 Southend-on-Sea Essex East of England ENG 16.5 8.7 12.5 37 21 58 12 7 19 166 105
E06000034 Thurrock Essex East of England ENG 13.2 8.1 10.6 25 15 40 8 5 13 100 111
E07000066 Basildon Essex East of England ENG 15.5 11.5 13.4 33 27 60 11 9 20 203 113
E07000067 Braintree Essex East of England ENG 15.0 12.0 13.5 31 26 57 10 9 19 206 197
E07000068 Brentwood Essex East of England ENG - - 7.9 7 9 16 2 3 5 16 294
E07000069 Castle Point Essex East of England ENG 19.0 8.0 13.2 28 12 40 9 4 13 194 187
E07000070 Chelmsford Essex East of England ENG 14.0 7.2 10.5 31 17 48 10 6 16 93 261
E07000071 Colchester Essex East of England ENG 10.4 10.5 10.5 23 25 48 8 8 16 95 185
E07000072 Epping Forest Essex East of England ENG 12.4 8.8 10.5 21 16 37 7 5 12 99 199
E07000073 Harlow Essex East of England ENG 20.5 14.9 17.7 19 15 34 6 5 11 298 71
E07000074 Maldon Essex East of England ENG 17.0 - 11.7 17 7 24 6 2 8 143 204
E07000075 Rochford Essex East of England ENG 10.3 - 6.2 13 3 16 4 1 5 4 285
E07000076 Tendring Essex East of England ENG 16.3 15.1 15.7 38 38 76 13 13 25 268 49
E07000077 Uttlesford Essex East of England ENG 9.8 - 8.6 12 9 21 4 3 7 28 297
E06000025 South Gloucestershire Gloucestershire South West ENG 10.3 7.0 8.6 36 26 62 12 9 21 26 274
E07000078 Cheltenham Gloucestershire South West ENG 13.3 8.9 11.0 19 13 32 6 4 11 117 228
E07000079 Cotswold Gloucestershire South West ENG 17.4 9.4 13.2 23 13 36 8 4 12 195 267
E07000080 Forest of Dean Gloucestershire South West ENG 12.8 10.4 11.5 16 15 31 5 5 10 131 155
E07000081 Gloucester Gloucestershire South West ENG 22.6 9.1 15.5 33 15 48 11 5 16 259 139
E07000082 Stroud Gloucestershire South West ENG 7.4 13.0 10.3 13 24 37 4 8 12 85 281
E07000083 Tewkesbury Gloucestershire South West ENG 14.2 12.8 13.5 18 18 36 6 6 12 208 262
E09000001 City of London Greater London London ENG - - - 2 - 2 1 - 1 1 226
E09000002 Barking and Dagenham Greater London London ENG 29.7 11.3 20.0 51 20 71 17 7 24 314 3
E09000003 Barnet Greater London London ENG 11.5 7.0 9.1 43 30 73 14 10 24 49 157
E09000004 Bexley Greater London London ENG 14.7 8.9 11.6 38 26 64 13 9 21 136 195
E09000005 Brent Greater London London ENG 22.5 16.1 19.2 65 48 113 22 16 38 311 39
E09000006 Bromley Greater London London ENG 13.7 7.6 10.5 52 32 84 17 11 28 97 220
E09000007 Camden Greater London London ENG 11.1 8.1 9.7 25 18 43 8 6 14 62 69
E09000008 Croydon Greater London London ENG 17.6 13.8 15.6 66 59 125 22 20 42 264 91
E09000009 Ealing Greater London London ENG 13.9 12.7 13.2 45 44 89 15 15 30 198 87
E09000010 Enfield Greater London London ENG 15.6 9.3 12.2 46 33 79 15 11 26 156 53
E09000011 Greenwich Greater London London ENG 16.8 11.6 14.1 39 28 67 13 9 22 222 50
E09000012 Hackney Greater London London ENG 18.7 14.3 16.4 34 28 62 11 9 21 283 2
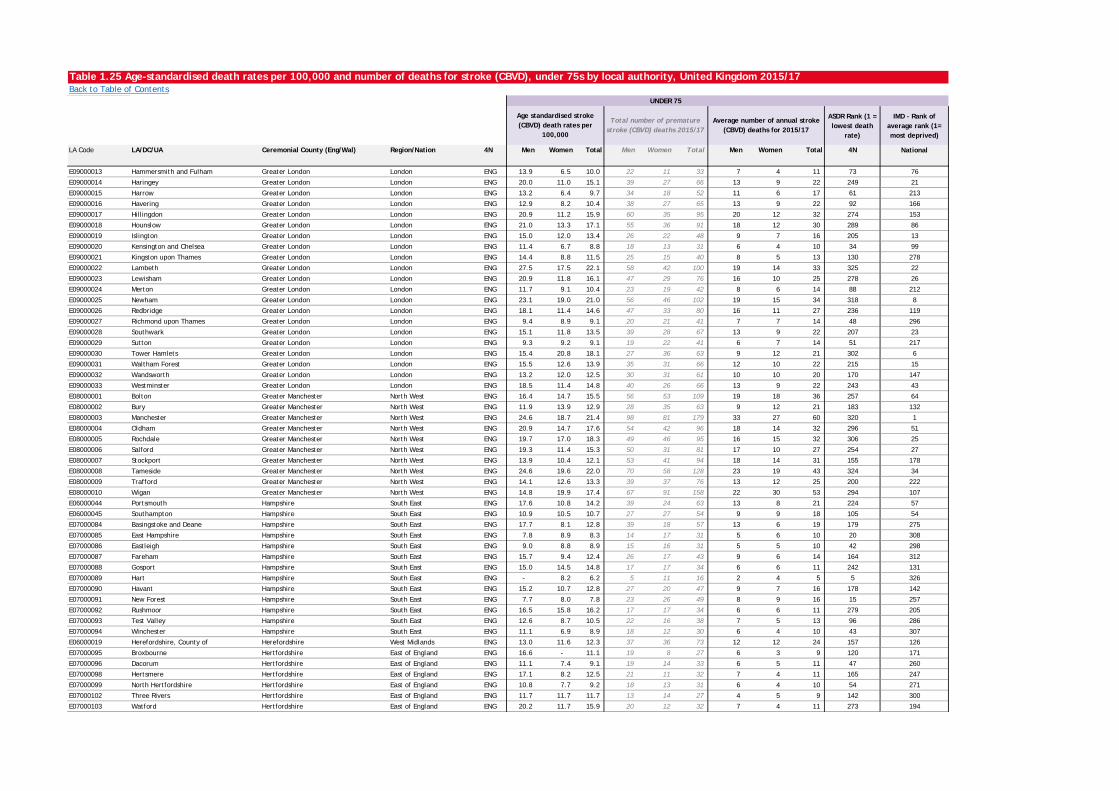
Table 1.25 Age-standardised death rates per 100,000 and number of deaths for stroke (CBVD), under 75s by local authority, United Kingdom 2015/17Back to Table of Contents
ASDR Rank (1 = lowest death
rate)
IMD - Rank of average rank (1= most deprived)
LA Code LA/DC/UA Ceremonial County (Eng/Wal) Region/Nation 4N Men Women Total Men Women Total Men Women Total 4N National
UNDER 75
Age standardised stroke (CBVD) death rates per
100,000
Total number of premature stroke (CBVD) deaths 2015/17
Average number of annual stroke (CBVD) deaths for 2015/17
E09000013 Hammersmith and Fulham Greater London London ENG 13.9 6.5 10.0 22 11 33 7 4 11 73 76
E09000014 Haringey Greater London London ENG 20.0 11.0 15.1 39 27 66 13 9 22 249 21
E09000015 Harrow Greater London London ENG 13.2 6.4 9.7 34 18 52 11 6 17 61 213
E09000016 Havering Greater London London ENG 12.9 8.2 10.4 38 27 65 13 9 22 92 166
E09000017 Hillingdon Greater London London ENG 20.9 11.2 15.9 60 35 95 20 12 32 274 153
E09000018 Hounslow Greater London London ENG 21.0 13.3 17.1 55 36 91 18 12 30 289 86
E09000019 Islington Greater London London ENG 15.0 12.0 13.4 26 22 48 9 7 16 205 13
E09000020 Kensington and Chelsea Greater London London ENG 11.4 6.7 8.8 18 13 31 6 4 10 34 99
E09000021 Kingston upon Thames Greater London London ENG 14.4 8.8 11.5 25 15 40 8 5 13 130 278
E09000022 Lambeth Greater London London ENG 27.5 17.5 22.1 58 42 100 19 14 33 325 22
E09000023 Lewisham Greater London London ENG 20.9 11.8 16.1 47 29 76 16 10 25 278 26
E09000024 Merton Greater London London ENG 11.7 9.1 10.4 23 19 42 8 6 14 88 212
E09000025 Newham Greater London London ENG 23.1 19.0 21.0 56 46 102 19 15 34 318 8
E09000026 Redbridge Greater London London ENG 18.1 11.4 14.6 47 33 80 16 11 27 236 119
E09000027 Richmond upon Thames Greater London London ENG 9.4 8.9 9.1 20 21 41 7 7 14 48 296
E09000028 Southwark Greater London London ENG 15.1 11.8 13.5 39 28 67 13 9 22 207 23
E09000029 Sutton Greater London London ENG 9.3 9.2 9.1 19 22 41 6 7 14 51 217
E09000030 Tower Hamlets Greater London London ENG 15.4 20.8 18.1 27 36 63 9 12 21 302 6
E09000031 Waltham Forest Greater London London ENG 15.5 12.6 13.9 35 31 66 12 10 22 215 15
E09000032 Wandsworth Greater London London ENG 13.2 12.0 12.5 30 31 61 10 10 20 170 147
E09000033 Westminster Greater London London ENG 18.5 11.4 14.8 40 26 66 13 9 22 243 43
E08000001 Bolton Greater Manchester North West ENG 16.4 14.7 15.5 56 53 109 19 18 36 257 64
E08000002 Bury Greater Manchester North West ENG 11.9 13.9 12.9 28 35 63 9 12 21 183 132
E08000003 Manchester Greater Manchester North West ENG 24.6 18.7 21.4 98 81 179 33 27 60 320 1
E08000004 Oldham Greater Manchester North West ENG 20.9 14.7 17.6 54 42 96 18 14 32 296 51
E08000005 Rochdale Greater Manchester North West ENG 19.7 17.0 18.3 49 46 95 16 15 32 306 25
E08000006 Salford Greater Manchester North West ENG 19.3 11.4 15.3 50 31 81 17 10 27 254 27
E08000007 Stockport Greater Manchester North West ENG 13.9 10.4 12.1 53 41 94 18 14 31 155 178
E08000008 Tameside Greater Manchester North West ENG 24.6 19.6 22.0 70 58 128 23 19 43 324 34
E08000009 Trafford Greater Manchester North West ENG 14.1 12.6 13.3 39 37 76 13 12 25 200 222
E08000010 Wigan Greater Manchester North West ENG 14.8 19.9 17.4 67 91 158 22 30 53 294 107
E06000044 Portsmouth Hampshire South East ENG 17.6 10.8 14.2 39 24 63 13 8 21 224 57
E06000045 Southampton Hampshire South East ENG 10.9 10.5 10.7 27 27 54 9 9 18 105 54
E07000084 Basingstoke and Deane Hampshire South East ENG 17.7 8.1 12.8 39 18 57 13 6 19 179 275
E07000085 East Hampshire Hampshire South East ENG 7.8 8.9 8.3 14 17 31 5 6 10 20 308
E07000086 Eastleigh Hampshire South East ENG 9.0 8.8 8.9 15 16 31 5 5 10 42 298
E07000087 Fareham Hampshire South East ENG 15.7 9.4 12.4 26 17 43 9 6 14 164 312
E07000088 Gosport Hampshire South East ENG 15.0 14.5 14.8 17 17 34 6 6 11 242 131
E07000089 Hart Hampshire South East ENG - 8.2 6.2 5 11 16 2 4 5 5 326
E07000090 Havant Hampshire South East ENG 15.2 10.7 12.8 27 20 47 9 7 16 178 142
E07000091 New Forest Hampshire South East ENG 7.7 8.0 7.8 23 26 49 8 9 16 15 257
E07000092 Rushmoor Hampshire South East ENG 16.5 15.8 16.2 17 17 34 6 6 11 279 205
E07000093 Test Valley Hampshire South East ENG 12.6 8.7 10.5 22 16 38 7 5 13 96 286
E07000094 Winchester Hampshire South East ENG 11.1 6.9 8.9 18 12 30 6 4 10 43 307
E06000019 Herefordshire, County of Herefordshire West Midlands ENG 13.0 11.6 12.3 37 36 73 12 12 24 157 126
E07000095 Broxbourne Hertfordshire East of England ENG 16.6 - 11.1 19 8 27 6 3 9 120 171
E07000096 Dacorum Hertfordshire East of England ENG 11.1 7.4 9.1 19 14 33 6 5 11 47 260
E07000098 Hertsmere Hertfordshire East of England ENG 17.1 8.2 12.5 21 11 32 7 4 11 165 247
E07000099 North Hertfordshire Hertfordshire East of England ENG 10.8 7.7 9.2 18 13 31 6 4 10 54 271
E07000102 Three Rivers Hertfordshire East of England ENG 11.7 11.7 11.7 13 14 27 4 5 9 142 300
E07000103 Watford Hertfordshire East of England ENG 20.2 11.7 15.9 20 12 32 7 4 11 273 194
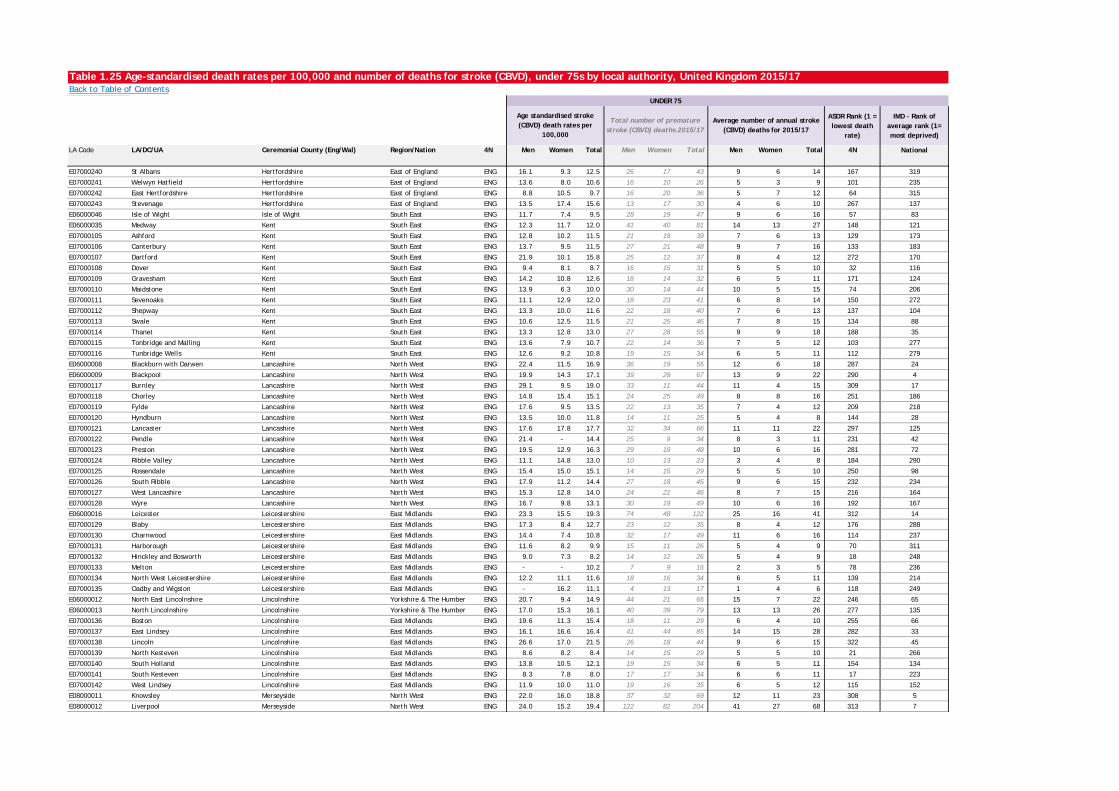
Table 1.25 Age-standardised death rates per 100,000 and number of deaths for stroke (CBVD), under 75s by local authority, United Kingdom 2015/17Back to Table of Contents
ASDR Rank (1 = lowest death
rate)
IMD - Rank of average rank (1= most deprived)
LA Code LA/DC/UA Ceremonial County (Eng/Wal) Region/Nation 4N Men Women Total Men Women Total Men Women Total 4N National
UNDER 75
Age standardised stroke (CBVD) death rates per
100,000
Total number of premature stroke (CBVD) deaths 2015/17
Average number of annual stroke (CBVD) deaths for 2015/17
E07000240 St Albans Hertfordshire East of England ENG 16.1 9.3 12.5 26 17 43 9 6 14 167 319
E07000241 Welwyn Hatfield Hertfordshire East of England ENG 13.6 8.0 10.6 16 10 26 5 3 9 101 235
E07000242 East Hertfordshire Hertfordshire East of England ENG 8.8 10.5 9.7 16 20 36 5 7 12 64 315
E07000243 Stevenage Hertfordshire East of England ENG 13.5 17.4 15.6 13 17 30 4 6 10 267 137
E06000046 Isle of Wight Isle of Wight South East ENG 11.7 7.4 9.5 28 19 47 9 6 16 57 83
E06000035 Medway Kent South East ENG 12.3 11.7 12.0 41 40 81 14 13 27 148 121
E07000105 Ashford Kent South East ENG 12.8 10.2 11.5 21 18 39 7 6 13 129 173
E07000106 Canterbury Kent South East ENG 13.7 9.5 11.5 27 21 48 9 7 16 133 183
E07000107 Dartford Kent South East ENG 21.9 10.1 15.8 25 12 37 8 4 12 272 170
E07000108 Dover Kent South East ENG 9.4 8.1 8.7 16 15 31 5 5 10 32 116
E07000109 Gravesham Kent South East ENG 14.2 10.8 12.6 18 14 32 6 5 11 171 124
E07000110 Maidstone Kent South East ENG 13.9 6.3 10.0 30 14 44 10 5 15 74 206
E07000111 Sevenoaks Kent South East ENG 11.1 12.9 12.0 18 23 41 6 8 14 150 272
E07000112 Shepway Kent South East ENG 13.3 10.0 11.6 22 18 40 7 6 13 137 104
E07000113 Swale Kent South East ENG 10.6 12.5 11.5 21 25 46 7 8 15 134 88
E07000114 Thanet Kent South East ENG 13.3 12.8 13.0 27 28 55 9 9 18 188 35
E07000115 Tonbridge and Malling Kent South East ENG 13.6 7.9 10.7 22 14 36 7 5 12 103 277
E07000116 Tunbridge Wells Kent South East ENG 12.6 9.2 10.8 19 15 34 6 5 11 112 279
E06000008 Blackburn with Darwen Lancashire North West ENG 22.4 11.5 16.9 36 19 55 12 6 18 287 24
E06000009 Blackpool Lancashire North West ENG 19.9 14.3 17.1 39 28 67 13 9 22 290 4
E07000117 Burnley Lancashire North West ENG 29.1 9.5 19.0 33 11 44 11 4 15 309 17
E07000118 Chorley Lancashire North West ENG 14.8 15.4 15.1 24 25 49 8 8 16 251 186
E07000119 Fylde Lancashire North West ENG 17.6 9.5 13.5 22 13 35 7 4 12 209 218
E07000120 Hyndburn Lancashire North West ENG 13.5 10.0 11.8 14 11 25 5 4 8 144 28
E07000121 Lancaster Lancashire North West ENG 17.6 17.8 17.7 32 34 66 11 11 22 297 125
E07000122 Pendle Lancashire North West ENG 21.4 - 14.4 25 9 34 8 3 11 231 42
E07000123 Preston Lancashire North West ENG 19.5 12.9 16.3 29 19 48 10 6 16 281 72
E07000124 Ribble Valley Lancashire North West ENG 11.1 14.8 13.0 10 13 23 3 4 8 184 290
E07000125 Rossendale Lancashire North West ENG 15.4 15.0 15.1 14 15 29 5 5 10 250 98
E07000126 South Ribble Lancashire North West ENG 17.9 11.2 14.4 27 18 45 9 6 15 232 234
E07000127 West Lancashire Lancashire North West ENG 15.3 12.8 14.0 24 22 46 8 7 15 216 164
E07000128 Wyre Lancashire North West ENG 16.7 9.8 13.1 30 19 49 10 6 16 192 167
E06000016 Leicester Leicestershire East Midlands ENG 23.3 15.5 19.3 74 48 122 25 16 41 312 14
E07000129 Blaby Leicestershire East Midlands ENG 17.3 8.4 12.7 23 12 35 8 4 12 176 288
E07000130 Charnwood Leicestershire East Midlands ENG 14.4 7.4 10.8 32 17 49 11 6 16 114 237
E07000131 Harborough Leicestershire East Midlands ENG 11.6 8.2 9.9 15 11 26 5 4 9 70 311
E07000132 Hinckley and Bosworth Leicestershire East Midlands ENG 9.0 7.3 8.2 14 12 26 5 4 9 18 248
E07000133 Melton Leicestershire East Midlands ENG - - 10.2 7 9 16 2 3 5 78 236
E07000134 North West Leicestershire Leicestershire East Midlands ENG 12.2 11.1 11.6 18 16 34 6 5 11 139 214
E07000135 Oadby and Wigston Leicestershire East Midlands ENG - 16.2 11.1 4 13 17 1 4 6 118 249
E06000012 North East Lincolnshire Lincolnshire Yorkshire & The Humber ENG 20.7 9.4 14.9 44 21 65 15 7 22 246 65
E06000013 North Lincolnshire Lincolnshire Yorkshire & The Humber ENG 17.0 15.3 16.1 40 39 79 13 13 26 277 135
E07000136 Boston Lincolnshire East Midlands ENG 19.6 11.3 15.4 18 11 29 6 4 10 255 66
E07000137 East Lindsey Lincolnshire East Midlands ENG 16.1 16.6 16.4 41 44 85 14 15 28 282 33
E07000138 Lincoln Lincolnshire East Midlands ENG 26.6 17.0 21.5 26 18 44 9 6 15 322 45
E07000139 North Kesteven Lincolnshire East Midlands ENG 8.6 8.2 8.4 14 15 29 5 5 10 21 266
E07000140 South Holland Lincolnshire East Midlands ENG 13.8 10.5 12.1 19 15 34 6 5 11 154 134
E07000141 South Kesteven Lincolnshire East Midlands ENG 8.3 7.8 8.0 17 17 34 6 6 11 17 223
E07000142 West Lindsey Lincolnshire East Midlands ENG 11.9 10.0 11.0 19 16 35 6 5 12 115 152
E08000011 Knowsley Merseyside North West ENG 22.0 16.0 18.8 37 32 69 12 11 23 308 5
E08000012 Liverpool Merseyside North West ENG 24.0 15.2 19.4 122 82 204 41 27 68 313 7
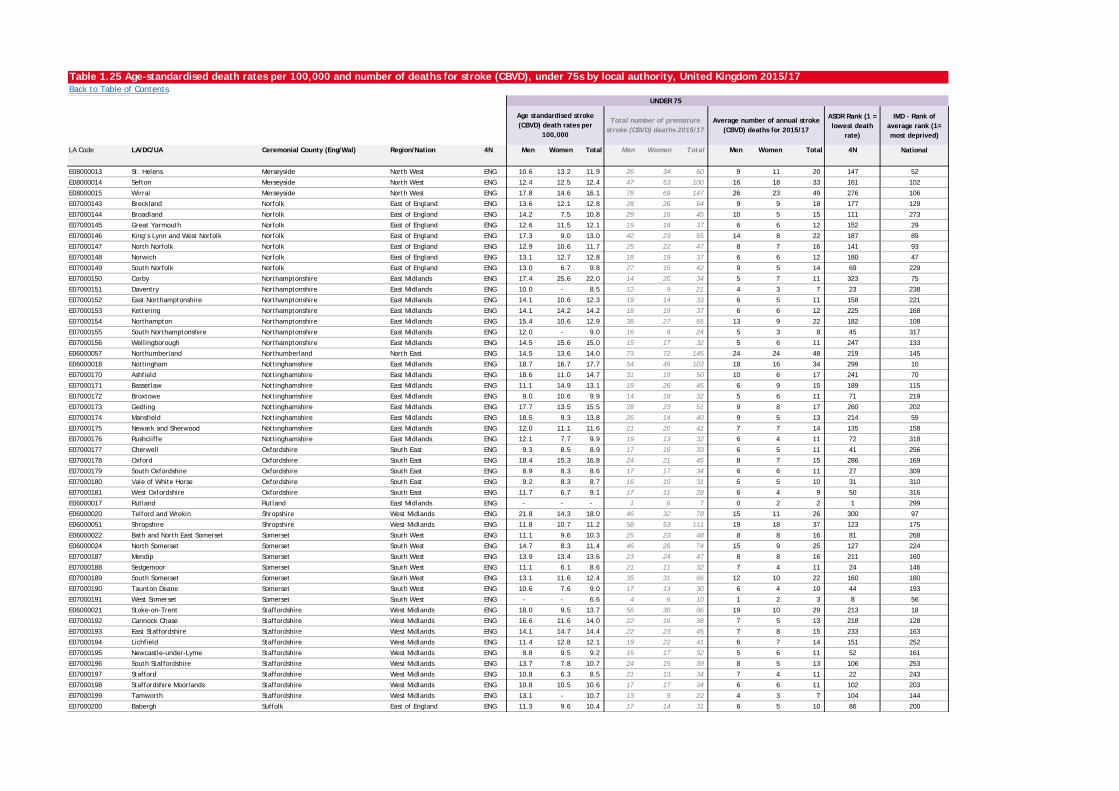
Table 1.25 Age-standardised death rates per 100,000 and number of deaths for stroke (CBVD), under 75s by local authority, United Kingdom 2015/17Back to Table of Contents
ASDR Rank (1 = lowest death
rate)
IMD - Rank of average rank (1= most deprived)
LA Code LA/DC/UA Ceremonial County (Eng/Wal) Region/Nation 4N Men Women Total Men Women Total Men Women Total 4N National
UNDER 75
Age standardised stroke (CBVD) death rates per
100,000
Total number of premature stroke (CBVD) deaths 2015/17
Average number of annual stroke (CBVD) deaths for 2015/17
E08000013 St. Helens Merseyside North West ENG 10.6 13.2 11.9 26 34 60 9 11 20 147 52
E08000014 Sefton Merseyside North West ENG 12.4 12.5 12.4 47 53 100 16 18 33 161 102
E08000015 Wirral Merseyside North West ENG 17.8 14.6 16.1 78 69 147 26 23 49 276 106
E07000143 Breckland Norfolk East of England ENG 13.6 12.1 12.8 28 26 54 9 9 18 177 129
E07000144 Broadland Norfolk East of England ENG 14.2 7.5 10.8 29 16 45 10 5 15 111 273
E07000145 Great Yarmouth Norfolk East of England ENG 12.6 11.5 12.1 19 18 37 6 6 12 152 29
E07000146 King’s Lynn and West Norfolk Norfolk East of England ENG 17.3 9.0 13.0 42 23 65 14 8 22 187 89
E07000147 North Norfolk Norfolk East of England ENG 12.9 10.6 11.7 25 22 47 8 7 16 141 93
E07000148 Norwich Norfolk East of England ENG 13.1 12.7 12.8 18 19 37 6 6 12 180 47
E07000149 South Norfolk Norfolk East of England ENG 13.0 6.7 9.8 27 15 42 9 5 14 69 229
E07000150 Corby Northamptonshire East Midlands ENG 17.4 25.6 22.0 14 20 34 5 7 11 323 75
E07000151 Daventry Northamptonshire East Midlands ENG 10.0 - 8.5 12 9 21 4 3 7 23 238
E07000152 East Northamptonshire Northamptonshire East Midlands ENG 14.1 10.6 12.3 19 14 33 6 5 11 158 221
E07000153 Kettering Northamptonshire East Midlands ENG 14.1 14.2 14.2 18 19 37 6 6 12 225 168
E07000154 Northampton Northamptonshire East Midlands ENG 15.4 10.6 12.9 38 27 65 13 9 22 182 108
E07000155 South Northamptonshire Northamptonshire East Midlands ENG 12.0 - 9.0 16 8 24 5 3 8 45 317
E07000156 Wellingborough Northamptonshire East Midlands ENG 14.5 15.6 15.0 15 17 32 5 6 11 247 133
E06000057 Northumberland Northumberland North East ENG 14.5 13.6 14.0 73 72 145 24 24 48 219 145
E06000018 Nottingham Nottinghamshire East Midlands ENG 18.7 16.7 17.7 54 49 103 18 16 34 299 10
E07000170 Ashfield Nottinghamshire East Midlands ENG 18.6 11.0 14.7 31 19 50 10 6 17 241 70
E07000171 Bassetlaw Nottinghamshire East Midlands ENG 11.1 14.9 13.1 19 26 45 6 9 15 189 115
E07000172 Broxtowe Nottinghamshire East Midlands ENG 9.0 10.6 9.9 14 18 32 5 6 11 71 219
E07000173 Gedling Nottinghamshire East Midlands ENG 17.7 13.5 15.5 28 23 51 9 8 17 260 202
E07000174 Mansfield Nottinghamshire East Midlands ENG 18.5 9.3 13.8 26 14 40 9 5 13 214 59
E07000175 Newark and Sherwood Nottinghamshire East Midlands ENG 12.0 11.1 11.6 21 20 41 7 7 14 135 158
E07000176 Rushcliffe Nottinghamshire East Midlands ENG 12.1 7.7 9.9 19 13 32 6 4 11 72 318
E07000177 Cherwell Oxfordshire South East ENG 9.3 8.5 8.9 17 16 33 6 5 11 41 256
E07000178 Oxford Oxfordshire South East ENG 18.4 15.3 16.8 24 21 45 8 7 15 286 169
E07000179 South Oxfordshire Oxfordshire South East ENG 8.9 8.3 8.6 17 17 34 6 6 11 27 309
E07000180 Vale of White Horse Oxfordshire South East ENG 9.2 8.3 8.7 16 15 31 5 5 10 31 310
E07000181 West Oxfordshire Oxfordshire South East ENG 11.7 6.7 9.1 17 11 28 6 4 9 50 316
E06000017 Rutland Rutland East Midlands ENG - - - 1 6 7 0 2 2 1 299
E06000020 Telford and Wrekin Shropshire West Midlands ENG 21.8 14.3 18.0 46 32 78 15 11 26 300 97
E06000051 Shropshire Shropshire West Midlands ENG 11.8 10.7 11.2 58 53 111 19 18 37 123 175
E06000022 Bath and North East Somerset Somerset South West ENG 11.1 9.6 10.3 25 23 48 8 8 16 81 268
E06000024 North Somerset Somerset South West ENG 14.7 8.3 11.4 46 28 74 15 9 25 127 224
E07000187 Mendip Somerset South West ENG 13.9 13.4 13.6 23 24 47 8 8 16 211 160
E07000188 Sedgemoor Somerset South West ENG 11.1 6.1 8.6 21 11 32 7 4 11 24 146
E07000189 South Somerset Somerset South West ENG 13.1 11.6 12.4 35 31 66 12 10 22 160 180
E07000190 Taunton Deane Somerset South West ENG 10.6 7.6 9.0 17 13 30 6 4 10 44 193
E07000191 West Somerset Somerset South West ENG - - 6.6 4 6 10 1 2 3 8 56
E06000021 Stoke-on-Trent Staffordshire West Midlands ENG 18.0 9.5 13.7 56 30 86 19 10 29 213 18
E07000192 Cannock Chase Staffordshire West Midlands ENG 16.6 11.6 14.0 22 16 38 7 5 13 218 128
E07000193 East Staffordshire Staffordshire West Midlands ENG 14.1 14.7 14.4 22 23 45 7 8 15 233 163
E07000194 Lichfield Staffordshire West Midlands ENG 11.4 12.8 12.1 19 22 41 6 7 14 151 252
E07000195 Newcastle-under-Lyme Staffordshire West Midlands ENG 8.8 9.5 9.2 15 17 32 5 6 11 52 161
E07000196 South Staffordshire Staffordshire West Midlands ENG 13.7 7.8 10.7 24 15 39 8 5 13 106 253
E07000197 Stafford Staffordshire West Midlands ENG 10.8 6.3 8.5 21 13 34 7 4 11 22 243
E07000198 Staffordshire Moorlands Staffordshire West Midlands ENG 10.8 10.5 10.6 17 17 34 6 6 11 102 203
E07000199 Tamworth Staffordshire West Midlands ENG 13.1 - 10.7 13 9 22 4 3 7 104 144
E07000200 Babergh Suffolk East of England ENG 11.3 9.6 10.4 17 14 31 6 5 10 86 200
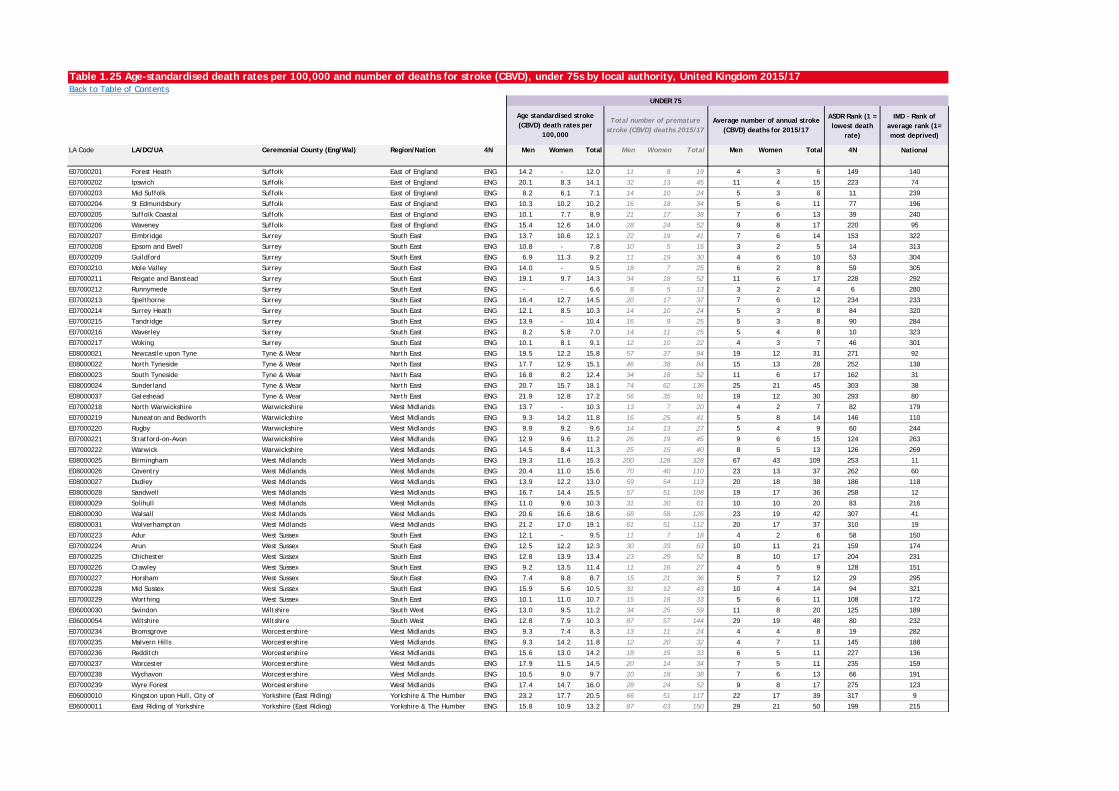
Table 1.25 Age-standardised death rates per 100,000 and number of deaths for stroke (CBVD), under 75s by local authority, United Kingdom 2015/17Back to Table of Contents
ASDR Rank (1 = lowest death
rate)
IMD - Rank of average rank (1= most deprived)
LA Code LA/DC/UA Ceremonial County (Eng/Wal) Region/Nation 4N Men Women Total Men Women Total Men Women Total 4N National
UNDER 75
Age standardised stroke (CBVD) death rates per
100,000
Total number of premature stroke (CBVD) deaths 2015/17
Average number of annual stroke (CBVD) deaths for 2015/17
E07000201 Forest Heath Suffolk East of England ENG 14.2 - 12.0 11 8 19 4 3 6 149 140
E07000202 Ipswich Suffolk East of England ENG 20.1 8.3 14.1 32 13 45 11 4 15 223 74
E07000203 Mid Suffolk Suffolk East of England ENG 8.2 6.1 7.1 14 10 24 5 3 8 11 239
E07000204 St Edmundsbury Suffolk East of England ENG 10.3 10.2 10.2 16 18 34 5 6 11 77 196
E07000205 Suffolk Coastal Suffolk East of England ENG 10.1 7.7 8.9 21 17 38 7 6 13 39 240
E07000206 Waveney Suffolk East of England ENG 15.4 12.6 14.0 28 24 52 9 8 17 220 95
E07000207 Elmbridge Surrey South East ENG 13.7 10.6 12.1 22 19 41 7 6 14 153 322
E07000208 Epsom and Ewell Surrey South East ENG 10.8 - 7.8 10 5 15 3 2 5 14 313
E07000209 Guildford Surrey South East ENG 6.9 11.3 9.2 11 19 30 4 6 10 53 304
E07000210 Mole Valley Surrey South East ENG 14.0 - 9.5 18 7 25 6 2 8 59 305
E07000211 Reigate and Banstead Surrey South East ENG 19.1 9.7 14.3 34 18 52 11 6 17 228 292
E07000212 Runnymede Surrey South East ENG - - 6.6 8 5 13 3 2 4 6 280
E07000213 Spelthorne Surrey South East ENG 16.4 12.7 14.5 20 17 37 7 6 12 234 233
E07000214 Surrey Heath Surrey South East ENG 12.1 8.5 10.3 14 10 24 5 3 8 84 320
E07000215 Tandridge Surrey South East ENG 13.9 - 10.4 16 9 25 5 3 8 90 284
E07000216 Waverley Surrey South East ENG 8.2 5.8 7.0 14 11 25 5 4 8 10 323
E07000217 Woking Surrey South East ENG 10.1 8.1 9.1 12 10 22 4 3 7 46 301
E08000021 Newcastle upon Tyne Tyne & Wear North East ENG 19.5 12.2 15.8 57 37 94 19 12 31 271 92
E08000022 North Tyneside Tyne & Wear North East ENG 17.7 12.9 15.1 46 38 84 15 13 28 252 138
E08000023 South Tyneside Tyne & Wear North East ENG 16.8 8.2 12.4 34 18 52 11 6 17 162 31
E08000024 Sunderland Tyne & Wear North East ENG 20.7 15.7 18.1 74 62 136 25 21 45 303 38
E08000037 Gateshead Tyne & Wear North East ENG 21.9 12.8 17.2 56 35 91 19 12 30 293 80
E07000218 North Warwickshire Warwickshire West Midlands ENG 13.7 - 10.3 13 7 20 4 2 7 82 179
E07000219 Nuneaton and Bedworth Warwickshire West Midlands ENG 9.3 14.2 11.8 16 25 41 5 8 14 146 110
E07000220 Rugby Warwickshire West Midlands ENG 9.9 9.2 9.6 14 13 27 5 4 9 60 244
E07000221 Stratford-on-Avon Warwickshire West Midlands ENG 12.9 9.6 11.2 26 19 45 9 6 15 124 263
E07000222 Warwick Warwickshire West Midlands ENG 14.5 8.4 11.3 25 15 40 8 5 13 126 269
E08000025 Birmingham West Midlands West Midlands ENG 19.3 11.6 15.3 200 128 328 67 43 109 253 11
E08000026 Coventry West Midlands West Midlands ENG 20.4 11.0 15.6 70 40 110 23 13 37 262 60
E08000027 Dudley West Midlands West Midlands ENG 13.9 12.2 13.0 59 54 113 20 18 38 186 118
E08000028 Sandwell West Midlands West Midlands ENG 16.7 14.4 15.5 57 51 108 19 17 36 258 12
E08000029 Solihull West Midlands West Midlands ENG 11.0 9.6 10.3 31 30 61 10 10 20 83 216
E08000030 Walsall West Midlands West Midlands ENG 20.6 16.6 18.6 68 58 126 23 19 42 307 41
E08000031 Wolverhampton West Midlands West Midlands ENG 21.2 17.0 19.1 61 51 112 20 17 37 310 19
E07000223 Adur West Sussex South East ENG 12.1 - 9.5 11 7 18 4 2 6 58 150
E07000224 Arun West Sussex South East ENG 12.5 12.2 12.3 30 33 63 10 11 21 159 174
E07000225 Chichester West Sussex South East ENG 12.8 13.9 13.4 23 29 52 8 10 17 204 231
E07000226 Crawley West Sussex South East ENG 9.2 13.5 11.4 11 16 27 4 5 9 128 151
E07000227 Horsham West Sussex South East ENG 7.4 9.8 8.7 15 21 36 5 7 12 29 295
E07000228 Mid Sussex West Sussex South East ENG 15.9 5.6 10.5 31 12 43 10 4 14 94 321
E07000229 Worthing West Sussex South East ENG 10.1 11.0 10.7 15 18 33 5 6 11 108 172
E06000030 Swindon Wiltshire South West ENG 13.0 9.5 11.2 34 25 59 11 8 20 125 189
E06000054 Wiltshire Wiltshire South West ENG 12.8 7.9 10.3 87 57 144 29 19 48 80 232
E07000234 Bromsgrove Worcestershire West Midlands ENG 9.3 7.4 8.3 13 11 24 4 4 8 19 282
E07000235 Malvern Hills Worcestershire West Midlands ENG 9.3 14.2 11.8 12 20 32 4 7 11 145 188
E07000236 Redditch Worcestershire West Midlands ENG 15.6 13.0 14.2 18 15 33 6 5 11 227 136
E07000237 Worcester Worcestershire West Midlands ENG 17.9 11.5 14.5 20 14 34 7 5 11 235 159
E07000238 Wychavon Worcestershire West Midlands ENG 10.5 9.0 9.7 20 18 38 7 6 13 66 191
E07000239 Wyre Forest Worcestershire West Midlands ENG 17.4 14.7 16.0 28 24 52 9 8 17 275 123
E06000010 Kingston upon Hull, City of Yorkshire (East Riding) Yorkshire & The Humber ENG 23.2 17.7 20.5 66 51 117 22 17 39 317 9
E06000011 East Riding of Yorkshire Yorkshire (East Riding) Yorkshire & The Humber ENG 15.8 10.9 13.2 87 63 150 29 21 50 199 215
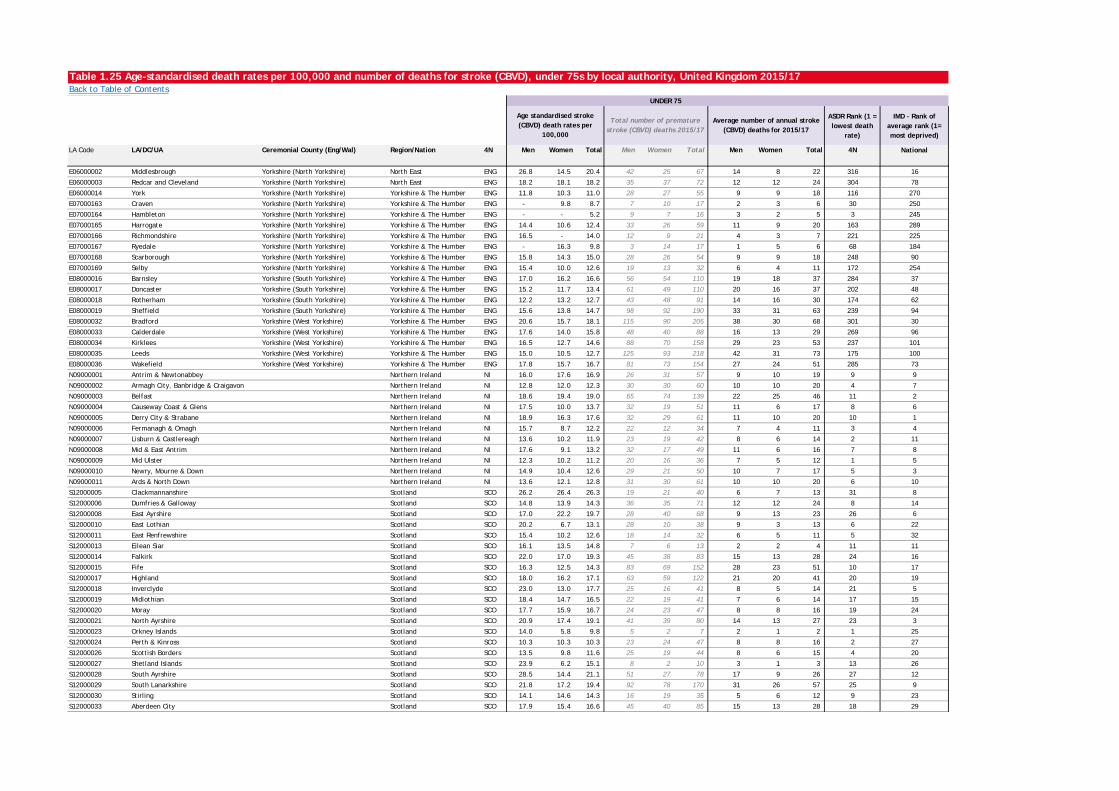
Table 1.25 Age-standardised death rates per 100,000 and number of deaths for stroke (CBVD), under 75s by local authority, United Kingdom 2015/17Back to Table of Contents
ASDR Rank (1 = lowest death
rate)
IMD - Rank of average rank (1= most deprived)
LA Code LA/DC/UA Ceremonial County (Eng/Wal) Region/Nation 4N Men Women Total Men Women Total Men Women Total 4N National
UNDER 75
Age standardised stroke (CBVD) death rates per
100,000
Total number of premature stroke (CBVD) deaths 2015/17
Average number of annual stroke (CBVD) deaths for 2015/17
E06000002 Middlesbrough Yorkshire (North Yorkshire) North East ENG 26.8 14.5 20.4 42 25 67 14 8 22 316 16
E06000003 Redcar and Cleveland Yorkshire (North Yorkshire) North East ENG 18.2 18.1 18.2 35 37 72 12 12 24 304 78
E06000014 York Yorkshire (North Yorkshire) Yorkshire & The Humber ENG 11.8 10.3 11.0 28 27 55 9 9 18 116 270
E07000163 Craven Yorkshire (North Yorkshire) Yorkshire & The Humber ENG - 9.8 8.7 7 10 17 2 3 6 30 250
E07000164 Hambleton Yorkshire (North Yorkshire) Yorkshire & The Humber ENG - - 5.2 9 7 16 3 2 5 3 245
E07000165 Harrogate Yorkshire (North Yorkshire) Yorkshire & The Humber ENG 14.4 10.6 12.4 33 26 59 11 9 20 163 289
E07000166 Richmondshire Yorkshire (North Yorkshire) Yorkshire & The Humber ENG 16.5 - 14.0 12 9 21 4 3 7 221 225
E07000167 Ryedale Yorkshire (North Yorkshire) Yorkshire & The Humber ENG - 16.3 9.8 3 14 17 1 5 6 68 184
E07000168 Scarborough Yorkshire (North Yorkshire) Yorkshire & The Humber ENG 15.8 14.3 15.0 28 26 54 9 9 18 248 90
E07000169 Selby Yorkshire (North Yorkshire) Yorkshire & The Humber ENG 15.4 10.0 12.6 19 13 32 6 4 11 172 254
E08000016 Barnsley Yorkshire (South Yorkshire) Yorkshire & The Humber ENG 17.0 16.2 16.6 56 54 110 19 18 37 284 37
E08000017 Doncaster Yorkshire (South Yorkshire) Yorkshire & The Humber ENG 15.2 11.7 13.4 61 49 110 20 16 37 202 48
E08000018 Rotherham Yorkshire (South Yorkshire) Yorkshire & The Humber ENG 12.2 13.2 12.7 43 48 91 14 16 30 174 62
E08000019 Sheffield Yorkshire (South Yorkshire) Yorkshire & The Humber ENG 15.6 13.8 14.7 98 92 190 33 31 63 239 94
E08000032 Bradford Yorkshire (West Yorkshire) Yorkshire & The Humber ENG 20.6 15.7 18.1 115 90 205 38 30 68 301 30
E08000033 Calderdale Yorkshire (West Yorkshire) Yorkshire & The Humber ENG 17.6 14.0 15.8 48 40 88 16 13 29 269 96
E08000034 Kirklees Yorkshire (West Yorkshire) Yorkshire & The Humber ENG 16.5 12.7 14.6 88 70 158 29 23 53 237 101
E08000035 Leeds Yorkshire (West Yorkshire) Yorkshire & The Humber ENG 15.0 10.5 12.7 125 93 218 42 31 73 175 100
E08000036 Wakefield Yorkshire (West Yorkshire) Yorkshire & The Humber ENG 17.8 15.7 16.7 81 73 154 27 24 51 285 73
N09000001 Antrim & Newtonabbey Northern Ireland NI 16.0 17.6 16.9 26 31 57 9 10 19 9 9
N09000002 Armagh City, Banbridge & Craigavon Northern Ireland NI 12.8 12.0 12.3 30 30 60 10 10 20 4 7
N09000003 Belfast Northern Ireland NI 18.6 19.4 19.0 65 74 139 22 25 46 11 2
N09000004 Causeway Coast & Glens Northern Ireland NI 17.5 10.0 13.7 32 19 51 11 6 17 8 6
N09000005 Derry City & Strabane Northern Ireland NI 18.9 16.3 17.6 32 29 61 11 10 20 10 1
N09000006 Fermanagh & Omagh Northern Ireland NI 15.7 8.7 12.2 22 12 34 7 4 11 3 4
N09000007 Lisburn & Castlereagh Northern Ireland NI 13.6 10.2 11.9 23 19 42 8 6 14 2 11
N09000008 Mid & East Antrim Northern Ireland NI 17.6 9.1 13.2 32 17 49 11 6 16 7 8
N09000009 Mid Ulster Northern Ireland NI 12.3 10.2 11.2 20 16 36 7 5 12 1 5
N09000010 Newry, Mourne & Down Northern Ireland NI 14.9 10.4 12.6 29 21 50 10 7 17 5 3
N09000011 Ards & North Down Northern Ireland NI 13.6 12.1 12.8 31 30 61 10 10 20 6 10
S12000005 Clackmannanshire Scotland SCO 26.2 26.4 26.3 19 21 40 6 7 13 31 8
S12000006 Dumfries & Galloway Scotland SCO 14.8 13.9 14.3 36 35 71 12 12 24 8 14
S12000008 East Ayrshire Scotland SCO 17.0 22.2 19.7 28 40 68 9 13 23 26 6
S12000010 East Lothian Scotland SCO 20.2 6.7 13.1 28 10 38 9 3 13 6 22
S12000011 East Renfrewshire Scotland SCO 15.4 10.2 12.6 18 14 32 6 5 11 5 32
S12000013 Eilean Siar Scotland SCO 16.1 13.5 14.8 7 6 13 2 2 4 11 11
S12000014 Falkirk Scotland SCO 22.0 17.0 19.3 45 38 83 15 13 28 24 16
S12000015 Fife Scotland SCO 16.3 12.5 14.3 83 69 152 28 23 51 10 17
S12000017 Highland Scotland SCO 18.0 16.2 17.1 63 59 122 21 20 41 20 19
S12000018 Inverclyde Scotland SCO 23.0 13.0 17.7 25 16 41 8 5 14 21 5
S12000019 Midlothian Scotland SCO 18.4 14.7 16.5 22 19 41 7 6 14 17 15
S12000020 Moray Scotland SCO 17.7 15.9 16.7 24 23 47 8 8 16 19 24
S12000021 North Ayrshire Scotland SCO 20.9 17.4 19.1 41 39 80 14 13 27 23 3
S12000023 Orkney Islands Scotland SCO 14.0 5.8 9.8 5 2 7 2 1 2 1 25
S12000024 Perth & Kinross Scotland SCO 10.3 10.3 10.3 23 24 47 8 8 16 2 27
S12000026 Scottish Borders Scotland SCO 13.5 9.8 11.6 25 19 44 8 6 15 4 20
S12000027 Shetland Islands Scotland SCO 23.9 6.2 15.1 8 2 10 3 1 3 13 26
S12000028 South Ayrshire Scotland SCO 28.5 14.4 21.1 51 27 78 17 9 26 27 12
S12000029 South Lanarkshire Scotland SCO 21.8 17.2 19.4 92 78 170 31 26 57 25 9
S12000030 Stirling Scotland SCO 14.1 14.6 14.3 16 19 35 5 6 12 9 23
S12000033 Aberdeen City Scotland SCO 17.9 15.4 16.6 45 40 85 15 13 28 18 29
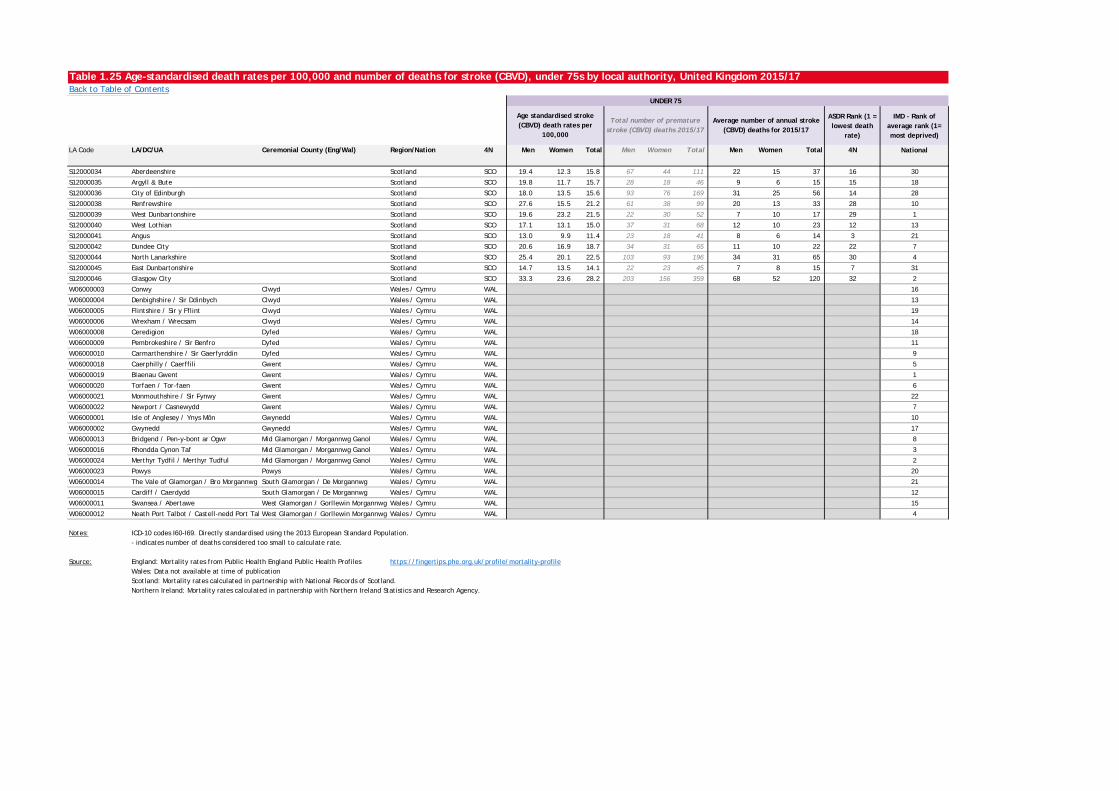
Table 1.25 Age-standardised death rates per 100,000 and number of deaths for stroke (CBVD), under 75s by local authority, United Kingdom 2015/17Back to Table of Contents
ASDR Rank (1 = lowest death
rate)
IMD - Rank of average rank (1= most deprived)
LA Code LA/DC/UA Ceremonial County (Eng/Wal) Region/Nation 4N Men Women Total Men Women Total Men Women Total 4N National
UNDER 75
Age standardised stroke (CBVD) death rates per
100,000
Total number of premature stroke (CBVD) deaths 2015/17
Average number of annual stroke (CBVD) deaths for 2015/17
S12000034 Aberdeenshire Scotland SCO 19.4 12.3 15.8 67 44 111 22 15 37 16 30
S12000035 Argyll & Bute Scotland SCO 19.8 11.7 15.7 28 18 46 9 6 15 15 18
S12000036 City of Edinburgh Scotland SCO 18.0 13.5 15.6 93 76 169 31 25 56 14 28
S12000038 Renfrewshire Scotland SCO 27.6 15.5 21.2 61 38 99 20 13 33 28 10
S12000039 West Dunbartonshire Scotland SCO 19.6 23.2 21.5 22 30 52 7 10 17 29 1
S12000040 West Lothian Scotland SCO 17.1 13.1 15.0 37 31 68 12 10 23 12 13
S12000041 Angus Scotland SCO 13.0 9.9 11.4 23 18 41 8 6 14 3 21
S12000042 Dundee City Scotland SCO 20.6 16.9 18.7 34 31 65 11 10 22 22 7
S12000044 North Lanarkshire Scotland SCO 25.4 20.1 22.5 103 93 196 34 31 65 30 4
S12000045 East Dunbartonshire Scotland SCO 14.7 13.5 14.1 22 23 45 7 8 15 7 31
S12000046 Glasgow City Scotland SCO 33.3 23.6 28.2 203 156 359 68 52 120 32 2
W06000003 Conwy Clwyd Wales / Cymru WAL 16
W06000004 Denbighshire / Sir Ddinbych Clwyd Wales / Cymru WAL 13
W06000005 Flintshire / Sir y Fflint Clwyd Wales / Cymru WAL 19
W06000006 Wrexham / Wrecsam Clwyd Wales / Cymru WAL 14
W06000008 Ceredigion Dyfed Wales / Cymru WAL 18
W06000009 Pembrokeshire / Sir Benfro Dyfed Wales / Cymru WAL 11
W06000010 Carmarthenshire / Sir Gaerfyrddin Dyfed Wales / Cymru WAL 9
W06000018 Caerphilly / Caerffili Gwent Wales / Cymru WAL 5
W06000019 Blaenau Gwent Gwent Wales / Cymru WAL 1
W06000020 Torfaen / Tor-faen Gwent Wales / Cymru WAL 6
W06000021 Monmouthshire / Sir Fynwy Gwent Wales / Cymru WAL 22
W06000022 Newport / Casnewydd Gwent Wales / Cymru WAL 7
W06000001 Isle of Anglesey / Ynys Môn Gwynedd Wales / Cymru WAL 10
W06000002 Gwynedd Gwynedd Wales / Cymru WAL 17
W06000013 Bridgend / Pen-y-bont ar Ogwr Mid Glamorgan / Morgannwg Ganol Wales / Cymru WAL 8
W06000016 Rhondda Cynon Taf Mid Glamorgan / Morgannwg Ganol Wales / Cymru WAL 3
W06000024 Merthyr Tydfil / Merthyr Tudful Mid Glamorgan / Morgannwg Ganol Wales / Cymru WAL 2
W06000023 Powys Powys Wales / Cymru WAL 20
W06000014 The Vale of Glamorgan / Bro Morgannwg South Glamorgan / De Morgannwg Wales / Cymru WAL 21
W06000015 Cardiff / Caerdydd South Glamorgan / De Morgannwg Wales / Cymru WAL 12
W06000011 Swansea / Abertawe West Glamorgan / Gorllewin Morgannwg Wales / Cymru WAL 15
W06000012 Neath Port Talbot / Castell-nedd Port Tal West Glamorgan / Gorllewin Morgannwg Wales / Cymru WAL 4
Notes: ICD-10 codes I60-I69. Directly standardised using the 2013 European Standard Population.- indicates number of deaths considered too small to calculate rate.
Source: England: Mortality rates from Public Health England Public Health Profiles https://fingertips.phe.org.uk/profile/mortality-profileWales: Data not available at time of publicationScotland: Mortality rates calculated in partnership with National Records of Scotland.Northern Ireland: Mortality rates calculated in partnership with Northern Ireland Statistics and Research Agency.
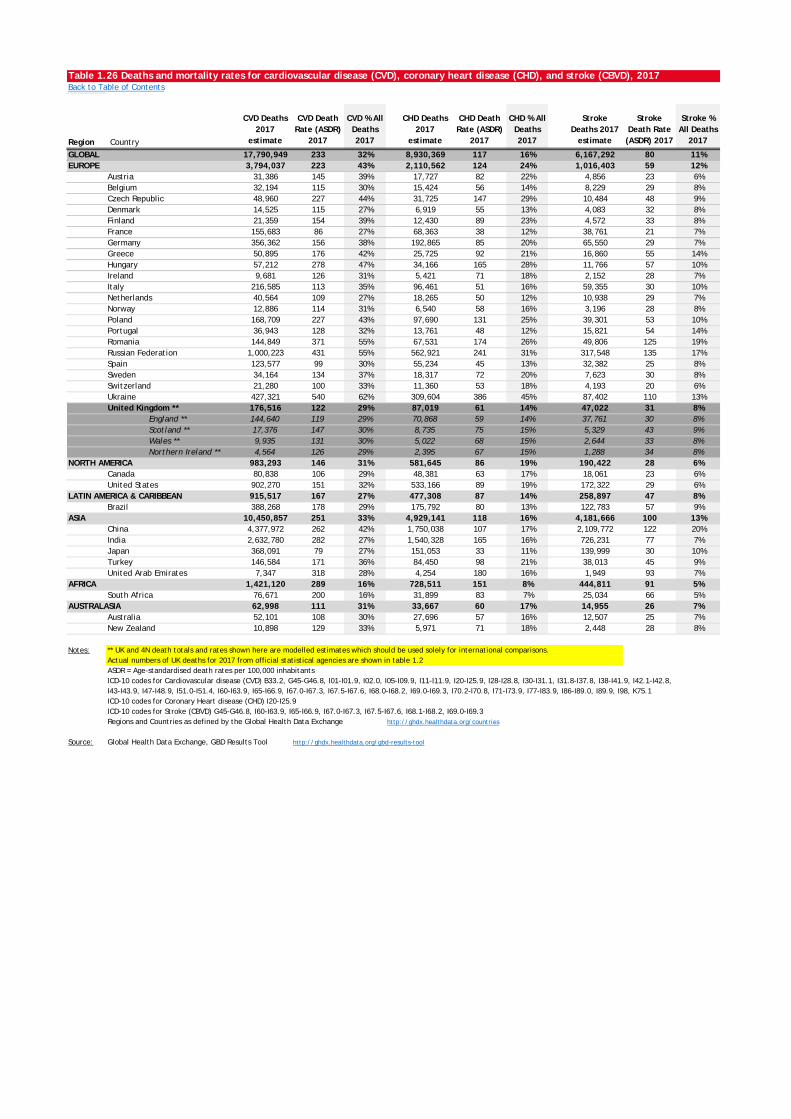
Table 1.26 Deaths and mortality rates for cardiovascular disease (CVD), coronary heart disease (CHD), and stroke (CBVD), 2017Back to Table of Contents
Region Country
CVD Deaths 2017
estimate
CVD Death Rate (ASDR)
2017
CVD % All Deaths 2017
CHD Deaths 2017
estimate
CHD Death Rate (ASDR)
2017
CHD % All Deaths 2017
Stroke Deaths 2017
estimate
Stroke Death Rate (ASDR) 2017
Stroke % All Deaths
2017
GLOBAL 1 17,790,949 233 32% 8,930,369 117 16% 6,167,292 80 11%EUROPE 2 3,794,037 223 43% 2,110,562 124 24% 1,016,403 59 12%EUROPE Austria 3 31,386 145 39% 17,727 82 22% 4,856 23 6%EUROPE Belgium 4 32,194 115 30% 15,424 56 14% 8,229 29 8%EUROPE Czech Republic 5 48,960 227 44% 31,725 147 29% 10,484 48 9%EUROPE Denmark 6 14,525 115 27% 6,919 55 13% 4,083 32 8%EUROPE Finland 7 21,359 154 39% 12,430 89 23% 4,572 33 8%EUROPE France 8 155,683 86 27% 68,363 38 12% 38,761 21 7%EUROPE Germany 9 356,362 156 38% 192,865 85 20% 65,550 29 7%EUROPE Greece # 50,895 176 42% 25,725 92 21% 16,860 55 14%EUROPE Hungary # 57,212 278 47% 34,166 165 28% 11,766 57 10%EUROPE Ireland # 9,681 126 31% 5,421 71 18% 2,152 28 7%EUROPE Italy # 216,585 113 35% 96,461 51 16% 59,355 30 10%EUROPE Netherlands # 40,564 109 27% 18,265 50 12% 10,938 29 7%EUROPE Norway # 12,886 114 31% 6,540 58 16% 3,196 28 8%EUROPE Poland # 168,709 227 43% 97,690 131 25% 39,301 53 10%EUROPE Portugal # 36,943 128 32% 13,761 48 12% 15,821 54 14%EUROPE Romania # 144,849 371 55% 67,531 174 26% 49,806 125 19%EUROPE Russian Federation # 1,000,223 431 55% 562,921 241 31% 317,548 135 17%EUROPE Spain # 123,577 99 30% 55,234 45 13% 32,382 25 8%EUROPE Sweden # 34,164 134 37% 18,317 72 20% 7,623 30 8%EUROPE Switzerland # 21,280 100 33% 11,360 53 18% 4,193 20 6%EUROPE Ukraine # 427,321 540 62% 309,604 386 45% 87,402 110 13%EUROPE United Kingdom ** # 176,516 122 29% 87,019 61 14% 47,022 31 8%EUROPE United Kin England ** # 144,640 119 29% 70,868 59 14% 37,761 30 8%EUROPE United Kin Scotland ** # 17,376 147 30% 8,735 75 15% 5,329 43 9%EUROPE United Kin Wales ** # 9,935 131 30% 5,022 68 15% 2,644 33 8%EUROPE United Kin Northern Ireland ** # 4,564 126 29% 2,395 67 15% 1,288 34 8%
NORTH AMERICA # 983,293 146 31% 581,645 86 19% 190,422 28 6%NORTH AMCanada # 80,838 106 29% 48,381 63 17% 18,061 23 6%NORTH AMUnited States # 902,270 151 32% 533,166 89 19% 172,322 29 6%LATIN AMERICA & CARIBBEAN # 915,517 167 27% 477,308 87 14% 258,897 47 8%LATIN AM Brazil # 388,268 178 29% 175,792 80 13% 122,783 57 9%ASIA # 10,450,857 251 33% 4,929,141 118 16% 4,181,666 100 13%ASIA China # 4,377,972 262 42% 1,750,038 107 17% 2,109,772 122 20%ASIA India # 2,632,780 282 27% 1,540,328 165 16% 726,231 77 7%ASIA Japan # 368,091 79 27% 151,053 33 11% 139,999 30 10%ASIA Turkey # 146,584 171 36% 84,450 98 21% 38,013 45 9%ASIA United Arab Emirates # 7,347 318 28% 4,254 180 16% 1,949 93 7%AFRICA # 1,421,120 289 16% 728,511 151 8% 444,811 91 5%AFRICA South Africa # 76,671 200 16% 31,899 83 7% 25,034 66 5%
AUSTRALASIA # 62,998 111 31% 33,667 60 17% 14,955 26 7%USTRALAS Australia # 52,101 108 30% 27,696 57 16% 12,507 25 7%USTRALAS New Zealand # 10,898 129 33% 5,971 71 18% 2,448 28 8%
Notes: ** UK and 4N death totals and rates shown here are modelled estimates which should be used solely for international comparisons. Actual numbers of UK deaths for 2017 from official statistical agencies are shown in table 1.2 ASDR = Age-standardised death rates per 100,000 inhabitantsICD-10 codes for Cardiovascular disease (CVD) B33.2, G45-G46.8, I01-I01.9, I02.0, I05-I09.9, I11-I11.9, I20-I25.9, I28-I28.8, I30-I31.1, I31.8-I37.8, I38-I41.9, I42.1-I42.8,I43-I43.9, I47-I48.9, I51.0-I51.4, I60-I63.9, I65-I66.9, I67.0-I67.3, I67.5-I67.6, I68.0-I68.2, I69.0-I69.3, I70.2-I70.8, I71-I73.9, I77-I83.9, I86-I89.0, I89.9, I98, K75.1ICD-10 codes for Coronary Heart disease (CHD) I20-I25.9ICD-10 codes for Stroke (CBVD) G45-G46.8, I60-I63.9, I65-I66.9, I67.0-I67.3, I67.5-I67.6, I68.1-I68.2, I69.0-I69.3Regions and Countries as defined by the Global Health Data Exchange http://ghdx.healthdata.org/countries
Source: Global Health Data Exchange, GBD Results Tool http://ghdx.healthdata.org/gbd-results-tool
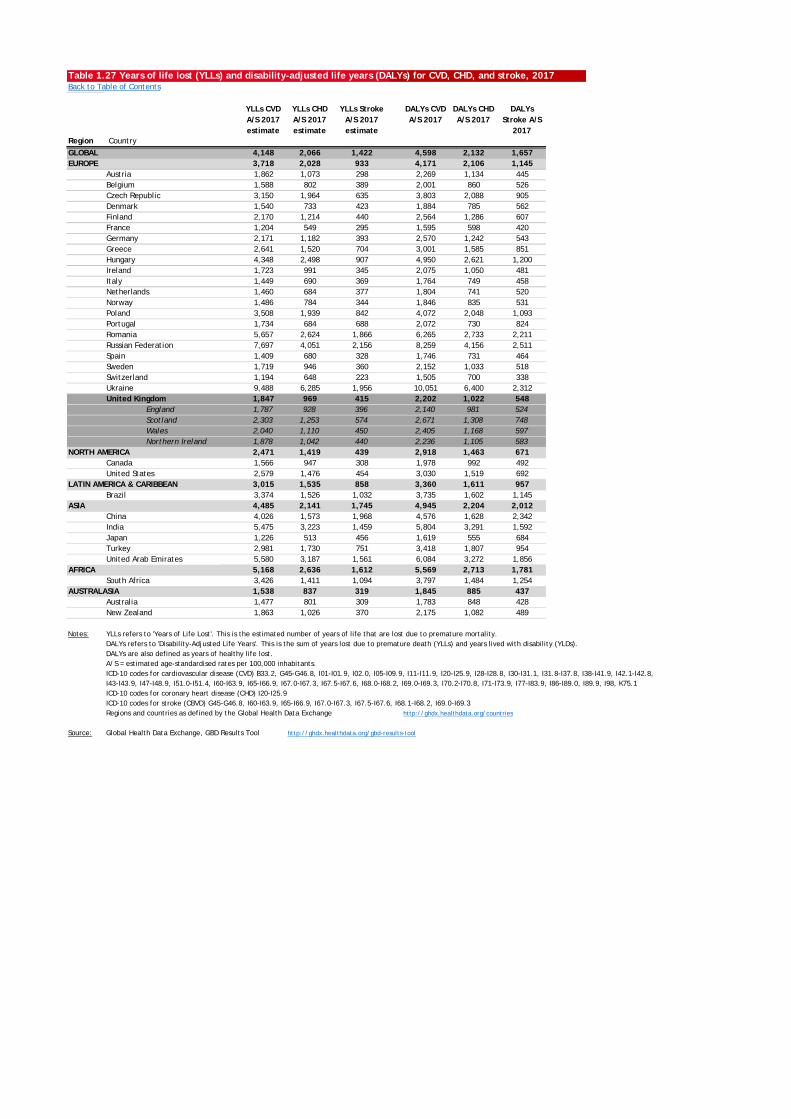
Table 1.27 Years of life lost (YLLs) and disability-adjusted life years (DALYs) for CVD, CHD, and stroke, 2017Back to Table of Contents
Region Country
YLLs CVD A/S 2017 estimate
YLLs CHD A/S 2017 estimate
YLLs Stroke A/S 2017 estimate
DALYs CVD A/S 2017
DALYs CHD A/S 2017
DALYs Stroke A/S
2017
GLOBAL 1 4,148 2,066 1,422 4,598 2,132 1,657EUROPE 2 3,718 2,028 933 4,171 2,106 1,145EUROPE Austria 3 1,862 1,073 298 2,269 1,134 445EUROPE Belgium 4 1,588 802 389 2,001 860 526EUROPE Czech Republic 5 3,150 1,964 635 3,803 2,088 905EUROPE Denmark 6 1,540 733 423 1,884 785 562EUROPE Finland 7 2,170 1,214 440 2,564 1,286 607EUROPE France 8 1,204 549 295 1,595 598 420EUROPE Germany 9 2,171 1,182 393 2,570 1,242 543EUROPE Greece # 2,641 1,520 704 3,001 1,585 851EUROPE Hungary # 4,348 2,498 907 4,950 2,621 1,200EUROPE Ireland # 1,723 991 345 2,075 1,050 481EUROPE Italy # 1,449 690 369 1,764 749 458EUROPE Netherlands # 1,460 684 377 1,804 741 520EUROPE Norway # 1,486 784 344 1,846 835 531EUROPE Poland # 3,508 1,939 842 4,072 2,048 1,093EUROPE Portugal # 1,734 684 688 2,072 730 824EUROPE Romania # 5,657 2,624 1,866 6,265 2,733 2,211EUROPE Russian Federation # 7,697 4,051 2,156 8,259 4,156 2,511EUROPE Spain # 1,409 680 328 1,746 731 464EUROPE Sweden # 1,719 946 360 2,152 1,033 518EUROPE Switzerland # 1,194 648 223 1,505 700 338EUROPE Ukraine # 9,488 6,285 1,956 10,051 6,400 2,312EUROPE United Kingdom # 1,847 969 415 2,202 1,022 548EUROPE United KingEngland # 1,787 928 396 2,140 981 524EUROPE United KingScotland # 2,303 1,253 574 2,671 1,308 748EUROPE United KingWales # 2,040 1,110 450 2,405 1,168 597EUROPE United KingNorthern Ireland # 1,878 1,042 440 2,236 1,105 583
NORTH AMERICA # 2,471 1,419 439 2,918 1,463 671NORTH AMCanada # 1,566 947 308 1,978 992 492NORTH AMUnited States # 2,579 1,476 454 3,030 1,519 692LATIN AMERICA & CARIBBEAN # 3,015 1,535 858 3,360 1,611 957LATIN AM Brazil # 3,374 1,526 1,032 3,735 1,602 1,145ASIA # 4,485 2,141 1,745 4,945 2,204 2,012ASIA China # 4,026 1,573 1,968 4,576 1,628 2,342ASIA India # 5,475 3,223 1,459 5,804 3,291 1,592ASIA Japan # 1,226 513 456 1,619 555 684ASIA Turkey # 2,981 1,730 751 3,418 1,807 954ASIA United Arab Emirates # 5,580 3,187 1,561 6,084 3,272 1,856AFRICA # 5,168 2,636 1,612 5,569 2,713 1,781AFRICA South Africa # 3,426 1,411 1,094 3,797 1,484 1,254
AUSTRALASIA # 1,538 837 319 1,845 885 437USTRALAS Australia # 1,477 801 309 1,783 848 428USTRALAS New Zealand # 1,863 1,026 370 2,175 1,082 489
Notes: YLLs refers to 'Years of Life Lost'. This is the estimated number of years of life that are lost due to premature mortality.DALYs refers to 'Disability-Adjusted Life Years'. This is the sum of years lost due to premature death (YLLs) and years lived with disability (YLDs).DALYs are also defined as years of healthy life lost.A/S = estimated age-standardised rates per 100,000 inhabitants.ICD-10 codes for cardiovascular disease (CVD) B33.2, G45-G46.8, I01-I01.9, I02.0, I05-I09.9, I11-I11.9, I20-I25.9, I28-I28.8, I30-I31.1, I31.8-I37.8, I38-I41.9, I42.1-I42.8,I43-I43.9, I47-I48.9, I51.0-I51.4, I60-I63.9, I65-I66.9, I67.0-I67.3, I67.5-I67.6, I68.0-I68.2, I69.0-I69.3, I70.2-I70.8, I71-I73.9, I77-I83.9, I86-I89.0, I89.9, I98, K75.1ICD-10 codes for coronary heart disease (CHD) I20-I25.9ICD-10 codes for stroke (CBVD) G45-G46.8, I60-I63.9, I65-I66.9, I67.0-I67.3, I67.5-I67.6, I68.1-I68.2, I69.0-I69.3Regions and countries as defined by the Global Health Data Exchange http://ghdx.healthdata.org/countries
Source: Global Health Data Exchange, GBD Results Tool http://ghdx.healthdata.org/gbd-results-tool
Heart and Circulatory Disease Statistics 2018 - Chapter 2 - MorbidityThis chapter reports on the morbidity of a number of heart and circulatory conditions, including cardiovascular disease (CVD), coronary heart disease (CHD), myocardial infarction (heart attack), heart failure, and stroke. Drawing on data from hospital episode and admissions statistics, GP registers and national health surveys, we present current estimates as well as trend data for incidence and prevalence of these conditions.Collecting accurate data is a challenge since the presence and onset of disease is not absolute. Individuals may not be aware that they have a disease or be able to accurately report its onset. Moreover, some diseases might be misdiagnosed by health professionals. As a result, the estimates of morbidity presented in this chapter should be interpreted with some caution.
INCIDENCE - HOSPITAL EPISODES
T2.1 Inpatient episodes by main diagnosis in NHS hospitals, by gender, England, Scotland, Wales, Northern Ireland and United Kingdom 2017/18
TRENDS IN INCIDENCE - HOSPITAL EPISODES
T2.2a All inpatient episodes by main diagnosis, England, Scotland, Wales, Northern Ireland and United Kingdom 2005/06 - 2017/18
T2.2b Inpatient episodes by main diagnosis for men, England, Scotland, Wales, Northern Ireland and United Kingdom 2005/06 - 2017/18
T2.2c Inpatient episodes by main diagnosis for women, England, Scotland, Wales, Northern Ireland and United Kingdom 2005/06 - 2017/18
INCIDENCE - HOSPITAL ADMISSIONS
T2.3 Inpatient admissions by main diagnosis in NHS hospitals, by gender, England, Scotland, Wales, Northern Ireland and United Kingdom latest
TRENDS IN INCIDENCE - HOSPITAL ADMISSIONS
T2.4a All inpatient admissions by main diagnosis, England, Scotland, Wales, Northern Ireland and United Kingdom 2009/10 - 2017/18
T2.4b Inpatient admissions by main diagnosis for men, England, Scotland, Wales, Northern Ireland and United Kingdom 2009/10 - 2017/18
T2.4c Inpatient admissions by main diagnosis for women, England, Scotland, Wales, Northern Ireland and United Kingdom 2009/10 - 2017/18
PREVALENCE AND INCIDENCE
T2.5 Prevalence of selected cardiovascular conditions by UK nation and English region, United Kingdom - 2017/18
T2.6 Incidence of heart and circulatory diseases (CVD), coronary heart disease (CHD), and stroke (CBVD) by UK nation and English region, 2017
T2.7 Prevalence of heart and circulatory diseases (CVD), coronary heart disease (CHD), and stroke (CBVD) by UK nation and English region, 2017
TRENDS IN PREVALENCE
T2.8 Prevalence of cardiovascular conditions from GP patient registers (QOF), England 2004/05-2017/18
T2.9 Prevalence of cardiovascular conditions from GP patient registers (QOF), Scotland 2008/09-2017/18
T2.10 Prevalence of cardiovascular conditions from GP patient registers (QOF), Wales 2006/07-2017/18
T2.11 Prevalence of cardiovascular conditions from GP patient registers (QOF), Northern Ireland 2004/05-2017/18
T2.12 Prevalence of cardiovascular conditions from national health survey by gender, England 2003-2017
T2.13 Prevalence of cardiovascular conditions from national health survey by gender, Scotland 2003-2017
T2.14 Prevalence of heart conditions and stroke from national health survey by gender, Wales 2003/04-2015
T2.15 Prevalence of cardiovascular conditions from national health survey by age group, England 2003-2017
T2.16 Prevalence of cardiovascular conditions from national health survey by age group, Scotland 2003-2017
T2.17 Prevalence of cardiovascular conditions from national health survey by equivalised household income and gender, England 2017
T2.18 Prevalence of cardiovascular conditions from national health survey by equivalised household income and gender, Scotland 2017
CO-MORBIDITIES
T2.19 Percentage of coronary heart disease (CHD) patients with each comorbidity for each UK nation and UK
T2.20 Percentage of coronary heart disease (CHD) patients with each comorbidity by age band
T2.21 Percentage of coronary heart disease (CHD) patients with each comorbidity by Townsend score
T2.22 Percentage of coronary heart disease (CHD) patients with each comorbidity by age band and BMI category
T2.23 Percentage of stroke (CBVD) patients with each comorbidity for each UK nation and UK
T2.24 Percentage of stroke (CBVD) patients with each comorbidity by age band
T2.25 Percentage of stroke (CBVD) patients with each comorbidity by Townsend score
T2.26 Percentage of stroke (CBVD) patients with each comorbidity by age band and BMI category
GLOBAL INCIDENCE & PREVALENCE
T2.27 Incidence of heart and circulatory diseases (CVD), coronary heart disease (CHD), and stroke (CBVD), selected nations 2017
T2.28 Prevalence of heart and circulatory diseases (CVD), coronary heart disease (CHD), and stroke (CBVD), selected nations 2017
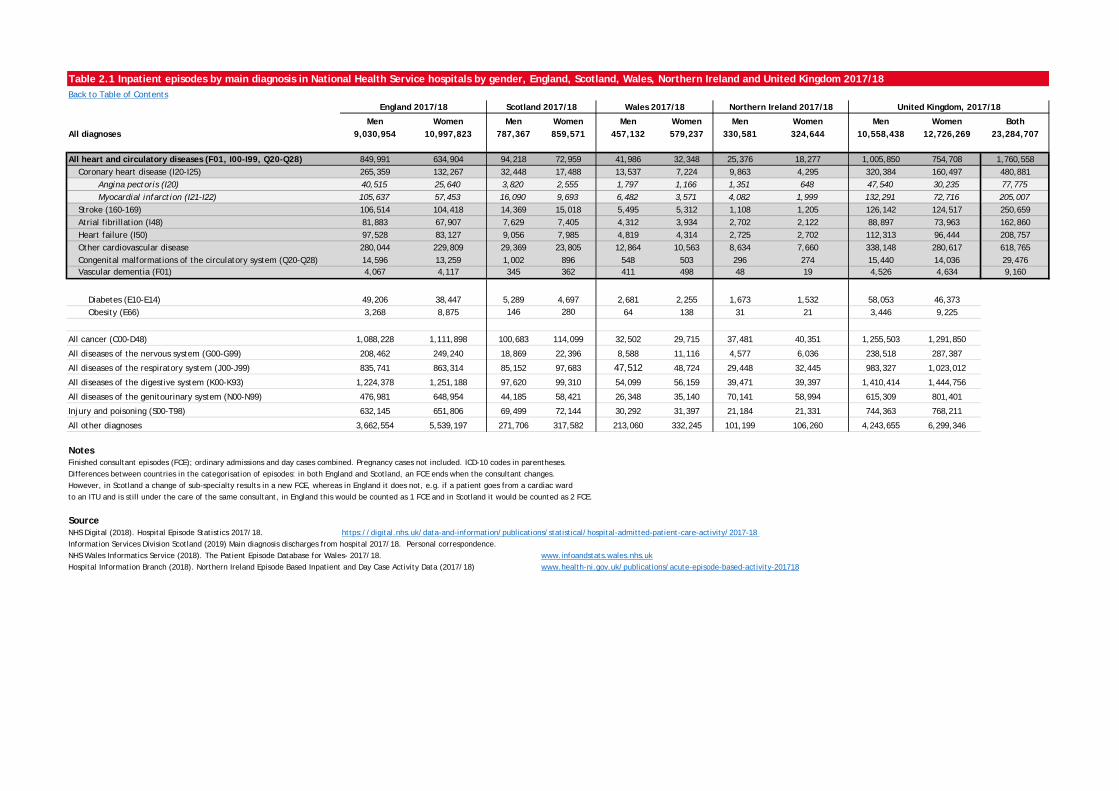
Table 2.1 Inpatient episodes by main diagnosis in National Health Service hospitals by gender, England, Scotland, Wales, Northern Ireland and United Kingdom 2017/18Back to Table of Contents
Men Women Men Women Men Women Men Women Men Women BothAll diagnoses 9,030,954 10,997,823 787,367 859,571 457,132 579,237 330,581 324,644 10,558,438 12,726,269 23,284,707
All heart and circulatory diseases (F01, I00-I99, Q20-Q28) 849,991 634,904 94,218 72,959 41,986 32,348 25,376 18,277 1,005,850 754,708 1,760,558Coronary heart disease (I20-I25) 265,359 132,267 32,448 17,488 13,537 7,224 9,863 4,295 320,384 160,497 480,881
Angina pectoris (I20) 40,515 25,640 3,820 2,555 1,797 1,166 1,351 648 47,540 30,235 77,775Myocardial infarction (I21-I22) 105,637 57,453 16,090 9,693 6,482 3,571 4,082 1,999 132,291 72,716 205,007
Stroke (160-169) 106,514 104,418 14,369 15,018 5,495 5,312 1,108 1,205 126,142 124,517 250,659Atrial fibrillation (I48) 81,883 67,907 7,629 7,405 4,312 3,934 2,702 2,122 88,897 73,963 162,860Heart failure (I50) 97,528 83,127 9,056 7,985 4,819 4,314 2,725 2,702 112,313 96,444 208,757Other cardiovascular disease 280,044 229,809 29,369 23,805 12,864 10,563 8,634 7,660 338,148 280,617 618,765Congenital malformations of the circulatory system (Q20-Q28) 14,596 13,259 1,002 896 548 503 296 274 15,440 14,036 29,476Vascular dementia (F01) 4,067 4,117 345 362 411 498 48 19 4,526 4,634 9,160
Diabetes (E10-E14) 49,206 38,447 5,289 4,697 2,681 2,255 1,673 1,532 58,053 46,373Obesity (E66) 3,268 8,875 146 280 64 138 31 21 3,446 9,225
All cancer (C00-D48) 1,088,228 1,111,898 100,683 114,099 32,502 29,715 37,481 40,351 1,255,503 1,291,850
All diseases of the nervous system (G00-G99) 208,462 249,240 18,869 22,396 8,588 11,116 4,577 6,036 238,518 287,387
All diseases of the respiratory system (J00-J99) 835,741 863,314 85,152 97,683 47,512 48,724 29,448 32,445 983,327 1,023,012
All diseases of the digestive system (K00-K93) 1,224,378 1,251,188 97,620 99,310 54,099 56,159 39,471 39,397 1,410,414 1,444,756
All diseases of the genitourinary system (N00-N99) 476,981 648,954 44,185 58,421 26,348 35,140 70,141 58,994 615,309 801,401
Injury and poisoning (S00-T98) 632,145 651,806 69,499 72,144 30,292 31,397 21,184 21,331 744,363 768,211
All other diagnoses 3,662,554 5,539,197 271,706 317,582 213,060 332,245 101,199 106,260 4,243,655 6,299,346
NotesFinished consultant episodes (FCE); ordinary admissions and day cases combined. Pregnancy cases not included. ICD-10 codes in parentheses. Differences between countries in the categorisation of episodes: in both England and Scotland, an FCE ends when the consultant changes. However, in Scotland a change of sub-specialty results in a new FCE, whereas in England it does not, e.g. if a patient goes from a cardiac ward to an ITU and is still under the care of the same consultant, in England this would be counted as 1 FCE and in Scotland it would be counted as 2 FCE.
SourceNHS Digital (2018). Hospital Episode Statistics 2017/18. https://digital.nhs.uk/data-and-information/publications/statistical/hospital-admitted-patient-care-activity/2017-18 Information Services Division Scotland (2019) Main diagnosis discharges from hospital 2017/18. Personal correspondence.NHS Wales Informatics Service (2018). The Patient Episode Database for Wales- 2017/18. www.infoandstats.wales.nhs.ukHospital Information Branch (2018). Northern Ireland Episode Based Inpatient and Day Case Activity Data (2017/18) www.health-ni.gov.uk/publications/acute-episode-based-activity-201718
England 2017/18 Scotland 2017/18 Wales 2017/18 Northern Ireland 2017/18 United Kingdom, 2017/18
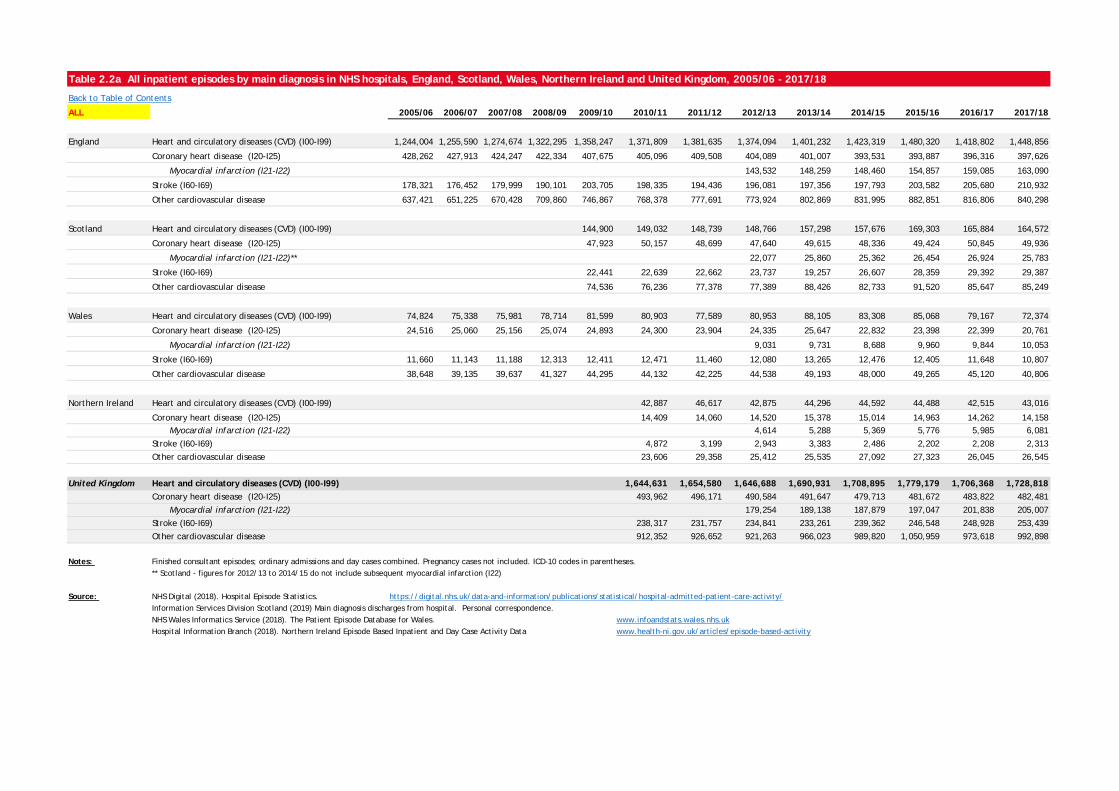
Table 2.2a All inpatient episodes by main diagnosis in NHS hospitals, England, Scotland, Wales, Northern Ireland and United Kingdom, 2005/06 - 2017/18
Back to Table of Contents
ALL 2005/06 2006/07 2007/08 2008/09 2009/10 2010/11 2011/12 2012/13 2013/14 2014/15 2015/16 2016/17 2017/18
England Heart and circulatory diseases (CVD) (I00-I99) 1,244,004 1,255,590 1,274,674 1,322,295 1,358,247 1,371,809 1,381,635 1,374,094 1,401,232 1,423,319 1,480,320 1,418,802 1,448,856
Coronary heart disease (I20-I25) 428,262 427,913 424,247 422,334 407,675 405,096 409,508 404,089 401,007 393,531 393,887 396,316 397,626
Myocardial infarction (I21-I22) 143,532 148,259 148,460 154,857 159,085 163,090
Stroke (I60-I69) 178,321 176,452 179,999 190,101 203,705 198,335 194,436 196,081 197,356 197,793 203,582 205,680 210,932
Other cardiovascular disease 637,421 651,225 670,428 709,860 746,867 768,378 777,691 773,924 802,869 831,995 882,851 816,806 840,298
Scotland Heart and circulatory diseases (CVD) (I00-I99) 144,900 149,032 148,739 148,766 157,298 157,676 169,303 165,884 164,572
Coronary heart disease (I20-I25) 47,923 50,157 48,699 47,640 49,615 48,336 49,424 50,845 49,936
Myocardial infarction (I21-I22)** 22,077 25,860 25,362 26,454 26,924 25,783
Stroke (I60-I69) 22,441 22,639 22,662 23,737 19,257 26,607 28,359 29,392 29,387
Other cardiovascular disease 74,536 76,236 77,378 77,389 88,426 82,733 91,520 85,647 85,249
Wales Heart and circulatory diseases (CVD) (I00-I99) 74,824 75,338 75,981 78,714 81,599 80,903 77,589 80,953 88,105 83,308 85,068 79,167 72,374
Coronary heart disease (I20-I25) 24,516 25,060 25,156 25,074 24,893 24,300 23,904 24,335 25,647 22,832 23,398 22,399 20,761
Myocardial infarction (I21-I22) 9,031 9,731 8,688 9,960 9,844 10,053
Stroke (I60-I69) 11,660 11,143 11,188 12,313 12,411 12,471 11,460 12,080 13,265 12,476 12,405 11,648 10,807
Other cardiovascular disease 38,648 39,135 39,637 41,327 44,295 44,132 42,225 44,538 49,193 48,000 49,265 45,120 40,806
Northern Ireland Heart and circulatory diseases (CVD) (I00-I99) 42,887 46,617 42,875 44,296 44,592 44,488 42,515 43,016
Coronary heart disease (I20-I25) 14,409 14,060 14,520 15,378 15,014 14,963 14,262 14,158Myocardial infarction (I21-I22) 4,614 5,288 5,369 5,776 5,985 6,081
Stroke (I60-I69) 4,872 3,199 2,943 3,383 2,486 2,202 2,208 2,313
Other cardiovascular disease 23,606 29,358 25,412 25,535 27,092 27,323 26,045 26,545
United Kingdom Heart and circulatory diseases (CVD) (I00-I99) 1,644,631 1,654,580 1,646,688 1,690,931 1,708,895 1,779,179 1,706,368 1,728,818Coronary heart disease (I20-I25) 493,962 496,171 490,584 491,647 479,713 481,672 483,822 482,481
Myocardial infarction (I21-I22) 179,254 189,138 187,879 197,047 201,838 205,007
Stroke (I60-I69) 238,317 231,757 234,841 233,261 239,362 246,548 248,928 253,439
Other cardiovascular disease 912,352 926,652 921,263 966,023 989,820 1,050,959 973,618 992,898
Notes: Finished consultant episodes; ordinary admissions and day cases combined. Pregnancy cases not included. ICD-10 codes in parentheses. ** Scotland - figures for 2012/13 to 2014/15 do not include subsequent myocardial infarction (I22)
Source: NHS Digital (2018). Hospital Episode Statistics. https://digital.nhs.uk/data-and-information/publications/statistical/hospital-admitted-patient-care-activity/Information Services Division Scotland (2019) Main diagnosis discharges from hospital. Personal correspondence.NHS Wales Informatics Service (2018). The Patient Episode Database for Wales. www.infoandstats.wales.nhs.ukHospital Information Branch (2018). Northern Ireland Episode Based Inpatient and Day Case Activity Data www.health-ni.gov.uk/articles/episode-based-activity
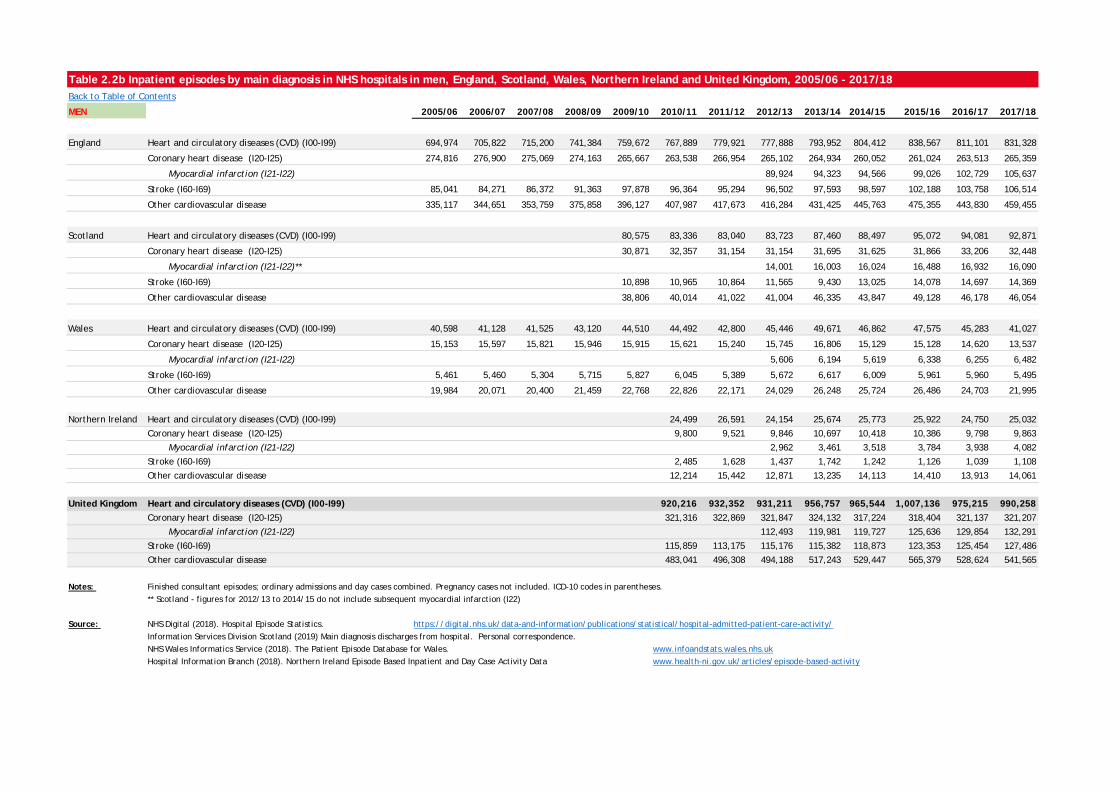
Table 2.2b Inpatient episodes by main diagnosis in NHS hospitals in men, England, Scotland, Wales, Northern Ireland and United Kingdom, 2005/06 - 2017/18Back to Table of Contents
MEN 2005/06 2006/07 2007/08 2008/09 2009/10 2010/11 2011/12 2012/13 2013/14 2014/15 2015/16 2016/17 2017/18
England Heart and circulatory diseases (CVD) (I00-I99) 694,974 705,822 715,200 741,384 759,672 767,889 779,921 777,888 793,952 804,412 838,567 811,101 831,328
Coronary heart disease (I20-I25) 274,816 276,900 275,069 274,163 265,667 263,538 266,954 265,102 264,934 260,052 261,024 263,513 265,359
Myocardial infarction (I21-I22) 89,924 94,323 94,566 99,026 102,729 105,637
Stroke (I60-I69) 85,041 84,271 86,372 91,363 97,878 96,364 95,294 96,502 97,593 98,597 102,188 103,758 106,514
Other cardiovascular disease 335,117 344,651 353,759 375,858 396,127 407,987 417,673 416,284 431,425 445,763 475,355 443,830 459,455
Scotland Heart and circulatory diseases (CVD) (I00-I99) 80,575 83,336 83,040 83,723 87,460 88,497 95,072 94,081 92,871
Coronary heart disease (I20-I25) 30,871 32,357 31,154 31,154 31,695 31,625 31,866 33,206 32,448
Myocardial infarction (I21-I22)** 14,001 16,003 16,024 16,488 16,932 16,090
Stroke (I60-I69) 10,898 10,965 10,864 11,565 9,430 13,025 14,078 14,697 14,369
Other cardiovascular disease 38,806 40,014 41,022 41,004 46,335 43,847 49,128 46,178 46,054
Wales Heart and circulatory diseases (CVD) (I00-I99) 40,598 41,128 41,525 43,120 44,510 44,492 42,800 45,446 49,671 46,862 47,575 45,283 41,027
Coronary heart disease (I20-I25) 15,153 15,597 15,821 15,946 15,915 15,621 15,240 15,745 16,806 15,129 15,128 14,620 13,537
Myocardial infarction (I21-I22) 5,606 6,194 5,619 6,338 6,255 6,482
Stroke (I60-I69) 5,461 5,460 5,304 5,715 5,827 6,045 5,389 5,672 6,617 6,009 5,961 5,960 5,495
Other cardiovascular disease 19,984 20,071 20,400 21,459 22,768 22,826 22,171 24,029 26,248 25,724 26,486 24,703 21,995
Northern Ireland Heart and circulatory diseases (CVD) (I00-I99) 24,499 26,591 24,154 25,674 25,773 25,922 24,750 25,032
Coronary heart disease (I20-I25) 9,800 9,521 9,846 10,697 10,418 10,386 9,798 9,863
Myocardial infarction (I21-I22) 2,962 3,461 3,518 3,784 3,938 4,082
Stroke (I60-I69) 2,485 1,628 1,437 1,742 1,242 1,126 1,039 1,108
Other cardiovascular disease 12,214 15,442 12,871 13,235 14,113 14,410 13,913 14,061
United Kingdom Heart and circulatory diseases (CVD) (I00-I99) 920,216 932,352 931,211 956,757 965,544 1,007,136 975,215 990,258Coronary heart disease (I20-I25) 321,316 322,869 321,847 324,132 317,224 318,404 321,137 321,207
Myocardial infarction (I21-I22) 112,493 119,981 119,727 125,636 129,854 132,291
Stroke (I60-I69) 115,859 113,175 115,176 115,382 118,873 123,353 125,454 127,486
Other cardiovascular disease 483,041 496,308 494,188 517,243 529,447 565,379 528,624 541,565
Notes: Finished consultant episodes; ordinary admissions and day cases combined. Pregnancy cases not included. ICD-10 codes in parentheses. ** Scotland - figures for 2012/13 to 2014/15 do not include subsequent myocardial infarction (I22)
Source: NHS Digital (2018). Hospital Episode Statistics. https://digital.nhs.uk/data-and-information/publications/statistical/hospital-admitted-patient-care-activity/Information Services Division Scotland (2019) Main diagnosis discharges from hospital. Personal correspondence.NHS Wales Informatics Service (2018). The Patient Episode Database for Wales. www.infoandstats.wales.nhs.ukHospital Information Branch (2018). Northern Ireland Episode Based Inpatient and Day Case Activity Data www.health-ni.gov.uk/articles/episode-based-activity
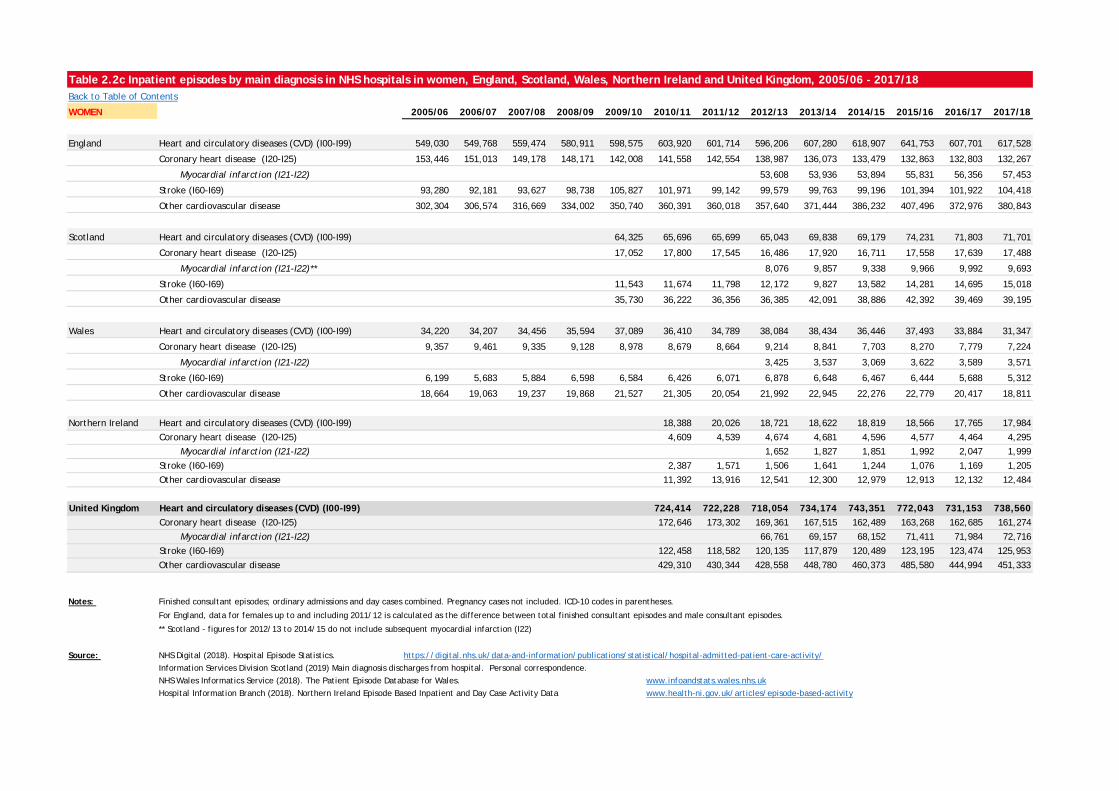
Table 2.2c Inpatient episodes by main diagnosis in NHS hospitals in women, England, Scotland, Wales, Northern Ireland and United Kingdom, 2005/06 - 2017/18Back to Table of Contents
WOMEN 2005/06 2006/07 2007/08 2008/09 2009/10 2010/11 2011/12 2012/13 2013/14 2014/15 2015/16 2016/17 2017/18
England Heart and circulatory diseases (CVD) (I00-I99) 549,030 549,768 559,474 580,911 598,575 603,920 601,714 596,206 607,280 618,907 641,753 607,701 617,528
Coronary heart disease (I20-I25) 153,446 151,013 149,178 148,171 142,008 141,558 142,554 138,987 136,073 133,479 132,863 132,803 132,267
Myocardial infarction (I21-I22) 53,608 53,936 53,894 55,831 56,356 57,453
Stroke (I60-I69) 93,280 92,181 93,627 98,738 105,827 101,971 99,142 99,579 99,763 99,196 101,394 101,922 104,418
Other cardiovascular disease 302,304 306,574 316,669 334,002 350,740 360,391 360,018 357,640 371,444 386,232 407,496 372,976 380,843
Scotland Heart and circulatory diseases (CVD) (I00-I99) 64,325 65,696 65,699 65,043 69,838 69,179 74,231 71,803 71,701
Coronary heart disease (I20-I25) 17,052 17,800 17,545 16,486 17,920 16,711 17,558 17,639 17,488
Myocardial infarction (I21-I22)** 8,076 9,857 9,338 9,966 9,992 9,693
Stroke (I60-I69) 11,543 11,674 11,798 12,172 9,827 13,582 14,281 14,695 15,018
Other cardiovascular disease 35,730 36,222 36,356 36,385 42,091 38,886 42,392 39,469 39,195
Wales Heart and circulatory diseases (CVD) (I00-I99) 34,220 34,207 34,456 35,594 37,089 36,410 34,789 38,084 38,434 36,446 37,493 33,884 31,347
Coronary heart disease (I20-I25) 9,357 9,461 9,335 9,128 8,978 8,679 8,664 9,214 8,841 7,703 8,270 7,779 7,224
Myocardial infarction (I21-I22) 3,425 3,537 3,069 3,622 3,589 3,571
Stroke (I60-I69) 6,199 5,683 5,884 6,598 6,584 6,426 6,071 6,878 6,648 6,467 6,444 5,688 5,312
Other cardiovascular disease 18,664 19,063 19,237 19,868 21,527 21,305 20,054 21,992 22,945 22,276 22,779 20,417 18,811
Northern Ireland Heart and circulatory diseases (CVD) (I00-I99) 18,388 20,026 18,721 18,622 18,819 18,566 17,765 17,984
Coronary heart disease (I20-I25) 4,609 4,539 4,674 4,681 4,596 4,577 4,464 4,295
Myocardial infarction (I21-I22) 1,652 1,827 1,851 1,992 2,047 1,999
Stroke (I60-I69) 2,387 1,571 1,506 1,641 1,244 1,076 1,169 1,205
Other cardiovascular disease 11,392 13,916 12,541 12,300 12,979 12,913 12,132 12,484
United Kingdom Heart and circulatory diseases (CVD) (I00-I99) 724,414 722,228 718,054 734,174 743,351 772,043 731,153 738,560Coronary heart disease (I20-I25) 172,646 173,302 169,361 167,515 162,489 163,268 162,685 161,274
Myocardial infarction (I21-I22) 66,761 69,157 68,152 71,411 71,984 72,716
Stroke (I60-I69) 122,458 118,582 120,135 117,879 120,489 123,195 123,474 125,953
Other cardiovascular disease 429,310 430,344 428,558 448,780 460,373 485,580 444,994 451,333
Notes: Finished consultant episodes; ordinary admissions and day cases combined. Pregnancy cases not included. ICD-10 codes in parentheses.
** Scotland - figures for 2012/13 to 2014/15 do not include subsequent myocardial infarction (I22)
Source: NHS Digital (2018). Hospital Episode Statistics. https://digital.nhs.uk/data-and-information/publications/statistical/hospital-admitted-patient-care-activity/Information Services Division Scotland (2019) Main diagnosis discharges from hospital. Personal correspondence.NHS Wales Informatics Service (2018). The Patient Episode Database for Wales. www.infoandstats.wales.nhs.ukHospital Information Branch (2018). Northern Ireland Episode Based Inpatient and Day Case Activity Data www.health-ni.gov.uk/articles/episode-based-activity
For England, data for females up to and including 2011/12 is calculated as the difference between total finished consultant episodes and male consultant episodes.
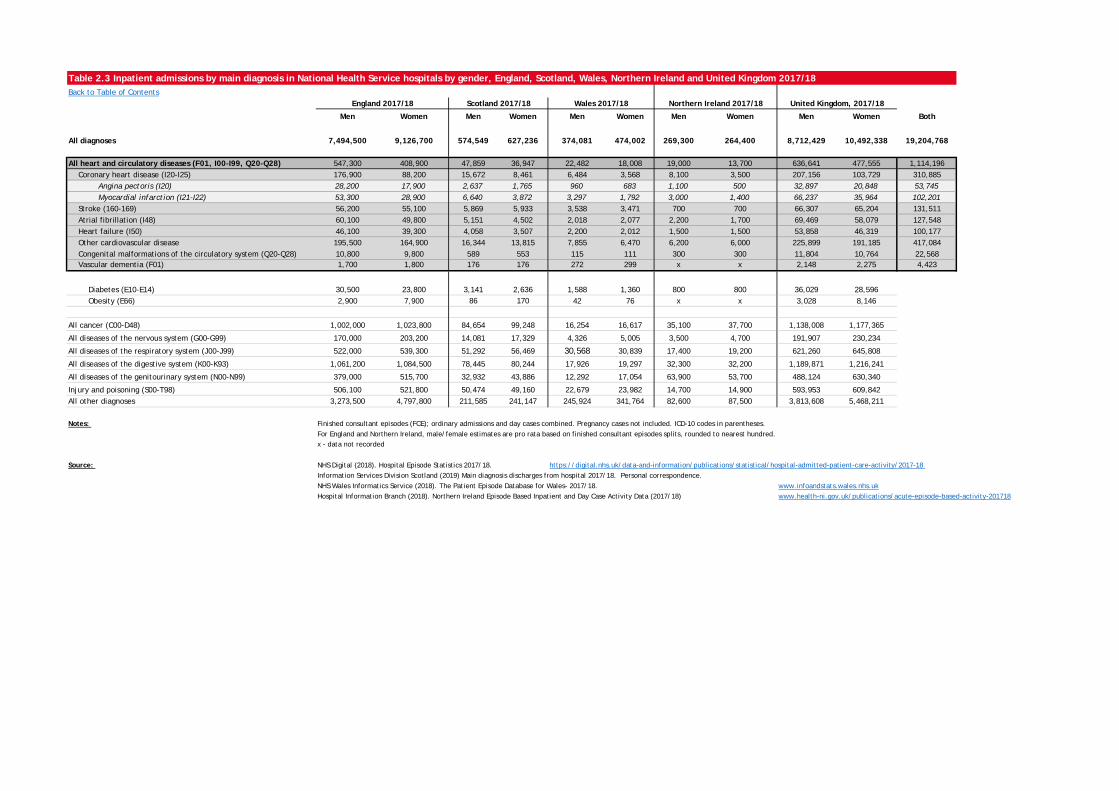
Table 2.3 Inpatient admissions by main diagnosis in National Health Service hospitals by gender, England, Scotland, Wales, Northern Ireland and United Kingdom 2017/18Back to Table of Contents
Men Women Men Women Men Women Men Women Men Women Both
All diagnoses 7,494,500 9,126,700 574,549 627,236 374,081 474,002 269,300 264,400 8,712,429 10,492,338 19,204,768
All heart and circulatory diseases (F01, I00-I99, Q20-Q28) 547,300 408,900 47,859 36,947 22,482 18,008 19,000 13,700 636,641 477,555 1,114,196Coronary heart disease (I20-I25) 176,900 88,200 15,672 8,461 6,484 3,568 8,100 3,500 207,156 103,729 310,885
Angina pectoris (I20) 28,200 17,900 2,637 1,765 960 683 1,100 500 32,897 20,848 53,745Myocardial infarction (I21-I22) 53,300 28,900 6,640 3,872 3,297 1,792 3,000 1,400 66,237 35,964 102,201
Stroke (160-169) 56,200 55,100 5,869 5,933 3,538 3,471 700 700 66,307 65,204 131,511Atrial fibrillation (I48) 60,100 49,800 5,151 4,502 2,018 2,077 2,200 1,700 69,469 58,079 127,548Heart failure (I50) 46,100 39,300 4,058 3,507 2,200 2,012 1,500 1,500 53,858 46,319 100,177Other cardiovascular disease 195,500 164,900 16,344 13,815 7,855 6,470 6,200 6,000 225,899 191,185 417,084Congenital malformations of the circulatory system (Q20-Q28) 10,800 9,800 589 553 115 111 300 300 11,804 10,764 22,568Vascular dementia (F01) 1,700 1,800 176 176 272 299 x x 2,148 2,275 4,423
Diabetes (E10-E14) 30,500 23,800 3,141 2,636 1,588 1,360 800 800 36,029 28,596Obesity (E66) 2,900 7,900 86 170 42 76 x x 3,028 8,146
All cancer (C00-D48) 1,002,000 1,023,800 84,654 99,248 16,254 16,617 35,100 37,700 1,138,008 1,177,365
All diseases of the nervous system (G00-G99) 170,000 203,200 14,081 17,329 4,326 5,005 3,500 4,700 191,907 230,234
All diseases of the respiratory system (J00-J99) 522,000 539,300 51,292 56,469 30,568 30,839 17,400 19,200 621,260 645,808
All diseases of the digestive system (K00-K93) 1,061,200 1,084,500 78,445 80,244 17,926 19,297 32,300 32,200 1,189,871 1,216,241
All diseases of the genitourinary system (N00-N99) 379,000 515,700 32,932 43,886 12,292 17,054 63,900 53,700 488,124 630,340
Injury and poisoning (S00-T98) 506,100 521,800 50,474 49,160 22,679 23,982 14,700 14,900 593,953 609,842All other diagnoses 3,273,500 4,797,800 211,585 241,147 245,924 341,764 82,600 87,500 3,813,608 5,468,211
Notes: Finished consultant episodes (FCE); ordinary admissions and day cases combined. Pregnancy cases not included. ICD-10 codes in parentheses. For England and Northern Ireland, male/female estimates are pro rata based on finished consultant episodes splits, rounded to nearest hundred.x - data not recorded
Source: NHS Digital (2018). Hospital Episode Statistics 2017/18. https://digital.nhs.uk/data-and-information/publications/statistical/hospital-admitted-patient-care-activity/2017-18 Information Services Division Scotland (2019) Main diagnosis discharges from hospital 2017/18. Personal correspondence.NHS Wales Informatics Service (2018). The Patient Episode Database for Wales- 2017/18. www.infoandstats.wales.nhs.ukHospital Information Branch (2018). Northern Ireland Episode Based Inpatient and Day Case Activity Data (2017/18) www.health-ni.gov.uk/publications/acute-episode-based-activity-201718
England 2017/18 Scotland 2017/18 Wales 2017/18 Northern Ireland 2017/18 United Kingdom, 2017/18
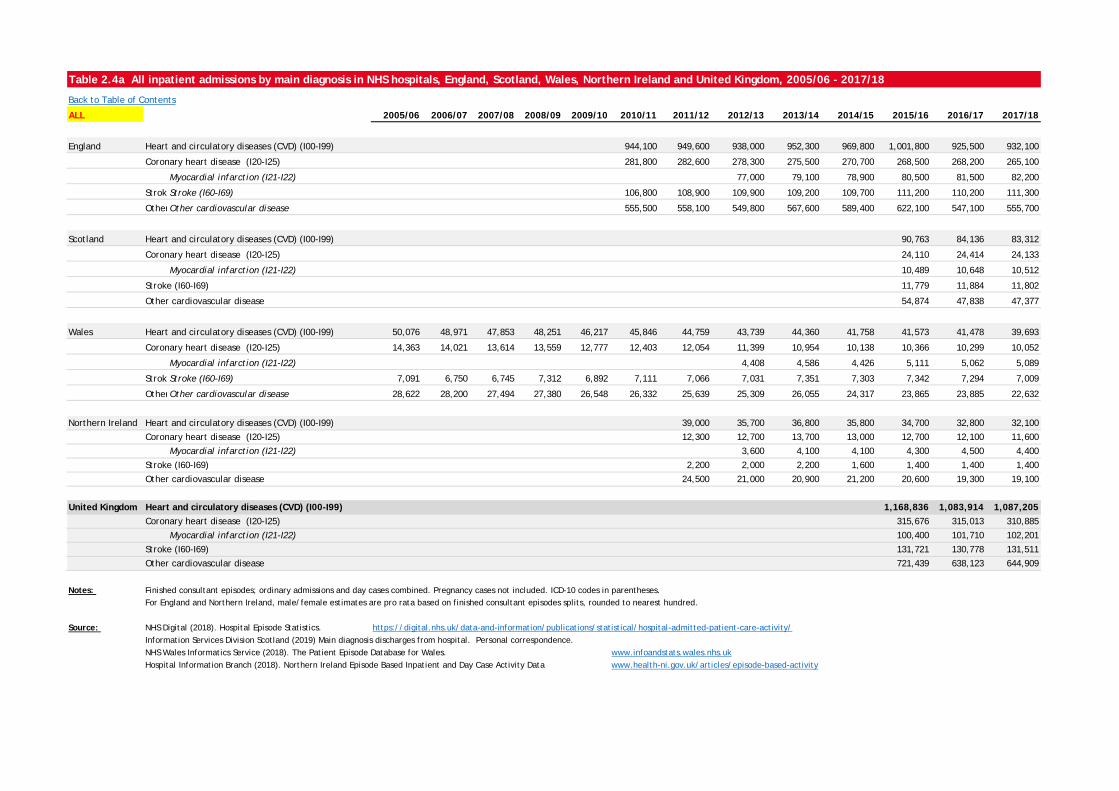
Table 2.4a All inpatient admissions by main diagnosis in NHS hospitals, England, Scotland, Wales, Northern Ireland and United Kingdom, 2005/06 - 2017/18
Back to Table of Contents
ALL 2005/06 2006/07 2007/08 2008/09 2009/10 2010/11 2011/12 2012/13 2013/14 2014/15 2015/16 2016/17 2017/18
England Heart and circulatory diseases (CVD) (I00-I99) 944,100 949,600 938,000 952,300 969,800 1,001,800 925,500 932,100
Coronary heart disease (I20-I25) 281,800 282,600 278,300 275,500 270,700 268,500 268,200 265,100
Myocardial infarction (I21-I22) 77,000 79,100 78,900 80,500 81,500 82,200
Stroke Stroke (I60-I69) 106,800 108,900 109,900 109,200 109,700 111,200 110,200 111,300
Other Other cardiovascular disease 555,500 558,100 549,800 567,600 589,400 622,100 547,100 555,700
Scotland Heart and circulatory diseases (CVD) (I00-I99) 90,763 84,136 83,312
Coronary heart disease (I20-I25) 24,110 24,414 24,133
Myocardial infarction (I21-I22) 10,489 10,648 10,512
Stroke (I60-I69) 11,779 11,884 11,802
Other cardiovascular disease 54,874 47,838 47,377
Wales Heart and circulatory diseases (CVD) (I00-I99) 50,076 48,971 47,853 48,251 46,217 45,846 44,759 43,739 44,360 41,758 41,573 41,478 39,693
Coronary heart disease (I20-I25) 14,363 14,021 13,614 13,559 12,777 12,403 12,054 11,399 10,954 10,138 10,366 10,299 10,052
Myocardial infarction (I21-I22) 4,408 4,586 4,426 5,111 5,062 5,089
Stroke Stroke (I60-I69) 7,091 6,750 6,745 7,312 6,892 7,111 7,066 7,031 7,351 7,303 7,342 7,294 7,009
Other Other cardiovascular disease 28,622 28,200 27,494 27,380 26,548 26,332 25,639 25,309 26,055 24,317 23,865 23,885 22,632
Northern Ireland Heart and circulatory diseases (CVD) (I00-I99) 39,000 35,700 36,800 35,800 34,700 32,800 32,100
Coronary heart disease (I20-I25) 12,300 12,700 13,700 13,000 12,700 12,100 11,600
Myocardial infarction (I21-I22) 3,600 4,100 4,100 4,300 4,500 4,400
Stroke (I60-I69) 2,200 2,000 2,200 1,600 1,400 1,400 1,400
Other cardiovascular disease 24,500 21,000 20,900 21,200 20,600 19,300 19,100
United Kingdom Heart and circulatory diseases (CVD) (I00-I99) 1,168,836 1,083,914 1,087,205Coronary heart disease (I20-I25) 315,676 315,013 310,885
Myocardial infarction (I21-I22) 100,400 101,710 102,201
Stroke (I60-I69) 131,721 130,778 131,511
Other cardiovascular disease 721,439 638,123 644,909
Notes: Finished consultant episodes; ordinary admissions and day cases combined. Pregnancy cases not included. ICD-10 codes in parentheses. For England and Northern Ireland, male/female estimates are pro rata based on finished consultant episodes splits, rounded to nearest hundred.
Source: NHS Digital (2018). Hospital Episode Statistics. https://digital.nhs.uk/data-and-information/publications/statistical/hospital-admitted-patient-care-activity/Information Services Division Scotland (2019) Main diagnosis discharges from hospital. Personal correspondence.NHS Wales Informatics Service (2018). The Patient Episode Database for Wales. www.infoandstats.wales.nhs.ukHospital Information Branch (2018). Northern Ireland Episode Based Inpatient and Day Case Activity Data www.health-ni.gov.uk/articles/episode-based-activity
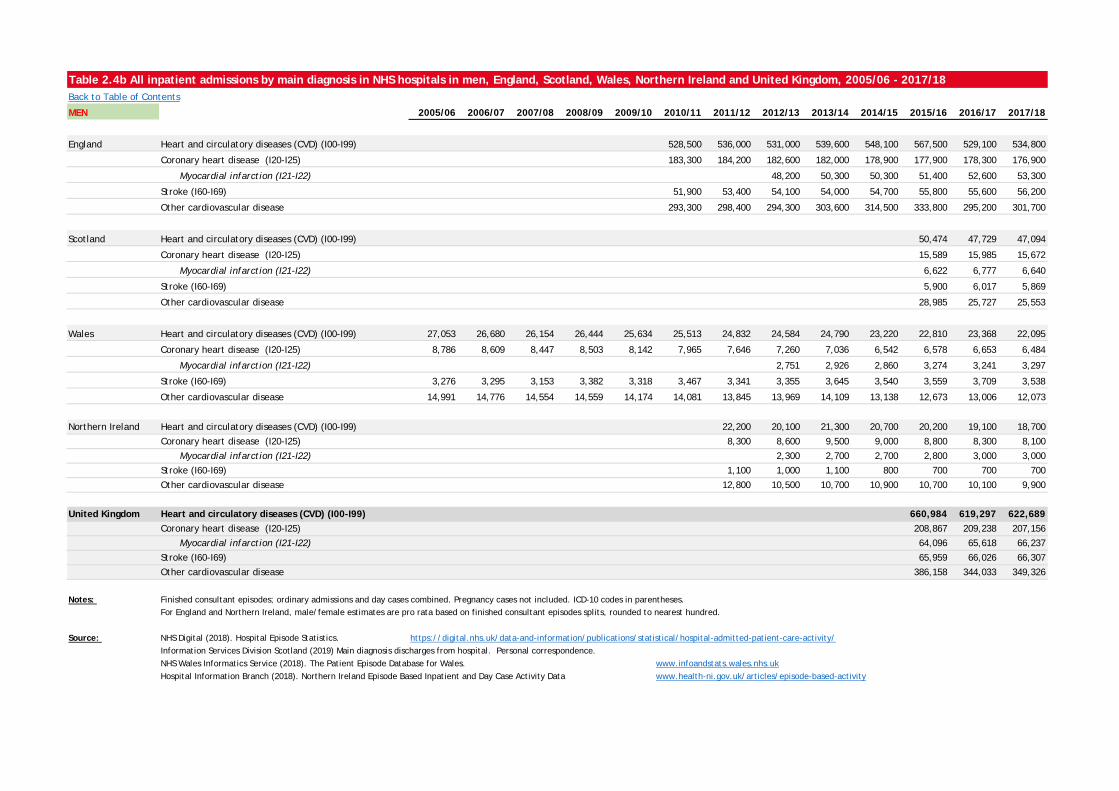
Table 2.4b All inpatient admissions by main diagnosis in NHS hospitals in men, England, Scotland, Wales, Northern Ireland and United Kingdom, 2005/06 - 2017/18Back to Table of Contents
MEN 2005/06 2006/07 2007/08 2008/09 2009/10 2010/11 2011/12 2012/13 2013/14 2014/15 2015/16 2016/17 2017/18
England Heart and circulatory diseases (CVD) (I00-I99) 528,500 536,000 531,000 539,600 548,100 567,500 529,100 534,800
Coronary heart disease (I20-I25) 183,300 184,200 182,600 182,000 178,900 177,900 178,300 176,900
Myocardial infarction (I21-I22) 48,200 50,300 50,300 51,400 52,600 53,300
Stroke (I60-I69) 51,900 53,400 54,100 54,000 54,700 55,800 55,600 56,200
Other cardiovascular disease 293,300 298,400 294,300 303,600 314,500 333,800 295,200 301,700
Scotland Heart and circulatory diseases (CVD) (I00-I99) 50,474 47,729 47,094
Coronary heart disease (I20-I25) 15,589 15,985 15,672
Myocardial infarction (I21-I22) 6,622 6,777 6,640
Stroke (I60-I69) 5,900 6,017 5,869
Other cardiovascular disease 28,985 25,727 25,553
Wales Heart and circulatory diseases (CVD) (I00-I99) 27,053 26,680 26,154 26,444 25,634 25,513 24,832 24,584 24,790 23,220 22,810 23,368 22,095
Coronary heart disease (I20-I25) 8,786 8,609 8,447 8,503 8,142 7,965 7,646 7,260 7,036 6,542 6,578 6,653 6,484
Myocardial infarction (I21-I22) 2,751 2,926 2,860 3,274 3,241 3,297
Stroke (I60-I69) 3,276 3,295 3,153 3,382 3,318 3,467 3,341 3,355 3,645 3,540 3,559 3,709 3,538
Other cardiovascular disease 14,991 14,776 14,554 14,559 14,174 14,081 13,845 13,969 14,109 13,138 12,673 13,006 12,073
Northern Ireland Heart and circulatory diseases (CVD) (I00-I99) 22,200 20,100 21,300 20,700 20,200 19,100 18,700
Coronary heart disease (I20-I25) 8,300 8,600 9,500 9,000 8,800 8,300 8,100
Myocardial infarction (I21-I22) 2,300 2,700 2,700 2,800 3,000 3,000
Stroke (I60-I69) 1,100 1,000 1,100 800 700 700 700
Other cardiovascular disease 12,800 10,500 10,700 10,900 10,700 10,100 9,900
United Kingdom Heart and circulatory diseases (CVD) (I00-I99) 660,984 619,297 622,689Coronary heart disease (I20-I25) 208,867 209,238 207,156
Myocardial infarction (I21-I22) 64,096 65,618 66,237
Stroke (I60-I69) 65,959 66,026 66,307
Other cardiovascular disease 386,158 344,033 349,326
Notes: Finished consultant episodes; ordinary admissions and day cases combined. Pregnancy cases not included. ICD-10 codes in parentheses. For England and Northern Ireland, male/female estimates are pro rata based on finished consultant episodes splits, rounded to nearest hundred.
Source: NHS Digital (2018). Hospital Episode Statistics. https://digital.nhs.uk/data-and-information/publications/statistical/hospital-admitted-patient-care-activity/Information Services Division Scotland (2019) Main diagnosis discharges from hospital. Personal correspondence.NHS Wales Informatics Service (2018). The Patient Episode Database for Wales. www.infoandstats.wales.nhs.ukHospital Information Branch (2018). Northern Ireland Episode Based Inpatient and Day Case Activity Data www.health-ni.gov.uk/articles/episode-based-activity
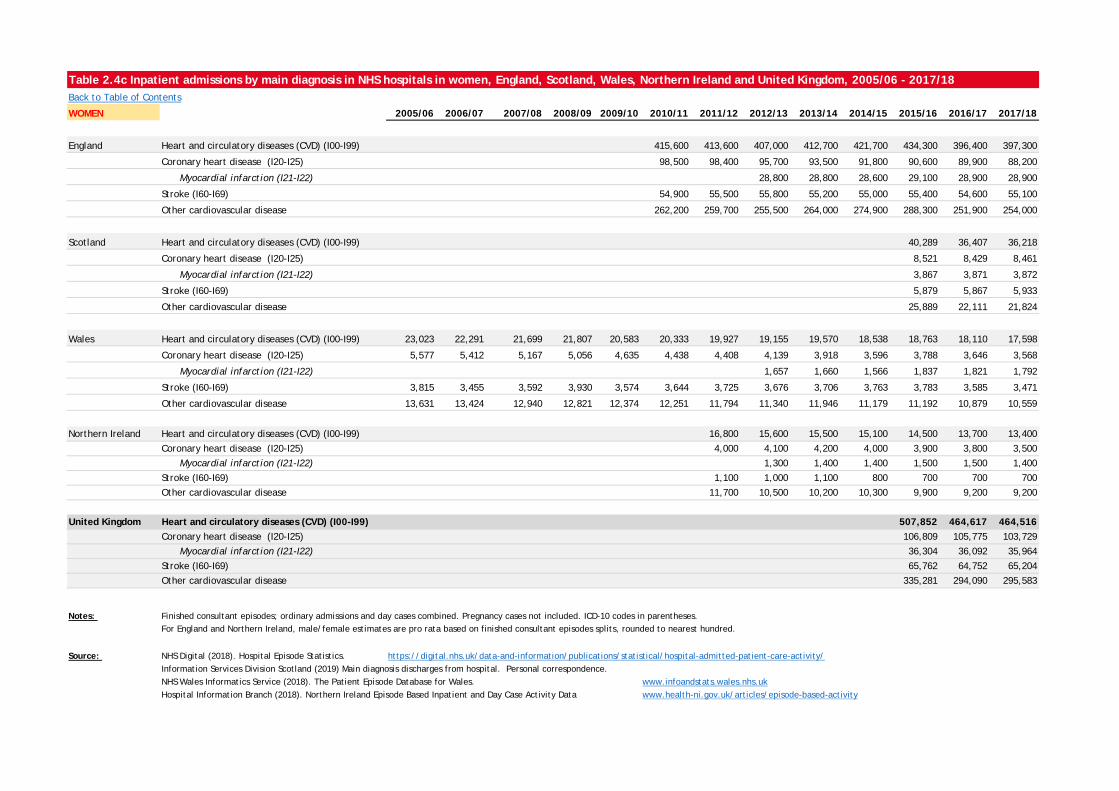
Table 2.4c Inpatient admissions by main diagnosis in NHS hospitals in women, England, Scotland, Wales, Northern Ireland and United Kingdom, 2005/06 - 2017/18Back to Table of Contents
WOMEN 2005/06 2006/07 2007/08 2008/09 2009/10 2010/11 2011/12 2012/13 2013/14 2014/15 2015/16 2016/17 2017/18
England Heart and circulatory diseases (CVD) (I00-I99) 415,600 413,600 407,000 412,700 421,700 434,300 396,400 397,300
Coronary heart disease (I20-I25) 98,500 98,400 95,700 93,500 91,800 90,600 89,900 88,200
Myocardial infarction (I21-I22) 28,800 28,800 28,600 29,100 28,900 28,900
Stroke (I60-I69) 54,900 55,500 55,800 55,200 55,000 55,400 54,600 55,100
Other cardiovascular disease 262,200 259,700 255,500 264,000 274,900 288,300 251,900 254,000
Scotland Heart and circulatory diseases (CVD) (I00-I99) 40,289 36,407 36,218
Coronary heart disease (I20-I25) 8,521 8,429 8,461
Myocardial infarction (I21-I22) 3,867 3,871 3,872
Stroke (I60-I69) 5,879 5,867 5,933
Other cardiovascular disease 25,889 22,111 21,824
Wales Heart and circulatory diseases (CVD) (I00-I99) 23,023 22,291 21,699 21,807 20,583 20,333 19,927 19,155 19,570 18,538 18,763 18,110 17,598
Coronary heart disease (I20-I25) 5,577 5,412 5,167 5,056 4,635 4,438 4,408 4,139 3,918 3,596 3,788 3,646 3,568
Myocardial infarction (I21-I22) 1,657 1,660 1,566 1,837 1,821 1,792
Stroke (I60-I69) 3,815 3,455 3,592 3,930 3,574 3,644 3,725 3,676 3,706 3,763 3,783 3,585 3,471
Other cardiovascular disease 13,631 13,424 12,940 12,821 12,374 12,251 11,794 11,340 11,946 11,179 11,192 10,879 10,559
Northern Ireland Heart and circulatory diseases (CVD) (I00-I99) 16,800 15,600 15,500 15,100 14,500 13,700 13,400
Coronary heart disease (I20-I25) 4,000 4,100 4,200 4,000 3,900 3,800 3,500
Myocardial infarction (I21-I22) 1,300 1,400 1,400 1,500 1,500 1,400
Stroke (I60-I69) 1,100 1,000 1,100 800 700 700 700
Other cardiovascular disease 11,700 10,500 10,200 10,300 9,900 9,200 9,200
United Kingdom Heart and circulatory diseases (CVD) (I00-I99) 507,852 464,617 464,516Coronary heart disease (I20-I25) 106,809 105,775 103,729
Myocardial infarction (I21-I22) 36,304 36,092 35,964
Stroke (I60-I69) 65,762 64,752 65,204
Other cardiovascular disease 335,281 294,090 295,583
Notes: Finished consultant episodes; ordinary admissions and day cases combined. Pregnancy cases not included. ICD-10 codes in parentheses. For England and Northern Ireland, male/female estimates are pro rata based on finished consultant episodes splits, rounded to nearest hundred.
Source: NHS Digital (2018). Hospital Episode Statistics. https://digital.nhs.uk/data-and-information/publications/statistical/hospital-admitted-patient-care-activity/Information Services Division Scotland (2019) Main diagnosis discharges from hospital. Personal correspondence.NHS Wales Informatics Service (2018). The Patient Episode Database for Wales. www.infoandstats.wales.nhs.ukHospital Information Branch (2018). Northern Ireland Episode Based Inpatient and Day Case Activity Data www.health-ni.gov.uk/articles/episode-based-activity
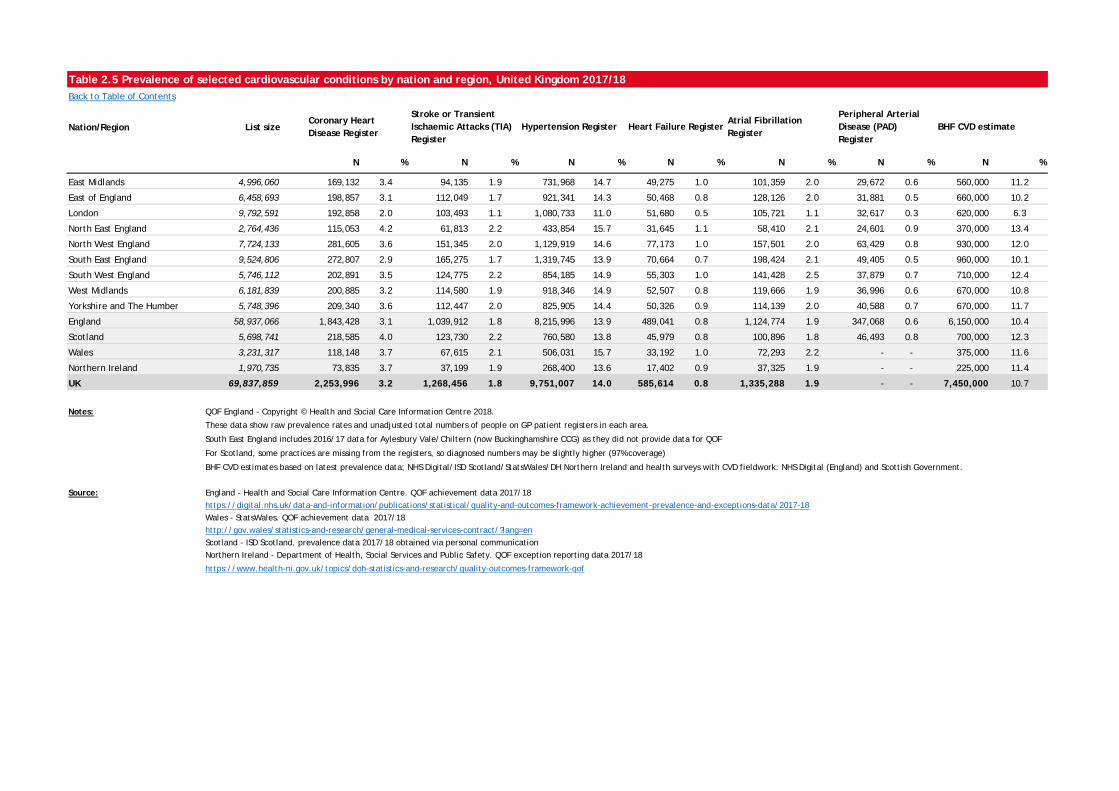
Table 2.5 Prevalence of selected cardiovascular conditions by nation and region, United Kingdom 2017/18Back to Table of Contents Chronic Hea Chronic He Stroke & Tra Stroke & T Hypertensio HypertensiHeart FailuHeart FailuAtrial FibrillaAtrial FibriPeripheral Peripheral Diabetes Diabetes
Nation/Region List size
N % N % N % N % N % N % N %
East Midlands 4,996,060 169,132 3.4 94,135 1.9 731,968 14.7 49,275 1.0 101,359 2.0 29,672 0.6 560,000 11.2
East of England 6,458,693 198,857 3.1 112,049 1.7 921,341 14.3 50,468 0.8 128,126 2.0 31,881 0.5 660,000 10.2
London 9,792,591 192,858 2.0 103,493 1.1 1,080,733 11.0 51,680 0.5 105,721 1.1 32,617 0.3 620,000 6.3
North East England 2,764,436 115,053 4.2 61,813 2.2 433,854 15.7 31,645 1.1 58,410 2.1 24,601 0.9 370,000 13.4
North West England 7,724,133 281,605 3.6 151,345 2.0 1,129,919 14.6 77,173 1.0 157,501 2.0 63,429 0.8 930,000 12.0
South East England 9,524,806 272,807 2.9 165,275 1.7 1,319,745 13.9 70,664 0.7 198,424 2.1 49,405 0.5 960,000 10.1
South West England 5,746,112 202,891 3.5 124,775 2.2 854,185 14.9 55,303 1.0 141,428 2.5 37,879 0.7 710,000 12.4
West Midlands 6,181,839 200,885 3.2 114,580 1.9 918,346 14.9 52,507 0.8 119,666 1.9 36,996 0.6 670,000 10.8
Yorkshire and The Humber 5,748,396 209,340 3.6 112,447 2.0 825,905 14.4 50,326 0.9 114,139 2.0 40,588 0.7 670,000 11.7
England 58,937,066 1,843,428 3.1 1,039,912 1.8 8,215,996 13.9 489,041 0.8 1,124,774 1.9 347,068 0.6 6,150,000 10.4
Scotland 5,698,741 218,585 4.0 123,730 2.2 760,580 13.8 45,979 0.8 100,896 1.8 46,493 0.8 700,000 12.3
Wales 3,231,317 118,148 3.7 67,615 2.1 506,031 15.7 33,192 1.0 72,293 2.2 - - 375,000 11.6
Northern Ireland 1,970,735 73,835 3.7 37,199 1.9 268,400 13.6 17,402 0.9 37,325 1.9 - - 225,000 11.4
UK 69,837,859 2,253,996 3.2 1,268,456 1.8 9,751,007 14.0 585,614 0.8 1,335,288 1.9 - - 7,450,000 10.7
Notes: QOF England - Copyright © Health and Social Care Information Centre 2018.
These data show raw prevalence rates and unadjusted total numbers of people on GP patient registers in each area.
South East England includes 2016/17 data for Aylesbury Vale/Chiltern (now Buckinghamshire CCG) as they did not provide data for QOF
For Scotland, some practices are missing from the registers, so diagnosed numbers may be slightly higher (97% coverage)
BHF CVD estimates based on latest prevalence data; NHS Digital/ISD Scotland/StatsWales/DH Northern Ireland and health surveys with CVD fieldwork: NHS Digital (England) and Scottish Government.
Source: England - Health and Social Care Information Centre. QOF achievement data 2017/18https://digital.nhs.uk/data-and-information/publications/statistical/quality-and-outcomes-framework-achievement-prevalence-and-exceptions-data/2017-18Wales - StatsWales. QOF achievement data 2017/18http://gov.wales/statistics-and-research/general-medical-services-contract/?lang=enScotland - ISD Scotland. prevalence data 2017/18 obtained via personal communicationNorthern Ireland - Department of Health, Social Services and Public Safety. QOF exception reporting data 2017/18
https://www.health-ni.gov.uk/topics/doh-statistics-and-research/quality-outcomes-framework-qof
BHF CVD estimatePeripheral Arterial Disease (PAD) Register
Coronary Heart Disease Register
Stroke or Transient Ischaemic Attacks (TIA) Register
Hypertension Register Heart Failure RegisterAtrial Fibrillation Register
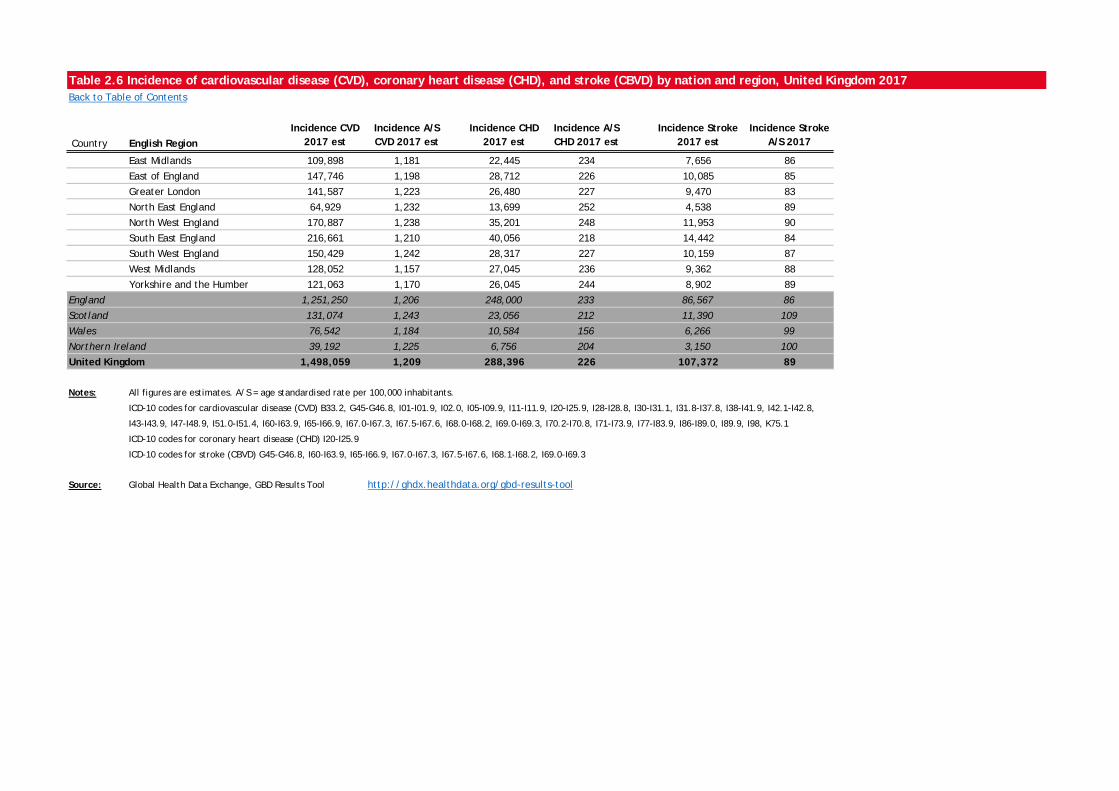
Table 2.6 Incidence of cardiovascular disease (CVD), coronary heart disease (CHD), and stroke (CBVD) by nation and region, United Kingdom 2017Back to Table of Contents
Country English RegionIncidence CVD
2017 estIncidence A/S CVD 2017 est
Incidence CHD 2017 est
Incidence A/S CHD 2017 est
Incidence Stroke 2017 est
Incidence Stroke A/S 2017
England East Midlands 109,898 1,181 22,445 234 7,656 86
England East of England 147,746 1,198 28,712 226 10,085 85
England Greater London 141,587 1,223 26,480 227 9,470 83
England North East England 64,929 1,232 13,699 252 4,538 89
England North West England 170,887 1,238 35,201 248 11,953 90
England South East England 216,661 1,210 40,056 218 14,442 84
England South West England 150,429 1,242 28,317 227 10,159 87
England West Midlands 128,052 1,157 27,045 236 9,362 88
England Yorkshire and the Humber 121,063 1,170 26,045 244 8,902 89
England 1,251,250 1,206 248,000 233 86,567 86
Scotland 131,074 1,243 23,056 212 11,390 109
Wales 76,542 1,184 10,584 156 6,266 99
Northern Ireland 39,192 1,225 6,756 204 3,150 100
United Kingdom 1,498,059 1,209 288,396 226 107,372 89
Notes: All figures are estimates. A/S = age standardised rate per 100,000 inhabitants.
ICD-10 codes for cardiovascular disease (CVD) B33.2, G45-G46.8, I01-I01.9, I02.0, I05-I09.9, I11-I11.9, I20-I25.9, I28-I28.8, I30-I31.1, I31.8-I37.8, I38-I41.9, I42.1-I42.8,
I43-I43.9, I47-I48.9, I51.0-I51.4, I60-I63.9, I65-I66.9, I67.0-I67.3, I67.5-I67.6, I68.0-I68.2, I69.0-I69.3, I70.2-I70.8, I71-I73.9, I77-I83.9, I86-I89.0, I89.9, I98, K75.1
ICD-10 codes for coronary heart disease (CHD) I20-I25.9
ICD-10 codes for stroke (CBVD) G45-G46.8, I60-I63.9, I65-I66.9, I67.0-I67.3, I67.5-I67.6, I68.1-I68.2, I69.0-I69.3
Source: Global Health Data Exchange, GBD Results Tool http://ghdx.healthdata.org/gbd-results-tool
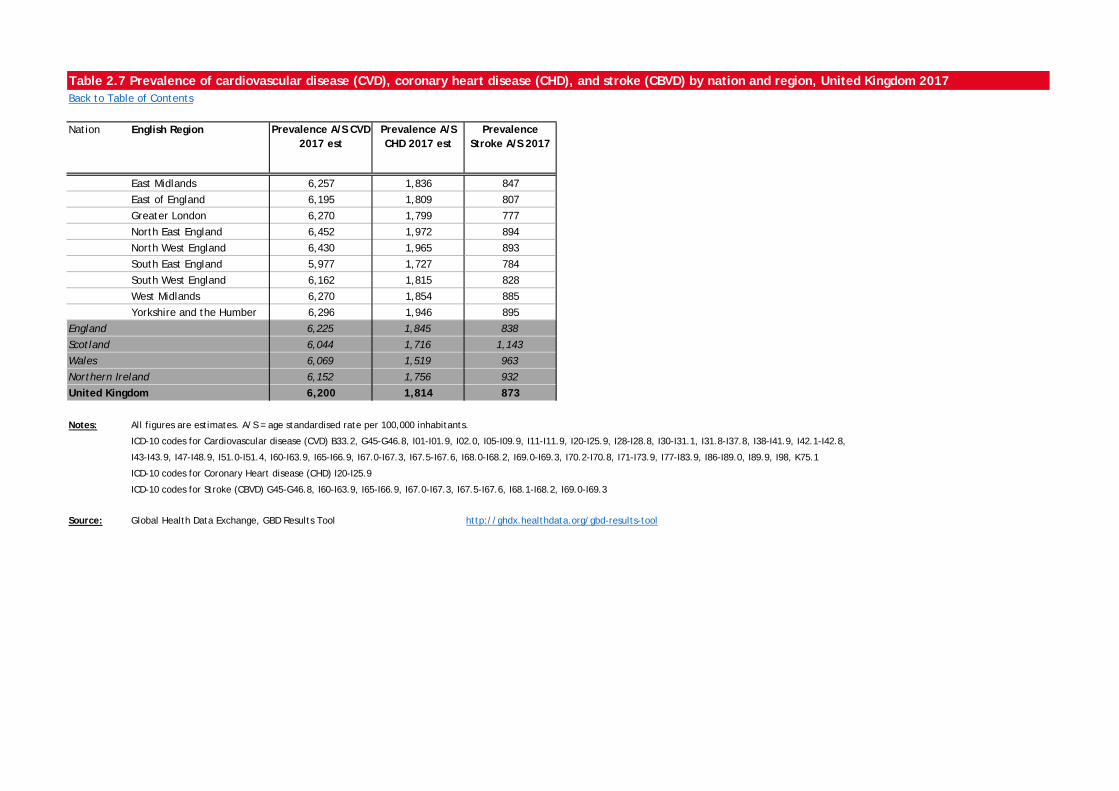
Table 2.7 Prevalence of cardiovascular disease (CVD), coronary heart disease (CHD), and stroke (CBVD) by nation and region, United Kingdom 2017Back to Table of Contents
Nation English Region Prevalence A/S CVD 2017 est
Prevalence A/S CHD 2017 est
Prevalence Stroke A/S 2017
England East Midlands 6,257 1,836 847
England East of England 6,195 1,809 807
England Greater London 6,270 1,799 777
England North East England 6,452 1,972 894
England North West England 6,430 1,965 893
England South East England 5,977 1,727 784
England South West England 6,162 1,815 828
England West Midlands 6,270 1,854 885
England Yorkshire and the Humber 6,296 1,946 895
England 6,225 1,845 838
Scotland 6,044 1,716 1,143
Wales 6,069 1,519 963
Northern Ireland 6,152 1,756 932
United Kingdom 6,200 1,814 873
Notes: All figures are estimates. A/S = age standardised rate per 100,000 inhabitants.
ICD-10 codes for Cardiovascular disease (CVD) B33.2, G45-G46.8, I01-I01.9, I02.0, I05-I09.9, I11-I11.9, I20-I25.9, I28-I28.8, I30-I31.1, I31.8-I37.8, I38-I41.9, I42.1-I42.8,
I43-I43.9, I47-I48.9, I51.0-I51.4, I60-I63.9, I65-I66.9, I67.0-I67.3, I67.5-I67.6, I68.0-I68.2, I69.0-I69.3, I70.2-I70.8, I71-I73.9, I77-I83.9, I86-I89.0, I89.9, I98, K75.1
ICD-10 codes for Coronary Heart disease (CHD) I20-I25.9
ICD-10 codes for Stroke (CBVD) G45-G46.8, I60-I63.9, I65-I66.9, I67.0-I67.3, I67.5-I67.6, I68.1-I68.2, I69.0-I69.3
Source: Global Health Data Exchange, GBD Results Tool http://ghdx.healthdata.org/gbd-results-tool
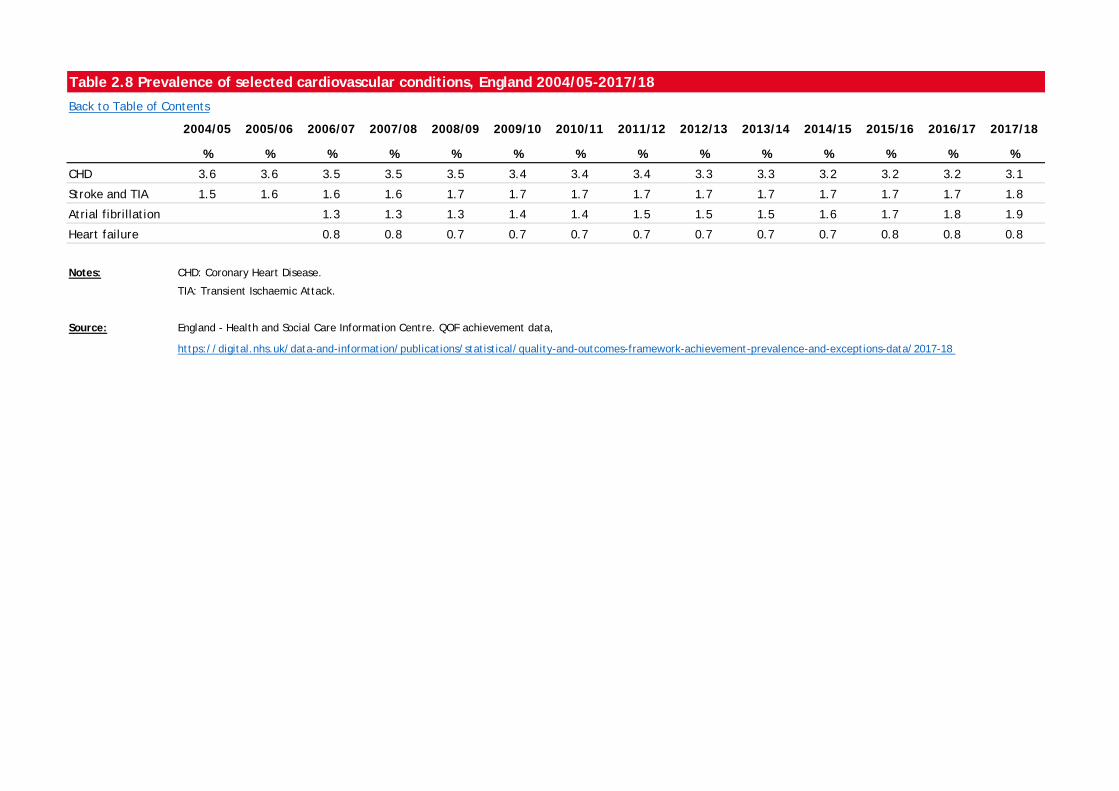
Table 2.8 Prevalence of selected cardiovascular conditions, England 2004/05-2017/18
Back to Table of Contents
2004/05 2005/06 2006/07 2007/08 2008/09 2009/10 2010/11 2011/12 2012/13 2013/14 2014/15 2015/16 2016/17 2017/18
% % % % % % % % % % % % % %
CHD 3.6 3.6 3.5 3.5 3.5 3.4 3.4 3.4 3.3 3.3 3.2 3.2 3.2 3.1
Stroke and TIA 1.5 1.6 1.6 1.6 1.7 1.7 1.7 1.7 1.7 1.7 1.7 1.7 1.7 1.8
Atrial fibrillation 1.3 1.3 1.3 1.4 1.4 1.5 1.5 1.5 1.6 1.7 1.8 1.9
Heart failure 0.8 0.8 0.7 0.7 0.7 0.7 0.7 0.7 0.7 0.8 0.8 0.8
Notes: CHD: Coronary Heart Disease.
TIA: Transient Ischaemic Attack.
Source: England - Health and Social Care Information Centre. QOF achievement data,
https://digital.nhs.uk/data-and-information/publications/statistical/quality-and-outcomes-framework-achievement-prevalence-and-exceptions-data/2017-18
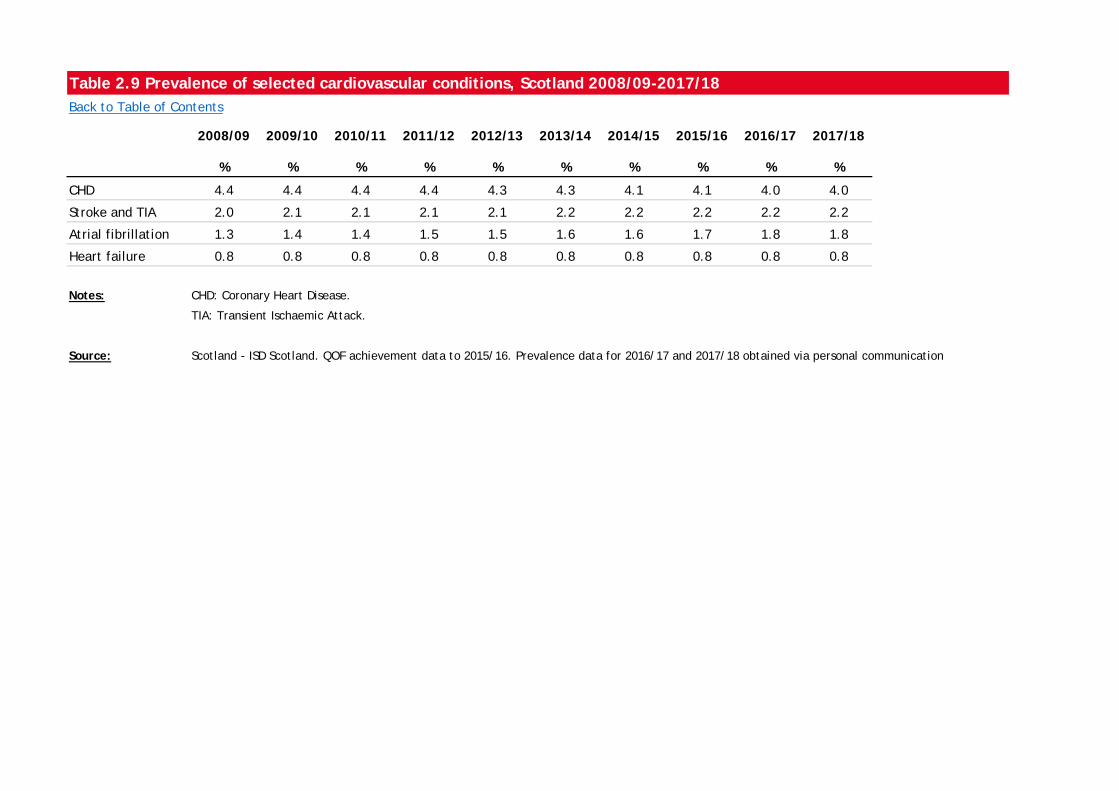
Table 2.9 Prevalence of selected cardiovascular conditions, Scotland 2008/09-2017/18Back to Table of Contents
2008/09 2009/10 2010/11 2011/12 2012/13 2013/14 2014/15 2015/16 2016/17 2017/18
% % % % % % % % % %
CHD 4.4 4.4 4.4 4.4 4.3 4.3 4.1 4.1 4.0 4.0
Stroke and TIA 2.0 2.1 2.1 2.1 2.1 2.2 2.2 2.2 2.2 2.2
Atrial fibrillation 1.3 1.4 1.4 1.5 1.5 1.6 1.6 1.7 1.8 1.8
Heart failure 0.8 0.8 0.8 0.8 0.8 0.8 0.8 0.8 0.8 0.8
Notes: CHD: Coronary Heart Disease.
TIA: Transient Ischaemic Attack.
Source: Scotland - ISD Scotland. QOF achievement data to 2015/16. Prevalence data for 2016/17 and 2017/18 obtained via personal communication
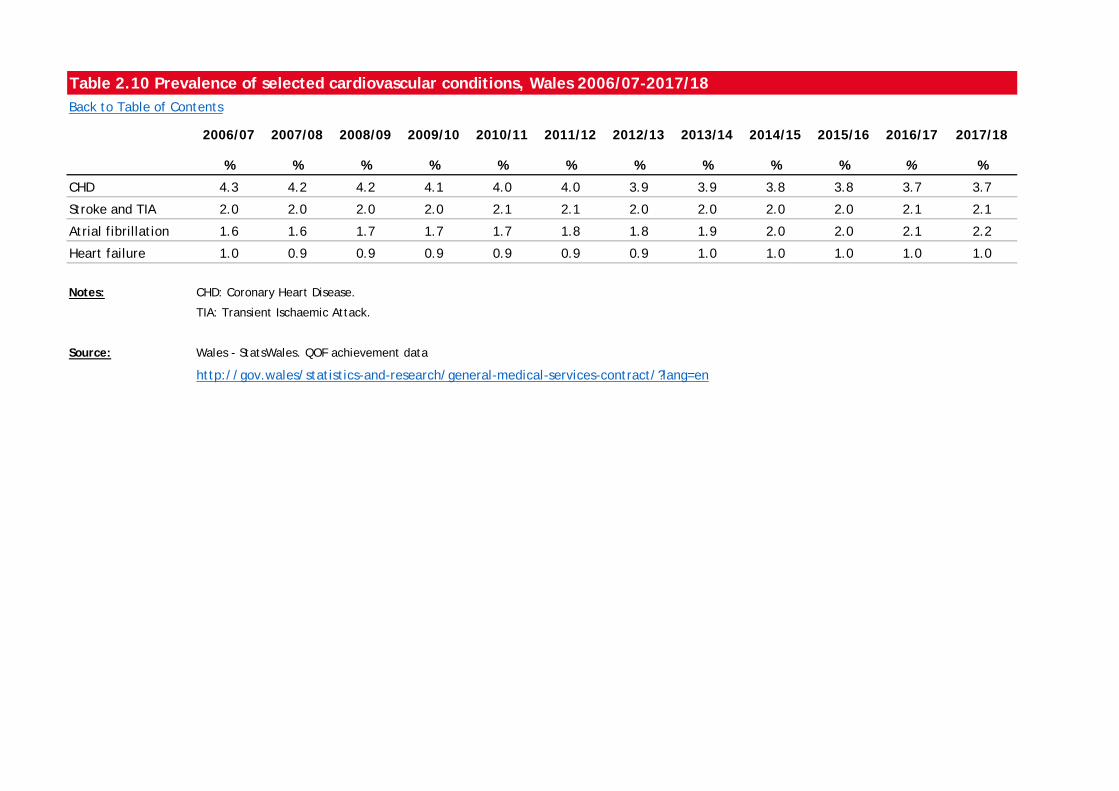
Table 2.10 Prevalence of selected cardiovascular conditions, Wales 2006/07-2017/18Back to Table of Contents
2006/07 2007/08 2008/09 2009/10 2010/11 2011/12 2012/13 2013/14 2014/15 2015/16 2016/17 2017/18
% % % % % % % % % % % %
CHD 4.3 4.2 4.2 4.1 4.0 4.0 3.9 3.9 3.8 3.8 3.7 3.7
Stroke and TIA 2.0 2.0 2.0 2.0 2.1 2.1 2.0 2.0 2.0 2.0 2.1 2.1
Atrial fibrillation 1.6 1.6 1.7 1.7 1.7 1.8 1.8 1.9 2.0 2.0 2.1 2.2
Heart failure 1.0 0.9 0.9 0.9 0.9 0.9 0.9 1.0 1.0 1.0 1.0 1.0
Notes: CHD: Coronary Heart Disease.
TIA: Transient Ischaemic Attack.
Source: Wales - StatsWales. QOF achievement data
http://gov.wales/statistics-and-research/general-medical-services-contract/?lang=en
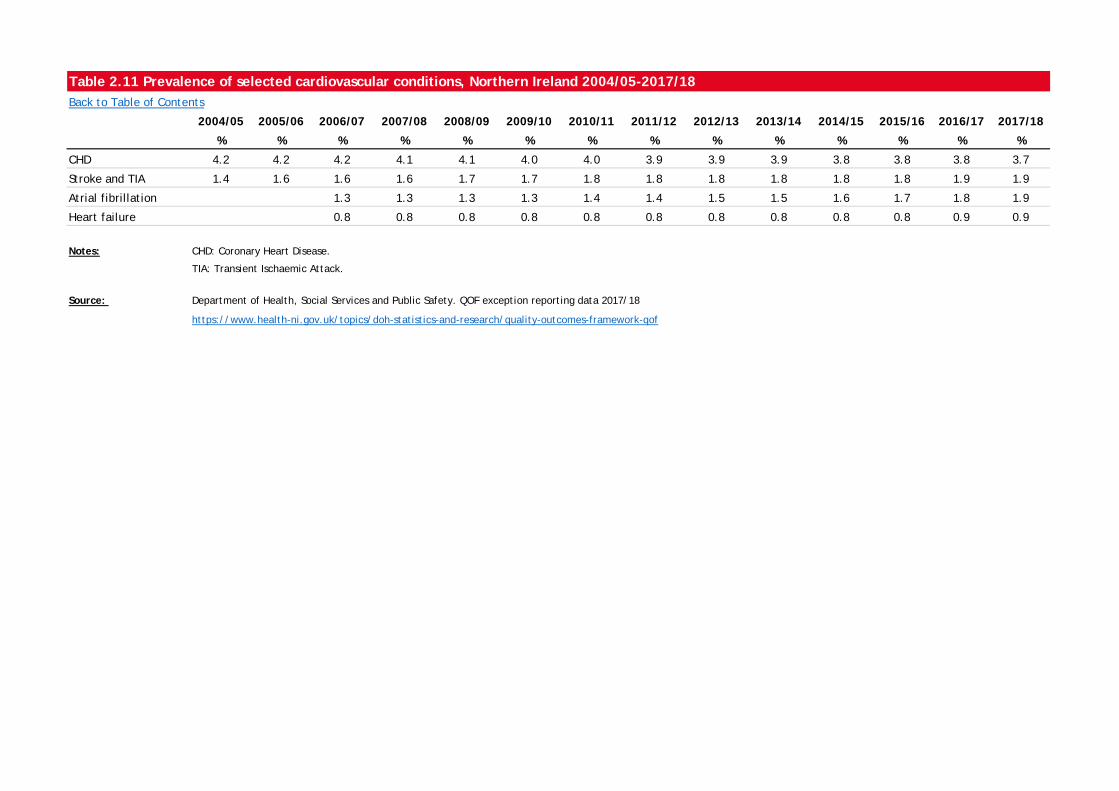
Table 2.11 Prevalence of selected cardiovascular conditions, Northern Ireland 2004/05-2017/18Back to Table of Contents
2004/05 2005/06 2006/07 2007/08 2008/09 2009/10 2010/11 2011/12 2012/13 2013/14 2014/15 2015/16 2016/17 2017/18
% % % % % % % % % % % % % %
CHD 4.2 4.2 4.2 4.1 4.1 4.0 4.0 3.9 3.9 3.9 3.8 3.8 3.8 3.7
Stroke and TIA 1.4 1.6 1.6 1.6 1.7 1.7 1.8 1.8 1.8 1.8 1.8 1.8 1.9 1.9
Atrial fibrillation 1.3 1.3 1.3 1.3 1.4 1.4 1.5 1.5 1.6 1.7 1.8 1.9
Heart failure 0.8 0.8 0.8 0.8 0.8 0.8 0.8 0.8 0.8 0.8 0.9 0.9
Notes: CHD: Coronary Heart Disease.
TIA: Transient Ischaemic Attack.
Source:
https://www.health-ni.gov.uk/topics/doh-statistics-and-research/quality-outcomes-framework-qof
Department of Health, Social Services and Public Safety. QOF exception reporting data 2017/18
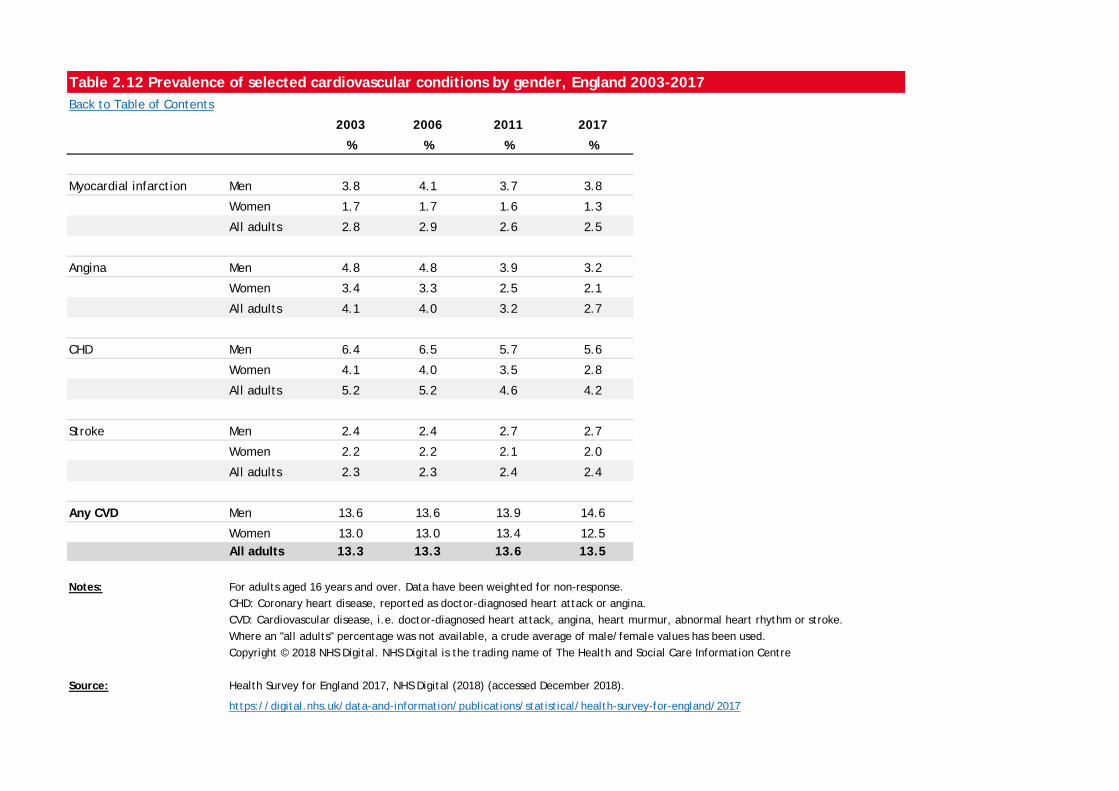
Table 2.12 Prevalence of selected cardiovascular conditions by gender, England 2003-2017Back to Table of Contents
2003 2006 2011 2017
% % % %
Myocardial infarction Men 3.8 4.1 3.7 3.8
Women 1.7 1.7 1.6 1.3
All adults 2.8 2.9 2.6 2.5
Angina Men 4.8 4.8 3.9 3.2
Women 3.4 3.3 2.5 2.1
All adults 4.1 4.0 3.2 2.7
CHD Men 6.4 6.5 5.7 5.6
Women 4.1 4.0 3.5 2.8
All adults 5.2 5.2 4.6 4.2
Stroke Men 2.4 2.4 2.7 2.7
Women 2.2 2.2 2.1 2.0
All adults 2.3 2.3 2.4 2.4
Any CVD Men 13.6 13.6 13.9 14.6
Women 13.0 13.0 13.4 12.5All adults 13.3 13.3 13.6 13.5
Notes: For adults aged 16 years and over. Data have been weighted for non-response. CHD: Coronary heart disease, reported as doctor-diagnosed heart attack or angina.CVD: Cardiovascular disease, i.e. doctor-diagnosed heart attack, angina, heart murmur, abnormal heart rhythm or stroke.Where an "all adults" percentage was not available, a crude average of male/female values has been used.Copyright © 2018 NHS Digital. NHS Digital is the trading name of The Health and Social Care Information Centre
Source: Health Survey for England 2017, NHS Digital (2018) (accessed December 2018).
https://digital.nhs.uk/data-and-information/publications/statistical/health-survey-for-england/2017
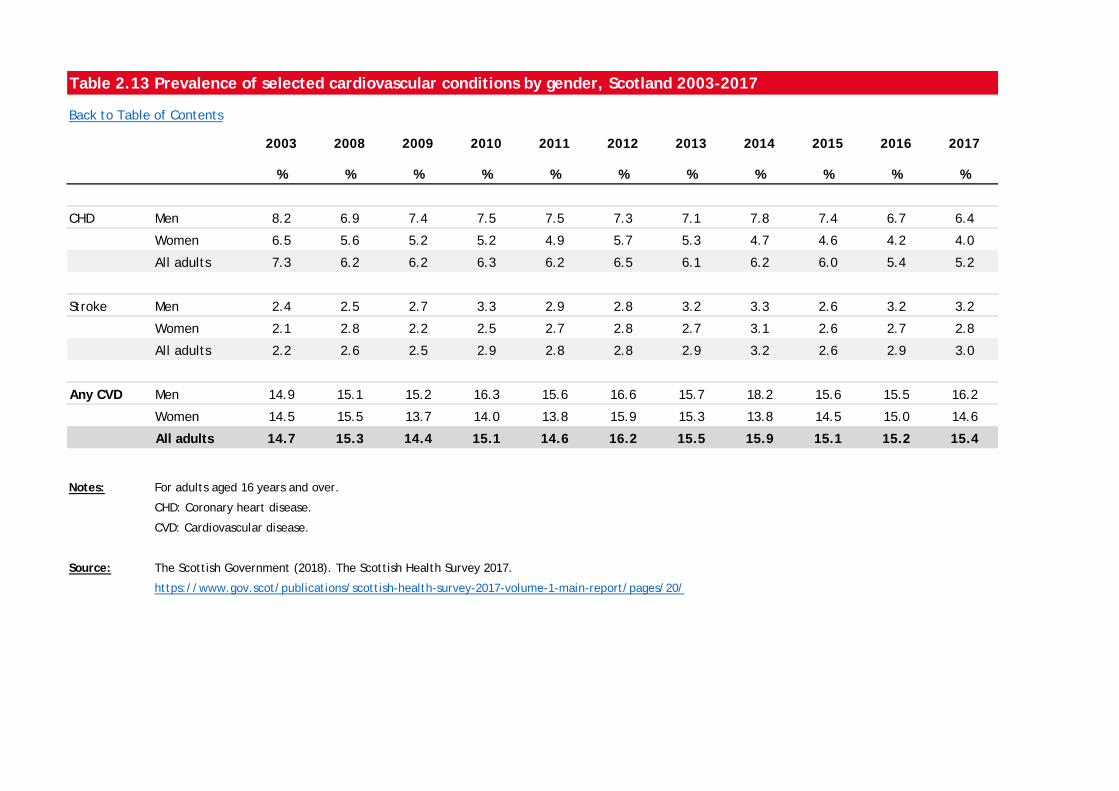
Table 2.13 Prevalence of selected cardiovascular conditions by gender, Scotland 2003-2017
Back to Table of Contents
2003 2008 2009 2010 2011 2012 2013 2014 2015 2016 2017
% % % % % % % % % % %
CHD Men 8.2 6.9 7.4 7.5 7.5 7.3 7.1 7.8 7.4 6.7 6.4
Women 6.5 5.6 5.2 5.2 4.9 5.7 5.3 4.7 4.6 4.2 4.0
All adults 7.3 6.2 6.2 6.3 6.2 6.5 6.1 6.2 6.0 5.4 5.2
Stroke Men 2.4 2.5 2.7 3.3 2.9 2.8 3.2 3.3 2.6 3.2 3.2
Women 2.1 2.8 2.2 2.5 2.7 2.8 2.7 3.1 2.6 2.7 2.8
All adults 2.2 2.6 2.5 2.9 2.8 2.8 2.9 3.2 2.6 2.9 3.0
Any CVD Men 14.9 15.1 15.2 16.3 15.6 16.6 15.7 18.2 15.6 15.5 16.2
Women 14.5 15.5 13.7 14.0 13.8 15.9 15.3 13.8 14.5 15.0 14.6
All adults 14.7 15.3 14.4 15.1 14.6 16.2 15.5 15.9 15.1 15.2 15.4
Notes: For adults aged 16 years and over.
CHD: Coronary heart disease.
CVD: Cardiovascular disease.
Source: The Scottish Government (2018). The Scottish Health Survey 2017.
https://www.gov.scot/publications/scottish-health-survey-2017-volume-1-main-report/pages/20/
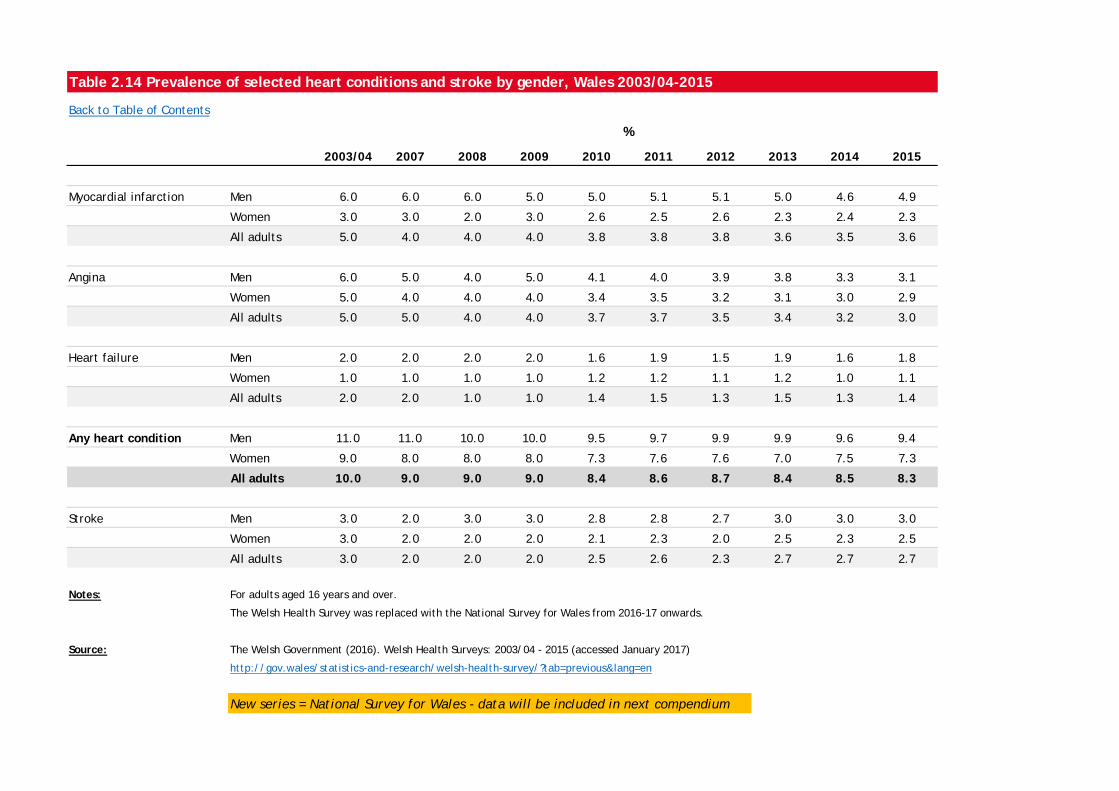
Table 2.14 Prevalence of selected heart conditions and stroke by gender, Wales 2003/04-2015
Back to Table of Contents
2003/04 2007 2008 2009 2010 2011 2012 2013 2014 2015
Myocardial infarction Men 6.0 6.0 6.0 5.0 5.0 5.1 5.1 5.0 4.6 4.9
Women 3.0 3.0 2.0 3.0 2.6 2.5 2.6 2.3 2.4 2.3
All adults 5.0 4.0 4.0 4.0 3.8 3.8 3.8 3.6 3.5 3.6
Angina Men 6.0 5.0 4.0 5.0 4.1 4.0 3.9 3.8 3.3 3.1
Women 5.0 4.0 4.0 4.0 3.4 3.5 3.2 3.1 3.0 2.9
All adults 5.0 5.0 4.0 4.0 3.7 3.7 3.5 3.4 3.2 3.0
Heart failure Men 2.0 2.0 2.0 2.0 1.6 1.9 1.5 1.9 1.6 1.8
Women 1.0 1.0 1.0 1.0 1.2 1.2 1.1 1.2 1.0 1.1
All adults 2.0 2.0 1.0 1.0 1.4 1.5 1.3 1.5 1.3 1.4
Any heart condition Men 11.0 11.0 10.0 10.0 9.5 9.7 9.9 9.9 9.6 9.4
Women 9.0 8.0 8.0 8.0 7.3 7.6 7.6 7.0 7.5 7.3
All adults 10.0 9.0 9.0 9.0 8.4 8.6 8.7 8.4 8.5 8.3
Stroke Men 3.0 2.0 3.0 3.0 2.8 2.8 2.7 3.0 3.0 3.0
Women 3.0 2.0 2.0 2.0 2.1 2.3 2.0 2.5 2.3 2.5
All adults 3.0 2.0 2.0 2.0 2.5 2.6 2.3 2.7 2.7 2.7
Notes: For adults aged 16 years and over.
The Welsh Health Survey was replaced with the National Survey for Wales from 2016-17 onwards.
Source: The Welsh Government (2016). Welsh Health Surveys: 2003/04 - 2015 (accessed January 2017)
http://gov.wales/statistics-and-research/welsh-health-survey/?tab=previous&lang=en
New series = National Survey for Wales - data will be included in next compendium
%
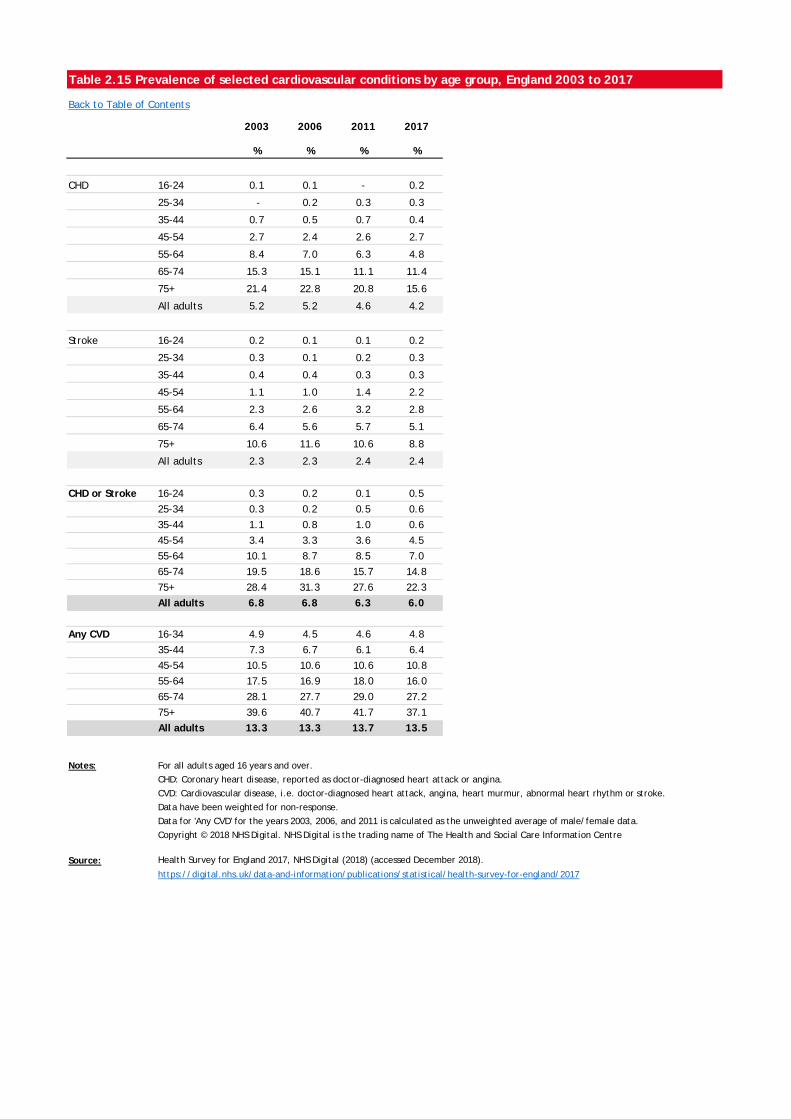
Table 2.15 Prevalence of selected cardiovascular conditions by age group, England 2003 to 2017
Back to Table of Contents
2003 2006 2011 2017
% % % %
CHD 16-24 0.1 0.1 - 0.2
25-34 - 0.2 0.3 0.3
35-44 0.7 0.5 0.7 0.4
45-54 2.7 2.4 2.6 2.7
55-64 8.4 7.0 6.3 4.8
65-74 15.3 15.1 11.1 11.4
75+ 21.4 22.8 20.8 15.6
All adults 5.2 5.2 4.6 4.2
Stroke 16-24 0.2 0.1 0.1 0.2
25-34 0.3 0.1 0.2 0.3
35-44 0.4 0.4 0.3 0.3
45-54 1.1 1.0 1.4 2.2
55-64 2.3 2.6 3.2 2.8
65-74 6.4 5.6 5.7 5.1
75+ 10.6 11.6 10.6 8.8
All adults 2.3 2.3 2.4 2.4
CHD or Stroke 16-24 0.3 0.2 0.1 0.5
25-34 0.3 0.2 0.5 0.6
35-44 1.1 0.8 1.0 0.6
45-54 3.4 3.3 3.6 4.5
55-64 10.1 8.7 8.5 7.0
65-74 19.5 18.6 15.7 14.8
75+ 28.4 31.3 27.6 22.3
All adults 6.8 6.8 6.3 6.0
Any CVD 16-34 4.9 4.5 4.6 4.8
35-44 7.3 6.7 6.1 6.4
45-54 10.5 10.6 10.6 10.8
55-64 17.5 16.9 18.0 16.0
65-74 28.1 27.7 29.0 27.2
75+ 39.6 40.7 41.7 37.1
All adults 13.3 13.3 13.7 13.5
Notes: For all adults aged 16 years and over.CHD: Coronary heart disease, reported as doctor-diagnosed heart attack or angina.CVD: Cardiovascular disease, i.e. doctor-diagnosed heart attack, angina, heart murmur, abnormal heart rhythm or stroke.Data have been weighted for non-response.Data for 'Any CVD' for the years 2003, 2006, and 2011 is calculated as the unweighted average of male/female data.Copyright © 2018 NHS Digital. NHS Digital is the trading name of The Health and Social Care Information Centre
Source: Health Survey for England 2017, NHS Digital (2018) (accessed December 2018).
https://digital.nhs.uk/data-and-information/publications/statistical/health-survey-for-england/2017
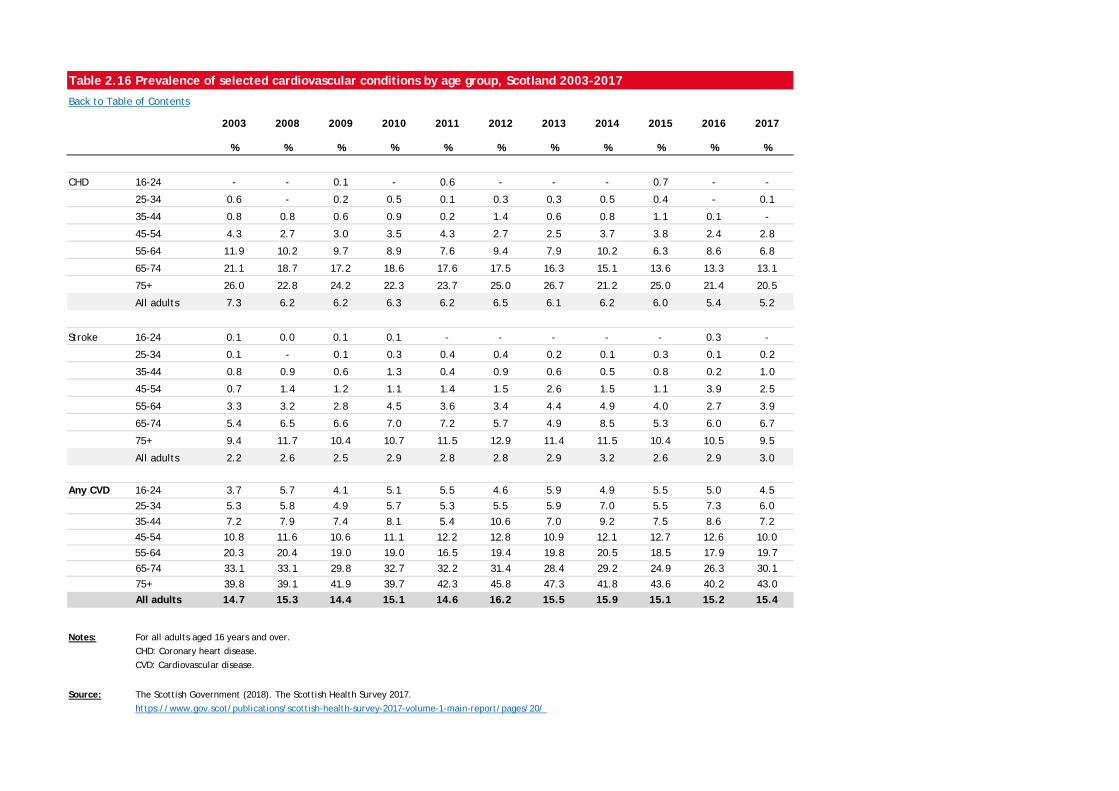
Table 2.16 Prevalence of selected cardiovascular conditions by age group, Scotland 2003-2017
Back to Table of Contents
2003 2008 2009 2010 2011 2012 2013 2014 2015 2016 2017
% % % % % % % % % % %
CHD 16-24 - - 0.1 - 0.6 - - - 0.7 - -
25-34 0.6 - 0.2 0.5 0.1 0.3 0.3 0.5 0.4 - 0.1
35-44 0.8 0.8 0.6 0.9 0.2 1.4 0.6 0.8 1.1 0.1 -
45-54 4.3 2.7 3.0 3.5 4.3 2.7 2.5 3.7 3.8 2.4 2.8
55-64 11.9 10.2 9.7 8.9 7.6 9.4 7.9 10.2 6.3 8.6 6.8
65-74 21.1 18.7 17.2 18.6 17.6 17.5 16.3 15.1 13.6 13.3 13.1
75+ 26.0 22.8 24.2 22.3 23.7 25.0 26.7 21.2 25.0 21.4 20.5
All adults 7.3 6.2 6.2 6.3 6.2 6.5 6.1 6.2 6.0 5.4 5.2
Stroke 16-24 0.1 0.0 0.1 0.1 - - - - - 0.3 -
25-34 0.1 - 0.1 0.3 0.4 0.4 0.2 0.1 0.3 0.1 0.2
35-44 0.8 0.9 0.6 1.3 0.4 0.9 0.6 0.5 0.8 0.2 1.0
45-54 0.7 1.4 1.2 1.1 1.4 1.5 2.6 1.5 1.1 3.9 2.5
55-64 3.3 3.2 2.8 4.5 3.6 3.4 4.4 4.9 4.0 2.7 3.9
65-74 5.4 6.5 6.6 7.0 7.2 5.7 4.9 8.5 5.3 6.0 6.7
75+ 9.4 11.7 10.4 10.7 11.5 12.9 11.4 11.5 10.4 10.5 9.5
All adults 2.2 2.6 2.5 2.9 2.8 2.8 2.9 3.2 2.6 2.9 3.0
Any CVD 16-24 3.7 5.7 4.1 5.1 5.5 4.6 5.9 4.9 5.5 5.0 4.5
25-34 5.3 5.8 4.9 5.7 5.3 5.5 5.9 7.0 5.5 7.3 6.0
35-44 7.2 7.9 7.4 8.1 5.4 10.6 7.0 9.2 7.5 8.6 7.2
45-54 10.8 11.6 10.6 11.1 12.2 12.8 10.9 12.1 12.7 12.6 10.0
55-64 20.3 20.4 19.0 19.0 16.5 19.4 19.8 20.5 18.5 17.9 19.7
65-74 33.1 33.1 29.8 32.7 32.2 31.4 28.4 29.2 24.9 26.3 30.1
75+ 39.8 39.1 41.9 39.7 42.3 45.8 47.3 41.8 43.6 40.2 43.0
All adults 14.7 15.3 14.4 15.1 14.6 16.2 15.5 15.9 15.1 15.2 15.4
Notes: For all adults aged 16 years and over.CHD: Coronary heart disease.CVD: Cardiovascular disease.
Source: The Scottish Government (2018). The Scottish Health Survey 2017.https://www.gov.scot/publications/scottish-health-survey-2017-volume-1-main-report/pages/20/
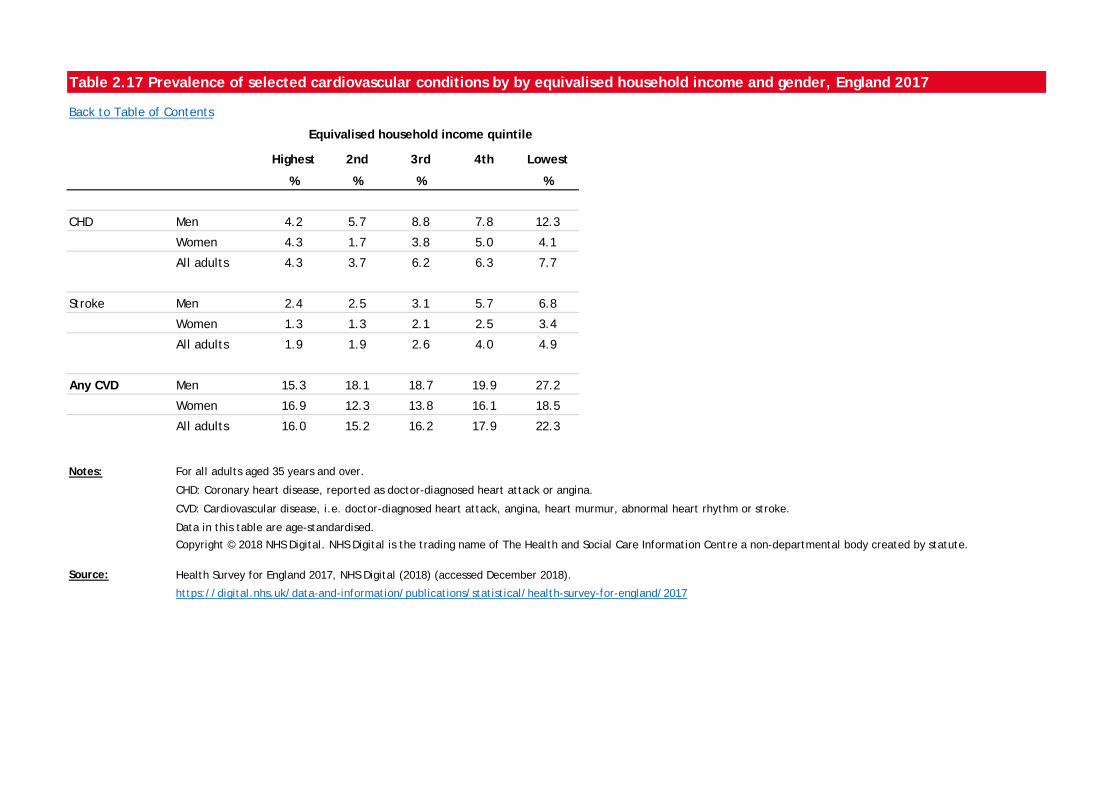
Table 2.17 Prevalence of selected cardiovascular conditions by by equivalised household income and gender, England 2017
Back to Table of Contents
Highest 2nd 3rd 4th Lowest
% % % %
CHD Men 4.2 5.7 8.8 7.8 12.3
Women 4.3 1.7 3.8 5.0 4.1
All adults 4.3 3.7 6.2 6.3 7.7
Stroke Men 2.4 2.5 3.1 5.7 6.8
Women 1.3 1.3 2.1 2.5 3.4
All adults 1.9 1.9 2.6 4.0 4.9
Any CVD Men 15.3 18.1 18.7 19.9 27.2
Women 16.9 12.3 13.8 16.1 18.5
All adults 16.0 15.2 16.2 17.9 22.3
Notes: For all adults aged 35 years and over.
CHD: Coronary heart disease, reported as doctor-diagnosed heart attack or angina.
CVD: Cardiovascular disease, i.e. doctor-diagnosed heart attack, angina, heart murmur, abnormal heart rhythm or stroke.
Data in this table are age-standardised.
Copyright © 2018 NHS Digital. NHS Digital is the trading name of The Health and Social Care Information Centre a non-departmental body created by statute.
Source: Health Survey for England 2017, NHS Digital (2018) (accessed December 2018).
https://digital.nhs.uk/data-and-information/publications/statistical/health-survey-for-england/2017
Equivalised household income quintile
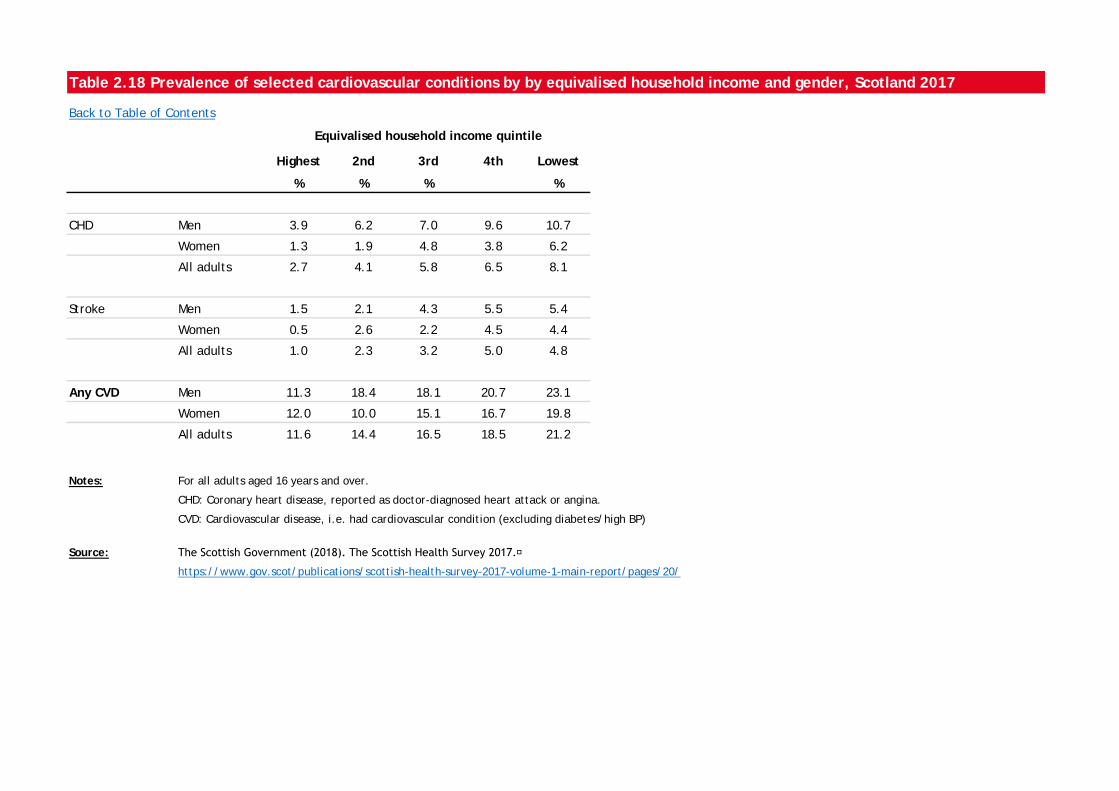
Table 2.18 Prevalence of selected cardiovascular conditions by by equivalised household income and gender, Scotland 2017
Back to Table of Contents
Highest 2nd 3rd 4th Lowest
% % % %
CHD Men 3.9 6.2 7.0 9.6 10.7
Women 1.3 1.9 4.8 3.8 6.2
All adults 2.7 4.1 5.8 6.5 8.1
Stroke Men 1.5 2.1 4.3 5.5 5.4
Women 0.5 2.6 2.2 4.5 4.4
All adults 1.0 2.3 3.2 5.0 4.8
Any CVD Men 11.3 18.4 18.1 20.7 23.1
Women 12.0 10.0 15.1 16.7 19.8
All adults 11.6 14.4 16.5 18.5 21.2
Notes: For all adults aged 16 years and over.
CHD: Coronary heart disease, reported as doctor-diagnosed heart attack or angina.
CVD: Cardiovascular disease, i.e. had cardiovascular condition (excluding diabetes/high BP)
Source: The Scottish Government (2018). The Scottish Health Survey 2017.
https://www.gov.scot/publications/scottish-health-survey-2017-volume-1-main-report/pages/20/
Equivalised household income quintile
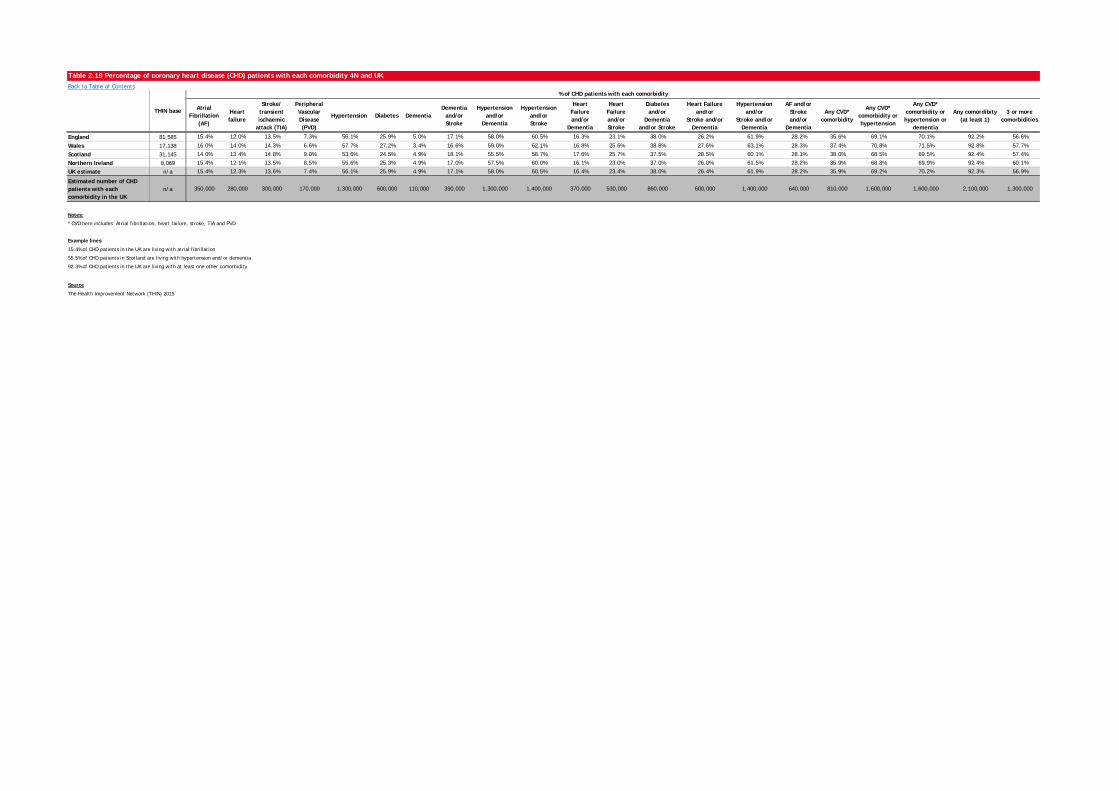
Table 2.19 Percentage of coronary heart disease (CHD) patients with each comorbidity 4N and UKBack to Table of Contents
Atrial Fibrillation
(AF)
Heart failure
Stroke/ transient ischaemic
attack (TIA)
Peripheral Vascular Disease (PVD)
Hypertension Diabetes DementiaDementia
and/or Stroke
Hypertension and/or
Dementia
Hypertension and/or Stroke
Heart Failure and/or
Dementia
Heart Failure and/or Stroke
Diabetes and/or
Dementia and/or Stroke
Heart Failure and/or
Stroke and/or Dementia
Hypertension and/or
Stroke and/or Dementia
AF and/or Stroke and/or
Dementia
Any CVD* comorbidity
Any CVD* comorbidity or hypertension
Any CVD* comorbidity or hypertension or
dementia
Any comordibity (at least 1)
3 or more comorbidities
England 81,585 15.4% 12.0% 13.5% 7.3% 56.1% 25.9% 5.0% 17.1% 58.0% 60.5% 16.3% 23.1% 38.0% 26.2% 61.9% 28.2% 35.6% 69.1% 70.1% 92.2% 56.6%
Wales 17,138 16.0% 14.0% 14.3% 6.6% 57.7% 27.2% 3.4% 16.6% 59.0% 62.1% 16.8% 25.6% 38.8% 27.6% 63.1% 28.3% 37.4% 70.8% 71.5% 92.8% 57.7%
Scotland 31,145 14.0% 13.4% 14.8% 9.0% 53.6% 24.5% 4.9% 18.1% 55.5% 58.7% 17.6% 25.7% 37.5% 28.5% 60.1% 28.1% 38.0% 68.5% 69.5% 92.4% 57.4%
Northern Ireland 8,069 15.4% 12.1% 13.5% 8.5% 55.6% 25.3% 4.9% 17.0% 57.5% 60.0% 16.1% 23.0% 37.0% 26.0% 61.5% 28.2% 35.9% 68.8% 69.9% 92.4% 60.1%
UK estimate n/a 15.4% 12.3% 13.6% 7.4% 56.1% 25.9% 4.9% 17.1% 58.0% 60.5% 16.4% 23.4% 38.0% 26.4% 61.9% 28.2% 35.9% 69.2% 70.2% 92.3% 56.9%
Estimated number of CHD patients with each comorbidity in the UK
n/a 350,000 280,000 300,000 170,000 1,300,000 600,000 110,000 390,000 1,300,000 1,400,000 370,000 530,000 860,000 600,000 1,400,000 640,000 810,000 1,600,000 1,600,000 2,100,000 1,300,000
Notes:
* CVD here includes: Atrial fibrillation, heart failure, stroke, TIA and PVD
Example lines:
15.4% of CHD patients in the UK are living with atrial fibrillation
55.5% of CHD patients in Scotland are living with hypertension and/or dementia
92.3% of CHD patients in the UK are living with at least one other comorbidity
Source
The Health Improvement Network (THIN) 2015
THIN base
% of CHD patients with each comorbidity
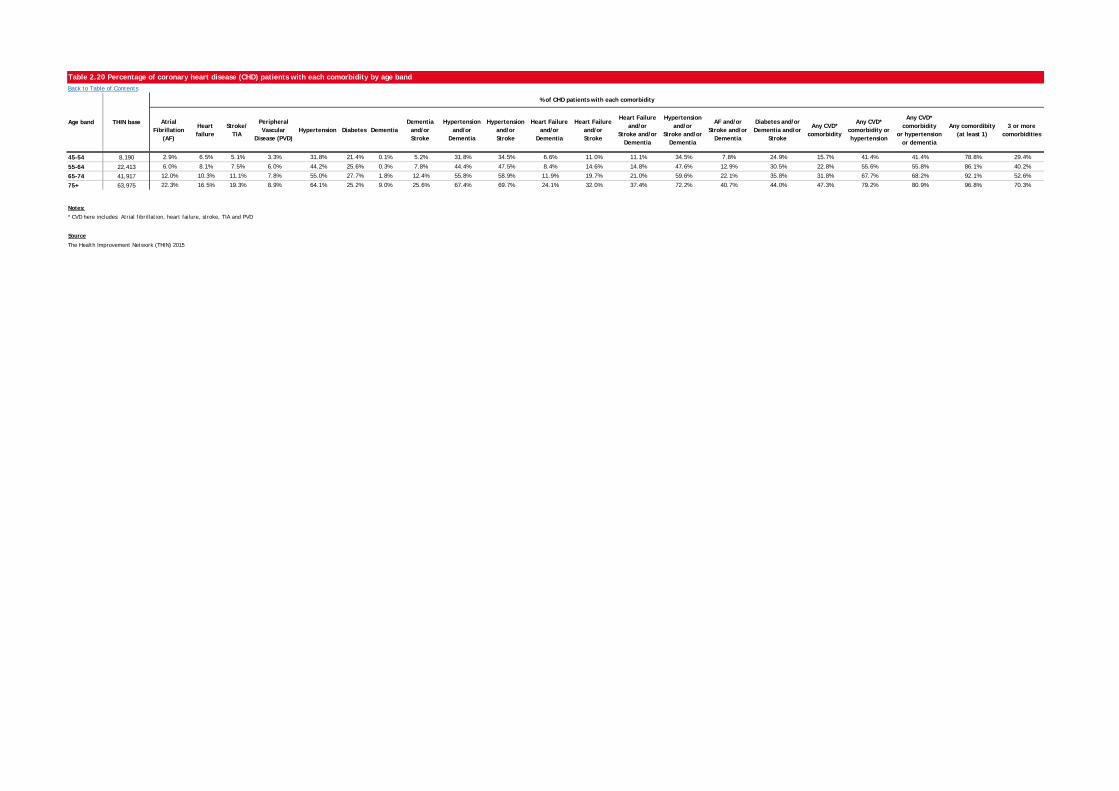
Table 2.20 Percentage of coronary heart disease (CHD) patients with each comorbidity by age bandBack to Table of Contents
Atrial Fibrillation
(AF)
Heart failure
Stroke/ TIA
Peripheral Vascular
Disease (PVD)Hypertension Diabetes Dementia
Dementia and/or Stroke
Hypertension and/or
Dementia
Hypertension and/or Stroke
Heart Failure and/or
Dementia
Heart Failure and/or Stroke
Heart Failure and/or
Stroke and/or Dementia
Hypertension and/or
Stroke and/or Dementia
AF and/or Stroke and/or
Dementia
Diabetes and/or Dementia and/or
Stroke
Any CVD* comorbidity
Any CVD* comorbidity or hypertension
Any CVD* comorbidity
or hypertension or dementia
Any comordibity (at least 1)
3 or more comorbidities
45-54 8,190 2.9% 6.5% 5.1% 3.3% 31.8% 21.4% 0.1% 5.2% 31.8% 34.5% 6.6% 11.0% 11.1% 34.5% 7.8% 24.9% 15.7% 41.4% 41.4% 78.8% 29.4%
55-64 22,413 6.0% 8.1% 7.5% 6.0% 44.2% 25.6% 0.3% 7.8% 44.4% 47.5% 8.4% 14.6% 14.8% 47.6% 12.9% 30.5% 22.8% 55.6% 55.8% 86.1% 40.2%
65-74 41,917 12.0% 10.3% 11.1% 7.8% 55.0% 27.7% 1.8% 12.4% 55.8% 58.9% 11.9% 19.7% 21.0% 59.6% 22.1% 35.8% 31.8% 67.7% 68.2% 92.1% 52.6%
75+ 63,975 22.3% 16.5% 19.3% 8.9% 64.1% 25.2% 9.0% 25.6% 67.4% 69.7% 24.1% 32.0% 37.4% 72.2% 40.7% 44.0% 47.3% 79.2% 80.9% 96.8% 70.3%
Notes:
* CVD here includes: Atrial fibrillation, heart failure, stroke, TIA and PVD
Source
The Health Improvement Network (THIN) 2015
Age band THIN base
% of CHD patients with each comorbidity
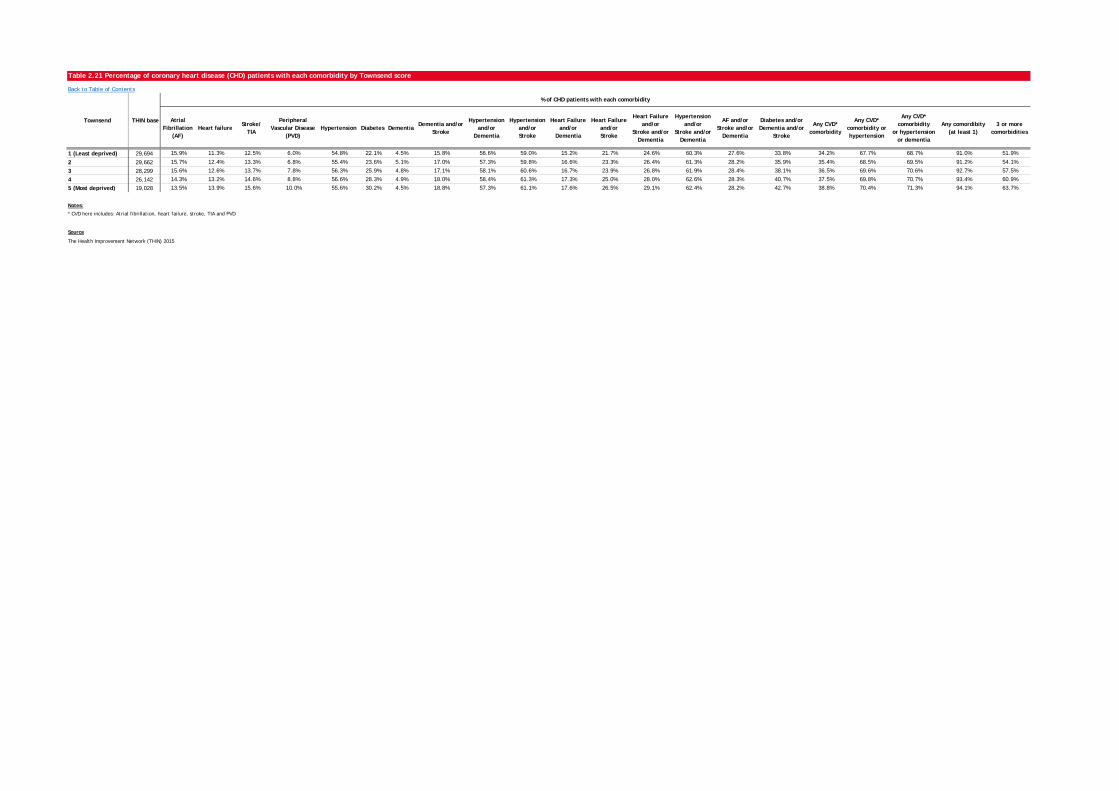
Table 2.21 Percentage of coronary heart disease (CHD) patients with each comorbidity by Townsend score
Back to Table of Contents
Atrial Fibrillation
(AF)Heart failure
Stroke/ TIA
Peripheral Vascular Disease
(PVD)Hypertension Diabetes Dementia
Dementia and/or Stroke
Hypertension and/or
Dementia
Hypertension and/or Stroke
Heart Failure and/or
Dementia
Heart Failure and/or Stroke
Heart Failure and/or
Stroke and/or Dementia
Hypertension and/or
Stroke and/or Dementia
AF and/or Stroke and/or
Dementia
Diabetes and/or Dementia and/or
Stroke
Any CVD* comorbidity
Any CVD* comorbidity or hypertension
Any CVD* comorbidity
or hypertension or dementia
Any comordibity (at least 1)
3 or more comorbidities
1 (Least deprived) 29,694 15.9% 11.3% 12.5% 6.0% 54.8% 22.1% 4.5% 15.8% 56.6% 59.0% 15.2% 21.7% 24.6% 60.3% 27.6% 33.8% 34.2% 67.7% 68.7% 91.0% 51.9%
2 29,662 15.7% 12.4% 13.3% 6.8% 55.4% 23.6% 5.1% 17.0% 57.3% 59.8% 16.6% 23.3% 26.4% 61.3% 28.2% 35.9% 35.4% 68.5% 69.5% 91.2% 54.1%
3 28,299 15.6% 12.6% 13.7% 7.8% 56.3% 25.9% 4.8% 17.1% 58.1% 60.6% 16.7% 23.9% 26.8% 61.9% 28.4% 38.1% 36.5% 69.6% 70.6% 92.7% 57.5%
4 26,142 14.3% 13.2% 14.6% 8.8% 56.6% 28.3% 4.9% 18.0% 58.4% 61.3% 17.3% 25.0% 28.0% 62.6% 28.3% 40.7% 37.5% 69.8% 70.7% 93.4% 60.9%
5 (Most deprived) 19,028 13.5% 13.9% 15.6% 10.0% 55.6% 30.2% 4.5% 18.8% 57.3% 61.1% 17.6% 26.5% 29.1% 62.4% 28.2% 42.7% 38.8% 70.4% 71.3% 94.1% 63.7%
Notes:
* CVD here includes: Atrial fibrillation, heart failure, stroke, TIA and PVD
Source
The Health Improvement Network (THIN) 2015
Townsend THIN base
% of CHD patients with each comorbidity
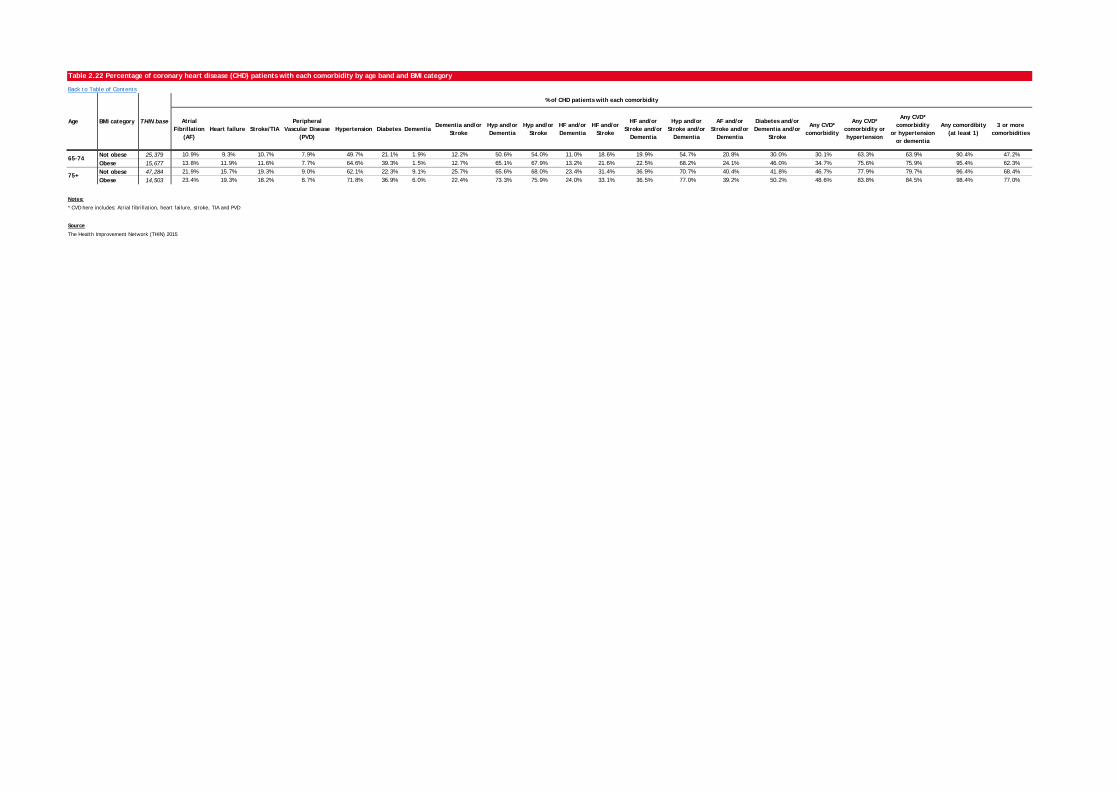
Table 2.22 Percentage of coronary heart disease (CHD) patients with each comorbidity by age band and BMI category
Back to Table of Contents
Atrial Fibrillation
(AF)Heart failure Stroke/TIA
Peripheral Vascular Disease
(PVD)Hypertension Diabetes Dementia
Dementia and/or Stroke
Hyp and/or Dementia
Hyp and/or Stroke
HF and/or Dementia
HF and/or Stroke
HF and/or Stroke and/or
Dementia
Hyp and/or Stroke and/or
Dementia
AF and/or Stroke and/or
Dementia
Diabetes and/or Dementia and/or
Stroke
Any CVD* comorbidity
Any CVD* comorbidity or hypertension
Any CVD* comorbidity
or hypertension or dementia
Any comordibity (at least 1)
3 or more comorbidities
Not obese 25,379 10.9% 9.3% 10.7% 7.9% 49.7% 21.1% 1.9% 12.2% 50.6% 54.0% 11.0% 18.6% 19.9% 54.7% 20.8% 30.0% 30.1% 63.3% 63.9% 90.4% 47.2%
Obese 15,677 13.8% 11.9% 11.6% 7.7% 64.6% 39.3% 1.5% 12.7% 65.1% 67.9% 13.2% 21.6% 22.5% 68.2% 24.1% 46.0% 34.7% 75.6% 75.9% 95.4% 62.3%Not obese 47,284 21.9% 15.7% 19.3% 9.0% 62.1% 22.3% 9.1% 25.7% 65.6% 68.0% 23.4% 31.4% 36.9% 70.7% 40.4% 41.8% 46.7% 77.9% 79.7% 96.4% 68.4%Obese 14,503 23.4% 19.3% 18.2% 8.7% 71.8% 36.9% 6.0% 22.4% 73.3% 75.9% 24.0% 33.1% 36.5% 77.0% 39.2% 50.2% 48.6% 83.8% 84.5% 98.4% 77.0%
Notes:
* CVD here includes: Atrial fibrillation, heart failure, stroke, TIA and PVD
Source
The Health Improvement Network (THIN) 2015
75+
Age BMI category THIN base
% of CHD patients with each comorbidity
65-74

Table 2.23 Percentage of stroke (CBVD) patients with each comorbidity for each Nation and the UKBack to Table of Contents
Atrial Fibrillation
(AF)Heart failure
Coronary Heart Disease
(CHD)
Peripheral Vascular
Disease (PVD)Hypertension Diabetes Dementia
Dementia and/or CHD
Hypertension and/or
Dementia
Hypertension and/or CHD
Heart Failure and/or
Dementia
Heart Failure and/or CHD
Heart Failure and/or
CHD and/or Dementia
Hypertension and/or
CHD and/or Dementia
AF and/or CHD and/orDementia
Diabetes and/or Dementia and/or
CHD
Any CVD* comorbidity
Any CVD* comorbidity or Hypertension
Any CVD* comorbidity
or Hypertension or dementia
Any comordibity (at least 1)
3 or more comorbidities
England 56,149 17.9% 6.9% 21.4% 5.9% 60.2% 20.5% 8.4% 27.6% 63.1% 67.0% 14.7% 24.5% 30.4% 69.3% 38.7% 40.4% 37.6% 72.2% 76.7% 93.3% 60.3%
Wales 15,505 17.6% 7.6% 22.6% 6.0% 61.9% 21.8% 5.9% 26.9% 63.7% 68.8% 12.8% 25.9% 29.9% 70.2% 37.4% 40.6% 38.2% 73.7% 77.4% 93.6% 60.2%
Scotland 24,035 15.6% 6.9% 24.0% 7.4% 58.2% 19.7% 8.6% 30.0% 61.5% 66.6% 14.8% 26.6% 32.3% 69.0% 38.9% 41.5% 38.6% 71.4% 75.8% 93.5% 60.1%
Northern Ireland 5,586 17.2% 8.5% 24.7% 7.8% 59.4% 20.1% 8.4% 30.8% 62.4% 67.4% 16.1% 28.2% 34.0% 69.6% 40.4% 41.8% 40.3% 72.2% 76.0% 93.8% 62.8%
UK estimate n/a 17.7% 7.0% 21.8% 6.1% 60.1% 20.4% 8.3% 27.9% 63.0% 67.0% 14.6% 24.9% 30.7% 69.3% 38.7% 40.5% 37.8% 72.2% 76.6% 93.4% 60.3%
Estimated number of stroke survivors with each comorbidity in the UK
n/a 220,000 90,000 280,000 80,000 760,000 260,000 100,000 350,000 800,000 850,000 190,000 320,000 390,000 880,000 490,000 510,000 480,000 920,000 970,000 1,200,000 770,000
Notes* CVD here includes: Atrial fibrillation, heart failure, CHD and PVD
Example lines:
17.7% of stroke patients in the UK are living with atrial fibrillation
30% of stroke patients in Scotland are living with dementia and/or CHD
93.4% of stroke patients in the UK are living with at least one other comorbidity
Source
The Health Improvement Network (THIN) 2015
THIN base
% of stroke patients with each comorbidity
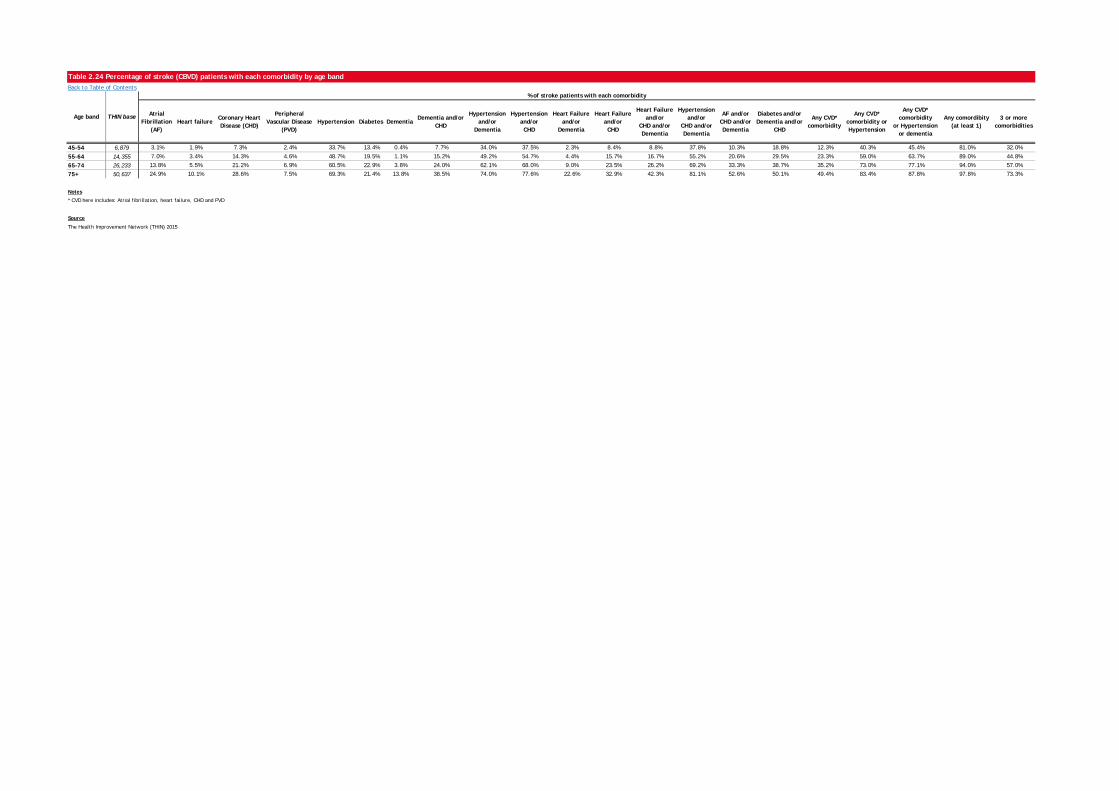
Table 2.24 Percentage of stroke (CBVD) patients with each comorbidity by age bandBack to Table of Contents
Atrial Fibrillation
(AF)Heart failure
Coronary Heart Disease (CHD)
Peripheral Vascular Disease
(PVD)Hypertension Diabetes Dementia
Dementia and/or CHD
Hypertension and/or
Dementia
Hypertension and/or CHD
Heart Failure and/or
Dementia
Heart Failure and/or CHD
Heart Failure and/or
CHD and/or Dementia
Hypertension and/or
CHD and/or Dementia
AF and/or CHD and/orDementia
Diabetes and/or Dementia and/or
CHD
Any CVD* comorbidity
Any CVD* comorbidity or Hypertension
Any CVD* comorbidity
or Hypertension or dementia
Any comordibity (at least 1)
3 or more comorbidities
45-54 6,879 3.1% 1.9% 7.3% 2.4% 33.7% 13.4% 0.4% 7.7% 34.0% 37.5% 2.3% 8.4% 8.8% 37.8% 10.3% 18.8% 12.3% 40.3% 45.4% 81.0% 32.0%
55-64 14,355 7.0% 3.4% 14.3% 4.6% 48.7% 19.5% 1.1% 15.2% 49.2% 54.7% 4.4% 15.7% 16.7% 55.2% 20.6% 29.5% 23.3% 59.0% 63.7% 89.0% 44.8%
65-74 26,233 13.8% 5.5% 21.2% 6.9% 60.5% 22.9% 3.8% 24.0% 62.1% 68.0% 9.0% 23.5% 26.2% 69.2% 33.3% 38.7% 35.2% 73.0% 77.1% 94.0% 57.0%
75+ 50,637 24.9% 10.1% 28.6% 7.5% 69.3% 21.4% 13.8% 38.5% 74.0% 77.6% 22.6% 32.9% 42.3% 81.1% 52.6% 50.1% 49.4% 83.4% 87.8% 97.8% 73.3%
Notes
* CVD here includes: Atrial fibrillation, heart failure, CHD and PVD
Source
The Health Improvement Network (THIN) 2015
Age band THIN base
% of stroke patients with each comorbidity
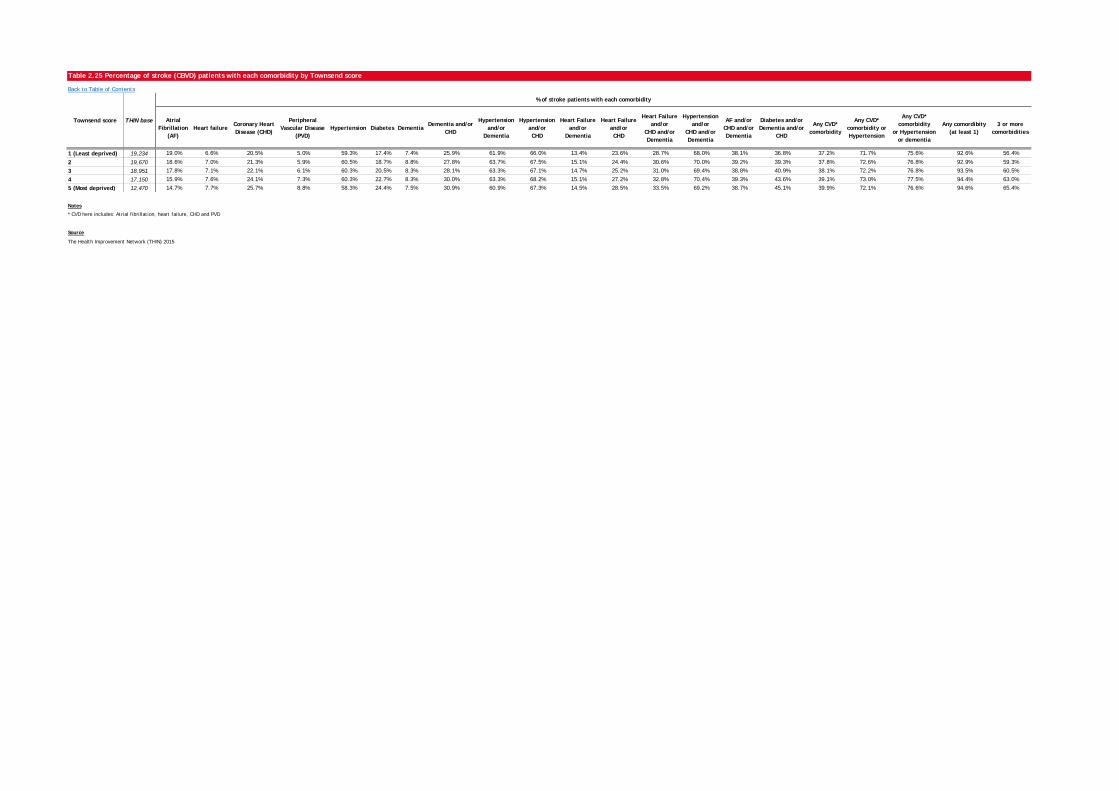
Table 2.25 Percentage of stroke (CBVD) patients with each comorbidity by Townsend score
Back to Table of Contents
Atrial Fibrillation
(AF)Heart failure
Coronary Heart Disease (CHD)
Peripheral Vascular Disease
(PVD)Hypertension Diabetes Dementia
Dementia and/or CHD
Hypertension and/or
Dementia
Hypertension and/or CHD
Heart Failure and/or
Dementia
Heart Failure and/or CHD
Heart Failure and/or
CHD and/or Dementia
Hypertension and/or
CHD and/or Dementia
AF and/or CHD and/orDementia
Diabetes and/or Dementia and/or
CHD
Any CVD* comorbidity
Any CVD* comorbidity or Hypertension
Any CVD* comorbidity
or Hypertension or dementia
Any comordibity (at least 1)
3 or more comorbidities
1 (Least deprived) 19,234 19.0% 6.6% 20.5% 5.0% 59.3% 17.4% 7.4% 25.9% 61.9% 66.0% 13.4% 23.6% 28.7% 68.0% 38.1% 36.8% 37.2% 71.7% 75.6% 92.6% 56.4%
2 19,670 18.6% 7.0% 21.3% 5.9% 60.5% 18.7% 8.8% 27.8% 63.7% 67.5% 15.1% 24.4% 30.6% 70.0% 39.2% 39.3% 37.8% 72.6% 76.8% 92.9% 59.3%
3 18,951 17.8% 7.1% 22.1% 6.1% 60.3% 20.5% 8.3% 28.1% 63.3% 67.1% 14.7% 25.2% 31.0% 69.4% 38.8% 40.9% 38.1% 72.2% 76.8% 93.5% 60.5%
4 17,150 15.9% 7.6% 24.1% 7.3% 60.3% 22.7% 8.3% 30.0% 63.3% 68.2% 15.1% 27.2% 32.8% 70.4% 39.3% 43.6% 39.1% 73.0% 77.5% 94.4% 63.0%
5 (Most deprived) 12,470 14.7% 7.7% 25.7% 8.8% 58.3% 24.4% 7.5% 30.9% 60.9% 67.3% 14.5% 28.5% 33.5% 69.2% 38.7% 45.1% 39.9% 72.1% 76.6% 94.6% 65.4%
Notes
* CVD here includes: Atrial fibrillation, heart failure, CHD and PVD
Source
The Health Improvement Network (THIN) 2015
Townsend score THIN base
% of stroke patients with each comorbidity
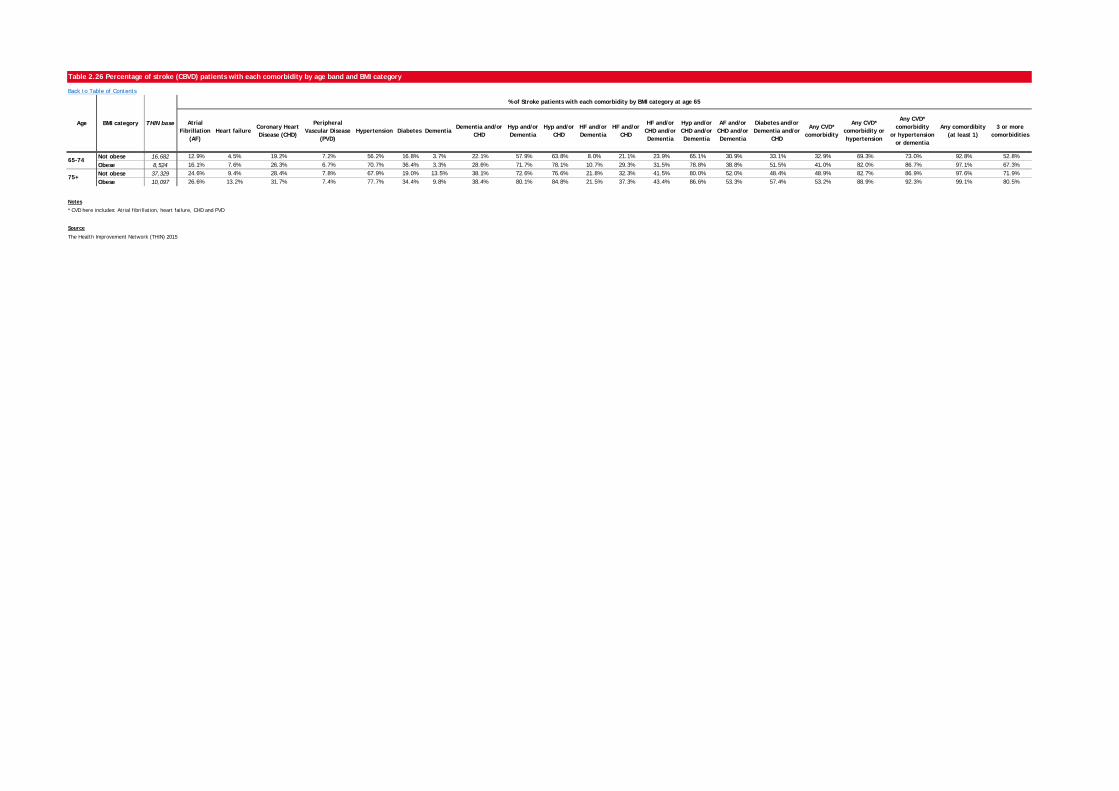
Table 2.26 Percentage of stroke (CBVD) patients with each comorbidity by age band and BMI category
Back to Table of Contents
Atrial Fibrillation
(AF)Heart failure
Coronary Heart Disease (CHD)
Peripheral Vascular Disease
(PVD)Hypertension Diabetes Dementia
Dementia and/or CHD
Hyp and/or Dementia
Hyp and/or CHD
HF and/or Dementia
HF and/or CHD
HF and/or CHD and/or Dementia
Hyp and/or CHD and/or Dementia
AF and/or CHD and/orDementia
Diabetes and/or Dementia and/or
CHD
Any CVD* comorbidity
Any CVD* comorbidity or hypertension
Any CVD* comorbidity
or hypertension or dementia
Any comordibity (at least 1)
3 or more comorbidities
Not obese 16,682 12.9% 4.5% 19.2% 7.2% 56.2% 16.8% 3.7% 22.1% 57.9% 63.8% 8.0% 21.1% 23.9% 65.1% 30.9% 33.1% 32.9% 69.3% 73.0% 92.8% 52.8%
Obese 8,524 16.1% 7.6% 26.3% 6.7% 70.7% 36.4% 3.3% 28.6% 71.7% 78.1% 10.7% 29.3% 31.5% 78.8% 38.8% 51.5% 41.0% 82.0% 86.7% 97.1% 67.3%Not obese 37,329 24.6% 9.4% 28.4% 7.8% 67.9% 19.0% 13.5% 38.1% 72.6% 76.6% 21.8% 32.3% 41.5% 80.0% 52.0% 48.4% 48.9% 82.7% 86.9% 97.6% 71.9%Obese 10,097 26.6% 13.2% 31.7% 7.4% 77.7% 34.4% 9.8% 38.4% 80.1% 84.8% 21.5% 37.3% 43.4% 86.6% 53.3% 57.4% 53.2% 88.9% 92.3% 99.1% 80.5%
Notes
* CVD here includes: Atrial fibrillation, heart failure, CHD and PVD
Source
The Health Improvement Network (THIN) 2015
75+
Age BMI category THIN base
% of Stroke patients with each comorbidity by BMI category at age 65
65-74
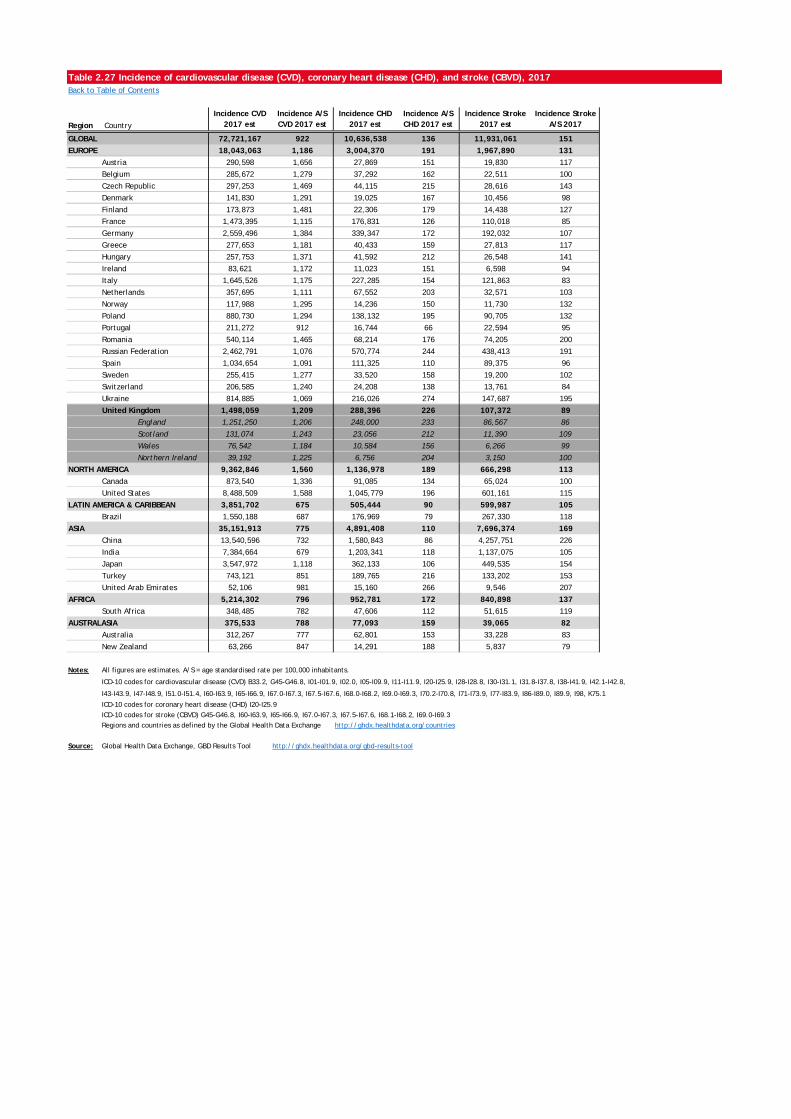
Table 2.27 Incidence of cardiovascular disease (CVD), coronary heart disease (CHD), and stroke (CBVD), 2017Back to Table of Contents
Region Country
Incidence CVD 2017 est
Incidence A/S CVD 2017 est
Incidence CHD 2017 est
Incidence A/S CHD 2017 est
Incidence Stroke 2017 est
Incidence Stroke A/S 2017
GLOBAL 72,721,167 922 10,636,538 136 11,931,061 151EUROPE 18,043,063 1,186 3,004,370 191 1,967,890 131EUROPE Austria 290,598 1,656 27,869 151 19,830 117
EUROPE Belgium 285,672 1,279 37,292 162 22,511 100
EUROPE Czech Republic 297,253 1,469 44,115 215 28,616 143
EUROPE Denmark 141,830 1,291 19,025 167 10,456 98
EUROPE Finland 173,873 1,481 22,306 179 14,438 127
EUROPE France 1,473,395 1,115 176,831 126 110,018 85
EUROPE Germany 2,559,496 1,384 339,347 172 192,032 107
EUROPE Greece 277,653 1,181 40,433 159 27,813 117
EUROPE Hungary 257,753 1,371 41,592 212 26,548 141
EUROPE Ireland 83,621 1,172 11,023 151 6,598 94
EUROPE Italy 1,645,526 1,175 227,285 154 121,863 83
EUROPE Netherlands 357,695 1,111 67,552 203 32,571 103
EUROPE Norway 117,988 1,295 14,236 150 11,730 132
EUROPE Poland 880,730 1,294 138,132 195 90,705 132
EUROPE Portugal 211,272 912 16,744 66 22,594 95
EUROPE Romania 540,114 1,465 68,214 176 74,205 200
EUROPE Russian Federation 2,462,791 1,076 570,774 244 438,413 191
EUROPE Spain 1,034,654 1,091 111,325 110 89,375 96
EUROPE Sweden 255,415 1,277 33,520 158 19,200 102
EUROPE Switzerland 206,585 1,240 24,208 138 13,761 84
EUROPE Ukraine 814,885 1,069 216,026 274 147,687 195
EUROPE United Kingdom 1,498,059 1,209 288,396 226 107,372 89EUROPE United KinEngland 1,251,250 1,206 248,000 233 86,567 86
EUROPE United KinScotland 131,074 1,243 23,056 212 11,390 109
EUROPE United KinWales 76,542 1,184 10,584 156 6,266 99
EUROPE United KinNorthern Ireland 39,192 1,225 6,756 204 3,150 100
NORTH AMERICA 9,362,846 1,560 1,136,978 189 666,298 113NORTH ACanada 873,540 1,336 91,085 134 65,024 100
NORTH AUnited States 8,488,509 1,588 1,045,779 196 601,161 115
LATIN AMERICA & CARIBBEAN 3,851,702 675 505,444 90 599,987 105LATIN AM Brazil 1,550,188 687 176,969 79 267,330 118
ASIA 35,151,913 775 4,891,408 110 7,696,374 169ASIA China 13,540,596 732 1,580,843 86 4,257,751 226
ASIA India 7,384,664 679 1,203,341 118 1,137,075 105
ASIA Japan 3,547,972 1,118 362,133 106 449,535 154
ASIA Turkey 743,121 851 189,765 216 133,202 153
ASIA United Arab Emirates 52,106 981 15,160 266 9,546 207
AFRICA 5,214,302 796 952,781 172 840,898 137AFRICA South Africa 348,485 782 47,606 112 51,615 119
AUSTRALASIA 375,533 788 77,093 159 39,065 82USTRALASAustralia 312,267 777 62,801 153 33,228 83
USTRALASNew Zealand 63,266 847 14,291 188 5,837 79
Notes: All figures are estimates. A/S = age standardised rate per 100,000 inhabitants.
ICD-10 codes for cardiovascular disease (CVD) B33.2, G45-G46.8, I01-I01.9, I02.0, I05-I09.9, I11-I11.9, I20-I25.9, I28-I28.8, I30-I31.1, I31.8-I37.8, I38-I41.9, I42.1-I42.8,
I43-I43.9, I47-I48.9, I51.0-I51.4, I60-I63.9, I65-I66.9, I67.0-I67.3, I67.5-I67.6, I68.0-I68.2, I69.0-I69.3, I70.2-I70.8, I71-I73.9, I77-I83.9, I86-I89.0, I89.9, I98, K75.1
ICD-10 codes for coronary heart disease (CHD) I20-I25.9ICD-10 codes for stroke (CBVD) G45-G46.8, I60-I63.9, I65-I66.9, I67.0-I67.3, I67.5-I67.6, I68.1-I68.2, I69.0-I69.3Regions and countries as defined by the Global Health Data Exchange http://ghdx.healthdata.org/countries
Source: Global Health Data Exchange, GBD Results Tool http://ghdx.healthdata.org/gbd-results-tool
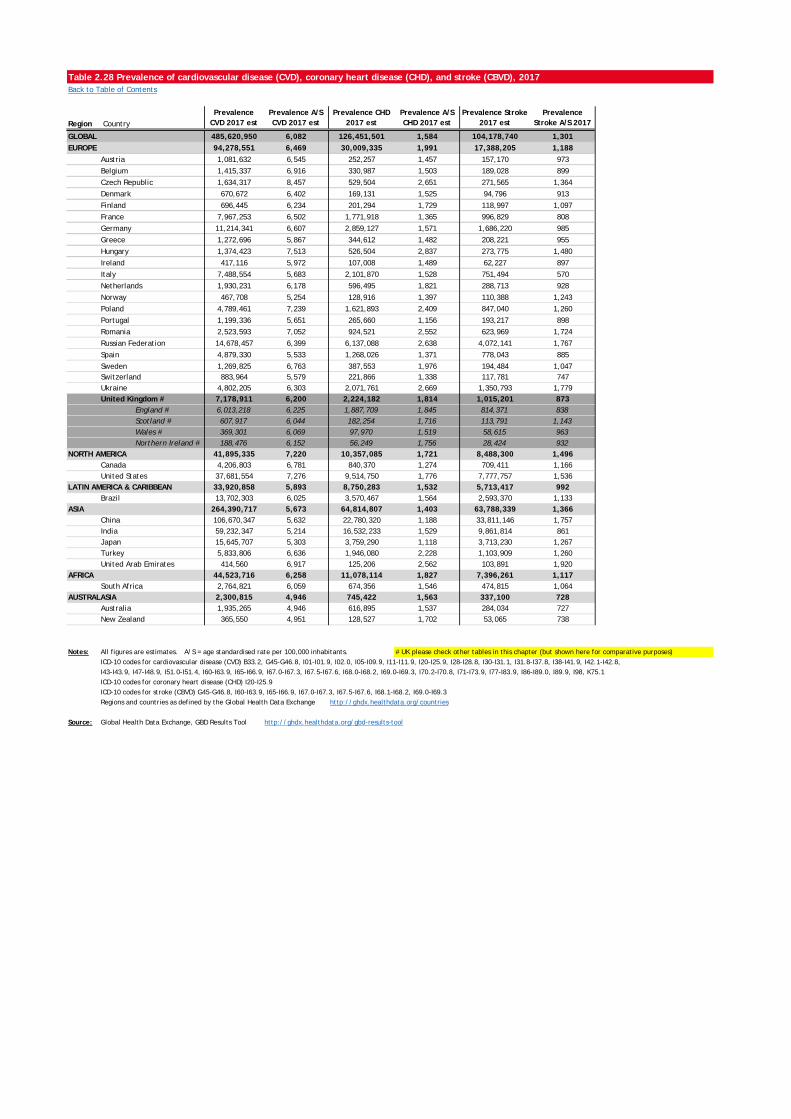
Table 2.28 Prevalence of cardiovascular disease (CVD), coronary heart disease (CHD), and stroke (CBVD), 2017Back to Table of Contents
Region CountryPrevalence
CVD 2017 estPrevalence A/S CVD 2017 est
Prevalence CHD 2017 est
Prevalence A/S CHD 2017 est
Prevalence Stroke 2017 est
Prevalence Stroke A/S 2017
GLOBAL 485,620,950 6,082 126,451,501 1,584 104,178,740 1,301EUROPE 94,278,551 6,469 30,009,335 1,991 17,388,205 1,188EUROPE Austria 1,081,632 6,545 252,257 1,457 157,170 973EUROPE Belgium 1,415,337 6,916 330,987 1,503 189,028 899EUROPE Czech Republic 1,634,317 8,457 529,504 2,651 271,565 1,364EUROPE Denmark 670,672 6,402 169,131 1,525 94,796 913EUROPE Finland 696,445 6,234 201,294 1,729 118,997 1,097EUROPE France 7,967,253 6,502 1,771,918 1,365 996,829 808EUROPE Germany 11,214,341 6,607 2,859,127 1,571 1,686,220 985EUROPE Greece 1,272,696 5,867 344,612 1,482 208,221 955EUROPE Hungary 1,374,423 7,513 526,504 2,837 273,775 1,480EUROPE Ireland 417,116 5,972 107,008 1,489 62,227 897EUROPE Italy 7,488,554 5,683 2,101,870 1,528 751,494 570EUROPE Netherlands 1,930,231 6,178 596,495 1,821 288,713 928EUROPE Norway 467,708 5,254 128,916 1,397 110,388 1,243EUROPE Poland 4,789,461 7,239 1,621,893 2,409 847,040 1,260EUROPE Portugal 1,199,336 5,651 265,660 1,156 193,217 898EUROPE Romania 2,523,593 7,052 924,521 2,552 623,969 1,724EUROPE Russian Federation 14,678,457 6,399 6,137,088 2,638 4,072,141 1,767EUROPE Spain 4,879,330 5,533 1,268,026 1,371 778,043 885EUROPE Sweden 1,269,825 6,763 387,553 1,976 194,484 1,047EUROPE Switzerland 883,964 5,579 221,866 1,338 117,781 747EUROPE Ukraine 4,802,205 6,303 2,071,761 2,669 1,350,793 1,779EUROPE United Kingdom # 7,178,911 6,200 2,224,182 1,814 1,015,201 873EUROPE United Ki England # 6,013,218 6,225 1,887,709 1,845 814,371 838EUROPE United Ki Scotland # 607,917 6,044 182,254 1,716 113,791 1,143EUROPE United Ki Wales # 369,301 6,069 97,970 1,519 58,615 963EUROPE United Ki Northern Ireland # 188,476 6,152 56,249 1,756 28,424 932NORTH AMERICA 41,895,335 7,220 10,357,085 1,721 8,488,300 1,496NORTH ACanada 4,206,803 6,781 840,370 1,274 709,411 1,166NORTH AUnited States 37,681,554 7,276 9,514,750 1,776 7,777,757 1,536LATIN AMERICA & CARIBBEAN 33,920,858 5,893 8,750,283 1,532 5,713,417 992LATIN AM Brazil 13,702,303 6,025 3,570,467 1,564 2,593,370 1,133ASIA 264,390,717 5,673 64,814,807 1,403 63,788,339 1,366ASIA China 106,670,347 5,632 22,780,320 1,188 33,811,146 1,757ASIA India 59,232,347 5,214 16,532,233 1,529 9,861,814 861ASIA Japan 15,645,707 5,303 3,759,290 1,118 3,713,230 1,267ASIA Turkey 5,833,806 6,636 1,946,080 2,228 1,103,909 1,260ASIA United Arab Emirates 414,560 6,917 125,206 2,562 103,891 1,920AFRICA 44,523,716 6,258 11,078,114 1,827 7,396,261 1,117AFRICA South Africa 2,764,821 6,059 674,356 1,546 474,815 1,064
AUSTRALASIA 2,300,815 4,946 745,422 1,563 337,100 728USTRALASAustralia 1,935,265 4,946 616,895 1,537 284,034 727USTRALASNew Zealand 365,550 4,951 128,527 1,702 53,065 738
Notes: All figures are estimates. A/S = age standardised rate per 100,000 inhabitants. # UK please check other tables in this chapter (but shown here for comparative purposes)ICD-10 codes for cardiovascular disease (CVD) B33.2, G45-G46.8, I01-I01.9, I02.0, I05-I09.9, I11-I11.9, I20-I25.9, I28-I28.8, I30-I31.1, I31.8-I37.8, I38-I41.9, I42.1-I42.8,I43-I43.9, I47-I48.9, I51.0-I51.4, I60-I63.9, I65-I66.9, I67.0-I67.3, I67.5-I67.6, I68.0-I68.2, I69.0-I69.3, I70.2-I70.8, I71-I73.9, I77-I83.9, I86-I89.0, I89.9, I98, K75.1ICD-10 codes for coronary heart disease (CHD) I20-I25.9ICD-10 codes for stroke (CBVD) G45-G46.8, I60-I63.9, I65-I66.9, I67.0-I67.3, I67.5-I67.6, I68.1-I68.2, I69.0-I69.3Regions and countries as defined by the Global Health Data Exchange http://ghdx.healthdata.org/countries
Source: Global Health Data Exchange, GBD Results Tool http://ghdx.healthdata.org/gbd-results-tool
Heart and Circulatory Disease Statistics 2019 - Chapter 3 - TreatmentThis chapter reports on different methods of treatment for heart and circulatory diseases, with a focus on treatments for cardiovascular disease (CVD) and coronary heart disease (CHD).Includes tables and figures for trends and latest statistics on the number of prescriptions, operations and cardiac arrest survival in the UK.
PRESCRIPTIONST3.1 Prescriptions used in the prevention and treatment of cardiovascular disease, England - 1981 to 2018T3.2 Prescriptions used in the prevention and treatment of cardiovascular disease, Wales - 2005 to 2017T3.3 Prescriptions used in the prevention and treatment of cardiovascular disease, Scotland - 2001/02 to 2017/18T3.4 Prescriptions used in the prevention and treatment of cardiovascular disease, Northern Ireland - 2000 to 2017T3.5 Prescriptions used in the prevention and treatment of cardiovascular disease, UK - latest year
OPERATIONST3.6 Number of CABGs and PCIs, UK - 1977 to 2015T3.7 Number of valve replacements and repairs, UK - 2003 to 2015T3.8 Number and rate of CABGs, Scotland - 2008/09 to 2017/18
TRANSPLANTST3.9 Cardiothoracic transplant list, UK - 2017/18T3.10 Cardiothoracic transplants and rate per million population, by country, UK - 2010/11 to 2017/18
IMPLANTST3.11 New Pacemaker implants and rate per million population, by country, UK - 2010/11 to 2015/16
OUT-OF-HOSPITAL CARDIAC ARRESTST3.12 Out-of-hospital cardiac arrest survival rates, by Ambulance Service, England - 2011-12 to 2017-18; 2011 to 2018T3.13 Out-of-hospital cardiac arrest survival rates, Scotland - 2011-12 to 2017-18
X0A0T
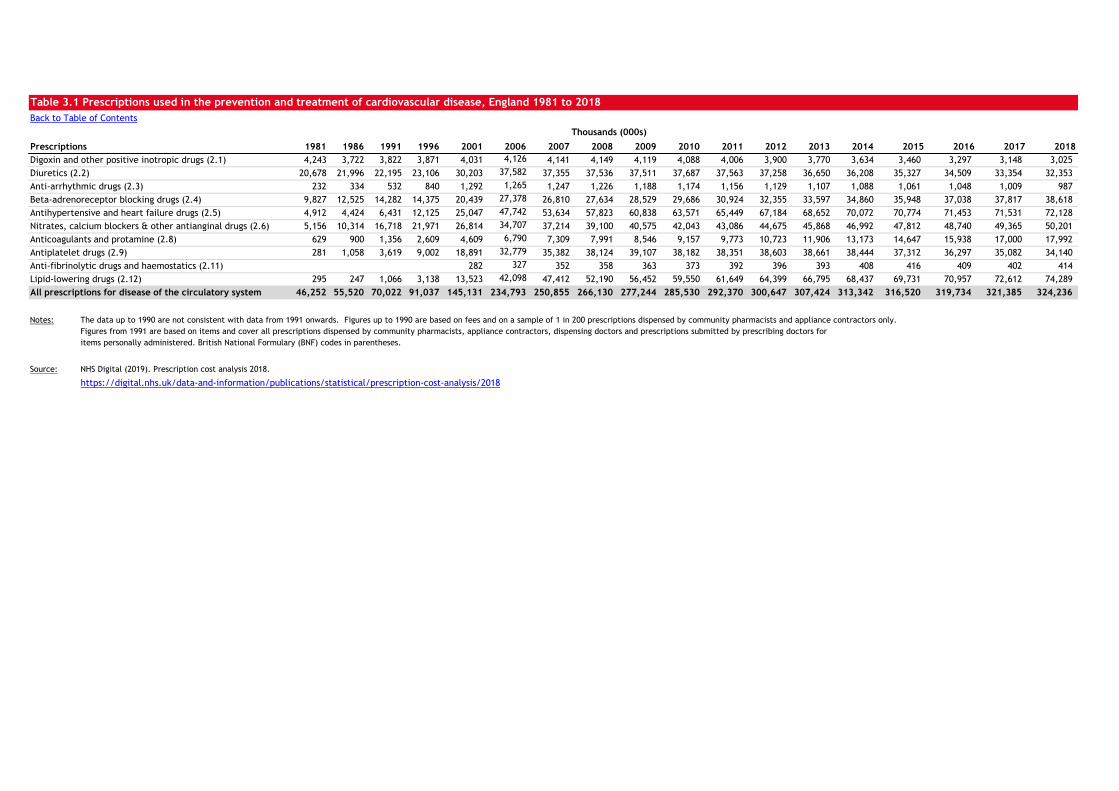
Table 3.1 Prescriptions used in the prevention and treatment of cardiovascular disease, England 1981 to 2018Back to Table of Contents
1981 1986 1991 1996 2001 2006 2007 2008 2009 2010 2011 2012 2013 2014 2015 2016 2017 20184,243 3,722 3,822 3,871 4,031 4,126 4,141 4,149 4,119 4,088 4,006 3,900 3,770 3,634 3,460 3,297 3,148 3,025
20,678 21,996 22,195 23,106 30,203 37,582 37,355 37,536 37,511 37,687 37,563 37,258 36,650 36,208 35,327 34,509 33,354 32,353 232 334 532 840 1,292 1,265 1,247 1,226 1,188 1,174 1,156 1,129 1,107 1,088 1,061 1,048 1,009 987
9,827 12,525 14,282 14,375 20,439 27,378 26,810 27,634 28,529 29,686 30,924 32,355 33,597 34,860 35,948 37,038 37,817 38,618 4,912 4,424 6,431 12,125 25,047 47,742 53,634 57,823 60,838 63,571 65,449 67,184 68,652 70,072 70,774 71,453 71,531 72,128 5,156 10,314 16,718 21,971 26,814 34,707 37,214 39,100 40,575 42,043 43,086 44,675 45,868 46,992 47,812 48,740 49,365 50,201
629 900 1,356 2,609 4,609 6,790 7,309 7,991 8,546 9,157 9,773 10,723 11,906 13,173 14,647 15,938 17,000 17,992 281 1,058 3,619 9,002 18,891 32,779 35,382 38,124 39,107 38,182 38,351 38,603 38,661 38,444 37,312 36,297 35,082 34,140
282 327 352 358 363 373 392 396 393 408 416 409 402 414 295 247 1,066 3,138 13,523 42,098 47,412 52,190 56,452 59,550 61,649 64,399 66,795 68,437 69,731 70,957 72,612 74,289
46,252 55,520 70,022 91,037 145,131 234,793 250,855 266,130 277,244 285,530 292,370 300,647 307,424 313,342 316,520 319,734 321,385 324,236
Notes: The data up to 1990 are not consistent with data from 1991 onwards. Figures up to 1990 are based on fees and on a sample of 1 in 200 prescriptions dispensed by community pharmacists and appliance contractors only.Figures from 1991 are based on items and cover all prescriptions dispensed by community pharmacists, appliance contractors, dispensing doctors and prescriptions submitted by prescribing doctors for items personally administered. British National Formulary (BNF) codes in parentheses.
Source: NHS Digital (2019). Prescription cost analysis 2018.
https://digital.nhs.uk/data-and-information/publications/statistical/prescription-cost-analysis/2018
All prescriptions for disease of the circulatory system
Anticoagulants and protamine (2.8)Antiplatelet drugs (2.9)Anti-fibrinolytic drugs and haemostatics (2.11)Lipid-lowering drugs (2.12)
Thousands (000s)
Beta-adrenoreceptor blocking drugs (2.4)Antihypertensive and heart failure drugs (2.5)Nitrates, calcium blockers & other antianginal drugs (2.6)
Prescriptions Digoxin and other positive inotropic drugs (2.1)Diuretics (2.2)Anti-arrhythmic drugs (2.3)
X1A0T
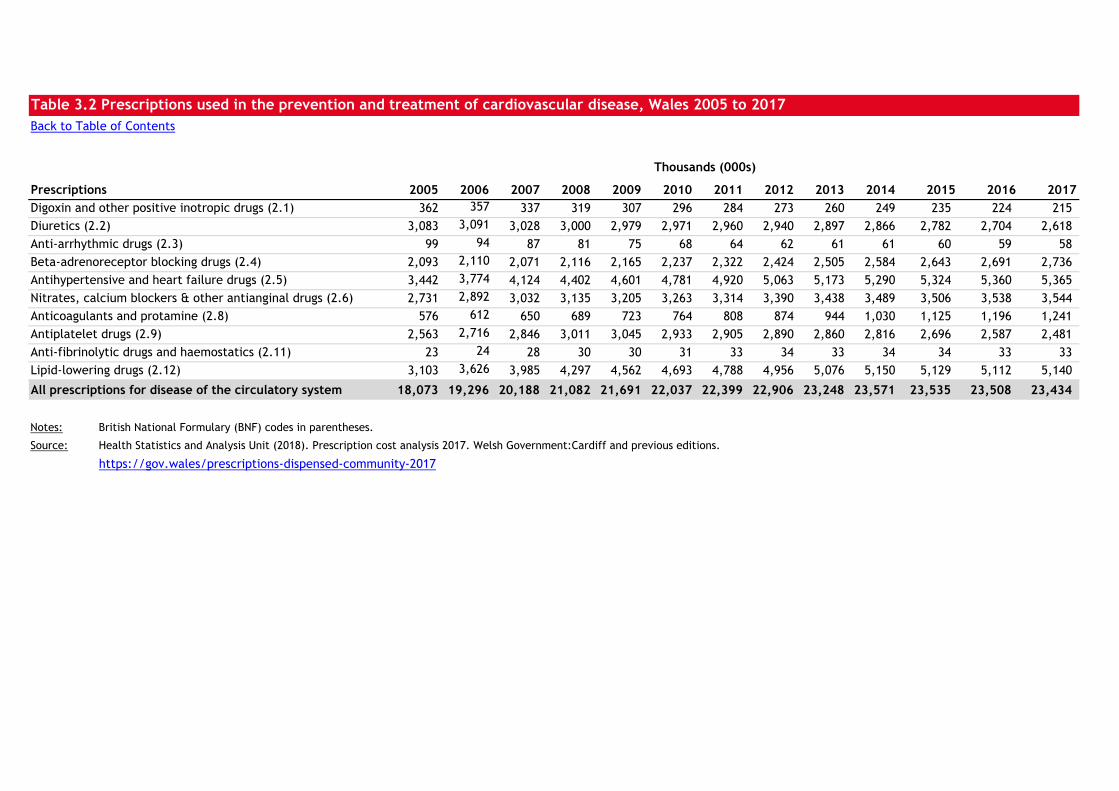
Table 3.2 Prescriptions used in the prevention and treatment of cardiovascular disease, Wales 2005 to 2017Back to Table of Contents
2005 2006 2007 2008 2009 2010 2011 2012 2013 2014 2015 2016 2017362 357 337 319 307 296 284 273 260 249 235 224 215
3,083 3,091 3,028 3,000 2,979 2,971 2,960 2,940 2,897 2,866 2,782 2,704 2,618 99 94 87 81 75 68 64 62 61 61 60 59 58
2,093 2,110 2,071 2,116 2,165 2,237 2,322 2,424 2,505 2,584 2,643 2,691 2,736 3,442 3,774 4,124 4,402 4,601 4,781 4,920 5,063 5,173 5,290 5,324 5,360 5,365 2,731 2,892 3,032 3,135 3,205 3,263 3,314 3,390 3,438 3,489 3,506 3,538 3,544
576 612 650 689 723 764 808 874 944 1,030 1,125 1,196 1,241 2,563 2,716 2,846 3,011 3,045 2,933 2,905 2,890 2,860 2,816 2,696 2,587 2,481
23 24 28 30 30 31 33 34 33 34 34 33 33 3,103 3,626 3,985 4,297 4,562 4,693 4,788 4,956 5,076 5,150 5,129 5,112 5,140
18,073 19,296 20,188 21,082 21,691 22,037 22,399 22,906 23,248 23,571 23,535 23,508 23,434
Notes: British National Formulary (BNF) codes in parentheses.
Source: Health Statistics and Analysis Unit (2018). Prescription cost analysis 2017. Welsh Government:Cardiff and previous editions.
https://gov.wales/prescriptions-dispensed-community-2017
Thousands (000s)
Beta-adrenoreceptor blocking drugs (2.4)
Prescriptions Digoxin and other positive inotropic drugs (2.1)Diuretics (2.2)Anti-arrhythmic drugs (2.3)
All prescriptions for disease of the circulatory system
Antihypertensive and heart failure drugs (2.5)Nitrates, calcium blockers & other antianginal drugs (2.6)Anticoagulants and protamine (2.8)Antiplatelet drugs (2.9)Anti-fibrinolytic drugs and haemostatics (2.11)Lipid-lowering drugs (2.12)
X2A0T
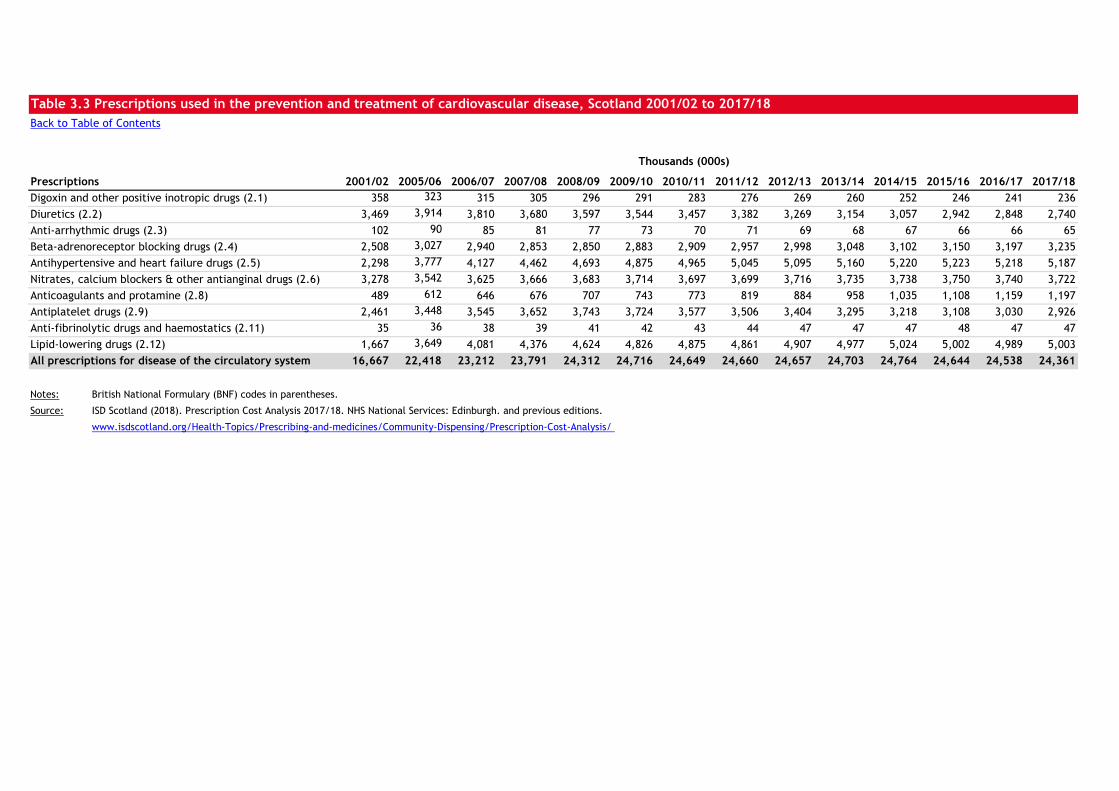
Table 3.3 Prescriptions used in the prevention and treatment of cardiovascular disease, Scotland 2001/02 to 2017/18Back to Table of Contents
2001/02 2005/06 2006/07 2007/08 2008/09 2009/10 2010/11 2011/12 2012/13 2013/14 2014/15 2015/16 2016/17 2017/18358 323 315 305 296 291 283 276 269 260 252 246 241 236
3,469 3,914 3,810 3,680 3,597 3,544 3,457 3,382 3,269 3,154 3,057 2,942 2,848 2,740102 90 85 81 77 73 70 71 69 68 67 66 66 65
2,508 3,027 2,940 2,853 2,850 2,883 2,909 2,957 2,998 3,048 3,102 3,150 3,197 3,2352,298 3,777 4,127 4,462 4,693 4,875 4,965 5,045 5,095 5,160 5,220 5,223 5,218 5,1873,278 3,542 3,625 3,666 3,683 3,714 3,697 3,699 3,716 3,735 3,738 3,750 3,740 3,722
489 612 646 676 707 743 773 819 884 958 1,035 1,108 1,159 1,1972,461 3,448 3,545 3,652 3,743 3,724 3,577 3,506 3,404 3,295 3,218 3,108 3,030 2,926
35 36 38 39 41 42 43 44 47 47 47 48 47 471,667 3,649 4,081 4,376 4,624 4,826 4,875 4,861 4,907 4,977 5,024 5,002 4,989 5,003
16,667 22,418 23,212 23,791 24,312 24,716 24,649 24,660 24,657 24,703 24,764 24,644 24,538 24,361
Notes: British National Formulary (BNF) codes in parentheses.
Source: ISD Scotland (2018). Prescription Cost Analysis 2017/18. NHS National Services: Edinburgh. and previous editions.
www.isdscotland.org/Health-Topics/Prescribing-and-medicines/Community-Dispensing/Prescription-Cost-Analysis/
Thousands (000s)
Beta-adrenoreceptor blocking drugs (2.4)
PrescriptionsDigoxin and other positive inotropic drugs (2.1)Diuretics (2.2)Anti-arrhythmic drugs (2.3)
All prescriptions for disease of the circulatory system
Antihypertensive and heart failure drugs (2.5)Nitrates, calcium blockers & other antianginal drugs (2.6)Anticoagulants and protamine (2.8)Antiplatelet drugs (2.9)Anti-fibrinolytic drugs and haemostatics (2.11)Lipid-lowering drugs (2.12)
X3A0T
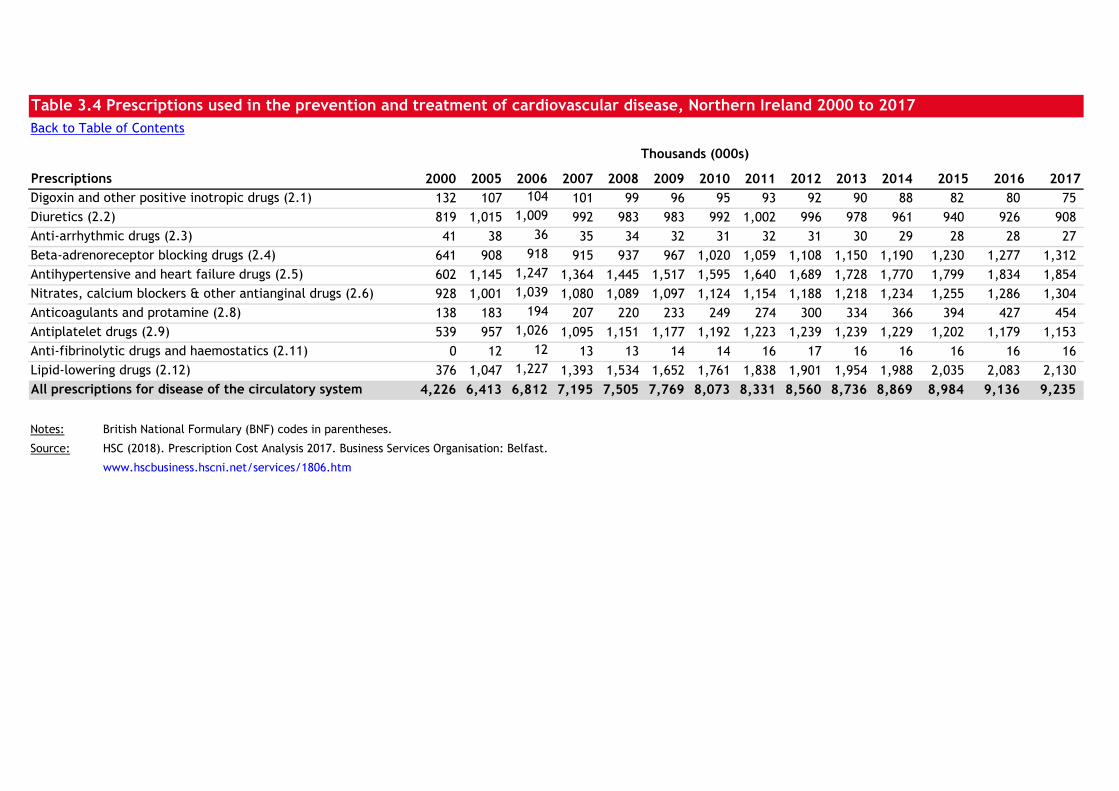
Table 3.4 Prescriptions used in the prevention and treatment of cardiovascular disease, Northern Ireland 2000 to 2017Back to Table of Contents
2000 2005 2006 2007 2008 2009 2010 2011 2012 2013 2014 2015 2016 2017132 107 104 101 99 96 95 93 92 90 88 82 80 75 819 1,015 1,009 992 983 983 992 1,002 996 978 961 940 926 908 41 38 36 35 34 32 31 32 31 30 29 28 28 27
641 908 918 915 937 967 1,020 1,059 1,108 1,150 1,190 1,230 1,277 1,312 602 1,145 1,247 1,364 1,445 1,517 1,595 1,640 1,689 1,728 1,770 1,799 1,834 1,854 928 1,001 1,039 1,080 1,089 1,097 1,124 1,154 1,188 1,218 1,234 1,255 1,286 1,304 138 183 194 207 220 233 249 274 300 334 366 394 427 454 539 957 1,026 1,095 1,151 1,177 1,192 1,223 1,239 1,239 1,229 1,202 1,179 1,153
0 12 12 13 13 14 14 16 17 16 16 16 16 16 376 1,047 1,227 1,393 1,534 1,652 1,761 1,838 1,901 1,954 1,988 2,035 2,083 2,130
4,226 6,413 6,812 7,195 7,505 7,769 8,073 8,331 8,560 8,736 8,869 8,984 9,136 9,235
Notes: British National Formulary (BNF) codes in parentheses.
Source: HSC (2018). Prescription Cost Analysis 2017. Business Services Organisation: Belfast.
www.hscbusiness.hscni.net/services/1806.htm
Thousands (000s)
All prescriptions for disease of the circulatory system
Antihypertensive and heart failure drugs (2.5)Nitrates, calcium blockers & other antianginal drugs (2.6)Anticoagulants and protamine (2.8)Antiplatelet drugs (2.9)Anti-fibrinolytic drugs and haemostatics (2.11)Lipid-lowering drugs (2.12)
Beta-adrenoreceptor blocking drugs (2.4)
PrescriptionsDigoxin and other positive inotropic drugs (2.1)Diuretics (2.2)Anti-arrhythmic drugs (2.3)
X4A0T
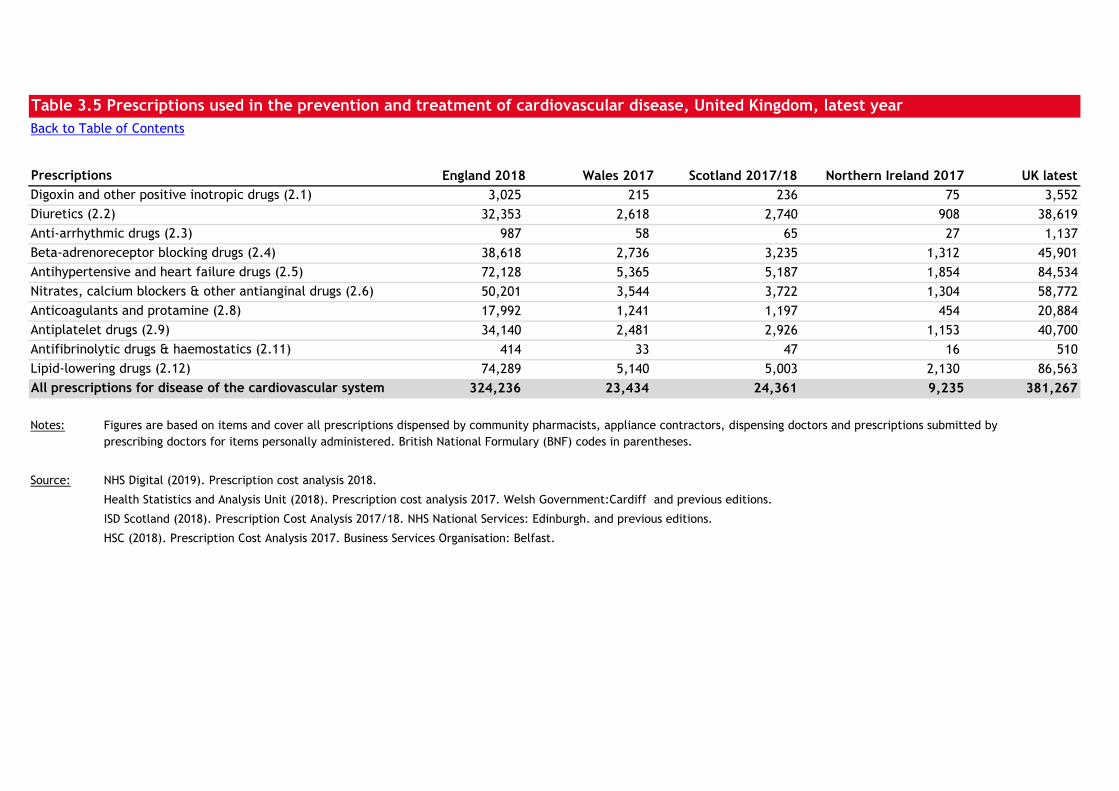
Table 3.5 Prescriptions used in the prevention and treatment of cardiovascular disease, United Kingdom, latest yearBack to Table of Contents
England 2018 Wales 2017 Scotland 2017/18 Northern Ireland 2017 UK latest3,025 215 236 75 3,552
32,353 2,618 2,740 908 38,619987 58 65 27 1,137
38,618 2,736 3,235 1,312 45,90172,128 5,365 5,187 1,854 84,53450,201 3,544 3,722 1,304 58,77217,992 1,241 1,197 454 20,88434,140 2,481 2,926 1,153 40,700
414 33 47 16 51074,289 5,140 5,003 2,130 86,563
324,236 23,434 24,361 9,235 381,267
Notes: Figures are based on items and cover all prescriptions dispensed by community pharmacists, appliance contractors, dispensing doctors and prescriptions submitted by prescribing doctors for items personally administered. British National Formulary (BNF) codes in parentheses.
Source: NHS Digital (2019). Prescription cost analysis 2018.
Health Statistics and Analysis Unit (2018). Prescription cost analysis 2017. Welsh Government:Cardiff and previous editions.
ISD Scotland (2018). Prescription Cost Analysis 2017/18. NHS National Services: Edinburgh. and previous editions.
HSC (2018). Prescription Cost Analysis 2017. Business Services Organisation: Belfast.
Beta-adrenoreceptor blocking drugs (2.4)
Prescriptions Digoxin and other positive inotropic drugs (2.1)Diuretics (2.2)Anti-arrhythmic drugs (2.3)
All prescriptions for disease of the cardiovascular system
Antihypertensive and heart failure drugs (2.5)Nitrates, calcium blockers & other antianginal drugs (2.6)Anticoagulants and protamine (2.8)Antiplatelet drugs (2.9)Antifibrinolytic drugs & haemostatics (2.11)Lipid-lowering drugs (2.12)
X5A0T
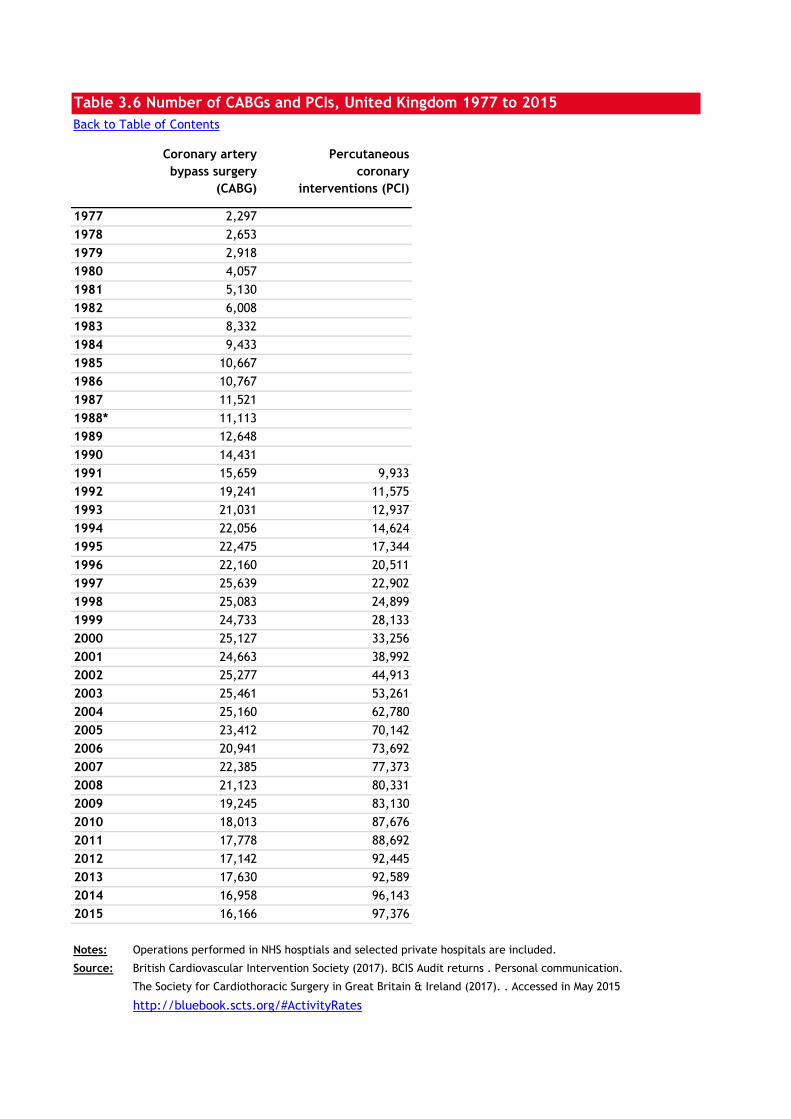
Table 3.6 Number of CABGs and PCIs, United Kingdom 1977 to 2015Back to Table of Contents
Coronary artery bypass surgery
(CABG)
Percutaneous coronary
interventions (PCI)
1977 2,2971978 2,6531979 2,9181980 4,0571981 5,1301982 6,0081983 8,3321984 9,4331985 10,6671986 10,7671987 11,5211988* 11,1131989 12,6481990 14,4311991 15,659 9,9331992 19,241 11,5751993 21,031 12,9371994 22,056 14,6241995 22,475 17,3441996 22,160 20,5111997 25,639 22,9021998 25,083 24,8991999 24,733 28,1332000 25,127 33,2562001 24,663 38,9922002 25,277 44,9132003 25,461 53,2612004 25,160 62,7802005 23,412 70,1422006 20,941 73,6922007 22,385 77,3732008 21,123 80,3312009 19,245 83,1302010 18,013 87,6762011 17,778 88,6922012 17,142 92,4452013 17,630 92,5892014 16,958 96,1432015 16,166 97,376
Notes: Operations performed in NHS hosptials and selected private hospitals are included.
Source: British Cardiovascular Intervention Society (2017). BCIS Audit returns . Personal communication.
The Society for Cardiothoracic Surgery in Great Britain & Ireland (2017). . Accessed in May 2015
http://bluebook.scts.org/#ActivityRates
X6A0T
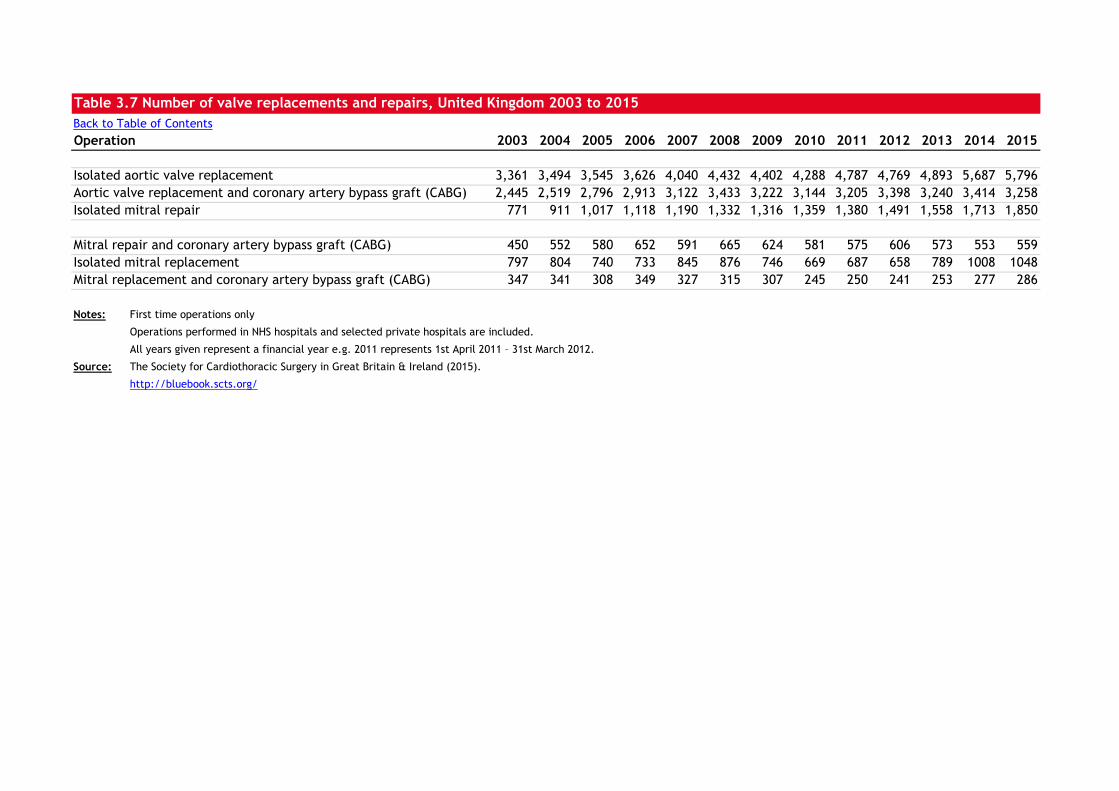
Table 3.7 Number of valve replacements and repairs, United Kingdom 2003 to 2015Back to Table of ContentsOperation 2003 2004 2005 2006 2007 2008 2009 2010 2011 2012 2013 2014 2015
Isolated aortic valve replacement 3,361 3,494 3,545 3,626 4,040 4,432 4,402 4,288 4,787 4,769 4,893 5,687 5,7962,445 2,519 2,796 2,913 3,122 3,433 3,222 3,144 3,205 3,398 3,240 3,414 3,258
Isolated mitral repair 771 911 1,017 1,118 1,190 1,332 1,316 1,359 1,380 1,491 1,558 1,713 1,850
450 552 580 652 591 665 624 581 575 606 573 553 559Isolated mitral replacement 797 804 740 733 845 876 746 669 687 658 789 1008 1048
347 341 308 349 327 315 307 245 250 241 253 277 286
Notes: First time operations only
Operations performed in NHS hospitals and selected private hospitals are included.
All years given represent a financial year e.g. 2011 represents 1st April 2011 – 31st March 2012.
Source: The Society for Cardiothoracic Surgery in Great Britain & Ireland (2015).
http://bluebook.scts.org/
Mitral replacement and coronary artery bypass graft (CABG)
Mitral repair and coronary artery bypass graft (CABG)
Aortic valve replacement and coronary artery bypass graft (CABG)
X7A0T
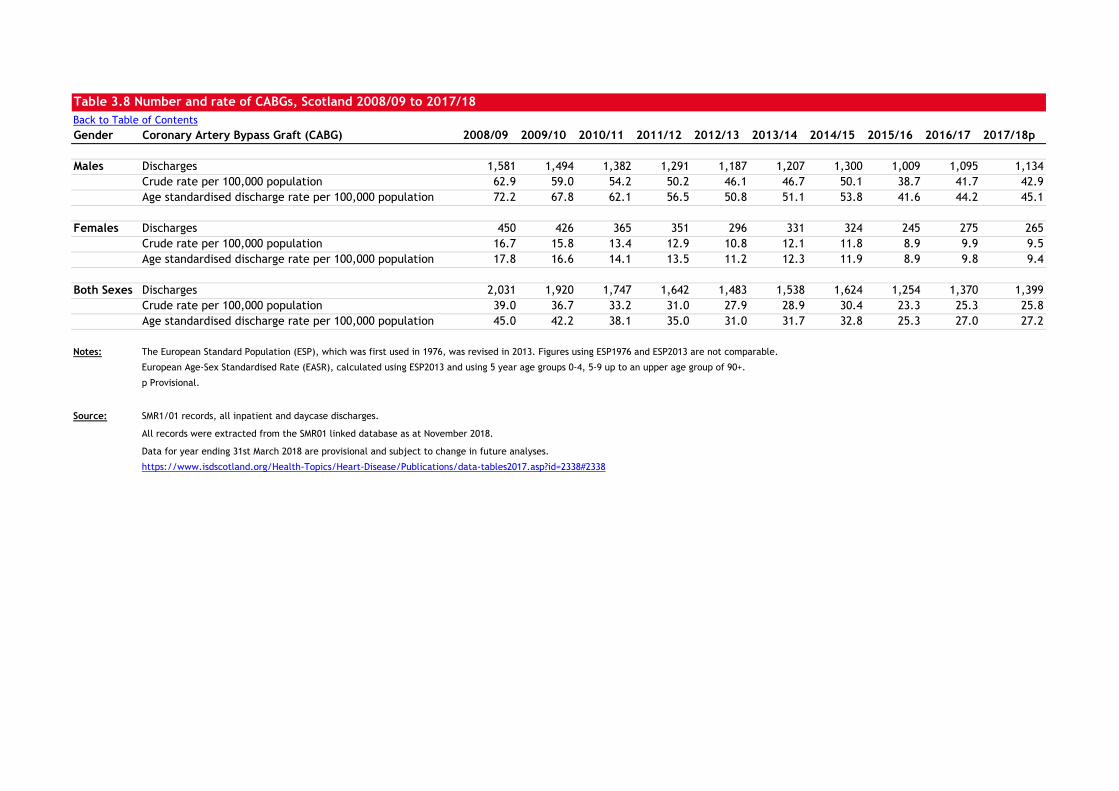
Table 3.8 Number and rate of CABGs, Scotland 2008/09 to 2017/18Back to Table of ContentsGender Coronary Artery Bypass Graft (CABG) 2008/09 2009/10 2010/11 2011/12 2012/13 2013/14 2014/15 2015/16 2016/17 2017/18p
Males Discharges 1,581 1,494 1,382 1,291 1,187 1,207 1,300 1,009 1,095 1,134Crude rate per 100,000 population 62.9 59.0 54.2 50.2 46.1 46.7 50.1 38.7 41.7 42.9Age standardised discharge rate per 100,000 population 72.2 67.8 62.1 56.5 50.8 51.1 53.8 41.6 44.2 45.1
Females Discharges 450 426 365 351 296 331 324 245 275 265Crude rate per 100,000 population 16.7 15.8 13.4 12.9 10.8 12.1 11.8 8.9 9.9 9.5Age standardised discharge rate per 100,000 population 17.8 16.6 14.1 13.5 11.2 12.3 11.9 8.9 9.8 9.4
Both Sexes Discharges 2,031 1,920 1,747 1,642 1,483 1,538 1,624 1,254 1,370 1,399Crude rate per 100,000 population 39.0 36.7 33.2 31.0 27.9 28.9 30.4 23.3 25.3 25.8Age standardised discharge rate per 100,000 population 45.0 42.2 38.1 35.0 31.0 31.7 32.8 25.3 27.0 27.2
Notes: The European Standard Population (ESP), which was first used in 1976, was revised in 2013. Figures using ESP1976 and ESP2013 are not comparable.
European Age-Sex Standardised Rate (EASR), calculated using ESP2013 and using 5 year age groups 0-4, 5-9 up to an upper age group of 90+.
p Provisional.
Source: SMR1/01 records, all inpatient and daycase discharges.
All records were extracted from the SMR01 linked database as at November 2018.
Data for year ending 31st March 2018 are provisional and subject to change in future analyses.
https://www.isdscotland.org/Health-Topics/Heart-Disease/Publications/data-tables2017.asp?id=2338#2338
X8A0T
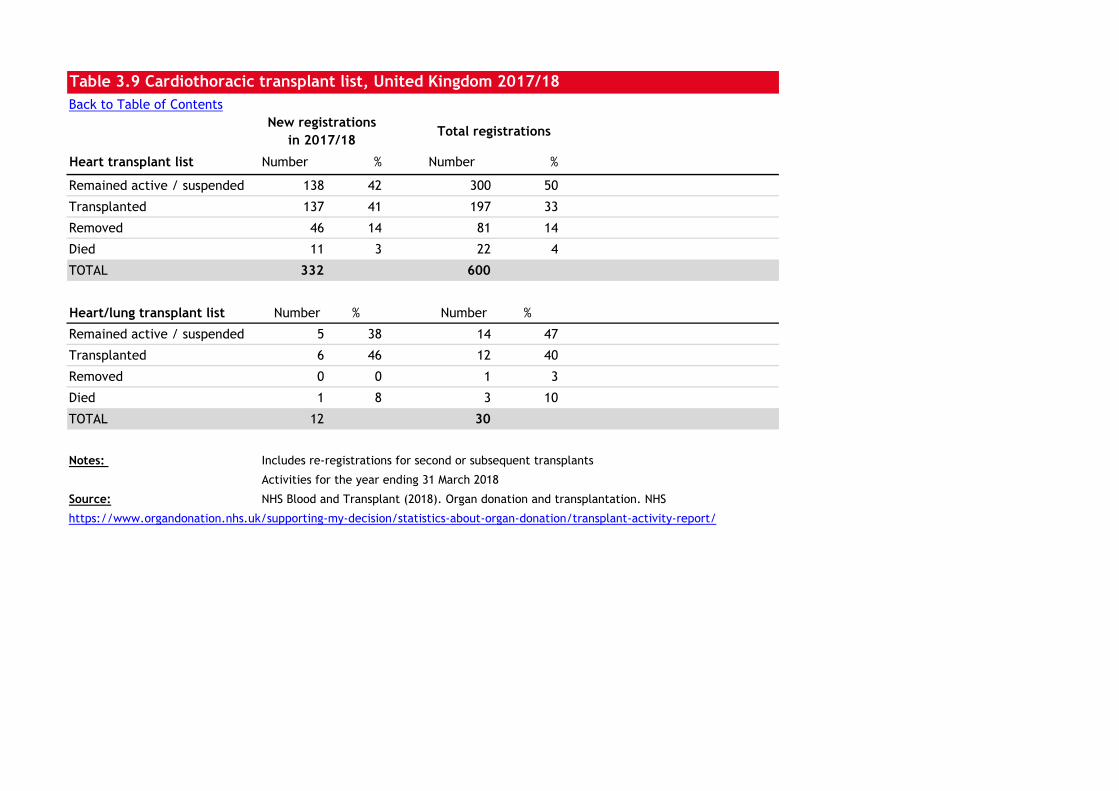
Table 3.9 Cardiothoracic transplant list, United Kingdom 2017/18Back to Table of Contents
Heart transplant list Number % Number %
Remained active / suspended 138 42 300 50
Transplanted 137 41 197 33
Removed 46 14 81 14
Died 11 3 22 4
TOTAL 332 600
Heart/lung transplant list Number % Number %
Remained active / suspended 5 38 14 47
Transplanted 6 46 12 40
Removed 0 0 1 3
Died 1 8 3 10
TOTAL 12 30
Notes: Includes re-registrations for second or subsequent transplants
Activities for the year ending 31 March 2018
Source: NHS Blood and Transplant (2018). Organ donation and transplantation. NHS
https://www.organdonation.nhs.uk/supporting-my-decision/statistics-about-organ-donation/transplant-activity-report/
Total registrationsNew registrations
in 2017/18
X9A0T
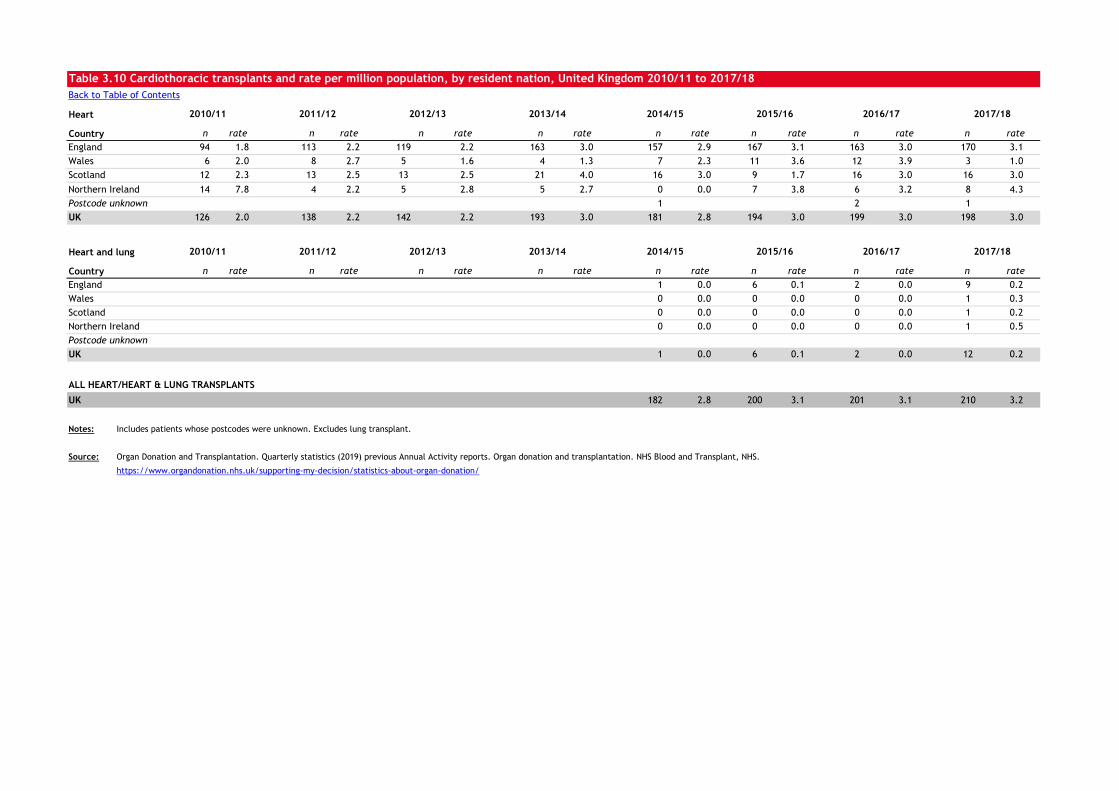
Table 3.10 Cardiothoracic transplants and rate per million population, by resident nation, United Kingdom 2010/11 to 2017/18Back to Table of Contents
Heart
Country n rate n rate n rate n rate n rate n rate n rate n rateEngland 94 1.8 113 2.2 119 2.2 163 3.0 157 2.9 167 3.1 163 3.0 170 3.1Wales 6 2.0 8 2.7 5 1.6 4 1.3 7 2.3 11 3.6 12 3.9 3 1.0Scotland 12 2.3 13 2.5 13 2.5 21 4.0 16 3.0 9 1.7 16 3.0 16 3.0Northern Ireland 14 7.8 4 2.2 5 2.8 5 2.7 0 0.0 7 3.8 6 3.2 8 4.3Postcode unknown 1 2 1UK 126 2.0 138 2.2 142 2.2 193 3.0 181 2.8 194 3.0 199 3.0 198 3.0
Heart and lung
Country n rate n rate n rate n rate n rate n rate n rate n rateEngland 1 0.0 6 0.1 2 0.0 9 0.2Wales 0 0.0 0 0.0 0 0.0 1 0.3Scotland 0 0.0 0 0.0 0 0.0 1 0.2Northern Ireland 0 0.0 0 0.0 0 0.0 1 0.5Postcode unknownUK 1 0.0 6 0.1 2 0.0 12 0.2
ALL HEART/HEART & LUNG TRANSPLANTS
UK 182 2.8 200 3.1 201 3.1 210 3.2
Notes: Includes patients whose postcodes were unknown. Excludes lung transplant.
Source: Organ Donation and Transplantation. Quarterly statistics (2019) previous Annual Activity reports. Organ donation and transplantation. NHS Blood and Transplant, NHS.
https://www.organdonation.nhs.uk/supporting-my-decision/statistics-about-organ-donation/
2010/11 2011/12 2012/13 2017/182016/172015/162013/14 2014/15
2015/16 2016/17 2017/182010/11 2011/12 2012/13 2013/14 2014/15
X10A0T
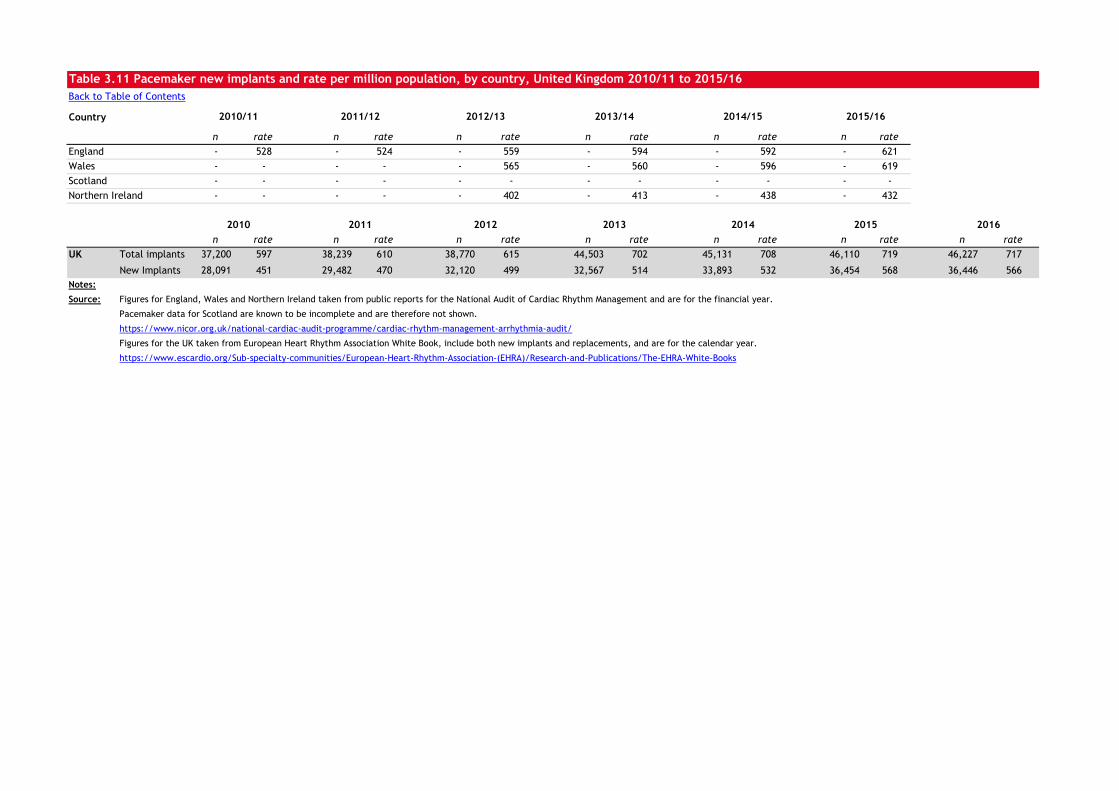
Table 3.11 Pacemaker new implants and rate per million population, by country, United Kingdom 2010/11 to 2015/16Back to Table of Contents
Country
n rate n rate n rate n rate n rate n rateEngland - 528 - 524 - 559 - 594 - 592 - 621Wales - - - - - 565 - 560 - 596 - 619Scotland - - - - - - - - - - - -Northern Ireland - - - - - 402 - 413 - 438 - 432
n rate n rate n rate n rate n rate n rate n rateUK Total implants 37,200 597 38,239 610 38,770 615 44,503 702 45,131 708 46,110 719 46,227 717
New Implants 28,091 451 29,482 470 32,120 499 32,567 514 33,893 532 36,454 568 36,446 566Notes:
Source: Figures for England, Wales and Northern Ireland taken from public reports for the National Audit of Cardiac Rhythm Management and are for the financial year.
Pacemaker data for Scotland are known to be incomplete and are therefore not shown.
https://www.nicor.org.uk/national-cardiac-audit-programme/cardiac-rhythm-management-arrhythmia-audit/
Figures for the UK taken from European Heart Rhythm Association White Book, include both new implants and replacements, and are for the calendar year.
https://www.escardio.org/Sub-specialty-communities/European-Heart-Rhythm-Association-(EHRA)/Research-and-Publications/The-EHRA-White-Books
2015 2016
2010/11 2011/12 2012/13 2013/14 2014/15 2015/16
2010 2011 2012 2013 2014
X11A0T
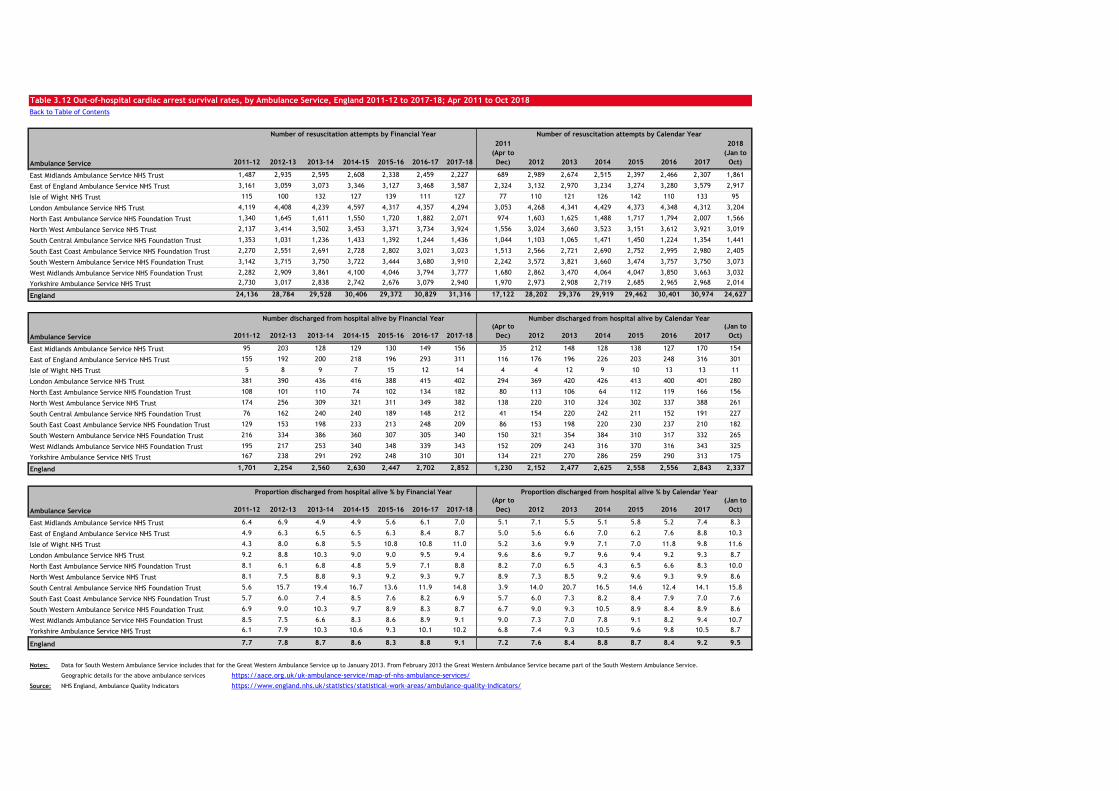
Table 3.12 Out-of-hospital cardiac arrest survival rates, by Ambulance Service, England 2011-12 to 2017-18; Apr 2011 to Oct 2018Back to Table of Contents
Ambulance Service 2011-12 2012-13 2013-14 2014-15 2015-16 2016-17 2017-18
2011 (Apr to Dec) 2012 2013 2014 2015 2016 2017
2018 (Jan to
Oct)
East Midlands Ambulance Service NHS Trust 1,487 2,935 2,595 2,608 2,338 2,459 2,227 689 2,989 2,674 2,515 2,397 2,466 2,307 1,861
East of England Ambulance Service NHS Trust 3,161 3,059 3,073 3,346 3,127 3,468 3,587 2,324 3,132 2,970 3,234 3,274 3,280 3,579 2,917
Isle of Wight NHS Trust 115 100 132 127 139 111 127 77 110 121 126 142 110 133 95
London Ambulance Service NHS Trust 4,119 4,408 4,239 4,597 4,317 4,357 4,294 3,053 4,268 4,341 4,429 4,373 4,348 4,312 3,204
North East Ambulance Service NHS Foundation Trust 1,340 1,645 1,611 1,550 1,720 1,882 2,071 974 1,603 1,625 1,488 1,717 1,794 2,007 1,566
North West Ambulance Service NHS Trust 2,137 3,414 3,502 3,453 3,371 3,734 3,924 1,556 3,024 3,660 3,523 3,151 3,612 3,921 3,019
South Central Ambulance Service NHS Foundation Trust 1,353 1,031 1,236 1,433 1,392 1,244 1,436 1,044 1,103 1,065 1,471 1,450 1,224 1,354 1,441
South East Coast Ambulance Service NHS Foundation Trust 2,270 2,551 2,691 2,728 2,802 3,021 3,023 1,513 2,566 2,721 2,690 2,752 2,995 2,980 2,405
South Western Ambulance Service NHS Foundation Trust 3,142 3,715 3,750 3,722 3,444 3,680 3,910 2,242 3,572 3,821 3,660 3,474 3,757 3,750 3,073
West Midlands Ambulance Service NHS Foundation Trust 2,282 2,909 3,861 4,100 4,046 3,794 3,777 1,680 2,862 3,470 4,064 4,047 3,850 3,663 3,032
Yorkshire Ambulance Service NHS Trust 2,730 3,017 2,838 2,742 2,676 3,079 2,940 1,970 2,973 2,908 2,719 2,685 2,965 2,968 2,014
England 24,136 28,784 29,528 30,406 29,372 30,829 31,316 17,122 28,202 29,376 29,919 29,462 30,401 30,974 24,627
Ambulance Service 2011-12 2012-13 2013-14 2014-15 2015-16 2016-17 2017-18
(Apr to Dec) 2012 2013 2014 2015 2016 2017
(Jan to
Oct)
East Midlands Ambulance Service NHS Trust 95 203 128 129 130 149 156 35 212 148 128 138 127 170 154
East of England Ambulance Service NHS Trust 155 192 200 218 196 293 311 116 176 196 226 203 248 316 301
Isle of Wight NHS Trust 5 8 9 7 15 12 14 4 4 12 9 10 13 13 11
London Ambulance Service NHS Trust 381 390 436 416 388 415 402 294 369 420 426 413 400 401 280
North East Ambulance Service NHS Foundation Trust 108 101 110 74 102 134 182 80 113 106 64 112 119 166 156
North West Ambulance Service NHS Trust 174 256 309 321 311 349 382 138 220 310 324 302 337 388 261
South Central Ambulance Service NHS Foundation Trust 76 162 240 240 189 148 212 41 154 220 242 211 152 191 227
South East Coast Ambulance Service NHS Foundation Trust 129 153 198 233 213 248 209 86 153 198 220 230 237 210 182
South Western Ambulance Service NHS Foundation Trust 216 334 386 360 307 305 340 150 321 354 384 310 317 332 265
West Midlands Ambulance Service NHS Foundation Trust 195 217 253 340 348 339 343 152 209 243 316 370 316 343 325
Yorkshire Ambulance Service NHS Trust 167 238 291 292 248 310 301 134 221 270 286 259 290 313 175
England 1,701 2,254 2,560 2,630 2,447 2,702 2,852 1,230 2,152 2,477 2,625 2,558 2,556 2,843 2,337
Ambulance Service 2011-12 2012-13 2013-14 2014-15 2015-16 2016-17 2017-18
(Apr to Dec) 2012 2013 2014 2015 2016 2017
(Jan to
Oct)
East Midlands Ambulance Service NHS Trust 6.4 6.9 4.9 4.9 5.6 6.1 7.0 5.1 7.1 5.5 5.1 5.8 5.2 7.4 8.3
East of England Ambulance Service NHS Trust 4.9 6.3 6.5 6.5 6.3 8.4 8.7 5.0 5.6 6.6 7.0 6.2 7.6 8.8 10.3
Isle of Wight NHS Trust 4.3 8.0 6.8 5.5 10.8 10.8 11.0 5.2 3.6 9.9 7.1 7.0 11.8 9.8 11.6
London Ambulance Service NHS Trust 9.2 8.8 10.3 9.0 9.0 9.5 9.4 9.6 8.6 9.7 9.6 9.4 9.2 9.3 8.7
North East Ambulance Service NHS Foundation Trust 8.1 6.1 6.8 4.8 5.9 7.1 8.8 8.2 7.0 6.5 4.3 6.5 6.6 8.3 10.0
North West Ambulance Service NHS Trust 8.1 7.5 8.8 9.3 9.2 9.3 9.7 8.9 7.3 8.5 9.2 9.6 9.3 9.9 8.6
South Central Ambulance Service NHS Foundation Trust 5.6 15.7 19.4 16.7 13.6 11.9 14.8 3.9 14.0 20.7 16.5 14.6 12.4 14.1 15.8
South East Coast Ambulance Service NHS Foundation Trust 5.7 6.0 7.4 8.5 7.6 8.2 6.9 5.7 6.0 7.3 8.2 8.4 7.9 7.0 7.6
South Western Ambulance Service NHS Foundation Trust 6.9 9.0 10.3 9.7 8.9 8.3 8.7 6.7 9.0 9.3 10.5 8.9 8.4 8.9 8.6
West Midlands Ambulance Service NHS Foundation Trust 8.5 7.5 6.6 8.3 8.6 8.9 9.1 9.0 7.3 7.0 7.8 9.1 8.2 9.4 10.7
Yorkshire Ambulance Service NHS Trust 6.1 7.9 10.3 10.6 9.3 10.1 10.2 6.8 7.4 9.3 10.5 9.6 9.8 10.5 8.7
England 7.7 7.8 8.7 8.6 8.3 8.8 9.1 7.2 7.6 8.4 8.8 8.7 8.4 9.2 9.5
Notes: Data for South Western Ambulance Service includes that for the Great Western Ambulance Service up to January 2013. From February 2013 the Great Western Ambulance Service became part of the South Western Ambulance Service.
Geographic details for the above ambulance services https://aace.org.uk/uk-ambulance-service/map-of-nhs-ambulance-services/Source: NHS England, Ambulance Quality Indicators https://www.england.nhs.uk/statistics/statistical-work-areas/ambulance-quality-indicators/
Number of resuscitation attempts by Financial Year
Number discharged from hospital alive by Financial Year
Proportion discharged from hospital alive % by Financial Year
Number of resuscitation attempts by Calendar Year
Number discharged from hospital alive by Calendar Year
Proportion discharged from hospital alive % by Calendar Year
X12A0T
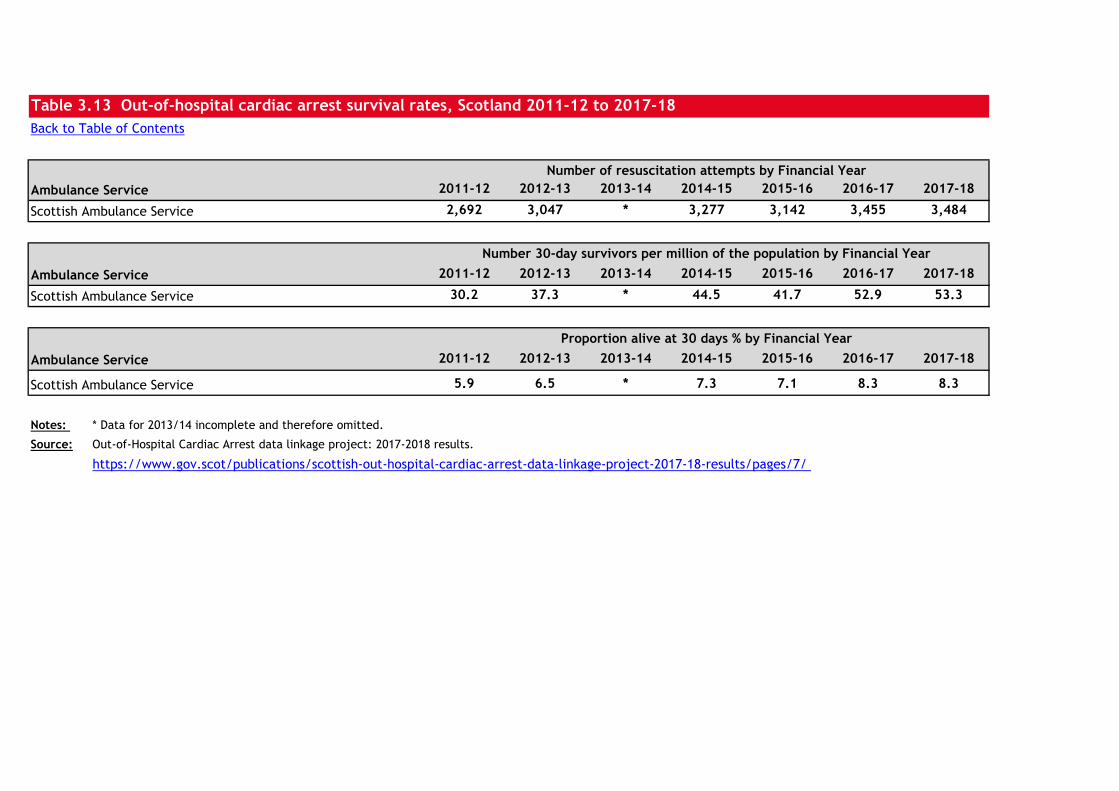
Table 3.13 Out-of-hospital cardiac arrest survival rates, Scotland 2011-12 to 2017-18Back to Table of Contents
Ambulance Service 2011-12 2012-13 2013-14 2014-15 2015-16 2016-17 2017-18
Scottish Ambulance Service 2,692 3,047 * 3,277 3,142 3,455 3,484
Ambulance Service 2011-12 2012-13 2013-14 2014-15 2015-16 2016-17 2017-18
Scottish Ambulance Service 30.2 37.3 * 44.5 41.7 52.9 53.3
Ambulance Service 2011-12 2012-13 2013-14 2014-15 2015-16 2016-17 2017-18
Scottish Ambulance Service 5.9 6.5 * 7.3 7.1 8.3 8.3
Notes: * Data for 2013/14 incomplete and therefore omitted.
Source: Out-of-Hospital Cardiac Arrest data linkage project: 2017-2018 results.
https://www.gov.scot/publications/scottish-out-hospital-cardiac-arrest-data-linkage-project-2017-18-results/pages/7/
Number of resuscitation attempts by Financial Year
Number 30-day survivors per million of the population by Financial Year
Proportion alive at 30 days % by Financial Year
X13A0T
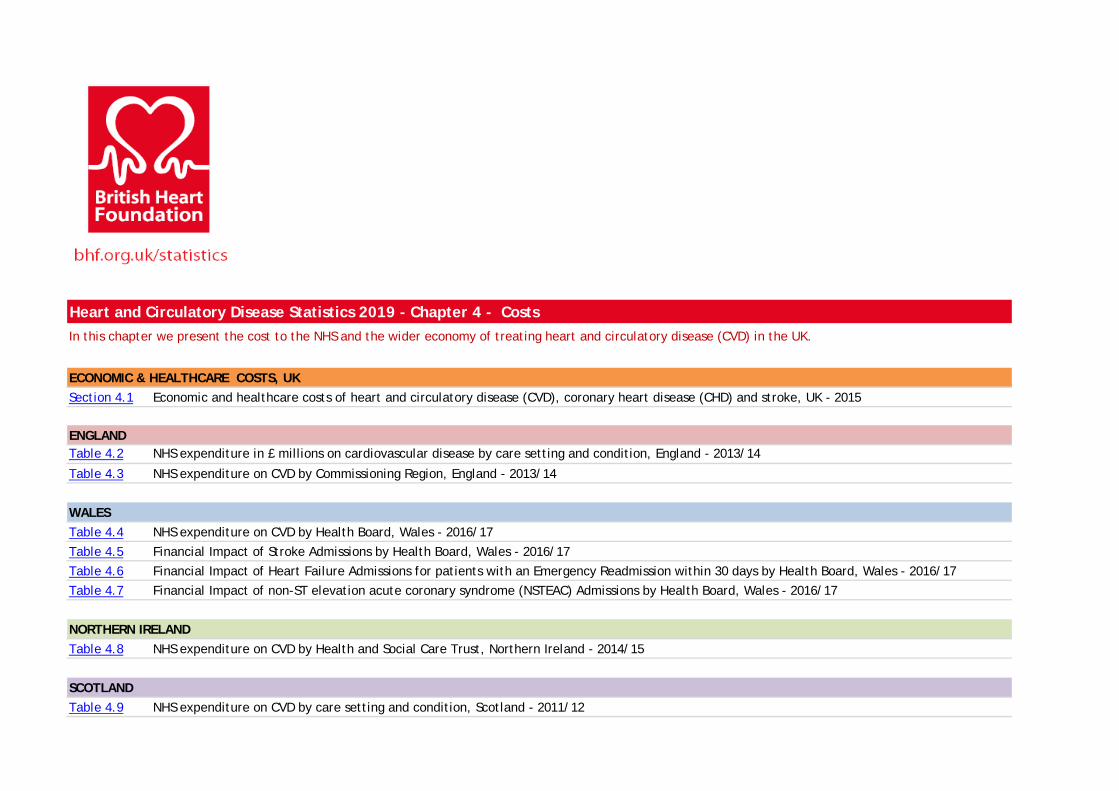
Heart and Circulatory Disease Statistics 2019 - Chapter 4 - CostsIn this chapter we present the cost to the NHS and the wider economy of treating heart and circulatory disease (CVD) in the UK.
ECONOMIC & HEALTHCARE COSTS, UKSection 4.1 Economic and healthcare costs of heart and circulatory disease (CVD), coronary heart disease (CHD) and stroke, UK - 2015
ENGLANDTable 4.2 NHS expenditure in £ millions on cardiovascular disease by care setting and condition, England - 2013/14
Table 4.3 NHS expenditure on CVD by Commissioning Region, England - 2013/14
WALESTable 4.4 NHS expenditure on CVD by Health Board, Wales - 2016/17Table 4.5 Financial Impact of Stroke Admissions by Health Board, Wales - 2016/17Table 4.6 Financial Impact of Heart Failure Admissions for patients with an Emergency Readmission within 30 days by Health Board, Wales - 2016/17Table 4.7 Financial Impact of non-ST elevation acute coronary syndrome (NSTEAC) Admissions by Health Board, Wales - 2016/17
NORTHERN IRELANDTable 4.8 NHS expenditure on CVD by Health and Social Care Trust, Northern Ireland - 2014/15
SCOTLANDTable 4.9 NHS expenditure on CVD by care setting and condition, Scotland - 2011/12
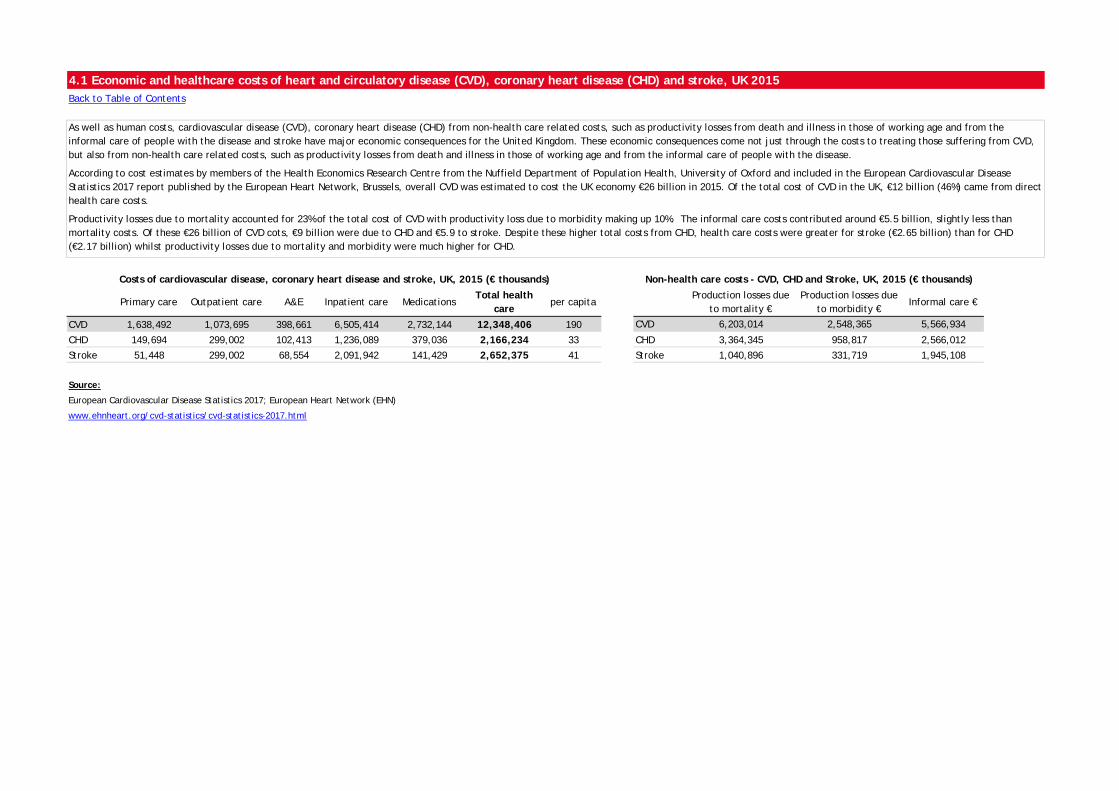
4.1 Economic and healthcare costs of heart and circulatory disease (CVD), coronary heart disease (CHD) and stroke, UK 2015Back to Table of Contents
Primary care Outpatient care A&E Inpatient care MedicationsTotal health
careper capita
Production losses due to mortality €
Production losses due to morbidity €
Informal care €
CVD 1,638,492 1,073,695 398,661 6,505,414 2,732,144 12,348,406 190 CVD 6,203,014 2,548,365 5,566,934
CHD 149,694 299,002 102,413 1,236,089 379,036 2,166,234 33 CHD 3,364,345 958,817 2,566,012
Stroke 51,448 299,002 68,554 2,091,942 141,429 2,652,375 41 Stroke 1,040,896 331,719 1,945,108
Source:
European Cardiovascular Disease Statistics 2017; European Heart Network (EHN)
www.ehnheart.org/cvd-statistics/cvd-statistics-2017.html
Costs of cardiovascular disease, coronary heart disease and stroke, UK, 2015 (€ thousands) Non-health care costs - CVD, CHD and Stroke, UK, 2015 (€ thousands)
As well as human costs, cardiovascular disease (CVD), coronary heart disease (CHD) from non-health care related costs, such as productivity losses from death and illness in those of working age and from the informal care of people with the disease and stroke have major economic consequences for the United Kingdom. These economic consequences come not just through the costs to treating those suffering from CVD, but also from non-health care related costs, such as productivity losses from death and illness in those of working age and from the informal care of people with the disease.
According to cost estimates by members of the Health Economics Research Centre from the Nuffield Department of Population Health, University of Oxford and included in the European Cardiovascular Disease Statistics 2017 report published by the European Heart Network, Brussels, overall CVD was estimated to cost the UK economy €26 billion in 2015. Of the total cost of CVD in the UK, €12 billion (46%) came from direct health care costs.
Productivity losses due to mortality accounted for 23% of the total cost of CVD with productivity loss due to morbidity making up 10%. The informal care costs contributed around €5.5 billion, slightly less than mortality costs. Of these €26 billion of CVD cots, €9 billion were due to CHD and €5.9 to stroke. Despite these higher total costs from CHD, health care costs were greater for stroke (€2.65 billion) than for CHD (€2.17 billion) whilst productivity losses due to mortality and morbidity were much higher for CHD.
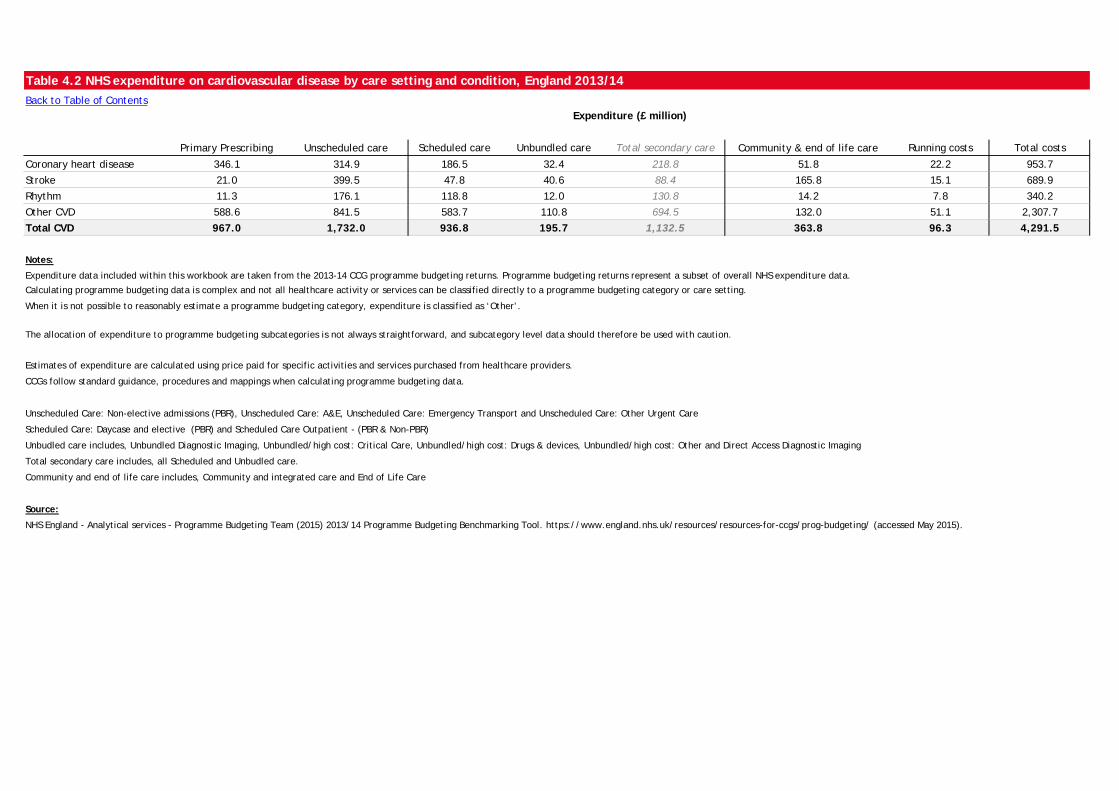
Table 4.2 NHS expenditure on cardiovascular disease by care setting and condition, England 2013/14 Back to Table of Contents
Primary Prescribing Unscheduled care Scheduled care Unbundled care Total secondary care Community & end of life care Running costs Total costs
Coronary heart disease 346.1 314.9 186.5 32.4 218.8 51.8 22.2 953.7
Stroke 21.0 399.5 47.8 40.6 88.4 165.8 15.1 689.9
Rhythm 11.3 176.1 118.8 12.0 130.8 14.2 7.8 340.2
Other CVD 588.6 841.5 583.7 110.8 694.5 132.0 51.1 2,307.7
Total CVD 967.0 1,732.0 936.8 195.7 1,132.5 363.8 96.3 4,291.5
Notes:
Expenditure data included within this workbook are taken from the 2013-14 CCG programme budgeting returns. Programme budgeting returns represent a subset of overall NHS expenditure data.
Calculating programme budgeting data is complex and not all healthcare activity or services can be classified directly to a programme budgeting category or care setting.
When it is not possible to reasonably estimate a programme budgeting category, expenditure is classified as ‘Other’.
The allocation of expenditure to programme budgeting subcategories is not always straightforward, and subcategory level data should therefore be used with caution.
Estimates of expenditure are calculated using price paid for specific activities and services purchased from healthcare providers.
CCGs follow standard guidance, procedures and mappings when calculating programme budgeting data.
Unscheduled Care: Non-elective admissions (PBR), Unscheduled Care: A&E, Unscheduled Care: Emergency Transport and Unscheduled Care: Other Urgent Care
Scheduled Care: Daycase and elective (PBR) and Scheduled Care Outpatient - (PBR & Non-PBR)
Unbudled care includes, Unbundled Diagnostic Imaging, Unbundled/high cost: Critical Care, Unbundled/high cost: Drugs & devices, Unbundled/high cost: Other and Direct Access Diagnostic Imaging
Total secondary care includes, all Scheduled and Unbudled care.
Community and end of life care includes, Community and integrated care and End of Life Care
Source:
NHS England - Analytical services - Programme Budgeting Team (2015) 2013/14 Programme Budgeting Benchmarking Tool. https://www.england.nhs.uk/resources/resources-for-ccgs/prog-budgeting/ (accessed May 2015).
Expenditure (£ million)
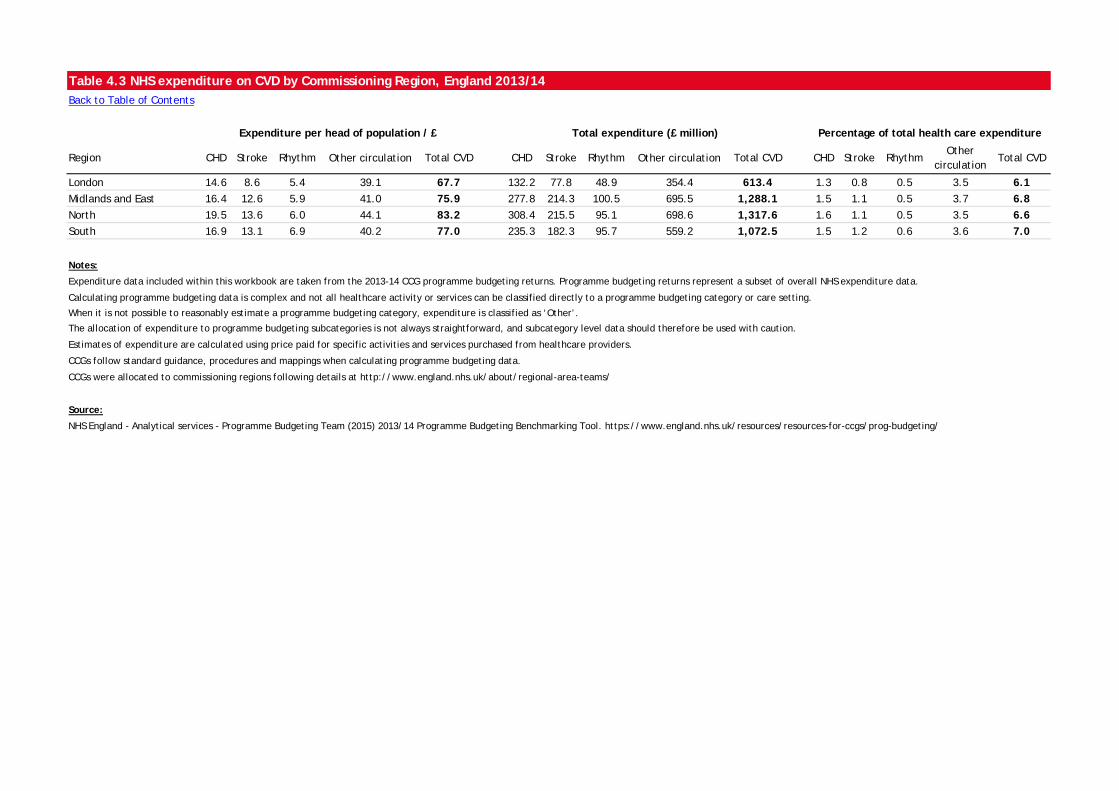
Table 4.3 NHS expenditure on CVD by Commissioning Region, England 2013/14Back to Table of Contents
Region CHD Stroke Rhythm Other circulation Total CVD CHD Stroke Rhythm Other circulation Total CVD CHD Stroke RhythmOther
circulationTotal CVD
London 14.6 8.6 5.4 39.1 67.7 132.2 77.8 48.9 354.4 613.4 1.3 0.8 0.5 3.5 6.1Midlands and East 16.4 12.6 5.9 41.0 75.9 277.8 214.3 100.5 695.5 1,288.1 1.5 1.1 0.5 3.7 6.8North 19.5 13.6 6.0 44.1 83.2 308.4 215.5 95.1 698.6 1,317.6 1.6 1.1 0.5 3.5 6.6South 16.9 13.1 6.9 40.2 77.0 235.3 182.3 95.7 559.2 1,072.5 1.5 1.2 0.6 3.6 7.0
Notes:
Expenditure data included within this workbook are taken from the 2013-14 CCG programme budgeting returns. Programme budgeting returns represent a subset of overall NHS expenditure data.
Calculating programme budgeting data is complex and not all healthcare activity or services can be classified directly to a programme budgeting category or care setting.
When it is not possible to reasonably estimate a programme budgeting category, expenditure is classified as ‘Other’.
The allocation of expenditure to programme budgeting subcategories is not always straightforward, and subcategory level data should therefore be used with caution.
Estimates of expenditure are calculated using price paid for specific activities and services purchased from healthcare providers.
CCGs follow standard guidance, procedures and mappings when calculating programme budgeting data.
CCGs were allocated to commissioning regions following details at http://www.england.nhs.uk/about/regional-area-teams/
Source:
NHS England - Analytical services - Programme Budgeting Team (2015) 2013/14 Programme Budgeting Benchmarking Tool. https://www.england.nhs.uk/resources/resources-for-ccgs/prog-budgeting/
Expenditure per head of population / £ Total expenditure (£ million) Percentage of total health care expenditure
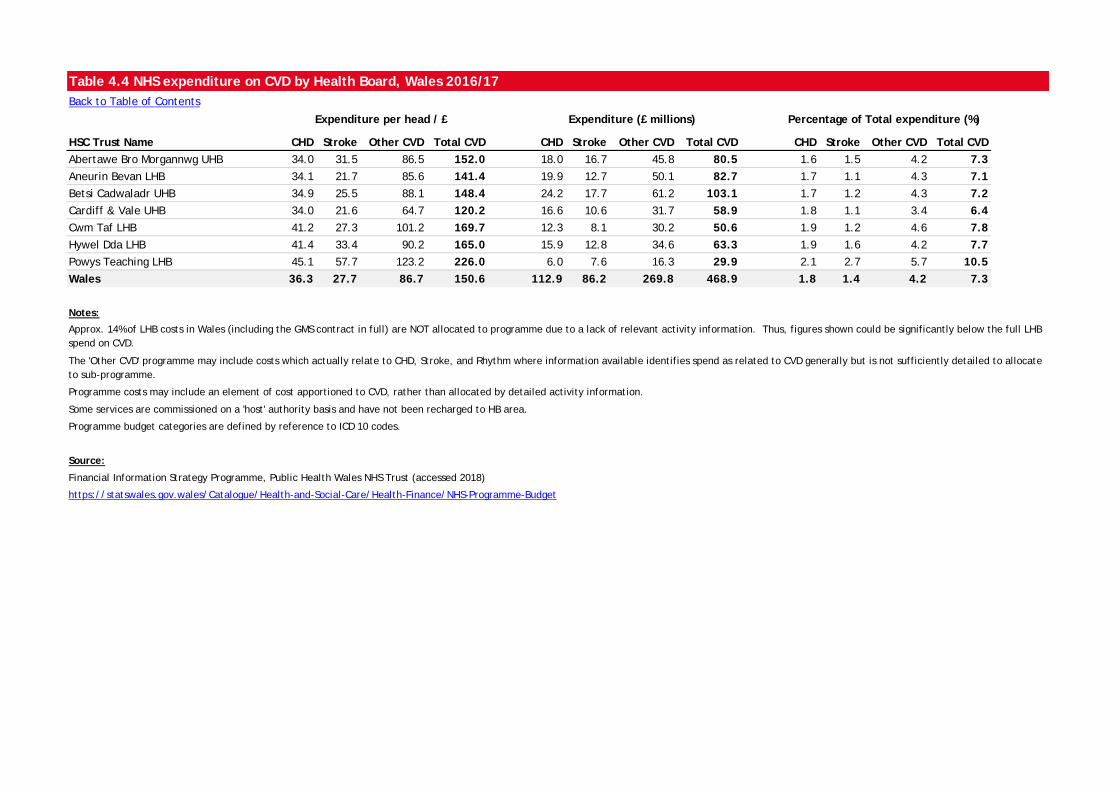
Table 4.4 NHS expenditure on CVD by Health Board, Wales 2016/17Back to Table of Contents
HSC Trust Name CHD Stroke Other CVD Total CVD CHD Stroke Other CVD Total CVD CHD Stroke Other CVD Total CVDAbertawe Bro Morgannwg UHB 34.0 31.5 86.5 152.0 18.0 16.7 45.8 80.5 1.6 1.5 4.2 7.3Aneurin Bevan LHB 34.1 21.7 85.6 141.4 19.9 12.7 50.1 82.7 1.7 1.1 4.3 7.1Betsi Cadwaladr UHB 34.9 25.5 88.1 148.4 24.2 17.7 61.2 103.1 1.7 1.2 4.3 7.2Cardiff & Vale UHB 34.0 21.6 64.7 120.2 16.6 10.6 31.7 58.9 1.8 1.1 3.4 6.4Cwm Taf LHB 41.2 27.3 101.2 169.7 12.3 8.1 30.2 50.6 1.9 1.2 4.6 7.8Hywel Dda LHB 41.4 33.4 90.2 165.0 15.9 12.8 34.6 63.3 1.9 1.6 4.2 7.7Powys Teaching LHB 45.1 57.7 123.2 226.0 6.0 7.6 16.3 29.9 2.1 2.7 5.7 10.5Wales 36.3 27.7 86.7 150.6 112.9 86.2 269.8 468.9 1.8 1.4 4.2 7.3
Notes:
Some services are commissioned on a 'host' authority basis and have not been recharged to HB area.
Programme budget categories are defined by reference to ICD 10 codes.
Source:
Financial Information Strategy Programme, Public Health Wales NHS Trust (accessed 2018)
https://statswales.gov.wales/Catalogue/Health-and-Social-Care/Health-Finance/NHS-Programme-Budget
Approx. 14% of LHB costs in Wales (including the GMS contract in full) are NOT allocated to programme due to a lack of relevant activity information. Thus, figures shown could be significantly below the full LHB spend on CVD.
The 'Other CVD' programme may include costs which actually relate to CHD, Stroke, and Rhythm where information available identifies spend as related to CVD generally but is not sufficiently detailed to allocate to sub-programme.
Programme costs may include an element of cost apportioned to CVD, rather than allocated by detailed activity information.
Expenditure per head / £ Expenditure (£ millions) Percentage of Total expenditure (%)
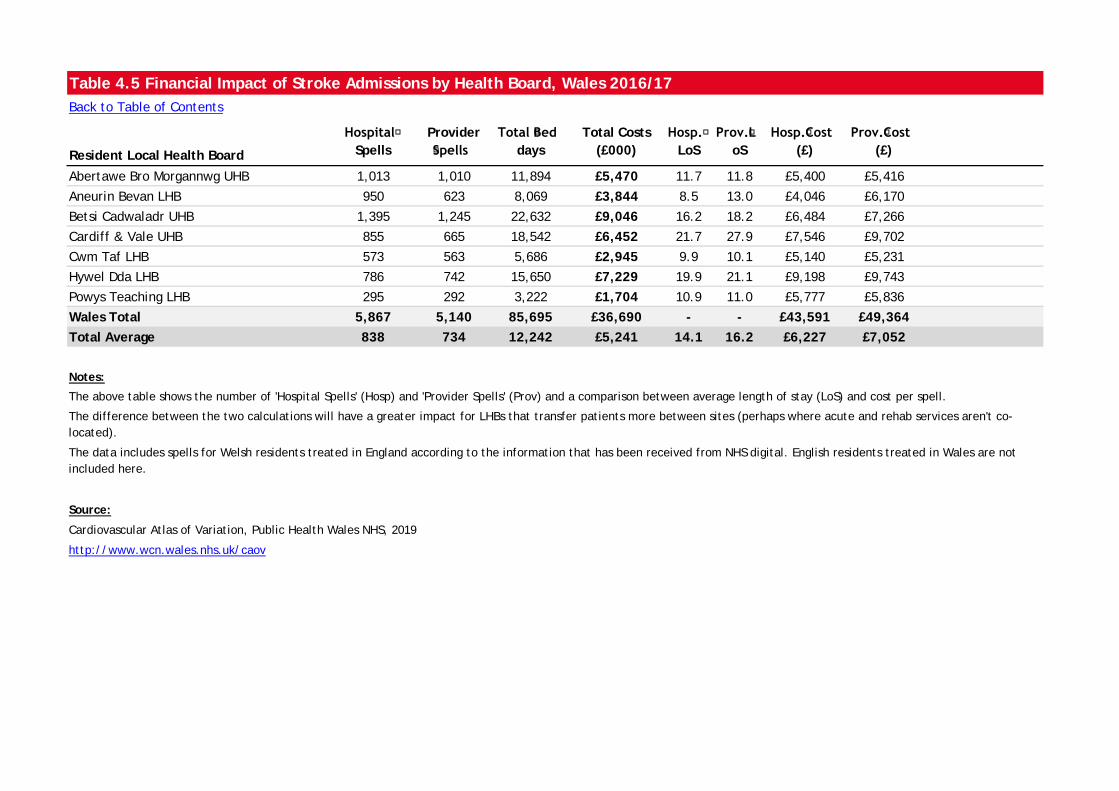
Table 4.5 Financial Impact of Stroke Admissions by Health Board, Wales 2016/17Back to Table of Contents
Resident Local Health Board
Hospital Spells
Provider Spells
Total Bed days
Total Costs (£000)
Hosp. LoS
Prov. LoS
Hosp. Cost (£)
Prov. Cost (£)
Abertawe Bro Morgannwg UHB 1,013 1,010 11,894 £5,470 11.7 11.8 £5,400 £5,416
Aneurin Bevan LHB 950 623 8,069 £3,844 8.5 13.0 £4,046 £6,170
Betsi Cadwaladr UHB 1,395 1,245 22,632 £9,046 16.2 18.2 £6,484 £7,266
Cardiff & Vale UHB 855 665 18,542 £6,452 21.7 27.9 £7,546 £9,702
Cwm Taf LHB 573 563 5,686 £2,945 9.9 10.1 £5,140 £5,231
Hywel Dda LHB 786 742 15,650 £7,229 19.9 21.1 £9,198 £9,743
Powys Teaching LHB 295 292 3,222 £1,704 10.9 11.0 £5,777 £5,836
Wales Total 5,867 5,140 85,695 £36,690 - - £43,591 £49,364Total Average 838 734 12,242 £5,241 14.1 16.2 £6,227 £7,052
Notes:
Source:
Cardiovascular Atlas of Variation, Public Health Wales NHS, 2019
http://www.wcn.wales.nhs.uk/caov
The above table shows the number of 'Hospital Spells' (Hosp) and 'Provider Spells' (Prov) and a comparison between average length of stay (LoS) and cost per spell.
The difference between the two calculations will have a greater impact for LHBs that transfer patients more between sites (perhaps where acute and rehab services aren't co-located).
The data includes spells for Welsh residents treated in England according to the information that has been received from NHS digital. English residents treated in Wales are not included here.

Table 4.6 Financial Impact of Heart Failure Admissions for patients with an Emergency Readmission within 30 days by Health Board, Wales 2016/17Back to Table of Contents
Heart Failure Spells within 16/17
Hospital Spells with
Readmission
Hospital Spells without
Readmission
Hospital Spells with
Readmission
Hospital Spells without
Readmission
Hospital Spells with
Readmission
Hospital Spells without
Readmission
Resident LHBHospital Spells with
ReadmissionHospital Spells
Readmission Rate
Aneurin Bevan 105 948 11.1 6.4 10.3 £2,453 £4,061 £258 £3,850Abertawe Bro Morgannwg 73 733 10.0 13.6 14.5 £4,989 £5,754 £364 £4,218Betsi Cadwaladr 96 956 10.0 10.6 11.7 £4,539 £4,951 £436 £4,733Cwm Taf 67 453 14.8 8.8 10.8 £3,980 £4,680 £267 £2,120Cardiff and Vale 74 556 13.3 8.3 13.6 £2,927 £4,567 £217 £2,539Hywel Dda 59 634 9.3 10.1 12.3 £4,323 £5,882 £255 £3,729Powys 16 208 7.7 7.8 12.0 £3,812 £5,905 £61 £1,228Grand Total 490 4,488 - - - £27,023 £35,800 £1,857 £22,417Total Average 70 641 10.9 9.4 12.1 £3,860 £5,114 £265 £3,202
Notes:
Source:
Cardiovascular Atlas of Variation, Public Health Wales NHS, 2019
http://www.wcn.wales.nhs.uk/caov
Total Cost per LHB (£000)Average LoS Average Spell Cost (£)
The above table compares the number of ‘Hospital Spells' where patients were admitted for heart failure and had an emergency readmission for any heart condition within 30 days of the discharge date.
"Costs per spell' are "fully absorbed" and as they include an element of fixed costs (e.g. estates, rates), semi fixed costs (most staff costs), and variable costs (e.g. drugs, prosthetics).
The data includes spells for Welsh residents treated in England according to the information that has been received from NHS digital. English residents treated in Wales are not included here.
This was against those that were admitted for heart failure and did not require a readmission. It also shows the total number of spells and the calculated readmission rate per resident cohort.
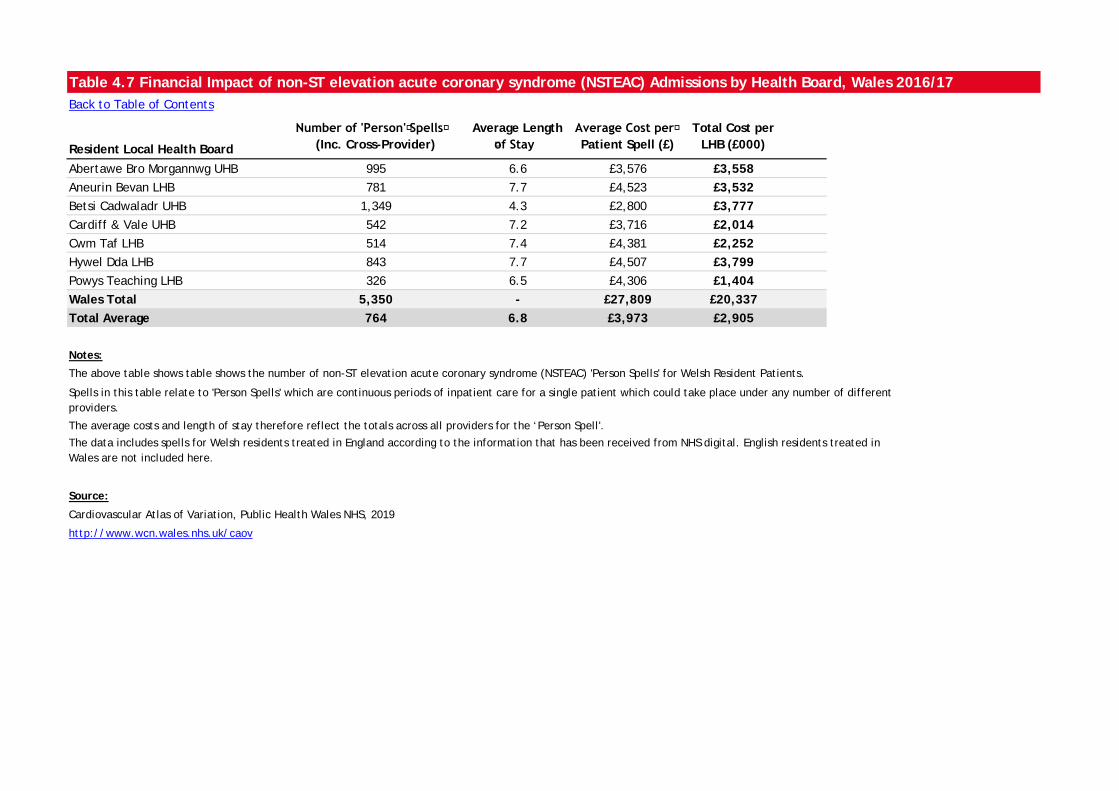
Table 4.7 Financial Impact of non-ST elevation acute coronary syndrome (NSTEAC) Admissions by Health Board, Wales 2016/17Back to Table of Contents
Resident Local Health Board
Number of 'Person' Spells (Inc. Cross-Provider)
Average Length of Stay
Average Cost per Patient Spell (£)
Total Cost per LHB (£000)
Abertawe Bro Morgannwg UHB 995 6.6 £3,576 £3,558Aneurin Bevan LHB 781 7.7 £4,523 £3,532Betsi Cadwaladr UHB 1,349 4.3 £2,800 £3,777Cardiff & Vale UHB 542 7.2 £3,716 £2,014Cwm Taf LHB 514 7.4 £4,381 £2,252Hywel Dda LHB 843 7.7 £4,507 £3,799Powys Teaching LHB 326 6.5 £4,306 £1,404Wales Total 5,350 - £27,809 £20,337Total Average 764 6.8 £3,973 £2,905
Notes:
Source:
Cardiovascular Atlas of Variation, Public Health Wales NHS, 2019
http://www.wcn.wales.nhs.uk/caov
The average costs and length of stay therefore reflect the totals across all providers for the ‘Person Spell'.
The above table shows table shows the number of non-ST elevation acute coronary syndrome (NSTEAC) 'Person Spells' for Welsh Resident Patients.
Spells in this table relate to 'Person Spells' which are continuous periods of inpatient care for a single patient which could take place under any number of different providers.
The data includes spells for Welsh residents treated in England according to the information that has been received from NHS digital. English residents treated in Wales are not included here.
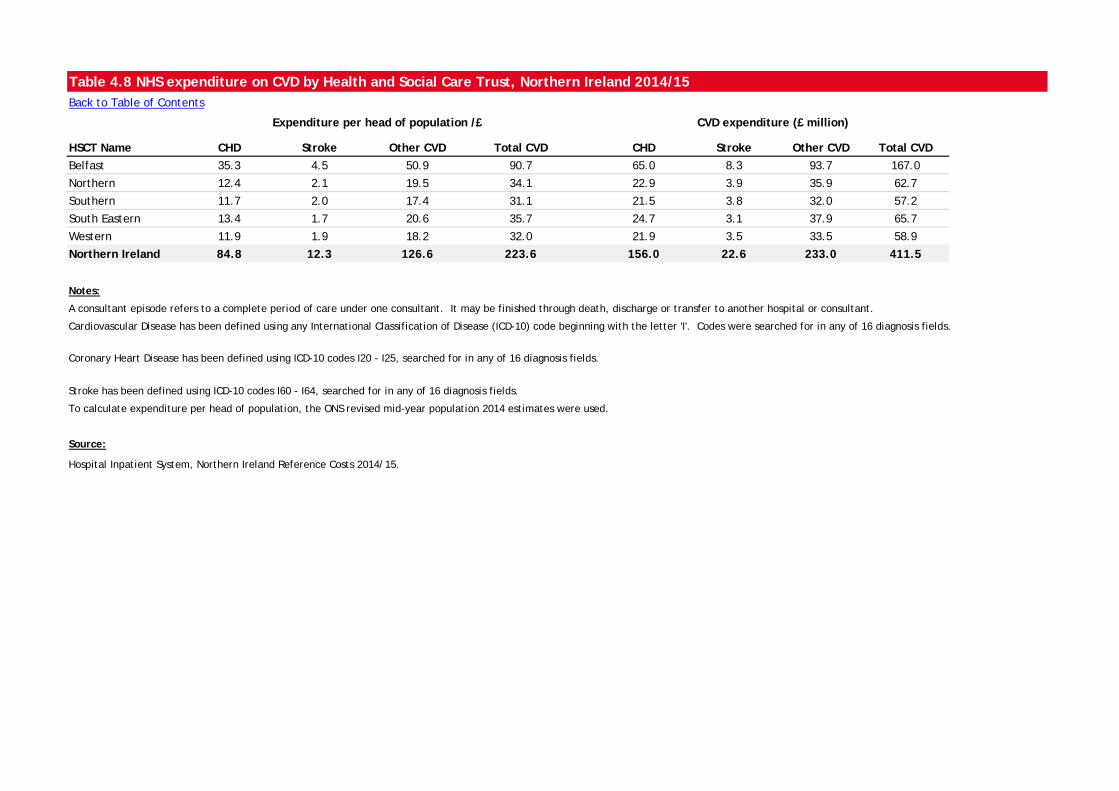
Table 4.8 NHS expenditure on CVD by Health and Social Care Trust, Northern Ireland 2014/15Back to Table of Contents
HSCT Name CHD Stroke Other CVD Total CVD CHD Stroke Other CVD Total CVDBelfast 35.3 4.5 50.9 90.7 65.0 8.3 93.7 167.0
Northern 12.4 2.1 19.5 34.1 22.9 3.9 35.9 62.7
Southern 11.7 2.0 17.4 31.1 21.5 3.8 32.0 57.2
South Eastern 13.4 1.7 20.6 35.7 24.7 3.1 37.9 65.7
Western 11.9 1.9 18.2 32.0 21.9 3.5 33.5 58.9
Northern Ireland 84.8 12.3 126.6 223.6 156.0 22.6 233.0 411.5
Notes:
A consultant episode refers to a complete period of care under one consultant. It may be finished through death, discharge or transfer to another hospital or consultant.
Cardiovascular Disease has been defined using any International Classification of Disease (ICD-10) code beginning with the letter 'I'. Codes were searched for in any of 16 diagnosis fields.
Coronary Heart Disease has been defined using ICD-10 codes I20 - I25, searched for in any of 16 diagnosis fields.
Stroke has been defined using ICD-10 codes I60 - I64, searched for in any of 16 diagnosis fields.
To calculate expenditure per head of population, the ONS revised mid-year population 2014 estimates were used.
Source:
Hospital Inpatient System, Northern Ireland Reference Costs 2014/15.
Expenditure per head of population /£ CVD expenditure (£ million)
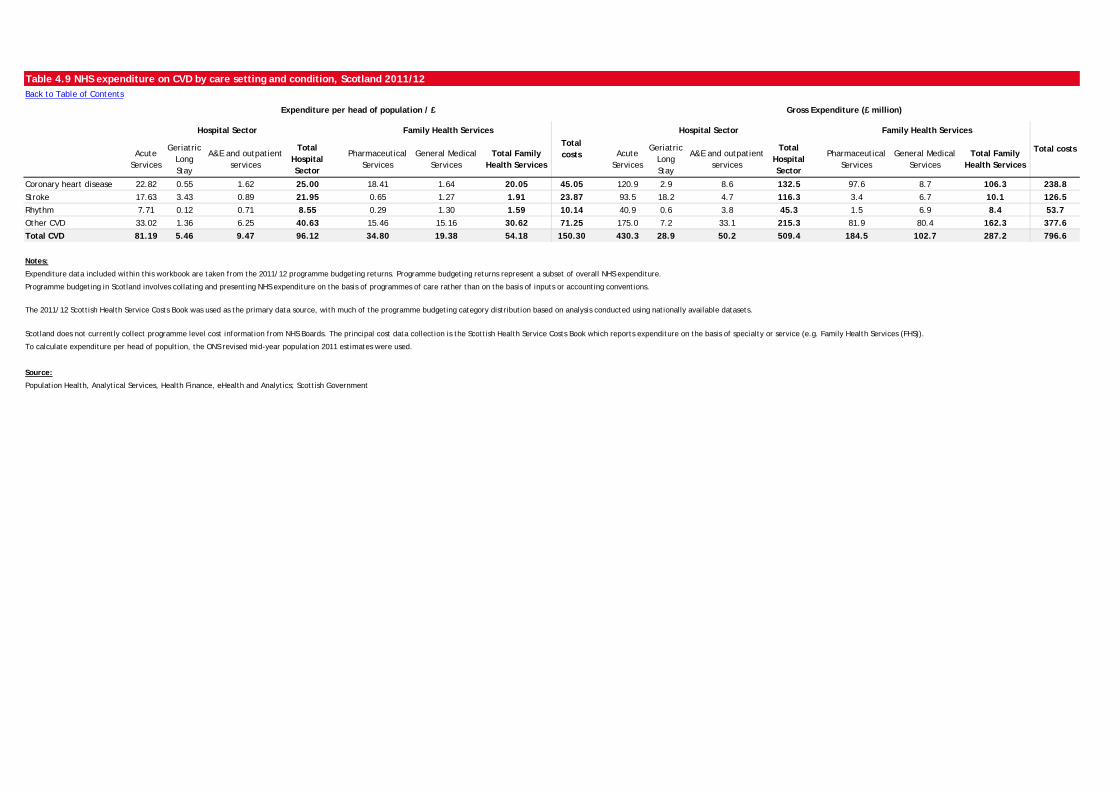
Table 4.9 NHS expenditure on CVD by care setting and condition, Scotland 2011/12 Back to Table of Contents
Acute Services
Geriatric Long Stay
A&E and outpatient services
Total Hospital Sector
Pharmaceutical Services
General Medical Services
Total Family Health Services
Acute Services
Geriatric Long Stay
A&E and outpatient services
Total Hospital Sector
Pharmaceutical Services
General Medical Services
Total Family Health Services
Coronary heart disease 22.82 0.55 1.62 25.00 18.41 1.64 20.05 45.05 120.9 2.9 8.6 132.5 97.6 8.7 106.3 238.8Stroke 17.63 3.43 0.89 21.95 0.65 1.27 1.91 23.87 93.5 18.2 4.7 116.3 3.4 6.7 10.1 126.5Rhythm 7.71 0.12 0.71 8.55 0.29 1.30 1.59 10.14 40.9 0.6 3.8 45.3 1.5 6.9 8.4 53.7Other CVD 33.02 1.36 6.25 40.63 15.46 15.16 30.62 71.25 175.0 7.2 33.1 215.3 81.9 80.4 162.3 377.6Total CVD 81.19 5.46 9.47 96.12 34.80 19.38 54.18 150.30 430.3 28.9 50.2 509.4 184.5 102.7 287.2 796.6
Notes:
Expenditure data included within this workbook are taken from the 2011/12 programme budgeting returns. Programme budgeting returns represent a subset of overall NHS expenditure.
Programme budgeting in Scotland involves collating and presenting NHS expenditure on the basis of programmes of care rather than on the basis of inputs or accounting conventions.
The 2011/12 Scottish Health Service Costs Book was used as the primary data source, with much of the programme budgeting category distribution based on analysis conducted using nationally available datasets.
Scotland does not currently collect programme level cost information from NHS Boards. The principal cost data collection is the Scottish Health Service Costs Book which reports expenditure on the basis of specialty or service (e.g. Family Health Services (FHS)).
To calculate expenditure per head of popultion, the ONS revised mid-year population 2011 estimates were used.
Source:
Population Health, Analytical Services, Health Finance, eHealth and Analytics; Scottish Government
Hospital Sector
Expenditure per head of population / £ Gross Expenditure (£ million)
Family Health Services
Total costs
Hospital SectorTotal costs
Family Health Services
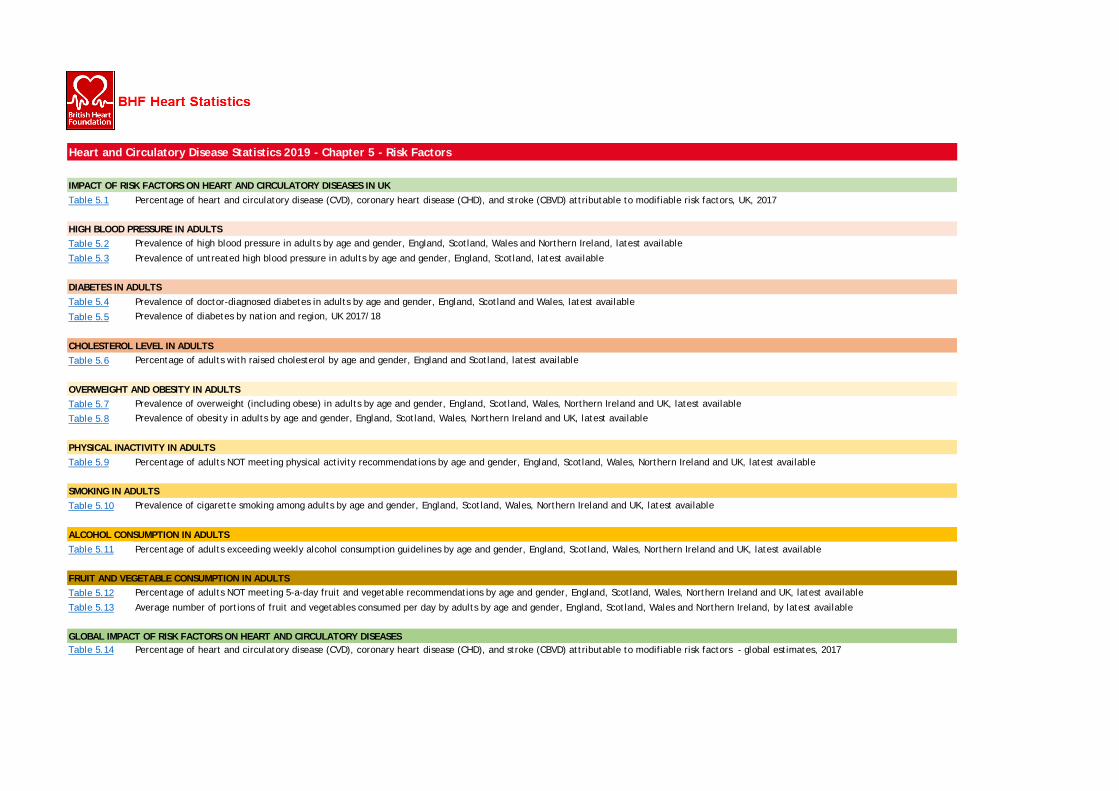
Heart and Circulatory Disease Statistics 2019 - Chapter 5 - Risk Factors
IMPACT OF RISK FACTORS ON HEART AND CIRCULATORY DISEASES IN UKTable 5.1 Percentage of heart and circulatory disease (CVD), coronary heart disease (CHD), and stroke (CBVD) attributable to modifiable risk factors, UK, 2017
HIGH BLOOD PRESSURE IN ADULTSTable 5.2 Prevalence of high blood pressure in adults by age and gender, England, Scotland, Wales and Northern Ireland, latest available
Table 5.3 Prevalence of untreated high blood pressure in adults by age and gender, England, Scotland, latest available
DIABETES IN ADULTSTable 5.4 Prevalence of doctor-diagnosed diabetes in adults by age and gender, England, Scotland and Wales, latest available
Table 5.5 Prevalence of diabetes by nation and region, UK 2017/18
CHOLESTEROL LEVEL IN ADULTSTable 5.6 Percentage of adults with raised cholesterol by age and gender, England and Scotland, latest available
OVERWEIGHT AND OBESITY IN ADULTSTable 5.7 Prevalence of overweight (including obese) in adults by age and gender, England, Scotland, Wales, Northern Ireland and UK, latest available
Table 5.8 Prevalence of obesity in adults by age and gender, England, Scotland, Wales, Northern Ireland and UK, latest available
PHYSICAL INACTIVITY IN ADULTSTable 5.9 Percentage of adults NOT meeting physical activity recommendations by age and gender, England, Scotland, Wales, Northern Ireland and UK, latest available
SMOKING IN ADULTSTable 5.10 Prevalence of cigarette smoking among adults by age and gender, England, Scotland, Wales, Northern Ireland and UK, latest available
ALCOHOL CONSUMPTION IN ADULTSTable 5.11 Percentage of adults exceeding weekly alcohol consumption guidelines by age and gender, England, Scotland, Wales, Northern Ireland and UK, latest available
FRUIT AND VEGETABLE CONSUMPTION IN ADULTSTable 5.12 Percentage of adults NOT meeting 5-a-day fruit and vegetable recommendations by age and gender, England, Scotland, Wales, Northern Ireland and UK, latest available
Table 5.13 Average number of portions of fruit and vegetables consumed per day by adults by age and gender, England, Scotland, Wales and Northern Ireland, by latest available
GLOBAL IMPACT OF RISK FACTORS ON HEART AND CIRCULATORY DISEASESTable 5.14 Percentage of heart and circulatory disease (CVD), coronary heart disease (CHD), and stroke (CBVD) attributable to modifiable risk factors - global estimates, 2017
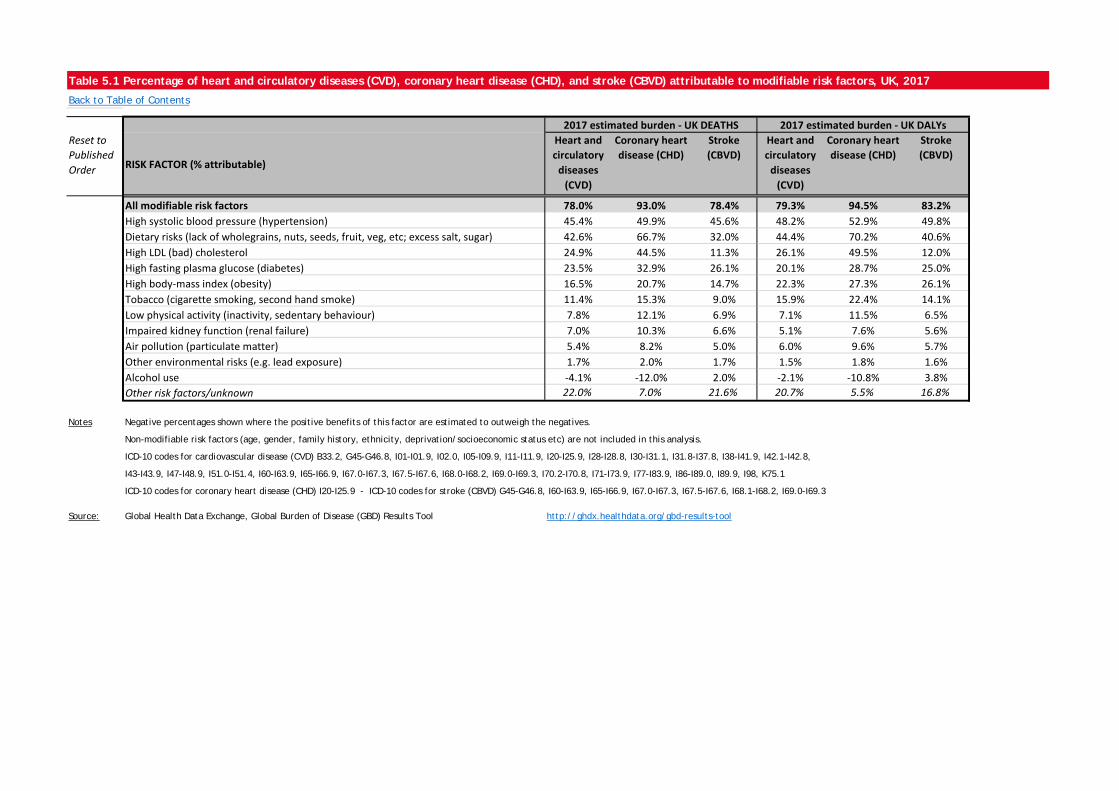
Table 5.1 Percentage of heart and circulatory diseases (CVD), coronary heart disease (CHD), and stroke (CBVD) attributable to modifiable risk factors, UK, 2017
Back to Table of Contents
Reset to Published Order RISK FACTOR (% attributable)
Heart and circulatory
diseases (CVD)
Coronary heart disease (CHD)
Stroke (CBVD)
Heart and circulatory
diseases (CVD)
Coronary heart disease (CHD)
Stroke (CBVD)
0 All modifiable risk factors 78.0% 93.0% 78.4% 79.3% 94.5% 83.2%1 High systolic blood pressure (hypertension) 45.4% 49.9% 45.6% 48.2% 52.9% 49.8%2 Dietary risks (lack of wholegrains, nuts, seeds, fruit, veg, etc; excess salt, sugar) 42.6% 66.7% 32.0% 44.4% 70.2% 40.6%3 High LDL (bad) cholesterol 24.9% 44.5% 11.3% 26.1% 49.5% 12.0%4 High fasting plasma glucose (diabetes) 23.5% 32.9% 26.1% 20.1% 28.7% 25.0%5 High body-mass index (obesity) 16.5% 20.7% 14.7% 22.3% 27.3% 26.1%6 Tobacco (cigarette smoking, second hand smoke) 11.4% 15.3% 9.0% 15.9% 22.4% 14.1%7 Low physical activity (inactivity, sedentary behaviour) 7.8% 12.1% 6.9% 7.1% 11.5% 6.5%8 Impaired kidney function (renal failure) 7.0% 10.3% 6.6% 5.1% 7.6% 5.6%9 Air pollution (particulate matter) 5.4% 8.2% 5.0% 6.0% 9.6% 5.7%
10 Other environmental risks (e.g. lead exposure) 1.7% 2.0% 1.7% 1.5% 1.8% 1.6%11 Alcohol use -4.1% -12.0% 2.0% -2.1% -10.8% 3.8%12 Other risk factors/unknown 22.0% 7.0% 21.6% 20.7% 5.5% 16.8%
Notes Negative percentages shown where the positive benefits of this factor are estimated to outweigh the negatives.
Non-modifiable risk factors (age, gender, family history, ethnicity, deprivation/socioeconomic status etc) are not included in this analysis.
ICD-10 codes for cardiovascular disease (CVD) B33.2, G45-G46.8, I01-I01.9, I02.0, I05-I09.9, I11-I11.9, I20-I25.9, I28-I28.8, I30-I31.1, I31.8-I37.8, I38-I41.9, I42.1-I42.8,
I43-I43.9, I47-I48.9, I51.0-I51.4, I60-I63.9, I65-I66.9, I67.0-I67.3, I67.5-I67.6, I68.0-I68.2, I69.0-I69.3, I70.2-I70.8, I71-I73.9, I77-I83.9, I86-I89.0, I89.9, I98, K75.1
ICD-10 codes for coronary heart disease (CHD) I20-I25.9 - ICD-10 codes for stroke (CBVD) G45-G46.8, I60-I63.9, I65-I66.9, I67.0-I67.3, I67.5-I67.6, I68.1-I68.2, I69.0-I69.3
Source: Global Health Data Exchange, Global Burden of Disease (GBD) Results Tool http://ghdx.healthdata.org/gbd-results-tool
2017 estimated burden - UK DEATHS 2017 estimated burden - UK DALYs
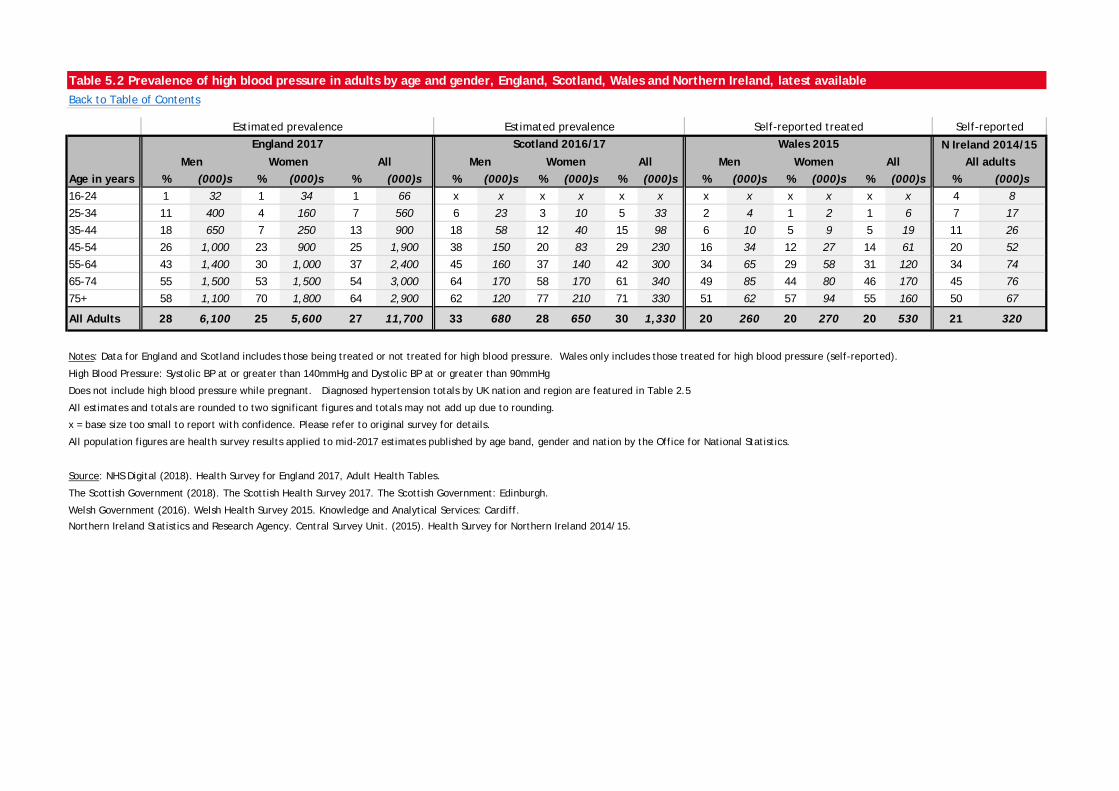
Table 5.2 Prevalence of high blood pressure in adults by age and gender, England, Scotland, Wales and Northern Ireland, latest availableBack to Table of Contents
Age in years % (000)s % (000)s % (000)s % (000)s % (000)s % (000)s % (000)s % (000)s % (000)s % (000)s16-24 1 32 1 34 1 66 x x x x x x x x x x x x 4 8
25-34 11 400 4 160 7 560 6 23 3 10 5 33 2 4 1 2 1 6 7 17
35-44 18 650 7 250 13 900 18 58 12 40 15 98 6 10 5 9 5 19 11 26
45-54 26 1,000 23 900 25 1,900 38 150 20 83 29 230 16 34 12 27 14 61 20 52
55-64 43 1,400 30 1,000 37 2,400 45 160 37 140 42 300 34 65 29 58 31 120 34 74
65-74 55 1,500 53 1,500 54 3,000 64 170 58 170 61 340 49 85 44 80 46 170 45 76
75+ 58 1,100 70 1,800 64 2,900 62 120 77 210 71 330 51 62 57 94 55 160 50 67
All Adults 28 6,100 25 5,600 27 11,700 33 680 28 650 30 1,330 20 260 20 270 20 530 21 320
Notes: Data for England and Scotland includes those being treated or not treated for high blood pressure. Wales only includes those treated for high blood pressure (self-reported).
High Blood Pressure: Systolic BP at or greater than 140mmHg and Dystolic BP at or greater than 90mmHg
Does not include high blood pressure while pregnant. Diagnosed hypertension totals by UK nation and region are featured in Table 2.5
All estimates and totals are rounded to two significant figures and totals may not add up due to rounding.
x = base size too small to report with confidence. Please refer to original survey for details.
All population figures are health survey results applied to mid-2017 estimates published by age band, gender and nation by the Office for National Statistics.
Source: NHS Digital (2018). Health Survey for England 2017, Adult Health Tables.
The Scottish Government (2018). The Scottish Health Survey 2017. The Scottish Government: Edinburgh.
Welsh Government (2016). Welsh Health Survey 2015. Knowledge and Analytical Services: Cardiff.
Northern Ireland Statistics and Research Agency. Central Survey Unit. (2015). Health Survey for Northern Ireland 2014/15.
All adultsN Ireland 2014/15
Men Women All Men Women AllMen Women All
Scotland 2016/17 Wales 2015Estimated prevalence Estimated prevalence Self-reported treated Self-reported
England 2017

Table 5.3 Prevalence of untreated high blood pressure in adults by age and gender, England, Scotland, latest availableBack to Table of Contents
Age in years % (000)s % (000)s % (000)s % (000)s % (000)s % (000)s16-24 - - 1 34 1 35 x x x x x x
25-34 9 340 4 160 6 490 5 19 1 2 3 21
35-44 13 460 4 150 8 600 17 55 9 32 13 87
45-54 16 610 13 520 14 1,100 22 86 10 41 16 130
55-64 19 600 14 470 17 1,100 19 65 21 76 20 140
65-74 16 410 21 600 18 1,000 26 71 28 84 27 160
75+ 14 270 18 470 16 740 33 61 27 72 30 130
All Adults 12 2,700 11 2,400 11 5,100 19 360 14 310 16 670
Notes: Hypertension diagnosed by nurse. Data weighted for non-response. NI/Wales surveys do not disclose.
Hypertensive untreated: Systolic BP at or greater than 140mmHg and Dystolic BP at or greater than 90mmHg, not currently taking medication for blood pressure.
All estimates and totals are rounded to two significant figures and may not add up due to rounding.
x = base size too small to report with confidence. Please refer to original survey for details.
All population figures are health survey results applied to mid-2017 estimates published by age band, gender and nation by the Office for National Statistics.
Source: NHS Digital (2018). Health Survey for England 2017, Adult Health Tables.
The Scottish Government (2018). The Scottish Health Survey 2017. The Scottish Government: Edinburgh.
England 2017Men Women All
Scotland 2016/17AllWomenMen
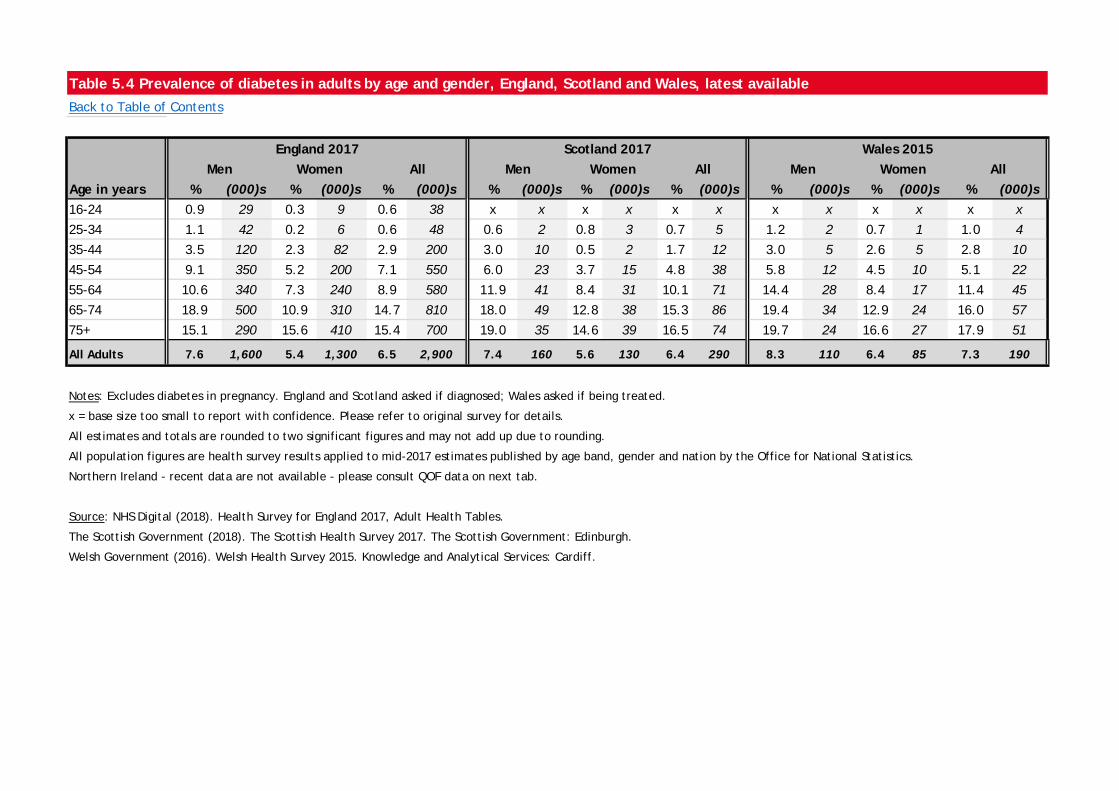
Table 5.4 Prevalence of diabetes in adults by age and gender, England, Scotland and Wales, latest availableBack to Table of Contents
Age in years % (000)s % (000)s % (000)s % (000)s % (000)s % (000)s % (000)s % (000)s % (000)s16-24 0.9 29 0.3 9 0.6 38 x x x x x x x x x x x x
25-34 1.1 42 0.2 6 0.6 48 0.6 2 0.8 3 0.7 5 1.2 2 0.7 1 1.0 4
35-44 3.5 120 2.3 82 2.9 200 3.0 10 0.5 2 1.7 12 3.0 5 2.6 5 2.8 10
45-54 9.1 350 5.2 200 7.1 550 6.0 23 3.7 15 4.8 38 5.8 12 4.5 10 5.1 22
55-64 10.6 340 7.3 240 8.9 580 11.9 41 8.4 31 10.1 71 14.4 28 8.4 17 11.4 45
65-74 18.9 500 10.9 310 14.7 810 18.0 49 12.8 38 15.3 86 19.4 34 12.9 24 16.0 57
75+ 15.1 290 15.6 410 15.4 700 19.0 35 14.6 39 16.5 74 19.7 24 16.6 27 17.9 51
All Adults 7.6 1,600 5.4 1,300 6.5 2,900 7.4 160 5.6 130 6.4 290 8.3 110 6.4 85 7.3 190
Notes: Excludes diabetes in pregnancy. England and Scotland asked if diagnosed; Wales asked if being treated.
x = base size too small to report with confidence. Please refer to original survey for details.
All estimates and totals are rounded to two significant figures and may not add up due to rounding.
All population figures are health survey results applied to mid-2017 estimates published by age band, gender and nation by the Office for National Statistics.
Northern Ireland - recent data are not available - please consult QOF data on next tab.
Source: NHS Digital (2018). Health Survey for England 2017, Adult Health Tables.
The Scottish Government (2018). The Scottish Health Survey 2017. The Scottish Government: Edinburgh.
Welsh Government (2016). Welsh Health Survey 2015. Knowledge and Analytical Services: Cardiff.
Wales 2015Men Women All
England 2017 Scotland 2017Men Women All Men Women All
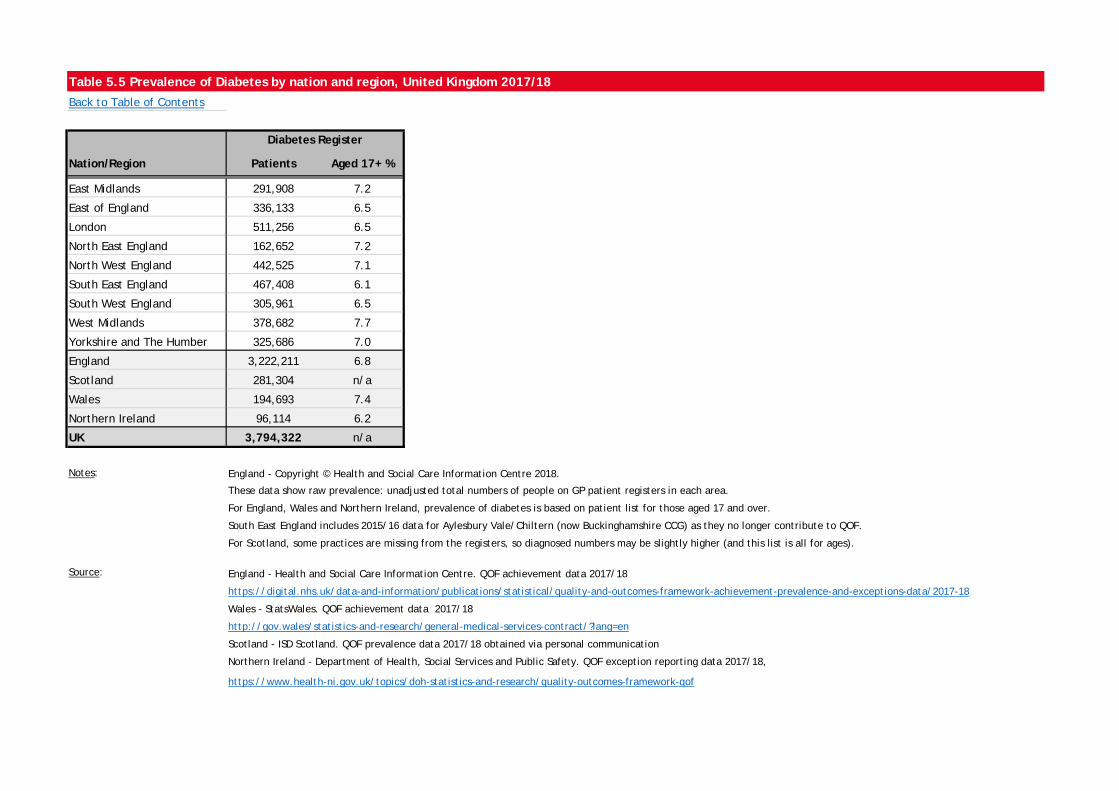
Table 5.5 Prevalence of Diabetes by nation and region, United Kingdom 2017/18Back to Table of Contents Diabetes Diabetes
Nation/Region Patients Aged 17+ %
East Midlands 291,908 7.2
East of England 336,133 6.5
London 511,256 6.5
North East England 162,652 7.2
North West England 442,525 7.1
South East England 467,408 6.1
South West England 305,961 6.5
West Midlands 378,682 7.7
Yorkshire and The Humber 325,686 7.0
England 3,222,211 6.8
Scotland 281,304 n/a
Wales 194,693 7.4
Northern Ireland 96,114 6.2
UK 3,794,322 n/a
Notes: England - Copyright © Health and Social Care Information Centre 2018.
These data show raw prevalence: unadjusted total numbers of people on GP patient registers in each area.
For England, Wales and Northern Ireland, prevalence of diabetes is based on patient list for those aged 17 and over.
South East England includes 2015/16 data for Aylesbury Vale/Chiltern (now Buckinghamshire CCG) as they no longer contribute to QOF.
For Scotland, some practices are missing from the registers, so diagnosed numbers may be slightly higher (and this list is all for ages).
Source: England - Health and Social Care Information Centre. QOF achievement data 2017/18
https://digital.nhs.uk/data-and-information/publications/statistical/quality-and-outcomes-framework-achievement-prevalence-and-exceptions-data/2017-18
Wales - StatsWales. QOF achievement data 2017/18
http://gov.wales/statistics-and-research/general-medical-services-contract/?lang=en
Scotland - ISD Scotland. QOF prevalence data 2017/18 obtained via personal communication
Northern Ireland - Department of Health, Social Services and Public Safety. QOF exception reporting data 2017/18,
https://www.health-ni.gov.uk/topics/doh-statistics-and-research/quality-outcomes-framework-qof
Diabetes Register
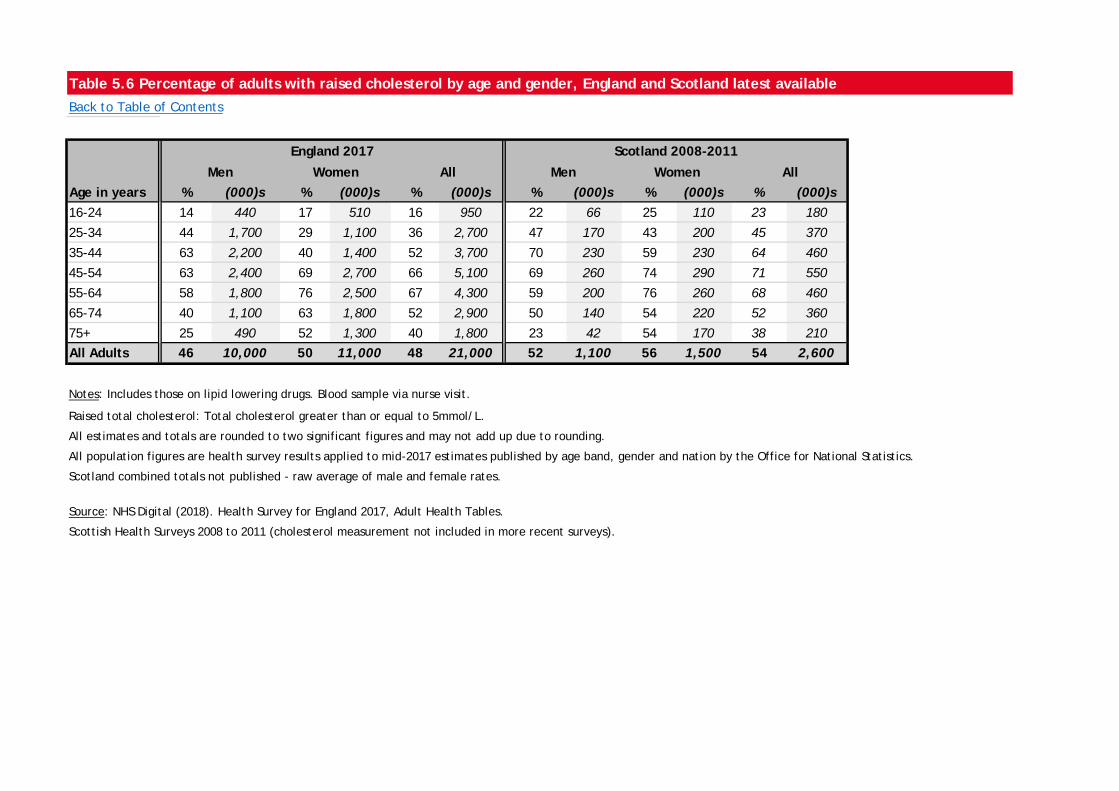
Table 5.6 Percentage of adults with raised cholesterol by age and gender, England and Scotland latest availableBack to Table of Contents
Age in years % (000)s % (000)s % (000)s % (000)s % (000)s % (000)s16-24 14 440 17 510 16 950 22 66 25 110 23 180
25-34 44 1,700 29 1,100 36 2,700 47 170 43 200 45 370
35-44 63 2,200 40 1,400 52 3,700 70 230 59 230 64 460
45-54 63 2,400 69 2,700 66 5,100 69 260 74 290 71 550
55-64 58 1,800 76 2,500 67 4,300 59 200 76 260 68 460
65-74 40 1,100 63 1,800 52 2,900 50 140 54 220 52 360
75+ 25 490 52 1,300 40 1,800 23 42 54 170 38 210All Adults 46 10,000 50 11,000 48 21,000 52 1,100 56 1,500 54 2,600
Notes: Includes those on lipid lowering drugs. Blood sample via nurse visit.
Raised total cholesterol: Total cholesterol greater than or equal to 5mmol/L.
All estimates and totals are rounded to two significant figures and may not add up due to rounding.
All population figures are health survey results applied to mid-2017 estimates published by age band, gender and nation by the Office for National Statistics.
Scotland combined totals not published - raw average of male and female rates.
Source: NHS Digital (2018). Health Survey for England 2017, Adult Health Tables.
Scottish Health Surveys 2008 to 2011 (cholesterol measurement not included in more recent surveys).
Scotland 2008-2011England 2017
Men Women All Men Women All
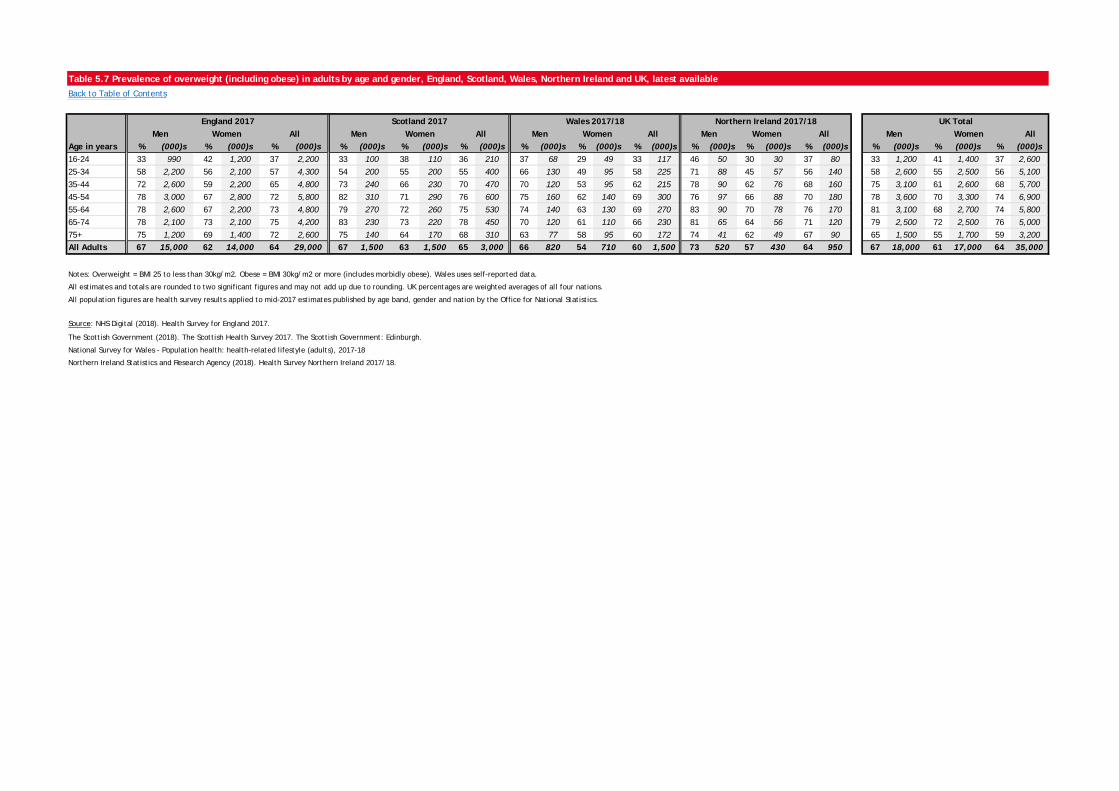
Table 5.7 Prevalence of overweight (including obese) in adults by age and gender, England, Scotland, Wales, Northern Ireland and UK, latest availableBack to Table of Contents
Women AllAge in years % (000)s % (000)s % (000)s % (000)s % (000)s % (000)s % (000)s % (000)s % (000)s % (000)s % (000)s % (000)s % (000)s % (000)s % (000)s16-24 33 990 42 1,200 37 2,200 33 100 38 110 36 210 37 68 29 49 33 117 46 50 30 30 37 80 33 1,200 41 1,400 37 2,60025-34 58 2,200 56 2,100 57 4,300 54 200 55 200 55 400 66 130 49 95 58 225 71 88 45 57 56 140 58 2,600 55 2,500 56 5,10035-44 72 2,600 59 2,200 65 4,800 73 240 66 230 70 470 70 120 53 95 62 215 78 90 62 76 68 160 75 3,100 61 2,600 68 5,70045-54 78 3,000 67 2,800 72 5,800 82 310 71 290 76 600 75 160 62 140 69 300 76 97 66 88 70 180 78 3,600 70 3,300 74 6,90055-64 78 2,600 67 2,200 73 4,800 79 270 72 260 75 530 74 140 63 130 69 270 83 90 70 78 76 170 81 3,100 68 2,700 74 5,80065-74 78 2,100 73 2,100 75 4,200 83 230 73 220 78 450 70 120 61 110 66 230 81 65 64 56 71 120 79 2,500 72 2,500 76 5,00075+ 75 1,200 69 1,400 72 2,600 75 140 64 170 68 310 63 77 58 95 60 172 74 41 62 49 67 90 65 1,500 55 1,700 59 3,200All Adults 67 15,000 62 14,000 64 29,000 67 1,500 63 1,500 65 3,000 66 820 54 710 60 1,500 73 520 57 430 64 950 67 18,000 61 17,000 64 35,000
Notes: Overweight = BMI 25 to less than 30kg/m2. Obese = BMI 30kg/m2 or more (includes morbidly obese). Wales uses self-reported data.
All estimates and totals are rounded to two significant figures and may not add up due to rounding. UK percentages are weighted averages of all four nations.
All population figures are health survey results applied to mid-2017 estimates published by age band, gender and nation by the Office for National Statistics.
Source: NHS Digital (2018). Health Survey for England 2017.
The Scottish Government (2018). The Scottish Health Survey 2017. The Scottish Government: Edinburgh.
National Survey for Wales - Population health: health-related lifestyle (adults), 2017-18
Northern Ireland Statistics and Research Agency (2018). Health Survey Northern Ireland 2017/18.
UK TotalMenMen Women All Men Women All Men Women All
Scotland 2017 Wales 2017/18 Northern Ireland 2017/18Men Women All
England 2017
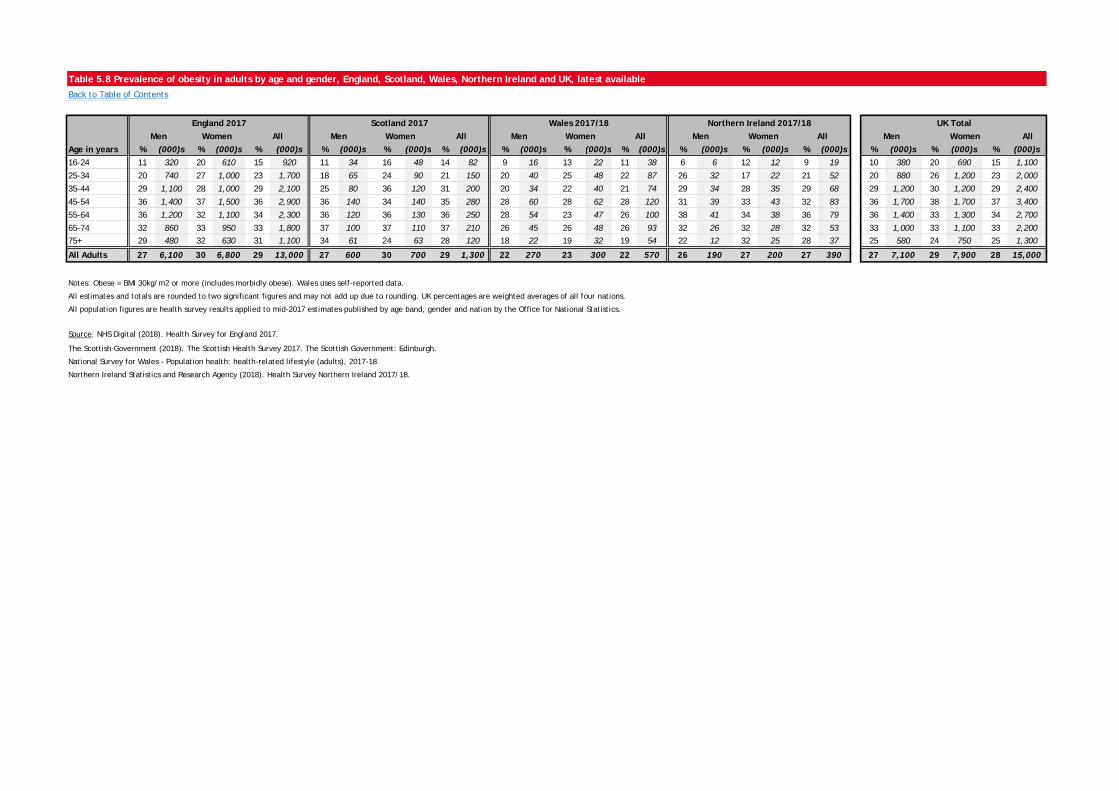
Table 5.8 Prevalence of obesity in adults by age and gender, England, Scotland, Wales, Northern Ireland and UK, latest available
Back to Table of Contents
Women AllAge in years % (000)s % (000)s % (000)s % (000)s % (000)s % (000)s % (000)s % (000)s % (000)s % (000)s % (000)s % (000)s % (000)s % (000)s % (000)s16-24 11 320 20 610 15 920 11 34 16 48 14 82 9 16 13 22 11 38 6 6 12 12 9 19 10 380 20 690 15 1,100
25-34 20 740 27 1,000 23 1,700 18 65 24 90 21 150 20 40 25 48 22 87 26 32 17 22 21 52 20 880 26 1,200 23 2,000
35-44 29 1,100 28 1,000 29 2,100 25 80 36 120 31 200 20 34 22 40 21 74 29 34 28 35 29 68 29 1,200 30 1,200 29 2,400
45-54 36 1,400 37 1,500 36 2,900 36 140 34 140 35 280 28 60 28 62 28 120 31 39 33 43 32 83 36 1,700 38 1,700 37 3,400
55-64 36 1,200 32 1,100 34 2,300 36 120 36 130 36 250 28 54 23 47 26 100 38 41 34 38 36 79 36 1,400 33 1,300 34 2,700
65-74 32 860 33 950 33 1,800 37 100 37 110 37 210 26 45 26 48 26 93 32 26 32 28 32 53 33 1,000 33 1,100 33 2,20075+ 29 480 32 630 31 1,100 34 61 24 63 28 120 18 22 19 32 19 54 22 12 32 25 28 37 25 580 24 750 25 1,300
All Adults 27 6,100 30 6,800 29 13,000 27 600 30 700 29 1,300 22 270 23 300 22 570 26 190 27 200 27 390 27 7,100 29 7,900 28 15,000
Notes: Obese = BMI 30kg/m2 or more (includes morbidly obese). Wales uses self-reported data.
All estimates and totals are rounded to two significant figures and may not add up due to rounding. UK percentages are weighted averages of all four nations.
All population figures are health survey results applied to mid-2017 estimates published by age band, gender and nation by the Office for National Statistics.
Source: NHS Digital (2018). Health Survey for England 2017.
The Scottish Government (2018). The Scottish Health Survey 2017. The Scottish Government: Edinburgh.
National Survey for Wales - Population health: health-related lifestyle (adults), 2017-18
Northern Ireland Statistics and Research Agency (2018). Health Survey Northern Ireland 2017/18.
Men Women AllEngland 2017
MenScotland 2017
Women All Men Women AllWales 2017/18 Northern Ireland 2017/18 UK Total
MenMen Women All
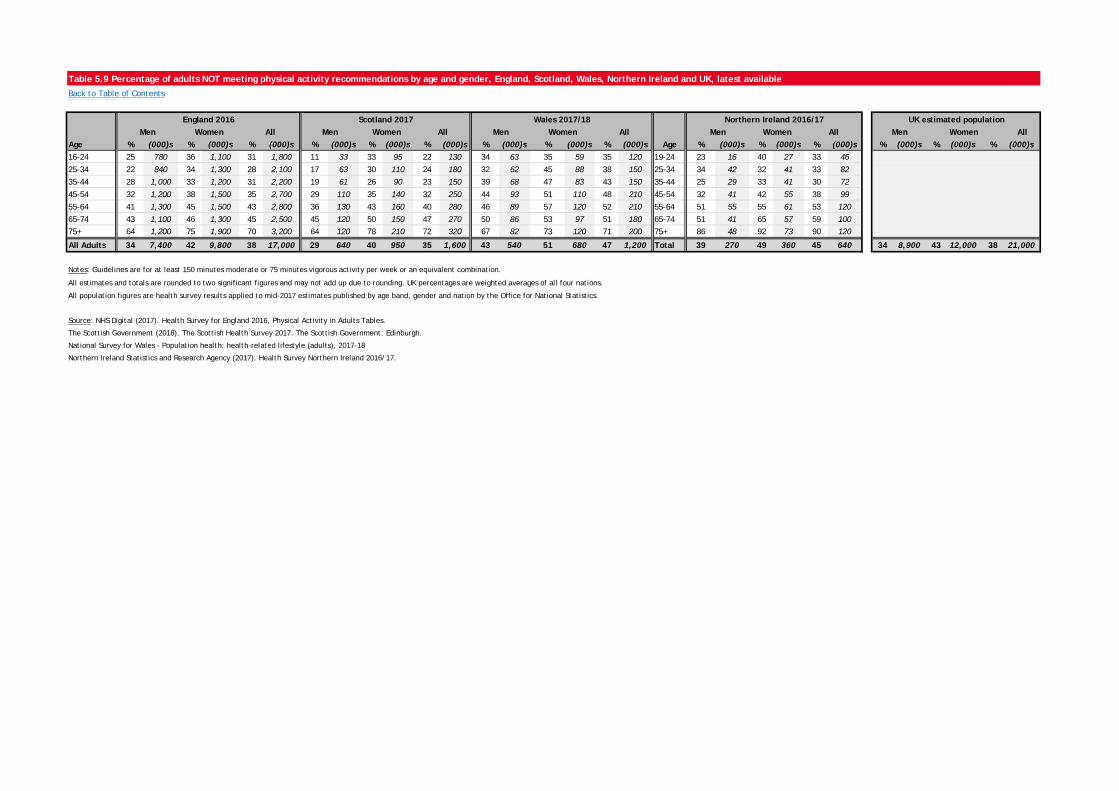
Table 5.9 Percentage of adults NOT meeting physical activity recommendations by age and gender, England, Scotland, Wales, Northern Ireland and UK, latest availableBack to Table of Contents
Women AllAge % (000)s % (000)s % (000)s % (000)s % (000)s % (000)s % (000)s % (000)s % (000)s Age % (000)s % (000)s % (000)s % (000)s % (000)s % (000)s16-24 25 780 36 1,100 31 1,800 11 33 33 95 22 130 34 63 35 59 35 120 19-24 23 16 40 27 33 4625-34 22 840 34 1,300 28 2,100 17 63 30 110 24 180 32 62 45 88 38 150 25-34 34 42 32 41 33 8235-44 28 1,000 33 1,200 31 2,200 19 61 26 90 23 150 39 68 47 83 43 150 35-44 25 29 33 41 30 7245-54 32 1,200 38 1,500 35 2,700 29 110 35 140 32 250 44 93 51 110 48 210 45-54 32 41 42 55 38 9955-64 41 1,300 45 1,500 43 2,800 36 130 43 160 40 280 46 89 57 120 52 210 55-64 51 55 55 61 53 12065-74 43 1,100 46 1,300 45 2,500 45 120 50 150 47 270 50 86 53 97 51 180 65-74 51 41 65 57 59 10075+ 64 1,200 75 1,900 70 3,200 64 120 78 210 72 320 67 82 73 120 71 200 75+ 86 48 92 73 90 120
All Adults 34 7,400 42 9,800 38 17,000 29 640 40 950 35 1,600 43 540 51 680 47 1,200 Total 39 270 49 360 45 640 34 8,900 43 12,000 38 21,000
Notes: Guidelines are for at least 150 minutes moderate or 75 minutes vigorous activity per week or an equivalent combination.
All estimates and totals are rounded to two significant figures and may not add up due to rounding. UK percentages are weighted averages of all four nations.
All population figures are health survey results applied to mid-2017 estimates published by age band, gender and nation by the Office for National Statistics.
Source: NHS Digital (2017). Health Survey for England 2016, Physical Activity in Adults Tables.
The Scottish Government (2018). The Scottish Health Survey 2017. The Scottish Government: Edinburgh.
National Survey for Wales - Population health: health-related lifestyle (adults), 2017-18
Northern Ireland Statistics and Research Agency (2017). Health Survey Northern Ireland 2016/17.
UK estimated populationMenWomen All
Scotland 2017 Wales 2017/18Men Women All Men Women All
Northern Ireland 2016/17Men Women All
England 2016Men
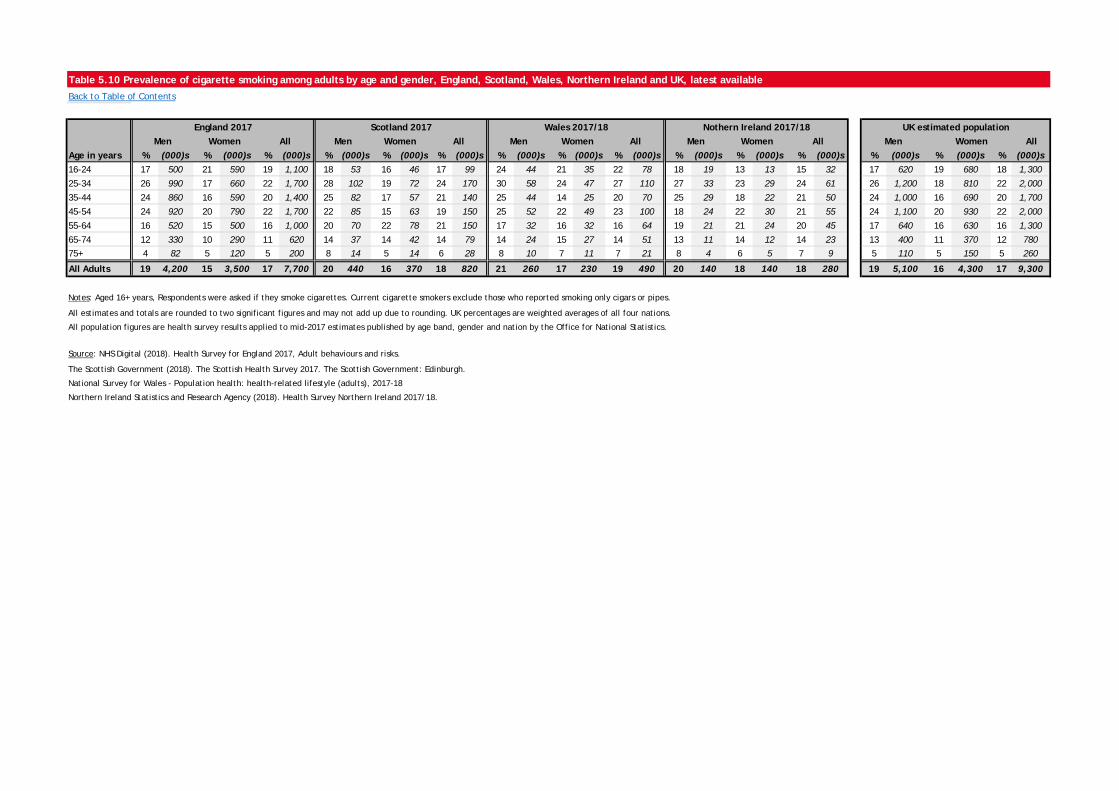
Table 5.10 Prevalence of cigarette smoking among adults by age and gender, England, Scotland, Wales, Northern Ireland and UK, latest available
Back to Table of Contents
Women AllAge in years % (000)s % (000)s % (000)s % (000)s % (000)s % (000)s % (000)s % (000)s % (000)s % (000)s % (000)s % (000)s % (000)s % (000)s % (000)s16-24 17 500 21 590 19 1,100 18 53 16 46 17 99 24 44 21 35 22 78 18 19 13 13 15 32 17 620 19 680 18 1,300
25-34 26 990 17 660 22 1,700 28 102 19 72 24 170 30 58 24 47 27 110 27 33 23 29 24 61 26 1,200 18 810 22 2,000
35-44 24 860 16 590 20 1,400 25 82 17 57 21 140 25 44 14 25 20 70 25 29 18 22 21 50 24 1,000 16 690 20 1,700
45-54 24 920 20 790 22 1,700 22 85 15 63 19 150 25 52 22 49 23 100 18 24 22 30 21 55 24 1,100 20 930 22 2,000
55-64 16 520 15 500 16 1,000 20 70 22 78 21 150 17 32 16 32 16 64 19 21 21 24 20 45 17 640 16 630 16 1,300
65-74 12 330 10 290 11 620 14 37 14 42 14 79 14 24 15 27 14 51 13 11 14 12 14 23 13 400 11 370 12 78075+ 4 82 5 120 5 200 8 14 5 14 6 28 8 10 7 11 7 21 8 4 6 5 7 9 5 110 5 150 5 260
All Adults 19 4,200 15 3,500 17 7,700 20 440 16 370 18 820 21 260 17 230 19 490 20 140 18 140 18 280 19 5,100 16 4,300 17 9,300
Notes: Aged 16+ years, Respondents were asked if they smoke cigarettes. Current cigarette smokers exclude those who reported smoking only cigars or pipes.
All estimates and totals are rounded to two significant figures and may not add up due to rounding. UK percentages are weighted averages of all four nations.
All population figures are health survey results applied to mid-2017 estimates published by age band, gender and nation by the Office for National Statistics.
Source: NHS Digital (2018). Health Survey for England 2017, Adult behaviours and risks.
The Scottish Government (2018). The Scottish Health Survey 2017. The Scottish Government: Edinburgh.
National Survey for Wales - Population health: health-related lifestyle (adults), 2017-18
Northern Ireland Statistics and Research Agency (2018). Health Survey Northern Ireland 2017/18.
England 2017Men Women All
Scotland 2017Men Women All
UK estimated populationMenMen Women
Wales 2017/18 Nothern Ireland 2017/18AllWomenAll Men
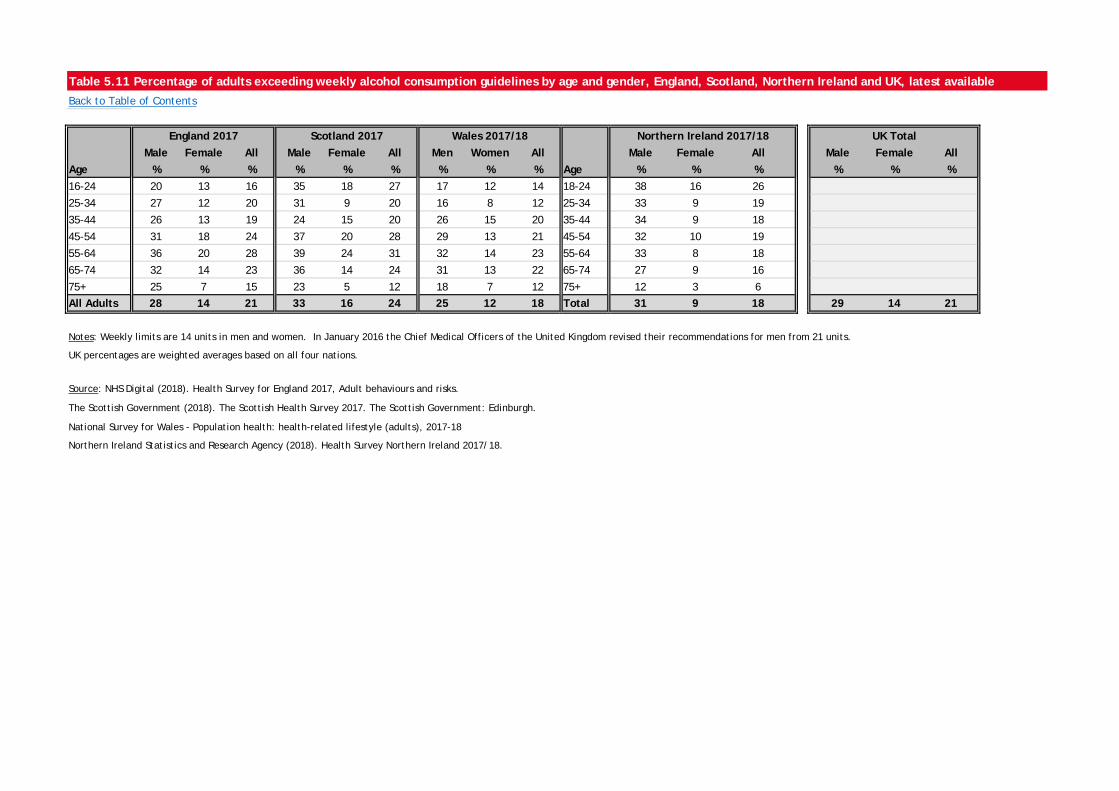
Table 5.11 Percentage of adults exceeding weekly alcohol consumption guidelines by age and gender, England, Scotland, Northern Ireland and UK, latest available
Back to Table of Contents
Male Female All Male Female All Men Women All Male Female All Male Female AllAge % % % % % % % % % Age % % % % % %16-24 20 13 16 35 18 27 17 12 14 18-24 38 16 26
25-34 27 12 20 31 9 20 16 8 12 25-34 33 9 19
35-44 26 13 19 24 15 20 26 15 20 35-44 34 9 18
45-54 31 18 24 37 20 28 29 13 21 45-54 32 10 19
55-64 36 20 28 39 24 31 32 14 23 55-64 33 8 18
65-74 32 14 23 36 14 24 31 13 22 65-74 27 9 16
75+ 25 7 15 23 5 12 18 7 12 75+ 12 3 6All Adults 28 14 21 33 16 24 25 12 18 Total 31 9 18 29 14 21
Notes: Weekly limits are 14 units in men and women. In January 2016 the Chief Medical Officers of the United Kingdom revised their recommendations for men from 21 units.
UK percentages are weighted averages based on all four nations.
Source: NHS Digital (2018). Health Survey for England 2017, Adult behaviours and risks.
The Scottish Government (2018). The Scottish Health Survey 2017. The Scottish Government: Edinburgh.
National Survey for Wales - Population health: health-related lifestyle (adults), 2017-18
Northern Ireland Statistics and Research Agency (2018). Health Survey Northern Ireland 2017/18.
England 2017 Wales 2017/18Scotland 2017 Northern Ireland 2017/18 UK Total
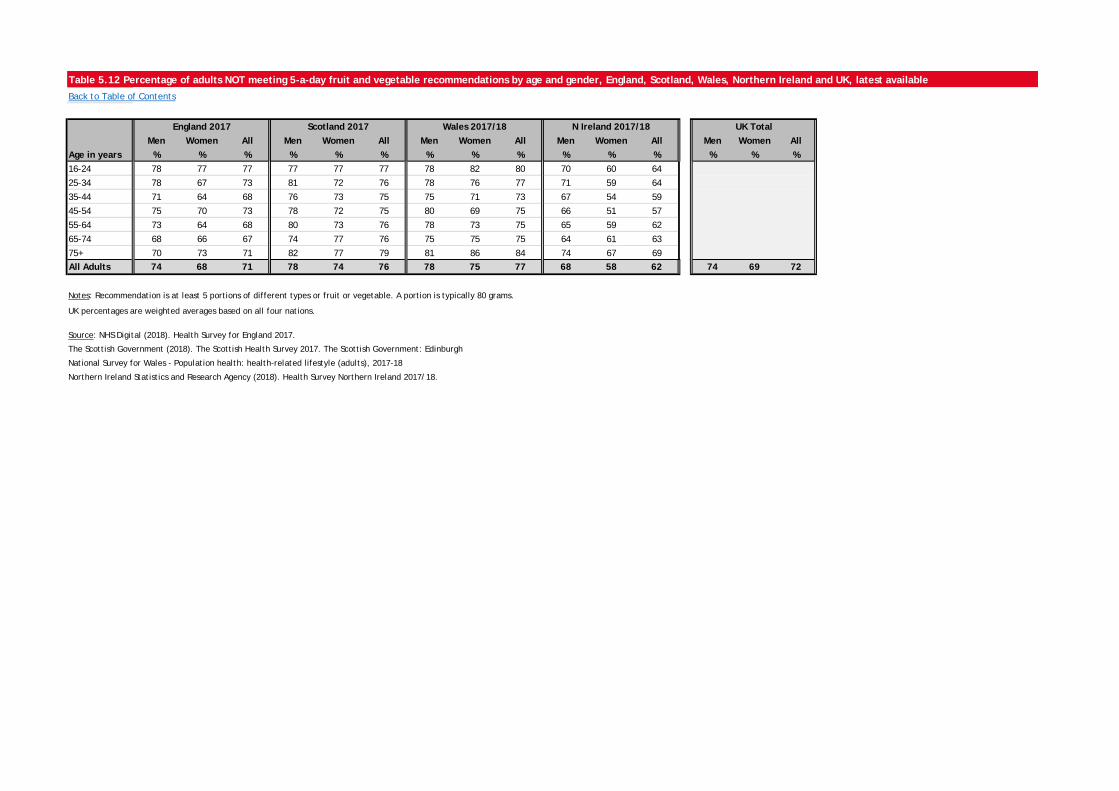
Table 5.12 Percentage of adults NOT meeting 5-a-day fruit and vegetable recommendations by age and gender, England, Scotland, Wales, Northern Ireland and UK, latest available
Back to Table of Contents
Men Women All Men Women All Men Women All Men Women All Men Women AllAge in years % % % % % % % % % % % % % % %16-24 78 77 77 77 77 77 78 82 80 70 60 64
25-34 78 67 73 81 72 76 78 76 77 71 59 64
35-44 71 64 68 76 73 75 75 71 73 67 54 59
45-54 75 70 73 78 72 75 80 69 75 66 51 57
55-64 73 64 68 80 73 76 78 73 75 65 59 62
65-74 68 66 67 74 77 76 75 75 75 64 61 63
75+ 70 73 71 82 77 79 81 86 84 74 67 69All Adults 74 68 71 78 74 76 78 75 77 68 58 62 74 69 72
Notes: Recommendation is at least 5 portions of different types or fruit or vegetable. A portion is typically 80 grams.
UK percentages are weighted averages based on all four nations.
Source: NHS Digital (2018). Health Survey for England 2017.
The Scottish Government (2018). The Scottish Health Survey 2017. The Scottish Government: Edinburgh
National Survey for Wales - Population health: health-related lifestyle (adults), 2017-18
Northern Ireland Statistics and Research Agency (2018). Health Survey Northern Ireland 2017/18.
England 2017 Scotland 2017 Wales 2017/18 N Ireland 2017/18 UK Total
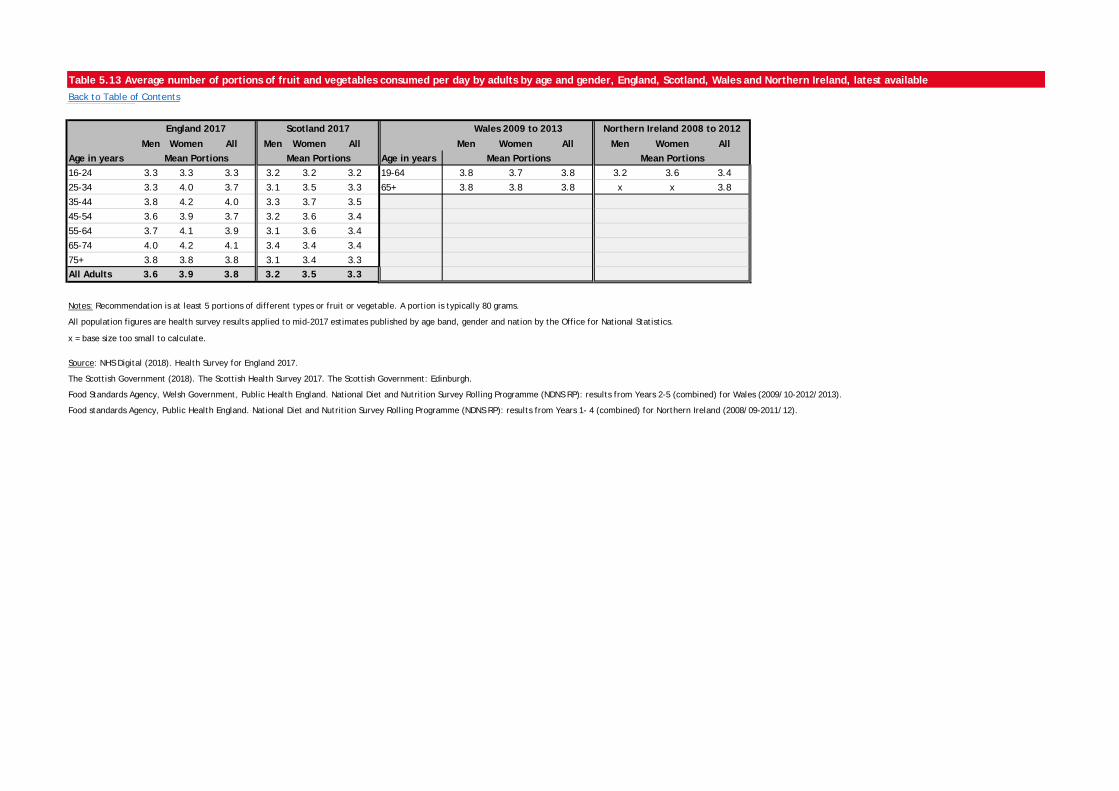
Table 5.13 Average number of portions of fruit and vegetables consumed per day by adults by age and gender, England, Scotland, Wales and Northern Ireland, latest availableBack to Table of Contents
Men Women All Men Women All Men Women All Men Women AllAge in years Age in years16-24 3.3 3.3 3.3 3.2 3.2 3.2 19-64 3.8 3.7 3.8 3.2 3.6 3.4
25-34 3.3 4.0 3.7 3.1 3.5 3.3 65+ 3.8 3.8 3.8 x x 3.8
35-44 3.8 4.2 4.0 3.3 3.7 3.5
45-54 3.6 3.9 3.7 3.2 3.6 3.4
55-64 3.7 4.1 3.9 3.1 3.6 3.4
65-74 4.0 4.2 4.1 3.4 3.4 3.4
75+ 3.8 3.8 3.8 3.1 3.4 3.3All Adults 3.6 3.9 3.8 3.2 3.5 3.3
Notes: Recommendation is at least 5 portions of different types or fruit or vegetable. A portion is typically 80 grams.
All population figures are health survey results applied to mid-2017 estimates published by age band, gender and nation by the Office for National Statistics.
x = base size too small to calculate.
Source: NHS Digital (2018). Health Survey for England 2017.
The Scottish Government (2018). The Scottish Health Survey 2017. The Scottish Government: Edinburgh.
Food Standards Agency, Welsh Government, Public Health England. National Diet and Nutrition Survey Rolling Programme (NDNS RP): results from Years 2-5 (combined) for Wales (2009/10-2012/2013).
Food standards Agency, Public Health England. National Diet and Nutrition Survey Rolling Programme (NDNS RP): results from Years 1- 4 (combined) for Northern Ireland (2008/09-2011/12).
Mean PortionsMean Portions Mean Portions
Scotland 2017England 2017
Mean Portions
Northern Ireland 2008 to 2012Wales 2009 to 2013
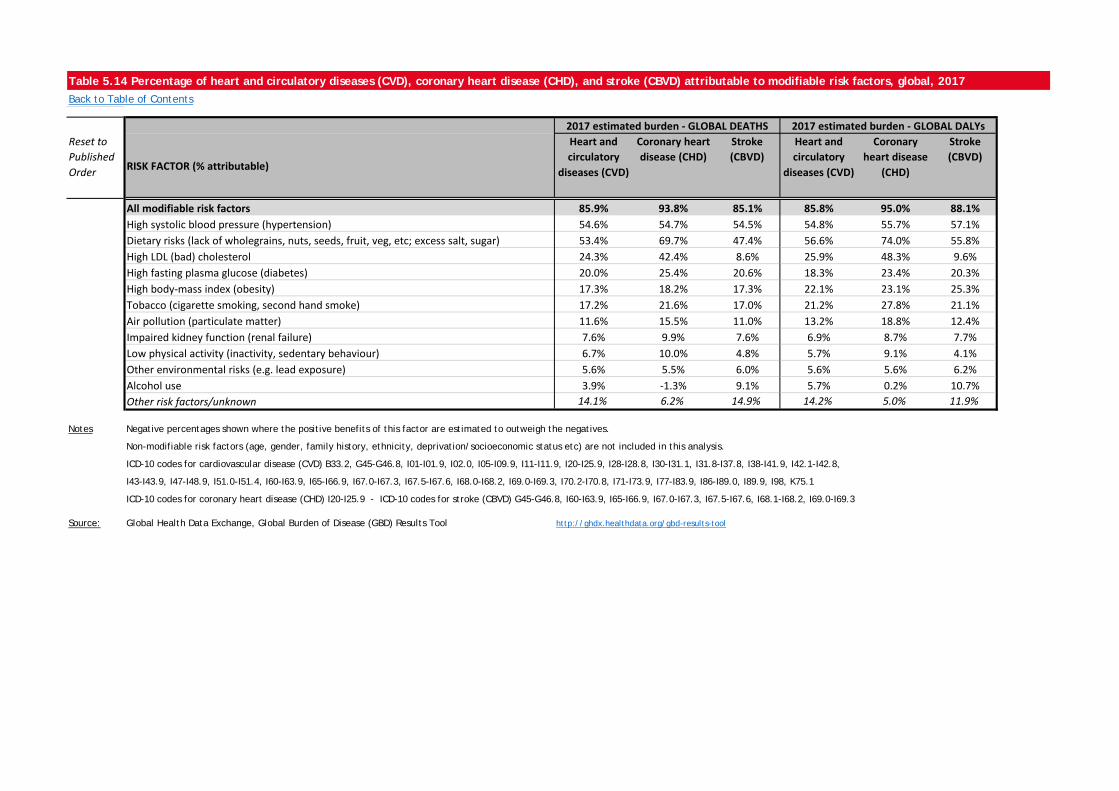
Table 5.14 Percentage of heart and circulatory diseases (CVD), coronary heart disease (CHD), and stroke (CBVD) attributable to modifiable risk factors, global, 2017Back to Table of Contents
Reset to Published Order RISK FACTOR (% attributable)
Heart and circulatory
diseases (CVD)
Coronary heart disease (CHD)
Stroke (CBVD)
Heart and circulatory
diseases (CVD)
Coronary heart disease
(CHD)
Stroke (CBVD)
0 All modifiable risk factors 85.9% 93.8% 85.1% 85.8% 95.0% 88.1%1 High systolic blood pressure (hypertension) 54.6% 54.7% 54.5% 54.8% 55.7% 57.1%2 Dietary risks (lack of wholegrains, nuts, seeds, fruit, veg, etc; excess salt, sugar) 53.4% 69.7% 47.4% 56.6% 74.0% 55.8%3 High LDL (bad) cholesterol 24.3% 42.4% 8.6% 25.9% 48.3% 9.6%4 High fasting plasma glucose (diabetes) 20.0% 25.4% 20.6% 18.3% 23.4% 20.3%5 High body-mass index (obesity) 17.3% 18.2% 17.3% 22.1% 23.1% 25.3%6 Tobacco (cigarette smoking, second hand smoke) 17.2% 21.6% 17.0% 21.2% 27.8% 21.1%7 Air pollution (particulate matter) 11.6% 15.5% 11.0% 13.2% 18.8% 12.4%8 Impaired kidney function (renal failure) 7.6% 9.9% 7.6% 6.9% 8.7% 7.7%9 Low physical activity (inactivity, sedentary behaviour) 6.7% 10.0% 4.8% 5.7% 9.1% 4.1%
10 Other environmental risks (e.g. lead exposure) 5.6% 5.5% 6.0% 5.6% 5.6% 6.2%11 Alcohol use 3.9% -1.3% 9.1% 5.7% 0.2% 10.7%12 Other risk factors/unknown 14.1% 6.2% 14.9% 14.2% 5.0% 11.9%
Notes Negative percentages shown where the positive benefits of this factor are estimated to outweigh the negatives.
Non-modifiable risk factors (age, gender, family history, ethnicity, deprivation/socioeconomic status etc) are not included in this analysis.
ICD-10 codes for cardiovascular disease (CVD) B33.2, G45-G46.8, I01-I01.9, I02.0, I05-I09.9, I11-I11.9, I20-I25.9, I28-I28.8, I30-I31.1, I31.8-I37.8, I38-I41.9, I42.1-I42.8,
I43-I43.9, I47-I48.9, I51.0-I51.4, I60-I63.9, I65-I66.9, I67.0-I67.3, I67.5-I67.6, I68.0-I68.2, I69.0-I69.3, I70.2-I70.8, I71-I73.9, I77-I83.9, I86-I89.0, I89.9, I98, K75.1
ICD-10 codes for coronary heart disease (CHD) I20-I25.9 - ICD-10 codes for stroke (CBVD) G45-G46.8, I60-I63.9, I65-I66.9, I67.0-I67.3, I67.5-I67.6, I68.1-I68.2, I69.0-I69.3
Source: Global Health Data Exchange, Global Burden of Disease (GBD) Results Tool http://ghdx.healthdata.org/gbd-results-tool
2017 estimated burden - GLOBAL DEATHS 2017 estimated burden - GLOBAL DALYs