Embed Size (px)
Citation preview

RSC Advances
PAPER
Ope
n A
cces
s A
rtic
le. P
ublis
hed
on 1
8 Fe
brua
ry 2
021.
Dow
nloa
ded
on 3
/14/
2022
2:4
9:54
AM
. T
his
artic
le is
lice
nsed
und
er a
Cre
ativ
e C
omm
ons
Attr
ibut
ion-
Non
Com
mer
cial
3.0
Unp
orte
d L
icen
ce.
View Article OnlineView Journal | View Issue
Health and ecolo
Department of Environmental Health En
Tarbiat Modares University, Tehran, Iran
Fax: +98-21-82884580; Tel: +98-21-8288486
† Electronic supplementary informa10.1039/d0ra08833a
Cite this: RSC Adv., 2021, 11, 8080
Received 16th October 2020Accepted 12th February 2021
DOI: 10.1039/d0ra08833a
rsc.li/rsc-advances
8080 | RSC Adv., 2021, 11, 8080–80
gical risk assessment andsimulation of heavy metal-contaminated soil ofTehran landfill†
Shahla Karimian, Sakine Shekoohiyan * and Gholamreza Moussavi
The toxic effects of heavy metals in landfill soils have become a significant concern for human health. The
present study aimed to estimate the health and ecological risk associated with soil heavy metal in Tehran
landfill. A total of 48 soil samples were taken from the landfill and residential area and were analyzed
using inductively coupled plasma-optical emission spectroscopy. The results showed the following order
for heavy metal levels in landfill soil: Al > Fe > Mn > Zn > Cr > Cu > Pb > Ni > Co > As > Cd. The
investigated ecological indices showed moderate to high heavy metal pollution. The principal
component analysis revealed that the concentration of Pb, Cu, Zn, Cr, and Ni in the investigated soil was
mainly affected by anthropogenic activities. Although the hazard index (HI) value in children was 6.5
times greater than that of adults, this value for both landfill workers and residents of the target area was
at a safe level (HI # 1). In the residential area, the Incremental Lifetime Cancer Risk (ILCR) value of adults
(1.4 � 10�4) was greater than children ILCR value (1.2 � 10�4). Monte Carlo simulation and sensitivity
analysis showed input variables such as exposure duration, exposure frequency, Ni concentration, soil
ingestion rate, and As concentration have a positive effect on ILCR of 41.3, 24.3, 9.4, 9.0, and 2.9% in
children, respectively. These results indicate that the landfill soil and the adjacent residential area are
affected by heavy metal contamination and that the current solid waste management policies need to be
revised.
Introduction
The improper management of solid waste is a signicant chal-lenge in developing countries.1 This issue has led to the intru-sion of potentially hazardous materials into the environmentand contamination of the ecosystem.1 The lack of a compre-hensive source separation plan can exacerbate the severity ofenvironmental contamination.2 Considering sustainable devel-opment goals, waste disposal has become a vital part of inte-grated solid waste management.3 Landlling is the mostcommon method for the disposal of various solid wastesaround the world, especially in Tehran, Iran.4 Tehran is thecapital city of Iran, and Kahrizak landll (Aradkouh) is the mainsite for the disposal of 8500 tons solid waste produced per day.5
In Kahrizak landll, the collected solid waste is managed withfour strategies, including materials recovery facility (MRF)station, composting plants, landlling, and incineration.5
About 200 tons per day of the generated waste is incinerated,approximately 15% of solid waste is recycled, less than 10% was
gineering, Faculty of Medical Sciences,
. E-mail: [email protected];
5
tion (ESI) available. See DOI:
95
composted, and nally, the residual components werelandlled.5
Inefficient solid waste management, the lack of obligatorylaws, and un-engineered landlls could worsen the diversehealth and environmental problems.6 Leachate and air emis-sions are the major landlling products and contain complexnature and highly polluted organic wastewater that damage theliving organisms.7 Heavy metal pollution is a major issue inlandll sites. According to the literature review, anthropogenicactivities such as waste disposal, pesticides and agriculturalactivities, domestic emission, burning, waste incineration,vehicle exhaust, and mining are the main sources of heavymetal pollution.8 Electronic wastes (e-wastes) are the maincomponents of solid wastes that contain a high concentrationof metals and are detected around informal e-waste recyclingsites.9 Heavy metals are non-biodegradable, and10 can accu-mulate in the human body through ingestion, inhalation, anddermal contact exposures.6,7 The bioaccumulation of heavymetals in organic tissues disrupts the nervous system functions,cardiovascular and endocrine systems, immune systems,etc.11–13 Also, depending on the heavy metal concentrations,route of exposure, and receptor sensitivity, adverse healtheffects ranging from acute to chronic reactions could beobserved in human beings.14
© 2021 The Author(s). Published by the Royal Society of Chemistry

Paper RSC Advances
Ope
n A
cces
s A
rtic
le. P
ublis
hed
on 1
8 Fe
brua
ry 2
021.
Dow
nloa
ded
on 3
/14/
2022
2:4
9:54
AM
. T
his
artic
le is
lice
nsed
und
er a
Cre
ativ
e C
omm
ons
Attr
ibut
ion-
Non
Com
mer
cial
3.0
Unp
orte
d L
icen
ce.
View Article Online
Due to the complicated interactions of heavy metals with theenvironment, investigation of soil pollution in landll hasturned into an essential need. Vaverkova et al.15 and Adelopoet al.16 indicated that non-engineered landlls can increase thelevel of metals in soil, air, and groundwater. Therefore,a continuous monitoring of landll environment is necessary.Besides, Krcmar et al.17 indicated that living in the vicinity ofa polluted site could have adverse health effects on the residentsthrough the inhalation of emitted substances, consumption ofcontaminated products, and ingestion of polluted water andsoil. For these reasons, it is essential to continuously evaluateand monitor the affected media.
Health and ecological risk assessment is an appropriate toolfor assessing and quantifying the probable adverse effects ofdifferent pollutants on human health and environment.17,18
Calculating the risk value can help policymakers performstrategies to mitigate adverse health effects through removingthe source of pollution, eliminating receptors, and dis-connecting the relation between a pollution source andreceptor.17 Landll workers and the neighboring residents arehighly exposed to pollutants through different exposure routesfrom the soil, water, and air near the solid waste dump.14
Therefore, to run an effective program for a further control ofhuman health risk, a comprehensive health and ecological riskassessment in Kahrizak soil is needed.
The expansion of Tehran metropolis moved people closer toKahrizak landll. People living in this area are usually from low-income families who pay less attention to preventive healthmeasures. In addition, landll workers are more exposed toenvironmental pollution because they are living in the landllsite. However, to the best knowledge of the present authors,there is no documented evidence of how landlls affect soilpollution by heavy metals in the residential area. For thesereasons and the lack of any comprehensive study, we decided toconduct this research and estimate the health and ecologicalrisks related to this pollution. This study aimed rstly todetermine the concentration of heavy metals including arsenic(As), chromium (Cr), cadmium (Cd), copper (Cu), nickel (Ni),lead (Pb), cobalt (Co), zinc (Zn), magnesium (Mn), aluminum(Al), and iron (Fe) at 11 landll soil sampling points and thecenter of the residential area attached to this site in fourseasons. Secondly, it aimed to investigate the non-carcinogenicand carcinogenic health risks of heavy metals through differentexposure routes for male adult landll workers and inhabitantsof the residential area. Thirdly, it aimed to show the spatialdistribution of different heavy metals in the landll usingGeographic Information System (GIS). And nally, it aimed tosimulate the hazard index (HI) and carcinogenic risk (CR)values using Monte Carlo simulation model.
Material and methodStudy area and sampling point selection
The studied area was located in the south of Tehran, Iran(35�2705200N and 51�1901800E). Kahrizak landll accepts thewastes coming from 22 districts of Tehran and also from specialcenters such as hospitals and institutions. The produced wastes
© 2021 The Author(s). Published by the Royal Society of Chemistry
in Tehran were processed in several units, including recycling,composting, incinerating, and landlling. This center is thebiggest recycling and processing facility in the Middle East. Ithas been operating for more than 40 years as the nal desti-nation of Tehran's municipal wastes. This center area is about1400 ha, and admits around 8500 tons of solid wastes entersdaily to this location.18 The predominant direction of wind iswest to east, and the maximum, minimum, and average annualtemperatures are 40 �C, �5 �C, and 17 �C, respectively. Thisstudied area is located in an arid climate with an average annualprecipitation of 250 mm and average relative humidity of 51%.The soil texture in Kahrizak is ne clayey with more than 17% ofclay and 43% of slit. Due to the population growth, Kahrizak issurrounded by residential areas and industrial factories.
Entering the Kahrizak landll for sampling requireda license, and aer several correspondences with the Tehranwaste management organization, a sampling license wasissued. Aer that, the sampling points were selected based ontwo criteria: places where laborers are working and places theyused for living in the Kahrizak vicinity. In addition, the center ofa residential area attached to the landll was selected toinvestigate the effect of the landll on resident health. Fig. 1shows the location of this landll on the Iran map and the soilsampling points. The selected points were (1) an active landll;(2) an incinerator wastewater treatment plant; (3) a leachatedrainage site; (4) a healthcare waste landll site; (5) an incin-eration site; (6) a compost granulation site; (7) a leachatecollection site; (8) a landll worker's residence site; (9) a closedlandll site; (10) an MRF station; (11) a fermentation site and;(12) the center of a residential area near the landll. In additionto the importance of the main sampling points, the determi-nation of background heavy metals concentrations in investi-gated soil is challenging but necessary for calculating ecologicalrisk indices. Therefore, the correct selection of backgroundsampling points is essential. We chose 10 background samplingpoints based on wind direction (from west to east) andconsultation with geologists who worked in the Kahrizaklandll. The selected points were located upstream and upwindof the landll's elevated points and were far away from indus-trial areas and vehicle traffic. The distance of backgroundlocations from the active landll was approximately 1000 m. Forobtaining the natural local background concentration of heavymetals, the soil samples were collected from 100 cm belowground level.19,20 Ten samples of 4 sub-samples were randomlycollected within a 1 m � 1 m grid and analyzed for backgroundheavy metal concentrations.
Soil sample collection and preparation
Due to the budget limitation, a total number of 48 soil sampleswere collected from 0–20 cm depth of the sampling points fromSeptember 2018 to September 2019. Soil samples were obtainedusing a stainless steel auger and collected in the middle of eachseason with a mixture of 5 subsamples. The composite soilsamples were sealed in polyvinyl chloride (PVC) bags and thentransferred to Tarbiat Modares University laboratory for phys-ical and chemical analysis. The soil sample preparation steps
RSC Adv., 2021, 11, 8080–8095 | 8081

Fig. 1 Locations of the soil sampling sites in the studied area.
RSC Advances Paper
Ope
n A
cces
s A
rtic
le. P
ublis
hed
on 1
8 Fe
brua
ry 2
021.
Dow
nloa
ded
on 3
/14/
2022
2:4
9:54
AM
. T
his
artic
le is
lice
nsed
und
er a
Cre
ativ
e C
omm
ons
Attr
ibut
ion-
Non
Com
mer
cial
3.0
Unp
orte
d L
icen
ce.
View Article Online
included air-drying at room temperature for a week, removingthe stones and bulky debris by hand, grounding by a grinder,and passing through a 0.15 mm sieve. In order to remove soilhumidity, the prepared samples were dried in the oven over-night and then kept in the desiccator. The prepared soil samplewas digested using acids for the determination of heavy metallevels.
Chemical analysis
For soil heavy metal determination, 0.5 g of the pretreated soilsamples was placed in Teon test tubes and digested for 4 h at220 �C using concentrated acids (3 : 3 : 1 (v/v/v) of HNO3–
HClO4–HCl) mixtures.21 Aer cooling, the digested solution wasltered using Whatman 42 lter paper, and the nal volumereached 50 mL with 1% of HNO3 before analysis. Finally, theconcentration of heavy metals, including As, Cr, Cd, Cu, Ni, Pb,Co, Zn, Mn, Al, and Fe was determined by the ICP-OES (Varian735 model, USA). The nitrate salt of metals was used to preparestock solutions. For metal decontamination, all glassware andplastic containers were soaked in 20% (v/v) of HNO3 and were
8082 | RSC Adv., 2021, 11, 8080–8095
washed with tap water, and rinsed with deionized water threetimes.
The detection limit values for As, Cr, Cd, Cu, Ni, Pb, Co, Zn,Mn, Al, and Fe were 0.5, 1, 0.1, 1, 1, 1, 1, 1, 5, 100, and100 mg L�1, respectively. The national standard soil sample wasemployed in each set of samples to validate the analyticalprocedure. The recovery rates of the national standard soilsamples ranged between 87 and 101% for Cr, 89–107% for Pb,92–108% for Cu, 97–102% for Ni, 86–105% for Zn, 95–103% forCd, 87–102% for Al, 93–103% for Mn, 96–105% for As, and 89–102% for Fe, respectively. Soil pH and electrical conductivity(EC) were measured immediately, and to this aim, the soil wasmixed with deionized water (1 : 2.5 w/v), and pH and EC weredetermined in this mixture three replicates using Jenway pH-meter (3540) and conductivity-meter (Jenway, 4510),respectively.
Soil pollution assessment
For heavy metal pollution assessment in soils and sediments,different indices have been introduced such as Enrichment
© 2021 The Author(s). Published by the Royal Society of Chemistry

Paper RSC Advances
Ope
n A
cces
s A
rtic
le. P
ublis
hed
on 1
8 Fe
brua
ry 2
021.
Dow
nloa
ded
on 3
/14/
2022
2:4
9:54
AM
. T
his
artic
le is
lice
nsed
und
er a
Cre
ativ
e C
omm
ons
Attr
ibut
ion-
Non
Com
mer
cial
3.0
Unp
orte
d L
icen
ce.
View Article Online
Factor (EF) and Ecological Risk Index (ERI).22 These indices helpprovide a qualitative threshold on the ecological risk evaluationof each heavy metal.
Enrichment factor
EF is a sign of a possible source of an anthropogenic effect onheavy metal pollution. EF is measured by comparing theconcentration of heavy metals in samples with a referencemetal. Elements such as Al, Fe, and Mn are generally selected asa reference element for EF calculation, and Al was used as thereference metal.23 EF was calculated via eqn (1).
EF ¼
�Ci
Cref
�sample�
Bi
Bref
�background
(1)
where Cref is the concentration of the reference element, Bref isthe background value of the soil's reference element.23 EF valuesclassication as follows;
� EF # 1 ¼ no enrichment.� 1 # EF # 2 ¼ slight enrichment.� 2 # EF # 5 ¼ moderate enrichment.� 5 # EF # 20 ¼ signicant enrichment.
Individual and total ecological risk index
Hakanson (1980) proposed this concept to determine the ERI ofheavy metals in sediment.24 ERI evaluates the potential risk ofheavy metals to organisms using a combination of heavy metalconcentrations with their toxicological effects.23 ERI is the sumof individual potential risk factors (Eir) in soils and is calculatedvia eqn (2) and (3):
Eir ¼ T i
r �Ci
Bi
(2)
ERI ¼Xn
i¼1
Eir (3)
where Tir represents the toxic response factor of each heavymetal and the values are As ¼ 10, Cr ¼ 2, Cd ¼ 30, Cu ¼ 5, Ni ¼5, Pb ¼ 5, Co ¼ 2, Zn ¼ 1 and Mn ¼ 1. Hakanson24 classiedEir and ERI values to determine the severity of ecological risk asfollows:
� Eir < 40 and ERI < 150 represents low ecological risk.� 40 # Eir < 80 and 150 # ERI < 300 represents moderate
ecological risk.� 80 # Eir < 160 and 300 # ERI < 600 represents strong
ecological risk.� 160 # Eir < 320 and ERI > 600 represents quite strong
ecological risk.� Eir $ 320 represents an extremely strong ecological risk.
Health risk assessment
USEPA proposed a method for calculating non-carcinogenicand carcinogenic risks aer chemical exposure. Three mainfactors in the dose–response model include the source of
© 2021 The Author(s). Published by the Royal Society of Chemistry
pollution, exposure route, and receptors.3 In this study, landllsoil heavy metals can affect landll workers and residentsthrough main pathways such as (i) direct soil ingestion, (ii)inhalation of dust particles through mouth and nose, and (iii)dermal absorption.25 The Average Daily Doses (ADDs) as (mg perkg per day) from each exposure route should be determinedthrough USEPA guidelines.26 Direct soil ingestion (ADDing-soil),inhalation of soil particles (ADDinh), and dermal absorption(ADDder) for landll adult male workers and adults and childrenin the residential area were calculated via eqn (4)–(6).
ADDing-soil ¼�Csoil � IngRsoil � EF� ED� CF
BW�AT
�(4)
ADDinh ¼�Csoil � InhR� EF� ED
BW�AT� PEF
�(5)
ADDder ¼�Csoil �AFsoil � SA�ABS� EF� ED� CF
BW�AT
�(6)
Csoil is the heavy metal concentration in soil (mg kg�1),IngRsoil is soil ingestion rate (mg per day), EF is exposurefrequency (day per year), ED is the exposure duration (year), CFis conversion factor (kg mg�1), BW is the average body weight(kg). Based on USEPA guideline, the mean body weight forchildren aged 1 to 6 was set as 15 kg,27 AT is the average time(day), AFsoil is the skin adherence factor (mg per cm per day), SAis the exposed skin area (cm2), ABS is the dermal absorptionfactor (unitless), InhR is the inhalation rate (m3 per day), andPEF is the particle emission factor (m3 kg�1). The values of thefactors are presented in Table S1 (ESI le†). Lack of local data onexposure was one of the main limitations in our study. Forsolving this problem, USEPA exposure values and probabilitydistributions were used for risk calculation and simulation.
To determine the non-carcinogenic risk or the hazardquotient (HQ) in eqn (7) and (8), ADDs is divided by the refer-ence dose (RfD) in mg per kg per day. If there were multiplesubstances or exposure routes, hazard index (HI) was calculatedwhich refers to the “sum of more than one HQ.” According tothe HQ or HI values, if HQ or HI# 1, there is no adverse humanhealth effect, and if HQ or HI $ 1, there is a potential non-carcinogenic risk.26 Based on the International Agency forResearch on Cancer (IARC),28 heavy metals such as As, Cd, Pb,Ni, and Cr are considered to have a carcinogenic effect. Toestimate carcinogenic risk (CRi) for each heavy metal or incre-mental lifetime cancer risk (ILCR) in eqn (9) and (10), ADDs ismultiplied by the cancer slope factor (SF) in (kg day per mg).According to the USEPA25 guideline, there is a negligible carci-nogenic risk if CRi or ILCR is lower than 1 � 10�6, harmful tohuman health if CRi or ILCR above 1 � 10�4 and there isa tolerable or acceptable carcinogenic risk if 1 � 10�4 # CRi orILCR # 1 � 10�6. The values for SF and RfD are listed in TableS2.†
HQ ¼ ADD
RfD(7)
RSC Adv., 2021, 11, 8080–8095 | 8083
Tab
le1
Theaveragevaluesofheavymetalsco
nce
ntrations(m
gkg
�1 )in
fourseasonsin
landfillsamplin
gpoints
andresidential
area
Samplingpo
int
As
Cr
Cd
Cu
Ni
PbCo
ZnMn
Al
Fe
Mean
SDMean
SDMean
SDMean
SDMean
SDMean
SDMean
SDMean
SDMean
SDMean
SDMean
SD
16.1
1.5
72.4
4.9
0.42
0.26
61.6
6.2
24.5
5.5
32.3
8.7
17.0
1.4
109.0
19.7
1150
.598
.679
933.3
4154
.046
100.2
4028
.62
5.2
2.7
97.3
40.0
0.86
0.44
102.1
29.6
27.6
6.9
44.5
20.5
18.0
3.9
207.0
101.0
1254
.016
9.0
7001
4.8
1727
.035
729.7
5469
.83
10.9
2.7
82.5
6.8
0.26
0.03
42.1
11.1
37.1
3.5
27.3
5.4
12.6
1.9
115.0
35.5
1096
.722
6.0
5817
6.3
1066
6.0
3459
3.5
6838
.34
5.8
2.5
62.1
7.0
0.24
0.02
41.9
11.8
21.4
1.3
18.5
5.2
13.1
1.4
59.1
8.0
856.0
105.0
6546
3.3
2805
.035
722.5
4128
.55
3.9
0.6
67.3
5.4
0.28
0.04
52.5
12.4
26.1
3.1
25.8
3.8
17.6
2.9
68.1
7.0
1074
.771
.272
642.8
1899
.043
719.2
1766
.86
5.3
1.2
127.5
33.0
0.38
0.10
179.4
82.7
42.9
15.5
111.5
62.8
15.5
3.1
275.0
134.0
1039
.714
1.0
6578
9.0
9797
.046
363.7
5602
.97
8.4
6.1
74.3
5.1
0.32
0.12
53.3
3.4
28.3
3.3
25.0
5.7
17.6
4.1
85.4
15.8
1119
.220
.569
898.0
7053
.042
870.5
5704
.18
7.7
3.2
77.5
7.0
0.29
0.04
118.5
32.9
33.4
2.1
61.8
27.0
12.0
1.2
159.0
43.3
880.7
48.3
6424
5.3
1930
.032
789.7
1421
.39
6.3
1.3
96.0
79.0
0.28
0.05
52.5
26.4
26.8
3.8
28.8
11.3
12.0
3.4
90.6
17.7
892.0
72.7
6483
4.5
6173
.032
676.2
8244
.810
8.2
4.5
65.5
4.5
0.30
0.10
43.9
11.0
31.6
5.1
26.8
6.3
10.7
1.7
77.3
10.6
798.5
52.9
5975
6.8
2117
.030
542.5
1690
.411
7.2
2.4
87.8
30.0
0.35
0.12
134.8
94.2
33.8
13.1
65.1
56.8
13.1
2.6
225.0
179.0
898.2
71.8
6420
478
49.0
3993
0.0
3105
.212
9.4
3.8
76.5
11.0
0.28
0.03
38.1
2.3
45.3
5.7
26.5
6.4
13.4
1.8
126.0
99.5
875.7
69.2
6299
7.5
4090
.032
537.2
1655
.0
RSC Advances Paper
Ope
n A
cces
s A
rtic
le. P
ublis
hed
on 1
8 Fe
brua
ry 2
021.
Dow
nloa
ded
on 3
/14/
2022
2:4
9:54
AM
. T
his
artic
le is
lice
nsed
und
er a
Cre
ativ
e C
omm
ons
Attr
ibut
ion-
Non
Com
mer
cial
3.0
Unp
orte
d L
icen
ce.
View Article Online
HI ¼Xi
1
HQ (8)
CRi ¼ ADDi � SF (9)
ILCR ¼Xi
1
CRi (10)
Probabilistic health risk assessment
Monte Carlo simulation is a modelingmethods used extensivelyfor probabilistic risk assessment29 and was done using Crystalball soware (version 11). This model can produce a statisticalrandom variable from any input variable that is a point value. InMonte Carlo simulation, ILCR and HI risks are calculatedseveral times with different random values of all inputs.Therefore, the output risk has a range of values instead ofa single value. In order to ensure numerical stability, 10 000iterations were considered. Table S1† shows the input valuesused in Monte Carlo simulation. In order to determine theeffect of input variables on HI and ILCR values, a sensitivityanalysis was done. The type of distribution of each variable wasobtained from credible works of research and presented inTable S1.†
Statistical analysis
The results for heavy metals were presented as the mean � SD(standard deviation) from duplicate determinations. Thenormality of heavy metal in different sampling points andseasons was checked using Shapiro–Wilk and Kolmogorov–Smirnov tests in SPSS 24 soware. Similarity and heavy metalconcentration trends in different sampling points and seasonswere measured using Mann–Whitney and Kruskal–Wallis tests.In statistical analysis, a p-value lower than (<0.05) was set as thesignicance level. In order to understand the sources of heavymetals in soils, correlation analysis was done using Pearson'scorrelation coefficients. Principal component analysis (PCA)was used to identify the source of soil metals. Pearson's corre-lation coefficients and PCA were run with Minitab (version 19).The gures were plotted by Origin 2019. The spatial distributionmaps of heavy metals concentrations in different samplingpoints in the landll and residential areas were prepared usingthe Inverse Distance Weighting (IDW) method in Arc GIS(version 10.3).
Results and discussionSoil heavy metal concentrations in different seasons andsampling points
Table 1 indicates the average content of heavy metals concen-trations � SD at different sampling points in the landll andresidential areas in four seasons. Sampling points no. 1–11 waslocated in the landll site and no. 12 was at the center of thenearest residential area. The order of heavy metal levels atlandll sampling points was Al > Fe > Mn > Zn > Cr > Cu > Pb >
8084 | RSC Adv., 2021, 11, 8080–8095 © 2021 The Author(s). Published by the Royal Society of Chemistry

Paper RSC Advances
Ope
n A
cces
s A
rtic
le. P
ublis
hed
on 1
8 Fe
brua
ry 2
021.
Dow
nloa
ded
on 3
/14/
2022
2:4
9:54
AM
. T
his
artic
le is
lice
nsed
und
er a
Cre
ativ
e C
omm
ons
Attr
ibut
ion-
Non
Com
mer
cial
3.0
Unp
orte
d L
icen
ce.
View Article Online
Ni > Co > As > Cd; but, in the residential area, it was Al > Fe > Mn> Zn > Cr > Ni > Cu > Pb > Co > As > Cd. The results show that thetrend of heavy metal concentrations in the landll and resi-dential area was similar, except Ni. The average Al concentra-tion in the landll site (66 178 � 5106.6 mg kg�1) andresidential area (62 997.5 � 4090.9 mg kg�1) was higher thanother heavy metals. The average heavy metal levels in thelandll sites for Fe, Mn, Zn, Cr, Cu, Pb, Ni, Co, As, and Cd were38 276.2� 4363.7, 1005.4� 98.1, 133.9� 52.5, 82.7 � 20.3, 80.2� 29.3, 42.5 � 19.4, 30.3 � 5.7, 14.5 � 2.5, 6.8 � 2.6, and 0.36 �0.12 mg kg�1, respectively. The average of heavy metals in theresidential area (no. 12) indicated that the concentration of allheavy metals, except Ni and As was lower in the residential areasthan the landll; but, these values were higher than the back-ground concentration. The quality of soil in the residential areamay be affected by the open-dumping of solid waste in thelandll site, soil properties such as soil organic carbon (SOC)and pH, different solubility and transport of metals, climateconditions, and background concentration.30 These ndings areinconsistent with Rovira et al.31 and Rimmer et al.32 Thesestudies reported that the landll was not responsible for heavymetal soil pollution in Catalonia and Newcastle.
If we compare different sampling points according to thesum of heavy metal pollution, the results show that the highestpolluted site matched the active landll. The lowest contami-nated site was the MRF station and the residential area. Thehigher heavy metal pollution in active landll soil was due tothe recirculation and accumulation of leachate on the soilsurface. Decomposition of solid waste in the closed landllincreased heavy metals concentrations in these soil samples.16
Adelopo et al.16 reported that heavy metal concentration ina closed landll was higher than an active landll, and thisresult is not consistent with our ndings. Heavy metalconcentration in landll soil is related to the composition ofdisposed waste and microbial degradation rate.16 Highconcentrations of heavy metals around landll sites could beattributed to the previous mismanagement of landll opera-tions, such as insufficient leachate collection systems, illegaldumping of mixed wastes in unlined cells, and inappropriateseparation of general and hazardous waste.33
The results of the heavy metal contents based on eachsampling season shown in Table S3 and Fig. S1.† The Box plotsshow the mean, minimum, and maximum of measured heavymetals in each season. Fig. S1(a and b)† shows that the contentsof heavy metals in autumn and winter was higher than summerand spring. This difference between the results could be due tothe higher precipitation in wet than dry seasons. In wet seasons,precipitation increased leachate production and reducedleachate recirculation rate; this caused leachate to spread on thesoil surface. In addition, a less viscosity of wet soil than dry soilenhanced heavy metals migration to long distances.34 Complexmeteorological parameters and predominant winds canpossibly affect the distribution of heavy metals and odors in thelandll.34 Wind direction and velocity are useful in the disper-sion of heavy metals downwind to residential areas. Theamount of elements can increase gradually along with thedirection of the prevailing wind. According to the higher
© 2021 The Author(s). Published by the Royal Society of Chemistry
concentration of heavy metals in autumn and winter and alsothe higher wind speed in these seasons, wind and other mete-orological parameters affect heavy metals distribution. Theprevailing wind direction in Kahrizak landll is generally fromwest to east, blowing particularly in the autumn and winterseasons. With a glance at the spatial distribution of heavymetals in Fig. 2, it seems that somemetals are distributed in thedominant direction of the wind, but distribution patterns arenot similar for all metals. Metals such as As and Ni, havea distinct distribution pattern in the prevailed wind directionfrom west to east. The presence of hotspots in the eastern partfor metals such as Co, Fe, Cr, Pb, and Zn can be attributed to therole of wind in the accumulation of metals over time and thepresence of compost site, which gradually has increased theconcentration of elements in this site. Nikravesh et al.35 re-ported that the GIS map showed gradual increases in Pb, Zn,Cd, and Cu concentrations from the west to the east in Iran'sSemnan industrial complex, which was consistent with theprevailing wind direction.
Topography will inuence landll capacity, drainage, nalland use, surface and groundwater pollution control and, siteaccessibility.36 Based on Shariatmadari et al.37 reported that inKahrizak landll, there were natural terrains and articialtrenches lled with solid waste until the year 2000. Therefore,the current landll is a at area with little effect on the distri-bution of heavy metals. The pH and electrical conductivity (EC)of soil samples were determined in four seasons. The pH valuerange was between 6.8 and 7.8, and the highest pH value wasobserved in the compost granulation site. The investigated soilsamples had a neutral pH, and the mobility of heavy metals inthis condition was limited. The EC values ranged from 1.3 to 1.9mS cm�1, and the highest EC value was recorded in the leachatecollection site.
In order to visually clarify the heavy metal distribution in alltarget areas, the spatial maps were prepared using Arc GIS, andthe results can be seen in Fig. 2. It was found that the spatialdistributions of Mn, Fe, and Al at different sampling points wasnot outstanding. The results showed that the heavy metals'spatial distribution at different sampling points was similar,except at sampling point no. 6. In sampling point no. 6, the Cr,Mn, Ni, Pb, Zn, and Cu concentrations were higher than otherlocations. The higher concentration of heavy metals at thissampling point was related to the windrow method's com-posting activity. The non-biodegradable nature of heavy metalshelps increase the contents of heavy metals gradually duringdegradation and composting.38 A previous study conducted byRupani et al.5 on the quality of the compost produced in Kah-rizak landll revealed that Pb concentration was higher thanthe threshold standard that has been approved by the IranInstitute of Standards and Industrial Research. These resultsshow that the inappropriate source separation of hazardouswastes in Tehran increased the level of soil heavy metals inKahrizak landll over time.
The remarkable point of this study was the low heavy metalconcentration at sampling point no. 4, which was due to thehealthcare waste disposal site. The color of heavy metal spatialdistribution at this sampling point for all the investigated
RSC Adv., 2021, 11, 8080–8095 | 8085
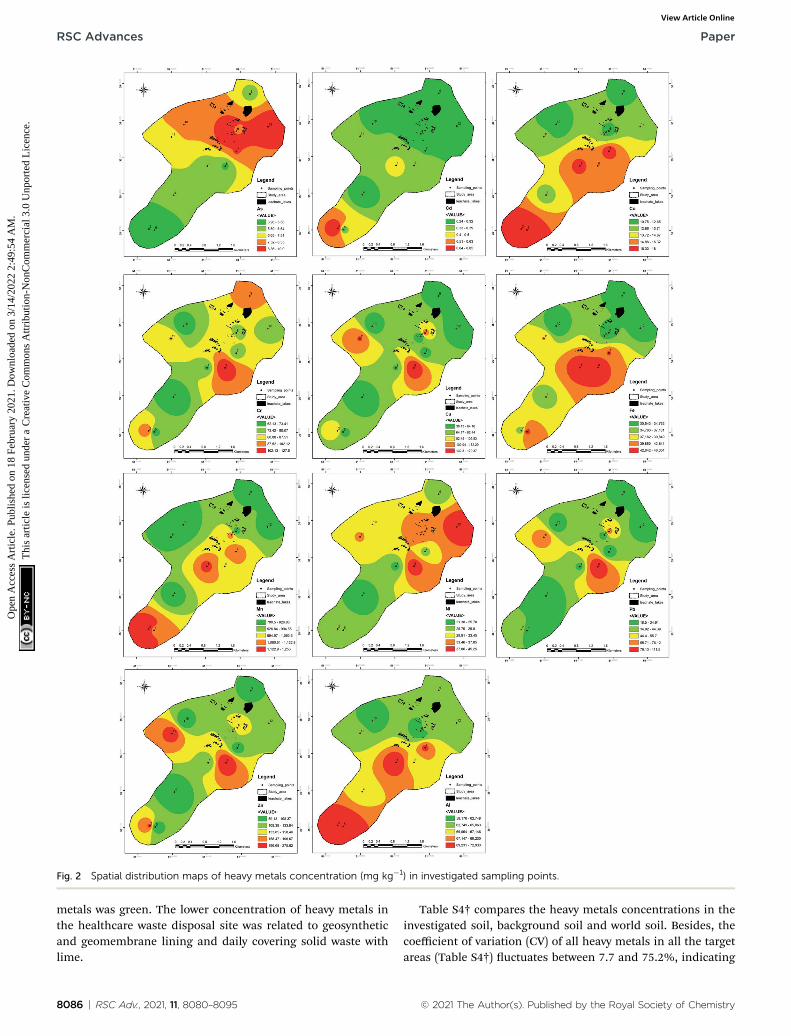
Fig. 2 Spatial distribution maps of heavy metals concentration (mg kg�1) in investigated sampling points.
RSC Advances Paper
Ope
n A
cces
s A
rtic
le. P
ublis
hed
on 1
8 Fe
brua
ry 2
021.
Dow
nloa
ded
on 3
/14/
2022
2:4
9:54
AM
. T
his
artic
le is
lice
nsed
und
er a
Cre
ativ
e C
omm
ons
Attr
ibut
ion-
Non
Com
mer
cial
3.0
Unp
orte
d L
icen
ce.
View Article Online
metals was green. The lower concentration of heavy metals inthe healthcare waste disposal site was related to geosyntheticand geomembrane lining and daily covering solid waste withlime.
8086 | RSC Adv., 2021, 11, 8080–8095
Table S4† compares the heavy metals concentrations in theinvestigated soil, background soil and world soil. Besides, thecoefficient of variation (CV) of all heavy metals in all the targetareas (Table S4†) uctuates between 7.7 and 75.2%, indicating
© 2021 The Author(s). Published by the Royal Society of Chemistry
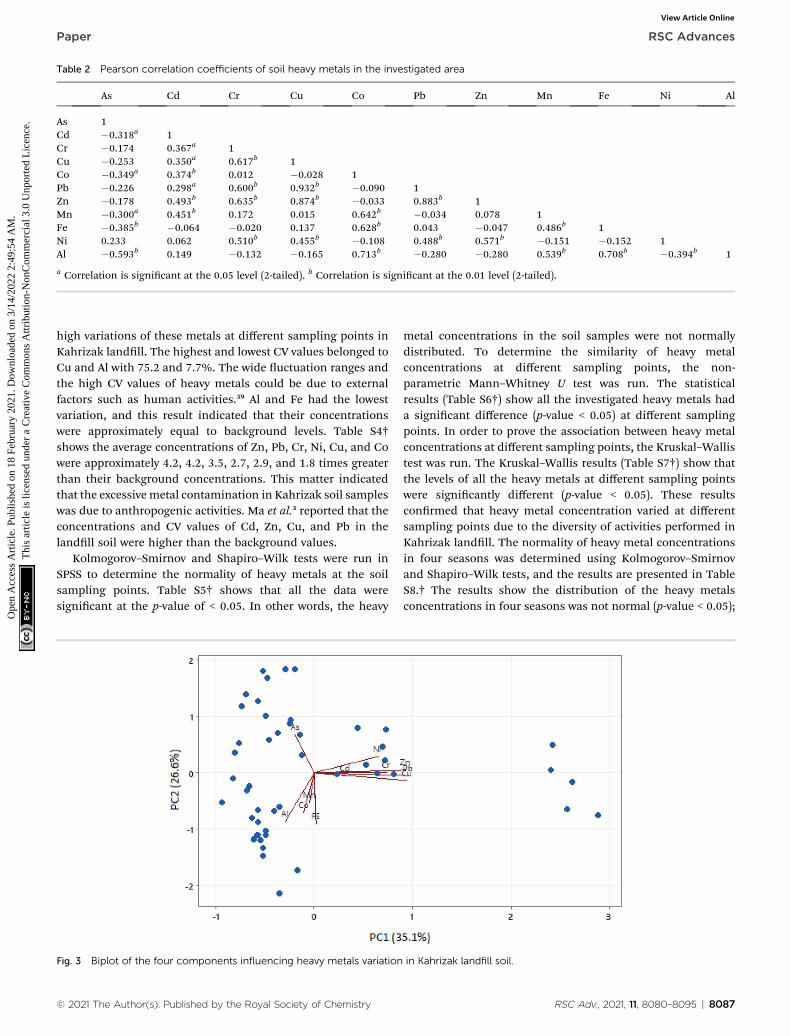
Table 2 Pearson correlation coefficients of soil heavy metals in the investigated area
As Cd Cr Cu Co Pb Zn Mn Fe Ni Al
As 1Cd �0.318a 1Cr �0.174 0.367a 1Cu �0.253 0.350a 0.617b 1Co �0.349a 0.374b 0.012 �0.028 1Pb �0.226 0.298a 0.600b 0.932b �0.090 1Zn �0.178 0.493b 0.635b 0.874b �0.033 0.883b 1Mn �0.300a 0.451b 0.172 0.015 0.642b �0.034 0.078 1Fe �0.385b �0.064 �0.020 0.137 0.628b 0.043 �0.047 0.486b 1Ni 0.233 0.062 0.510b 0.455b �0.108 0.488b 0.571b �0.151 �0.152 1Al �0.593b 0.149 �0.132 �0.165 0.713b �0.280 �0.280 0.539b 0.708b �0.394b 1
a Correlation is signicant at the 0.05 level (2-tailed). b Correlation is signicant at the 0.01 level (2-tailed).
Paper RSC Advances
Ope
n A
cces
s A
rtic
le. P
ublis
hed
on 1
8 Fe
brua
ry 2
021.
Dow
nloa
ded
on 3
/14/
2022
2:4
9:54
AM
. T
his
artic
le is
lice
nsed
und
er a
Cre
ativ
e C
omm
ons
Attr
ibut
ion-
Non
Com
mer
cial
3.0
Unp
orte
d L
icen
ce.
View Article Online
high variations of these metals at different sampling points inKahrizak landll. The highest and lowest CV values belonged toCu and Al with 75.2 and 7.7%. The wide uctuation ranges andthe high CV values of heavy metals could be due to externalfactors such as human activities.39 Al and Fe had the lowestvariation, and this result indicated that their concentrationswere approximately equal to background levels. Table S4†shows the average concentrations of Zn, Pb, Cr, Ni, Cu, and Cowere approximately 4.2, 4.2, 3.5, 2.7, 2.9, and 1.8 times greaterthan their background concentrations. This matter indicatedthat the excessive metal contamination in Kahrizak soil sampleswas due to anthropogenic activities. Ma et al.3 reported that theconcentrations and CV values of Cd, Zn, Cu, and Pb in thelandll soil were higher than the background values.
Kolmogorov–Smirnov and Shapiro–Wilk tests were run inSPSS to determine the normality of heavy metals at the soilsampling points. Table S5† shows that all the data weresignicant at the p-value of < 0.05. In other words, the heavy
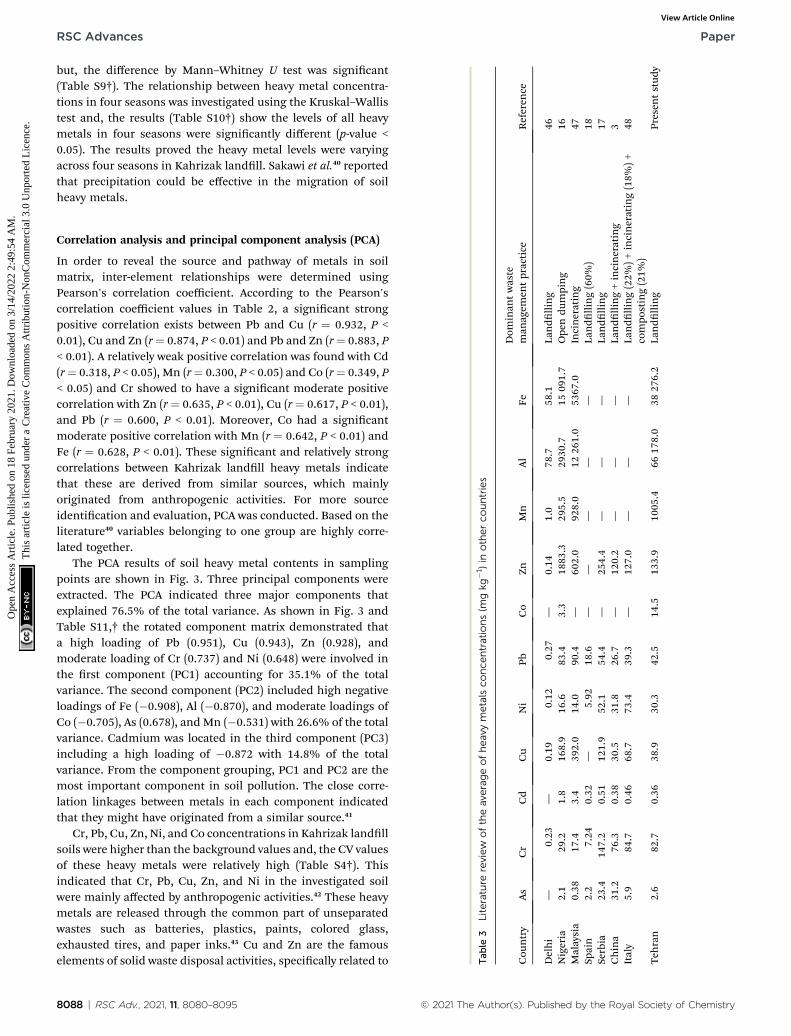
Fig. 3 Biplot of the four components influencing heavy metals variation
© 2021 The Author(s). Published by the Royal Society of Chemistry
metal concentrations in the soil samples were not normallydistributed. To determine the similarity of heavy metalconcentrations at different sampling points, the non-parametric Mann–Whitney U test was run. The statisticalresults (Table S6†) show all the investigated heavy metals hada signicant difference (p-value < 0.05) at different samplingpoints. In order to prove the association between heavy metalconcentrations at different sampling points, the Kruskal–Wallistest was run. The Kruskal–Wallis results (Table S7†) show thatthe levels of all the heavy metals at different sampling pointswere signicantly different (p-value < 0.05). These resultsconrmed that heavy metal concentration varied at differentsampling points due to the diversity of activities performed inKahrizak landll. The normality of heavy metal concentrationsin four seasons was determined using Kolmogorov–Smirnovand Shapiro–Wilk tests, and the results are presented in TableS8.† The results show the distribution of the heavy metalsconcentrations in four seasons was not normal (p-value < 0.05);
in Kahrizak landfill soil.
RSC Adv., 2021, 11, 8080–8095 | 8087
Referen
ce
46 16 47 18 17 3ing(18%
)+
48 Presen
tstud
y
RSC Advances Paper
Ope
n A
cces
s A
rtic
le. P
ublis
hed
on 1
8 Fe
brua
ry 2
021.
Dow
nloa
ded
on 3
/14/
2022
2:4
9:54
AM
. T
his
artic
le is
lice
nsed
und
er a
Cre
ativ
e C
omm
ons
Attr
ibut
ion-
Non
Com
mer
cial
3.0
Unp
orte
d L
icen
ce.
View Article Online
but, the difference by Mann–Whitney U test was signicant(Table S9†). The relationship between heavy metal concentra-tions in four seasons was investigated using the Kruskal–Wallistest and, the results (Table S10†) show the levels of all heavymetals in four seasons were signicantly different (p-value <0.05). The results proved the heavy metal levels were varyingacross four seasons in Kahrizak landll. Sakawi et al.40 reportedthat precipitation could be effective in the migration of soilheavy metals.
Tab
le3
Literature
review
oftheaverageofheavymetalsco
nce
ntrations(m
gkg
�1 )in
otherco
untries
Cou
ntry
As
Cr
Cd
Cu
Ni
PbCo
ZnMn
Al
FeDom
inan
twaste
man
agem
entpractice
Delhi
—0.23
—0.19
0.12
0.27
—0.14
1.0
78.7
58.1
Landlling
Nigeria
2.1
29.2
1.8
168.9
16.6
83.4
3.3
1883
.329
5.5
2930
.715
091.7
Ope
ndu
mping
Malaysia
0.38
17.4
3.4
392.0
14.0
90.4
—60
2.0
928.0
1226
1.0
5367
.0Incinerating
Spain
2.2
7.24
0.32
—5.92
18.6
——
——
—La
ndlling(60%
)Serbia
23.4
147.2
0.51
121.9
52.1
54.4
—25
4.4
——
—La
ndlling
China
31.2
76.3
0.38
30.5
31.8
26.7
—12
0.2
——
—La
ndlling+incinerating
Italy
5.9
84.7
0.46
68.7
73.4
39.3
—12
7.0
——
—La
ndlling(22%
)+incinerat
compo
sting(21%
)Teh
ran
2.6
82.7
0.36
38.9
30.3
42.5
14.5
133.9
1005
.466
178.0
3827
6.2
Landlling
Correlation analysis and principal component analysis (PCA)
In order to reveal the source and pathway of metals in soilmatrix, inter-element relationships were determined usingPearson's correlation coefficient. According to the Pearson'scorrelation coefficient values in Table 2, a signicant strongpositive correlation exists between Pb and Cu (r ¼ 0.932, P <0.01), Cu and Zn (r¼ 0.874, P < 0.01) and Pb and Zn (r¼ 0.883, P< 0.01). A relatively weak positive correlation was found with Cd(r¼ 0.318, P < 0.05), Mn (r¼ 0.300, P < 0.05) and Co (r¼ 0.349, P< 0.05) and Cr showed to have a signicant moderate positivecorrelation with Zn (r ¼ 0.635, P < 0.01), Cu (r ¼ 0.617, P < 0.01),and Pb (r ¼ 0.600, P < 0.01). Moreover, Co had a signicantmoderate positive correlation with Mn (r ¼ 0.642, P < 0.01) andFe (r ¼ 0.628, P < 0.01). These signicant and relatively strongcorrelations between Kahrizak landll heavy metals indicatethat these are derived from similar sources, which mainlyoriginated from anthropogenic activities. For more sourceidentication and evaluation, PCA was conducted. Based on theliterature40 variables belonging to one group are highly corre-lated together.
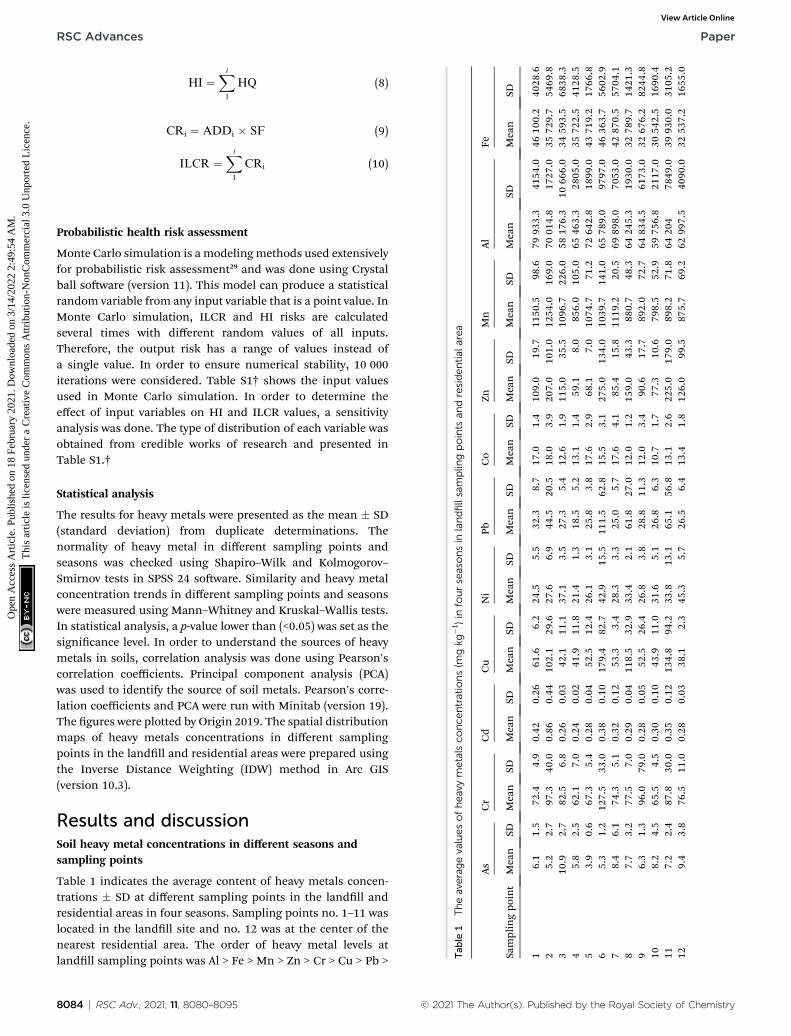
The PCA results of soil heavy metal contents in samplingpoints are shown in Fig. 3. Three principal components wereextracted. The PCA indicated three major components thatexplained 76.5% of the total variance. As shown in Fig. 3 andTable S11,† the rotated component matrix demonstrated thata high loading of Pb (0.951), Cu (0.943), Zn (0.928), andmoderate loading of Cr (0.737) and Ni (0.648) were involved inthe rst component (PC1) accounting for 35.1% of the totalvariance. The second component (PC2) included high negativeloadings of Fe (�0.908), Al (�0.870), and moderate loadings ofCo (�0.705), As (0.678), and Mn (�0.531) with 26.6% of the totalvariance. Cadmium was located in the third component (PC3)including a high loading of �0.872 with 14.8% of the totalvariance. From the component grouping, PC1 and PC2 are themost important component in soil pollution. The close corre-lation linkages between metals in each component indicatedthat they might have originated from a similar source.41
Cr, Pb, Cu, Zn, Ni, and Co concentrations in Kahrizak landllsoils were higher than the background values and, the CV valuesof these heavy metals were relatively high (Table S4†). Thisindicated that Cr, Pb, Cu, Zn, and Ni in the investigated soilwere mainly affected by anthropogenic activities.42 These heavymetals are released through the common part of unseparatedwastes such as batteries, plastics, paints, colored glass,exhausted tires, and paper inks.43 Cu and Zn are the famouselements of solid waste disposal activities, specically related to
8088 | RSC Adv., 2021, 11, 8080–8095 © 2021 The Author(s). Published by the Royal Society of Chemistry

Paper RSC Advances
Ope
n A
cces
s A
rtic
le. P
ublis
hed
on 1
8 Fe
brua
ry 2
021.
Dow
nloa
ded
on 3
/14/
2022
2:4
9:54
AM
. T
his
artic
le is
lice
nsed
und
er a
Cre
ativ
e C
omm
ons
Attr
ibut
ion-
Non
Com
mer
cial
3.0
Unp
orte
d L
icen
ce.
View Article Online
the landlling of e-waste, incinerator ashes, plastic, and paperwastes in the landll site.3 Moreover, Ni and Pb are also releasedthrough treated healthcare wastes, e-wastes, and disposed ofmetal fragments in the investigation of Roundhill landll byNyika et al.44 Adelopo et al.16 suggested that Zn is a good indi-cator of soil landll pollution and could result from uncon-trolled leachate discharge. Mn, Fe, As, and Al concentrations inPC2 were approximately equal to their background values(Table S4†), indicating that these metals can be originated fromnatural sources. Themean Co concentration in soil samples wasrelatively higher than the background level, but this metal waslocated in PC2. It was shown that in addition to a naturalsource, Co could be entered through an anthropogenic sourcesuch as spent lithium-ion batteries.45
In order to determine the condition of Tehran landll soilpollution, a comparison was made with other countries, theresults of which are summarized in Table 3. Comparing theresults of Kahrizak landll with the studied countries (Table 3)revealed wide variations in metals concentration. On the otherhand, the concentrations of heavy metals in different countrieshave wide changes, and each metal level has changed a lot ineach country. This wide variation of heavy metal concentrationmay be related to several factors such as (1) different back-ground levels of soil metals in various countries; (2) change ofwaste management policies over time; (3) use of engineeredlandll or open dumping; (4) incentive and penalize regulationsfor waste production; (5) landlls' location. Proper imple-mentation of source separation programs can decrease wastecontaining heavy metals such as paints, solvents, pesticides,paper inks, and plastics and nally reduce heavy metal pollu-tion in landll soils. Therefore, combining these factorscomplicates the possibility of precise comparing of changes inthe concentration of soil heavy metals in landll sites.
Soil pollution indicators
Enrichment factor. The results of heavy metal enrichmentin sampling sites are presented in Table 4 and illustrated inFig. S2(a).† As it can be seen, the enrichment factor for metals
Table 4 The EF values for different soil sampling points
Area Sampling points
EF values
As Cr Cd
Landll 1 0.9 2.8 1.12 0.8 3.9 2.33 1.9 3.9 0.94 0.9 2.6 0.75 0.6 2.6 0.76 0.9 5.4 1.17 1.3 2.9 0.98 1.3 3.6 0.89 1.0 4.1 0.810 1.4 3.1 0.911 1.2 1.1 1.1
Residential 12 1.9 3.4 0.9
© 2021 The Author(s). Published by the Royal Society of Chemistry
including As, Cd, Co, Mn, and Fe in most of the sampling siteswas at the slight enrichment level (1 # EF # 2), and Cr and Niwere at a moderate enrichment level (2 # EF # 5); but,a signicant enrichment level was observed for Cu, Pb, and Zn(5# EF# 20). In detail, the EF value for Cu ranged between 2.9and 13.0, in which about 67% of the sampling sites were ata moderate enrichment level. The highest enrichment factorvalues for Cu belonged to the composting site, fermentationunit, and landll worker's resting site with 13.0, 10.1, and 8.8,respectively. The EF value of Pb ranged between 1.8 and 10.8,with 75% of the sampling sites having a moderate pollutionand the enriched site for Pb as a composting unit. The EF valuefor Zn uctuated between 1.9 and 8.6, with 75% of thesampling sites having moderate enrichment levels, and thehighest level belonging to the composting site. Therefore, thecomposting site had the highest EF values for Cu, Pb, Cr, Fe,and Zn of other sampling points, and workers in this unit wereexposed to higher risks. In most works of research, EF valueslower than 2 were assumed to be the indicate a natural metalsource, while EF values greater than 2 indicated an anthro-pogenic pollution source.16 Therefore, the high EF values forCu, Pb, and Zn strongly suggested that metals were concen-trated from the extrinsic sources, mostly from waste disposedon the landll.
Individual and total ecological risk index. The calculatedEir and ERI values for the selected heavy metals in the samplingpoints are shown in Table 5 and Fig. S2(b, c).† As it can be seenin Table 5, ERI values for As, Cr, Ni, Zn, Mn, and Co were lowerthan 40, and this matter indicated that the level of pollution atthis sampling point was low. The moderate ecological risk wasobserved for Cd (Eir ¼ 75.4) at sampling point no. 2 (incineratorwastewater treatment plant) and, Cu was detected at samplingpoints no. 6, 8, and 11 due to the compost granulation site,landll worker's residence site, and fermentation site, respec-tively. Besides, Fig. S2(b and c)† shows the levels of individualand total ecological risk values. The red line in both curvesrepresents the safe mode, above which the ecological risk willstart. The higher Eir and ERI at these sampling points wasassociated with the leachate accumulation and compost
Cu Ni Pb Co Zn Mn Fe
4.0 1.9 2.8 1.9 3.1 1.3 1.76.9 2.3 4.1 2.1 6.1 1.5 1.33.5 3.7 2.9 1.8 4.1 1.4 1.63.1 1.9 1.8 1.6 1.9 1.1 1.43.4 2.1 2.6 1.9 1.9 1.2 1.6
13.0 3.8 10.8 1.9 8.6 1.3 1.93.6 2.3 2.3 2.1 2.5 1.3 1.68.8 2.9 6.1 1.5 5.1 1.1 1.33.9 2.8 2.8 1.5 2.9 1.1 1.33.5 3.1 2.9 1.5 2.6 1.0 1.4
10.1 3.0 6.5 1.6 7.2 1.1 1.62.9 4.1 2.7 1.7 4.1 1.1 1.4
RSC Adv., 2021, 11, 8080–8095 | 8089

Table 5 The Eir and ERI values for different soil sampling points
Area Sampling point
Individual risk index (Eir)
ERIAs Cd Cr Ni Cu Zn Mn Co
Landll 1 9.9 37.3 6.2 10.7 22.6 3.4 1.4 4.2 95.72 8.6 75.4 8.3 12.2 37.5 6.6 1.6 4.5 154.73 17.9 22.7 7.1 16.5 15.5 3.6 1.4 3.1 87.84 9.5 21.4 5.3 9.5 15.4 1.9 1.1 3.3 67.45 6.5 24.7 5.7 11.6 19.3 2.2 1.4 4.4 75.86 8.8 33.7 10.9 19.0 65.8 8.7 1.3 3.9 152.17 13.8 28.5 6.4 12.5 19.5 2.7 1.4 4.4 89.28 12.6 25.2 6.6 14.8 43.5 5.1 1.1 3.0 111.99 10.4 24.5 8.2 11.9 19.3 2.9 1.1 3.0 81.310 13.4 26.7 5.6 14.0 16.1 2.4 1.0 2.7 81.911 11.8 31.1 7.5 14.9 49.5 7.2 1.1 3.3 126.4
Residential 12 15.4 24.9 6.5 20.0 14.0 3.9 1.1 3.3 89.1
Table 6 Non-carcinogenic health risk values in different landfill soil sampling point in four seasons
Sampling points
THQ for each metal
HINi Cu Fe Co Zn As Cr Pb Cd
1 1.8 � 10�3 2.1 � 10�3 1.4 � 10�1 1.2 � 10�3 5.0 � 10�4 9.5 � 10�3 1.4 � 10�2 4.4 � 10�3 2.8 � 10�4 1.7 � 10�1
2 2.1 � 10�3 3.5 � 10�3 1.1 � 10�1 1.3 � 10�3 9.5 � 10�4 8.2 � 10�3 1.8 � 10�2 6.1 � 10�3 5.6 � 10�4 1.5 � 10�1
3 2.8 � 10�3 1.4 � 10�3 1.0 � 10�1 8.7 � 10�4 5.3 � 10�4 1.7 � 10�2 1.6 � 10�2 3.7 � 10�3 1.7 � 10�4 1.5 � 10�1
4 1.6 � 10�3 1.4 � 10�3 1.1 � 10�1 9.1 � 10�4 2.7 � 10�4 9.2 � 10�3 1.2 � 10�2 2.5 � 10�3 1.6 � 10�4 1.4 � 10�1
5 1.9 � 10�3 1.8 � 10�3 1.3 � 10�1 1.2 � 10�3 3.1 � 10�4 6.2 � 10�3 1.3 � 10�2 3.5 � 10�3 1.8 � 10�4 1.6 � 10�1
6 3.2 � 10�3 6.2 � 10�3 1.4 � 10�1 1.1 � 10�3 1.3 � 10�3 8.4 � 10�3 2.4 � 10�2 1.5 � 10�2 2.5 � 10�4 2.0 � 10�1
7 2.1 � 10�3 1.8 � 10�3 1.3 � 10�1 1.2 � 10�3 3.9 � 10�4 1.3 � 10�2 1.4 � 10�2 3.4 � 10�3 2.1 � 10�4 1.7 � 10�1
8 2.5 � 10�3 4.1 � 10�3 9.9 � 10�2 8.3 � 10�4 7.3 � 10�4 1.2 � 10�2 1.5 � 10�2 8.5 � 10�3 1.9 � 10�4 1.4 � 10�1
9 2.0 � 10�3 1.8 � 10�3 9.9 � 10�2 8.3 � 10�4 4.2 � 10�4 9.9 � 10�3 1.8 � 10�2 3.9 � 10�3 1.8 � 10�4 1.4 � 10�1
10 2.4 � 10�3 1.5 � 10�3 9.3 � 10�2 7.4 � 10�4 3.5 � 10�4 1.3 � 10�2 1.2 � 10�2 3.7 � 10�3 1.9 � 10�4 1.3 � 10�1
11 2.5 � 10�3 4.6 � 10�3 1.2 � 10�1 9.1 � 10�4 1.0 � 10�3 1.1 � 10�2 1.7 � 10�2 8.9 � 10�3 2.3 � 10�4 1.7 � 10�1
RSC Advances Paper
Ope
n A
cces
s A
rtic
le. P
ublis
hed
on 1
8 Fe
brua
ry 2
021.
Dow
nloa
ded
on 3
/14/
2022
2:4
9:54
AM
. T
his
artic
le is
lice
nsed
und
er a
Cre
ativ
e C
omm
ons
Attr
ibut
ion-
Non
Com
mer
cial
3.0
Unp
orte
d L
icen
ce.
View Article Online
preparation. The landll worker's residence site in Kahrizaklandll was located near the leachate lake, and this issueincreased the concentration of heavy metals at this samplingpoint. Due to the high individual risk originated from Cd andCu, it is necessary to control their discharge into the environ-ment to reduce the ecological risk. High Eir and ERI values willdamage landll workers and residents living around this site.Elias et al.49 investigated the ecological risk of element pollutionin Abdul Rahman National Park in Sabah. The results show thatthe ecological risk value was 916 and indicated that the soil hada very high contamination degree.
Based on EF and ERI results, As, Cd, Cr, Cu, Pb, Zn, Fe, Co,and Ni created a moderate to high ecological risk in the landlland residential area. Exposure to high concentrations of thesesoil heavy metals could hurt lungs and the respiratory system,reproductive system, DNA and kidney, cognition, and behaviordisorders in children.16 These pollution indices suggest thata high concentrations of soil heavy metals could adversely affecthuman and ecological health. Therefore, it is necessary toestimate carcinogenic and non-carcinogenic risks on theexposed population.
8090 | RSC Adv., 2021, 11, 8080–8095
Human health risk assessment
Non-carcinogenic risks. The non-carcinogenic risk for land-ll workers, adults, and children in the residential area posedby heavy metals through ingestion, inhalation of dust particles,and dermal absorption exposure routes were calculated andshown in Tables 6 and 7. All HQs and HI values in both landlland residential areas were within the acceptable range (HQs <1). It implies that, there were no non-carcinogenic risks fromthe investigated elements for children and adults. The HIaverage value for landll workers was 1.6� 10�1, which is below1. Moreover, the calculated mean non-carcinogenic values forall the target metals for children and adults were 8.9� 10�1 and1.4 � 10�1, respectively, which was lower than the USEPA25
guideline level (HI # 1). These results indicated no signicantdifference between non-carcinogenic risk in landll workersand adults in the residential area. These implications empha-sized that mitigation measurements should be decided toprevent a future contamination of the residential soil.
Among the 9 studied elements, the HI for both adults andchildren decreased in the order of Fe > Cr > As > Pb > Cu > Ni >Co > Zn > Cd. The higher HI value for Fe was originated from the
© 2021 The Author(s). Published by the Royal Society of Chemistry

Table 7 Comparison of non-carcinogenic and carcinogenic health risk values from exposure routes in residential area
Groups
HQ vales ILCR values
Ingestion Dermal Inhalation Ingestion Dermal Inhalation
Children 7.9 � 10�1 3.5 � 10�2 6.2 � 10�2 1.1 � 10�4 4.5 � 10�6 1.1 � 10�7
Adults 9.0 � 10�2 6.0 � 10�3 3.2 � 10�2 1.1 � 10�4 9.3 � 10�6 2.1 � 10�7
Children/adults ratio 8.5 5.4 1.9 1.0 0.48 0.51Children Ingestion/dermal ratio 22.5 25.3
Ingestion/inhalation ratio 12.7 1027.6Adults Ingestion/dermal ratio 14.3 11.9
Ingestion/inhalation ratio 2.9 516.7
Paper RSC Advances
Ope
n A
cces
s A
rtic
le. P
ublis
hed
on 1
8 Fe
brua
ry 2
021.
Dow
nloa
ded
on 3
/14/
2022
2:4
9:54
AM
. T
his
artic
le is
lice
nsed
und
er a
Cre
ativ
e C
omm
ons
Attr
ibut
ion-
Non
Com
mer
cial
3.0
Unp
orte
d L
icen
ce.
View Article Online
high concentration of this element in soil. The HI values for allthe investigated heavy metals in the landll and residentialareas were lower than the permitted level (HI # 1). It indicatedthat there was no health threat for children and adults throughsoil heavy metal exposure. The non-carcinogenic risk was esti-mated with a high degree of uncertainty and the adverse effectsof heavy metal accumulations should be considered in humanbody in long-term exposure.
The potential risk of non-carcinogenic in both sites followedthe order of ingestion > inhalation > dermal absorption and theingestion was the main exposure route. For example, theaverage HQ values for ingestion, inhalation, and dermalabsorption in landll workers were 1.1 � 10�1, 4.0 � 10�2, and8.0 � 10�3, respectively (Table S12†). Based on Table S12,† thenon-carcinogenic risk created through the ingestion route inthe landll workers was 13.6 and 2.8 times greater than that ofdermal and inhalation risks. These results indicated thatworkers should be use personal protective equipment to reducethe calculated risks. If the non-carcinogenic risk levels atdifferent sampling points were compared together, it could beconcluded that the highest HI value belongs to the compostingsite with 2.0 � 10�1 followed by the leachate collection site andthe fermentation unit with similar HI values of 1.7 � 10�1.
The non-carcinogenic values in children and adults are crosscompared through different exposure routes in Table 7 andFig. 4(a). Based on Table 7, Fe and Cr primarily contributed to
Fig. 4 (a) Non-carcinogenic and (b) carcinogenic risk of heavy metals in
© 2021 The Author(s). Published by the Royal Society of Chemistry
the HI value for children and adults. Also, the ratio of non-carcinogenic values in children to adults through ingestion,dermal absorption, and inhalation was 8.5, 5.4, and 1.9,respectively. Although the HI values for both age groups werewithin the permitted limit. This value in children was 6.5 timesgreater than that adults, suggesting that children had a greaterchance of non-carcinogenic risk than adults. The higher HIvalue in children was related to their pica behavior and hand ornger sucking, one of the most frequent metal exposure routesfor children.50 Baltas et al.51 investigated human health riskthrough heavy metal soil pollution in Turkey. They reported HIvalues for adults and children to be 1.3 � 10�1 and 1.2 � 10�1,respectively, and oral ingestion for both groups was the primaryexposure route. Their ndings were similar to our report, andchildren were more sensitive to the adverse health effects ofheavy metals due to the higher intake of soil through theirhands and mouth.
The non-carcinogenic risk associated with heavy metalpollution was simulated using the Monte Carlo model in theresidential area. Presenting the data in this format made therisk better comprehensible. A cumulative distribution plot ofthe non-carcinogenic risk due to heavy metals exposure throughpolluted soil in adults and children is presented in Fig. 5(a andb). It reects the probability distribution characteristics and the5% and 95% percentile risk values. The 5th and 95th percentilevalues indicated low-end exposure and a high level of health
children and adults.
RSC Adv., 2021, 11, 8080–8095 | 8091

Fig. 5 Monte Carlo simulation for risk estimation (a) histogram of non-carcinogenic for adults; (b) histogram of non-carcinogenic for children;(c) sensitivity analysis for non-carcinogenic risk in adults; (d) sensitivity analysis for non-carcinogenic risk in children; (e) histogram of carci-nogenic risk for adults; (f) histogram of carcinogenic risk for children; (g) sensitivity analysis for carcinogenic risk in adults; (h) sensitivity analysisfor carcinogenic risk in children.
8092 | RSC Adv., 2021, 11, 8080–8095 © 2021 The Author(s). Published by the Royal Society of Chemistry
RSC Advances Paper
Ope
n A
cces
s A
rtic
le. P
ublis
hed
on 1
8 Fe
brua
ry 2
021.
Dow
nloa
ded
on 3
/14/
2022
2:4
9:54
AM
. T
his
artic
le is
lice
nsed
und
er a
Cre
ativ
e C
omm
ons
Attr
ibut
ion-
Non
Com
mer
cial
3.0
Unp
orte
d L
icen
ce.
View Article Online
Paper RSC Advances
Ope
n A
cces
s A
rtic
le. P
ublis
hed
on 1
8 Fe
brua
ry 2
021.
Dow
nloa
ded
on 3
/14/
2022
2:4
9:54
AM
. T
his
artic
le is
lice
nsed
und
er a
Cre
ativ
e C
omm
ons
Attr
ibut
ion-
Non
Com
mer
cial
3.0
Unp
orte
d L
icen
ce.
View Article Online
risk.50,52 The calculated mean non-carcinogenic value for all theinvestigated metals was 1.4 � 10�1 for adults and 8.9 � 10�1 forchildren, respectively, which was lower than the USEPA23
guideline level (HI # 1). For an adult, the 5th and 95thpercentile deterministic values were 7.9 � 10�2 and 1.8 � 10�1;both were smaller than the upper recommended limit. More-over, for children, the 5th percentile deterministic value was 4.2� 10�1, which was lower than the upper recommended limit.But, the 95th percentile deterministic value was 1.1 � 10�1,which was higher than the upper recommended limit. It isa warning that if the situation continues this way, it willthreaten children's non-carcinogenic risk in future. Thecumulative distribution functions (CDFs) or the probabilities ofexceeding the risk of HI and ILCR in children and adults wereextracted using Monte-Carlo simulation. The simulation resultsof HI in adults showed that there was no probability of HIexceeding 1. According to the probability distributions, theprobability for HI > 1 for children was 8.4%. Besides, the valuesof Monte Carlo simulation for HI and ILCR in adults and chil-dren are presented in Table S14.† The sensitivity analysis resultsshowed that BW posed a negative effect on HI and ILCR esti-mation for both adults and children. In adults, HI estimation(Fig. 5(c)), EF, ingestion rate of the soil, ED, As, and Feconcentrations with 37.4, 8.5, 6.5, 6.0, and 2.5%, respectively,were the most inuential variables. Also, in children (Fig. 5(d)),ED, EF, ingestion rate of the soil, and Fe concentration with46.8, 27.1, 10.3, and 8.0%, respectively had a positive effect onthe non-carcinogenic risk.
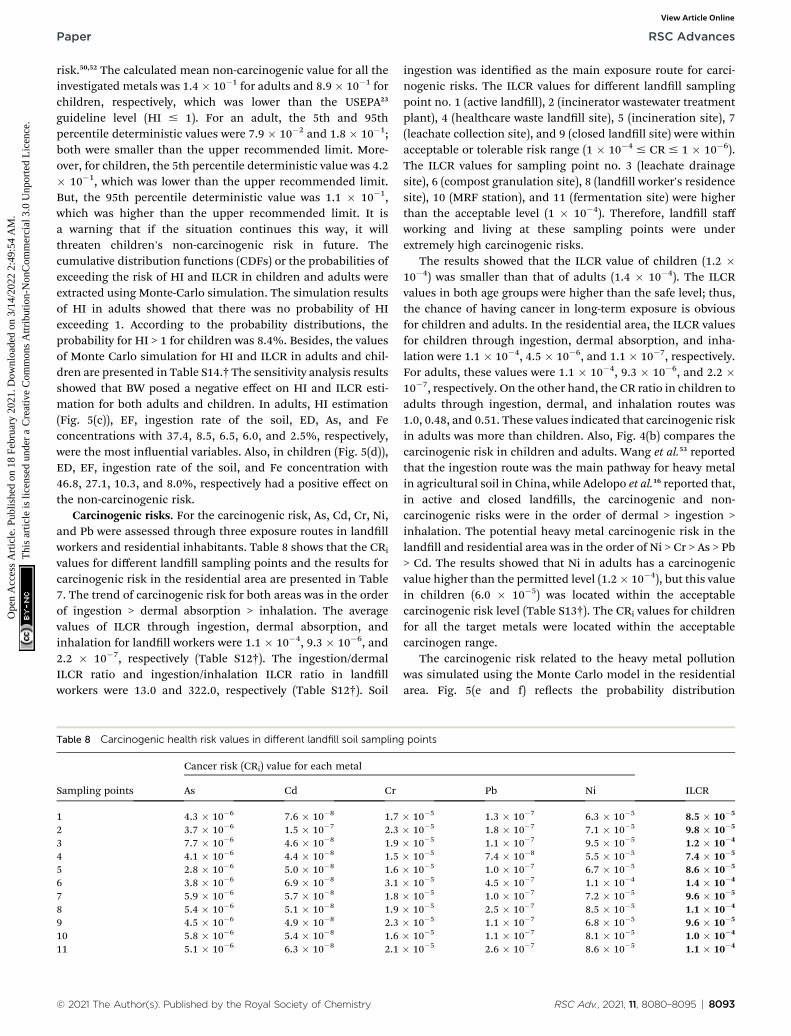
Carcinogenic risks. For the carcinogenic risk, As, Cd, Cr, Ni,and Pb were assessed through three exposure routes in landllworkers and residential inhabitants. Table 8 shows that the CRi
values for different landll sampling points and the results forcarcinogenic risk in the residential area are presented in Table7. The trend of carcinogenic risk for both areas was in the orderof ingestion > dermal absorption > inhalation. The averagevalues of ILCR through ingestion, dermal absorption, andinhalation for landll workers were 1.1 � 10�4, 9.3 � 10�6, and2.2 � 10�7, respectively (Table S12†). The ingestion/dermalILCR ratio and ingestion/inhalation ILCR ratio in landllworkers were 13.0 and 322.0, respectively (Table S12†). Soil
Table 8 Carcinogenic health risk values in different landfill soil sampling
Sampling points
Cancer risk (CRi) value for each metal
As Cd Cr
1 4.3 � 10�6 7.6 � 10�8 1.72 3.7 � 10�6 1.5 � 10�7 2.33 7.7 � 10�6 4.6 � 10�8 1.94 4.1 � 10�6 4.4 � 10�8 1.55 2.8 � 10�6 5.0 � 10�8 1.66 3.8 � 10�6 6.9 � 10�8 3.17 5.9 � 10�6 5.7 � 10�8 1.88 5.4 � 10�6 5.1 � 10�8 1.99 4.5 � 10�6 4.9 � 10�8 2.310 5.8 � 10�6 5.4 � 10�8 1.611 5.1 � 10�6 6.3 � 10�8 2.1
© 2021 The Author(s). Published by the Royal Society of Chemistry
ingestion was identied as the main exposure route for carci-nogenic risks. The ILCR values for different landll samplingpoint no. 1 (active landll), 2 (incinerator wastewater treatmentplant), 4 (healthcare waste landll site), 5 (incineration site), 7(leachate collection site), and 9 (closed landll site) were withinacceptable or tolerable risk range (1 � 10�4 # CR # 1 � 10�6).The ILCR values for sampling point no. 3 (leachate drainagesite), 6 (compost granulation site), 8 (landll worker's residencesite), 10 (MRF station), and 11 (fermentation site) were higherthan the acceptable level (1 � 10�4). Therefore, landll staffworking and living at these sampling points were underextremely high carcinogenic risks.
The results showed that the ILCR value of children (1.2 �10�4) was smaller than that of adults (1.4 � 10�4). The ILCRvalues in both age groups were higher than the safe level; thus,the chance of having cancer in long-term exposure is obviousfor children and adults. In the residential area, the ILCR valuesfor children through ingestion, dermal absorption, and inha-lation were 1.1 � 10�4, 4.5 � 10�6, and 1.1 � 10�7, respectively.For adults, these values were 1.1 � 10�4, 9.3 � 10�6, and 2.2 �10�7, respectively. On the other hand, the CR ratio in children toadults through ingestion, dermal, and inhalation routes was1.0, 0.48, and 0.51. These values indicated that carcinogenic riskin adults was more than children. Also, Fig. 4(b) compares thecarcinogenic risk in children and adults. Wang et al.53 reportedthat the ingestion route was the main pathway for heavy metalin agricultural soil in China, while Adelopo et al.16 reported that,in active and closed landlls, the carcinogenic and non-carcinogenic risks were in the order of dermal > ingestion >inhalation. The potential heavy metal carcinogenic risk in thelandll and residential area was in the order of Ni > Cr > As > Pb> Cd. The results showed that Ni in adults has a carcinogenicvalue higher than the permitted level (1.2� 10�4), but this valuein children (6.0 � 10�5) was located within the acceptablecarcinogenic risk level (Table S13†). The CRi values for childrenfor all the target metals were located within the acceptablecarcinogen range.
The carcinogenic risk related to the heavy metal pollutionwas simulated using the Monte Carlo model in the residentialarea. Fig. 5(e and f) reects the probability distribution
points
ILCRPb Ni
� 10�5 1.3 � 10�7 6.3 � 10�5 8.5 � 10�5
� 10�5 1.8 � 10�7 7.1 � 10�5 9.8 � 10�5
� 10�5 1.1 � 10�7 9.5 � 10�5 1.2 � 10�4
� 10�5 7.4 � 10�8 5.5 � 10�5 7.4 � 10�5
� 10�5 1.0 � 10�7 6.7 � 10�5 8.6 � 10�5
� 10�5 4.5 � 10�7 1.1 � 10�4 1.4 � 10�4
� 10�5 1.0 � 10�7 7.2 � 10�5 9.6 � 10�5
� 10�5 2.5 � 10�7 8.5 � 10�5 1.1 � 10�4
� 10�5 1.1 � 10�7 6.8 � 10�5 9.6 � 10�5
� 10�5 1.1 � 10�7 8.1 � 10�5 1.0 � 10�4
� 10�5 2.6 � 10�7 8.6 � 10�5 1.1 � 10�4
RSC Adv., 2021, 11, 8080–8095 | 8093

RSC Advances Paper
Ope
n A
cces
s A
rtic
le. P
ublis
hed
on 1
8 Fe
brua
ry 2
021.
Dow
nloa
ded
on 3
/14/
2022
2:4
9:54
AM
. T
his
artic
le is
lice
nsed
und
er a
Cre
ativ
e C
omm
ons
Attr
ibut
ion-
Non
Com
mer
cial
3.0
Unp
orte
d L
icen
ce.
View Article Online
characteristics, as well as the 5% and 95% percentile carcino-genic risk in adults and children. For an adult, the 5thpercentile deterministic value was 7.8 � 10�5 and the 95thpercentile value was �1.8 times higher than the upper recom-mended limit (1.8 � 10�4). Moreover, for children, the 5th and95th percentile deterministic values were 5.4 � 10�5 and 1.5 �10�4. The 95th percentile was higher than the upper recom-mended limit. Probability distributions of ILCR show theprobability for ILCR > 1 � 10�4 for children and adults were34.8 and 70.4%, respectively. According to the results, heavymetal's long-term exposure to the polluted soil increased thelikelihood of carcinogenic risk and the adverse effects in theexposed population. Gaurav and Sharma54 simulated the esti-mated health risk from heavy metal pollution in the industrialarea using Monte Carlo simulation. The results show the risk ofCr at the 95th percentile for children and adults was 3.6 and 2.2,respectively, which was quite higher than the acceptable range.
The sensitivity analysis of carcinogenic risk in Fig. 5(g) showsthe most important input variables with a positive effect oncarcinogenic risk in adults were EF, Ni concentration, soilingestion rate, ED and As concentration with 31.7, 13.9, 12.1,5.9, and 0.5%, respectively. Fig. 5(h) shows ED, EF, Ni concen-tration, soli ingestion rate, and As concentration with 41.3, 24.3,9.4, 9.0, and 2.9%, respectively, had the highest effect oncarcinogenic risk estimation in children. The higher positiveeffect of ED and EF in sensitivity analysis for children wasrelated to more contact with soil due to behavioral patterns.Fallahzadeh et al.55 conducted a study to evaluate human healthrisk through oral ingestion of trace metals in Iran and thesensitivity analysis revealed that heavy metal level and BW hadthe highest positive and negative effects on cancer estimation.Comparison of Fallahzadeh et al.55 study with our results indi-cated that soil heavy metal pollution is an important factor inIran and should be considered in decision-making. There wasa signicant carcinogenic risk associated with soil heavy metalfor landll workers and the population living near Kahrizaklandll. Heavy metals had chronic effects and could causea health problem in long-term exposure. Therefore, it isnecessary to conduct mitigation measurements in order todecrease soil heavy metal contamination in the investigatedarea.
Conclusion
The present study assessed the health and ecological riskarising from heavy metal contents in the landll and residentialsoil of Tehran, Iran. The results revealed that the highest andlowest soil heavy metals in the landll and residential regionwere related to Al and Cd. The Kruskal–Wallis analysis showedthat the levels of all heavy metals at different sampling pointsand seasons were signicantly different. The concentration ofCr, Cu, Fe, Mn, Ni, Pb, and Zn in sampling point no. 6 (com-posting site) was higher than other locations, which wasattributed to the accumulation of heavy metals during com-posting through the windrow method.
Ecological indices and PCA results strongly revealed that Pb,Cu, Zn, Cr, and Ni are concentrated from external and
8094 | RSC Adv., 2021, 11, 8080–8095
anthropogenic activities, mostly from the disposal of mixedwaste in the landll. The potential non-carcinogenic risks fol-lowed the order of ingestion > inhalation > dermal absorption,but the order of exposure routes for carcinogenic risk wasingestion > dermal absorption > inhalation. The HI value forlandll workers and residents of the residential areas lay withinthe acceptable limit (HI < 1). It indicated that there were no non-carcinogenic risks associated with the target elements. TheILCR values for landll workers in some locations were higherthan the acceptable level (1 � 10�4), and thus the chance ofhaving cancer through long-term exposure was inevitable. Thecarcinogenic risk values of Ni in adults were above the thresholdlevel (1 � 10�6), but the CR values in children for all the targetmetals were under the permitted level. The HI probabilisticanalysis using Monte Carlo simulation showed that the higherpositive effect of ED, ED, and soli ingestion rate in children wasassociated with more contact with soil due to behavioralpatterns. These results indicate that more attention should bepaid to the soil heavy metal pollution in landlls and residentialareas, especially for children in Tehran.
Author contributions
Sakine Shekoohiyan was responsible for resources, conceptu-alization, methodology, validation, writing – original dra,writing – review & editing, funding acquisition, project admin-istration, and supervision. The role of Gholamreza Moussaviwas conceptualization, methodology, writing – original dra,writing – review & editing, project administration, and advising.Shahla Karimian roles were investigation, formal analysis,writing – original dra and review.
Conflicts of interest
We declare that the authors do not have any conict of interest.
Acknowledgements
The authors would like to acknowledge the National Institutefor Medical Research Development (NIMAD) for providingnancial support under grant no. 983999. The authors are alsograteful to Tarbiat Modares University for providing technicaland nancial support under the grant no. IG-39801.
References
1 M. Petrovic, M. Sremacki, J. Radonic, I. Mihajlovic,B. Obrovski and M. Vojinovic Miloradov, Sci. Total Environ.,2018, 644, 1201–1206.
2 H. Chen, Y. Yang, W. Jiang, M. Song, Y. Wang and T. Xiang, J.Air Waste Manage. Assoc., 2017, 67, 182–195.
3 W. Ma, L. Tai, Z. Qiao, L. Zhong, Z. Wang, K. Fu and G. Chen,Sci. Total Environ., 2018, 631–632, 348–357.
4 T. E. Butt, H. M. Gouda, M. I. Baloch, P. Paul, A. A. Javadi andA. Alam, Environ. Int., 2014, 63, 149–162.
© 2021 The Author(s). Published by the Royal Society of Chemistry
Paper RSC Advances
Ope
n A
cces
s A
rtic
le. P
ublis
hed
on 1
8 Fe
brua
ry 2
021.
Dow
nloa
ded
on 3
/14/
2022
2:4
9:54
AM
. T
his
artic
le is
lice
nsed
und
er a
Cre
ativ
e C
omm
ons
Attr
ibut
ion-
Non
Com
mer
cial
3.0
Unp
orte
d L
icen
ce.
View Article Online
5 P. F. Rupani, R. Maleki Delarestaghi, H. Asadi, S. Rezania,J. Park, M. Abbaspour and S. Weilan, Int. J. Environ. Res.Public Health, 2019, 16, 979.
6 N. Ferronato and V. Torretta, Int. J. Environ. Res. PublicHealth, 2019, 16, 1060.
7 G. Li, J. Chen, W. Yan and N. Sang, J. Environ. Sci., 2020, 55,206–213.
8 M. Liu, Z. Han and Y. Yang, RSC Adv., 2019, 9, 21893.9 C. M. Ohajinwa, P. M. van Bodegom, O. Osibanjo, Q. Xie,J. Chen, M. G. Vijver and W. J. G. M. Peijnenburg, Int. J.Environ. Res. Public Health, 2019, 16, 906.
10 H. Huang, C. Lin, R. Yu, Y. Yan, G. Hu and H. Li, RSC Adv.,2019, 9, 14736.
11 Z. Wu, L. Zhang, T. Xia, X. Jia and S. Wang, RSC Adv., 2020,10, 23066.
12 M. Liu, Z. Han and Y. Yang, RSC Adv., 2019, 9, 21893.13 S. Shekoohiyan, M. Ghoochani, A. Mohagheghian,
A. H. Mahvi, M. Yunesian and S. Nazmara, Iran. J. Environ.Health Sci. Eng., 2012, 9, 37.
14 Q. Wang, J. Liu and S. Cheng, Environ. Monit. Assess., 2014,187, 4178.
15 M. D. Vaverkova, J. Elbl, M. Radziemska, D. Adamcova,A. Kintl, L. Balakova, S. Barton, J. Hladky, J. Kynicky andM. Brtnicky, Chemosphere, 2018, 208, 569–578.
16 A. O. Adelopo, P. I. Haris, B. I. Alo, K. Huddersman andR. O. Jenkins, Waste Manag., 2018, 78, 227–237.
17 D. Krcmar, S. Tenodi, N. Grba, D. Kerkez, M. Watson,S. Roncevic and B. Dalmacija, Sci. Total Environ., 2018,615, 1341–1354.
18 M. Mari, M. Nadal, M. Schuhmacher and J. L. Domingo,Environ. Int., 2009, 35, 1034–1039.
19 A. A. Agbeshie, R. Adjei, J. Anokye and A. Banunle, Sci. Afr.,2020, 23, e00390.
20 R. P. Breckenridge and A. B. Crockett, Environ. Monit. Assess.,1998, 51, 621–656.
21 S. Ahmadi Doabi, M. Karami, M. Afyuni and M. Yeganeh,Ecotoxicol. Environ. Saf., 2018, 163, 153–164.
22 Y. Wang, Y. Wei, P. Guo, J. Pan, Q. Wu and N. Liu, Mar.Pollut. Bull., 2016, 113, 240–246.
23 M. Varol, Environ. Res., 2020, 187, 109664.24 L. Hakanson, Water Res., 1980, 14, 975–1001.25 A. Mohammadi, A. Zarei, M. Esmaeilzadeh, M. Taghavi,
M. Youse, Z. Youse, F. Sedighi and S. Javan, Biol. TraceElem. Res., 2019, 195, 343–352.
26 USEPA, Exposure factors handbook, Office of health andenvironmental assessment, Washington, DC 20460, 1989.
27 USEPA, Revised Human Health Risk Assessment Hudson RiverPCBs Reassessment RI/FS, 2000.
28 IARC, Some Metals and Metallic Compounds, IARCmonographs on the evaluation of carcinogenic risks tohumans. World Health Organization, Geneva, 1980.
29 N. Shalyari, A. Alinejad, A. H. G. Hashemi, M. Radfard andM. Dehghani, MethodsX, 2019, 6, 1812–1821.
30 C. Liu, J. Cui, G. Jiang, X. Chen, L. Wang and C. Fang, SoilSediment Contam., 2013, 22, 390–403.
© 2021 The Author(s). Published by the Royal Society of Chemistry
31 J. Rovira, L. Vilavert, M. Nadal, M. Schuhmacher andJ. L. Domingo, Waste Manag., 2015, 43, 168–175.
32 D. L. Rimmer, C. G. Vizard, T. Pless-Mulloli, I. Singleton,I. V. S. Air and Z. Keatinge, Sci. Total Environ., 2006, 356,207–216.
33 J. M. Nyika, E. K. Onyari, M. O. Dinka and S. B. Mishra,Orient. J. Chem., 2019, 35, 1286–1296.
34 Z. Sakawi, M. R. Ariffin, S. M. S. Abdullah and M. F. M. Jali,Res. J. Appl. Sci., Eng. Technol., 2013, 5, 8619–8625.
35 M. Nikravesh, A. Karimi, I. Esfandiarpour Borujeni andA. Fotovat, Casp. J. Environ. Sci., 2019, 17, 163–174.
36 M. Aljaradin and K. M Persson, Open Waste Manage. J., 2012,5, 28–39.
37 N. Shariatmadari, A. H. Sadeghpour and M. J. Mokhtari, Int.J. Civ. Eng., 2015, 13, 126–136.
38 Z. Kong, X. Wang, Q. Liu, T. Li, X. Chen, L. Chai, D. Liu andQ. Shen, J. Environ. Manage., 2018, 207, 366–377.
39 E. Mahmoudabadi, F. Sarmadian and R. N. Moghaddam, Int.J. Environ. Sci. Technol., 2015, 12, 3283–3298.
40 Z. Sakawi, M. R. Ariffin, S. M. S. Abdullah and M. F. M. Jali,Res. J. Appl. Sci., Eng. Technol., 2013, 5, 8619–8625.
41 J. Marrugo-Negrete, J. Pinedo-Hernandez and S. Dıez,Environ. Res., 2017, 154, 380–388.
42 Y. Han, H. Xie, W. Liu, H. Li, M. Wang, X. Chen, X. Liao andN. Yan, Front. Environ. Sci. Eng., 2016, 10, 129–139.
43 Y. Y. Long, D. S. Shen, H. T. Wang, W. J. Lu and Y. Zhao, J.Hazard. Mater., 2011, 186, 1082–1087.
44 J. M. Nyika and E. K. Onyari, Air, Soil Water Res., 2019, 12, 1–8.
45 J. Zhao, B. Zhang, H. Xie, J. Qu, X. Qu, P. Xing, P. Xing andH. Yin, Environ. Res., 2020, 181, 108803.
46 W. Swati, P. Ghosh and I. S. Thakur, Ecotoxicol. Environ. Saf.,2017, 143, 120–128.
47 B. Jayanthi, C. U. Emenike, S. H. Auta, P. Agamuthu andS. H. Fauziah, Int. Biodeterior. Biodegrad., 2017, 119, 467–475.
48 F. C. Bretzel and M. Calderisi, Environ. Monit. Assess., 2011,182, 523–533.
49 M. S. Elias, M. S. Hamzah, S. A. Rahman, N. A. A. Salim,W. B. Siong and E. Sanuri, AIP Conf. Proc., 2014, 196–206.
50 X. Wei, B. Gao, P. Wang, H. Zhou and J. Lu, Ecotoxicol.Environ. Saf., 2015, 112, 186–192.
51 H. Baltas, M. Sirin, E. Gokbayrak and E. Ozcelik,Chemosphere, 2020, 241, 125015.
52 E. Durmusoglu, F. Taspinar and A. Karademir, J. Hazard.Mater., 2010, 176, 870–887.
53 S. Wang, Y. K. Kalkhajeh, Z. Qin and W. Jiao, Environ. Res.,2020, 188, 109661.
54 V. K. Gaurav and C. Sharma, Sustain. Comput. Inf. Systems,2019, 100310, DOI: 10.1016/j.suscom.2019.01.012.
55 R. A. Fallahzadeh, M. T. Ghaneian, M. Miri andM. M. Dashti, Environ. Sci. Pollut. Res., 2017, 24, 24790–24802.
RSC Adv., 2021, 11, 8080–8095 | 8095