Embed Size (px)
DESCRIPTION
Simulation of Investment Returns of Toll Projects, Supported by a grant from the U.S. Department of Transportation, University Transportation Centers Program and general revenues from the State of Texas.
Citation preview

Form DOT F 1700.7 (8-72) Reproduction of completed page authorized
1. Report No.
SWUTC/13/600451-00075-1 2. Government Accession No.
3. Recipient's Catalog No.
4. Title and Subtitle
Simulation of Investment Returns of Toll Projects 5. Report Date
August 2013 6. Performing Organization Code
7. Author(s)
Weiyuan Yuwen and Zhanmin Zhang 8. Performing Organization Report No.
476660-00075-1 9. Performing Organization Name and Address
Center for Transportation Research
University of Texas at Austin
1616 Guadalupe Street, Suite 4.200
Austin, Texas 78701
10. Work Unit No. (TRAIS)
11. Contract or Grant No.
DTRT12-G-UTC06
12. Sponsoring Agency Name and Address
Southwest Region University Transportation Center
Texas A&M Transportation Institute
Texas A&M University System
College Station, Texas 77843-3135
13. Type of Report and Period Covered
Final Technical
May 2012 – August 2013 14. Sponsoring Agency Code
15. Supplementary Notes
Supported by a grant from the U.S. Department of Transportation, University Transportation Centers
Program and general revenues from the State of Texas. 16. Abstract
This research develops a methodological framework to illustrate key stages in applying the
simulation of investment returns of toll projects, acting as an example process of helping agencies conduct
numerical risk analysis by taking certain uncertainties associated with toll projects into consideration. The
numerical financial model provides a deterministic financial evaluation for the project. Next, there are four
risk sources identified in this research, including project-based risks, cost-based risks, toll-based risks and
finance-based risks. For each risk source, critical variables are recognized and probability distributions are
suggested. The deterministic financial evaluation result is obtained through the projected single-value
estimates of these variables. By considering the variability associated with the components of a project, the
Monte Carlo simulation technique is used to estimate the overall project risks. Risk simulation results are
interpreted through various numerical measures of project’s risks, which further provide agencies with
quantitative information to set investment decision criteria. For risk optimization, exploration of optimal
value-combination of variables and utilization of single-variable control method are discussed, which could
assist agencies in setting threshold toll prices in order to achieve the goal revenue and maximize potential
returns on the investment. The risk analysis, consisting of risk simulation and risk optimization, can give the
statistical distribution of investment returns for a project under analysis, providing decision makers with a
direct approach to the evaluation of the projects’ financial risks and the development of recommendations
for risk control measures.
17. Key Words
Public Private Partnership, Risk
Analysis, Financial Evaluation, Toll
Projects
18. Distribution Statement
No restrictions. This document is available to the public through
NTIS:
National Technical Information Service
5285 Port Royal Road
Springfield, Virginia 22161 19. Security Classif.(of this report)
Unclassified 20. Security Classif.(of this page)
Unclassified 21. No. of Pages
53 22. Price

SIMULATION OF INVESTMENT RETURNS OF TOLL PROJECTS
by
Weiyuan Yuwen
Graduate Research Assistant
Center for Transportation Research
The University of Texas at Austin
and
Zhanmin Zhang
Associate Professor
Center for Transportation Research
The University of Texas at Austin
SWUTC/13/600451-00075-1
“Develop a System to Support Preparation of Life-Cycle Budget Needs”
Performed in cooperation with the
Southwest Region University Transportation Center
Texas A&M Transportation Institute
August 2013
CENTER FOR TRANSPORTATION RESEARCH
University of Texas at Austin
Austin, Texas 78712

iv
v
EXECUTIVE SUMMARY
Public-private partnership (PPP) is an innovative funding mechanism for state Departments of
Transportation (DOTs) to utilize private capital and expertise in transportation infrastructure
projects, so as to increase funding options to bridge the budget gap of DOTs. In this report
research, a literature synthesis was conducted to clarify key concepts including reviews on the
literature of PPP and toll projects, investigation of the state-of-art financial models, presentation
of problems in toll revenue estimation and summarization of the significance of conducting risk
management in PPP investments.
Financial models can provide public sectors and private partners with an analysis tool to evaluate
the potential returns of investments and financial feasibility of the projects. This research
develops a methodological framework to illustrate key stages in applying the simulation of
investment returns of toll projects. This methodological framework of risk analysis for financing
toll projects acts as an example process of helping agencies conduct numerical risk analysis by
taking certain uncertainties associated with toll projects into consideration. The numerical
financial model provides a deterministic financial evaluation for the project. Next, there are four
risk sources identified in this research, including project-based risks, cost-based risks, toll-based
risks and finance-based risks.
For each risk source, critical variables are recognized. Furthermore, probability distributions of
identified variables are suggested. The deterministic financial evaluation result is obtained
through the projected single-value estimates of these variables. By considering the variability
associated with the components of a project, the Monte Carlo simulation technique is used to
estimate the overall project risks. Risk simulation results are interpreted through various
numerical measures of project’s risks, which further provide agencies with quantitative
information to set investment decision criteria.
For risk optimization, there are two main functions. One is to explore the optimal value-
combination of variables so as to help set risk control benchmarks. The other is to utilize the
single-variable control method to investigate the optimal total revenue considering the impact of
toll prices on the traffic demand, which could assist agencies in setting threshold toll prices in
order to achieve the goal revenue and maximize potential returns on the investment.
The risk analysis, consisting of risk simulation and risk optimization, can give the statistical
distribution of investment returns for a project under analysis, providing decision makers with a
direct approach to the evaluation of the projects’ financial risks and the development of
recommendations for risk control measures.

vi
DISCLAIMER
The contents of this report reflect on the views of the authors, who are responsible for the facts
and the accuracy of the information presented herein. This document is disseminated under the
sponsorship of the Department of Transportation, University Transportation Centers Program, in
the interested of information exchange. Mention of trade names or commercial products does
not constitute endorsement or recommendation for use.
ACKNOWLEDGMENT
The authors recognize that support for this research was provided by a grant from the U.S.
Department of Transportation, University Transportation Centers program to the Southwest
Region University Transportation Center which is funded, in part, with general revenue funds
from the State of Texas.
vii
TABLE OF CONTENTS
LIST OF TABLES ....................................................................................................................... ix
LIST OF FIGURES .......................................................................................................................x
1.1 BACKGROUND AND MOTIVATION ....................................................................................1
1.2 RESEARCH OBJECTIVES ...................................................................................................1
1.3 RESEARCH SCOPE .............................................................................................................1
1.4 REPORT OUTLINE .............................................................................................................2
1.5 SUMMARY AND CONCLUSIONS .........................................................................................2
CHAPTER 2 LITERATURE REVIEW ......................................................................................3
2.1 PUBLIC-PRIVATE PARTNERSHIPS (PPPS) ........................................................................3
2.2 TOLL PROJECTS................................................................................................................3
2.2.1 Toll Project Types ...............................................................................................3
2.2.2 Worldwide and American Experiences and Lessons .......................................4
2.3 STATE-OF-THE-ART OF FINANCIAL MODELS ..................................................................5
2.4 RISK MANAGEMENT .........................................................................................................6
2.4.1 Project Risks ........................................................................................................6
2.4.2 Risk Management ...............................................................................................6
2.4.3 Toll Revenue Estimation ....................................................................................7
2.5 SUMMARY .........................................................................................................................8
CHAPTER 3 METHODOLOGY ...............................................................................................11
3.1 METHODOLOGICAL FRAMEWORK .................................................................................11
3.2 PROJECT DATA REQUIREMENT .....................................................................................12
3.2.1 General Project Information ...........................................................................13
3.2.2 Project Costs ......................................................................................................13
3.2.3 Traffic and Revenue .........................................................................................13
3.2.4 Financial Structure ...........................................................................................14
3.2.5 Macroeconomic Data ........................................................................................14
3.3 FINANCIAL ANALYSIS .....................................................................................................14
3.4 NUMERICAL RISK ANALYSIS ..........................................................................................15
3.4.1 Risk Simulation .................................................................................................15
viii
3.4.2 Risk Optimization .............................................................................................16
CHAPTER 4 CASE STUDY .......................................................................................................19
4.1 DATA SOURCES AND COLLECTIONS ...............................................................................19
4.2 FINANCIAL EVALUATION ...............................................................................................23
4.3 RISK SIMULATION ..........................................................................................................24
4.3.1 Variables Identification ....................................................................................24
4.3.2 Risk Simulation Results ....................................................................................27
4.4 RISK OPTIMIZATION ......................................................................................................32
4.5 DISCUSSION OF RESULTS ................................................................................................33
4.5.1 Analyses Results ................................................................................................33
4.5.2 Additional Insights ............................................................................................35
4.5.3 Summary ............................................................................................................36
CHAPTER 5 CONLUSIONS AND RECOMMENDATIONS ................................................38
REFERENCES .............................................................................................................................40

ix
LIST OF TABLES
Table 1. Project P12 General Information [Pantelias 2009]. ........................................................ 20
Table 2. Project P12 Cost Information [Pantelias 2009]. ............................................................. 20
Table 3. Project P12 Traffic and Revenue Information [Pantelias 2009]. .................................... 21
Table 4. Project P12 Financial Structure [Pantelias 2009]. .......................................................... 22
Table 5. Project P12 Economic Information [Pantelias 2009]. .................................................... 23
Table 6. Financial Evaluation Results. ......................................................................................... 24
Table 7. Risk Simulation Results. ................................................................................................. 31
Table 8. Results Comparison. ....................................................................................................... 35
x
LIST OF FIGURES
Figure 1. Methodological Framework for Risk Analysis. ............................................................ 12
Figure 2. Conjecture of the Developing Trend of Total Revenue. ............................................... 17
Figure 3. Simulation Result of NPV. ............................................................................................ 28
Figure 4. Simulation Result of the IRR. ....................................................................................... 29
Figure 5. Simulation Result of the Minimum ADSCR for Senior Bank Debt. ............................ 30
Figure 6. Simulation Result of the Minimum ADSCR for Combined Debts. .............................. 31

1
INTRODUCTION
1.1 BACKGROUND AND MOTIVATION
As one of the options to address the serious budgetary shortages caused by the increasing
public demand for transportation services and available funding for transportation agencies to
maintain, replace or expand the highway system, public-private partnership (PPP) is used as an
innovative funding mechanism for state DOTs to introduce private capital and expertise into the
development of transportation infrastructure [Rall et al. 2010].
Since PPPs are a relatively recent funding mechanism, agencies and financial institutions
are still exploring and learning how to employ this tool. Although the understanding of the long-
term economics of PPPs is not fully completed, highway agencies have seen PPPs as a way to
provide funding flexibility and relieve budget shortfalls. Therefore, some PPP projects have been
implemented ahead of the completion of necessary theoretical research [ADB 2008, Reinhardt
2011, Robert 2011]. However, not all the PPPs are successful experiences [Engel et al. 2007, Mu
et al. 2011]. Since the PPP projects are subject to many forces outside the control of agencies,
there have been some disappointing PPP experiences during project implementation in Latin
America during 1990s, followed by contract renegotiations and revisions to the benefit of
concessionaires [Guasch 2004]. In order to provide the public with a quantifiable measure of the
investment value in PPP projects, considering project uncertainties, it is important to find
applicable financial models and employ the numerical risk analysis of the selected financial
model for each PPP project.
1.2 RESEARCH OBJECTIVES
This research seeks to provide a statistically-based methodology for simulation of
investment returns of PPP projects, especially for toll projects. The proposed methodology is
used as a supplemental analysis tool for financial models with which evaluation results are
deterministic rather than dispersed, neglecting uncertainties and risks in projects. The Monte
Carlo simulation technique is applied to numerically assess the overall project risks. As a whole,
this framework can help both public and private sectors identify critical risk sources, measure the
overall project risks and determine key control measures to help secure the financial reliability of
toll projects. Also, based on the interpretation of risk analysis results, investors can evaluate
financial risks of PPP projects and set investment decision criteria.
1.3 RESEARCH SCOPE
The scope of this research is to develop a methodological framework which provides risk
analysis to supplement financial evaluation in toll projects. To demonstrate the methodology, a
section Project P12 from Trans Texas Corridor-35 (TTC-35) is employed as a case study to
illustrate the development of risk assessment, ending up with financial evaluation results and
numerical measures of the overall project risks. The methodological framework contains major
steps in developing the risk analysis and key techniques to achieve numerical measures of the
project risks. The proposed methodology for the simulation of investment returns of toll projects
can be applied in the U.S. and may provide a reference for other areas to help agencies and
investors assess project risks and facilitate effective decision making process.

2
1.4 REPORT OUTLINE
The first chapter briefly introduces the background and motivation for this research, as
well as the objectives of this report. Chapter 2 presents a comprehensive literature review
covering various topics based on the background of this research. These topics include public-
private partnerships, toll projects, state-of-the-art of financial models for PPP projects and risk
management. Chapter 3 describes the methodology for the simulation of investment returns of
toll projects, including a methodological framework outlining the development of the
methodology and discussions on the implementation of key stages shown in the framework. In
chapter 4, a case study is conducted based on the proposed methodology, including financial
evaluation, risk evaluation, and risk optimization. Chapter 5 gives a summary of the research
effort and presents potential directions for future research.
1.5 SUMMARY AND CONCLUSIONS
This report aims to present a methodological framework to conduct a statistically-based
risk analysis, which is a supplemental analysis tool for the financial evaluation of toll projects.
Major risk resources are identified in order to help agencies seek out potential variables existing
in the toll projects. By employing the Monte Carlo simulation technique, risk simulation
provides decision makers with numerical measures of risks of toll projects. Additionally, risk
optimization assists agencies in exploring the optimal combination of risk control measures on
major risks. Also, by utilizing the single-variable control method, risk optimization could help
set the optimal toll price, thus to maximize the total toll revenue. The proposed methodology of
risk analysis, which combines risk simulation and risk optimization, provides project partners
with a comprehensive risk assessment of financing toll projects, which helps make better
investment decisions. The literature review in chapter 2 provides an overview of the background
literature on various topics pertaining to this report research: definitions of public-private
partnerships and toll projects, state-of-the-art studies on financing models in PPP projects, the
methodologies of applying risk analysis in project management and problems in up-to-date
estimations of the toll revenue.

3
CHAPTER 2 LITERATURE REVIEW
2.1 PUBLIC-PRIVATE PARTNERSHIPS (PPPS)
Facing the budgetary shortage, DOTs are exploring options for introducing capital and
expertise from the private sector into transportation infrastructure projects. Among various
definitions provided by a wide range of literature resources, the most widely adopted definition
of PPP is provided by the U.S. Department of Transportation [U.S.DOT 2004]:
A public-private partnership is a contractual agreement formed between public and
private sector partners, which allows more private sector participation than is traditional. The
agreements usually involve a government agency contracting with a private company to
renovate, construct, operate, maintain, and/or manage a facility or system. While the public
sector usually retains ownership in the facility or system, the private party will be given
additional decision rights in determining how the project or task will be completed.
In the U.S., the first major PPP project was the E-470 Tollway east of Denver project
which began construction in July, 1989 and was constructed through a Design-Build (DB)
contract budgeted at $323-million. As of today, 24 states and the District of Columbia have
initiated the PPP process, including Alaska, Alabama, Arizona, California, Colorado, Florida,
Illinois, Indiana, Maryland, Massachusetts, Minnesota, Missouri, Nevada, New Jersey, New
Mexico, New York, North Carolina, Oregon, Rhode Island, South Carolina, Texas, Utah,
Virginia and Washington. These states have initiated a total of at least 96 PPP projects, worth
$54.3 billion [Reinhardt 2011]. Some state DOTs have adjusted their organization structures in
order to provide management teams to make better use of this innovative financing resource. For
example, Caltrans added a separate branch to its organizational structure which is in charge of
PPP projects. This organizational structure benefits Caltrans with the state-of-art innovative
transportation financing methods, and equips Caltrans with the most creative and updated
methods to finance and develop its projects [Robert 2011].
2.2 TOLL PROJECTS
2.2.1 Toll Project Types
Toll projects are one of the infrastructure project types that have used PPP financing. The
purpose of a toll project is mainly to alleviate congestion of the road network and to increase the
funding flexibility for road projects. Generally, there are two main types of toll projects, toll
roads and managed lanes. In Norway, there is also one specific toll project type, which is called
as a ‘toll ring’ [Meland and Polak 1993]. A toll ring is a cordon toll scheme with toll stations
positioned on a toll loop encircling the city center. Researcher categorized current existing toll
routes into four groups by performance and locations, despite of some recognized overlaps: 1)
routes in high congested areas and suburban areas; 2) outlying routes in metropolitan areas; 3)
developed corridors which are parallel to existing roads; and 4) routes in the least developed
areas [Muller and Buono 2002].
Toll roads have been among the top-listed options for DOTs to solve congestion and
budgetary shortages for new transportation infrastructure projects on new locations, which are
also known as ‘Greenfield projects’. As for managed lanes, different agencies and researchers
give different definitions, but there are some common elements included: 1) within freeway cross
sections and separated from general lanes; 2) with high operational flexibility enabling the
adjustment of operation actions according to the changing traffic volume and needs; 3) applying

4
various combinations of tools and techniques in the operation management to facilitate the
operational flexibility and to achieve the optimal operation condition continuously; and 4)
including three main types of operational strategies, namely pricing, vehicle eligibility and
access control [FHWA 2004(a), FHWA 2004(b), FHWA 2004(c)].
There have been long-term discussions on the differences among High Occupancy Toll
(HOT) lanes, High Occupancy Vehicle (HOV) lanes, managed lanes and toll roads. The major
difference between toll roads and managed lanes is that toll roads are brand-new projects with all
lanes tolled, while managed lanes are lanes reserved next to free lanes providing users with toll
choices in order to avoid congestions [NCTCOG 2011]. There are more confusions concerning
the difference among HOT, HOV and managed lanes. Generally, most HOT lanes were
converted from HOV lanes. Many states established HOV lanes within a highway system as free
lanes reserved for high occupancy vehicles. Since most congested areas are highly developed,
leaving few available spaces for Greenfield projects, more DOTs tend to convert under-utilized
HOV lanes to HOT lanes. HOT lanes generally operate immediately parallel to existing freeway
lanes. HOT lanes provide customers with a choice either to use the congested free lanes or to pay
a toll to use the HOT lanes. When comparing HOT lanes with managed lanes, some agencies’
decision makers have thought that managed lanes could be treated as a type of HOT lanes where
high occupancy vehicles receive no discount for using reserved lanes [Transurban 2007];
whereas some other agencies consider managed lanes as a broader definition of HOT lanes,
where management tools and techniques are applied to improve freeway efficiency and
community objectives. FHWA prepared a research report to explain the definition and concept of
managed lanes [FHWA 2004(c)]. The definition included single- and multi-facet operational
strategies. Single-facet operational management strategies include pricing, or vehicle eligibility,
or access control. Versus, multi-facet operational management combines these single-facet
strategies to optimize managed lanes’ performance. However, multi-facet operational
management introduces increased complexity.
2.2.2 Worldwide and American Experiences and Lessons
Around the world, there have been more than 30 years of development and exploration
for viable approaches to applying toll systems. In 1975, road pricing was first introduced to
Singapore, in a form of a full-scale urban road pricing system called Area Licensing Scheme
(ALS), in order to reduce peak time traffic flows. In 1998, further development of the ALS
involved upgrading the original manual system to the automated Electronic Road Pricing (ERP)
system [Menon 2000, Olszewski and Xie 2005]. During this same period, France led in the
intellectual development of efficient pricing and had successful experiences in intercity road
pricing. However, because of the strong public and legislative difficulties in implementing urban
road pricing systems, France lags in the development of urban road system pricing policy [de
Palma and Lindsey 2006]. Canada built the world’s first all-electronic and barrier-free toll
highway in 1997, with variable toll fees depending on vehicle type, time of day and weekday.
Since that project there have not been many practices of toll facilities in Canada [Lindsey 2008].
In Norway, some researchers have reported that the impacts of the toll ring on the total
traffic crossing the toll ring and users’ choice of modes are quite small [Meland and Polak 1993,
Ramjerdi et al. 2004]. Statistics on the Bergen toll ring in Norway showed little impact of tolls
on travel behavior, which was less than the expected 3 percent reduction in traffic by authorities
[Ramjerdi et al. 2004]. Later studies on the Trondheim toll ring found that the major effect of toll
scheme on driving behavior is the retiming of trips [Hayes and Cabrero 1995]. Also, after the set-
5
up of the toll ring in Trondheim, car passenger and bicycle trips decreased by 14 to 15 percent
and public transport trips increased by 8 percent, which may be affected by combined effects of
the Toll Ring and improvements in the bicycle road network [Meland 1995]. Studies on the Oslo
toll ring found that the toll scheme had a large range of impacts on total traffic by decreasing the
number of cars crossing the ring, from an insignificant amount to 10 percent. Regarding the toll
scheme’s impact on the demand of public transport, no significant impact was shown [Ramjerdi
1994, Ramjerdi et al. 2004].
In the U.S., for states such as Texas and California, there have already been toll projects
in operation. Other states, such as Georgia, Maryland, North Carolina, Oregon, Virginia are also
considering using toll facilities [Bervell et al. 2007]. In Texas, the current PPP projects include
SH 130 (DB-Concession), US 183A (DB), SH 121 in Dallas/Ft. Worth (Concession), Central
Texas Turnpike, DFW Connector and North Tarrant Expressway (Concession), LBJ 35
(Concession). Also, there is a new HOT project under development in Austin along the Loop 1
‘Mopac’ corridor, with a length of 11 miles, from Parmer Lane to Cesar Chavez Street [CTRMA
2012].
2.3 STATE-OF-THE-ART OF FINANCIAL MODELS
In order to formulate external and non-numerical factors, it is important to develop
practical financial models so that the financial feasibility of PPP projects can be analyzed. The
financial modeling result could provide project partners with numerical evaluation results to
assess the investment returns in PPP projects. Financial models, on one hand, can help the public
sector assess the amount of potential financial contribution to the project; on the other hand,
these models can help demonstrate whether PPP projects are financially attractive to the private
sectors or not. A significant amount of effort has been made by other researchers to conduct
financial analysis of PPP projects. For example, the World Bank–Public-private Infrastructure
Advisory Facility (PPIAF) developed financial models in the ‘Toolkit for Public Private
Partnerships in Roads and Highways’, in order to provide public authorities in developing
countries with a key reference source to understand the PPP-related issues, to give guidance for
the policy making process and reforms, and to conduct the selection, implementation and
management during the PPP process [PPIAF 2009].
In this Toolkit, there are two financial models presented, the graphical model and the
numerical model. The graphical model is intended to help users with limited financial
backgrounds to become more familiar with basic knowledge of financial simulations, by
visualizing the impact of adjustments in key project assumptions on the project cash flow. The
numerical model considers more complex financial variables, and provides public authorities
with detailed and developed financial evaluations. The numerical model can help public officials
conduct pre-feasibility analyses in assessing multiple possible PPP options. The model provides
methods to check all potential data input combinations to ensure consistency. This is done by
establishing an extensive range of feasible input combinations [PPIAF 2009]. In order to
estimate the financial outcome, financial indices including the net present value (NPV), the
internal rate of return (IRR), project life cover ratio (PLCR) and average life of total debt are
taken into consideration in the financial analysis.
6
2.4 RISK MANAGEMENT
2.4.1 Project Risks
Project risks are uncertainties that might affect project objectives, such as budget, time,
performance, quality and client satisfaction. Risks are the combined impacts of the probability of
a specified uncertain event and its consequences. The risks of projects come from a large number
of sources, including technology, project duration, finance, policy and contractual terms.
Researcher summed up eight types of risks and their max/min assessment values, including
policy, finance, nature (disaster), market, production, technology, management and completion
[Cheng et al. 2010]. The combination of different uncertainties increases the complexity of risk
analysis in infrastructure projects. There are two major areas of focus in risk management
research, the first focus area is an individuals’ attitude toward risk and the analysts’ ability to
identify and model this process, the second focus area is the analysis of projects to assess the
overall risks of these projects [Williams 1993]. These risks can lead to negative consequences,
such as investment loss and schedule delay, as well as positive events, such as increased profits
[Roll 1982, Gabel 2010]. For example, one typical type of projects’ risks involves inaccurate
cost forecasting. Based on the Danish Flyvbjerg database the inaccuracy in cost forecasts for
transportation infrastructure projects is averagely 20.4 percent for roads, 44.7 percent for rail,
and 33.8 percent for bridges and tunnels [Flyvbjerg 2006]. There are many possible explanations
for inaccurate forecasting including technical, financial and political-economic aspects. For
instance, the misuse of forecasting models and unreliable or outdated data could lead to
technically inaccuracy [Vanston et al. 2004]. Hence, in practical situations, actual accuracy
distributions are non-normal, rather than normal, with averages significantly away from zero.
Additionally, the approval process also causes many uncertainties in the project duration,
which can bring the project huge potential time costs. The approval phase lies between the
planning of the project and the signing of contracts in the project life cycle, which impacts
significantly on the commencement of projects. For example, environmental clearances are
required in the approval process for transportation infrastructure projects, due to potential
endangered species, historic areas, archaeological sites, noise, air and water pollution potential.
There is uncertainty in the amount of time necessary to obtain environmental clearances from
agencies outside the control of the DOTs or concessionaires. In India, among 441 road projects
by the National Highway Authority of India (NHAI), 137 projects were delayed because of
environmental clearances and land acquisition [Vilventhan and Kalidindi 2012]. In order to
balance conflicts between technical approaches and political feasibility, the process of
collaborative environmental planning and management (CEPM) is applied to the entire policy
process as a result of executive order or legislative mandate. Researcher cited an Ohio case study
to explain the process of CEPM, which involved citizens in the policy process, along with
government and interested stakeholders [Kellogg 2009]. However, the employment of CEPM
process cannot eliminate all potential legislative or political risks in infrastructure projects.
Investors and agencies still need to pay attention to the possible occurrences of unplanned
change orders due to policies and other socio-economic factors.
2.4.2 Risk Management
As discussed previously, uncertainties and risks vary among infrastructure projects and
projects with similar risks might also vary with regard to the ability to quantify the risks
depending on political issues, potential cost changes and other factors. Appropriate risk

7
management tools can help senior management recognize these potential uncertainties and
evaluate and forecast possible outcomes. Additionally, risk management can assist sponsors or
public sectors in taking proactive responses to allocate resources effectively so as to minimize
future actions that can disrupt the project. Risk analysis comprises identifying specific risks
associated with a given project and determining the likelihood of occurrence and impacts of each
identified risk. Risk analysis serves as one important part in the risk management process, which
can be used as a tool to support decision-makers in identifying risks and determining risk control
measures responding to identified major risks. Furthermore, by exploring all possible risks and
their consequences, risk analysis can help investors identify both pitfalls and new opportunities
in investments.
Different risk analysis methods have been applied in the risk analysis, such as Analytic
Hierarchy Process, Bayesian algorithm and fuzzy logic method. There are two major ways of
performing risk analysis, qualitatively and quantitatively. Risk analysis can provide a way of
estimating the probability that a project meets its budget and time goals. Additionally,
quantitative risk analysis includes deterministic risk analysis and stochastic risk analysis.
Deterministic risk analysis is based on single-point estimates, which can only provide discrete
outcomes, with no attempt in accessing the likelihood of each outcome. Stochastic risk analysis,
which is also called the Monte Carlo simulation, integrates the range of possible values for each
variable in the analysis. Compared with deterministic risk analysis, one of the main advantages
of applying the Monte Carlo simulation is that the simulation result provides the outcomes, as
well as their likelihood. Furthermore, the Monte Carlo simulation can realize the scenario
analysis based on various combinations of different input data with different values [Vanston et
al. 2004].
2.4.3 Toll Revenue Estimation
Toll revenue is a major economic risk impacting the investment returns in toll projects.
Also, projected toll revenue is one of the key factors used to determine the degree of
attractiveness of PPP projects to both public and private partners. Hence, the accuracy of the toll
revenue projections significantly influences the decision-making process of agency investment
and the conclusions made about the financial feasibility of the project. There exist many
references that discuss the methods for conducting revenue forecasts among researchers and
agencies. However, no consensus has yet been achieved. After comparing actual and projected
toll revenue for 26 toll highways through the U.S., the result shows that there is a significant
variation considering the performance, with the ratio of actual revenue to projected results
ranging from 13.0 percent to 152.2 percent [Kriger et al. 2006].
The inaccuracy of the actual revenue forecasts largely lies in modeling the traffic demand
with toll facilities. A multi-national review of 210 infrastructure projects completed between
1969 and 1998, including 27 rail projects, 170 highway projects, 10 bridges and 3 tunnels, found
significant inaccuracies in the traffic projections, where half of road projects have more than ±20
percent inaccuracies in projected traffic [Flyvbjerg et al. 2005, Bain and Polakovic 2005].
Generally there are five categories of methods for modeling toll road traffic demand identified
from the state of the practice of valuing pricing projects in the U.S.: 1) modeled as a component
of an activity-based model; 2) modeled within the modal split part of a four-step model; 3)
modeled within the trip assignment part; 4) modeled as a post-processor for a regional model; 5)
modeled through sketch-planning [Nourzad 2004]. Critical assumptions are required in traffic
forecast modeling, including regional growth policies, economic growth, development trends of
8
traffic patterns and, users’ willingness to use toll facilities. Specifically, toll-related factors,
including the toll technology, toll rate structure and performance of toll facilities, can have an
impact on the share of toll facility users. Usually a simplified assumption that the toll revenue is
proportional to the traffic demand is applied in the forecasting modeling. In other words, the toll
revenue is achieved by multiplying the forecasted traffic demand by the toll amount neglecting
the impact of tolls on the percent of traffic demand using the toll facilities. This assumption is
correct only when the toll rate is low enough that tolls have no impact on the choice of highway
users considering the toll facility. However, as toll rates increase, the opposite effect may occur
and the share of highway users willing to pay a toll may decrease. This leads to the complexity
of traffic forecast modeling and toll revenue forecasting.
One difficulty in traffic forecasting is to simulate users’ mode choice with the toll facility
considered as an option. Researcher used a diagram to illustrate the toll mode choice structure for
person trips [Dehghani 2003]. This structure groups all mode-choices for personal trips into 10
modes, adding toll choice into the conventional auto mode-choice structure. Additionally, socio-
economic factors, such as gender and household income, seem to have a significant impact on
the choice of modes and the usage of toll facilities. Based on the 3-year observations from
traveler surveys on the Riverside Freeway (SR-91) in Orange County of California, the study
estimated factors impacting the use of toll facilities [Sullivan et al. 2000]. In this research, gender
was found to have a significant impact on the willingness to pay tolls, with a higher proportion of
women drivers to choose toll facilities. Other socioeconomic factors, including household
income, education level, age and trip purpose, also have indirect impacts on the use of toll
facilities.
Another difficulty in traffic and revenue forecasting is the difference in critical planning
periods. Generally, for traffic demand forecasts, future years (20- or 30- years) are more crucial
in making long-term decisions. However, for revenue forecasts, the initial years of operation
period are more important. This is because during this period, also called the ‘ramp-up’ period,
the risk is typically at the highest as users become aware of the efficiency and potential of toll
facilities in saving time and other costs such as fuel consumption. In addition, the growth of
population and employment along toll corridors might be lower than forecasted [Kriger et al.
2006]. A study of 104 toll facilities around the world summarized significant variability of traffic
forecasts in the first operation year, ranging from 15 percent to 150 percent of actual
performance. An optimistic bias is generally found in the traffic forecasting process of most
projects. The forecasted traffic is overestimated 20 percent to 30 percent by the actual traffic on
average [Bain and Polakovic 2005, RCA 2012].
2.5 SUMMARY
This chapter presented a synthesized literature review providing information background
for the report. The literature review started with the discussion on the concepts of public-private
partnerships and toll projects and was followed by the review on the state of the practice in toll
projects in the U.S. and other areas around the world. Also, the review on the state-of-the-art
research on financial models and project risk management provided this report research with
solid theoretical background and various choices to develop a methodology of risk analysis
which could be applied to toll projects. The final part of the chapter described the status of
current methodologies and problems for toll revenue estimation, which brought a major
economic risk for project management.

9
Based on the literature review, there have been many theoretical research efforts devoted
to the financial evaluation of PPP projects and infrastructure project risk management. However,
there are few choices of available practical models for risk management which are developed
centered on PPP projects, especially on toll projects. Also, there is still a huge challenge in the
accuracy of estimating toll revenue, which brings a major economic risk to the projects’
investment returns. In the next chapter, a methodological framework will be developed as a
guideline for agencies to identify risk sources in toll projects and to conduct risk analysis, so that
the overall degree of risks of PPP projects could be assessed. Among existing risk analysis
methods, a numerical model, namely the Monte Carlo simulation model, is selected and
employed for risk simulation in order to numerically assess the overall risks of toll projects.
Furthermore, the risk optimization process could facilitate a decision tool in determining
‘benchmarks’ for major risks and setting the optimal toll price to achieve the goal toll revenue.
The methodology of risk analysis developed in the report could be applied in the U.S. as a
supplemental analysis tool to the financial evaluation of toll projects. Also, this methodology can
be considered as a reference to guide agencies in risk management of toll projects in other areas
around the world. The concept of combing risk simulation and risk optimization in the risk
analysis could be applied to all PPP infrastructure projects.

10
11
CHAPTER 3 METHODOLOGY
3.1 METHODOLOGICAL FRAMEWORK
A comprehensive methodological framework is developed in this research, to illustrate
critical steps to achieve the research objectives. First, critical factors in the financial analysis for
toll projects are determined, including general information, project costs, traffic and revenue, and
financial structure. Second, based on the basic input information, a financial analysis is
conducted by calculating relevant financial indices, such as net present value (NPV), the internal
rate of return (IRR) and annual debt service coverage ratio (ADSCR). Third, the risk analysis for
the project is structured based on two major parts, risk simulation and risk optimization. Four
risk sources are identified, including: 1) project-based risk source; 2) cost-based risk source; 3)
toll-based risk source and 4) finance-based risk source. In the risk analysis, potential variables
associated with each risk source are identified, along with the variables’ probability distributions.
Based on the results of risk simulation, the probability of achieving an ideal return on investment
is presented, assisting agencies in analyzing the project’s financial feasibility. Besides risk
simulation, risk optimization is applied to determine the combination of benchmarks for
identified variables and the optimal toll price considering the impacts of toll prices on traffic
demand. Based on the analysis results of financial evaluation, risk simulation and risk
optimization, a feasibility report can be developed, helping agencies make investment decisions
and develop recommendations for monitoring the project.

12
Figure 1. Methodological Framework for Risk Analysis.
3.2 PROJECT DATA REQUIREMENT
The primary data for the financial model of toll projects includes basic project
information, project costs, traffic and revenue, and financial structure. Related macroeconomic
information is also taken into consideration as well [PPIAF 2009]. The financial structure is one
of the major differences in PPP projects from traditional transportation infrastructure projects,
General
Information
Project
Costs Traffic &
Revenue
Recommendations
Project Financial
Analysis
Risk
Simulation
Feasibility Analysis
Risk
Optimization
Financial Risk
Analysis Critical
Variables
Variables
Distributions
Adjustable
Variables
Preset
Constraints
Financial
Structure
Toll-based
Finance-based
Project-based
Cost-based
Risk
Source
Risk
Source

13
since external funds are needed and introduced into projects from the initial phase, which may
come from public sectors or private sectors.
3.2.1 General Project Information
Basic project information mainly includes project location, length and route name; parties
involved in this project; project objectives; project design; construction and completion
durations. Project periods contain critical time limit information for a project, including the base
year of study, concession duration, construction duration, and operation period. Concession
duration is clarified in the concession contract for PPP projects, which could range from 4 to 99
years, restricted to the maximum concession duration in regional regulations of different regions
or countries. Specifically for toll projects, the construction costs could be roughly estimated by
using the product of length and unit cost of roadway construction.
3.2.2 Project Costs
Project costs are expenses in a project, including the concessionaire costs, operating
costs, routine maintenance costs and rehabilitation costs. The concessionaire costs cover the
concessionaire’s annual expenses during the concession duration, such as management expenses.
Operating costs cover expenses for administration, personnel, and fixed toll facilities. Future
maintenance costs could be varied largely due to the change in prices of construction materials,
damage due to accidents and the cost of technologies. Crash damage and potential closure of a
toll facility lane or a bridge can bring potential risks to projects which could be a subject in the
future research. Also, another ancillary cost, which must be considered if Hazmat cargo
(including gasoline tankers) is permitted on a toll facility which is ‘Greenfield’, is the allocation
of adequate Emergency Medical Service and Fire Department facilities. The cost to build these
new facilities might be boomed by the local city or county which may or may or have the
resources. In the Toolkit developed by PPIAF, there include variable costs as well, which are
additional to fixed toll collection costs, consisting of personnel fees, facility fees and
maintenance fees due to traffic growth. Typically variable costs follow a segmented function,
where costs have different mathematical relationships with traffic volumes at different traffic
levels [PPIAF 2009].
3.2.3 Traffic and Revenue
Revenue plays an important role in the financial analysis for toll projects. One of the
critical steps in estimating toll revenue is to forecast future traffic demand, which is significantly
inter-dependent with toll prices. Appropriate selection of the traffic demand forecasting model
could help achieve more accurate revenue forecasting and better assist agencies in making
investment decisions. Therefore, project partners, especially private partners, place great efforts
in simulating the relationship between toll prices and traffic demand. As for toll policies, all
vehicles are divided into several categories with different corresponding toll prices. Traffic
demand is forecasted based on the default or adjustable toll prices. The initial daily traffic
demand forecast is a required input for the study of future traffic demand growth. For toll
projects, specifically for projects changing existing roadways from non-tolled to tolled, users
require a period to become aware of the efficiency of new toll facilities in saving travel time and
other costs, which is also called as ‘ramp-up’ period. During this ramp-up period, the traffic
demand experiences more volatility and may exhibit distinct, regional characteristics. The
duration and changing trend of traffic demand during the ramp-up period are considered during

14
the regional demographic analysis, including statistics from users preference surveys, such as
gender (male/female) percentage among users and the trip-purpose pie charts for the study area.
3.2.4 Financial Structure
PPP projects introduce an innovative financing plan into infrastructure projects by
utilizing external funds for the construction of public works, combining public funding and
private finance together. External funds are needed to cover the initial costs, which, theoretically,
will be returned to investors from future revenue flows. Therefore, the financial structure is an
important aspect of the financial analysis for PPP projects. There are three major types of
financial sources, equity, investment subsidy and debts. The total debts are split into tranches and
each tranche has its own interest rate, grace period, and repayment profile and debt fees. The
principle and interest make up the repayment profile, repaid during respective debt’s maturities.
During the grace period, the repayment of the principal is deferred. The actual beginning of
principal repayment could be adjusted to a time point which is after the duration of construction
according to debtors’ requirements.
3.2.5 Macroeconomic Data
The macroeconomic data refers to economic indices which are applied in the whole
market. Macroeconomics shows the current status and development trends of the economy in
different industries or regions as a whole, such as gross domestic product (GDP), consumer price
index (CPI), retail sales and employment indicators. When considering toll projects, the
macroeconomic statistics include economic indices such as inflation rate and corporate tax
policy, which have a significant impact on the returns from project-investments. The updated
macroeconomic data is required in the financial analysis of investment returns of PPP projects
and is generally available from online sources for national statistics.
3.3 FINANCIAL ANALYSIS
In the financial analysis, the project net present value (NPV), the internal rate of return
(IRR), the annual debt service coverage ratio (ADSCR) are used to estimate the value of money
and the ability to repay debt services of the project. The equations for operating cash-flows
before financing (OCFBF), NPV, the IRR and the ADSCR are presented in Equations 1 - 4,
respectively [PPIAF 2009]. The NPV is the sum of present values of cash flows during the
lifecycle of a project using the time value of money, which reflects the value of money of the
project in present value terms. The IRR is a rate of return used to measure the profitability of
capital investments. The ADSCR is an annual index to assess the ability of the project to repay
debt services.
(1) For OCFBF,
OCFBF=Operating Cash-Flows Before Financing
=Operating revenues +Other revenues–Construction costs–Fixed operating costs
–Variable operating costs-Corporate tax (w/o interests of debts and subsidy)
–Other tax Equation 1
(2) For the project NPV,
0-
)
(1+ )
Ni
i ii
OCFBFNPV
r
( Equation 2
15
where, r = the minimum project IRR for different financial markets,
N = the end year of concession,
i = the first year of construction,
= base year.
(3) For the IRR,
)=0
(1+IRR)
Ni
ii
OCFBF(
Equation 3
where, i = the ith year of concession, ,
N = the end year of concession.
(4) For ADSCR,
)
(Principal Repayment+ Interest Payment)
ii J
i
j
j
OCFBFADSCR
( Equation 4
where, i = the ith year of concession, ,
j = the jth debt service,
J = the total debt services.
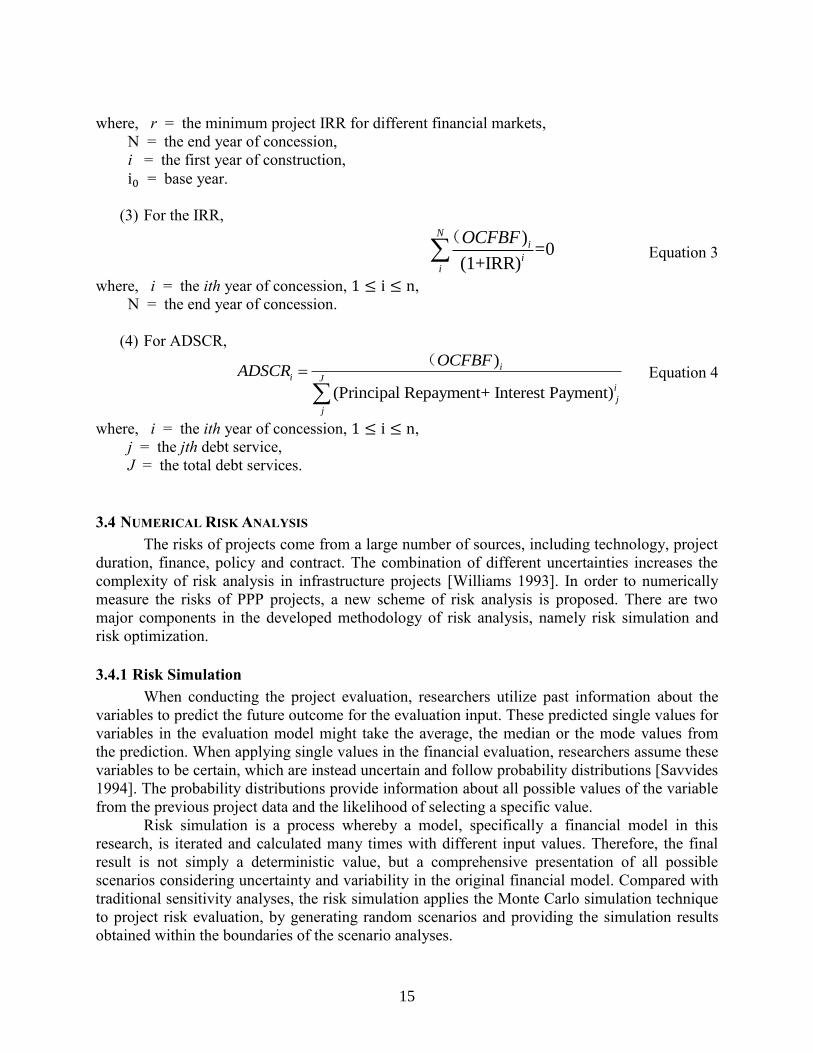
3.4 NUMERICAL RISK ANALYSIS
The risks of projects come from a large number of sources, including technology, project
duration, finance, policy and contract. The combination of different uncertainties increases the
complexity of risk analysis in infrastructure projects [Williams 1993]. In order to numerically
measure the risks of PPP projects, a new scheme of risk analysis is proposed. There are two
major components in the developed methodology of risk analysis, namely risk simulation and
risk optimization.
3.4.1 Risk Simulation
When conducting the project evaluation, researchers utilize past information about the
variables to predict the future outcome for the evaluation input. These predicted single values for
variables in the evaluation model might take the average, the median or the mode values from
the prediction. When applying single values in the financial evaluation, researchers assume these
variables to be certain, which are instead uncertain and follow probability distributions [Savvides
1994]. The probability distributions provide information about all possible values of the variable
from the previous project data and the likelihood of selecting a specific value.
Risk simulation is a process whereby a model, specifically a financial model in this
research, is iterated and calculated many times with different input values. Therefore, the final
result is not simply a deterministic value, but a comprehensive presentation of all possible
scenarios considering uncertainty and variability in the original financial model. Compared with
traditional sensitivity analyses, the risk simulation applies the Monte Carlo simulation technique
to project risk evaluation, by generating random scenarios and providing the simulation results
obtained within the boundaries of the scenario analyses.

16
3.4.2 Risk Optimization
The results of risk simulation are probability distributions of all expected financial
evaluation results. However, in order to achieve threshold returns, researchers need to consider
the combination of those variables, in order to identify and implement risk control measures.
There are two main functions of applying risk optimization. One is to explore the optimal
benchmark combination of major variables for the whole project. The other is to utilize single-
variable control method to investigate the optimal total revenue considering the impact of toll
prices on the traffic demand.
For the first function, risk optimization process explores the combined impact of risks by
changing the adjustable variables within a specified range. Some constraints are imposed to
ensure that the model results are feasible and applicable based on the preset ranges. Using the
data range for each variable, a risk optimization model can repeatedly run the operation until the
outcome reaches its optimized value. The final optimized outcome is presented to users with an
optimized combination of adjustable variables values, which could be a reference for decision
makers to set risk control benchmarks.
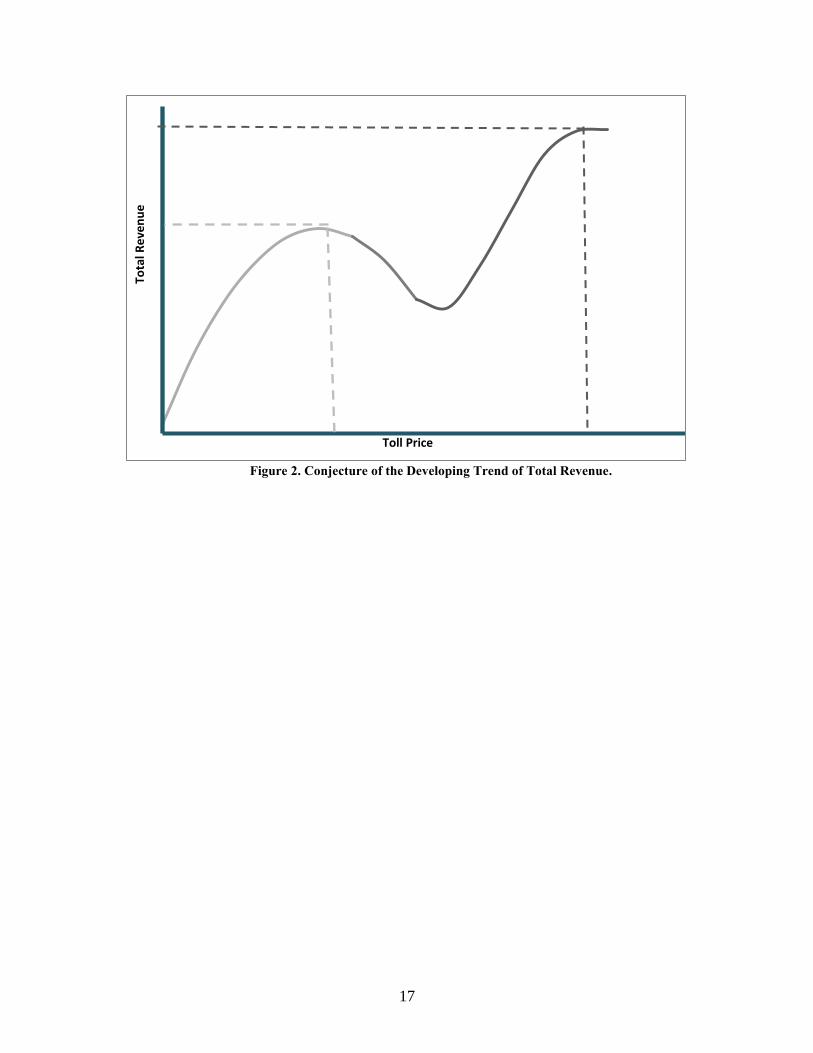
For the second function, risk optimization can be applied to conduct optimization
analysis of the toll revenue to provide valuable information to decision makers. One of the key
analyses conducted in the financial analysis of toll projects focuses on the relationship between
total revenue and toll price, so that information about the maximum toll revenue can be obtained
by adjusting toll prices. According to this relationship diagram, decision-makers can set the
proper toll price so that the agency could achieve the best investment return from each project.
Based on most of the state-of-the-art simulation models, total revenue follows a parabolic curve
responding to the increase of toll prices, with one toll price where the total revenue results in the
maximum value. However, it has yet to be determined whether there is only one inflection point
or multiple inflection points in the total revenue curve. Figure 2 shows one possible shape of the
developing trend of the total revenue responding to the increase of toll prices. The black trend
line shows a typical simulation result. When the toll price continues to increase and follows the
red line, there might be another inflection curve point which will result in higher optimized
revenue. However, the optimal peak might not be found using conventional analyses which only
focus on the black portion of the trend line and the first inflection point. This is referred to as
identifying a local maximum value, but missing the global maximum.
17
Figure 2. Conjecture of the Developing Trend of Total Revenue.
Tota
l Re
ven
ue
Toll Price

18

19
CHAPTER 4 CASE STUDY
4.1 DATA SOURCES AND COLLECTIONS
The case study is conducted to illustrate the development process of the risk analysis and
demonstrate how the methodological framework could serve as an analysis tool to help agencies
make decisions. In this research, the dataset employed is from Pantelias 2009; the dataset is
based on the detailed project information for the facility P12 selected from TTC-35, the first
element of Trans-Texas Corridor (TTC).
The Trans-Texas Corridor was proposed in 2001 as a new 4,200 center-line mile
network. The 1,200-ft-wide corridor from Oklahoma to Mexico was to contain separate car and
heavy truck lanes, light and freight rail lines and a utility corridor. The proposed corridor concept
integrated current and to-be-built highways, railways and utility right-of-ways in Texas, with the
purpose of building multiuse facilities [Schwartz 2005]. TTC-35 was to be the first element of
Trans-Texas Corridor, with a length of 600 miles from Oklahoma to Mexico/Gulf Coast. P12 is
one facility linking from Hillsboro to Temple. Other similar facilities for TTC-35 include P3, P4,
P13, P17A, P1_2 and P17B [Pantelias 2009].
Although existing concessions were allowed to continue, the State Legislature stopped
further development of the Trans Texas Corridor and placed a 2-year moratorium on new PPP
projects due to the large public disapproval of the TTC concept. The main issues included: 1) a
misconception of the width of the corridor leading to the perception that huge amounts of right of
way would be purchased by TxDOT; 2) public misunderstanding of the PPP concept and the
incorrect belief that foreign investors would own roadway systems in Texas; 3) insufficient
public involvement in discussing the TTC concept, individual route and the corridors that were
to be developed first; 4)concerns that the new alignments would bypass communities and result
in loss of traffic, lands, customers and eventually loss of businesses and jobs; 5)
misunderstanding that there would be limited opportunities for development along these new
facilities since TTC concept did not include frontage road [KWTX 2005, KXII 2006, Taylor
2007].
In the analyses, it is noted that transaction unit costs were not provided by the author and
are currently not available. In this case study, in order to calculate the toll transaction costs, it is
assumed that the average transaction cost is $0.15/veh/transaction, which incurred for toll
transaction process of each toll payment. The project information for P12 is shown in tables
below.

20
Table 1. Project P12 General Information [Pantelias 2009].
General Information Units Mean CV(%) Comments
Concession Period years 50 N/A
Construction Period years 5 N/A
Project Length miles 57.0 N/A
Number of Lanes per direction number 3 N/A Including shoulder (a shoulder
is treated as one lane)
Table 2. Project P12 Cost Information [Pantelias 2009].
Project Cost Units Mean CV
(%) Comments
Initial Construction Cost ( $ 822,330,824 20
Initial construction estimate =Cost
of design($60,973,868)+ Cost of
ROW($169,445,455) +Cost of
structures ($591,911,501)
Initial Operating Cost % 3.50 N/A As a % of
Routine Maintenance % 0.60 N/A As a % of
Rehabilitation Cost % 3.00 N/A As a % of
Annual Price Escalation Rate % 2.5 N/A Equal to inflation

21
Table 3. Project P12 Traffic and Revenue Information [Pantelias 2009].
Traffic and Revenue Units Mean CV(%) Comments
Initial AADT1 vehicles 24,278 15 Initial estimate
Categories of Vehicles
Cars % 65 N/A
Trucks % 35 N/A
Traffic Growth % 6.5 N/A Constant for all years
Average Trip Length miles 30 N/A
Average Transaction Per Trip number 1.3 N/A
Average Transaction Cost $/veh/transaction 0.15 N/A
Toll Rates
Cars $/car/mile 0.152 N/A
Trucks $/truck/mile 0.585 N/A
Annual Toll Rate Growth % 2.5 N/A Equal to inflation
1 AADT: Average Annual Daily Traffic.
22
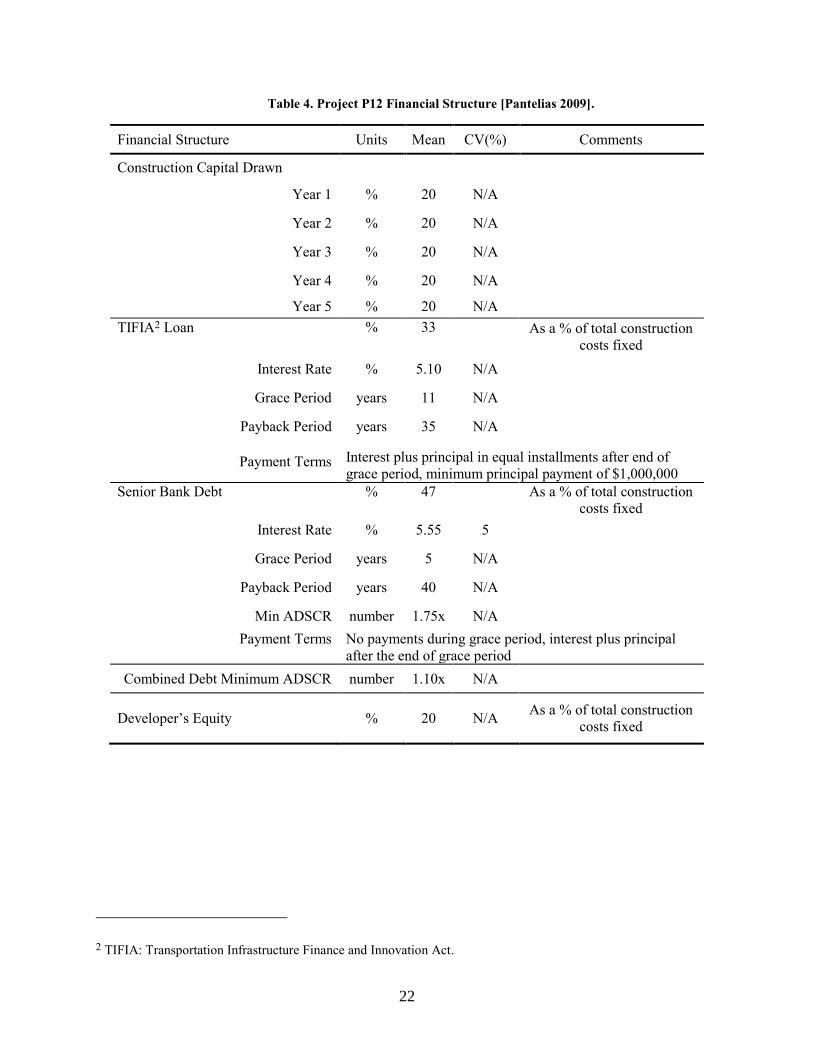
Table 4. Project P12 Financial Structure [Pantelias 2009].
Financial Structure Units Mean CV(%) Comments
Construction Capital Drawn
Year 1 % 20 N/A
Year 2 % 20 N/A
Year 3 % 20 N/A
Year 4 % 20 N/A
Year 5 % 20 N/A
TIFIA2 Loan % 33 As a % of total construction
costs fixed
Interest Rate % 5.10 N/A
Grace Period years 11 N/A
Payback Period years 35 N/A
Payment Terms Interest plus principal in equal installments after end of
grace period, minimum principal payment of $1,000,000
Senior Bank Debt % 47
As a % of total construction
costs fixed
Interest Rate % 5.55 5
Grace Period years 5 N/A
Payback Period years 40 N/A
Min ADSCR number 1.75x N/A
Payment Terms No payments during grace period, interest plus principal
after the end of grace period
Combined Debt Minimum ADSCR number 1.10x N/A
Developer’s Equity % 20 N/A As a % of total construction
costs fixed
2 TIFIA: Transportation Infrastructure Finance and Innovation Act.

23
Table 5. Project P12 Economic Information [Pantelias 2009].
Economic Information Units Mean CV(%) Comments
Inflation Rate % 2.5 10 Initial estimate
Discount Rate % 12 10 Target value
4.2 FINANCIAL EVALUATION
Three financial indices, the NPV, the IRR and the ADSCR, are estimated in order to
analyze the financial returns of the project investment and the ability of the project to sustain its
debt. Since the ADSCR is an annual index and used to measure the project’s ability to produce
enough income to cover its debt, the minimum ADSCR is used to assess the project’s ability to
pay debt services. If the minimum ADSCR satisfies the minimum ADSCR requirement
demonstrated in the dataset, it can be concluded that the project is estimated to be able to repay
lenders’ debt services. As long as the minimum ADSCR satisfies the ADSCR requirement, it can
be concluded that other ADSCRs should satisfy the requirements and the project is able to pay
back its debts. Specifically in this case study, since Senior Bank Debt (SBD) repayment begins
from the 6th
year of the concession and the combined debt repayment begins from the 12th
year of
the concession, the minimum ADSCR of Senior Bank Debt and the minimum ADSCR of the
combined debt are calculated separately.
With the data input presented in Section 4.1, the estimation result is summarized in
Error! Reference source not found.6 below. In general, the IRR from an infrastructure project
anges from 10 percent to 15 percent. As shown in Table 6, the IRR for this project is 12.4
percent which is larger than the discount rate 12.0 percent, supporting the investment decision in
this project.

24
Table 6. Financial Evaluation Results.
Indices Result
NPV (million USD) $45.4
IRR (%) 12.4
Minimum ADSCR for Senior Bank Debt
(number) 1.94
Minimum ADSCR for Combined Debts
(number) 2.38
4.3 RISK SIMULATION
4.3.1 Variables Identification
In order to measure the project risks, potential variables related to the project’s respective
components should first be identified. This research proposes four risk sources for consideration
in the risk analyses, which will be used as a framework for considering the risk variables. This
framework and variable could also be considered by other agencies conducting risk analyses.
These four risk sources are: 1) project-based risk source; 2) cost-based risk source; 3) toll-based
risk source; and 4) finance-based risk source. As previously mentioned, there is no consensus
about the types of probability distributions applied in the risk analysis for identified variables in
infrastructure projects. Researcher stated that the objective of the risk analysis is to find the
distribution which can best represent an appraisal team’s judgment [Pouliquen 1970]. Other
scholars applied triangular distributions for all variables in the Toll Viability Screening Tool
[Smith et al. 2004]. In some analyses, the lognormal distribution was preferred for the prediction
of design costs after investigating a set of representative probability distributions and comparing
the Anderson-Darling (AD) goodness-of-fit measure results [Hegab and Nassar 2006]. Also, a
report displayed four strengths for applying lognormal distributions in modeling stochastic
variables [Baker and Trietsch 2009]. This research suggests a probability distribution for
individual identified variable, rather than takes the uniform probability distribution for all
variables. Moreover, from an assessment of the dataset, the coefficient of variation, which is a
dimensionless parameter equal to the variable’s standard deviation divided by its expected mean
value, is used to describe the variability of non-deterministic variables. In order for the
convenience of defining the probability distributions, the coefficients of variation are converted
to standard deviations. Considering the impacts of the risks on the projects and the probability of
risks’ occurrences, variables considered in the analysis are listed as:
(1) Project-based Risk Source-
o Length of Highway: Different project situations may lead to different
assumptions on the risk estimation of the length of highway, either a
deterministic value or a variable. For example, if there are multiple optional
routes for a new toll facility – each with benefits and dis-benefits related to the
number of required bridges, amount of Right of Way, environmental impacts
and length of project. In this case, a risk analysis might be performed for
different toll route options of varying lengths. However, in the case study of this

25
research, during the project planning process, the length of highway is
determined, thus making the length of highway a deterministic value rather than
a variable.
o Concession Duration: Different states or regions have different practical
experiences and different levels of ‘adaptability’ on the length of concession
duration. For example, Chicago holds a 99-year concessionaire contract for its
Skyway project, while the duration of North Tarrant Express Project 125 in
Texas is 52 years. In this analysis, the concession life is assumed to be
predetermined by local regulations as its base input and is assumed to be 50
years.
o Legislative Restrictions: There are two main types of legislative risks: 1) potential
risks associated with changing laws or regulations under the control of the
Legislature; 2) failure to obtain environmental clearances/approval or ROW
acquisition by the Public Transportation Agencies under the authority of the
Legislature [FHWA 2007]. Legal prohibitions or regulatory restrictions can
bring impediments and risks into PPP projects. Changes in laws or regulations
can impact the successful completion and initiation of a PPP contract or might
otherwise change laws that affect the viability of an on-going PPP project. Other
legislative risks include procurement, permitting, land acquisition and
environmental clearance. Specifically, the environmental and utility processes
may bring huge potential time costs in infrastructure projects due to project
delays. Researchers conducted an analysis of 431 projects, involving 1,144
utility-related change orders totaled as $55 million in the U.S. from 1999 to
2007 in the Bid Analysis Management System (BAMS)/Decision Support
System (DSS) database of TxDOT [Quiroga et al. 2009]. Based on the analysis,
a monetary impact of unplanned utility adjustments for these order changes was
suggested in the range from $15 million to $47 million. However, based on the
limitation of the information for the case project, the potential cost for
legislative restrictions on PPP projects will not be included in the analysis.
(2) Cost-based Risk Source-
o Construction Cost: Researchers concluded that lognormal distributions better fit
the empirical data on construction costs [Wall 1997, Touran and Wiser 1992].
Hence, it is assumed that the construction cost for the case project follows a
lognormal distribution, with its mean being $822,330,824 (base value) and a
standard deviation of coefficient being $164,466,165 based on the dataset.
o Initial Operating Cost: From the dataset, the initial operating cost is expressed as
a constant percentage, namely 3.50 percent, of the initial construction,
increasing annually with inflation. As discussed previously the initial
construction cost is assumed to follow a lognormal distribution. Following the
assumption in the project, the initial operating cost should follow a lognormal
distribution, with its amplitude being 3.5 percent of the amplitude of the initial
construction cost’s distribution.
o Routine Maintenance / Rehabilitation Cost: Similar with the operating cost,
routine maintenance / rehabilitation cost are indicated using a constant
percentage of construction costs, namely 0.60 percent and 3.00 percent

26
respectively. Therefore routine maintenance / rehabilitation costs are also
assumed to follow lognormal distributions.
(3) Toll-based Risk Source-
o Initial AADT: The projection of the initial AADT in the opening year is based on
many traffic projections such as users’ preference to toll facilities. Based on the
researchers’ statistical analysis [Piyatrapoomi et al. 2005], a normal distribution
is suggested in this research for the initial AADT, with its mean value being the
base value 24,500 and a standard deviation of 3,700 based on the dataset.
o Yearly Traffic Increase: Since the impact of the ramp-up period is considered in
the previous assumption, this research neglects dramatic changes in yearly
traffic which might be caused by abrupt policy changes or environmental
changes. The yearly traffic increase percentage is assumed to remain stable
during the study years, which takes the base value as 6.5 percent.
o Toll Price: The setting of toll price is largely due to policy making. Within the
risk simulation portion of the analysis, the correlation between toll prices and
traffic is neglected. The toll prices, for cars and trucks respectively, are assumed
to be determined by agreements in the concession contract.
(4) Finance-based Risk Source-
o Debt Grace Period/Maturity: Debt grace period has a correlation with debt
maturity, where the maximum grace period equals to debt maturity minus one
year. Once the contract is signed, both grace period and debt maturity are fixed.
Therefore, debt grace period and maturity are treated as deterministic values
since these time limits are restricted in the contract.
o Debt Interest Rate: There are two major distributions for simulating interest rates,
normal distribution and lognormal distribution. A research showed that
lognormal distribution better reflected the probability distribution of interest
rates chiefly because it prevented the negative interest rates in analyses
[Miltersen et al. 1997]. Here based on the dataset, it is assumed that interest rate
for Senior Bank Debt (SBD) follows a lognormal distribution with its mean
value being 5.55 percent and the standard deviation being 0.28 percent. Based
on the dataset, the interest rate of TIFIA is assumed to stay constant during the
project’s life cycle.
o Inflation Rate: When considering the inflation rate volatilities, many researchers
took the lognormal distribution to describe the probability distribution of
inflation indices [Jarrow and Yildirim 2003, van Haastrecht and Pelsser 2011].
In the research simulation process, the inflation rate is assumed to follow a
lognormal distribution with its base value being 2.50 percent, and its standard
deviation being 0.25 percent.
Additional potential variables, such as traffic share and debt fees, might be investigated
under other alternative scenarios based on specific situations of different projects. These are not
considered in this research due to the limited project background information for TTC-35 Project
P12.

27
4.3.2 Risk Simulation Results
The risk simulation is undertaken concerning the discussion for potential variables and
probability distribution assumptions for these variables by applying the Monte Carlo simulation
technique. It was suggested that no less than 300 samples should be required in order to get the
entire output distribution [Vose Software 2012]. For the operation, 10,000 iterations were
performed in order to have a large enough sample to better reflect the project financial risks. This
report research uses the software @Risk® 5.7 developed by Palisade Corporation as the risk
analysis tool [Palisade Corporation 2010].
Figures 3 - 6 show the risk simulation results considering different financial indices
(NPV, the IRR, and minimum ADSCRs). In figures, y-axis shows a relative frequency, which
means that the height of each bar is equal to the percentage of the distribution which falls within
that bar [Palisade Corporation 2010]. Generally there are three measures which are mostly
common used to describe the central tendency, mean, mode and median. The risk simulation
result lists all these three measures for each index. After running the Monte Carlo simulation, the
mean value of NPV is expected to be $46.0 million; the mean value of the IRR is 12.6 percent;
the mean value of the minimum ADSCR for Senior Bank Debt is 2.07; the mean value of the
minimum ADSCR for combined debts is 2.51. In order to reflect the values of these indices
which are most likely to happen, mode values are included in the analysis and shown in the
makers in the figures: the mode value of NPV is expected to be $7.1 million; the mode value of
the IRR is 11.6 percent; the mode value of the minimum ADSCR for Senior Bank Debt is 1.84;
the mode value of the minimum ADSCR for combined debts is 2.33. Additionally, from median
values, we can read that there is a 50 percent possibility of achieving its NPV as $54.0 million,
the IRR as 12.5 percent, the minimum ADSCR for Senior Bank Debt as 1.97, and the minimum
ADSCR for combined debts as 2.41.
The general rule of utilizing the risk simulation results to make investment decisions is to
judge whether the dispersion of returns suits investor’s acceptability toward risks. In this
analysis, the decision making process is conducted by adjusting delimiters in the analysis tool.
Agencies can adjust the positions of delimiters to analyze the probability of achieving objective
returns. For example, if the goal NPV is $88 million which is roughly 10 percent of the initial
construction cost, the reader can determine from Figure 3 that there is a possibility of 43.7
percent to make the NPV equal to or above the goal value. Additionally, the cumulative curve
provides agencies with a direct way to estimate the probability of the financial indices reaching
the goal value. As an illustration, in Figure 3, when NPV equals $88 million, the corresponding
y-axis shows 56.3 percent, indicating that there is a 43.7 percent probability for the project’s
NPV being above the goal value. The result is the same as the one indicated by delimiters. As
demonstrated in the dataset, the discount rate is 12.0 percent. After adjusting the delimiters, it
can be read from Figure 4 that there is a 60.2 percent probability achieving an IRR above the
discount rate 12.0 percent which is the target value.
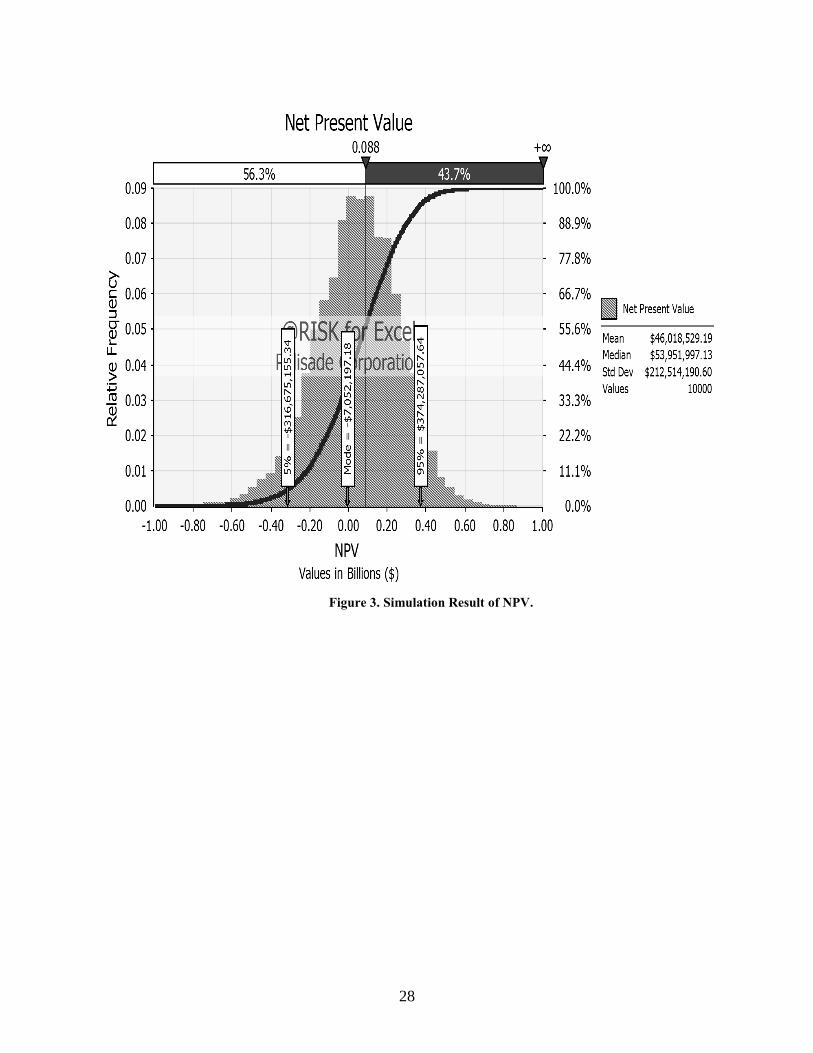
28
Figure 3. Simulation Result of NPV.
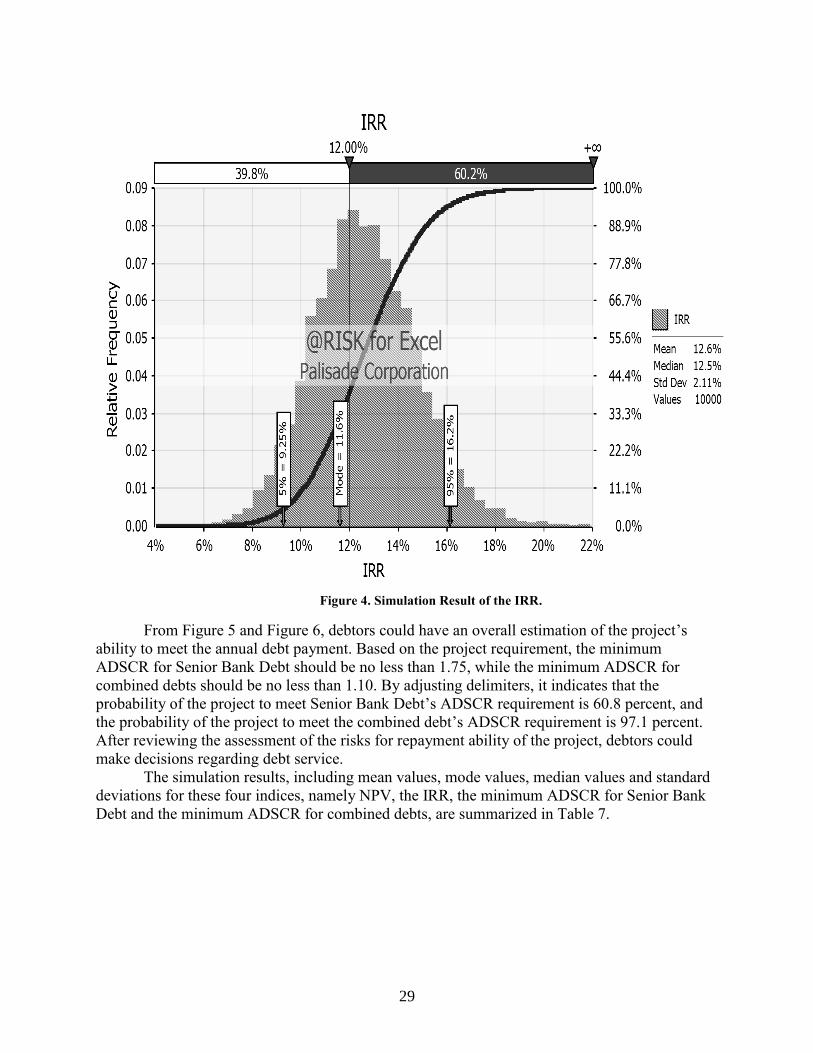
29
Figure 4. Simulation Result of the IRR.
From Figure 5 and Figure 6, debtors could have an overall estimation of the project’s
ability to meet the annual debt payment. Based on the project requirement, the minimum
ADSCR for Senior Bank Debt should be no less than 1.75, while the minimum ADSCR for
combined debts should be no less than 1.10. By adjusting delimiters, it indicates that the
probability of the project to meet Senior Bank Debt’s ADSCR requirement is 60.8 percent, and
the probability of the project to meet the combined debt’s ADSCR requirement is 97.1 percent.
After reviewing the assessment of the risks for repayment ability of the project, debtors could
make decisions regarding debt service.
The simulation results, including mean values, mode values, median values and standard
deviations for these four indices, namely NPV, the IRR, the minimum ADSCR for Senior Bank
Debt and the minimum ADSCR for combined debts, are summarized in Table 7.

30
Figure 5. Simulation Result of the Minimum ADSCR for Senior Bank Debt.
Minimum ADSCR for Senior Bank Debt
Minimum ADSCR for Senior Bank Debt
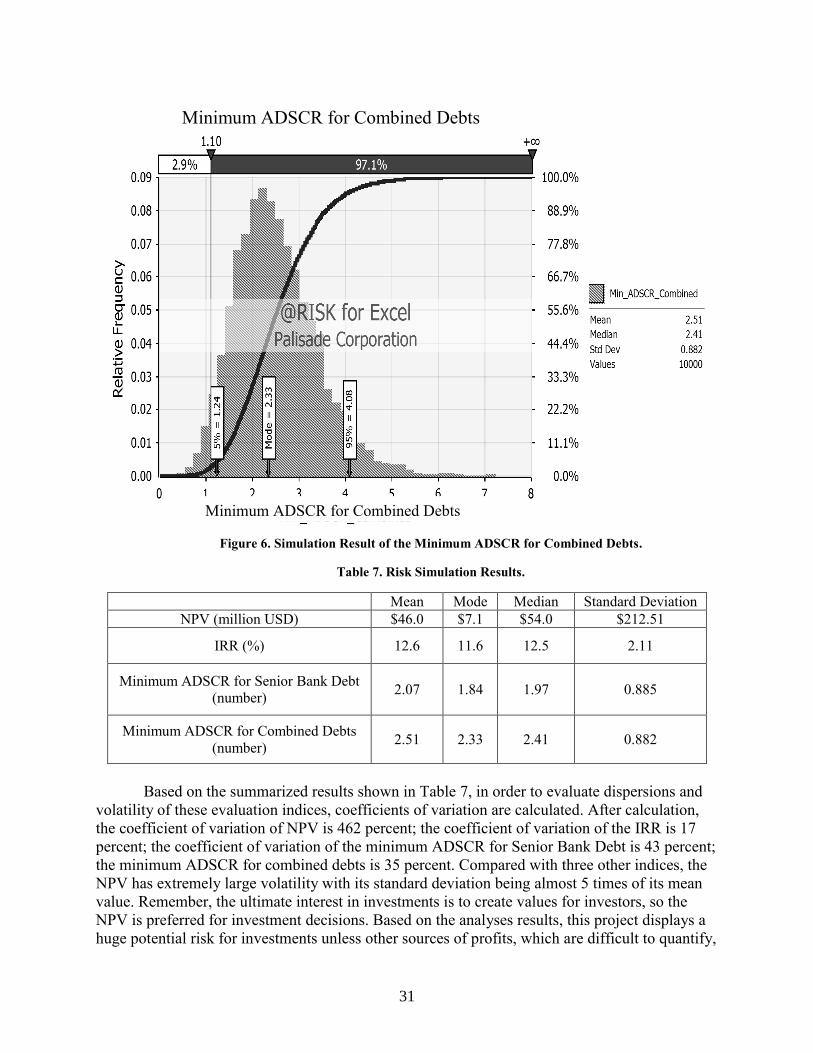
31
Figure 6. Simulation Result of the Minimum ADSCR for Combined Debts.
Table 7. Risk Simulation Results.
Mean Mode Median Standard Deviation
NPV (million USD) $46.0 $7.1 $54.0 $212.51
IRR (%) 12.6 11.6 12.5 2.11
Minimum ADSCR for Senior Bank Debt
(number) 2.07 1.84 1.97 0.885
Minimum ADSCR for Combined Debts
(number) 2.51 2.33 2.41 0.882
Based on the summarized results shown in Table 7, in order to evaluate dispersions and
volatility of these evaluation indices, coefficients of variation are calculated. After calculation,
the coefficient of variation of NPV is 462 percent; the coefficient of variation of the IRR is 17
percent; the coefficient of variation of the minimum ADSCR for Senior Bank Debt is 43 percent;
the minimum ADSCR for combined debts is 35 percent. Compared with three other indices, the
NPV has extremely large volatility with its standard deviation being almost 5 times of its mean
value. Remember, the ultimate interest in investments is to create values for investors, so the
NPV is preferred for investment decisions. Based on the analyses results, this project displays a
huge potential risk for investments unless other sources of profits, which are difficult to quantify,
Minimum ADSCR for Combined Debts
Minimum ADSCR for Combined Debts

32
are also taken into consideration such as purchase and development of real estates by the private
partners at key toll facility interchange locations. This could provide the private partners with
continued profits by offering services to exiting toll facility users or by selling the real estate to
other developers at a future time at a profit.
4.4 RISK OPTIMIZATION
As discussed in chapter 3, there are two main purposes of applying risk optimization. One
is to explore the optimal value-combination of identified variables so as to help set benchmarks
for these risk sources. The other is to utilize the single-variable control method to investigate the
optimal total revenue considering the impact of toll prices on the traffic demand, which could
assist agencies in setting threshold toll prices in order to maximize potential returns on the
investment.
For the first purpose of risk optimization, major variables and their correlations should be
identified. In this case study major variables considered are length of highway, concession
duration, legislative restrictions, construction cost, initial opening cost, routine maintenance /
rehabilitation cost, initial AADT, yearly traffic increase, toll price, debt grace period / maturity,
debt interest rate, and inflation rate. Among these variables, length of highway, concession
duration and yearly traffic increase are treated as deterministic values; legislative restrictions are
neglected; initial opening cost and routine maintenance / rehabilitation cost are in proportion to
construction cost; yearly traffic increase is in proportion to the initial AADT. Therefore the risk
optimization should explore the optimal benchmark combination of the four variables,
construction cost, initial AADT, debt interest rate and inflation rate. Since in this case study
these four variables are assumed to be independent from each other [Pantelias 2009], there is no
correlative impacts among these major variables. This makes the optimal risk control ‘package’
for the project simplified as making the individual variable’s risk as small as possible. If the
project’s major variables are correlated with each other, through the risk optimization process,
the benchmark for individual variable could be referred by project managers for the risk control
during the project process.
For the second purpose, by neglecting other risks and only considering the relationship
between toll price and traffic demand, risk optimization is applied to set the optimal toll price in
order to make sure that the total revenue can reach the goal value. In previous analyses of risk
simulation, toll’s impacts on traffic demand are neglected. However, in the practical experiences
of applying toll policies, toll prices could have a significant impact on traffic demand. A
significant amount of research has been devoted to simulating the impacts of tolling on traffic
demand growth to conduct total revenue forecasts. A report indicated adjustments applied to the
mode choice model variables had the greatest impact on toll scenarios results [Cambridge and
URS 2005]. In mode choice models prepared for the SR91 Study, researchers took multiple
parameters into consideration, such as traveler characteristics, travel time, toll costs, and trip
characteristics [Sullivan et al. 2000]. Some agency prepared a demand model for the State of
Minnesota and Metropolitan Area of Minneapolis-St. Paul which was basically developed from
stated preference models, using survey statistics of residents in the study areas [WSA 1996]. In
addition, a three-level model analysis on the traffic and revenue estimation was proposed for the
LBJ freeway corridor projects, including global demand estimates, travel time simulation model
and market share micro-model [WSA 2005].
In this report research, based on the project information and assumptions, the total toll
revenue is in proportion to the traffic volume. In other words, when the traffic volumes increase,

33
the toll revenue increases. Hence, there will not be peaks and valleys in the relationship between
the toll price and the total toll revenue. The second purpose of risk optimization will not be
applicable in this project. However, this assumption is not universal in toll projects. For example,
the transaction costs, such as variable costs as described in the Toolkit, might vary in response to
the increase in traffic volumes [PPIAF 2009]. Also, the traffic volume can be influenced by the
toll prices. With more detailed project input, the risk optimization using the single-variable
control method can be applied to determine the optimal toll price.
4.5 DISCUSSION OF RESULTS
4.5.1 Analyses Results
The comparison of results from the financial evaluation and risk simulation is
summarized in Table 8. Regarding the different statistical parameters and applying hypothesis
analysis, the t-test is applied to test the difference of these two evaluation results, deterministic
analysis result and stochastic analysis result. Based on the calculation results, the t-statistic of
NPV is 0.003; the t-statistic of the IRR is 0.095; the t-statistic of the minimum ADSCR for
Senior Bank Debt is 0.147; the t-statistic of the minimum ADSCR for combined debts is 0.147.
All the t-statistic values of these four indices are less than 1.96. Therefore it can be concluded
that the results of deterministic analysis and stochastic analysis are not significantly different at a
95 percent confidence level.
The deterministic financial evaluation outcome provides decision makers and investors
with a rough estimate that this project returns a reasonable profit, with its NPV expected to be
$45.4 million dollars, the IRR to be 12.4 percent, the minimum ADSCR for Senior Bank Debt to
be 1.94 and the minimum ADSCR for combined debts to be 2.38, neglecting projects
uncertainties. Total for the 50-year life of the project, this would be less than $1 million per year
for a total up-front investment of $822 million, which is not attractive for the investments that
are purely for money returns.
Concerning variables from four major types of risk sources, namely project-based, cost-
based, toll-based and finance-based risk sources, the risk simulation result numerically measures
financial risks for the projects, showing agencies the probability of achieving objectives of
investment returns as well. In the data analysis, since NPV, the IRR and minimum ADSCRs are
continuous variables and their distributions are not skewed which can be read from Figure 3 to
Figure 6, mean values are utilized as the best measure of the central tendency [Laerd Statistics
2012]. Most likely, the project could achieve an NPV as $46.0 million (slightly larger than 5
percent of the initial construction cost), its IRR as 12.6 percent (larger than the discount rate 12
percent), its minimum ADSCR for Senior Bank Debt as 2.07 (larger than the minimum ADSCR
requirement which is 1.75), and its minimum ADSCR for combined debts as 2.51 (larger than
the minimum ADSCR requirement which is 1.10). From mean values of the risk simulation, it
shows that the project is acceptable but not attractive for investments since its expected NPV is
relatively small compared to the initial construction cost and the IRR is just above the discount
rate. On the basis of the ‘ultimate value interest’ principle in investment, NPV is utilized for
analysis of the volatility of project’s return. Based on the input information, the NPV has an
extremely large degree of variation, with its standard deviation being almost 5 times its mean
value. The risk simulation result shows that there exist huge potential risks in financing this
project. However, this evaluation result might be unbalanced because of many other factors that
are not considered in the simulation process. This will be discussed in the following part.

34

35
Table 8. Results Comparison.
Evaluation Method
Comparison of Results
NPV
(million USD)
IRR
(%)
Minimum ADSCR for
Senior Bank Debt
(number)
Minimum ADSCR for
Combined Debts
(number)
Deterministic $45.4 12.4 1.94
2.38
Risk
Simulation
Mean $46.0 12.6 2.07
2.51
Standard
Deviation $212.51 2.11 0.885 0.882
4.5.2 Additional Insights
From the analyses results, both the financial evaluation and risk analysis results do not
show favorable support for investments in this project. Also, there is a large coefficient of
variation in the risk simulation result of NPV. However, these analyses results might be affected
or biased by incomplete project information and unidentified potential benefits which are
attractive to investors and can significantly impact investment decisions. Here are some insights
considering the analyses results:
1. Other potential revenue sources. If rail companies and utilities pay a certain fee to the
PPP for rights to operate in the corridor, these additional revenue flows might occur at
future dates during the concession term. Another consideration is the huge potential
traffic increase, especially for truck traffic. The new widened Panama Canal is planned
to open in 2014. Texas expects a huge increase in cargo container traffic as many
larger container ships arrive at Houston. A portion of these containers will be carried
by rail, but there could also be a large increase in containers carried by truck,
especially if the destination is in Texas. The TCC-35 project might therefore have seen
a much larger percentage of truck traffic which would affect tolls, and maintenance or
rehabilitation costs. Further work is needed to specifically consider the impact of the
Panama Canal cargo container traffic flows on toll facilities such as TTC-35.
2. Other unidentified collateral benefits for investors. From the proposal by Cintra and
Zachry, if Cintra/Zachry team was the developer then the ‘cost’ of design and the
construction would actually also provide a profit for the proposer since its own design
team would be paid a fee [Cintra and Zachry 2004]. It was assumed that Zachry would
have been the contractor on the project and would also obtain about 6 percent or so of
the construction cost as a profit – in this case about $48 million. Therefore, although
the project would have borrowed money to pay for design and construction, the private
partners could also have gained profits by designing and building the project. This
would need to be taken into consideration in the total cash flows. Another
consideration is that the private partners were thought to be in the process of buying
real estate at each of the interchange locations along the TTC-35 route. In this way,

36
private partners could build services plazas or later sell the land at a much greater
profit to major retailers that wanted access to the toll customers as they exited. Also it
might be the service concessions, rather than the tolls, which made the TTC-35 project
attractive.
3. Other potential benefits for the public. Besides the relief of congestions and cost-
savings (such as time and fuel costs) for the public, the project would also generate
jobs, taxes, and increased sales for services along the planned corridor since workers
bought food, paid for motel rooms and other services. These benefits would be
positive cash flows for the local economies and the State. Another positive impact of
TTC-35, if the corridor had been built, would be that IH 35 traffic would decrease by
some percentage which would reduce congestion, and increase the life of the IH
facility since fewer cars and trucks would be operating on IH 35. A potential downside
would be that businesses currently along IH 35 would suffer lower profits and might
even be forced to close, which would depend on how close the TTC corridor was to
the existing IH 35 route and how easily the toll facilities could be accessed.
4.5.3 Summary
Research analyses and results in this chapter indicated that considering uncertainties and
risks in PPP projects, the project’s evaluation indices of investment obeyed probability
distributions rather than deterministic values. Among the deterministic values of the four indices,
NPV and the IRR can provide agencies with a rudimentary evaluation of the project’s feasibility;
the minimum ADSCR for Senior Bank Debt and the minimum ADSCR for combined debts can
help investors assess the project’s ability of debt repayment. By identifying risk sources and
conducting risk analysis, project investors can grasp the volatility of investment returns, further
to assess the project’s financial reliability and risks of investment returns. Risk optimization
could help managers set risk control benchmarks for identified major variables. Additionally,
with the implementation of traffic demand forecasting model, risk optimization could facilitate a
numerical analytical tool in setting the optimal toll price so that the total revenue could be
ensured at a desirable level. In this case study, based on limited project information, the analyses
results did not show favorable support for investments in the project. However, in the proposal
by Cintra and Zarchy, Cintra/Zarchy team was planning to ‘donate’ a large sum of money, about
$1.3 Billion up front to help fund other TxDOT projects associated with the toll corridor in order
to make their concession proposal more attractive to the proposal evaluation team [Cintra and
Zachry 2004]. The proposer certainly was considering other profit centers than just the toll
concession. In view of insights added to the project and many potential benefits for both public
and private partners that are not included in the analysis, this project still holds a huge potential
for profitable investments.

37
38
CHAPTER 5 CONLUSIONS AND RECOMMENDATIONS
This research proposed a methodological framework for risk analysis of financial models
in toll projects through risk simulation. By the identification of key variables from four major
risk sources and their probability distributions, projects are numerically simulated. The proposed
process can help agencies set threshold values to ensure the investment returns. Key findings
from this research work include:
1. There exist numerous uncertainties and risks from different sectors of PPP projects.
These risks can have a significant impact on the financial evaluation result. Risks can
be dispersed during the whole life cycle of PPP projects, requiring project partners to
monitor the lifespan of these projects, rather than to focus only on one project phase.
Risks in infrastructure projects have a significant impact on investment returns, thus
making it necessary for agencies to conduct risk analysis during the feasibility study
process of the project.
2. In this research, a methodological framework for the risk analysis of financing PPP
projects is presented, serving as an example process for both public and private
partners to assess the risk of investments. Also, risk analysis could render public and
private agencies with a tool to measure the effectiveness of PPP projects investment,
by providing decision-makers with information on the expected returns of the
projects, along with the probabilities of achieving these returns.
3. Four major risk sources are identified for PPP projects, namely project-based risk
source, cost-based risk source, toll-based risk source and finance-based risk source.
These four risk sources cover different components of PPP projects, serving as
examples in the risk-identification process so as to explore major risks of the project
in the round. Moreover, probability distributions of identified variables in this
research are suggested based on the synthesis of previous research conducted by
others.
4. There are two major parts in the risk analysis, risk simulation and risk optimization.
Risk simulation uses the Monte Carlo simulation technique, helping project partners
better understand the investment returns. The risk optimization process helps identify
key risk control measures in the risk management process during the life cycle of PPP
projects.
The methodological framework that was developed and the analysis that was undertaken
in this research for the simulation of investment returns of toll projects provide valuable
directions for the future study, which could be extended as suggested below:
1. Additional efforts should be made on testing different probability distributions for
various variables identified in this research respectively, which might lead to a better
fit of real risks in PPP projects investments. There are many distributions which
should be explored for the further research on simulating variables’ uncertainties,
such as Beta, normal, exponential and Weibull distributions. The accuracy of
employing different assumptions on variables’ probability distributions might result
in significant change in the risk analysis result. The proper selection of probability
distributions, based on analyses of actual projects, could better reflect real risks in
projects investments and facilitate trustworthy investment decisions.
39
2. Besides identified variables in this research, other potential variables that might cause
investment risks should be explored. Since there are numerous uncertainties for PPP
infrastructure projects, there might be different major risks impacting projects’
investment performance corresponding to the project type. Other potential variables
for investigation may include: 1) environmental clearances, 2) utility adjustment, 3)
route alignment changes, 4) right-of-way or drainage easement acquisition delays, 5)
discovery of geologic, geotechnical, historic or archeological features during
construction that could introduce unforeseen delays or increase construction costs, 6)
global changes in the cost of fuel and/or construction materials which can cause major
changes in construction costs and result in potential contract renegotiations, 7)crash
damage and potential short-term closures of a toll facility lane or a bridge.
3. For Brownfield toll projects that must be constructed within a limited Right of Way,
instances may occur in which the lane width, shoulder width or other design features
might require a design-exception such as an 11’ versus 12’ wide lanes, or narrower or
no shoulder on the inside lane. In addition, other factors such as variability in
horizontal and vertical geometry coupled with narrower lanes might introduce higher
crash rates or numbers once the toll projects are placed into service. Additional work
is needed to investigate risks associated with design exceptions associated with
Brownfield, toll projects.
4. As discussed in the previous summary, risk optimization could be applied to set
desirable toll prices in order to maximize the toll revenue. One of the primary tasks to
achieve a reliable forecast of toll revenue is to select a rational and theoretically sound
traffic demand forecasting model to determine the relationship between toll prices and
future traffic demand growth. More detailed and exhaustive researches need to be
devoted to the development of traffic demand forecasting models for toll projects.
The model should be sensitive enough to reflect the influence of toll prices on the
total revenue, while not so sensitive as to lead to a result which over-estimates the
impact of the toll price on traffic demand. Based on the developed forecasting model,
the risk optimization process could help agencies adjust the toll price to achieve the
optimal toll revenue.

40
REFERENCES
[ADB 2008]
“Public-Private Partnership Handbook”, Asian Development
Bank, Mandaluyong City, Philippines, 2008.
[Bain and Polakovic
2005]
Bain, R. and L. Polakovic, “Traffic Forecasting Risk (Study
Update 2005): Through Ramp-up and Beyond, Standard &
Poor’s”, New York, N.Y., 2005.
[Bervell et al. 2007] Bervell, J., B. Frey, B. Love, J. Lu, T. S. Merkens, E. Regan, P.
Rubstello, D. Samdahl, C. Szeto, M. Uddin and K. Westby,
“Managed Lanes White Paper: I-405 Congestion Relief and Bus
Rapid Transit Projects”, Washington State Department of
Transportation, Washington State, 2007.
[Baker and Trietsch 2009] Baker, K.R. and D. Trietsch, “Principles of Sequencing and
Scheduling”, John Wiley & Sons, New York, N.Y., 2009.
[Cheng et al. 2010] Cheng H.F., S.M. Jiang, and D. F. Zou, “Risk Identification of
Public Infrastructure Projects”, Journal of Computer and
Automation Engineering (ICCAE) 4, Singapore, pp. 173-176,
2010.
[Cambridge and URS
2005]
“ MnPASS System Study Technical Memorandum #3: Travel
Demand Forecasting Approach” , Cambridge Systematics and
URS Corporation, Minnesota Department of Transportation, 2005.
[CTRMA 2012] “The Mopac Improvement Project”, Central Texas Regional
Mobility Authority (CTRMA), 2012.
Retrieved online at: http://www.mobilityauthority.com
/projects/mopac-improvement.php.
[Cintra and Zachry 2004] “Proposal for TTC-35 High Priority Trans-Texas Corridor Project
Comprehensive Development Agreement”, Cintra and Zachry,
TxDOT and Texas Turnpike Authority Division, 2004.
[de Palma and Lindsey
2006]
de Palma, Andre and R. Lindsey, “Modeling and Evaluation of
Road Pricing in Paris”, Journal of Transport Policy 13, pp. 115–
126., 2006.
[Engel et al. 2007] Engel, E., R. Fischer, and A. Galetovic, “The Basic Public Finance
of Public-private Partnerships. Economic Growth Center”, Yale
University, CT., 2007. Retrieved online at:
http://ssrn.com/abstract=1001758.
[Flyvbjerg et al. 2005] Flyvbjerg, B., M.K.S. Holm, and S.L. Buhl, “How (In)accurate
Are Demand Forecasts in Public Works Projects? The Case of
Transportation”, Journal of the American Planning Association
71(2), pp. 131–146, 2005.
[Flyvbjerg 2006] Flyvbjerg, B, “From Nobel Prize to Project Management: Getting
Risks Right”, Journal of the Project Management Institute 37(3),
pp. 5-15, 2006.
[FHWA 2004 (a)] “Managed Lanes: A Primer”, Publication FHWA-HOP-05-031,
FHWA, U.S. DOT, 2004 (a).
[FHWA 2004 (b)] “Moving Forward with Managed Lanes”, CD-ROM, Publication
FHWA-HOP-07-030, FHWA, U.S.DOT, 2004(b).

41
[FHWA 2004 (c)] “Managed Lanes: A Cross-Cutting Study”, Publication FHWA-
HOP-05-037, FHWA, U.S.DOT, 2004(c).
[FHWA 2007] “User Guidebook on Implementing Public-Private Partnerships for
Transportation Infrastructure Projects in the United States”,
FHWA, U.S.DOT, 2007. Retrieved online at:
http://www.fhwa.dot.gov/ipd/pdfs/ppp_user_ guidebook_final_7-
7-07.pdf.
[Guasch 2004] Guasch, J. L., “Granting and Renegotiating Infrastructure
Concessions: Doing it Right”, The International Bank for
Reconstruction and Development / The World Bank, Washington,
D.C., 2004.
[Gabel 2010] Gabel, M., “Project Risk Management: Guidance for WSDOT
Project”, Washington State Department of Transportation,
Washington, 2010.
[Hegab and Nassar 2006] Hegab, M.Y. and K.M. Nassar, “ Stochastic Prediction of Design
Costs for Transportation Projects”, ASC Proceedings of the 42nd
Annual Conference Colorado State University Fort Collins, pp.20
- 22, 2006.
[Hayes and Cabrero 1995] Hayes, S. and K. Cabrero, “Generalised and Advanced Urban
Debiting Innovations”, The GAUDI Project 1–Overview. Journal
of Traffic Engineering and Control 36 (1), pp. 6-9, 1995.
[Jarrow and Yildirim
2003]
Jarrow, R. and Y. Yildirim, “Pricing Treasury Inflation Protected
Securities and Related Derivatives Using An HJM Model”,
Journal of Financial and Quantitative Analysis 38(2), pp.409-430,
2003.
[KWTX 2005] “Farmers and Ranchers Rally Against Trans Texas Corridor
Project”, KWTX, 2005. Retrieved online at:
http://www.kwtx.com/home/headlines/1538982.html.
[Kriger et al. 2006] Kriger, D., S. Shiu, and S. Naylor, “Estimating Toll Road Demand
and Revenue: A Synthesis of Highway Practice”, NCHRP
Synthesis 364, Transportation Research Board, Washington, D.C.,
2006.
[KXII 2006] “Trans Texas Corridor – Misconceptions”, KXII, 2006. Retrieved
online at: http://www.kxii.com/home/headlines/ 3381786.html.
[Kellogg 2009] Kellogg, W. A., “Ohio’s Balanced Growth Program: A Case Study
of Collaboration for Planning and Policy Design”, Journal of
Environmental Planning and Management 52(4), pp. 549-570.,
2009.
[Lindsey 2008] Lindsey, R., “Prospects for Urban Road Pricing in Canada”,
Brookings-Wharton Papers on Urban Affairs, pp. 235-293, 2008.
[Lared Statistics 2012] “Measures of Central Tendency” Lared Statistics, 2012. Retrieved
online at: https://statistics.laerd.com/statistical-guides/measures-
central-tendency-mean-mode-edian.php.

42
[Mu et al. 2011] Mu, R., M.D. Jong, and J. Koppenjan, “The Rise and Fall of
Public–private Partnerships in China: A Path-dependent
Approach”, Journal of Transport Geography 19, pp.794–806,
2011.
[Muller and Buono 2002] Muller, R. and K. Buono, “Start-up Toll Roads: Separating
Winners from Losers”, Municipal Credit Monitor, J.P. Morgan
Securities Inc., New York, N.Y., 2002.
[Meland and Polak 1993] Meland, S. and J. Polak, “Impact of the Trondheim Toll Ring on
Travel Behavior”, Presented at Proceedings of PTRC (Planning
and Transport Research and Computation) Seminar F, Transport
Policy and Its Implementation, pp. 103–117, 1993.
[Meland 1995] Meland, S., “Generalised and Advanced Urban Debiting
Innovations”, The GAUDI Project 3-The Trondheim toll ring.
Journal of Traffic Engineering and Control 36 (3), pp. 150–155,
1995.
[Menon 2000] Menon, A.P.G., “ERP in Singapore — A Perspective One Year
On”, Traffic Engineering and Control 41, pp. 40-45, 2000.
[Miltersen et al. 1997] Miltersen, K. R., K. Sandmann and D. Sondermann, “Closed Form
Solutions for Term Structure Derivatives with Log-Normal
Interest Rates”, Journal of Finance 52(1), pp. 409-430, 1997.
[Nourzad 2004] Nourzad, F., “Estimating Demand for Value Pricing Projects—
State of the Practice. Urban Analytics Inc. and URS Corporation”,
Presented at AMPO Travel Modeling Subcommittee Meeting.
North Central Texas Council of Governments, Arlington, Texas,
2004.
[NCTCOG 2011] “Improved Mobility through Choice”, North Central Texas
Council of Governments (NCTCOG), 2011. Retrieved online at:
http://www.nctcog.org/trans/outreach/MandLan0209.pdf.
[Olszewski and Xie 2005] Olszewski, P. and L. Xie, “Modeling the Effects of Road Pricing
on Traffic in Singapore”, Journal of Transportation Research Part
A 39, pp. 755–772, 2005.
[Pantelias 2009] Pantelias, A., “A Methodological Framework for Probabilistic
Evaluation of Financial Viability of Transportation Infrastructure
under Public Private Partnerships”, Doctoral Dissertation, the
University of Texas at Austin, 2009.
[Pouliquen 1970] Pouliquen, L.Y., “Risk Analysis in Project Appraisal. World Bank
Staff Occasional Papers”, No. 11, Baltimore: The John Hopkins
University Press, 1970.
[Palisade Corporation
2010]
“@Risk User’s Guide: Risk Analysis and Simulation Add-In for
Microsoft® Excel” Palisade Corporation, New York, N.Y., 2010.
[PPIAF 2009] Toolkit for Public-private Partnership in Roads & Highways,
PPIAF, 2009. Retrieved online at:
http://www.ppiaf.org/ppiaf/sites/ppiaf.org/files/documents/toolkits
/ highwaystoolkit/index. html.
43
[Piyatrapoomi et al. 2005] Piyatrapoomi, N. and A. Kumar, and J. Weligamage,
“Identification of Critical Input Variables for Risk-based Cost
Estimates for Road Maintenance and Rehabilitation”, In 4th
International Conference on Maintenance and Rehabilitation of
Pavements and Technological Control, Ulster, Northern Ireland,
2005.
[Quiroga et al. 2009] Quiroga, C., E. Kraus, J. Overman and N. Koncz, “Integration of
Utility and Environmental Activities in the Project Development
Process”, Publication FHWA/TX-10/0-6065-1, FHWA, U.S.
DOT, 2009.
[Rall et al. 2010] Rall, J., J.B. Reed, and N.J. Farber, “Public-private Partnership for
Transportation: A Toolkit for Legislators”, The Forum for
American Ideas, National Conference of State Legislatures, 2010.
[Reinhardt 2011] Reinhardt, W., “The Role of Private Investment in Meeting U.S.
Transportation Infrastructure Needs”, Public Works Financing
260, pp.1-31, 2011.
[Robert 2011] Robert, C., “California Pushes Ahead with Public-private Parkway
Job”, Journal of Engineering News 266(1), pp.28, 2011.
[Ramjerdi et al. 2004] Ramjerdi, F., H. Minken and K. Østmoe, “Norwegian Urban Tolls.
Road Pricing: Theory and Evidence”, Research in Transportation
Economics 9, pp. 237–249, 2004.
[Ramjerdi 1994] Ramjerdi, F., “An Evaluation of the Impact of the Oslo Toll
Scheme on Travel Behavior”, In: B.Johansson & L. G. Mattsson
(Eds), Road Pricing: Theory, Empirical Assessment and Policy,
Dordrecht/Boston/London: Kluwer, 1994.
[Roll 1982] Roll, R., “A Simple Implicit Measure of the Effective Bid-Ask
Spread in An Efficient Market”, Journal of Finance 39(4),
pp.1127-1139, 1982.
[RCA 2012] Wilbur Smith Associates’ Traffic and Revenue Forecasts: Plenty
of Room for Error. Reston Citizens Association (RCA), 2012.
Retrieved online at: http://www.baconsreb
ellion.com/PDFs/2012/01/Wilbur_Smith.pdf.
[Sullivan et al. 2000] Sullivan, E., K. Blakerly, J. Daly, J.Gilpin, K. Mastako, K.A.
Small, and J.Yan, “Continuation Study to Evaluate the Impacts of
the SR 91 Value-Priced Express Lanes—Final Report”,
Department of Civil and Environmental Engineering, California
Polytechnic State University, 2000.
[Smith et al. 2004] Smith, D. R., C. Chang-Albitres, W.R. Stockton and C. Smith,
“Estimating Revenues Using A Toll Viability Screening Tool”,
Publication FHWA/TX-05/0-4726-1. FHWA, U.S. Department of
Transportation, 2004.
[Savvides 1994] Savvides, S. C., “Risk Analysis in Investment Appraisal”, Journal
of Project Appraisal 9(1), pp.3-18, 1994.
[Schwartz 2005] Schwartz, E., “A Trans-Texas Corridor Primer: Plan Moves
Forward with Consortium Selection”, Journal of Texas
Construction 13(5), pp. 14, 2005.
44
[TxDOT 2012] “Toll Road System”, TXDOT, 2012. Retrieved online at:
http://www.txdot.gov/travel/toll_roads.htm.
[Taylor 2007] Taylor, K., “Trans Texas Corridor Road Race”, Journal of The
New American 23(17), pp. 17, 2007.
[Touran and Wiser 1992] Touran, A. and E. P. Wiser, “Monte Carlo Technique with
Correlated Random Variables”, Journal of Construction
Engineering and Management 118, pp.258-272, 1992.
[Transurban 2007] “HOT Lanes: An Emerging Investment Opportunity”,
Transurban,2007. Retrieved online at: http://www. Tran-
surban.com/HOT_lanes_an_emerging_investment.pdf.
[U.S.DOT 2004] “Report to Congress on Public Private Partnership”, viii. U.S.
DOT, 2004.
[Vanston et al. 2004] Vanston, J. H., and L. K. Vanston, “Testing the Tea Leaves:
Evaluating the Validity of Forecasts”, Journal of Research-
Technology Management 47(5),pp.33-39, 2004.
[van Haastrecht and
Pelsser 2011]
van Haastrecht, A. and A. Pelsser, “Generic Pricing of FX,
Inflation and Stock under Stochastic Interest Rates and Stochastic
Volatility”, Journal of Quantitative Finance 11(4), pp.665-691,
2011.
[Vilventhan and Kalidindi
2012]
Vilventhan, A. and S. N. Kalidindi, “Approval Risks in
Transportation Infrastructure in India”, 2012. Retrieved online at:
http://rebar.ecn.purdue.edu/crc2012/papers/pdfs /-149.pdf.
[Vose Software 2012] “ModelRisk Online Help File”, Vose Software, 2012. Retrieved
online at: http://www.vosesoftware.com/
ModelRiskHelp/index.htm#Monte_Carlo_simulation/How_many_
iterations_to_run.htm.
[WSA 1996] “Congestion/Road Pricing Study Technical Memorandum 6:
Results of Metrowide Personal Interviews”, Wilbur Smith
Associates(WSA), New Haven, CT, 1996.
[WSA 2005] “ Proposed LBJ Managed Lanes: Comprehensive Traffic and
Revenue Study”, Wilbur Smith Associates(WSA), New Haven,
CT, 2005.
[Williams 1993] Williams, T.M., “Risk Management Infrastructure”, International
Journal of Project Management 11(1), pp. 5-10, 1993.
[Wall 1997] Wall, D., “Distributions and Correlations in Monte Carlo
Simulations”, Journal of Construction Management and
Economics 15, pp.241-258, 1997.