Embed Size (px)
Citation preview

U.S. Department of the InteriorU.S. Geological Survey
Prepared in cooperation with Clarke County and Warren County, Virginia
Data Collection and Simulation of Ecological Habitat and Recreational Habitat in the Shenandoah River, Virginia
Scientific Investigations Report 2015–5005

Cover: View of the Shenandoah River from Lockes Mill boat landing. Photograph by Jennifer Krstolic, U.S. Geological Survey.

Data Collection and Simulation of Ecological Habitat and Recreational Habitat in the Shenandoah River, Virginia
By Jennifer L. Krstolic
Prepared in cooperation with Clarke County and Warren County, Virginia
Scientific Investigations Report 2015–5005
U.S. Department of the InteriorU.S. Geological Survey

U.S. Department of the InteriorSALLY JEWELL, Secretary
U.S. Geological SurveySuzette M. Kimball, Acting Director
U.S. Geological Survey, Reston, Virginia: 2015
For more information on the USGS—the Federal source for science about the Earth, its natural and living resources, natural hazards, and the environment, visit http://www.usgs.gov or call 1–888–ASK–USGS.
For an overview of USGS information products, including maps, imagery, and publications, visit http://www.usgs.gov/pubprod
To order this and other USGS information products, visit http://store.usgs.gov
Any use of trade, firm, or product names is for descriptive purposes only and does not imply endorsement by the U.S. Government.
Although this information product, for the most part, is in the public domain, it also may contain copyrighted materials as noted in the text. Permission to reproduce copyrighted items must be secured from the copyright owner.
Suggested citation:Krstolic, J.L., 2015, Data collection and simulation of ecological habitat and recreational habitat in the Shenandoah River, Virginia: U.S. Geological Survey Scientific Investigations Report 2015–5005, 30 p., http://dx.doi.org/10.3133/sir20155005.
ISSN 2328-031X (print) ISSN 2328-0328 (online)

iii
Contents
Abstract ...........................................................................................................................................................1Introduction.....................................................................................................................................................2
Purpose and Scope ..............................................................................................................................2Description of the Study Area ............................................................................................................2
Analysis of Historic Streamflow ..................................................................................................................4Water Withdrawals and Projections From the Water Supply Planning Initiative ...............................7Hydraulic Data Collection Update ...............................................................................................................9
Establishing New Elevation Control Points ......................................................................................9Discharge and Water-Surface-Level Data Collection ....................................................................9
Water-Surface-Level Adjustments .........................................................................................10Fish-Community Data and Dominant Substrate ......................................................................................10Using RHABSIM Modeling to Determine Fish Habitat Availability and Recreation
Conditions ........................................................................................................................................11Model Calibration................................................................................................................................11
Water-Surface-Level Calibration ............................................................................................11Velocity Calibration ....................................................................................................................11
Habitat Simulation and Development of Weighted Usable-Habitat Area Curves ....................11Habitat-Discharge Relations for Lockes Mill Study Reach and the Millville
Streamflow-Gaging Station ........................................................................................12Habitat Time-Series Scenario Analysis for Low-Flow Periods ............................................................15
Habitat Duration for Summer Months of the Historic Record .....................................................15Times-Series Scenarios for Historic Droughts and Normal Summers ......................................16
Daily Summaries ........................................................................................................................16Monthly Summaries ..................................................................................................................20
Increased Water-Use Scenario Results .........................................................................................21Summary and Conclusions .........................................................................................................................25Acknowledgments .......................................................................................................................................27References Cited..........................................................................................................................................27Appendix. RHABSIM model calibration data ......................................................................................29
Figures 1. Map of the Lockes Mill study reach on the Shenandoah River at USGS
station number 0163633459, transect and elevation control point locations, and water depth ............................................................................................................................3
2. Map of study area and surrounding counties, watersheds, and streamflow- gaging stations within the Shenandoah Basin ........................................................................5
3. Weighted usable-habitat area of ecological and recreational habitat for the Lockes Mill study reach on the Shenandoah River, Virginia ...............................................14
4. Normal range of weighted usable-habitat area during July, August, and September for each fish species or life stage .......................................................................15
5. Habitat time series for the Lockes Mill study reach during 2002 ........................................17

iv
6. Habitat time series for the Lockes Mill study reach during 1999 ........................................18 7. Habitat time series for the Lockes Mill study reach during 2012 ........................................19 8. Number of days per month when habitat for fish or canoeing was within the
normal range during 1963, 1999, 2002, and 2012 ....................................................................21 9. Habitat time-series increased water-withdrawal scenarios for the
Shenandoah River at Millville, West Virginia, during 2002 ..................................................23 10. Habitat time-series increased water-withdrawal scenarios for the
Shenandoah River at Millville, West Virginia, during 2012 ..................................................24 11. Canoeing recreational habitat time-series increased water-withdrawal scenarios,
main stem Shenandoah River, based on 2002 flow data, and 2012 flow data ..................25
Tables 1. Selected streamflow-gaging stations in the Shenandaoah River Basin .............................5 2. Streamflow statistics for gages on the North Fork, South Fork, and main stem
Shenandoah River ........................................................................................................................6 3. Water-withdrawal totals for 2005 and projected estimates for 2040 for the
Shenandoah River Basin .............................................................................................................8 4. Substrate-suitability indices for the Lockes Mill study reach (0163633459),
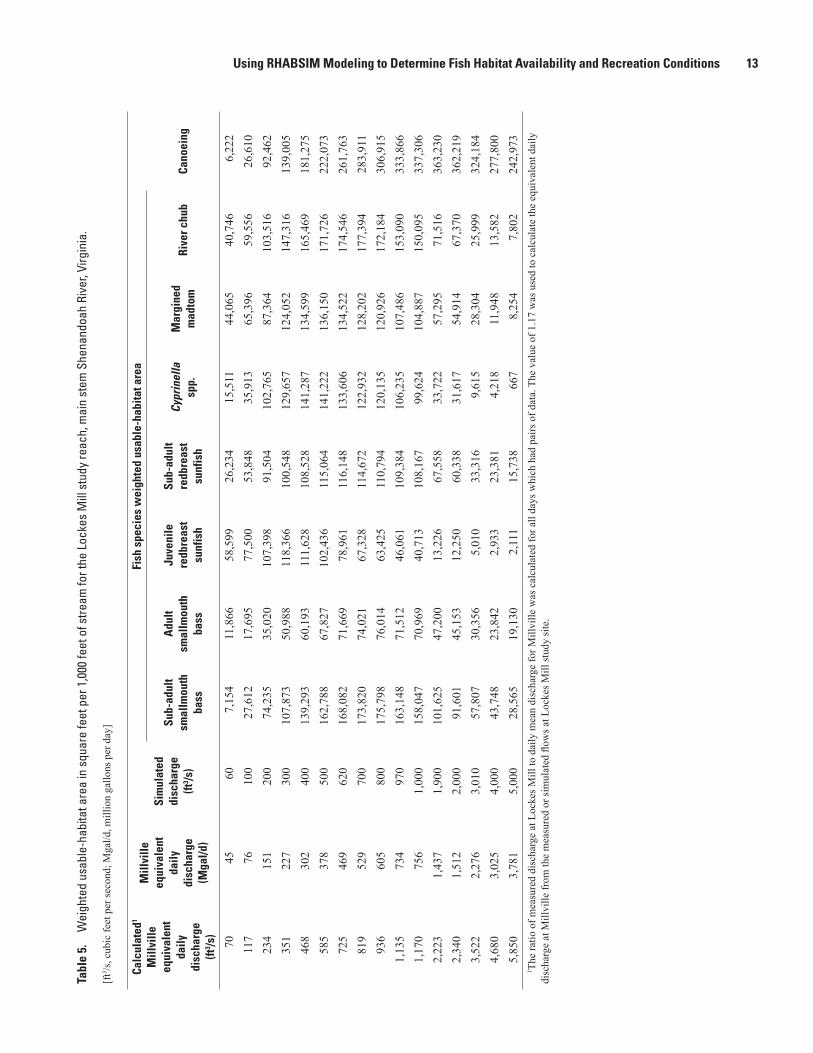
main stem Shenandoah River, Virginia....................................................................................10 5. Weighted usable-habitat area in square feet per 1,000 feet of stream for the
Lockes Mill study reach, main stem Shenandoah River, Virginia .......................................13 6. Normal range of weighted usable-habitat area in square feet per 1,000 feet
of stream for July, August, and September for each species and canoeing for the Shenandoah River ........................................................................................20

v
Conversion FactorsInch/Pound to SI
Multiply By To obtain
Lengthfoot (ft) 0.3048 meter (m)mile (mi) 1.609 kilometer (km)
Areasquare mile (mi2) 2.590 square kilometer (km2)
Flow ratefoot per second (ft/s) 0.3048 meter per second (m/s)cubic foot per second (ft3/s) 0.02832 cubic meter per second (m3/s)foot per mile (ft/mi) 0.1894 meter per kilometer (m/km)million gallons per day (Mgal/d) 0.04381 cubic meter per second (m3/s)
Vertical coordinate information is referenced to the North American Vertical Datum of 1988 (NAVD 88).
Horizontal coordinate information is referenced to the North American Datum of 1983 (NAD 83).
AbbreviationsADCP acoustic Doppler current profiler
GPS global positioning system
HABSIM Habitat Simulation model
HSC habitat-suitability criteria
JAS July, August, September low-flow period. Signifies statistics were calculated only on the basis of data for those 3 months for the period of record
PHABSIM Physical Habitat Simulation model
RHABSIM River Habitat Simulation model
USGS U.S. Geological Survey
VAF velocity adjustment factor
WSL water-surface level
WUA weighted usable-habitat area, in square feet per 1,000 feet of stream


AbstractThis report presents updates to methods, describes
additional data collected, documents modeling results, and discusses implications from an updated habitat-flow model that can be used to predict ecological habitat for fish and rec-reational habitat for canoeing on the main stem Shenandoah River in Virginia. Given a 76-percent increase in population predictions for 2040 over 1995 records, increased water-withdrawal scenarios were evaluated to determine the effects on habitat and recreation in the Shenandoah River. Projected water demands for 2040 vary by watershed: the North Fork Shenandoah River shows a 55.9-percent increase, the South Fork Shenandoah River shows a 46.5-percent increase, and the main stem Shenandoah River shows a 52-percent increase; most localities are projected to approach the total permitted surface-water and groundwater withdrawals values by 2040, and a few localities are projected to exceed these values.
The habitat model used for this study evaluates the suitability of ecological habitat, represented by fish, and recreational habitat, represented by canoeing, based on depth, velocity, and substrate conditions, which are weighted for the physical habitat types (riffles, runs, or pools) present within a stretch of river. Weighted usable-habitat area in the Lockes Mill reach was maximized for adult smallmouth bass and sub-adult smallmouth bass (Micropterus dolomieu) and river chub (Nocomis micropogon) when streamflows were equal to median flow (900 cubic feet per second) for summer months. Ecological maximum weighted usable-habitat areas for smaller fish, such as spotfin or satinfin shiner (Cyprinella spp.), margined madtom (Noturus insignis), and juvenile redbreast sunfish (Lepomis auritus) occurred with 10th percentile flows (482 cubic feet per second) and lower. Recreational weighted usable-habitat areas for canoeing were maximized when streamflows were above the 75th percentile (1,410 cubic feet per second). During historic droughts, streamflows were less than the 10th percentile, and adult smallmouth bass and sub-adult smallmouth bass habitat was below normal for the majority of days during at least
2 months of the summer. When streamflows were less than the lowest 7-day average in a 10-year period, or 7Q10 flow (357 cubic feet per second), margined madtom, river chub, and sub-adult redbreast sunfish habitat areas were below nor-mal as well. Streamflows that limit most fish species habitat availability range from 300 to 500 cubic feet per second. For the drought years simulated, flows that were equal to or less than the 10th percentile for summer months did not provide adequate depth for canoe passage through riffle habitats. A modeling limitation for higher flows than those studied during development of the habitat-suitability criteria is that modeled habitat availability will decrease as flows increase.
Time-series analyses were used to investigate changes in habitat availability with increased water withdrawals of 10, 20, and almost 50 percent (48.6 percent) up to the 2040 amounts projected by local water supply plans. Adult and sub-adult smallmouth bass frequently had habitat availability outside the normal range for habitat conditions during drought years, yet 10- or 20-percent increases in withdrawals did not contribute to a large reduction in habitat. When withdrawals were increased by 50 percent, there was an additional decrease in habitat. During 2002 drought scenarios, reduced habitat availability for sub-adult redbreast sunfish or river chub was only slightly evident with 50-percent increased withdrawal scenarios. Recreational habitat represented by canoeing decreased lower than normal during the 2002 drought. For a recent normal year, like 2012, increased water-withdrawal scenarios did not affect habitat availability for fish such as adult and sub-adult smallmouth bass, sub-adult redbreast sunfish, or river chub. Canoeing habitat availability was within the normal range most of 2012, and increased water-withdrawal scenarios showed almost no affect. For both ecological fish habitat and recreational canoeing habitat, the antecedent conditions (habitat within normal range of habitat or below normal) appear to govern whether additional water withdrawals will affect habitat availability. As human populations and water demands increase, many of the ecological or recreational stresses may be lessened by managing the timing of water withdrawals from the system.
Data Collection and Simulation of Ecological Habitat and Recreational Habitat in the Shenandoah River, Virginia
By Jennifer L. Krstolic

2 Data Collection and Simulation of Ecological Habitat and Recreational Habitat in the Shenandoah River, Virginia
IntroductionDemands on the water resources of the Shenandoah River
have been an issue since the mid 1990s. In 1998, the U.S. Geological Survey (USGS) demonstrated the utility of develop-ing predictive habitat models to address water-use and instream-flow issues and questions concerning fish and recreational habitat for the Shenandoah River (Zappia and Hayes, 1998). This previous work presented the framework for a physical habitat simulation model to be developed, and for habitat time-series analysis and alternative-flow scenario analysis to be conducted. Since the publication of habitat modeling results in Zappia and Hayes (1998), additional low-flow information and fish habitat-suitability criteria have become available. With recent population growth and projected increases in population and water withdrawals, Clarke and Warren Counties cooperated with the USGS to update the original habitat simulation model for the Shenandoah River to provide water-resource managers with current habitat time-series and alternate flow scenario informa-tion for decision-making related to drought management, water supply planning, and management of ecological and recreational habitat needs.
The total population of the Shenandoah River watershed in Virginia and West Virginia was 371,000 in 2010 (U.S. Census Bureau, 2011). This total watershed population was calculated using block group data within each hydrologic unit code (HUC) representing the major drainages in the Shenandoah River Basin: the South Fork Shenandoah River (population 263,000), the North Fork Shenandoah River (population 74,000), and the main stem Shenandoah River (population 34,000). In addition to people living in the watershed, 104,500 people living in Frederick County and the City of Winchester also rely on the Shenandoah River for some of their water supply, making a total of 475,500 people who use the Shenandoah River in some capacity. At the writing of Zappia and Hayes (1998), the 1995 Census reported only 294,000 people living in the Shenandoah River watershed (Solley and others, 1998) with an additional 74,500 people in Frederick County and the City of Winchester for a total of 368,500 people. The majority of people (178,000) resided in the South Fork Shenandoah River Basin, the North Fork Shenandoah River Basin (92,000), and the main stem Shenandoah River (24,000) (Solley and others, 1998).
Over the past 12 years, the number of people living in the vicinity of the Shenandoah River watershed has increased by 106,500 individuals—a 29-percent increase (Solley and others, 1998; U.S. Census Bureau, 2011). Water supply plan-ning initiative reports predict population to increase over the next 20 years to approximately 649,000 (Central Shenandoah Planning District Commission, 2011; Northern Shenandoah Valley Regional Commission, 2011), representing a 76-percent increase from 1995 population levels. In an effort to plan for future water-use needs and maintain the Shenandoah River as an environmental resource, the main stem Shenandoah River habitat flow model was updated to incorporate new fish habitat-use data, low-flow calibration datasets, and future water-withdrawal scenarios. These scenarios may serve as general examples to
other locals for potential habitat impacts to rivers of similar size as the Shenandoah River given predicted population growth and withdrawal requirements.
Purpose and Scope
The purpose of this report is to describe updates to methods, document modeling results, and discuss implications from an updated habitat-flow model for the main stem Shenandoah River. Since the initial investigation (Zappia and Hayes, 1998), new fish habitat-suitability criteria (Krstolic and Ramey, 2012) and water-withdrawal projections (Central Shenandoah Planning District Commission, 2011; Northern Shenandoah Valley Regional Commission, 2011) have been developed. Additionally, new data have been collected to improve and extend the model predictions for low-flow conditions. The objectives of the current investigation are to enhance the understanding of summer low-flow conditions in the main stem Shenandoah River relative to the physical habitat needs of fish and to analyze water use and recreation needs of humans, such as adequate conditions for canoe passage. Water-withdrawal scenarios similar to those developed for the North Fork and South Fork Shenandoah Rivers (Krstolic and others, 2006; Krstolic and Ramey, 2012) were completed for use by resource managers and planners for drought management and water supply planning.
Description of the Study Area
The Shenandoah River watershed was described in Zappia and Hayes (1998) and other related publications (Krstolic and others, 2006; Krstolic and Ramey, 2012). Elements of the landscape that have changed since 1998 will be described as well as pertinent differences about study site information. Land use in the Shenandoah River Basin in 2006 was predominantly rural, with 56 percent forest and wetlands, 33 percent agricultural row crops and pasture, and almost 10 percent developed (Fry and others, 2011). A decrease in forest and agricultural land and an increase in developed land was evident from the 2006 National land cover dataset (Fry and others, 2011). In 1992, approximately 58 percent of the area was forest and wetlands, 38 percent agriculture, and less than 3 percent of the area was developed (Vogelmann and others, 2001).
The primary study site (Lockes Mill study reach) used in Zappia and Hayes (1998) was used for model development again in this investigation. This section of river stretches approximately 3.2 miles on the Shenandoah River including the Lockes Mill site and a Virginia Department of Game and Inland Fish (VDGIF) boat landing, to a historic inactive water intake downstream. Of the 20 initial transects surveyed for Zappia and Hayes (1998) only 14 were accessible and had adequate data to be included in the model update (fig. 1). A re-survey of depths using side-scan-sonar technology demonstrated that habitats had generally remained in the same locations as they were during the initial study.

Introduction 3
Loca
tion
of s
tudy
are
a in
Virg
inia
#
#
##
##
##
#
#
#
###
#
#
#
# *#
#
Shen
ando
ah
River
EXPL
AN
ATI
ON
Dep
th b
elow
sur
face
, in
met
ers
–3.0
–2.0
–0.0
1.
#El
evat
ion
benc
hmar
k(In
clud
ed in
cur
rent
mod
el)
Elev
atio
n be
nchm
ark
(Om
itted
from
cur
rent
mod
el)
00.
51
MIL
E
00.
51
KILO
MET
ER
6 3b#
Univ
ersa
l Tra
nsve
rse
Mer
cato
r pro
ject
ion,
NAD
198
3, Z
one
17N
Cen
tral m
erid
ian
-81’
00”
; El
evat
ion
from
U.S
. Geo
logi
cal S
urve
y US
GS To
po M
ap S
erve
r, in
clud
ing
elev
atio
n, h
ydog
raph
y, la
nd c
over
,tra
nspo
rtatio
n, a
nd o
ther
them
es fr
om th
e N
atio
nal M
ap, 1
:18,
000
Cont
ours
from
U.S
. Geo
logi
cal S
urve
y US
Topo
, 201
3, 1
8,00
0;
Rive
rs fr
om U
.S. G
eolo
gica
l Sur
vey
Nat
iona
l Hyd
rogr
aphy
Dat
aset
1:2
4,00
0 ac
cess
ed 2
010
Rive
r dep
th fr
om H
umm
inbi
rd
sid
e-sc
an s
onar
sur
vey
cond
ucte
d by
the
U.S.
Geo
logi
cal S
urve
y Vi
rgin
ia W
ater
Sci
ence
Cen
ter,
2012
Lock
es M
ill
VDG
IF L
ocke
s M
illB
oat L
andi
ng
Dis
cont
inue
d w
ater
sup
ply
inta
ke
Wat
erm
elon
Pa
rk
0163
6334
5939
°6'
39°5
'
18
17
1615
14b
10
1112
1314
9
12
3b
5
5b
6
77b
8
Mor
gan
Mill
Stre
am
Chapel Run
Lewi
s Run
Craig Run
Dog Run
Craig Run
Dog Run
77°5
6'77
°57'
77°5
8'
VA
WV
KY
MD
Stud
yar
ea
Figu
re 1
. Lo
ckes
Mill
stu
dy re
ach
on th
e Sh
enan
doah
Riv
er a
t USG
S st
atio
n nu
mbe
r 016
3633
459,
tran
sect
and
ele
vatio
n co
ntro
l poi
nt lo
catio
ns, a
nd
wat
er d
epth
. (W
ater
dep
ths
are
from
sid
e-sc
an s
onar
sur
vey)

4 Data Collection and Simulation of Ecological Habitat and Recreational Habitat in the Shenandoah River, Virginia
Analysis of Historic StreamflowThe Lockes Mill study reach (station number
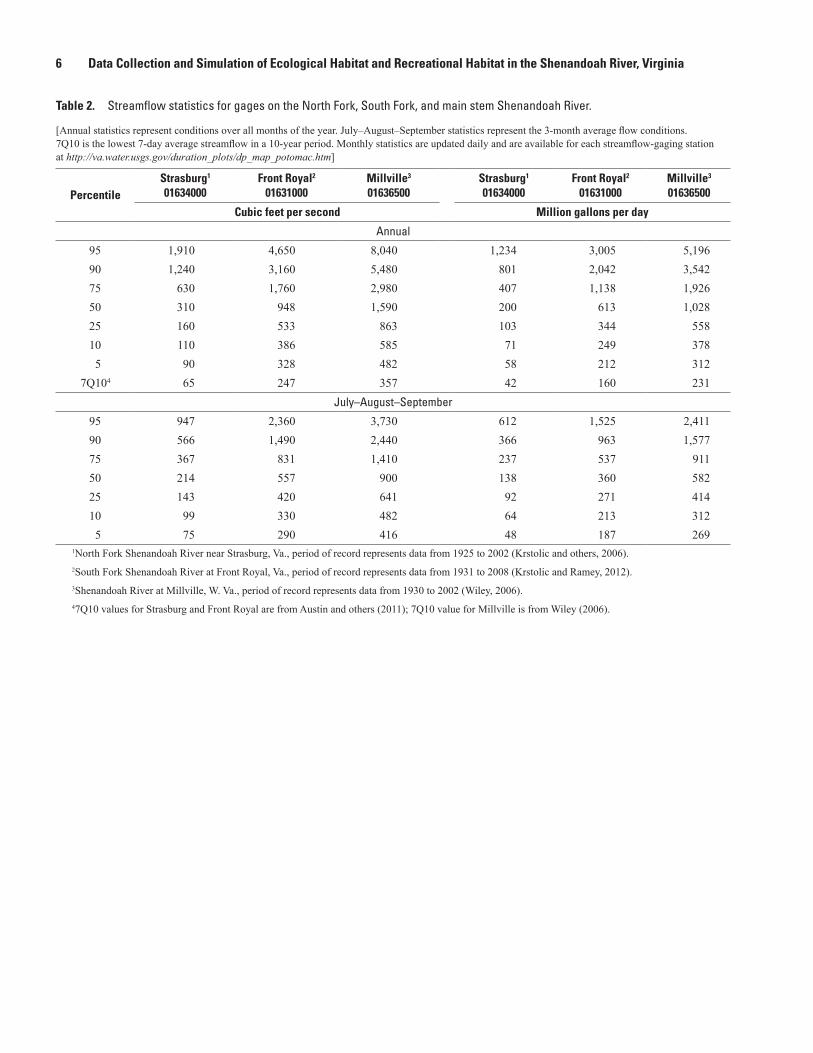
0163633459) along the main stem Shenandoah River is located downstream from the confluence of the North Fork and South Fork Shenandoah Rivers and the Strasburg gage (01634000) and Front Royal gage (01631000) in Virginia, and is located upstream from the Shenandoah River at Millville, W. Va., gage (01636500) (fig. 2; table 1). The modeling results will be discussed in the context of the Millville gage, but the way in which the three gages relate to each other will be noted for reference. Published streamflow statistics for three streamflow-gaging stations are presented in this report for reference purposes. Table 2 presents annual flow statistics and seasonal flow statistics for the low-flow summer period of July, August, and September (JAS). The low-flow period as defined in this study and other USGS Shenandoah River Basin reports, represents the time of year when water supplies are most limited, air temperatures are highest, and the demand for water is greatest. Typically the flows in October are lower than in July and August; however, the irrigation demand and predation risk to young-of-year fish are of greater concern in earlier months. These flow statistics (table 2) represent a long-term record showing that the flow at Strasburg is approximately 35 percent of the flow at Front Royal, and the combined flow at Strasburg plus Front Royal is approximately 85 percent of the flow at Millville.
The Millville gage has a record of streamflow begin-ning in 1896, but has only been in continuous operation since 1930. On the basis of data from 1930 to 2002, the interquartile range (25th to 75th percentile) for annual flows at the Millville streamflow-gaging station ranged from 863 to 2,980 cubic feet per second (ft3/s) or 558 to 1,926 million gallons per day (Mgal/d; Wiley, 2006). For this investigation, flow statistics were re-calculated for the date range from 1930 to 2012 and compared with those published in Wiley (2006) to confirm no major changes to the rating in recent years. Compared to the published values in Wiley (2006), each flow statistic was within 2 percent, and for flow statistics lower than the 50th percentile, the values were within 6 ft3/s of the published statistics, so published statistics for Millville (1930–2002) were referenced throughout this report. Flows equal to or less than the 10th percentile for JAS have been used as a drought indicator in previous studies (Krstolic and others, 2006; Krstolic and Ramey, 2012) and will be evaluated as such for this study. The 10th percentile JAS flow for Millville is 482 ft3/s or 312 Mgal/d (table 2) (Wiley, 2006). Of note is that the lowest 7-day average flow in a 10-year period (7Q10; 357 ft3/s or 231 Mgal/d) is lower than the 10th and 5th percentile JAS flows for Millville (table 2) (Wiley, 2006). The 7Q10 historically has represented an extreme low-flow statistic.
Wiley (2006) compared the computed average low-flow statistics for 1930–2002 with each years’ annual minimum-flow statistics to examine trends over time. For 15 streamflow gages across the State of West Virginia, the departure of annual minimum flows from the long-term average demonstrated an increase in minimum flows around 1970 (McCabe and Wolock, 2002; Wiley, 2006). These departures are considered negative if they are less than the long-term average low-flow statistic and positive if they are greater than the average low-flow statistic (Wiley, 2006). The primary cause for an increase in flows was attributed to climate variability (Wiley, 2006). For the streamflow-gaging station at Millville, a positive trend was noted for the entire time period when considering annual statistics. Increases in computed flow statistics generally were observed for statistics representing 1–7 day averages every 3 to 10 years. This indicates that the extreme low-flow statistics appear to be increasing with time.
Wiley (2006) compared the computed statistics for 1930–2002 with statistics for 10- to 20-year time periods to demonstrate how low-flow statistics vary through time and season. The lowest 7-day average flow in a 10-year period (7Q10) during the summer for Millville ranged from –28.4 to 12.1 percent of the 1930–2002 computed statistic depending on the time period examined. For a known drought period, 1963 to 1969, the 7Q10 was –28.4 percent lower than the long-term statistic. For 1943–1962 and 1970–1979, the summer JAS 7Q10 was 12.1 percent higher than the long-term statistic. These data demonstrate why it is important to monitor and assess long-term data in order to account for climactic variability. The lowest 30-day average flow in a 5-year period (30Q5) during the summer for Millville ranged from –28.3 to 17.1 percent of the 1930–2002 computed statistic depending on the time period examined. The only time the 30Q5 was lower than the long-term statistic was from 1963 to 1969. All other time periods examined were at least 3.7 percent higher (Wiley, 2006). The analysis of long-term streamflow indicates that mini-mum flows follow cyclical patterns associated with climate, and the minimum flows of a stream have regularly been 23–28 percent lower than the long-term average low-flow statistic since systematic streamgaging began.

Analysis of Historic Streamflow 5
!
!!
!
!
!
FREDERICK
LOUDOUNCLARKE
MARYLAND
MD
79° 78°
0 10 20 MILES
0 10 20 KILOMETERS
VIRGINIA
Staunton
WaynesboroCharlottesville
SHENANDOAH
39°
38°
Crai
g
Dog
Run
Run
Chap
Lewi
Base from Virginia Counties, Virginia Department of Conservation and Recreation, 2004;Universal Transverse Mercator projection, NAD 1983, Zone 17N Central meridian -81’ 00”; Rivers from U.S. Geological Survey National Hydrography Dataset 1:24,000 accessed 2010
River
North
Rive
r
South
Middle
River
River
Shen
ando
ah
South
Fork
Shen
ando
ah Rive
r
North
Fo
rk
Shen
ando
ah
Rive
r
Potomac
River
Shenandoah
River
WatershedSubwatershedStreamflow-gaging station and number
EXPLANATION
Winchester
ROCKINGHAMPAGE
WEST VIRGINIA
Berryville
Millville
Harrisonburg
Luray
Front Royal
Strasburg
AUGUSTA
HIGHLAND
ROCKBRIDGENELSON
ALBEMARLE
Location of study area in Clarke County, Virginia
RAPPAHANNOCK
STAFFORD
CAROLINE
GREENE
MADISON
CULPEPPER
Fredericksburg
Manassas
ManassasPark
SPOTSYLVANIAORANGE
LOUISA
FAIRFAX
PRINCEWILLIAM
FAUQUER
WARREN
01631000
##
#
01632000
01633000
01634000
01628500
01629500
#
#
#
#01636500
#01629500
Figure 2. Map of study area and surrounding counties, watersheds, and streamflow-gaging stations within the Shenandoah Basin.
Table 1. Selected streamflow-gaging stations in the Shenandoah River Basin.
[mi2, square mile]
Station number Station nameDrainage area (mi2)
Operating agencyPeriod of record
used in this study
01636500 Shenandoah River at Millville, W. Va. 3,041 U.S. Geological Survey 1930–201201631000 South Fork Shenandoah River at Front Royal, Va. 1,634 U.S. Geological Survey 1931–200801634000 North Fork Shenandoah River near Strasburg, Va. 770 U.S. Geological Survey 1925–2002
6 Data Collection and Simulation of Ecological Habitat and Recreational Habitat in the Shenandoah River, Virginia
Table 2. Streamflow statistics for gages on the North Fork, South Fork, and main stem Shenandoah River.
[Annual statistics represent conditions over all months of the year. July–August–September statistics represent the 3-month average flow conditions. 7Q10 is the lowest 7-day average streamflow in a 10-year period. Monthly statistics are updated daily and are available for each streamflow-gaging station at http://va.water.usgs.gov/duration_plots/dp_map_potomac.htm]
PercentileStrasburg1 01634000
Front Royal2 01631000
Millville3 01636500
Strasburg1 01634000
Front Royal2 01631000
Millville3 01636500
Cubic feet per second Million gallons per day
Annual
95 1,910 4,650 8,040 1,234 3,005 5,19690 1,240 3,160 5,480 801 2,042 3,54275 630 1,760 2,980 407 1,138 1,92650 310 948 1,590 200 613 1,02825 160 533 863 103 344 55810 110 386 585 71 249 3785 90 328 482 58 212 312
7Q104 65 247 357 42 160 231July–August–September
95 947 2,360 3,730 612 1,525 2,41190 566 1,490 2,440 366 963 1,57775 367 831 1,410 237 537 91150 214 557 900 138 360 58225 143 420 641 92 271 41410 99 330 482 64 213 3125 75 290 416 48 187 269
1North Fork Shenandoah River near Strasburg, Va., period of record represents data from 1925 to 2002 (Krstolic and others, 2006).2South Fork Shenandoah River at Front Royal, Va., period of record represents data from 1931 to 2008 (Krstolic and Ramey, 2012).3Shenandoah River at Millville, W. Va., period of record represents data from 1930 to 2002 (Wiley, 2006).47Q10 values for Strasburg and Front Royal are from Austin and others (2011); 7Q10 value for Millville is from Wiley (2006).

Water Withdrawals and Projections From the Water Supply Planning Initiative 7
Water Withdrawals and Projections From the Water Supply Planning Initiative
The Shenandoah River watershed withdrawals for surface water and groundwater in 2005 were summarized on the basis of data reported to the Virginia Department of Environmental Quality (DEQ) in Krstolic and Ramey (2012). The 2005 water-use values are similar to the baseline water-use data compiled in the Upper Shenandoah River Basin Water Supply Plan (Central Shenandoah Planning District Commission, 2011) and the Northern Shenandoah Regional Water Supply Plan (Northern Shenandoah Valley Regional Commission, 2011). These plans used 2008 and 2006 data, respectively, to indicate current conditions and make predictions for daily average and peak water demand to the year 2040. The Krstolic and Ramey (2012) withdrawal calculation combined the permitted, reported values from DEQ as summarized and published in Kenny and others (2009) and the USGS-published countywide estimates for livestock and aquaculture (Lovelace, 2009a, 2009b) to ensure that agricultural withdrawals were represented. Aquaculture data are considered non-consumptive use by DEQ so it was omitted from the current investigation. Although agricultural users of greater than 300,000 gallons per month are reported, livestock and row crop spatial estimates are not part of the DEQ water-supply model, but represent agricultural uses that may go unreported. Therefore, the data for 2005 permitted and reported withdrawals (Kenny and others, 2009) were kept separate from the Lovelace (2009b) estimates for livestock, but were summed before calculating the 2040 projected demands (table 3). Summary data for 2005 water withdrawals for the North Fork, South Fork, and main stem Shenandoah River (table 3) represent “current” conditions for water supply for this investigation. The withdrawal values represent data from Virginia only, so the withdrawals may be underrepresented for the main stem Shenandoah River in Jefferson County, West Virginia. The withdrawal data and future water-withdrawal demands were used within the modeling phase without developing return-flow estimates. It is assumed that the current streamflow-gaging station records report daily values that already incorporate withdrawals and return flows. The withdrawal data are reported, tabulated, and verified through multiple sources, but returns would need to be estimated for future withdrawal regimes. Only withdrawals were considered for the modeling phase of this investigation, recognizing that this may represent a “worst case” scenario because there likely will be some portion of return flows from any consumptive-use withdrawal.
The water supply plans describe surface water and groundwater sources and frequently combine them when summarizing future demands. To gain a general understand-ing of the amount of increased water use for municipalities, comparisons were made for status of presently permitted withdrawals, current water use, and projected 2040 demand. On the basis of the reported withdrawals for 2006, average water withdrawals represent 50 percent of permitted with-drawals. Localities in the Shenandoah Valley have the legal permits to withdraw roughly twice the amount of water than were used in 2006. Six out of 13 localities in the North Fork and main stem Shenandoah River watersheds and five out of 13 other localities in the South Fork watershed project that daily average demands will equal or exceed 80 percent of their presently permitted withdrawals by the year 2040 (Central Shenandoah Planning District Commission, 2011; Northern Shenandoah Valley Regional Commission, 2011). Augusta County, Frederick County, Rockingham County, and the City of Harrisonburg each expect an increased water demand within the range of 4.4 to 6.5 Mgal/d by 2040. This equates to 74 to 250 percent of existing permitted capacity for those localities. Most localities approach their total permitted surface-water and groundwater values by 2040, and a few exceed them (Central Shenandoah Planning District Commission, 2011; Northern Shenandoah Valley Regional Commission, 2011).
The 2040 demand projections from the water supply plans were incorporated into the DEQ water supply model during 2013. The current and future water-use estimates in the DEQ model were preliminary as of September 2013 (Robert Burgholzer, Virginia Department of Environmental Quality, oral commun., 2013), but provide ratios of current (2006 or 2008) to future (2040) water demand for surface water that can be used to adjust the 2005 published water withdrawals for use in this investigation. The water supply plans (Central Shenandoah Planning District Commission, 2011; Northern Shenandoah Valley Regional Commission, 2011), as input to the DEQ water supply model, depict a wide range of surface-water withdrawals from the North Fork (55.9-percent increase), South Fork (46.5-percent increase), and main stem Shenandoah (52-percent increase) River watersheds. Cumulatively, the 2040 surface-water demand projections represent a 51-percent increase from 2005 surface-water withdrawals.

8 Data Collection and Simulation of Ecological Habitat and Recreational Habitat in the Shenandoah River, Virginia
Table 3. Water-withdrawal totals for 2005 and projected estimates for 2040 for the Shenandoah River Basin.
[Mgal/d, million gallons per day]
USGS station number and name of watersheds in the Shenandoah River Basin
2040 estimates2005
totals2005 water-withdrawal
data3
20401 surface-
water with-
drawals (Mgal/d)
Estimated percentage increase2
(percent)
Permitted plus
spatial estimate
with-drawals (Mgal/d)
Permitted with-
drawals in the DEQ and USGS databases(Mgal/d)
Spatial estimates for agricultural withdrawals
(livestock and crop
irrigation)(Mgal/d)
01632000 North Fork Shenandoah River at Cootes Store, Va. 0.75 0.00 0.7501633000 North Fork Shenandoah River at Mount Jackson, Va. 2.69 1.75 0.94 – North Fork Shenandoah River at mouth 9.66 8.92 0.73North Fork Shenandoah River cumulative totals 20.41 55.9 13.09 10.67 2.42 – South River at mouth 4.04 3.51 0.53 – Middle River at mouth 0.88 0.05 0.83 – North River at mouth 9.89 8.44 1.4501628500 South Fork Shenandoah River near Lynnwood, Va. 0.10 0.00 0.1001629500 South Fork Shenandoah River near Luray, Va. 1.29 0.38 0.91 – South Fork Shenandoah River at mouth 2.33 1.93 0.40South Fork Shenandoah River cumulative totals 27.15 46.5 18.53 14.31 4.22 – Shenandoah River at West Virginia State line near Berryville, Va. 5.37 52.2 3.53 3.22 0.31Basin totals 52.93 35.15 28.20 6.95
1Calculation of 2040 surface-water withdrawals = (2005 totals * Percent) + 2005 totals.2Percentage increase from the Virginia Department of Environmental Quality water supply model (September 2013), which reflects the surface-water per-
centage increase in demand from the Upper and Northern Shenandoah water supply plans (Northern Shenandoah Valley Regional Commission, 2011; Central Shenandoah Planning District Commission, 2011).
3Permitted, location-specific withdrawal datasets, such as public water supply, commercial-industrial, thermoelectric, golf course irrigation, and mining (Kenny and others, 2009). Spatial estimates for county-level data include livestock (Lovelace, 2009b).

Hydraulic Data Collection Update 9
Hydraulic Data Collection UpdateThe majority of the data collected in 1996 and 1997 were
input to the updated habitat-flow model for the Shenandoah River. Previously surveyed transect streambed elevations for each variably sized model cell, water-surface levels, velocity, discharge, and elevation control points were utilized along with new water-surface level and discharge data collected in 2011 and 2012. Transect elevation control points were verified, and new water-surface-level datasets were compared with historic datasets to ensure accuracy. The historic data and recently collected data were combined to create an updated habitat-flow model with an extended representation of low-flow conditions and new fish habitat-suitability criteria (Krstolic and Ramey, 2012).
A few challenges complicated the modeling phase of the Zappia and Hayes (1998) investigation. The primary complication was a change in the channel topography due to a flood in September 1996, which altered the channel geometry near transects 5b, 7b, 8, and 13. The flood occurred after the two high-flow discharge measurements had been made and water-surface-level data had been collected, but the velocity and depth (channel elevation) surveys had not been completed. For the original model this meant that the depth and velocity profile after the storm did not match what the stage-discharge relation would have predicted for discharge. The stage-discharge relation for measurements prior to the storm was adjusted to fit the new channel geometry within the Zappia and Hayes (1998) model, so that subsequent measurements would fit within that relation. The transect water-surface level (WSL) above and below the adjusted transects were taken into account to ensure the slope was realistic. Because the model stage-discharge relation was adjusted to post-flood conditions, it was assumed that new data collected for extending the low-flow portion of the rating could be verified against the original relation and utilized for development of a new model.
Establishing New Elevation Control Points
It was necessary to verify existing horizontal and vertical control points for the transects along the Lockes Mill study reach so that water-surface profiles could be surveyed and used for additional calibration datasets for the habitat-flow model. Fifteen years had passed since the initial investigation, and only 8 of the original 26 transect elevation control marks (benchmarks) were found to be in usable condition. The benchmarks were lag bolts in trees, most of which were in areas of substantial growth, but the lag bolts were found to be stable and accessible. New transect benchmarks were established at each transect when necessary, and the few remaining headpins or tail pins from the original study were found to be unusable for establishing new control, but they were marked for reference purposes. The origi-nal survey control was based off of Global Positioning System (GPS) coordinates and elevation for the Lockes Mill tailrace near transect 16. This location was re-surveyed with survey-grade GPS and post processed through the National Geodetic Survey
(2012) Online Positioning User Service (OPUS), resulting in an elevation within 0.09 feet (ft) of the original survey elevation and within 0.07 ft of the tax map survey provided by the landowner. The mill tailrace is a cobblestone structure that did not have a clear marking for the exact location of the original survey, so the accuracy of the GPS survey confirmed that the tail race is a good control feature to verify the new elevations surveyed for this update. New control points were installed and surveyed with GPS along the boat launch and the road near the VDGIF Lockes Mill landing. The new control points were in view of the transect 14b benchmark, which was at the boat launch and was still in good condition from the original survey (fig. 1). The transect 14b benchmark was used as a verification for each new survey conducted.
Total station surveys of the newly installed and existing original benchmarks were conducted in 2011 beginning from the two newly installed control points, extending upstream on the left bank, extending downstream on the left bank, and across the river to the right bank from Watermelon Park near transect 7. The four separate surveys used the two new control points along the boat launch as starting elevations and included surveys of the bench-mark 14b lag bolt and the mill tailrace for elevation verification.
Elevations for the transect 14b benchmark from the four surveys were compared with the original survey elevation from 1996. For each survey, any of the eight intact original transect benchmarks available were also surveyed and the updated elevations were compared with the original elevations. To assure the continuity between original and updated elevations, all new survey benchmark elevations were adjusted to match original elevations on the basis of the difference between transect 14b original and updated elevations or other original benchmarks. The difference between updated and original benchmarks resulted in survey adjustment factors ranging from 0.25 to 0.90 ft. These updated benchmark elevations were used as control points for new WSL measurements, but no new transect elevation surveys were conducted.
Discharge and Water-Surface-Level Data Collection
Discharge and WSL data were collected in July 2012 at a measured discharge of 970 ft3/s, and in September 2012 at 620 ft3/s. Digital auto level equipment (Sokia SDL30) and traditional leveling equipment (Zeiss) were used to survey water-surface profiles from transect 18 to transect 1. Data were recorded digitally in the field with hand-held Trimble data storage devices. Discharge measurements were made upstream from the VDGIF Lockes Mill boat landing by using a power boat and acoustic Doppler current profiler (ADCP) running WinRiver II software (Turnipseed and Sauer, 2010). Discharge was measured in the morning and the afternoon each day that a WSL survey was conducted, unless the WSL survey was completed before midday. A survey of WSL at transect 14b accompanied each discharge measurement to monitor for changes in stage.

10 Data Collection and Simulation of Ecological Habitat and Recreational Habitat in the Shenandoah River, Virginia
As an additional verification for changes in stage during each data-collection period, continuous HOBO U2 (2008–10, Onset Computer Corporation) water-level and temperature loggers were deployed at the upstream and downstream ends of the study reach and in the middle at transect 8 on both banks. The loggers were placed at least 1 ft below the water surface to ensure they would be submerged the entire time. Two HOBO monitors were placed above water on land surface at either end of the study reach for barometric pressure compensation calculations. In July 2012 the total change in stage increased slightly overnight and decreased on the second day of data collection, with a maximum range of values less than 0.06 ft. Discharge ranged from 959 to 1,043 ft3/s during the July surveys. The upstream monitor showed the least amount of variation because it was located in a pool near the water intake. The left bank monitors at transect 8 and transect 1 had the greatest amount of variability because they were located in or near riffle habitats. In September 2012 stage dropped during data collection, although the stage did not change more than 0.076 ft. Discharge measurements ranged from 612 to 618 ft3/s during the September surveys.
Water-Surface-Level Adjustments
Water-surface levels were surveyed using elevation control points that had not yet been adjusted to match the Zappia and Hayes (1998) published elevations. The resulting WSLs were adjusted using the same factors used to adjust the benchmark elevations. The WSLs from transect 18 to transect 1 from the historic and the current surveys plot as would be expected for the range of discharges surveyed. The WSLs associated with the 970 ft3/s discharge measurement in 2012 served as a confirmation of accuracy as they plotted close to WSLs associated with the 907 ft3/s discharge measurement from 1997.
Fish-Community Data and Dominant Substrate
The initial investigation on the Shenandoah River (Zappia and Hayes, 1998) included flow requirements for aquatic biota drawn from a number of sources that were not known to be applicable to the Shenandoah River. The purpose of that investigation was to demonstrate the utility of the instream flow process in this region, and the reader was originally cautioned to regard it as such. For this update, fish habitat-suitability criteria are available. Habitat-suitability criteria were developed for the fish community of the South Fork Shenandoah River in 2008 and 2009 (Ramey, 2009; Krstolic and Ramey, 2012, tables 10, 11). Fish observations were made using three sampling techniques, and the habitats of each species were documented for flows representing the 10th percentile to the 75th percentile JAS flow range on the South Fork Shenandoah River. Habitat-suitability criteria (Ramey, 2009; Krstolic and Ramey, 2012) from the South Fork Shenandoah River were used for modeling at Lockes Mill because the depths and velocity range was quite similar to study sites on the South Fork Shenandoah River. Krstolic and Ramey (2012) used dominant substrate as a measure of habitat differentiation during the River Habitat Simulation (RHABSIM) software model process (Thomas R. Payne and Associates, 1998). Dominant substrate data were available for the main stem Shenandoah River; however, fewer classes of substrate were recorded by Zappia and Hayes (1998). Krstolic and Ramey (2012) recorded substrate classes for various sizes of gravel (fine, small, large), cobble (small and large), and boulder (small and large), and Zappia and Hayes (1998) simply recorded clay/silt, sand, gravel, and bedrock. The South Fork Shenandoah fish habitat-suitability criteria had to be generalized to represent dominant substrate data available for evaluation on the main stem Shenandoah River (table 4).
Table 4. Substrate-suitability indices for the Lockes Mill study reach (0163633459), main stem Shenandoah River, Virginia.
[1 indicates 100% suitable, 0.75 indicates 75% suitable, 0.5 indicates 50% suitable, and 0 indicates not suitable]
Numeric code
Main stem sub-strate category
Substrate-suitability indexSub-adult
smallmouth bass
Adult small-mouth bass
Juvenile redbreast
sunfish
Sub-adult redbreast
sunfish
Cyprinella spp.
Margined madtom
River chub
20 Clay/Silt 0 1 0.5 0.5 0 0.000 026 Clay/gravel 0 1 0 0.5 0 0.000 029 Clay/bedrock 0 0.5 0.5 0.5 0 0.000 030 Sand 0.5 0.5 0 0 0 0.000 036 Sand/gravel 0.5 0.5 0 0 0 0.000 039 Sand/bedrock 0 0 0 0 0 0.000 060 Gravel/cobble 1 1 1 1 0.75 0.75 0.7563 Gravel/sand 0.5 0 0 0 0 0.00 069 Gravel/bedrock 0.5 0 0.5 0 0.5 0.5 0.590 Boulder/bedrock 1 0.5 0.5 1 1 1.000 193 Bedrock/sand 0 0 0 0 0 0.000 096 Bedrock/gravel 0.5 1 0 1 1 1.000 1

Using RHABSIM Modeling to Determine Fish Habitat Availability and Recreation Conditions 11
Using RHABSIM Modeling to Determine Fish Habitat Availability and Recreation Conditions
The program RHABSIM 3.0 for DOS and Windows (Thomas R. Payne and Associates, 1998) was used for calibra-tion and simulation of flow and habitat. The methods used in the RHABSIM modeling process were similar to methods used in Krstolic and Ramey (2012) and Krstolic and others (2006), with calibrations of WSL and velocity used to simulate WSL, velocity, and habitat for a wide range of flows. Calibration and simulation were completed in one model for the Lockes Mill Shenandoah River study reach.
Model Calibration
The RHABSIM model calibration incorporates datasets representing topographic information for each transect, WSLs, velocities, and discharge data for the study reach. The transect data are used to calculate stage-discharge ratings to enable simulation of depths and velocities for flows not measured during hydraulic data collection. The Physical Habitat Simula-tion (PHABSIM) model developed in Zappia and Hayes (1998) was available and imported to RHABSIM so that the same transect topographic information and streambed substrate data could be utilized. The high-flow datasets representing 1,900 ft3/s and 3,200 ft3/s that had been collected in 1996 prior to the flood and the adjusted WSL, as they were corrected by Zappia and Hayes (1998), were used in their original format. New low-flow discharge and WSLs collected in 2012 representing 620 ft3/s and 970 ft3/s were added the model. The previously collected 907 ft3/s calibration dataset was omitted because it was similar to the more recent data collected. Other data elements that were updated include the distance and average slope between transects. The RHABSIM interface includes tools to examine the stage-discharge relation for each transect individually and the slope profiles for all transects. The tools were used to verify the ratings for each transect; two transects were identified that did not fit the WSL slope profiles of the other transects. The historic WSL for transects 5 and 3b as represented in the original PHABSIM model were more than 2 ft above the recent survey elevations and were omitted from the model update. The calibration technique for the original model was used to examine each transect individually and did not require the WSL slope profile to be consistent upstream or downstream from the transect in question. It is possible that calibration adjustments for transects 5 and 3b altered the streambed elevation, making the data incomparable to the recent measurements. The recently surveyed WSLs for the 620 ft3/s and 970 ft3/s discharge datasets were consistent throughout the study reach, and the slopes paralleled the Zappia and Hayes (1998) data quite well.
Water-Surface-Level CalibrationThe WSL calibration method was the same for each
transect throughout the reach. Given the large distance between transects, each transect was calibrated separately using the Log-Log regression approach (Thomas R. Payne and Associates, 1998), which creates a stage-discharge rating for each transect. The rating is then used to predict WSLs for simulated discharges that were not measured during the study. The predicted values were compared with the field-measured WSLs with relatively good agreement. Differences between predicted and observed WSLs ranged from 0.02 to 0.15 ft for pools and runs, and from 0.05 to 0.43 ft for riffles. Riffle WSLs are much more challenging to sample, which makes it difficult to get accurate measurements and predictions, espe-cially over such a large date range. The WSL for the 1,900 ft3/s calibration discharge was frequently predicted higher than what was observed. Since the two highest calibration flows were measured in 1996 prior to the flood, it is likely that the discrepancies are related to the adjustments that were made to the stage-discharge relation after the channel was altered.
Velocity CalibrationVelocity data were not re-surveyed for this model update.
The historic data that matched the streambed topography were used. Velocity calibration procedures were similar to those used with the North Fork Shenandoah and South Fork Shenandoah models (Krstolic and Ramey, 2012; Krstolic and others, 2006). The 1-velocity calibration method (Thomas R. Payne and Associates, 1998) was selected for all transects. Cell-by-cell roughness values were adjusted to ensure a good match between the simulated velocity and discharge, and the measured velocity and best-estimate discharge calibration datasets. The model-calculated discharge for each transect was compared to best-estimate calibration discharge for the reach to obtain velocity adjustment factors (VAF) for each calibration discharge. After VAF were determined for calibration discharges, they were incrementally increased for each simulation discharge. Measured velocities in the velocity calibration dataset were used as a template and adjusted on the basis of the predicted depths from WSL simulations and the VAF to simulate velocities.
Habitat Simulation and Development of Weighted Usable-Habitat Area Curves
RHABSIM model cells were centered on the verticals where depths and velocities were collected at varying intervals along each transect. The length of model cells was varied based on the kind of habitat represented along the transect and the percentage of the reach upstream or downstream from the transect that contained the same habitat type. Transect weighting factors (app. 1) were used to determine model cell lengths and ultimately areas of available habitat.

12 Data Collection and Simulation of Ecological Habitat and Recreational Habitat in the Shenandoah River, Virginia
The WSL and velocity simulations and the fish habitat-suitability criteria (HSC), developed by Ramey (2009) and Krstolic and Ramey (2012), and canoeing HSC (Milhouse, 1990; Zappia and Hayes, 1998) were input to the Habitat Simulation Model (HABSIM) of RHABSIM (Thomas R. Payne and Associates, 1998). HABSIM uses the HSC suitable ranges for water depths, water velocities, and dominant substrate to assign individual suitability ranks (on a scale from 0.0 to 1.0) for depth, velocity, and substrate in each model cell. Following Krstolic and others (2006) and Krstolic and Ramey (2012), multiplicative aggregation (Waddle, 2001) was used to calculate the composite habitat-suitability rank for each cell between 0.0 and 1.0. The area of all suitable habitat cells within a reach was summed for a total weighted usable-habitat area (WUA). The process was repeated for each species or life stage of fish and for canoeing over all simulation flows, and a functional relation between habitat and discharge was defined and expressed in the form of WUA curves. For canoeing, only depth and velocity were of concern. The velocity had upper and lower limits defining optimal, suitable, and unsuitable velocity. Flows that are faster than 5 feet per second are considered unsuitable and could be unsafe for inexperienced paddlers. For higher flows, fast velocities with low HSC ranks combined with depths with suitable HSC result in reduced WUA. Adequate water depth to avoid scraping bottom is a major consideration when paddling; therefore, habitat simulations for canoeing had additional restrictions placed on depth to include only cells that are 1-ft deep or greater.
Habitat-Discharge Relations for Lockes Mill Study Reach and the Millville Streamflow-Gaging Station
Habitat was simulated for a range of flows from 60 to 5,000 ft3/s at Lockes Mill study reach for seven species and life stages of fish and for recreation. These flows are equivalent to a range of 70 to 5,850 ft3/s at the Millville gage. Because it is advantageous to discuss habitat data in the context of long-term historical streamflow data, the Millville-equivalent flows were used as input to the time-series analysis. The WUA data represent total physical habitat available per a simulated 1,000-ft reach of stream with habitats present in the study reach for a given stream-flow (table 5; fig. 3).
The WUA curves (fig. 3) help depict the streamflows associated with maximum values of WUAs for each species and for recreation and how WUA increases or decreases as flows change. It should be noted that the WUA curves are bell-shaped, having lower WUA at the highest flows—a maximum associated with median to low-flow conditions—and decreasing WUA as flows decrease. The WUA curves have similar patterns for species of similar size or life stage as opposed to patterns grouping game or grouping non-game species together. For example, the maximum WUA for adult smallmouth bass and sub-adult smallmouth bass (Micropterus dolomieu) and river chub (Nocomis micropogon) all appear to be associated with the median flow for JAS (900 ft3/s). Sub-adult redbreast sunfish (Lepomis auritus) maximum WUA is associated with the 25th percentile flow (641 ft3/s), which is still within the normal range of flows for JAS. Smaller fish, such as spotfin or satinfin shiner (Cyprinella spp.), margined madtom (Noturus insignis), and juvenile redbreast sunfish (Micropterus dolomieu) maximum WUA were associated with the 10th percentile flows and lower. The maximum or optimum habitat is related to streamflows that consistently provide depths with an optimal range for species (table 5). Smaller fish or earlier life stage habitat requirements are optimized with depths less than 2 ft, and larger adult fish habitat requirements are optimized with depths greater than 2 ft. Canoeing WUA is maximized when streamflows are above the 75th percentile, near 2,000 ft3/sec. At discharges greater than 2,000 ft3/s, the velocity becomes faster than considered suitable for canoeing safely. Although the depth is adequate, the velocity could increase to a level that could make canoeing dangerous. For all species of fish considered during this investigation, except juvenile redbreast sunfish, habitat was maximized with streamflows between 482 and 900 ft3/s at Millville, representing the 10th percentile to the 50th percentile flows for JAS (fig. 3).
Using RHABSIM Modeling to Determine Fish Habitat Availability and Recreation Conditions 13Ta
ble
5.
Wei
ghte
d us
able
-hab
itat a
rea
in s
quar
e fe
et p
er 1
,000
feet
of s
tream
for t
he L
ocke
s M
ill s
tudy
reac
h, m
ain
stem
She
nand
oah
Rive
r, Vi
rgin
ia.
[ft3 /s
, cub
ic fe
et p
er se
cond
; Mga
l/d, m
illio
n ga
llons
per
day
]
Calc
ulat
ed1
Mill
ville
eq
uiva
lent
da
ily
disc
harg
e (ft
3 /s)
Mill
ville
eq
uiva
lent
da
ily
disc
harg
e (M
gal/d
)
Sim
ulat
ed
disc
harg
e (ft
3 /s)
Fish
spe
cies
wei
ghte
d us
able
-hab
itat a
rea
Sub-
adul
t sm
allm
outh
ba
ss
Adu
lt
smal
lmou
th
bass
Juve
nile
re
dbre
ast
sunf
ish
Sub-
adul
t re
dbre
ast
sunf
ish
Cypr
inel
la
spp.
Mar
gine
d m
adto
mRi
ver c
hub
Cano
eing
7045
607,
154
11,8
6658
,599
26,2
3415
,511
44,0
6540
,746
6,22
211
776
100
27,6
1217
,695
77,5
0053
,848
35,9
1365
,396
59,5
5626
,610
234
151
200
74,2
3535
,020
107,
398
91,5
0410
2,76
587
,364
103,
516
92,4
6235
122
730
010
7,87
350
,988
118,
366
100,
548
129,
657
124,
052
147,
316
139,
005
468
302
400
139,
293
60,1
9311
1,62
810
8,52
814
1,28
713
4,59
916
5,46
918
1,27
558
537
850
016
2,78
867
,827
102,
436
115,
064
141,
222
136,
150
171,
726
222,
073
725
469
620
168,
082
71,6
6978
,961
116,
148
133,
606
134,
522
174,
546
261,
763
819
529
700
173,
820
74,0
2167
,328
114,
672
122,
932
128,
202
177,
394
283,
911
936
605
800
175,
798
76,0
1463
,425
110,
794
120,
135
120,
926
172,
184
306,
915
1,13
573
497
016
3,14
871
,512
46,0
6110
9,38
410
6,23
510
7,48
615
3,09
033
3,86
61,
170
756
1,00
015
8,04
770
,969
40,7
1310
8,16
799
,624
104,
887
150,
095
337,
306
2,22
31,
437
1,90
010
1,62
547
,200
13,2
2667
,558
33,7
2257
,295
71,5
1636
3,23
02,
340
1,51
22,
000
91,6
0145
,153
12,2
5060
,338
31,6
1754
,914
67,3
7036
2,21
93,
522
2,27
63,
010
57,8
0730
,356
5,01
033
,316
9,61
528
,304
25,9
9932
4,18
44,
680
3,02
54,
000
43,7
4823
,842
2,93
323
,381
4,21
811
,948
13,5
8227
7,80
05,
850
3,78
15,
000
28,5
6519
,130
2,11
115
,738
667
8,25
47,
802
242,
973
1 The
ratio
of m
easu
red
disc
harg
e at
Loc
kes M
ill to
dai
ly m
ean
disc
harg
e fo
r Mill
ville
was
cal
cula
ted
for a
ll da
ys w
hich
had
pai
rs o
f dat
a. T
he v
alue
of 1
.17
was
use
d to
cal
cula
te th
e eq
uiva
lent
dai
ly
disc
harg
e at
Mill
ville
from
the
mea
sure
d or
sim
ulat
ed fl
ows a
t Loc
kes M
ill st
udy
site
.

14 Data Collection and Simulation of Ecological Habitat and Recreational Habitat in the Shenandoah River, Virginia
05032
10065
200129
300194
500323
1,000646
2,0001,294
3,0001,939
5,0003,232
50,000
100,000
150,000
200,000
250,000
300,000
350,000
400,000
Wei
ghte
d us
able
-hab
itat a
rea,
in s
quar
e fe
et p
er 1
,000
feet
Discharge, in cubic feet per second (top number in blue) or million gallons per day (bottom number)
7Q10 flow statistic
50 percent of JAS flow
July–August–September (JAS) flow percentiles, in percent
EXPLANATION
Ecological (fish) habitat Game fish habitat Sub-adult smallmouth bass Adult smallmouth bass Juvenile redbreast sunfish Sub-adult redbreast sunfish Nongame fish habitat Cyprinella spp. Margined madtom River chub Recreational (canoe) habitat Canoeing
Greater than 7525 to 7510 to less than 255 to less than 10Less than 5
Figure 3. Weighted usable-habitat area of ecological and recreational habitat for the Lockes Mill study reach on the Shenandoah River, Virginia. Flow percentiles are based on data from the Millville streamflow-gaging station (01636500) from 1930 to 2002 for streamflows during the months of July, August, and September. These statistics represent the expected range of flows and are based on the historic streamflow record.

Habitat Time-Series Scenario Analysis for Low-Flow Periods 15
Habitat Time-Series Scenario Analysis for Low-Flow Periods
For management purposes it is important to understand what the normal range of habitat conditions would be for each species of interest and which species habitat area may become limited during droughts. Time-series analysis allows the evaluation of habitat over the historic streamflow record to simulate past and future habitat conditions on the basis of the current understanding of WUA and streamflow.
Habitat Duration for Summer Months of the Historic Record
Habitat-duration plots were constructed for each species or life stage by assigning usable habitat area to each discharge value for the period of record for Millville from
1930 to 2012. Habitat values for JAS were then ordered and ranked, and the percentage of time the habitat value was equaled or exceeded was calculated. Habitat-duration statistics describe the most common and least common habitat conditions, and can be used to define a normal range of available habitat area for each species or life stage of fish (fig. 4). The normal range of habitat for summer months (JAS) represented by the 25th to 75th percentiles of available habitat is depicted on time-series plots for context. Figure 4 illustrates the differing amounts of habitat available for each species during summer months in the main stem Shenandoah River. Typically the least amount of habitat area is available for adult smallmouth bass and sub-adult redbreast sunfish, which have narrow ranges of available habitat area. River chub and sub-adult smallmouth bass tend to have the most available habitat within the study reach in the summer, and Cyprinella spp., margined madtom, and juvenile redbreast sunfish have wide ranges of available habitat.
20,000
0
40,000
60,000
80,000
100,000
120,000
140,000
160,000
180,000
200,000
SA MDO
Wei
ghte
d us
able
-hab
itat a
rea,
in s
quar
e fe
et p
er 1
,000
feet
Sub-adult smallmouth bass (Micropterus dolomieu), (SA MDO)Adult smallmouth bass (Micropterus dolomieu), (A MDO)Juvenile redbreast sunfish (Lepomis auritus), (J LAU)Sub-adult redbreast sunfish (Lepomis auritus), (SA LAU)Spotfin or satinfin shiner, (Cyprinella spp.), (CYP)Margined madtom (Noturus insignis), (NIN)River chub (Nocomis micropogon), (NMI)
Normal range of habitat for July, August, and September (JAS) 75th habitat percentiles
25th habitat percentiles
SA LAU
A MDO J LAU
CYP
NMI
NIN
EXPLANATION
Figure 4. Normal range of weighted usable-habitat area during July, August, and September for each fish species or life stage. (Shaded boxes represent 25th to 75th habitat percentiles calculated from a time-series association of the weighted usable-habitat area curves to the historic streamflow record at Millville, West Virginia).

16 Data Collection and Simulation of Ecological Habitat and Recreational Habitat in the Shenandoah River, Virginia
Times-Series Scenarios for Historic Droughts and Normal Summers
Time-series plots of the habitat availability were calculated from the discharge-habitat relations and applied to historic daily flows for the streamflow-gaging station at Millville following Krstolic and Ramey (2012) to provide a picture of habitat availability during a selected set of summer flow periods. Drought years were examined as examples of times when habitat was potentially limited so that species and habitats affected by drought could be identified. This assessment sought to describe the flow conditions that were potentially stressful for fish or recreation habitat availability and to contrast those conditions with normal or optimal habitat availability. The results and descriptions are interpretations of the WUA curves, the time-series plots, and the historic flow record. The scenarios presented in this report are for informational purposes only, and any selection of flow thresholds and desired habitat availability during drought or low-flow periods would be at the discretion of resource managers, planners, and policy makers in the Shenandoah Valley.
For each species, life stage, or canoeing, daily and monthly habitat was examined for drought years (1963, 1977, 1999, and 2002) and one normal flow year (2012). The normal range (25th to 75th percentile range) of flows for the streamflow-gaging station at Millville for JAS (from 1930 to 2002) is 641 to 1,410 ft3/s (table 2). During the selected drought years examined for this study (1963, 1977, 1999, and 2002), the monthly mean flows ranged from 392 ft3/s to 595 ft3/s during June, July, August, and September which is below the normal range of flows for JAS. During 2012, monthly mean flows ranged from 776 ft3/s to 1,199 ft3/s, which is within the normal range of flows for JAS (table 2). For management purposes it may be useful to evaluate habitat availability on a daily or monthly basis so information is presented in both formats.
Daily Summaries
During historic droughts, daily changes in habitat in response to changes in streamflow demonstrated that adult smallmouth bass and sub-adult smallmouth bass habitat was frequently below normal. When streamflows were close to the 10th percentile JAS flow (less than 500 ft3/s or 323 Mgal/d) during 2002 (fig. 5), 1999 (fig. 6), 1977, and 1963, adult and sub-adult smallmouth bass available habitat was below normal for the majority of days during at least 2 months of the summer. Streamflows were less than the 7Q10 flow (357 ft3/s or 231 Mgal/day) for 15 days during summer months of 1999. These extreme low-flow conditions also resulted in habitat decreases below the 25th percentile of available habitat for margined madtom, river chub, and sub-adult redbreast sunfish. Except for the decreases in available habitat described above, available
fish habitat in the Shenandoah River near Lockes Mill during historic droughts was within a normal range for a given species or life stage. Flows that limit most species habitat ranged from 300 ft3/s to 500 ft3/s, with particular strain to larger game species like adult smallmouth bass. In general, if flows were greater than the 10th percentile JAS flow, available habitat for all species studied was at least suitable.
As was the case on the South Fork Shenandoah River during historic droughts, adequate flows for suitable canoe-ing rarely occurred on the main stem Shenandoah River. On the basis of the habitat modeling results in the Lockes Mill section of the Shenandoah River, streamflow must be at least 500 ft3/s to ensure average depths of at least 1 ft for paddling. Flows equal to or less than the 10th percentile flow for JAS do not provide adequate depth for passage through riffle habitats. For the time-series scenarios for 2002 and 1999, conditions for canoeing were outside the normal range (figs. 5B and 6B) for the majority of days during JAS. Flows during 2012 were adequate to support canoeing at the end of July, most of August, and some of September (fig. 7B) because streamflows were greater than the 25th percentile JAS flow (641 ft3/s) during that time. Although recreation is certainly a consideration for water-resources management, when flows are only slightly higher than the 10th percentile flow for JAS and decreasing as they were during the drought years examined, canoe paddling is unlikely to be successful.

Habitat Time-Series Scenario Analysis for Low-Flow Periods 17
Discharge, in cubicfeet per secondWeighted usable-habitat area, in square feet per 1,000 feet
EXPL
AN
ATIO
NN
orm
al ra
nge
of h
abita
t for
July
, Aug
ust,
and
Sept
embe
r
75th
hab
itat
per
cent
ile50
th h
abit
at p
erce
ntile
25th
hab
itat
per
cent
ile
Sub-
adul
t sm
allm
outh
bas
s20
0,00
0
150,
000
100,
000
50,0
00
Juve
nile
redb
reas
t sun
fish
AB
150,
000
100,
000
50,0
00
Adu
lt sm
allm
outh
bas
s10
0,00
080
,000
60,0
0040
,000
20,0
00
Mar
gine
d m
adto
m15
0,00
0
100,
000
50,0
00
Sub-
adul
t red
brea
st s
unfis
h
100,
000
120,
000
80,0
00
Cypr
inel
la s
pp.
150,
000
100,
000
50,0
00
Rive
r chu
b
150,
000
200,
000
100,
000
50,0
00
Cano
e40
0,00
0
300,
000
100,
000
200,
000
Dis
char
ge fo
r the
Mill
ville
str
eam
flow
-gag
ing
stat
ion,
200
2
1,00
0
5,00
0
100
1,00
0
5,00
0
100
Dis
char
ge fo
r the
Mill
ville
str
eam
flow
-gag
ing
stat
ion,
200
2
June
July
Augu
st20
02Se
ptem
ber
June
July
Augu
st20
02Se
ptem
ber
Figu
re 5
. Ha
bita
t tim
e se
ries
for t
he L
ocke
s M
ill s
tudy
reac
h (0
1636
3345
9) d
urin
g 20
02. (
A) a
dult
and
sub-
adul
t sm
allm
outh
bas
s, s
ub-a
dult
redb
reas
t sun
fish,
and
rive
r ch
ub w
eigh
ted
usab
le-h
abita
t are
a an
d da
ily m
ean
disc
harg
e fo
r the
rive
r at M
illvi
lle (0
1636
500)
; (B)
juve
nile
redb
reas
t sun
fish,
mar
gine
d m
adto
m, C
yprin
ella
spp
., an
d ca
noei
ng w
eigh
ted
usab
le-h
abita
t are
a, a
nd d
aily
mea
n di
scha
rge
for t
he ri
ver a
t Mill
ville
(016
3650
0).

18 Data Collection and Simulation of Ecological Habitat and Recreational Habitat in the Shenandoah River, Virginia
Discharge, in cubicfeet per secondWeighted usable-habitat area, in square feet per 1,000 feet
EXPL
AN
ATIO
NN
orm
al ra
nge
of h
abita
t for
July
, Aug
ust,
and
Sept
embe
r
75th
hab
itat
per
cent
ile50
th h
abit
at p
erce
ntile
25th
hab
itat
per
cent
ile
Sub-
adul
t sm
allm
outh
bas
s20
0,00
0
150,
000
100,
000
50,0
00
Juve
nile
redb
reas
t sun
fish
AB
150,
000
100,
000
50,0
00
Adu
lt sm
allm
outh
bas
s10
0,00
080
,000
60,0
0040
,000
20,0
00
Mar
gine
d m
adto
m15
0,00
0
100,
000
50,0
00
Sub-
adul
t red
brea
st s
unfis
h
100,
000
120,
000
80,0
00
Cypr
inel
la s
pp.
150,
000
100,
000
50,0
00
Rive
r Chu
b
150,
000
200,
000
100,
000
20,0
00
Cano
e40
0,00
0
300,
000
100,
000
200,
000
Dis
char
ge fo
r the
Mill
ville
str
eam
flow
-gag
ing
stat
ion,
199
9
1,00
0
5,00
0
100
1,00
0
5,00
0
100
Dis
char
ge fo
r the
Mill
ville
str
eam
flow
-gag
ing
stat
ion,
199
9
June
July
Augu
st19
99Ju
neJu
lyAu
gust
1999
Figu
re 6
. Ha
bita
t tim
e se
ries
for t
he L
ocke
s M
ill s
tudy
reac
h (0
1636
3345
9) d
urin
g 19
99. (
A) a
dult
and
sub-
adul
t sm
allm
outh
bas
s, s
ub-a
dult
redb
reas
t sun
fish,
and
rive
r ch
ub w
eigh
ted
usab
le-h
abita
t are
a an
d da
ily m
ean
disc
harg
e fo
r the
rive
r at M
illvi
lle (0
1636
500)
; (B)
juve
nile
redb
reas
t sun
fish,
mar
gine
d m
adto
m, C
yprin
ella
spp
., an
d ca
noei
ng w
eigh
ted
usab
le-h
abita
t are
a, a
nd d
aily
mea
n di
scha
rge
for t
he ri
ver a
t Mill
ville
(016
3650
0).

Habitat Time-Series Scenario Analysis for Low-Flow Periods 19
Discharge, in cubicfeet per secondWeighted usable-habitat area, in square feet per 1,000 feet
EXPL
AN
ATIO
NN
orm
al ra
nge
of h
abita
t for
July
, Aug
ust,
and
Sept
embe
r
75th
hab
itat
per
cent
ile50
th h
abit
at p
erce
ntile
25th
hab
itat
per
cent
ile
Sub-
adul
t sm
allm
outh
bas
s20
0,00
0
150,
000
100,
000
50,0
00
Juve
nile
redb
reas
t sun
fish
AB
150,
000
100,
000
50,0
00
Adu
lt sm
allm
outh
bas
s10
0,00
080
,000
60,0
0040
,000
20,0
00
Mar
gine
d m
adto
m15
0,00
0
100,
000
50,0
00
Sub-
adul
t red
brea
st s
unfis
h
100,
000
120,
000
80,0
00
Cypr
inel
la s
pp.
150,
000
100,
000
50,0
00
Rive
r chu
b
150,
000
200,
000
100,
000
50,0
00
Cano
e40
0,00
0
300,
000
100,
000
200,
000
Dis
char
ge fo
r the
Mill
ville
str
eam
flow
-gag
ing
stat
ion,
201
2
1,00
0
5,00
0
100
1,00
0
5,00
0
100
Dis
char
ge fo
r the
Mill
ville
str
eam
flow
-gag
ing
stat
ion,
201
2
June
July
Augu
st20
12Se
ptem
ber
June
July
Augu
st20
12Se
ptem
ber
Figu
re 7
. Ha
bita
t tim
e se
ries
for t
he L
ocke
s M
ill s
tudy
reac
h (0
1636
3345
9) d
urin
g 20
12. (
A) a
dult
and
sub-
adul
t sm
allm
outh
bas
s, s
ub-a
dult
redb
reas
t sun
fish,
and
rive
r ch
ub w
eigh
ted
usab
le-h
abita
t are
a an
d da
ily m
ean
disc
harg
e fo
r the
rive
r at M
illvi
lle (0
1636
500)
; (B)
juve
nile
redb
reas
t sun
fish,
mar
gine
d m
adto
m, C
yprin
ella
spp
., an
d ca
noei
ng w
eigh
ted
usab
le-h
abita
t are
a, a
nd d
aily
mea
n di
scha
rge
for t
he ri
ver a
t Mill
ville
(016
3650
0).

20 Data Collection and Simulation of Ecological Habitat and Recreational Habitat in the Shenandoah River, Virginia
Monthly Summaries
Bar charts summarizing the number of days each month that habitat was within the normal range for each species or life stage and canoeing (table 6) were constructed from time-series daily data for JAS 1963, 1999, 2002, and 2012 (fig. 8). For smaller species, redbreast sunfish, Cyprinella spp., margined madtom, and river chub, habitat conditions were within a normal range almost all months during the selected drought years (fig. 8). Adult and sub-adult smallmouth bass and canoeing habitat was lower than the 25th percentile of habitat more than half the days of each month during 1963, 1999, and 2002. The habitat conditions for fish and canoeing were possibly as close to ideal as possible in July and August 2012 because all species of fish were within the normal habitat range for 28–31 days and canoeing was within the normal range for 20–31 days.
During wet conditions in September 1999 and 2012, available fish habitat did not follow the same patterns as might be expected with increases in flow. For example, when the maximum flow for September 1999 was 9,650 ft3/s (fig. 8), the number of days that habitat was within the normal range was six or less for all fish species. The decreased
habitat availability with higher streamflows is related to storm flow. This demonstrates a modeling limitation for the habitat-suitability criteria, because higher flows represent fast velocities or depths outside those values studied during the development of the fish HSC. For species that prefer shallow habitats, high flows can intermittently create instream habitat conditions outside the optimal or suitable ranges for depth or velocity. Canoe mean monthly suitability responded to flow changes as would be expected, increasing with more flow and decreasing with less flow.
These monthly count summary statistics could be developed on an on-going basis and integrated with the DEQ water supply planning initiative by applying the habitat-discharge relation to daily values of streamflow from USGS streamflow-gaging stations throughout the Shenandoah Basin. The available daily habitat can be compared with the normal habitat range (table 6) determined in this investigation and counted if the criteria are met. The monthly count summary statistics should also be considered in the context of the maximum and mean monthly flow for each month. The reader is encouraged to be mindful of the upper limits indicated by the HSC so that incorrect assumptions are avoided.
Table 6. Normal range of weighted usable-habitat area in square feet per 1,000 feet of stream for July, August, and September for each species and canoeing for the Shenandoah River.
Habitat percentile
Fish species weighted usable-habitat area
Sub-adult small mouth
bass
Adult small mouth bass
Juvenile redbreast
sunfish
Sub-adult readbreast
sunfish
Cyprinella spp.
Margined madtom
River chub Canoeing
75 168,915 72,538 93,909 114,639 135,852 134,562 173,092 338,04550 157,512 68,347 65,160 109,924 121,187 122,978 164,383 288,04025 131,256 58,777 34,970 98,770 85,856 94,944 132,931 236,207

Habitat Time-Series Scenario Analysis for Low-Flow Periods 21
1963 1999 2002 2012July Aug. Sept. July Aug. Sept. July Aug. Sept. July Aug. Sept.
Num
ber o
f day
s w
ithin
norm
al h
abita
t ran
ge
Max
imum
dis
char
ge,
in c
ubic
feet
per
sec
ond
353025201510
50
10,000
8,000
6,000
4,000
2,000
0
Sub-adult smallmouth bassAdult smallmouth bassJuvenile redbreast sunfishSub-adult redbreast sunfishSpotfin or satinfin shinerMargined madtomRiver chubRecreational habitat
EXPLANATION
Figure 8. Number of days per month when habitat for fish or canoeing was within the normal range during 1963, 1999, 2002, and 2012.
Increased Water-Use Scenario Results
Time-series analyses were used to investigate changes in habitat availability with increased water use up to the 2040 amounts projected by local water supply plans (Central Shenandoah Planning District Commission, 2011; Northern Shenandoah Valley Regional Commission, 2011). On the basis of the estimates for water use and population growth, cumulative water-withdrawal increases of 10, 20, and almost 50 percent (48.6 percent) were applied to the Millville streamflow record. These percentage increases in water withdrawals equate to a maximum reduction in streamflow of 26.7 ft3/s or 17.3 Mgal/d more than the present withdrawals when the 2040 estimated water-withdrawal totals for the basin are considered. As with the time-series analysis, years with extreme drought, moderate drought, and normal recent conditions were examined to determine potential effects on available habitat. Scenarios were run for both game and non-game fish ecological habitat and canoeing recreational habitat availability with increased water withdrawals.
While scenarios were run for each species that was modeled, only the species with somewhat obvious declines in habitat availability with increased withdrawals are discussed in this section. Adult and sub-adult smallmouth
bass frequently had habitat availability outside the normal range for habitat conditions during drought years such as 2002, yet 10- or 20-percent increases in withdrawals did not contribute to a large reduction in usable habitat (fig. 9A, B). When withdrawals were increased by 50 percent and habitat conditions were outside the normal range, there was an additional decrease in usable habitat (fig. 9A). During 2002 drought scenarios, reduced habitat availability for sub-adult redbreast sunfish or river chub was only slightly evident with 50-percent increased withdrawal scenarios (fig. 9C, D). This result is not surprising because the habitat availability primar-ily is based on suitability criteria that assess changes in depth or velocity as primary habitat indicators. For a river as large as the Shenandoah River, a reduction of 17.3 Mgal/d equates to a decrease in depth of less than 0.02 ft. For a recent normal year like 2012, increased water-use scenarios did not affect habitat availability for fish such as adult and sub-adult smallmouth bass, sub-adult redbreast sunfish, or river chub (fig. 10).
For recreational habitat represented by canoeing, drought conditions that were already much lower than the normal range for canoeing were decreased with increases in withdrawals. For the 2002 drought, the increased withdrawals contributed to a constant decrease as habitat continued to drop lower than normal (fig. 11A). In contrast, canoeing habitat

22 Data Collection and Simulation of Ecological Habitat and Recreational Habitat in the Shenandoah River, Virginia
availability was within the normal range for most of 2012, and any increased water-withdrawal scenario applied to that time series of habitat showed almost no affect (fig. 11B).
The increased water-withdrawal scenarios confirm that habitat availability will be reduced with increased water withdrawals. Although short-term investigations in the Shenandoah River Basin have not confirmed whether habitat and flow alteration could affect fish species diversity or abundance, investigations in other basins have shown reductions in abundance, demographic parameters, and species diversity with respect to decreases in flow magnitude of base flow, mean discharge, or total discharge (Poff and Zimmerman, 2010). Most of the studies summarized in Poff and Zimmerman (2010) represented large alterations and lacked data for moderate ranges of flow alteration, so more work is needed to ascertain whether there is a threshold response with lower levels of alteration. One study quantified the response of fluvial fish to environmental or anthropo-genic variables (Armstrong and others, 2011) and found that a one-unit (1 percent) alteration in the August median flow resulted in a 0.9-percent decrease in relative abundance of fish (in counts per hour). The 50-percent water-withdrawal increase scenario could result in as much as a 3-percent reduction in the median JAS flow statistic if water returns were minimal. If Armstrong and others (2011) calculations
were applicable to the Shenandoah River, the relative abundance of fish could be reduced by 2.7 percent.
These scenarios illustrate the importance of the timing of water withdrawals for maintaining habitat and sustaining flows during low-flow conditions. For both ecological fish habitat and recreational canoeing habitat, the antecedent conditions (habitat within normal range of habitat or below normal) appear to govern whether additional water withdrawals will affect habitat availability. The increased water-withdrawal scenarios contributed to greater reductions in habitat if streamflow was already below normal. Potential management strategies toward maintaining flows and habitat in the normal range could include withdrawing water to off-stream storage prior to low-flow months or preferentially withdrawing during storms in the summer. Implementing water-conservation practices during drought and repairing water delivery system leaks to improve efficiency, thus reducing water withdrawals, are both strategies that would proactively work toward maintaining the flow regime and available habitat. As the population and water demands increase, many of the ecological or recreational stresses may be lessened by managing the timing of water withdrawals and working to keep the projected withdrawals as low as possible.

Habitat Time-Series Scenario Analysis for Low-Flow Periods 23
Wei
ghte
d us
able
-hab
itat a
rea,
in s
quar
e fe
et p
er 1
,000
feet
EXPLANATIONNormal range of habitat for
July, August, and September
75th habitat percentile50th habitat percentile
25th habitat percentile
Habitat, no increases10 percent increased withdrawals20 percent increased withdrawals50 percent increased withdrawals
A. Adult smallmouth bass
5,000
8,000
7,000
6,000
4,000B. Sub-adult smallmouth bass
150,000
200,000
100,000
50,000C. Sub-adult redbreast sunfish
120,000
110,000
100,000
90,000
D. River chub
100,000
200,000
150,000
June July August2002
September
Figure 9. Habitat time-series increased water-withdrawal scenarios for the Shenandoah River at Millville, West Virginia, during 2002. (A) adult smallmouth bass, (B) sub-adult smallmouth bass, (C) sub-adult redbreast sunfish, and (D) river chub weighted usable-habitat area with 10-, 20-, and 50-percent increase in water use.

24 Data Collection and Simulation of Ecological Habitat and Recreational Habitat in the Shenandoah River, Virginia
Wei
ghte
d us
able
-hab
itat a
rea,
in s
quar
e fe
et p
er 1
,000
feet
EXPLANATIONNormal range of habitat for
July, August, and September
75th habitat percentile50th habitat percentile
25th habitat percentile
Habitat, no increases10 percent increased withdrawals20 percent increased withdrawals50 percent increased withdrawals
5,000
8,000
7,000
6,000
4,000
150,000
200,000
100,000
50,000
120,000
110,000
100,000
90,000
100,000
200,000
150,000
June July August2012
September
A. Adult smallmouth bass
B. Sub-adult smallmouth bass
C. Sub-adult redbreast sunfish
D. River chub
Figure 10. Habitat time-series increased water-withdrawal scenarios for the Shenandoah River at Millville, West Virginia, during 2012. (A) adult smallmouth bass, (B) sub-adult smallmouth bass, (C) sub-adult redbreast sunfish, and (D) river chub weighted usable-habitat area with 10-, 20-, and 50-percent increase in water use.

Summary and Conclusions 25
A. Canoeing habitat scenarios for 2002350,000300,000
250,000
200,000
150,000
100,000
350,000300,000
250,000
200,000
150,000
100,000
Wei
ghte
d us
able
-hab
itat a
rea,
in s
quar
e fe
et p
er 1
,000
feet
EXPLANATIONNormal range of habitat for
July, August, and September
75th habitat percentile50th habitat percentile
25th habitat percentile
Habitat, no increases10 percent increased withdrawals20 percent increased withdrawals50 percent increased withdrawals
B. Canoeing habitat scenarios for 2012
June July August September
Figure 11. Canoeing recreational habitat time-series increased water-withdrawal scenarios, main stem Shenandoah River, based on (A) 2002 flow data, and (B) 2012 flow data.
Summary and ConclusionsThis report describes updates to methods, documents
modeling results, and discusses implications from an updated habitat-flow model for the main stem Shenandoah River in Virginia. The 2010 population within the Shenandoah River watershed and adjacent areas that used water from the river represented a 29-percent increase from 1995 records, and the 2040 predicted population represents a 76-percent increase from 1995 records. Given that water withdrawals are also predicted to increase with population, there has been interest in assessing how increases in withdrawals may affect habitat and recreation in the Shenandoah River. Water withdrawals for 2005 were compared with projected water demands for 2040 from the recently completed water supply planning initiative documents written by the two planning district commissions within the Shenandoah River Basin. Most localities projected demands that approach their total presently permitted surface-water and groundwater withdrawal values by 2040, and a few are pro-jected to exceed them. The projected surface-water withdrawals vary by watershed, the North Fork Shenandoah River shows a 55.9-percent increase, the South Fork Shenandoah River shows a 46.5-percent increase, and the main stem Shenandoah River shows a 52-percent increase. Cumulatively, the 2040 surface-water withdrawal values represent a 51-percent increase from 2005 surface-water withdrawals. This equates to adjusted
daily mean flows for the Shenandoah River at Millville, West Virginia, that are 17.3 Mgal/d (26.7 ft3/s) less than they were in 2005.
Seasonal flow statistics for the Shenandoah River at Millville for the low-flow summer period of July, August, and September (JAS) were of interest for understanding effects on habitat with increases in water withdrawals during low-flow periods. Long-term record flow statistics for streamflow-gaging stations in the Shenandoah River Basin show the flow at Strasburg is approximately 35 percent of the flow at Front Royal, and the combined flow of Strasburg plus Front Royal is approximately 85 percent of the flow at Millville. Flows equal to or less than the 10th percentile for JAS (482 ft3/s or 312 Mgal/d) were evaluated as drought indicators for this study.
New water-withdrawal projections were complemented by additional low-flow water-surface level (WSL) profiles and discharge data to enhance the habitat simulation model. It was necessary to verify and install new elevation control points along the Lockes Mill study reach, with updated elevations adjusted to the previous study values. New discharge and WSL profile data were collected and combined with the two high-flow datasets previously published in an early model from 1998. After the data were combined, the model was re-calibrated, and a new habitat-discharge relation was developed for ecological habitat for fish and recreational habitat for canoeing.
26 Data Collection and Simulation of Ecological Habitat and Recreational Habitat in the Shenandoah River, Virginia
The habitat-discharge relation weighted usable-habitat area (WUA) curves have similar patterns for species of similar size or life stage as opposed to patterns grouping game or grouping non-game species together. For example, the maximum WUA for adult smallmouth bass, sub-adult small-mouth bass, and river chub all appear to be associated with the median flow for JAS (900 ft3/s). Smaller fish, such as Cypri-nella spp., margined madtom, and juvenile redbreast sunfish maximum WUA were associated with the 10th percentile flows and lower. Canoeing WUA is maximized when streamflows are above the 75th percentile, near 2,000 ft3/s.
To place the habitat-discharge relation in context, time series of habitat were used to calculate habitat-duration statistics to define normal habitat availability for the summer months. Habitat-duration statistics describe the availability of usable habitat for a given species for a range of streamflow, given the known physical conditions of the reach. The range of available habitat for adult smallmouth bass and sub-adult redbreast sunfish at the Lockes Mill study reach is narrow compared to other fish species, predominantly because these fish favor deeper pool habitats that are not as common as run habitats within the study reach.
Time-series plots of the habitat availability and daily streamflow during drought years illustrate how ecological or recreational habitat conditions may be affected by drought. For each fish species, life stage, and for canoeing, daily habitat availability was examined for drought years (1963, 1977, 1999, and 2002) and one normal flow year (2012). During his-toric droughts, streamflows were less than the 10th percentile flow (500 ft3/s or 323 Mgal/d), and adult smallmouth bass and sub-adult smallmouth bass habitats were below normal for the majority of days during at least 2 months of the summer. When streamflows were less than the 7Q10 flow (357 ft3/s or 231 Mgal/d), margined madtom, river chub, and sub-adult redbreast sunfish habitats were below normal as well. Stream-flows that limit most fish species habitat availability range from 300 to 500 ft3/s. Although recreation is a consideration for water-resources management, when flows are only slightly higher than the 10th percentile flow for JAS, canoe paddling is unlikely to be successful because flows equal to or less than the 10th percentile do not provide adequate depth for passage through riffles. Flows during 2012 were adequate to support canoeing because streamflows were greater than the 25th percentile JAS flow (641 ft3/s) during that time.
For smaller species, redbreast sunfish, Cyprinella spp., margined madtom, and river chub, habitat conditions were within a normal range almost all days of each summer month during selected drought years 1963, 1999, and 2002. Whereas, adult and sub-adult smallmouth bass and canoeing habitat was lower than the normal range of habitat the majority of days during summer months of 1963, 1999, and 2002. Ideal habitat conditions for fish and canoeing were represented by model simulations for July and August 2012. However, in September 1999 when the maximum flow for the month was 9,650 ft3/s, habitat was only within the normal range six days or less for all fish. Storm flows occurred with faster velocities
or deeper depths than those studied during the development of the fish habitat-suitability criteria, thus demonstrating a model-ing limitation represented by flows outside the study range.
Time-series analyses were used to investigate changes in habitat availability with increased water use of 10, 20, and almost 50 percent (48.6 percent) up to the 2040 amounts projected by local water supply plans of the two planning district commissions within the Shenandoah River Basin. These percentage increases in water withdrawals equate to 17.3 Mgal/d more than the present withdrawals when the 2040 estimated water-withdrawal totals for the basin are considered.
Increased water-withdrawal scenarios were run for both game and non-game fish ecological-habitat availability and canoeing recreational-habitat availability. Adult and sub-adult smallmouth bass habitat availability frequently was outside the normal range for habitat conditions during drought years, yet only when withdrawals were increased by 50 percent during drought years, were large reductions in habitat evident. For small species such as sub-adult redbreast sunfish or river chub that were usually within the normal range for habitat conditions, 2002 drought scenarios plus 50-percent increased withdrawal scenarios resulted in only slightly reduced habitat availability. For a recent normal year, like 2012, the increased water-use scenarios did not affect habitat availability for fish.
Recreational habitat represented by canoeing decreased with increases in withdrawals. For the 2002 drought, the increased withdrawals contributed to a constant decrease as habitat continued to drop lower than normal. In contrast, canoeing habitat availability was within the normal range for most of 2012, and any increased water-withdrawal scenario applied to that time series of habitat showed almost no affect.
The increased water-withdrawal scenarios confirm that habitat availability will be reduced during drought years with increased water withdrawals. While short-term investigations in the Shenandoah River Basin have not confirmed whether habitat and flow alteration could affect fish species diversity or abundance, investigations in other basins increasingly support this assertion. A study of fluvial fish assemblages in Massachusetts demonstrated decreases in relative abundance of fish in response to anthropogenic alteration to August median flows. In applying similar methods to those used in Massachusetts to the Shenandoah River, a 50-percent water-withdrawal increase could result in a 2.7 percent reduction in relative abundance of fish.
These increased water-withdrawal scenarios in this investigation illustrate the importance of the timing of water withdrawals for maintaining habitat and sustaining flows during low-flow conditions. For all simulations of habitat, the antecedent conditions (habitat within normal range of habitat or below normal) appear to govern whether additional water withdrawals will affect habitat availability. Withdrawing water to off-stream storage prior to low-flow months, preferentially withdrawing water during storms in the summer, and implementing water-conservation practices during droughts are management strategies which may help to maintain flows and habitat in the normal range. As the population and water

References Cited 27
demand increase, many of the ecological or recreational stresses may be lessened by managing the timing of water withdrawals and implementing proactive conservation strate-gies to keep the projected withdrawals as low as possible.
AcknowledgmentsThe author thanks the cooperators, Clarke and Warren
Counties, for support of this scientific work. We also thank the Northern Shenandoah Valley Regional Commission and Central Shenandoah Planning District for their continued support and interest in this work. The continued interest and feedback received from policy makers, planners, utility managers, State agency staff, and private citizens enhanced the study process.
Appreciation is extended to local landowners for allow-ing access to the river from their properties. Watermelon Park allowed access to the river along the campground that facilitated re-visiting historic monitoring locations.
Vital field assistance was provided by the lead technician for the project, Roger Moberg (USGS, Richmond, Va.) and other experienced technicians and hydrologists: Brent Banks, Carlos Rodriguez, James Duda, Karl Dydak, Geoff Austin, Russ Lotspeich, Don Hayes, and Gary Speiran (USGS, Richmond, Va.). Additional field assistance was provided by Jon Campbell (USGS, Reston, Va.). The author also thanks the peer reviewers who increased the effectiveness of this document.
References Cited
Armstrong, D.S., Richards, T.A., and Levin, S.B., 2011, Factors influencing riverine fish assemblages in Massachusetts: U.S. Geological Survey Scientific Investigations Report 2011–5193, 59 p. (Also available at http://pubs.usgs.gov/sir/2011/5193/.)
Austin, S.H., Krstolic, J.L., and Wiegand, Ute, 2011, Low-flow characteristics of Virginia streams: U.S. Geological Survey Scientific Investigations Report 2011–5143, 122 p. + 9 tables on CD. (Also available online at http://pubs.usgs.gov/sir/2011/5143/.)
Central Shenandoah Planning District Commission, 2011, Upper Shenandoah water supply plan and drought pre-paredness and response plan: Staunton, Va., Central Shenandoah Planning District Commission, accessed January 14, 2014, at http://www.cspdc.org/programs/environment/programs_environment.htm.
Fry, J., Xian, G., Jin, S., Dewitz, J., Homer, C., Yang, L., Barnes, C., Herold, N., and Wickham, J., 2011, Completion of the 2006 National Land Cover Database for the conter-minous United States: Photogrammetric Engineering & Remote Sensing, v. 77, no. 9, p. 858–864.
Kenny, J.F., Barber, N.L., Hutson, S.S., Linsey, K.S., Lovelace, J.K., and Maupin, M.A., 2009, Estimated use of water in the United States in 2005: U.S. Geological Survey Circular 1344, 52 p.
Krstolic, J.L., and Ramey, R.C., 2012, South Fork Shenandoah River habitat-flow modeling to determine ecological and recreational characteristics during low-flow periods: U.S. Geological Survey Scientific Investigations Report 2012–5081, 64 p. (Available online at http://pubs.usgs.gov/sir/2012/5081/.)
Krstolic, J.L., Hayes, D.C., and Ruhl, P.M., 2006, Physical habitat classification and instream flow modeling to deter-mine habitat availability during low-flow periods, North Fork Shenandoah River, Virginia: U.S. Geological Survey Scientific Investigations Report 2006–5025, 63 p.
Lovelace, J.K., 2009a, Methods for estimating water with-drawals for aquaculture in the United States, 2005: U.S. Geological Survey Scientific Investigations Report 2009–5042, 13 p.
Lovelace, J.K., 2009b, Methods for estimating water withdrawals for livestock in the United States, 2005: U.S. Geological Survey Scientific Investigations Report 2009–5041, 7 p.
McCabe, G.J., and Wolock, D.M., 2002, A step increase in streamflow in the conterminous United States: Geophysical Research Letters, v. 29, no. 24, p. 38–1—38–4.
Milhouse, R.T., 1990, Recreational river space as related to discharge in the Salmon River, Oswego, County, New York: US Fish and Wildlife Service, Draft Report, 56 p.
National Geodetic Survey, 2012, OPUS—Online Positioning User Service, National Geodetic Survey, accessed January 24, 2014, at http://www.ngs.noaa.gov/OPUS /about.jsp#.
Northern Shenandoah Valley Regional Commission, 2011, Northern Shenandoah regional water supply plan, submitted to Virginia Department of Environmental Quality, September 2011, 127 p.
Onset Computer Corporation, 2008–10, HOBO U2 data loggers and HOBOware software, accessed April 4, 2014, at http://www.onsetcomp.com/.
Poff, N.L., and Zimmerman, J.K.H., 2010, Ecological responses to altered flow regimes—A literature review to inform the science and management of environmental flows: Freshwater Biology, v. 55, p. 194–205.

28 Data Collection and Simulation of Ecological Habitat and Recreational Habitat in the Shenandoah River, Virginia
Ramey, R.C., 2009, Habitat suitability criteria for fishes of the South Fork of the Shenandoah River and an investiga-tion into observer effects associated with two techniques of underwater observation: Richmond, Va., Virginia Commonwealth University, Master’s thesis, 123 p.
Solley, W.B., Pierce, R.R., and Perlman, H.A., 1998, Estimated use of water in the United States in 1995: U.S. Geological Survey Circular 1200, 76 p.
Thomas R. Payne and Associates, 1998, User’s manual—RHABSIM [Riverine Habitat Simulation software] 2.0 for Dos and Windows, variously paged.
Turnipseed, D.P., and Sauer, V.B., 2010, Discharge mea-surements at gaging stations: U.S. Geological Survey Techniques and Methods, book 3, chap. A8, 87 p.
U.S. Census Bureau, 2011, 2010 Census centers of population by census block group, accessed June 21, 2011, at http://www.census.gov/geo/www/2010census/centerpop2010/blkgrp/bgcenters.html.
Vogelmann, J.E., Howard, S.M., Yang, L., Larson, C.R., Wylie, B.K., and Van Driel, J.N., 2001, Completion of the 1990’s National Land Cover Data Set for the conterminous United States: Photogrammetric Engineering and Remote Sensing, v. 67, p. 650-662, accessed November 5, 2014, at http://www.mrlc.gov/nlcd1992.php.
Waddle, T.J., ed., 2001, PHABSIM [Physical Habitat Simulation model] for Windows—User’s manual and exercises: Fort Collins, Colo.: U.S. Geological Survey Open-File Report 01–340, 288 p., accessed April 9, 2014, at http://www.mesc.usgs.gov/Products/Publications/pub_abstract.asp?PubID=15000.
Wiley, J.B., 2006, Low-flow analysis and selected flow statistics representative of 1930–2002 for streamflow-gaging stations in or near West Virginia: U.S. Geological Survey Scientific Investigations Report 2006–5002, 190 p.
Zappia, Humbert, and Hayes, D.C., 1998, A demonstration of the instream flow incremental methodology, Shenandoah River, Virginia: U.S. Geological Survey Water-Resources Investigations Report 98–4157, 24 p.
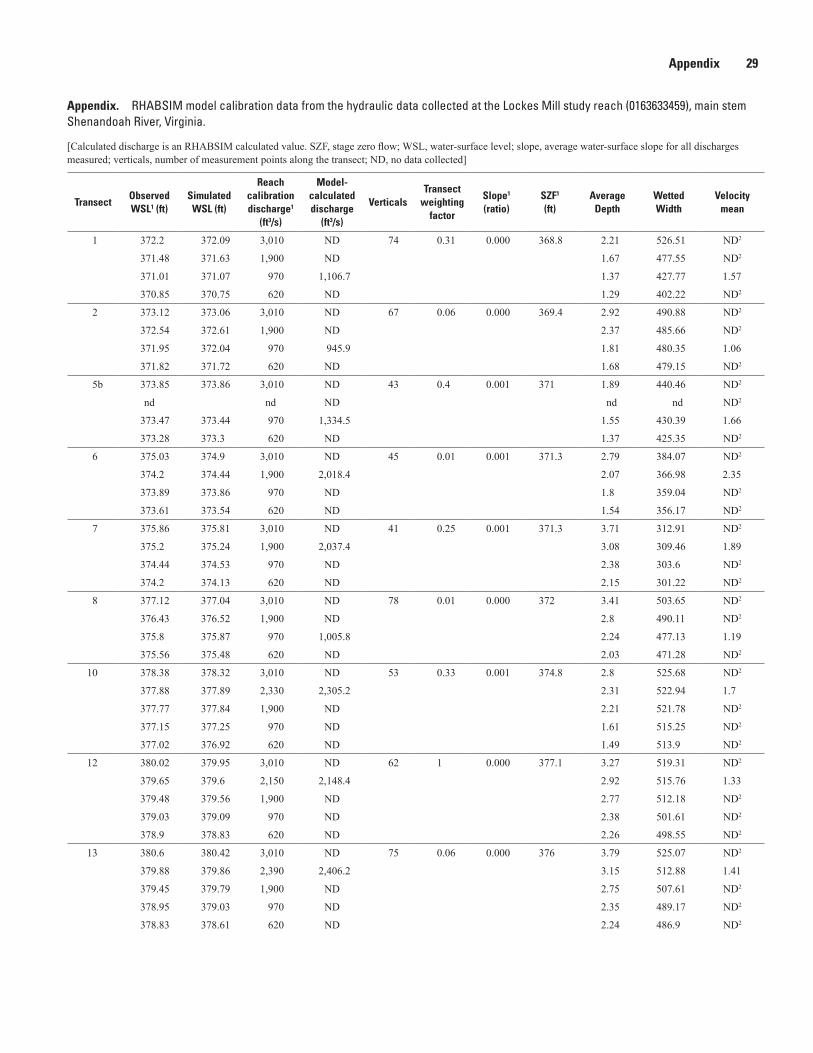
Appendix 29
Appendix. RHABSIM model calibration data from the hydraulic data collected at the Lockes Mill study reach (0163633459), main stem Shenandoah River, Virginia.
[Calculated discharge is an RHABSIM calculated value. SZF, stage zero flow; WSL, water-surface level; slope, average water-surface slope for all discharges measured; verticals, number of measurement points along the transect; ND, no data collected]
TransectObserved WSL1 (ft)
Simulated WSL (ft)
Reach calibration discharge1
(ft3/s)
Model-calculated discharge
(ft3/s)
VerticalsTransect
weighting factor
Slope1 (ratio)
SZF1 (ft)
Average Depth
Wetted Width
Velocity mean
1 372.2 372.09 3,010 ND 74 0.31 0.000 368.8 2.21 526.51 ND2
371.48 371.63 1,900 ND 1.67 477.55 ND2
371.01 371.07 970 1,106.7 1.37 427.77 1.57
370.85 370.75 620 ND 1.29 402.22 ND2
2 373.12 373.06 3,010 ND 67 0.06 0.000 369.4 2.92 490.88 ND2
372.54 372.61 1,900 ND 2.37 485.66 ND2
371.95 372.04 970 945.9 1.81 480.35 1.06
371.82 371.72 620 ND 1.68 479.15 ND2
5b 373.85 373.86 3,010 ND 43 0.4 0.001 371 1.89 440.46 ND2
nd nd ND nd nd ND2
373.47 373.44 970 1,334.5 1.55 430.39 1.66
373.28 373.3 620 ND 1.37 425.35 ND2
6 375.03 374.9 3,010 ND 45 0.01 0.001 371.3 2.79 384.07 ND2
374.2 374.44 1,900 2,018.4 2.07 366.98 2.35
373.89 373.86 970 ND 1.8 359.04 ND2
373.61 373.54 620 ND 1.54 356.17 ND2
7 375.86 375.81 3,010 ND 41 0.25 0.001 371.3 3.71 312.91 ND2
375.2 375.24 1,900 2,037.4 3.08 309.46 1.89
374.44 374.53 970 ND 2.38 303.6 ND2
374.2 374.13 620 ND 2.15 301.22 ND2
8 377.12 377.04 3,010 ND 78 0.01 0.000 372 3.41 503.65 ND2
376.43 376.52 1,900 ND 2.8 490.11 ND2
375.8 375.87 970 1,005.8 2.24 477.13 1.19
375.56 375.48 620 ND 2.03 471.28 ND2
10 378.38 378.32 3,010 ND 53 0.33 0.001 374.8 2.8 525.68 ND2
377.88 377.89 2,330 2,305.2 2.31 522.94 1.7
377.77 377.84 1,900 ND 2.21 521.78 ND2
377.15 377.25 970 ND 1.61 515.25 ND2
377.02 376.92 620 ND 1.49 513.9 ND2
12 380.02 379.95 3,010 ND 62 1 0.000 377.1 3.27 519.31 ND2
379.65 379.6 2,150 2,148.4 2.92 515.76 1.33
379.48 379.56 1,900 ND 2.77 512.18 ND2
379.03 379.09 970 ND 2.38 501.61 ND2
378.9 378.83 620 ND 2.26 498.55 ND2
13 380.6 380.42 3,010 ND 75 0.06 0.000 376 3.79 525.07 ND2
379.88 379.86 2,390 2,406.2 3.15 512.88 1.41
379.45 379.79 1,900 ND 2.75 507.61 ND2
378.95 379.03 970 ND 2.35 489.17 ND2
378.83 378.61 620 ND 2.24 486.9 ND2

30 Data Collection and Simulation of Ecological Habitat and Recreational Habitat in the Shenandoah River, Virginia
Appendix. RHABSIM model calibration data from the hydraulic data collected at the Lockes Mill study reach (0163633459), main stem Shenandoah River, Virginia.—Continued
[Calculated discharge is an RHABSIM calculated value. SZF, stage zero flow; WSL, water-surface level; slope, average water-surface slope for all discharges measured; verticals, number of measurement points along the transect; ND, no data collected]
TransectObserved WSL1 (ft)
Simulated WSL (ft)
Reach calibration discharge1
(ft3/s)
Model-calculated discharge
(ft3/s)
VerticalsTransect
weighting factor
Slope1 (ratio)
SZF1 (ft)
Average Depth
Wetted Width
Velocity mean
14 380.72 380.52 3,010 ND 47 1 0.001 375.6 4.29 569.01 ND2
379.76 379.95 2,240 2,260.9 3.38 562.46 1.2
379.45 379.88 1,900 ND 3.09 558.24 ND2
379.06 379.09 970 ND 2.73 552.72 ND2
378.89 378.65 620 ND 2.57 549.43 ND2
14b3 380.25 380.15 3,010 ND 26 0 0.000 375.6 2.3 597.06 ND2
379.6 379.75 1,900 ND 1.78 559.48 ND2
379.21 379.25 970 ND 1.49 524.6 ND2
379.04 378.95 620 ND 1.37 509.95 ND2
15 380.42 380.33 3,010 ND 40 0.1 0.000 376.5 5.26 491.5 ND2
380.18 379.92 2,200 2,187.1 5.03 490.92 0.87
379.75 379.87 1,900 ND 4.62 489.3 ND2
379.24 379.3 970 ND 4.12 487.37 ND2
379.07 378.98 620 ND 3.95 486.7 ND2
16 380.7 380.61 3,010 3,007.9 50 0.1 0.000 376.5 5.76 401 1.16
380.03 380.16 1,900 ND 5.12 399.01 ND2
379.56 379.6 970 ND 4.67 397.61 ND2
379.36 379.28 620 ND 4.48 396.39 ND2
18 380.71 380.6 3,010 ND 52 1 0.000 376.5 4.92 403.1 ND2
379.96 380.11 1,900 1,860.6 4.2 400.84 0.95
379.45 379.5 970 ND 3.71 398.74 ND2
379.25 379.16 620 ND 3.52 397.93 ND2
1Value calculated from field measurements.2No velocity dataset collected for this water-surface level.3No velocity datasets were collected for any discharges that were simulated, so the model could not calculate discharge. The transect was weighted 0, so it
does not factor into the habitat calculations but remains as part of the study for reference, water-surface calibration, and because it is central to the elevation control network.

Approved for publication January 8, 2015For further information about this publication contact:
Director U.S. Geological Survey Virginia Water Science Center 1730 East Parham Road Richmond, VA 23228
http://va.water.usgs.gov/
Prepared by the Raleigh Publishing Service Center

Krstolic—D
ata Collection and Simulation of Ecological H
abitat and Recreational Habitat in the Shenandoah River, Virginia—
Scientific Investigations Report 2015–5005
ISSN 2328-031X (print) ISSN 2328-0328 (online) http://dx.doi.org/10.3133/sir20155005