Embed Size (px)
Citation preview
1
Örebro University
School of Medicine
Degree project, 30 ECTS
June 2nd, 2017
Headphone use, hearing and listening levels in young people with hearing loss a comparison between the ages of 17 and 24
Author: Viktor Magnusson
Supervisors: Claes Möller, Professor, MD, PhD
Åsa Skagerstrand, clinical audiologist, PhD-student
2
Abstract
Introduction
Most young people (17-24 years) use personal music devices (PMD´s). Exposure to different
kinds of sounds or noise has cumulative negative effects on hearing. Several studies have
described risks with high listening levels together with a frequent use of a PMD. Exposure to
loud music in PMD´s is known to elevate hearing thresholds in normal hearing people. Ten %
are hearing impaired in Sweden and young people with congenital hearing loss seem to use
PMD´s even more, which might cause a more severe hearing loss.
Aims
The aims were to investigate hearing thresholds, PMD-listening output levels and PMD-use,
in a group of young people with congenital, severe to profound hearing loss.
Materials and Methods
Sixteen young people were tested at age 17 y (2010) and retested at age 24 y (2017), by pure
tone audiometry, measurement of PMD output levels and questionnaires. Results were
analyzed and compared using descriptive statistics, paired t-tests and ANOVA.
Results
Mean pure tone thresholds on both ears were more severe from age 16-20 to 22-27 in all
subjects. Furthermore, 66% (10/15) had 1.5dB/year more in two or more frequencies on both
ears. Pure tone thresholds on the right ear were different between the tests in frequencies 1-8
kHz. Mean listening level on the right ear in 2010 was 84.9 dB LAeq (range 54.8-108.9 dB
LAeq), and in 2017, 84.9 (range 52.2-102.9 dB LAeq). In 2010, 53% (n=8/15) subjects PMD´s
measured playing louder than 85 dB LAeq while 60 % (n=9/15) of the subjects listened to
louder levels than 85 dB LAeq in 2017. Mean listening times were 0.5 hours shorter in 2017.
Conclusions
A majority of subjects, 60%, listened to PMD´s with sound levels above 85 dB LAeq. Five
subjects had listening times that together with their PMD sound levels made them exceed safe
norms. This study concludes that young people with hearing loss are at risk for developing
additional noise induced hearing loss and need extensive education about risks with loud
PMD output levels. Hearing thresholds had deteriorated in all participants.
3
Introduction
In the 70´s portable music became available with the portable cassette players. During the
80´s more than a third of young people, 11-18y, owned a portable cassette player [1]. Later in
the 90´s, technical improvement and lower costs made portable music more accessible and
digital MP3-players were introduced [2]. Portable electronic devices such as smartphones,
tablets and computers, with headphones, became a common and natural part of everyday life.
The unit sales in Europe for all portable audio have increased and most mobile phones today
include an audio playback function [3, 4]. Today most young people use portable music
devices (PMD) and the average use in young people has been reported to about 2 hours per
day and the prevalence of PMD´s has tripled the last two decades [4, 3, 5, 6].
Ears detect changes in sound pressure levels (SPL) as changes in loudness. Sound pressure is
the changes in the atmospherics pressure caused by a sound wave. Human ears detect and
register frequencies between 20 and 20000 Hz. Sound waves with higher SPL sounds louder
and vice versa. For example a normal human ear can detect 1000 Hz at 4 dB SPL. Since long
it has been known that loud noises can damage the hearing.
Hearing impairment is the most frequent sensory impairment in Sweden, with significant
social and psychosocial implications. About 200 children are born deaf or with severe hearing
loss every year. 5000 children and young people have a severe to profound hearing loss [7].
Several studies indicate the need to increase awareness about risks with exposure to loud
music levels [8]. Noise exposure in young people are increasing, not only from PMD´s, live
music concerts and music at nightclubs are also noise sources that young people in some
extension are exposed to [4, 5].
Damage risk is decided by total acoustic energy (sound pressure and exposure time). As safe
norm is set to 85 dB LAeq for 8 hours, for every added 3 dB, exposure time must be reduced
with 50%, ex: 88 dB – 4 hours, 91 dB – 2 hours. Listening to music louder than 91 dB LAeq in
more than 2 hours exceeds the set limit with following risks for developing a noise-induced
hearing loss [9].While these norms are set for occupational noise exposure, many PMD´s have
the capacity to play sound levels well above 100 dBA [10]. PMD´s play not only music, they
provide various broadcasts or lecture material, through ear phones producing a range of
maximum levels around 88-113 dBA across different devices [4]. It is possible to obtain
levels of about 120-126 dBA [2, 4].

4
Not only the PMD´s output level decides what sound levels the users are exposed to. Different
types of headphones affect what volume the users choose. An over-the-ear headphone may
reduce background noise more than an on-the-ear headphone thus reducing the signal to noise
ratio (SNR) that result in lower output. But self-chosen listening levels may also increase with
increased background noise. This means using a PMD in a noisy environment results in a
greater noise exposure [10].
Kaplan-Neeman et al. measured a noise dose calculated on specific sound file, volume level
setting and a calibrated in ear canal SPL, using a smartphone application. It was found that
22% of the study group exceeded their weekly noise dose (85 dB, 8 hours 5 days per week)
[11].
It has also been shown that excessive exposure to music in PMD users have negative effects
on their hearing at high frequencies in young adults [12, 13]. Two studies detected increased
risk for impaired hearing in 14% of their study groups (n=120) resp. (n=29) [10, 13]. Looking
at self-reported symptoms of hearing loss and PMD use in young people, about 10 % reported
symptoms that they thought was noise related [5, 6]. A literature review made by Sliwinska-
Kowalska & Davis, on noise induced hearing loss, found that noise exposure from an early
age can have cumulative negative effects on hearing later in life [14].
Noise induced hearing loss (NIHL) develops, and damage occurs most during the first 10
years of noise exposure. It initially and usually appears as high-frequency notches (>25 dB) in
the audiogram, maximum notching depends on kind of noise and the ear canal anatomy. It
primary affects 4-6 kHz with recovery at 8 kHz. Additional years of noise exposure can
spread to lower frequencies, but 2 kHz and below are affected less [15]. However, studies that
measured hearing thresholds in young PMD-users implies damage to hearing may be seen
mainly, or first, on frequencies above 8 kHz. Some studies has found elevated thresholds (>25
dB HL) using extended high-frequency audiometry (10-20 kHz) [12, 13, 16]. These studies
indicate that extended high-frequency audiometry could be used to detect early stages of
noise-induced hearing loss.
Several studies have investigated the use of PMD´s in normal hearing young people with
surveys, audiometry and measuring sound output in PMD´s [3, 5, 8, 12]. But there are few
studies that have investigated these factors in young people with congenital hearing loss.

5
Widén et al [17] compared PMD-use, hearing thresholds and PMD-output levels (dB LAeq) in
a group of 17 year old, upper secondary school students with hearing loss, with a group of
normal hearing 17 year olds. They showed that young people with hearing loss use PMD´s
more often than normal-hearing adolescents. It was also found that young people with hearing
loss had their PMD´s at higher output levels than the normal hearing.
Aims The aims were to analyze and compare hearing thresholds, PMD-output levels and PMD-use
over time in a smaller group of young people with congenital hearing loss.
Material and Methods
Sample
Data presented in this study was collected in two parts. First as a part of a previous study [17]
where data were collected in 2010 on 29 young people with severe to profound hearing loss
(n=29). They were 16-20 years, (mean age 17y).
Subjects were recruited from a national upper secondary school for the deaf and hard of
hearing in Sweden. The tests applied were audiometry with measurement of hearing
thresholds, measurements of PMD volumes and a questionnaire to establish listening habits.
In the present study the former participants were contacted via regular mail, email, SMS and
by phone. Sixteen out of 29 persons (55%) agreed to participate. Five persons did not
respond, and seven could or did not want to participate. In February 2017, at the Audiological
Research Center in Örebro, 16 persons underwent the same tests as in 2010, described above.
Later in the analyses, one subject was excluded because of normal hearing on the right ear.
The final study group consisted of 11 females and 4 males, ages 22-27 years (mean age 24y).
Audiometry Prior to audiological testing, otoscopy of the participants was conducted. The audiological
tests were performed in a sound proof booth by an authorized audiologist. Pure tone
audiometry was conducted using an Astera audiometer and TDH 39 headphones, calibrated
according to IEC 60645-1. Pure tone audiometry for air conduction was measured at the
audiometric frequencies (half octave frequencies) between 0.125 and 8 kHz. A pure tone
mean average was calculated for the frequencies 0.5 – 4 kHz (PTA4). Pure tone audiometry
for bone conduction was measured at the audiometric frequencies between 0.5 and 4 kHz. If
the audiometric testing revealed suspicion of middle ear problems, tympanometry was

6
conducted. Furthermore, all participants were tested with speech audiometry using the
Swedish FB-test, a test where the participant is prompted to repeat the last word in a 4-word
sentence. The speech signal were presented at the persons preferred listening level with
simultaneous speech weighted noise with a SNR (signal to noise ratio) at +4dB.
The PMD measurements The sound pressure levels from the PMD’s were measured using the KEMAR manikin
(GRAS 45BM) equipped with GRAS RA0045, IEC318-4 ear simulator, with 40AG ½ inch
pressure field microphones and 26AC preamplifiers. The outputs of the two preamps were
connected to two separate inputs of a Brüel & Kjᴂr 3160-A-042 Frontend. Sound from the
earphones was analyzed in real-time in the B&K PULSE software (version 18.1.1.9). All
measurements were made in a soundproofed semi-anechoic room, with low background noise.
All adolescents brought their own PMD and headphones. Some subjects listened with
headphones through their hearing aid (n=5/15) or an inductive neck loop system (n=1/15).
They were asked to choose a favorite piece and set the volume at the level they usually listen
to in a fairly noisy environment. Measurements were made ensuring the best possible fitting
of headphones to the KEMAR manikin. If the subject listened though their hearing aid, their
ear mold were temporary replaced with foam tips, which were inserted into the artificial ear
canal, to insure a tight fit. If a neck loop was used this was hung around the neck of KEMAR.
When the PMD music was started, the PULSE system was started simultaneously. Then after
a 10 second delay the measurement was set to run for 120 second period, in which LAeq,120 sec
,
Max and Peak levels were measured. LAeq and Max levels were analyzed in 1/3 octave band.
(20Hz - 20 kHz, according to IEC 1260). Free-field sound field (ISO-11904-2) correction was
applied so that the measured sound pressure levels can be compared to maximum permissible
limits for the workplace.
Only analysis of the right ear was used, since the KEMAR manikin used in 2010 only had an
ear simulator on the right ear. The KEMAR used in the old test, had a B&K 4157 ear
simulator with a B&K 4192 microphone. However, the B&K 4157 and GRAS RA0045 are
produced in accordance to the same international standard and the two different microphones
(B&K 4192 and GRAS 40AG) have very similar specifications, so this difference has
probably very little influence on the measured sound pressure levels and spectrums.
7
Questionnaires Four questionnaires were used, three of them were the same as in the previous study and one
was new. The first questionnaire regarded hearing and PMD usage (appendix 1). The second
questionnaire comprised questions regarding subjective hearing (appendix 2). The third
questionnaire was YANS (youth attitudes to noise scale) [18] and questions regarding noise
exposure, (appendix 3). The fourth questionnaire was new and regarded external health
aspects to investigate other factors affecting hearing over time (appendix 4).
Statistical analysis
The data were analyzed using IBM SPSS (21.0.0.0). Statistics were used to analyze the results
from the hearing thresholds. Individual calculations of clinical significant progression of
hearing loss were also performed (1.5 dB/year at two or more frequencies) [19]. The hearing
thresholds were analyzed in regards to PMD-use and PMD-sound pressure levels. Differences
between the measurements in 2010 and 2017 were analyzed with t-test and one-way ANOVA
regarding measured sound pressure levels and listening habits such as duration of time.
Ethics
This study was an extension of a previous study which was approved by the regional ethical
board (no: 2009/140) that this present study-objects were a part of. In 2010 they were
informed that they might be contacted again for further studies. In 2017 all participants read
an information letter about the study and the tests they were expected to participate in (answer
a questionnaire, undergo psycho-acoustic measurements and have their PMD tested in a lab).
All participants gave a written consent. The audiogram which was performed can give the
informants useful and important information about their hearing and all participants were
informed about their present hearing loss from an audiologist. Measurements on PMD´s were
made on a physiological manikin, KEMAR. Answered questionnaires and test results were
coded and unidentifiable except gender and age. Code-keys were kept in a safe and on the
server and only authorized personnel had access.
Results
Hearing Mean pure tone thresholds (PTA4) on both ears were more severe from age 16-20 to 22-27 in
all subjects. Right ear hearing thresholds are visualized in figure 1. Clinical significant
progression of hearing loss (1.5 dB/year at two or more frequencies) were found on 10/15
subjects on the right ear and 10/15 on the left ear. The progression of hearing loss was

8
significant at higher frequencies (3-8 kHz). On the left ear 33% (5/15) had significantly more
severe PTA4 (0.5-8kHz), (>1.5 dB HT/year), in 2017. Pure tone thresholds on the right ear
were statistically significant lower (p<0.05) in 2017, at frequencies 1, 2, 4, 6, 8 kHz.
Figure 1. Mean hearing thresholds 2010 and 2017, right ear. Paired t-test, p=.0018.
Speech reception tests were only performed in 2017. The results were compared with
expected speech test-results using t-tests. On the right ear, 44% (n=7), had clinically
significant lower results on their speech tests than expected. On the left ear 31% (n=5) had
lower results (p<0.05). There were significant differences in the whole group between
measured and expected speech test results [20].
PMD-output levels
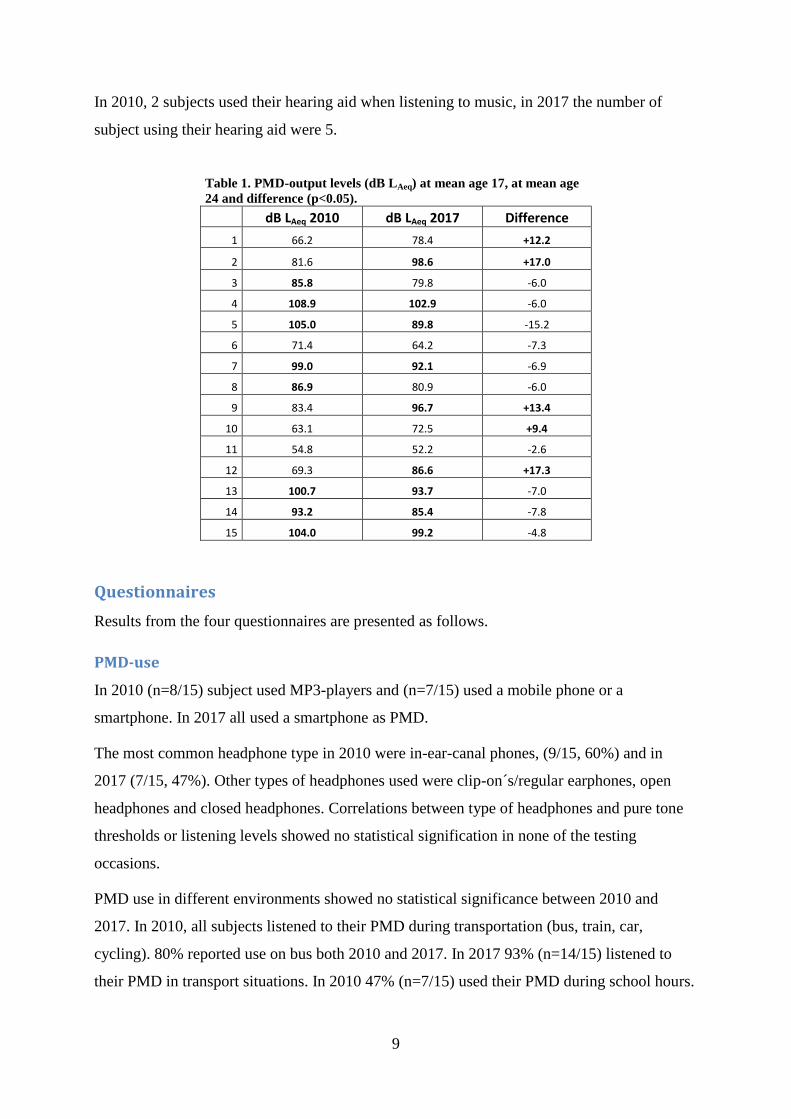
Mean listening level on the right ear in 2010 was 84.9 dB LAeq (range 54.8-108.9 dB LAeq),
and in 2017, 84.9 dB LAeq (range 52.2-102.9 dB LAeq). Five subjects had louder PMD output
levels in 2017 compared to 2010, average difference was 13.8 dB LAeq (range +9.4 - +17.3).
Ten subjects had lower PMD output levels in 2017 compared to 2010, average difference was
7.0 dB LAeq (range -2.6- -15.2).
Statistical analysis (ANOVA) between those who had increased their listening levels and
those who had lowered, showed significant difference for listening levels (p<0.05), (table 1).
In 2010, 53% (n=8/15) subjects had their PMD´s measured playing louder than 85 dB LAeq.
Five subjects had still in 2017, levels above 85 dB LAeq. 60 % (n=9/15) of the subjects
listened to louder levels than 85 dB LAeq in 2017 (table 1).
0
10
20
30
40
50
60
70
125 250 500 1k 2k 3k 4k 6k 8k
dB
HL
ISO
38
9
Frequency [Hz]
Hearing thresholds, right ear
mean age 17
mean age 24
9
In 2010, 2 subjects used their hearing aid when listening to music, in 2017 the number of
subject using their hearing aid were 5.
Table 1. PMD-output levels (dB LAeq) at mean age 17, at mean age
24 and difference (p<0.05).
dB LAeq 2010 dB LAeq 2017 Difference
1 66.2 78.4 +12.2
2 81.6 98.6 +17.0
3 85.8 79.8 -6.0
4 108.9 102.9 -6.0
5 105.0 89.8 -15.2
6 71.4 64.2 -7.3
7 99.0 92.1 -6.9
8 86.9 80.9 -6.0
9 83.4 96.7 +13.4
10 63.1 72.5 +9.4
11 54.8 52.2 -2.6
12 69.3 86.6 +17.3
13 100.7 93.7 -7.0
14 93.2 85.4 -7.8
15 104.0 99.2 -4.8
Questionnaires
Results from the four questionnaires are presented as follows.
PMD-use
In 2010 (n=8/15) subject used MP3-players and (n=7/15) used a mobile phone or a
smartphone. In 2017 all used a smartphone as PMD.
The most common headphone type in 2010 were in-ear-canal phones, (9/15, 60%) and in
2017 (7/15, 47%). Other types of headphones used were clip-on´s/regular earphones, open
headphones and closed headphones. Correlations between type of headphones and pure tone
thresholds or listening levels showed no statistical signification in none of the testing
occasions.
PMD use in different environments showed no statistical significance between 2010 and
2017. In 2010, all subjects listened to their PMD during transportation (bus, train, car,
cycling). 80% reported use on bus both 2010 and 2017. In 2017 93% (n=14/15) listened to
their PMD in transport situations. In 2010 47% (n=7/15) used their PMD during school hours.
10
While in 2017 only 33% (n=5/15) reported use of PMD during school (university) hours or
working hours.
In 2010, 5/15 subjects reported listening to their PMD while falling asleep. In 2017 two
subjects reported use of PMD while falling asleep.
Average age starting PMD-use was 12 years (6-16 y). In 2010 67% (n=10/15) of the subjects
listened with their PMD every day, 33% (n=5/15) used their PMD one or several times per
week. In 2017, 40% (n=6/15) used their PMD every day and 60% (n=9/15) used it one or
several times per week.
Mean listening times were 30 minutes shorter in 2017. Mean listening times in 2010 was 2.5
hours (range 1-24 hours) at every occasion. In 2017 it was 2.0 hours (range 0.5-4.5 hours) at
every occasion. 33% (n=5/15) listened for 3 hours or more every time they used their PMD in
2010. These 5 subjects had all reduced their occasional listening times to 3 hours or less in
2017.
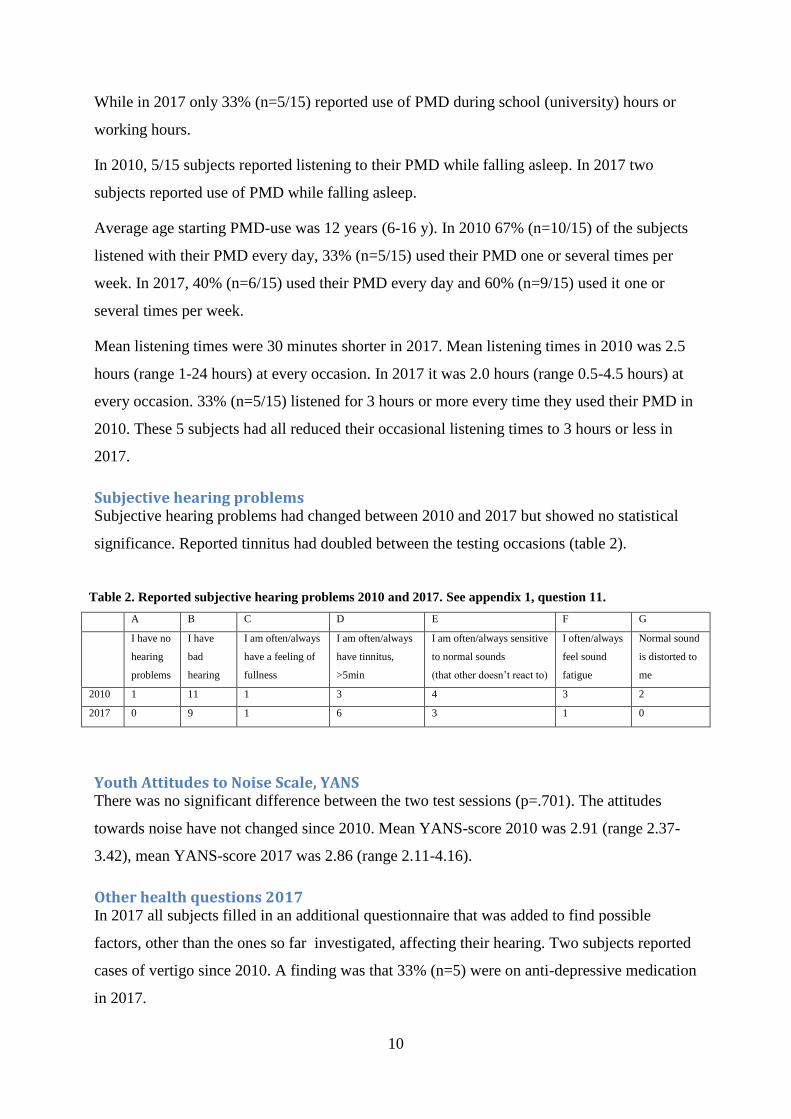
Subjective hearing problems Subjective hearing problems had changed between 2010 and 2017 but showed no statistical
significance. Reported tinnitus had doubled between the testing occasions (table 2).
Table 2. Reported subjective hearing problems 2010 and 2017. See appendix 1, question 11.
A B C D E F G
I have no
hearing
problems
I have
bad
hearing
I am often/always
have a feeling of
fullness
I am often/always
have tinnitus,
>5min
I am often/always sensitive
to normal sounds
(that other doesn’t react to)
I often/always
feel sound
fatigue
Normal sound
is distorted to
me
2010 1 11 1 3 4 3 2
2017 0 9 1 6 3 1 0
Youth Attitudes to Noise Scale, YANS There was no significant difference between the two test sessions (p=.701). The attitudes
towards noise have not changed since 2010. Mean YANS-score 2010 was 2.91 (range 2.37-
3.42), mean YANS-score 2017 was 2.86 (range 2.11-4.16).
Other health questions 2017 In 2017 all subjects filled in an additional questionnaire that was added to find possible
factors, other than the ones so far investigated, affecting their hearing. Two subjects reported
cases of vertigo since 2010. A finding was that 33% (n=5) were on anti-depressive medication
in 2017.
11
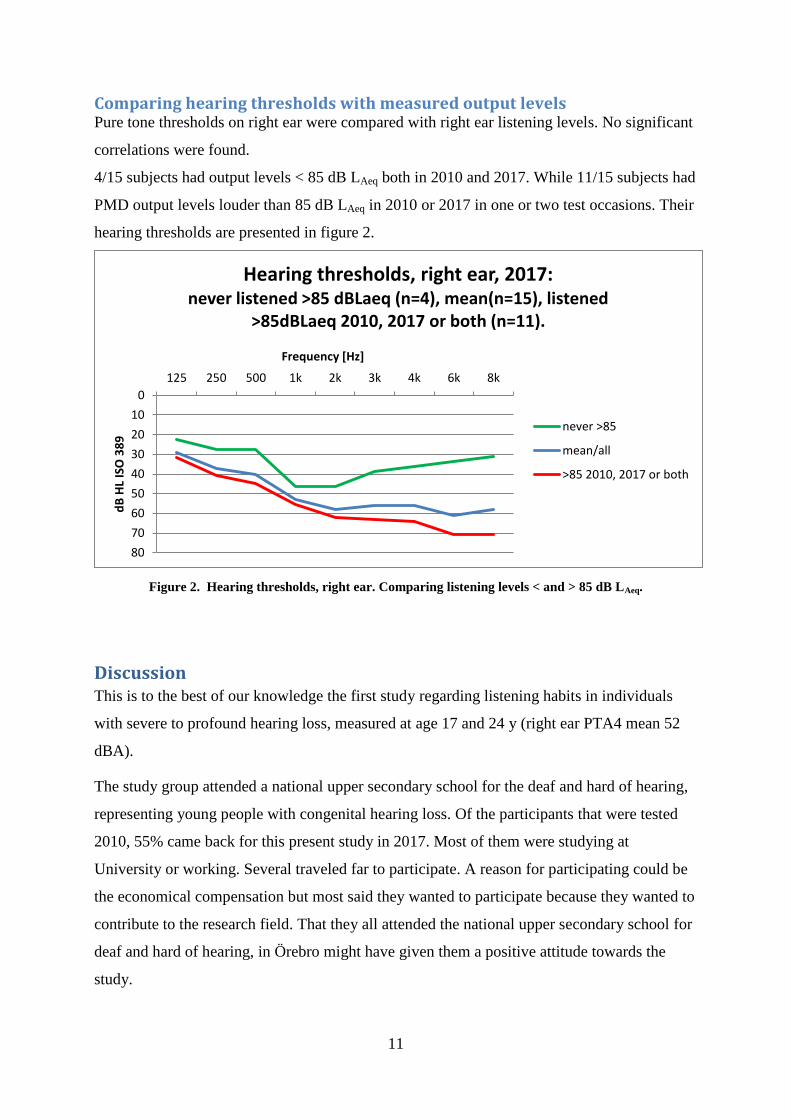
Comparing hearing thresholds with measured output levels Pure tone thresholds on right ear were compared with right ear listening levels. No significant
correlations were found.
4/15 subjects had output levels < 85 dB LAeq both in 2010 and 2017. While 11/15 subjects had
PMD output levels louder than 85 dB LAeq in 2010 or 2017 in one or two test occasions. Their
hearing thresholds are presented in figure 2.
Figure 2. Hearing thresholds, right ear. Comparing listening levels < and > 85 dB LAeq.
Discussion This is to the best of our knowledge the first study regarding listening habits in individuals
with severe to profound hearing loss, measured at age 17 and 24 y (right ear PTA4 mean 52
dBA).
The study group attended a national upper secondary school for the deaf and hard of hearing,
representing young people with congenital hearing loss. Of the participants that were tested
2010, 55% came back for this present study in 2017. Most of them were studying at
University or working. Several traveled far to participate. A reason for participating could be
the economical compensation but most said they wanted to participate because they wanted to
contribute to the research field. That they all attended the national upper secondary school for
deaf and hard of hearing, in Örebro might have given them a positive attitude towards the
study.
0
10
20
30
40
50
60
70
80
125 250 500 1k 2k 3k 4k 6k 8k
dB
HL
ISO
38
9
Frequency [Hz]
Hearing thresholds, right ear, 2017: never listened >85 dBLaeq (n=4), mean(n=15), listened
>85dBLaeq 2010, 2017 or both (n=11).
never >85
mean/all
>85 2010, 2017 or both
12
On both ears, ten subjects (66%, n=10/15), had hearing thresholds that had deteriorated with
clinical significance (>1.5 dB HT/year) in two or more frequencies (0.125 - 8 kHz). This is a
group of people with congenital hearing loss and these results indicate a progressive loss of
hearing more than expected in this age and in such a short period of time. It is reasonable to
assume that loud listening volumes have affected the hearing of these individuals.
Most of the subjects in 2017 (9/15) exposed themselves to PMD output levels above 85 db
LAeq. Five subjects listened above 85 dB LAeq at both test occasions. The norms of 85 dB LAeq
are made for industrial work during eight hours, five days per week and it is made for subjects
with normal hearing. It has been demonstrated that subjects with sensory hearing loss are
more susceptible to loud sounds, which might destroy remaining sensory cells [4].
Even though average listening time per week should be less than 40 hours, five subjects
PMD´s were measured playing over 85 dB LAeq. One subjects PMD´s measured output was
102.87 dB LAeq, calculating on safe norms, below 85 dB LAeq in 8 hours -5 days a week [4, 9],
this level gives a safe listening time of 1 hour and 33 minutes. This subject reported listening
for 2 hours at every occasion which means that he or she exceeds the safe norm thus being in
risk for developing NIHL [14, 21]. In total, five subjects had listening levels that together
with their listening times made them exceed safe norms. Two of these subjects had the most
severe deterioration on hearing thresholds. One reason could of course be that the severe
hearing loss makes the person listen to extremely loud sound levels.
This study concludes that there are great individual differences in hearing thresholds, listening
habits and PMD-output levels. Still, on a group level there are no major differences in
comparing the two testing occasions.
They all, except one, used their smartphones as PMD in 2017. Most smartphones are
equipped with an audio playback function and it is easy to draw the conclusion that music in a
portable form has become more accessible. This in turn should mean that the known risk with
prolonged exposure to music is a definite and a highly relevant phenomenon.
On a group level no significant correlations between type of headphones, hearing thresholds
and PMD-output levels in any of the testing occasions were found. Even though headphone
type can affect chosen listening levels (CLL) by isolating background noise more or less,
affecting the listeners chosen listening level [10, 22], this study group was probably too small
to be able to show this.

13
The average starting age using PMD was 12 years. All subjects reported listening to their
PMD more than once a week both in 2010 and in 2017. 11/15 reported use every day in 2017.
That mean listening hours were 0.5 hours shorter in 2017 which might indicate a more mature
perception on noise exposure. However, looking at YANS-score, attitudes towards noise had
not changed. Shorter listening time could also reflect the fact that the study group is older and
have different living conditions, such as work instead of school.
One limit is that the question about listening time was as follows; “for how long do you
usually listen with your PMD at every occasion?” This leaves an uncertainty, one subject
could answer 2 hours listening time but might listen at several occasions per day. Therefore
these data must be viewed with some precaution, rather indicating a trend.
All (5/15) subjects that listened more than three hours in 2010 had all reduced their occasional
listening times to 3 hours or less in 2017. Two of these individuals listened to volumes louder
than 85 dB LAeq in 2017.
It is difficult to quantify self-reported subjective or perceived hearing and to draw any certain
conclusions. However 11/15 subjects experienced they had bad hearing in 2010. In 2017, 9/15
subjects assented to bad hearing. A lot has happened in seven year in hearing aids and even
though this is a small study group, the fact that less assent to their hearing as “bad” could
show these improvements. But there are too many factors that affect perceived hearing to
make any conclusion. Reported tinnitus had doubled between the testing occasions, however
no correlation to deteriorated hearing or loud PMD output levels and tinnitus were found.
Five subjects (5/15, 33%) reported use of anti-depressive medication or being diagnosed with
some type of depressive condition. In Sweden the prevalence of anti-depressive medication
was about 6% in the age group 16-29y in 2014 [23].
Conclusions A majority of the subjects in this study listened to sound levels above 85 dB LAeq. Five
subjects reported listening times that together with their PMD sound levels made them
exceeded safe norms by far. This study concludes that young people with hearing loss that use
PMD´s are at risk for developing additional noise induced hearing loss. This study also
indicates that young people with congenital, severe to profound hearing loss must get
extensive education about the risks with exposure to noise in PMD´s.
14
References 1. Bradley R, Fortnum H, Coles R. Patterns of exposure of schoolchildren to amplified music.
British Journal of Audiology. 1987;21:119-125.
2. Breinbauer HA, Anabalón, JL, Gutierrez D, Cárcamo R, Olivares C, Caro J. Output
capabilities of personal music players and assessment of preferred listening levels of test
subjects: Outlining recommendations for preventing music-induced HL. Laryngoscope,
2012;122:2549-2555.
3. Smith PA, Davis A, Ferguson M, Lutman ME, The prevalence and type of social noise
exposure in young adults in England. Noise Health 2000;2:41-56.
4. Scientific committee on emerging and newly identified health risks. Scientific opinion on
the potential health risks of exposure to noise from personal music players and mobile phones
including a music playing function; 2008 (Cited 24.04.2017). Available at:
http://ec.europa.eu/health/ph_risk/committees/04_scenihr/docs/scenihr_o_018.pdf.
5. Ahmed S, Fallah S, Garrido B, Gross A, King M, Morrish T, et al. Use of portable audio
devices by university students. Canadian Acoustics 2007;35-52.
6. Danhauer JL, Johnson CE, Byrd A, DeGood L, Meuel C, Pecile A, et al. Survey of college
students on iPod use and hearing health. Journal of the American Academy of Audiology
2009; 20:5-27.
7. Hörselskadades riksförbund. Adjö yxskaft: om hörselskadades situation i Sverige.
Årsrapport 2008. Stockholm: Hörselskadades riksförbund (HRF); 2008.
8. Biassoni EC, Serra MR, Hinalaf M, Abraham M, Pavlik M, Villalobo JP, et al. Hearing and
loud music exposure in a group of adolescents at the ages of 14-15 and retested at 17-18.
Noise Health 2014;16:331-41.
9. Socialstyrelsen. Buller: Höga ljudnivåer och buller inomhus. Stockholm: Socialstyrelsen;
2008. 101; 4.
10. Portnuff C, Fligor B, Arehart K. Teenage use of portable listening devices: A hazard to
hearing? Journal of the American Academy of Audiology 2011;22:663-677.
11. Kaplan-Neeman R, Muchnik C, Amir N. Listening to music with personal listening
devices: monitoring the noise dose using a smartphone application. Int J Audiol. 2017;1:1-8
12. Sulaiman AH, Husain R, Seluakumaran K. Hearing Risk among Young Personal
Listening Device Users: Effects at High-Frequency and Extended High-Frequency
Audiogram Thresholds. The Journal of International Advanced Otology 2015; 11(2):104-9.
13. Peng J-H, Tao Z-Z, Huang Z-W. Risk of damage to hearing from personal listening
devices in young adults. The Journal of Otolaryngology. 2007;36(3):181-185.
14. Sliwinska-Kowalska M, Davis A. Noise-induced hearing loss. Noise Health 2012;14:274-
280.
15. Doswell Royster J. Preventing Noise-Induced Hearing Loss. North Carolina Medical
Journal. 2017;78:113-117.

15
16. Le Prell CG, Spankovich C, Lobarinas E, Griffiths SK. Extended high frequency
thresholds in college students: effects of recreational noise. J Am Acad Audiol.
2013;24(8):725-739.
17. Widén SE, Möller C, Kähäri K. Headphone listening habits, hearing thresholds and
listening levels in Swedish adolescents with severe to profound hearing loss and adolescents
with normal hearing. Noise & Health, 2017, in press.
18. Widén, SE. (2006). Noise and Music – A Matter of Risk Perception. Department of
Psychology, Göteborg University, Sweden.
19. Van Camp G, Smith RJH. The hereditary hearing loss homepage. Eropean work group on
genetics of hearing impairment. 1998;4:1-3.
20. Barrenäs ML, Wikström I. The Influence of Hearing and Age on Speech Recognition
Scores in Noise in Audiological Patients and in the General Population. Ear & Hearing.
2000;21(6):569-77.
21. Henderson E, Testa MA, Hartnick C. Prevalence of Noise-induced hearing-threshol shifts
and hearing loss among US youths. Pediatrics. 2011;127:39-46.
22. Croghan NB, Swanberg AM, Anderson MC, Arehart KH. Chosen listening levels for
music with and without the use of hearing aids. Am J Audiol. 2016;25:161-166.
23. Folkhälsomyndigheten. Läkemedelsanvändning – nationella folkhälsoenkäten [Internet].
Stockholm: Folkhälsomyndigheten; 2014 [uppdaterad 2016-08-30; citerad 2017-05-22]
Hämtad från: https://www.folkhalsomyndigheten.se/folkhalsorapportering-
statistik/statistikdatabaser-och-visualisering/nationella-
folkhalsoenkaten/lakemedelsanvandning/.

16
Appendix
1. Användning av bärbar musikspelare
1. Vad använder du för typ av bärbar musikspelare (mobiltelefon, mp3, cd, minidisk etc.)?
Om det är flera så ange den du använder mest. ___________________________
2. Vilken typ av hörlurar använder du idag?
A) Utanpåliggande, modell större, av typ kåpa, med tätningsring B) Vanliga, utanpåliggande, inte tätande C) Små, runda som ligger löst i örat D) Små, som trycks in och som tätar i hörselgången E) Lyssnar via / tillsammans med mitt hörhjälpmedel (ex. bluetooth) (vg specificera)________________________________________________ F) Annat (vg specificera)_________________________________________
3. Vilken typ av hörlurar har du använt mest under de senaste 3 åren sedan du började använda bärbar musikspelare? (se olika alternativ under fråga 2, A, B, C, D, E eller F)
___________________
4. Hur länge har du haft din nuvarande och mest använda bärbara musikspelare?
___________________ 5. Hur gammal var du när du först började använda/ lyssna regelbundet med bärbar
musikspelare? ___________________
6. Hur ofta lyssnar du med din bärbara musikspelare? Sätt ett kryss.
A) Varje dag B) Någon/några gånger per vecka
C) Någon/några gånger per månad D) Någon/några gånger per år 7. Hur länge brukar du lyssna med din bärbara musikspelare vid varje tillfälle?
Ange antal timmar_________ 8. Hur mycket av maxvolym (ungefär) brukar du ha på? Sätt ett kryss.
A) 25 % av max B) 50 % av max C) 75 % av max D) 100 % av max

17
9. I vilka miljöer brukar du använda din bärbara musikspelare? Ringa in de svarsalternativ
som stämmer bäst överens med din situation. Om inget av alternativen nedan stämmer in så anteckna den/de situation/er som du använder din musikspelare på raden nedan.
a. Bussen B) Tåget C) Båten D) Bilen E) Går F) Joggar G) Cyklar H) Sportar I) Kopplar av J) Skolan/arbetet -rast utomhus K) Skolan/arbetet-rast inomhus L) Skolan/arbetet -lektions- /arbetstid M) Skolan/arbetet -lunchtid N) Läxläsning/Pluggar O) Annat ________________________________________________
10. Brukar du använda din bärbara musikspelare när du ska somna och sover? Sätt ett
kryss.
A) Ja B) Nej
11. Hur upplever du din hörsel? Sätt ett kryss på det som stämmer på dig.
A) Jag har inga hörselproblem alls
B) Jag hör dåligt
C) Jag har ofta/alltid lockkänsla
D) Jag har ofta/ alltid tinnitus (öronsus/ljud) i > 5 min
E) Jag är ofta/ alltid känslig för normalstarka ljud som andra inte reagerar på (t.ex.
disk, pappersprassel, trafik, samtal i grupp)
F) Jag känner mig ofta/ alltid ”ljudtrött” i öronen
G) Ljud som låter bra eller som andra inte klagar på, låter ofta/ alltid distorderade (orena, skrapiga, trasiga) för mig
H) Något annat hörselproblem? _________________________
Är det något du vill tillägga? __________________________________________________________________________
18
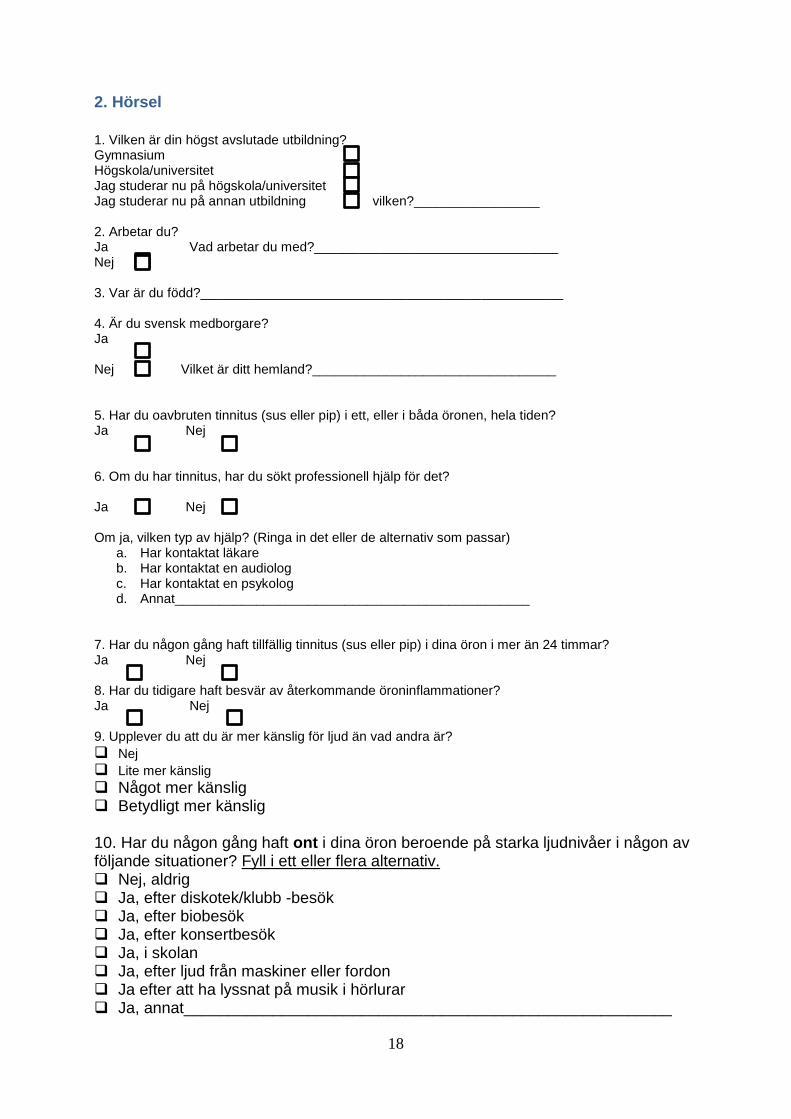
2. Hörsel 1. Vilken är din högst avslutade utbildning? Gymnasium Högskola/universitet Jag studerar nu på högskola/universitet Jag studerar nu på annan utbildning vilken?_________________ 2. Arbetar du? Ja Vad arbetar du med?_________________________________ Nej 3. Var är du född?_________________________________________________ 4. Är du svensk medborgare? Ja Nej Vilket är ditt hemland?_________________________________ 5. Har du oavbruten tinnitus (sus eller pip) i ett, eller i båda öronen, hela tiden? Ja Nej 6. Om du har tinnitus, har du sökt professionell hjälp för det? Ja Nej Om ja, vilken typ av hjälp? (Ringa in det eller de alternativ som passar)
a. Har kontaktat läkare b. Har kontaktat en audiolog c. Har kontaktat en psykolog d. Annat________________________________________________
7. Har du någon gång haft tillfällig tinnitus (sus eller pip) i dina öron i mer än 24 timmar? Ja Nej 8. Har du tidigare haft besvär av återkommande öroninflammationer? Ja Nej 9. Upplever du att du är mer känslig för ljud än vad andra är?
Nej
Lite mer känslig
Något mer känslig Betydligt mer känslig 10. Har du någon gång haft ont i dina öron beroende på starka ljudnivåer i någon av följande situationer? Fyll i ett eller flera alternativ. Nej, aldrig Ja, efter diskotek/klubb -besök Ja, efter biobesök Ja, efter konsertbesök Ja, i skolan Ja, efter ljud från maskiner eller fordon Ja efter att ha lyssnat på musik i hörlurar Ja, annat_______________________________________________________

19
11. Hur ofta har du haft ont i öronen därför att du varit exponerad för starka ljud? Aldrig Sällan Ibland Ofta Mycket ofta Alltid 12. Har du någon gång haft tinnitus (sus eller pip) i öronen på grund av kraftiga ljudnivåer i någon av följande situationer? Fyll i ett eller flera alternativ. Nej, aldrig Ja, efter diskotek/klubb -besök Ja, efter biobesök Ja, efter konsertbesök Ja, i skolan Ja, efter ljud från maskiner eller fordon Ja, efter att ha lyssnat på musik i hörlurar Ja, annat _______________________________________________________ 13. Hur ofta har du haft tinnitus (sus eller pip) i öronen efter det att du varit exponerad för starka ljud? Aldrig Sällan Ibland Ofta Mycket ofta Alltid 14. Har du någon gång uppmärksammat en förändring i din hörsel (t.ex. lock för öronen, sämre hörsel, att ljud upplevts som mer dämpade, etc) på grund av starka ljud i någon av följande situationer. Markera ett eller flera alternativ. Nej, aldrig Ja, efter diskotekbesök Ja, efter biobesök Ja, efter konsertbesök Ja, i skolan Ja, efter ljud från maskiner eller fordon Ja, efter att ha lyssnat på musik i hörlurar Ja,
annat____________________________________________________________

20
15. Hur ofta har du upplevt förändringar i din hörsel efter att du varit exponerad för starka ljud? Aldrig Sällan Ibland Ofta Mycket ofta Alltid 16. Om du upplevt att det susat/pipit i öron eller i huvud vid något tillfälle, vad tänkte du då? Kryssa för det alternativ som du tycker passar bäst med hur du tänkte. Alternativ 1. Ljudet kommer att försvinna snart. Alternativ 2. Tänk om ljudet inte försvinner, och jag måste dras med detta i
resten av mitt liv. Annat: vad?
_______________________________________________________ 17. Hur ofta tycker du att ljudvolymen i skolan/universitetet/din arbetsplats är obekvämt hög? Aldrig Sällan Ibland Ofta Mycket ofta Alltid 18. Hur ofta är din hemmiljö bullrig? Aldrig Sällan Ibland Ofta Mycket ofta Alltid

21
3. Attityder till ljud
Youth Attitude to Noise Scale (YANS) Instämmer helt
Instämmer delvis
Tveksam Tar delvis
avstånd
Tar helt avstånd
1. Jag tycker att ljudvolymen på t.ex. klubbar, uteställen, konserter och sportevenemang, rent generellt är för höga.
2. Att lyssna på musik under tiden jag gör mina läxor, hjälper mig att koncentrera mig.
3. Jag är beredd att göra något för att ljudmiljön i skolan/arbetsplatsen skall bli tystare.
4. Jag överväger att lämna exempelvis klubben, utestället, konserten eller sportevenemanget om ljudvolymen är för hög.
5. Jag kan koncentrera mig även om det är mycket ljud runt i kring mig.
6. Jag tycker att det är onödigt att använda hörselskydd när jag är på t.ex. klubb, uteställen, konserter eller sportevenemang.
7. Det är viktigt för mig att göra min ljudmiljö trivsammare.
8. Jag tycker inte om att ha det tyst omkring mig.
9. Ljudvolymen på t.ex. diskotek, uteställen, konserter eller sportevenemang är inget problem.
10. Buller och starka ljud är en naturlig del av vårt samhälle.
11. Trafikbuller är inte störande.
12. Ljudvolymen borde sänkas på t.ex. klubbar, uteställen, konserter och sportevenemang.
13. Jag anser att det mestadels borde vara lugn och tyst i klassrum.
14. Ljud från fläktar, kylskåp, datorer, etc. stör mig inte.
15. Jag är beredd att avstå från aktiviteter där ljudvolymen är för hög.
16. Ljudmiljön i skolan/arbetet känns bra.
17. Det är lätt för mig att ignorera trafikbuller.
18. Det borde finnas fler lagar eller regler som reglerar ljudnivåerna i samhället.
19. När jag inte kan komma ifrån ljud som besvärar mig, känner jag mig hjälplös.

22
Hur ofta gör du någon av följande aktiviteter?
Hur ofta använder du hörselskydd när du gör denna aktivitet?
Aldrig Sällan (några enstaka gånger per år)
Ibland (någon enstaka gång per månad)
Ofta (flera gånger i veckan)
Använder aldrig
hörselskydd
vid denna aktivitet
Använder ibland
hörselskydd vid denna
aktivitet
Använder alltid
hörselskydd vid denna
aktivitet
1. Använder fyrverkerier, smällare
2. Övar skytte, eller deltar i jakt med eldvapen
3. Åker moped eller motorcykel
4. Använder motorgräsklippare
5. Deltar eller närvarar på motorsporter t.ex. speedway och rally.
6. Närvarar på rock konserter el dyl.
7. Närvarar på dans eller diskotek
8. Närvarar på aerobics klasser
9. Lyssnar på musik i hörlurar
10. Lyssnar på musik på hög volym på hemstereon
11. Lyssnar på bilstereon på hög volym
12. Spelar i band eller orkester
13. Använder bullriga maskiner eller verktyg
14. Arbetar i en bullrig miljö

23
4. Övrigt
1. Har du sökt vård eller medicinerat mot någon allvarlig åkomma de senaste 7 åren? Ja Vad?_______________________________________________
Vilka läkemedel använde du?____________________________ Nej 2. Är du frisk? Ja Nej Vilken sjukdom?____________________ 3. Medicinerar du regelbundet? Ja Vad?_____________________ Nej 4. Har du haft något av följande? Skallskada Högt blodtryck Hjärtbesvär Blodpropp Högt kolesterol Sockersjuka (diabetes) Njurbesvär Yrsel Annat vad?____________________________ 5. Har du någon ärftlig sjukdom i släkten, i så fall vad?
______________________________

24
Cover letter
May 16th, 2017. Corresponding author: Viktor Magnusson, Bachelor of medicine, Örebro
University
Dear Editor
Headphone use, hearing and listening levels in young people with hearing loss
- a comparison between the ages of 17 and 24
Young people (17-24 y) with hearing loss seem to use personal music devices (PMD) more
than normal hearing young people. Since exposure to noise have cumulative negative effects
on hearing young people with hearing loss need to protect their hearing.
We have measured hearing thresholds, PMD listening output levels and PMD-use, in a group
of young people with congenital, severe to profound hearing loss. They were tested when they
were 17 (16-20) years old and retested when they were 24 (22-27) years old 2010 & 2017.
Mean pure tone thresholds (PTA4) on both ears had progressed from age 17y to 24y in all
subjects. 33% of the study group exceeded safe norms (85 dB LAeq, 8h) by far.
Our study concludes that young people with hearing loss are at risk for developing additional
noise induced hearing loss and there is a need for extensive education about loud PMD output
levels and damage to hearing.
This manuscript has not been presented and is not considered for publication elsewhere.
Best regards
Viktor Magnusson

25
Populärvetenskaplig sammanfattning
Hörselskadade ungdomar och bärbara musikspelare.
Ljud kan vara skadligt om man lyssnar på för hög volym under lång tid. Ljudstyrka anges som
decibel (dB). Ett vanligt samtal har en ljudstyrka omkring 50 dB, livlig trafik ungefär 80 dB,
en rockkonsert 100 dB och ett jetflygplan ca 120 dB. Hörlurar med musik ska helst inte vara
högre än 85 dB då det kan skada hörseln.
Vi har undersökt hörselskadade ungdomars användande av bärbara musikspelare. 2010 fick
29 stycken 17-åringar, från riksgymnasiet i Örebro för döva och hörselskadade, fylla i en
enkät om sina musiklyssnarvanor. De fick lämna in sina bärbara musikspelare (mp3-spelare
eller mobiltelefoner) för att mäta hur högt de spelade. Deras hörsel testades också.
2017 kallades ungdomarna tillbaka för att göra samma tester som 2010. 16 av dem kom under
februari månad föra att fylla i samma enkät, göra samma mätningar på deras musikspelare och
göra samma sorts hörseltest.
Vi tittade om det fanns några som hade särskilt sämre hörsel mellan testtillfällena, om det
fanns några som lyssnade på höga volymer och om någon hade fyllt i något speciellt i
enkäten. Därefter jämförde vi testresultaten från 2010 med resultaten från 2017.
Flera lyssnade på nivåer över 85 dB. Det betyder att dessa ungdomar riskerar få ännu sämre
hörsel än de redan har.
De som lyssnade med hög volym hade sämre hörsel än de som lyssnade på lägre volymer.

26
Ethics
In 2010, all study participants were informed and approved that they might be contacted again
for further studies. All 2010-participants had an information letter sent to them about the
study and what moments they needed to participate in. The letter also held an inquiry to
participate. All participants gave their written consent after reading a copy of the information
letter when they arrived.
The questionnaire held no private-invasive questions and participant were free to leave any
question unanswered. Pure tone audiometry gives useful and important information about the
participants hearing and all participants were informed about their test results from an
audiologist. Measurements on PMD´s were made on a physiological doll. No moments
constituted any risks for the participants. All participants were well compensated financially
for their partaking.
Answered questionnaires and test results were coded except gender and age. Code-key does
however still exist.
This is a group of individuals with impaired hearing that we know, from the testing’s in 2010,
and are exposed to loud music volumes. We know that listening to loud music can damage
hearing even if it already is poor. Therefore this study is important.