Embed Size (px)
Citation preview
September 2017
NASA/TM–2017-219663
Guidelines for VCCT-Based Interlaminar Fatigue and Progressive Failure Finite Element Analysis Lyle R. Deobald and Gerald E. Mabson The Boeing Company, Seattle, Washington Steve Engelstad Lockheed Martin Company, Atlanta, Georgia M. Prabhakar Rao and Mark Gurvich United Technologies Research Center, East Hartford, Connecticut Waruna Seneviratne and Shenal Perera National Institute for Aviation Research, Wichita, Kansas T. Kevin O’Brien, Gretchen Murri, James Ratcliffe, and Carlos Davila Langley Research Center, Hampton, Virginia Nelson Carvalho and Ronald Krueger National Institute of Aerospace, Hampton, Virginia
https://ntrs.nasa.gov/search.jsp?R=20170011484 2018-07-17T13:23:09+00:00Z

NASA STI Program . . . in Profile
Since its founding, NASA has been dedicated to the advancement of aeronautics and space science. The NASA scientific and technical information (STI) program plays a key part in helping NASA maintain this important role.
The NASA STI program operates under the auspices of the Agency Chief Information Officer. It collects, organizes, provides for archiving, and disseminates NASA’s STI. The NASA STI program provides access to the NTRS Registered and its public interface, the NASA Technical Reports Server, thus providing one of the largest collections of aeronautical and space science STI in the world. Results are published in both non-NASA channels and by NASA in the NASA STI Report Series, which includes the following report types:
• TECHNICAL PUBLICATION. Reports of
completed research or a major significant phase of research that present the results of NASA Programs and include extensive data or theoretical analysis. Includes compilations of significant scientific and technical data and information deemed to be of continuing reference value. NASA counter-part of peer-reviewed formal professional papers but has less stringent limitations on manuscript length and extent of graphic presentations.
• TECHNICAL MEMORANDUM. Scientific and technical findings that are preliminary or of specialized interest, e.g., quick release reports, working papers, and bibliographies that contain minimal annotation. Does not contain extensive analysis.
• CONTRACTOR REPORT. Scientific and technical findings by NASA-sponsored contractors and grantees.
• CONFERENCE PUBLICATION. Collected papers from scientific and technical conferences, symposia, seminars, or other meetings sponsored or co-sponsored by NASA.
• SPECIAL PUBLICATION. Scientific, technical, or historical information from NASA programs, projects, and missions, often concerned with subjects having substantial public interest.
• TECHNICAL TRANSLATION. English-language translations of foreign scientific and technical material pertinent to NASA’s mission.
Specialized services also include organizing and publishing research results, distributing specialized research announcements and feeds, providing information desk and personal search support, and enabling data exchange services.
For more information about the NASA STI program, see the following:
• Access the NASA STI program home page at
http://www.sti.nasa.gov
• E-mail your question to [email protected]
• Phone the NASA STI Information Desk at 757-864-9658
• Write to: NASA STI Information Desk Mail Stop 148 NASA Langley Research Center Hampton, VA 23681-2199

National Aeronautics and Space Administration Langley Research Center Hampton, Virginia 23681-2199
September 2017
NASA/TM–2017-219663
Guidelines for VCCT-Based Interlaminar Fatigue and Progressive Failure Finite Element Analysis Lyle R. Deobald and Gerald E. Mabson The Boeing Company, Seattle, Washington Steve Engelstad Lockheed Martin Company, Atlanta, Georgia M. Prabhakar Rao and Mark Gurvich United Technologies Research Center, East Hartford, Connecticut Waruna Seneviratne and Shenal Perera National Institute for Aviation Research, Wichita, Kansas T. Kevin O’Brien, Gretchen Murri, James Ratcliffe, and Carlos Davila Langley Research Center, Hampton, Virginia Nelson Carvalho and Ronald Krueger National Institute of Aerospace, Hampton, Virginia

Available from:
NASA STI Program / Mail Stop 148 NASA Langley Research Center
Hampton, VA 23681-2199 Fax: 757-864-6500
The use of trademarks or names of manufacturers in this report is for accurate reporting and does not constitute an official endorsement, either expressed or implied, of such products or manufacturers by the National Aeronautics and Space Administration.

Abstract This document is intended to detail the theoretical basis, equations, references and data that are necessary to enhance the functionality of commercially available Finite Element codes, with the objective of having functionality better suited for the aerospace industry in the area of composite structural analysis. The specific area of focus will be improvements to composite interlaminar fatigue and progressive interlaminar failure. Suggestions are biased towards codes that perform interlaminar Linear Elastic Fracture Mechanics (LEFM) using Virtual Crack Closure Technique (VCCT)-based algorithms [1,2]. All aspects of the science associated with composite interlaminar crack growth are not fully developed and the codes developed to predict this mode of failure must be programmed with sufficient flexibility to accommodate new functional relationships as the science matures.
Nomenclature
B Number of blocks in block spectrum loading
!" Paris Law constant, intercept
!# Paris Law constant, stress ratio corrected; intercept. Mode I only
!## Paris Law constant, stress ratio corrected; intercept. Mode II only Cycle Jump Finite element solution load step from Pmax to Pmin but not a true load cycle
$%/$' Crack growth rate in length per cycle
($%/$')# Crack growth rate in length per cycle, mode I only
($%/$')## Crack growth rate in length per cycle, mode II only
DCB Double Cantilever Beam test for measuring mode I fracture toughness ENF End Notch Flexure test for measuring mode II fracture toughness
ERR Energy Release Rate
*+,-. Fraction of max load Pmax to define the magnitude of each load block i *(%) Factor to account for R-curve effect where /#0 = /#2 ∙ *(%)
/#2 Mode I static initiation fracture toughness
/##2 Mode II static initiation fracture toughness
/###2 Mode III static initiation fracture toughness
/2 Total critical energy release rate (fracture toughness) based on mixed mode law
/#0 Mode I static initiation apparent fracture toughness with R-curve effect
/#4+,- Mode I energy release rate at cyclic maximum load
/##4+,- Mode II energy release rate at cyclic maximum load
/###4+,- Mode III energy release rate at cyclic maximum load
/+,- Total crack tip energy release rate at cyclic maximum load, Pmax
/+.5 Total crack tip energy release rate at cyclic minimum load, Pmin
/65789 Total crack tip energy release rate required to initiate growth from existing flaw
/:; Energy release rate threshold Paris Limit value
/< Total crack tip energy release rate /< = /# + /## + /###
/<? Energy release rate threshold value
Δ/ Difference in maximum and minimum ERR ∆/ = /+,- − /+.5
C# Normalized cyclic energy release rate, Mode I only, where C# = /#4+,-//#2
C## Normalized cyclic energy release rate, Mode II only, where C## = /##4+,-//##2
C### Normalized cyclic energy release rate, Mode III only, where C### = /###4+,-//###2
D+,- Stress intensity factor at maximum fatigue load LEFM Linear Elastic Fracture Mechanics
MMB Mixed Mode Bend test for measuring mixed-mode I & II fracture toughness
E" Power law fit constant for /65789 method
EF Power law fit constant for /65789 method
N Fatigue load cycles
'G Load cycles to accumulate first matrix damage
'H Load cycles to initiation delamination from initial flaw
'I Load cycles to grow delamination
'< Total load cycles
PDA Progressive Damage Analysis
J+.5 Minimum applied load or displacement set in a fatigue load cycle
J+,- Maximum applied load or displacement set in a fatigue load cycle
K Stress ratioK = L+.5/L+,-
K;M2,N Local crack tip stress ratio estimated from K;M2,N = /<4+.5//<4+,-
KOPPN.8Q Externally applied stress ratio estimated from KOPPN.8Q = J+.5/J+,-
R-curve Changing interlaminar toughness with increasing crack length
VCCT Virtual Crack Closure Technique
ΔR Element length in crack growth direction
S Paris Law constant, slope
S# Paris Law constant, slope. Mode I only
S## Paris Law constant, slope. Mode II only
S′ Paris Law constant slope adjusted for stress ratio and mode mix
S′# Paris Law constant slope adjusted for stress ratio. Mode I only
S′## Paris Law constant slope adjusted for stress ratio. Mode II only
U# Paris Law constant to correct intercept for stress ratio. Mode I only
U## Paris Law constant to correct intercept for stress ratio. Mode II only
V# Paris Law constant to correct intercept for stress ratio. Mode I only
V## Paris Law constant to correct intercept for stress ratio. Mode II only
W# Paris Law constant to correct slope for stress ratio. Mode I only
W## Paris Law constant to correct slope for stress ratio. Mode II only
Subcripts
c Critical
I Mode I only II Mode II only
III Mode III only j element index
T Total
Superscripts
i increment number
S Paris Law constant, slope

Introduction
There exists a need in the aerospace industry to efficiently evaluate composite interlaminar crack growth under cyclic loading where loading consists of a complex spectrum of load components. This need is analogous to current analysis methods for metallic structure; however, interlaminar failure must deal with a three-dimensional delamination growth constrained between the plies and subjected to mixed mode interlaminar tension (mode I) and interlaminar shear (mode II) crack tip loading. Interlaminar crack growth is characterized using the DCB (Double Cantilever Beam) coupon for mode I; ENF (End Notch Flexure) test for mode II; and MMB (Mixed-Mode Bending) test for mixed-mode I/II cases (Refs.[3,4,5]). The Composite Materials Handbook-17 (CMH-17) [6] defines three phases of fatigue delamination damage: “...the total cumulative life to failure, NT, may be predicted by summing the lives for the onset of matrix cracking, NM, delamination onset from this matrix crack, ND, and stable delamination growth to a finite acceptable size, NG.” The total cumulative life to delamination failure is calculated in Eq. (1). For this article, “failure” is defined in the broadest terms to indicate a state of damage that exceeds a given design objective to be defined by the using organization. This document concerns only the onset and growth from a flaw, so the number of cycles associated with the matrix damage nucleation, NM, is not addressed at this time.
'< = 'G + 'H + 'I (1)
Many thermoset composites tend to fail in interlaminar modes via brittle fracture. In comparison
to ductile polymers, these materials are expected to be less sensitive to frequency or the path history between minimum and maximum load within the expected operating load spectrum. Consequently, fracture mechanics methods with linear scaling may be used to accommodate complex loading once the fatigue delamination propagation relationships (Paris Laws) have been characterized. The basic Paris Law is a power law function
$%$'
= !" ∙ /+,-X (2)
where da/dN is the increase in delamination length per cycle and Gmax is the maximum energy release rate at the crack front at peak loading. The factors C0 and exponents β were obtained by fitting the curve to the experimental data obtained from fracture tests.
There are three key modifications required for the basic interlaminar Paris Laws characterized by the DCB and ENF tests. These modifications account for
(1) crack growth resistance mechanisms (such as fiber bridging, fiber delving, etc.) in the form of delamination growth resistance curves (R-curves)
(2) stress ratio (e.g., K = L+.5/L+,-)
(3) mode mixity (/##//<)
Post-fatigue residual strength analysis requires interlaminar failure evaluation by robust progressive interlaminar failure algorithms. Code improvements in the following areas will greatly enhance the usefulness of these codes for aerospace structures.
Specific Capabilities Needed
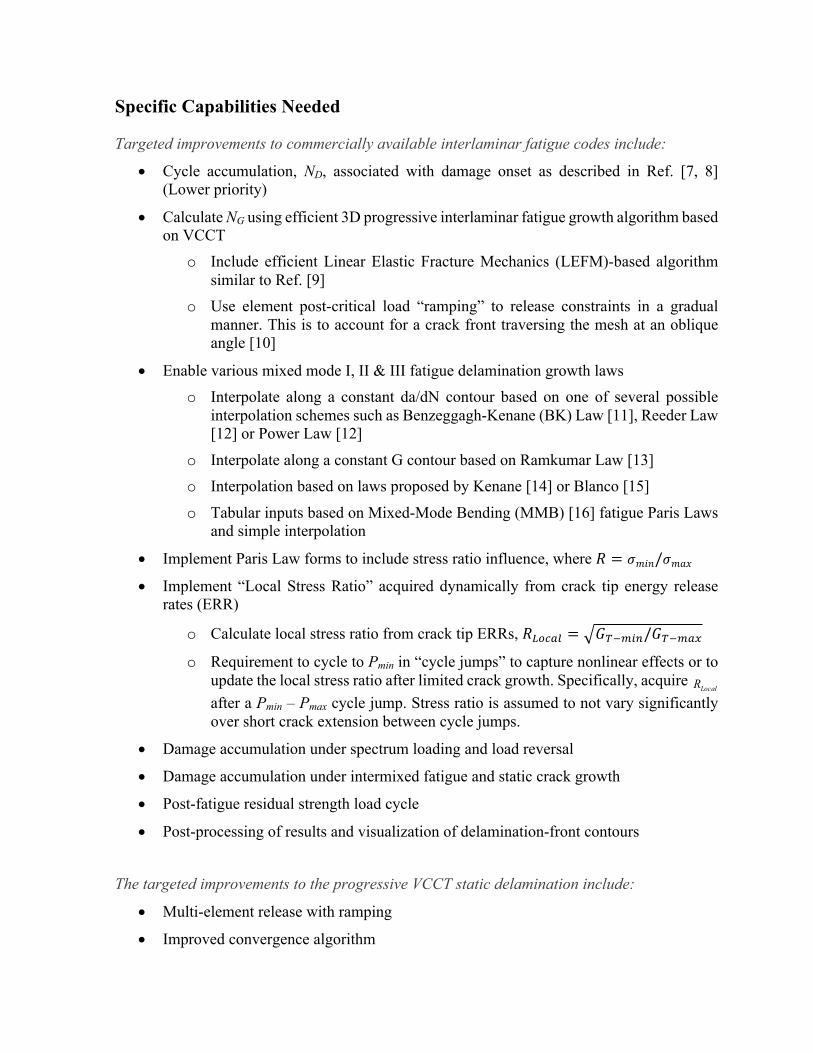
Targeted improvements to commercially available interlaminar fatigue codes include:
• Cycle accumulation, ND, associated with damage onset as described in Ref. [7, 8] (Lower priority)
• Calculate NG using efficient 3D progressive interlaminar fatigue growth algorithm based on VCCT
o Include efficient Linear Elastic Fracture Mechanics (LEFM)-based algorithm similar to Ref. [9]
o Use element post-critical load “ramping” to release constraints in a gradual manner. This is to account for a crack front traversing the mesh at an oblique angle [10]
• Enable various mixed mode I, II & III fatigue delamination growth laws o Interpolate along a constant da/dN contour based on one of several possible
interpolation schemes such as Benzeggagh-Kenane (BK) Law [11], Reeder Law [12] or Power Law [12]
o Interpolate along a constant G contour based on Ramkumar Law [13] o Interpolation based on laws proposed by Kenane [14] or Blanco [15]
o Tabular inputs based on Mixed-Mode Bending (MMB) [16] fatigue Paris Laws and simple interpolation
• Implement Paris Law forms to include stress ratio influence, where K = LEZ[/LE%R
• Implement “Local Stress Ratio” acquired dynamically from crack tip energy release rates (ERR)
o Calculate local stress ratio from crack tip ERRs, K;M2,N = /<4+.5//<4+,-
o Requirement to cycle to Pmin in “cycle jumps” to capture nonlinear effects or to update the local stress ratio after limited crack growth. Specifically, acquire
LocalR after a Pmin – Pmax cycle jump. Stress ratio is assumed to not vary significantly over short crack extension between cycle jumps.
• Damage accumulation under spectrum loading and load reversal
• Damage accumulation under intermixed fatigue and static crack growth
• Post-fatigue residual strength load cycle
• Post-processing of results and visualization of delamination-front contours The targeted improvements to the progressive VCCT static delamination include:
• Multi-element release with ramping
• Improved convergence algorithm

Potential future enhancements that may be considered include:
• Static and Fatigue Pristine Initiation (Calculation of NM defined previously)
• Static Crack Migration
• Fatigue Crack Migration
• Tri-linear strain softening law for simulating R-curve effects in static progressive analysis
• Maintain compatibility for use for simulating in-plane damage and, specifically, interactions between in-plane cracks and delaminations
The following three major sections address the theoretical background for suggested code
improvements in the areas of fatigue delamination onset, fatigue delamination growth, and residual static (delamination) strength prediction. A fourth major section then provides a brief overview of potential future enhancements.
Suggested Approach for Onset of Delamination Growth from a Singularity (discontinuity, matrix crack, existing delamination)
This section addresses the cycles, ND, which are associated with the onset of delamination growth from a discontinuity, matrix crack, or existing delamination and are calculated following the procedures in Refs. [7,8 ]. The user should have the option to count cycles associated with damage onset, ND. However, the user should not be required to activate the algorithm. The damage onset cycles may be calculated for each constrained node pair along the crack front. Nodes along the initial crack front will have an accumulated total life associated with damage onset prior to entering into the crack growth phase. Damage onset calculations will be locked out once progressive fatigue delamination commences. A typical mode I R = 0.1 GOnset curve is shown in Figure 1. Such a curve can also be non-dimensionalized by GIC. A progressive Damage Analysis (PDA) code would need to accept m0 and m1 for each material, fracture mode, environment, and (potentially) a range of stress ratios R. One would anticipate that a curve similar to Figure 1 may be generated for mode II shear crack tip loading. The onset curves are fit as a power law to delamination onset data generated from a series of constant amplitude loads. The curves may be adjusted based on stress ratio or mode mix. Adjustments for mode mix and stress ratios for the progressive fatigue growth algorithm are discussed later in this document. Similar relationships may be derived for growth onset calculations.

Figure 1: \]^_`a curve from [7, 8]
This section on delamination onset cycle counting is placed here based on the order of occurrence in an actual problem. However, the next section on progressive fatigue crack growth prediction, NG, would be expected to be a more significant contributor to the damage life and would be a higher priority over counting cycles to delamination onset, ND. Additionally, establishing the progressive growth first, would aid in adding the onset cycles to the simulation in a second phase.
Suggested Approach for Prediction of Interlaminar Fatigue Delamination Growth
This section outlines suggested guidelines for progressive interlaminar fatigue crack growth life, NG. The discussion is separated into subsections covering a 3D progressive fatigue algorithm, various forms of the Paris Law, Paris Law limits/thresholds, mixed-mode interpolation schemes, definition of a local/dynamic R-ratio, block spectrum algorithms, load reversal and negative stress ratio, and fatigue damage visualization.

Suggested 3D Progressive Fatigue Algorithm
The remainder of the specifications with respect to fatigue focuses on damage growth from the crack tip, based on LEFM and Paris Law data. One example is the VCCT-based progressive interlaminar fatigue analysis that was published in Ref. [9]. The analysis assumed crack growth in a brittle composite matrix calculated based on Paris law and stress ratio, R > 0. The algorithm took advantage of the brittle fracture characteristics of thermoset composites, and assumed that damage accumulation depends only on the maximum and minimum crack tip Energy Release Rates (ERRs). Crack growth was assumed to be independent of path between minimum and maximum load states and the case of load reversal was not considered. The simple algorithm of Figure 2 was implemented in a User Element (UEL) in the ABAQUSTM finite element code and was based on VCCT calculated energy release rates [10]. The “element” consisted of a center pair of nodes connected by a spring with a very high stiffness (essentially constrained). A series of unconstrained node pairs around the perimeter would sense an approaching crack front and would be used to calculate the crack opening displacement used in a VCCT calculation of energy release rate. Once the crack is calculated to grow across the element length, then the constrained node pair is released.
VCCT calculations may be accomplished in other ways based on constrained node pairs, and the remainder of this document refers only to the “constrained nodes” with the understanding that other implementations may calculate energy release rates and release constraints in an analogous manner. In the algorithm of Ref. [9], the load step is ramped up to the applied maximum fatigue load and the load is held constant as the fatigue delamination is allowed to grow in the model, as shown in Figure 3. The crack tip energy release rate, Gmax, and a crack growth rate, $%/$', are calculated for each node pair along the crack front based on a simple Paris Law, $%/$' = !" ∙/+,-X . Given the element length, ∆R, and crack growth rate, the number of cycles required to
separate a constrained node pair may be calculated, assuming self-similarity and constant mode mix during delamination extension. In one time-step increment, the algorithm will determine the minimum number of cycles, '+.5, to fail the most critical constrained node pair. The node pair with the fewest cycles to failure is released and all other nodes along the crack front accumulate damage based on the '+.5cycles in the current increment, $%,22b+_d. = $%,22b+_d
.4F + '+.5. ∙
$%/$' d. The cycle is repeated in the next time increment, where damage accumulated in prior time increments is accounted for in the calculation of '+.5 for the current increment. At least one node pair is released per time increment while holding the load constant at J+,-.

%<6_eO#; d
.= ∆Rd − $%,22b+_d
.4F
Figure 2: Paris Law linear fracture algorithm based on VCCT from [9].

Figure 3: Ramp load to Pmax to acquire Gmax for Paris Law crack growth rate calculation [9].
The original code in Ref. [9] had several limitations. This algorithm was developed only for 2D crack growth and was not configured to account for mode mix. The code used an a priori stress ratio entered as an input value, and did not determine stress ratio from the crack tip energy release rates. Node pairs that had accumulated partial fatigue damage did not account for the damage as a change in spring stiffness until a sufficient number of cycles had been counted to fully release the constraining spring.
Finite element code software vendors may offer a static VCCT interlaminar crack growth capability with both instantaneous release and “ramping” release after the crack tip reaches its critical energy release rate. Although the instantaneous release may be computationally efficient, a 3D crack front traversing a mesh at an angle will create a multitude of “corner nodes” as shown in Figure 4(A). Calculations at these corner nodes will result in a high energy release rate and the crack front may advance at artificially low load levels. Reference [17] shows how VCCT with instantaneous release may lead to artificially low predicted loads. However, the simulation may be improved if the “ramping” feature depicted in Figure 4(B) is implemented. During “ramping”, the post-critical load of the constrained node pair (or contact algorithm) follows an unloading curve encompassing the area determined by the energy release rate, G, as shown in Figure 4(C). This “ramping” is important for more precise crack growth predictions. Compared to the static crack growth prediction, those based on Paris Law have shown to be significantly more sensitive to variations in computed energy release rates. Therefore, a preferable implementation of a 3D fatigue delamination capability would incorporate a post-release unloading curve. Additionally, energy release rate calculations may be needed at intermediate crack tip locations between nodes.
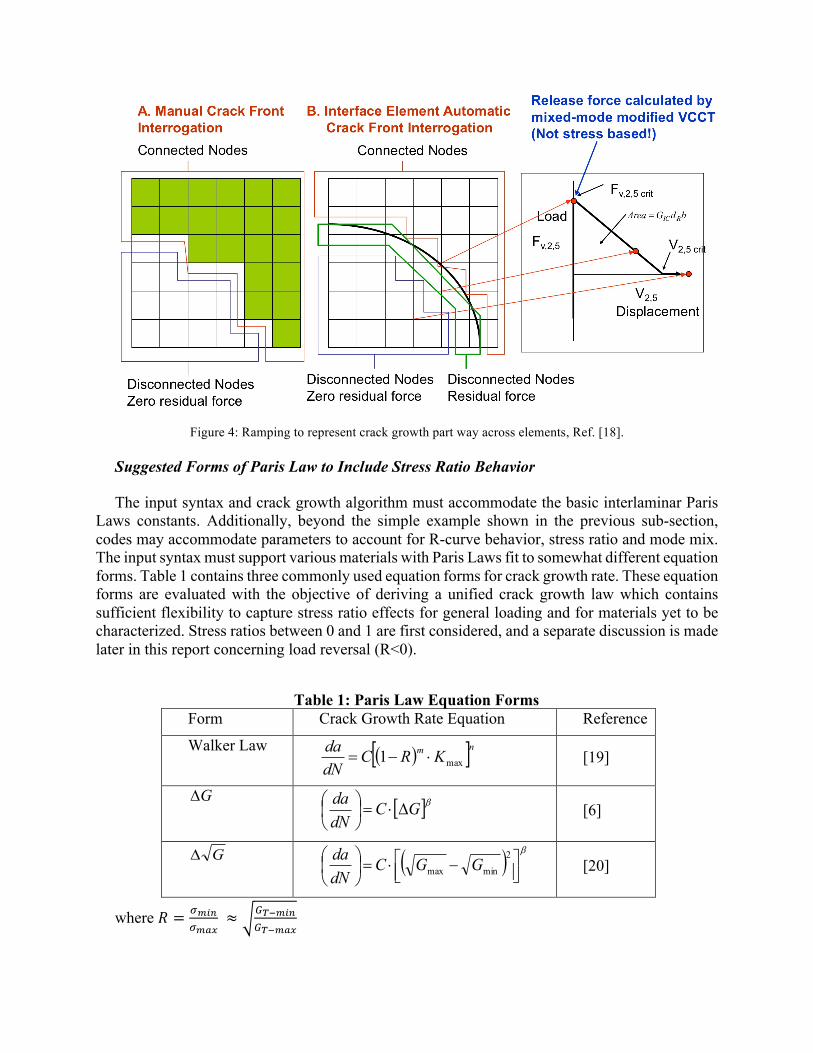
Figure 4: Ramping to represent crack growth part way across elements, Ref. [18].
Suggested Forms of Paris Law to Include Stress Ratio Behavior
The input syntax and crack growth algorithm must accommodate the basic interlaminar Paris Laws constants. Additionally, beyond the simple example shown in the previous sub-section, codes may accommodate parameters to account for R-curve behavior, stress ratio and mode mix. The input syntax must support various materials with Paris Laws fit to somewhat different equation forms. Table 1 contains three commonly used equation forms for crack growth rate. These equation forms are evaluated with the objective of deriving a unified crack growth law which contains sufficient flexibility to capture stress ratio effects for general loading and for materials yet to be characterized. Stress ratios between 0 and 1 are first considered, and a separate discussion is made later in this report concerning load reversal (R<0).
Table 1: Paris Law Equation Forms
Form Crack Growth Rate Equation Reference
Walker Law ( )[ ]nm KRCdNda
max1 ×-=
[19]
GD
[ ]bGCdNda
D×=÷øö
çèæ
[6]
GD ( ) b
úûù
êëé -×=÷
øö
çèæ 2
minmax GGCdNda
[20]
where K = fghi
fgjk≈ Imnghi
Imngjk

The Walker Law was derived for fatigue crack growth in aluminum panels. The equation accounts for the dependence of the crack growth rate, $%/$', on the stress ratio,K = L+.5/L+,-. Its development is detailed in Ref. [19]. The equation was originally presented in terms of maximum stress intensity factor, Kmax, and is converted to energy release rate here for the application to interlaminar fracture [21]. Subscripts “I” and “II” are added to account for mode I and II interlaminar crack growth. Mode III is assumed to be equal to mode II, for now, until significant data is available for mode III fatigue [12]. The mode I and II crack growth rates (Paris Law) are characterized with the DCB and ENF fatigue tests, respectively. Paris Law constants, !# and !##, result from the conversion of Walker Law from the stress intensity factor to energy release rate.
( )[ ]
( )[ ]
max
min
max
max
1
1
-
-
-
-
=
===
×-×=÷øö
çèæ
×-×=÷øö
çèæ
T
T
IIIIIIIIIIIIIII
IIIIII
III
GGR
CC
GRCdNda
GRCdNda
IIII
II
ggbb
bg
bg
(3)
A convenient form of the Paris Law is found by normalizing the maximum energy release rate
by the initiation fracture toughness, ICG or IICG as discussed in Ref. [22]. The lower case “g” is introduced to represent the normalized form of the energy release rate, where CGGg /max= and
10 << g . Hence, the Paris Law in its simplest form, with slope and intercept modified by stress ratio and R-curve effects, is given as Equation (4).
( )( ) ( )r
bgµ
b
bb RafRCC
gCdNda
-×=¢úúû
ù
êêë
é -×=
×=÷øö
çèæ
¢
¢
11'
'
(4)
Units of C’ = length / cycle, β’ is non-dimensional
Accordingly, the Walker Law can be written in normalized form:

( )[ ]
( )[ ]( ) ( ) III
IIII
II
IICIIIIICII
IIIIII
III
GCCGCC
gRCdNda
gRCdNda
bb
bg
bg
×=×=
×-×=÷øö
çèæ
×-×=÷øö
çèæ
1
1
(5)
The other two forms of Paris Law in Table 1 are converted to forms that include the maximum
energy release rate, Gmax, during cyclic loading.
∆Gform:$%$'
= ! ∙ 1 − Kw ∙ /+,- X(6)
∆ /form:$%$'
= ! ∙ 1 − K w ∙ /+,- X(7)
The three Paris Law forms are captured by factors on /+,- of 1 − K z, 1 − Kw , and 1 − K w, corresponding to the Walker Law, the ∆/ form and the ∆ / form, respectively. The
following form of the Paris Law will capture all three:
( )[ ]bgµ gRCdNda
×-×=÷øö
çèæ 1 (8)
The three forms represented by Eq. (8) all assume the slope of the Paris Law is unchanged. This may be true for the class of thermoset composites where data exists in the literature. However, for other materials, the slope may change as a function of stress ratio. The following equation forms will add some flexibility in fitting data where the slope varies with stress ratio.
( )[ ] ( )rbgµR
gRCdNda -×
×-×=÷øö
çèæ 1
1 or ( )[ ] ( )rbgµR
gRCdNda -×
×-×=÷øö
çèæ 1
1 (9)
The document will proceed with the slope modified by S′ = S ∙ 1 − K { and subscripts are added to represent mode I and II crack tip loading.
( )[ ] ( )
( )[ ] ( ) IIIIIIII
IIII
R
IIII
R
II
gRCdNda
gRCdNda
r
r
bgµ
bgµ
-×
-×
×-×=÷øö
çèæ
×-×=÷øö
çèæ
1
1
1
1 (10)
Implementation of the mixed mode functionality given in Equation (10) would provide a great early benefit to industry.
Forms of Paris Law to Include R-curve Behavior
The application of a Paris Law normalized by static initiation fracture toughness may yield crack growth rates that are higher than crack growth observed in tests, since the normalized Paris

law will not account for mechanisms that retard crack growth, such as fiber bridging, fiber delving, etc. R-curve effects can be eliminated from the Paris Law by either dividing DCB crack growth rate data by the static R-curve (resistance curve), or by limiting crack growth to lengths which are mostly void of R-curve influence. Equation (10) may be modified to account for delamination growth resistance mechanisms that will retard crack growth as a function of increasing crack length as discussed in Ref. [23]. R-curve effects are accounted for by normalizing G using the static resistance curve,/#0 = /#| ∙ *(%). R-curve effects lead to an observed decrease in Paris law crack growth rates for typical co-cured interfaces. R-curve effects are dependent on the cyclic load levels under which these crack growth resistance effects are measured. Typically, R-curve effects are smaller under cyclic load levels compared to those measured under static crack growth conditions, as discussed in Refs. [24,25]. Consequently, normalization with the static R-curve, as in Equation (11), is approximate. Equation (11) is mathematically simple. However, programming a PDA code to spatially adjust the R-curve, *(%), as a function of lineal length from an arbitrary 3D crack front may be challenging. This functionality may be a point of future interest.
( ) ( )[ ]( )
( ) ( ) 0.101
1
=>×=
×-×=÷øö
çèæ
fafafGG
afgRCdNda
ICIR
III
IIbg
(11)
Suggested Threshold and Paris Limit Inputs
Fatigue crack growth rate curves are defined in three regions; region I is the regime where the crack growth rate transitions from the (notional) no-growth threshold, GTH, to the linear Paris Law regime; region II is the linear Paris Law region and region III is the high growth rate region where the crack growth rate transitions from the upper Paris Limit, GPL, to quasi-static crack growth. This section describes the expected code behavior approaching the threshold of growth, GTH, and above the upper Paris Limit, GPL. The Paris Limit, GPL, marks the end of the linear Paris Law and is where crack growth transitions from subcritical crack growth under cyclic loading to quasi-static crack growth. The threshold of growth, GTH, marks the point at which the crack grows so slowly as to not be of practical engineering interest and resides below the end of the linear zone of the Paris Law. Two options are proposed for behavior in regions I and III, however an assessment of the accuracy of the choice of transition is not made. As before, the threshold and Paris limit are non-dimensionalized. Figure 5 defines GTH and GPL.
10 <<<
==
PLTH
C
PLPL
C
THTH
ggGGg
GGg
(12)

Studies have shown the threshold of growth to be influenced by the stress ratio, as discussed in Ref. [20]. One practical approach to account for the threshold is to use Equation (4) and adjust the terms. For example, if the mode I threshold is measured in a DCB test at a stress ratio of R ~ 0, then an estimated threshold is calculated for R ≠ 0 based on an equivalent crack growth rate.
( ) ( )gµ
bb
r
Rgg
gCgCdNda
RRThRTh
RThRRThRTH
RR
-=
×¢=×¢=÷øö
çèæ
-=¹
¢¹¹
¢==
¹=
111)0()0(
)0(0)0(000
(13)
Figure 5: Simple Paris Law with GTH and GPL defined.
The code may offer options on behavior in the transition regions. The behavior in the transition zones may follow no transition, a simple transition behavior or an advanced transition behavior, as defined in the following.
Option 1: No Transition: This suggested approach ignores the threshold and Paris Limit
behavior altogether. The crack growth rate follows the Paris Law equation except for the condition where the energy release rates reach the critical value for static crack growth. Many practical problems may not be greatly controlled by crack growth at the low and high fatigue crack growth regimes. No inputs are required for gTH and gPL.

Option 2: Simple transition: This suggested approach will calculate no growth for ERRs
below gTH and static release for ERRs greater than gPL.
If THgg < , then minNN D=D of lead node pair and 0=Da
If PLgg > , then 1=DN and xa D=D (one element length).
Option 3: Advanced transition: The Paris Law is modified with the factor from Ref. [23]
[(1 − (/<?//+,-)H~)/(1 − (/+,-//|)H�)]where D1 and D2 are fit constants. See Figure 6. The non-dimensional form is [(1 − (C<?/C+,-)H~)/(1 − (C+,-/C|)H�)]. Option 3 is not typically employed in fatigue crack growth analysis and may be a future enhancement if there is a demonstrated need for accurate characterization in the transition regions.
Figure 6: Full-fatigue delamination characterization plot with region I and III transitions [23].
Data from Ref. [7] suggests that thermoset composite laminates may not reach a true “no-growth” threshold and use of a GTH in analysis is provided as an engineering convenience for use with materials that appear to approach a threshold behavior.
Suggested Mixed Mode I, II Paris Law Inputs with Interpolation Schemes
Typically, interlaminar crack growth data is acquired under pure mode I and mode II loading using the DCB and ENF test methods, respectively. Optionally, MMB testing may be performed to evaluate crack growth under mixed mode loading at discrete mode mix conditions. This section considers algorithms to interpolate crack growth rates at mode mix intervals that lie between the mode mix ratios at which testing was completed. Following the de facto process for static crack
For composite materials, delamination growth has typically been related to the cyclic strain energy release rate, G. In ref. 4 and 5, delamination growth onset data from edge-delamination (EDT) and end-notched flexure (ENF) tests were used to generate threshold curves, below which delamination would not initiate. A minimum threshold for no-delamination-growth was assumed to exist at a loading level for which there was no delamination growth at 1 million cycles.
Delamination growth in a constant-amplitude displacement-controlled DCB test yields decreasing GImax values. Therefore, delamination growth from onset to arrest can be considered to have 3 phases, as shown in Fig. 2: a region of rapid growth at high (but sub-critical) values of G, a linear growth region, and a slow growth region where the delamination approaches an arrest point, or apparent threshold, below which delamination will not grow. A full-fatigue characterization equation of the form shown on Fig. 2 has been proposed [4-7] to express the complete delamination growth behavior in terms of the maximum cyclic G-value, GImax; the threshold value at delamination arrest, GIth; and the static fracture toughness, GIc. The equation of the linear portion of this curve is known as the Paris Law, da/dN=A(GImax)B, and is typically used to characterize stable delamination growth.
Figure 2. Full-fatigue delamination characterization plot.
Because the DCB specimen is unidirectional, some nesting of fibers between
adjacent plies can occur, resulting in fiber-bridging at the delaminating interface. As a delamination grows, the fiber-bridging acts to resist the delamination, causing an artificial increase in the measured toughness [5-9], which will affect the resulting Paris Law. However, this fiber-bridging is not a material property, but an artifact of the unidirectional specimen. In actual structures, delaminations typically grow between plies of dissimilar orientation and fiber-bridging does not occur. Therefore, in order to be useful in structural modeling, expressions relating the delamination growth rate and strain energy release rate must be corrected for the
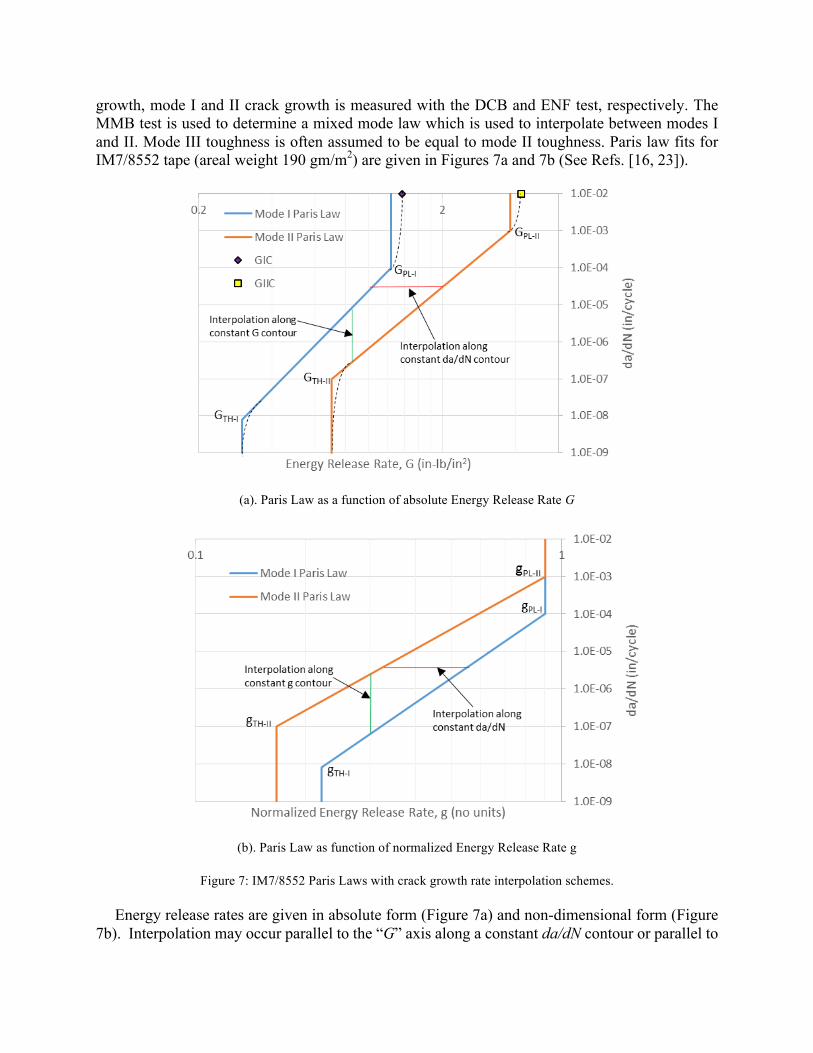
growth, mode I and II crack growth is measured with the DCB and ENF test, respectively. The MMB test is used to determine a mixed mode law which is used to interpolate between modes I and II. Mode III toughness is often assumed to be equal to mode II toughness. Paris law fits for IM7/8552 tape (areal weight 190 gm/m2) are given in Figures 7a and 7b (See Refs. [16, 23]).
(a). Paris Law as a function of absolute Energy Release Rate G
(b). Paris Law as function of normalized Energy Release Rate g
Figure 7: IM7/8552 Paris Laws with crack growth rate interpolation schemes.
Energy release rates are given in absolute form (Figure 7a) and non-dimensional form (Figure 7b). Interpolation may occur parallel to the “G” axis along a constant da/dN contour or parallel to

the “da/dN” axis along a constant G contour. Interpolation may be between the pure mode Paris Laws curves or using intermediate Paris Laws curves from the MMB test. Figure 7a and 7b highlight the various options for interpolation. Crack growth thresholds and Paris Limits are included.
Interpolation along constant G line using the Ramkumar Law [13] is given in Equation (14). Each mode I, II, III crack growth rate equation is of the Paris Law form given in Equation (4).
( ) ( ) ( ) IIIIIIIIIIIIIIIIII gCgCgC
dNda ''' ''' bbb ++= (14)
This interpolation scheme assumes the accumulated damage in each mode is additive in the mixed mode condition. Although this equation is easy to use, it has not been supported by significant data. The two interpolation schemes along a constant da/dN contour, given as Eqs. (15) and (16), make the assumption that the mode mix law demonstrated under static growth translates to fatigue growth, thereby avoiding the requirement to perform separate MMB fatigue testing. These mode mix interpolation schemes have not been proven by significant data. A challenge with interpolation schemes along a constant da/dN is that da/dN may not be calculated explicitly. One approximate method is to forward calculate GC-fat for the target mode mix at two different da/dN values. Given two points, a new linear (approximate) mixed-mode Paris Law may be calculated.
Interpolation along constant da/dN using Power Law: Solve for da/dN when gT = 1:
( ) ( ) ( )
IIIIII
p
III
o
II
n
IT
pIII
oII
nI
fatC
TT
dNda
CdNda
CdNda
Cg
gggGGg
'''
max
'1
'1
'1 bbb
÷÷ø
öççè
æ×+÷÷
ø
öççè
æ×+÷÷
ø
öççè
æ×=
++==-
-
(15)
Interpolation along constant da/dN using BK Law: Solve for da/dN when gT = 1:
( )
hbbb
h
÷÷ø
öççè
æ×÷÷÷
ø
ö
ççç
è
æ
÷÷ø
öççè
æ×-÷÷
ø
öççè
æ×+÷÷
ø
öççè
æ×
==
÷÷ø
öççè
æ×-+=
-
-
-
-
-
-
-----
max
max'1
'1
'1
maxmax
max
max
'1
'1
'1
T
II
IIII
T
fatC
TT
T
IIParisIParisIIParisIfatC
GG
dNda
CdNda
CdNda
C
GGGg
GGGGGG
IIII
(16)
Following the two-point linear-fit process described above, both constant da/dN methods may result in a mixed-mode Paris Law.
( ) MMTMM gC
dNda b×= (17)
Two additional mode mix laws that have been studied are discussed in Refs. [14, 15].

From Kenane & Benzeggagh [14]:
( )
( ) ( ) ( )( )
( )d
T
IIIIIIMM
b
T
IIIIIIIMM
tMM
GG
GGCCCC
GCdNda MM
÷÷ø
öççè
æ×-+=
úúû
ù
êêë
é÷÷ø
öççè
æ-×-+=
D×=
-
-
-
-
-
max
max
max
max
max
1lnlnlnexp
bbbb
b
(18)
From Blanco et al [15]:
( )
( ) ( ) ( )
( )2
max
max
max
max
2
max
max
max
max
max
loglogloglog
÷÷ø
öççè
æ×--+÷÷
ø
öççè
æ×+=
÷÷ø
öççè
æ×÷÷ø
öççè
æ×
+÷÷ø
öççè
æ×+=
D×=
-
-
-
-
-
-
-
-
-
T
IImIII
T
IImIMM
T
II
mI
II
T
IImIMM
tMM
GG
GG
GG
CCC
GGCCC
GCdNda MM
bbbbbb
b
(19)
Parameters mC and mb are additional fit parameters to be fit to MMB fatigue data.
The advantage of equation (19) is that it does not assume monotonic behavior as a function of crack growth rate and may capture the unexpected mode mix behavior seen in Refs.15 and 16.
Tabular Input: Another interpolation method requires measuring mixed-mode Paris Laws at various mode mix
ratios [16] and performing a simple linear interpolation of MMC and MMb .
( )( ) ( ) ( ) 0.1,8.0,6.0,4.0,2.0,0max =÷÷
ø
öççè
æ×=÷
øö
çèæ
-T
IITGG
GG GGGC
dNda
TGIIG
TII
TII
b (20)
Suggested Approach for Local Stress Ratio Acquired Dynamically by Simulation
The energy release rate G computed at a local stress ratio, K;M2,N = /<4+.5//<4+,-always has to be compared to a Paris Law obtained for the same stress ratio in order to obtain the appropriate growth rate da/dN. The analysis load step, however, is dependent on the applied (external) stress ratio, RApplied, which may or may not be equal to the local stress ratio, RLocal. Negative (local) stress ratios will be discussed in the next section.
The most straightforward coding option for mixed mode Paris Law inputs is to not provide a stress ratio adjustment (i.e., RLocal = 0). In this scenario, the analyst will verify that the stress ratio
for the mode I and II input Paris Laws is consistent with the simulation over the full crack growth range, or the user will make appropriate adjustments to the Paris Law constants external to the simulation (See Equation (4)).
The second option is for the stress ratio to be calculated from the applied load and the assumption is made that the crack tip stress ratio trends with the applied stress ratio (RLocal = RApplied). The user will be required to confirm the compatibility of Paris Law constants in case the applied load results in a negative stress ratio. The code will require a method to identify the specific load component to define the stress ratio.
The calculation of a local stress ratio was discussed previously (see Eq. 3) and should be made as the third option in the analysis setup. This feature may be important for problems where residual stress is important and the base (unloaded) state of the model is changing during the simulation (RLocal ¹ RApplied). This option is likely a higher priority than option 1 or 2. In summary:
• Option 1: No stress ratio adjustment or the stress ratio behavior is implied in the Paris Law constants.
• Option 2: Stress ratio is calculated based on an external load component
• Option 3: Stress ratio is calculated from the total ERRs
Suggested Approach for Spectrum Effects
Various methods are cited in the literature to account for load spectrum effects in metal fatigue. Cyclic loading damage phenomena such as crack tip blunting due to plasticity, hysteresis due to viscoelastic effects or other nonlinearities are assumed to not contribute to damage growth for interlaminar fatigue. Neglecting these nonlinear effects does not constitute a statement that such mechanisms are not active in all composite fatigue, only that the science and data is immature in this regard. Users of the code will need to assess the behavior of their material in question and ascertain if the LEFM methods proposed here are sufficiently applicable to their material.
The influence of load spectrum on interlaminar crack growth is easily accounted for via the block spectrum loading damage accumulation algorithm cited in Ref. 26. This method is compatible with the energy release rate Paris Law methods that have become the norm for composite interlaminar crack growth. Simply stated, the total damage is the sum of the damage from multiple constant amplitude load blocks. No discussion is made here concerning the method by which the block spectrum is derived from the true spectrum. The crack is assumed to not grow an appreciable length through execution of the entire spectrum. The following discussion pertains to damage accumulation for interlaminar failure. The Paris Law given in the development is based on the mixed mode crack growth after adjustments have been made for stress ratio and R-curve. Each applied load will be in terms of maximum applied load, Pmax, and the corresponding minimum load, Pmin, for N cycles over B number of blocks. The model is initially loaded to Pmin and then to Pmax to acquire crack tip energy release rates, C+.5 and C+,-, respectively.
úû
ùêë
é= ---
IIIC
III
IIC
II
IC
I
GG
GG
GGg minminmin
min ,, úû
ùêë
é= ---
IIIC
III
IIC
II
IC
I
GG
GG
GGg maxmaxmax
max ,, (21)
A convenient input syntax defines the individual blocks i as fractions *+,-. , *+.5. of the applied

load, Pmax [26]:
*+.5F , *+,-F , 'F⋮
*+.5. , *+,-. , '.
*+.5.ÉF, *+,-.ÉF , '.ÉF
⋮*+.5Ñ , *+,-Ñ , 'Ñ
(22)
Block spectrum damage accumulation methods assume that the material has negligible load-history effects. Load history effects would need to be characterized experimentally to evaluate the accuracy of the proposed approach.
As the model is loaded from Pmin to Pmax, and during every “cycle jump” from Pmax to Pmin and back to Pmax, the energy release rate for each constrained node pair is acquired for every Ö+.5. and Ö+,-. in the load cycle.
maxmaxmax
maxminmin
PfpPfp
ii
ii
×=
×= (23)
Ideally, the fatigue load step is configured such that min(Ö+.5. ) = J+.5 and max(Öäãå. ) =
J+,- where all other Ö+.5. , Ö+,-. in the block fall between Pmin and Pmax. The VCCT calculation provides the energy release rates:
[ ][ ]i
IIIiII
iI
iVCCT
i
iIII
iII
iI
iVCCT
i
ggggp
ggggp
maxmaxmaxmaxmax
minminminminmin
---
---
=Þ
=Þ (24)
For each block, the stress ratio, which is assumed to be constant during crack growth and updated at the next cycle jump, is calculated. As before, the user will have the option to calculate the stress ratio based on the applied load, K. = *+.5/*+,-, or based on the local stress ratio (Eq. (24)).
iIII
iII
iI
iIII
iII
iI
iT
iT
Locali GGGGGG
GG
Rmaxmaxmax
minminmin
max
min
---
---
-
-- ++
++== (25)
The stress ratio and energy release rates are used to calculate the mixed mode Paris Law for each load block. Because the mode mix and stress ratio may change with each block, the mixed mode Paris Law constants, !GG
(.) and SGG(.) , are calculated uniquely for each block. The average
crack growth rate is calculated and is subsequently used in the algorithm of Figure 2 to calculate the accumulated damage at each node pair along the crack front.
( ) )()()(
iMMi
TiMM
i
gCdNda b
×=÷øö
çèæ (26)

å
å
=
=÷øö
çèæ×
=÷øö
çèæ
B
ii
B
i ii
AVE N
dNdaN
dNda
1
1 (27)
Suggested Approach for Load Reversals
Metal fatigue is influenced greatly by the plastic zone around the crack tip and load reversal must be characterized by testing at a negative stress ratio. An analogous phenomena may occur in composite interlaminar fatigue. The analysis framework proposed here offers two mechanisms to account for load reversal:
1. Provide Paris Law exponents compatible with the negative stress ratio to calculate the corresponding crack growth rate
2. Treat the load reversal as a separate block loading and ignore loading history effects. In this scenario, load reversal at the crack tip will cause the shear (mode II and III) to reverse sign, however the mode I contribution will truncate at the zero load level as the sublaminate faces come in contact.
A practical means to account for load reversal in a mixed mode problem is to divide the problem into a two-step block where tension will have mode I, II and III crack tip loading, and compression may have only modes II and III. Users will need to be aware that contact, preload or other nonlinearities may cause the zero energy release rate state to not coincide with the zero applied load. Currently, there is insufficient data for delamination growth under mode II conditions which allows a correlation of growth rates obtained from a fully reversed loading (R=-1) cycle with growth rates obtained from two cycles of a positive stress ratio (R>0). One may expect the mode I contribution to be the most significant part of the tension term of the growth rate expressed in Eq. (28). This is another area where the science may be immature and significant test-to-analysis correlation may be required to mature any code that accounts for stress ratio effects under reverse loading.
nCompressioTensionAVE dNda
dNda
dNda
÷øö
çèæ+÷
øö
çèæ=÷
øö
çèæ (28)
Suggested Approach for Intermittent Static Growth, Pre-load and Residual Strength Load Cycle
One would anticipate that a code could be configured to allow a progressive fatigue step to be interspersed with other static or fatigue load steps. Figure 8 shows one plausible loading scheme where a structure is preloaded statically (without damage growth), subjected to cyclic loading with fatigue damage growth, and subsequently evaluated in its post-fatigue damage state for residual static strength, at least for the delamination failure mode. The static preload will set the initial condition for the fatigue loading and the (minimum) crack tip energy release rates are recorded. Upon entering the fatigue step, the model is loaded to the maximum load. As describe previously,

the maximum load may encompass a spectrum of loads, however the discussion will continue as if the structure is under constant amplitude cyclic loading. The discussion refers to singular applied loads, Pmin and Pmax, but these terms refer to a general set of loads and displacements applied to a structure at a “minimum” and “maximum” load condition. A stress ratio is calculated from the energy release rates at the maximum and minimum loads and is used in the crack growth rate calculations. The assumption is being made that the stress ratio does not change significantly over short lengths of growth. The maximum energy release rate and mode mix would be continually updated as the damage grows. In order to account for a changing stress ratio as damage grows, the minimum energy release rates are to be updated after each “cycle jump” back down to the minimum applied load. The cycle jump does not correspond to a physical load cycle, but is included to update the stress ratio to be used in the crack growth rate calculations. A simulation that is configured to run based on a predetermined stress ratio will not require a cycle jump and the user must confirm that the linear scaling assumptions are not violated by any non-linear behavior. In Figure 8, the minimum energy release rates gmin(1), gmin(2) and gmin(3), are different values which are used to update the stress ratios, R(1), R(2) and R(3),. The number of cycles for every cycle jump may be predetermined or triggered based on some criteria. Progressive fatigue is expected to terminate after reaching the target life of the structure.
A key question to answer is: Will the structure still meet its ultimate design loads after fatigue cycling for a full life of the structure (or inspection interval)? A final load step could be applied to simulate the target ultimate load with fatigue damage accumulated in the cyclic load step, e.g., to determine the residual static strength. An efficient progressive quasi-static interlaminar crack growth algorithm is important for accomplishing this analysis. Suggested capability is discussed in the following sections.
Figure 8: Possible loading scheme mixing fatigue and static damage growth.

The simple algorithm suggested in Figure 8 implies that the most critical energy release rate coincides with the maximum load, Pmax. Likewise, gmin is assumed to coincide with Pmin. A structure subjected to complex loading with contact and residual forces, however, may not have gmax coincident with Pmax and gmin coincident with Pmin. Additionally, the user may wish to analyze an array of loads for which the magnitude of certain loads is increasing while others are decreasing. Implementation of a complex algorithm to determine the applied load states corresponding to gmax and gmin may be too complex in the initial publication of a code capable of spectrum effects. A practical alternative is to interrogate values of gmin and gmax on the load ramping from Pmin to Pmax and report a warning to the user if the value of gmax does not coincide with Pmax or the value of gmin does not coincide with Pmin.
Suggested Approach for Post-Processing of Results, Visualization of Delamination Contours
One would expect that a PDA code designed for interlaminar fatigue would have output consistent with the fatigue analysis. Data output may consist of contour plots to show:
• Damage state as a function of cycles associated with a given increment • Current element state
1) not active (not at crack front) 2) opening but not released (e.g., blue color in shaded scale in a contour plot)
3) releasing on ramp (e.g., green color in shaded scale in a contour plot) 4) completely released (e.g., full red color in a contour plot)
Other possible tabular output data may include the following: • Total cycles per increment
• Damage area as a function of cycle count
Suggested Improvements to Progressive Static Crack Growth
The post-fatigue residual strength assessment is an important aspect in any structural fatigue evaluation. The predicted onset of damage using VCCT is a robust calculation. However progressive delamination growth predictions may be more challenging depending on the particular problem. This section identifies two key enhancement that will greatly improve the usefulness of currently available codes.
• Adding multi-element release (within one time increment) at the iteration level with ramping as described in the previous sections.
• Improvement of algorithm convergence. Specific approaches to this objective require further investigation; however, this topic remains a high priority.

Specific Capabilities and Advanced Enhancements Suggested After Initial Tasks Above Have Been Implemented
This section proposes advanced enhancements and capabilities that would improve the usefulness of VCCT-based interlaminar PDA codes. However, these enhancements are more appropriately implemented once the features described in prior sections have been implemented and fully vetted. The advanced topics that may be considered include:
• Fatigue Pristine Initiation (Calculation of NM defined in Ref. [7])
• Static Crack Migration analysis in Ref. [27]
• Fatigue Crack Migration in Ref. [27]
• Tri-linear strain softening law for simulating R-curve effects (progressive static analysis) in Ref. [17]
• Maintain compatibility for use for simulating in-plane damage and specifically interactions between in-plane cracks and delaminations

References
[1] E. F. Rybicki and M. F. Kanninen, "A Finite Element Calculation of Stress Intensity Factors by a Modified Crack Closure Integral," Eng. Fracture Mech., vol. 9, pp. 931-938, 1977.
[2] R. Krueger, "Virtual Crack Closure Technique: History, Approach and Applications," Applied Mechanics Reviews, vol. 57, pp. 109-143, March 2004.
[3] "ASTM D5528 Standard Test Method for Mode I Interlaminar Fracture Toughness of Unidirectional Fiber-Reinforced Polymer Matrix Composites," in Annual Book of ASTM Standards. Vol. 15.03, ASTM International, 2013.
[4] "ASTM D7905/D7905M Standard Test Method for Determination of the Mode II Interlaminar Fracture Toughness of Unidirectional Fiber-Reinforced Polymer Matrix Composites," in Annual Book of ASTM Standards. Vol. 15.03, ASTM International, 2014.
[5] “ASTM D6671/D6671M-13 Standard Test Method for Mixed Mode I-Mode II Interlaminar Fracture Toughness of Unidirectional Fiber Reinforced Polymer Matrix Composites," in Annual Book of ASTM Standards. Vol. 15.03, ASTM International, 2013.
[6] Polymer Matrix Composites: Materials Usage, Design, and Analysis, Composite Materials Handbook (CMH-17), Volume 3, section 12.6.4.3 SAE International, 2012.
[7] T. K. O’Brien, “Towards a Damage Tolerance Philosophy for Composite Materials and Structures,” Composite Materials: Testing and Design (Ninth Volume), ASTM STP 1059, S.P. Garbo, Ed., American Society for Testing and Materials, Philadelphia, pp. 7-33. 1990.
[8] "ASTM D6115, Standard Test Method for Mode I Fatigue Delamination Growth Onset of Unidirectional Fiber-Reinforced Polymer Matrix Composites," in Annual Book of ASTM Standards. Vol. 15.03, ASTM International, 2011.
[9] L.R. Deobald, et al, “Interlaminar Fatigue Elements for Crack Growth Based On Virtual Crack Closure Technique,” AIAA SDM Conference, Honolulu, HI, April 2007.
[10] Abaqus Analysis User's Guide,Abaqus 6.14 Dassault Systèmes Simulia Corp., Providence, RI, USA, 2014.
[11] M.L. Benzeggagh and M. Kenane, "Measurement of Mixed-Mode Delamination Fracture Toughness of Unidirectional Glass/Epoxy Composites with Mixed-Mode Bending Apparatus," Composite Science & Technology, 56(4):439-449, 1996.
[12] J. Reeder, "3D Mixed-Mode Delamination Fracture Criteria - An Experimentalist's Perspective," in Proceedings of American Society for Composites, 21st Annual Technical Conference, Dearborn, Michigan, 2006.
[13] R. L. Ramkumar, J. M. Whitcomb, “Characterization of Mode I and Mixed-Mode Delamination Growth in T300/5208 Graphite/Epoxy,” Delamination and Debonding of Materials, ASTM STP 876. American Society for Testing and Materials, Philadelphia, pp. 315-335. 1985.
[14] M. Kenane, M.L. Benzeggagh, “Mixed-mode Delamination Fracture Toughness of Unidirectional Glass/Epoxy Composites Under Fatigue Loading,” Composites Science and Technology, 57 (5), pp. 597-605, 1997.

[15] N. Blanco, E.K. Gamstedt, L.E. Asp, J. Costa, “Mixed-Mode Delamination Growth in Carbon-Fibre Composite Laminates Under Cyclic Loading,” International Journal of Solids and Structures, 41, pp. 4219–4235, 2004.
[16] J.G. Ratcliffe and W.M. Johnston, "Influence of Mixed Mode I-Mode II Loading on Fatigue Delamination Growth Characteristics of a Graphite Epoxy Tape Laminate," in Proceedings of American Society for Composites 29th Technical Conference, San Diego, CA, 2014.
[17] C. Bisagni, P. Brambilla, C. Dávila, “Modeling Delamination in Postbuckled Composite Structures Under Static and Fatigue Loads,” SAMPE, Long Beach, CA, United States, 2013.
[18] G.E. Mabson et al, “Fracture Interface Elements for the Implementation of the Virtual Crack Closure Technique,” AIAA SDM Conference, April 2007.
[19] K. Walker, “The Effect of Stress Ratio during Crack Propagation and Fatigue for 2024-T3 and 7075-T6 Aluminum”, Effects of Environment and Complex Load History on Fatigue Life, ASTM STP 462. American Society for Testing and Materials, pp. 1-14, 1970.
[20] L. Yao, Y. Sun, M. Zhao, R.C. Alderliesten, R. Benedictus, “Stress Ratio Dependence of Fibre Bridging Significance in Mode I Fatigue Delamination Growth of Composite Laminates,” Composites: Part A, 95, pp. 65-74, 2017.
[21] G.C. Sih and H. Liebowitz, “Mathematical Theories of Brittle Fracture,” Fracture, Vol. II, H. Liebowitz, Ed., Academic, New York, pp. 67-190, 1968.
[22] “Polymer Matrix Composites, Guidelines for Characterization of Structural Materials,” Composite Materials Handbook (CMH-17) Volume 1, section 6.9.4, SAE Internatl., 2012.
[23] G.B. Murri, “Evaluation of Delamination Onset and Growth Characterization Methods under Mode I Fatigue Loading,” NASA/TM-2013-217966, Feb. 2013.
[24] N.V. De Carvalho, and G.B. Murri, “A Novel Method for Characterizing Fatigue Delamination Growth under Mode I using the Double Cantilever Beam Specimen,” in Proceedings of American Society for Composites 29th Technical Conference, San Diego, CA, 2014.
[25] L. Yao, R.C. Alderliesten, M. Zhao, R. Benedictus, “Characterization of the Fibre Bridging Contribution in Mode I Fatigue Delamination in Composite Laminates,” in Proceedings of American Society for Composites 29th Technical Conference, San Diego, CA, 2014.
[26] J. Bannantine, J. Comer, J. Handrock, Fundamentals of Metal Fatigue Analysis, pp. 208-214, 1990.
[27] J.G. Ratcliffe and N.V. De Carvalho, “Investigating Delamination Migration in Composite Tape Laminates,” NASA/TM–2014-2182892, 2014.

REPORT DOCUMENTATION PAGE
Standard Form 298 (Rev. 8/98) Prescribed by ANSI Std. Z39.18
Form Approved OMB No. 0704-0188
The public reporting burden for this collection of information is estimated to average 1 hour per response, including the time for reviewing instructions, searching existing datasources, gathering and maintaining the data needed, and completing and reviewing the collection of information. Send comments regarding this burden estimate or any otheraspect of this collection of information, including suggestions for reducing the burden, to Department of Defense, Washington Headquarters Services, Directorate for InformationOperations and Reports (0704-0188), 1215 Jefferson Davis Highway, Suite 1204, Arlington, VA 22202-4302. Respondents should be aware that notwithstanding any otherprovision of law, no person shall be subject to any penalty for failing to comply with a collection of information if it does not display a currently valid OMB control number. PLEASE DO NOT RETURN YOUR FORM TO THE ABOVE ADDRESS.1. REPORT DATE (DD-MM-YYYY) 2. REPORT TYPE 3. DATES COVERED (From - To)
4. TITLE AND SUBTITLE 5a. CONTRACT NUMBER
5b. GRANT NUMBER
5c. PROGRAM ELEMENT NUMBER
5d. PROJECT NUMBER
5e. TASK NUMBER
5f. WORK UNIT NUMBER
6. AUTHOR(S)
7. PERFORMING ORGANIZATION NAME(S) AND ADDRESS(ES) 8. PERFORMING ORGANIZATION REPORT NUMBER
10. SPONSOR/MONITOR'S ACRONYM(S)
11. SPONSOR/MONITOR'S REPORT NUMBER(S)
9. SPONSORING/MONITORING AGENCY NAME(S) AND ADDRESS(ES)
12. DISTRIBUTION/AVAILABILITY STATEMENT
13. SUPPLEMENTARY NOTES
14. ABSTRACT
15. SUBJECT TERMS
16. SECURITY CLASSIFICATION OF:a. REPORT b. ABSTRACT c. THIS PAGE
17. LIMITATION OF ABSTRACT
18. NUMBER OF PAGES
19a. NAME OF RESPONSIBLE PERSON
19b. TELEPHONE NUMBER (Include area code) (757) 864-9658
NASA Langley Research Center Hampton, VA 23681-2199
National Aeronautics and Space Administration Washington, DC 20546-0001
NASA-TM-2017-219663
L-20852
01-09-2017 Technical Memorandum
STI Help Desk (email: [email protected])
U U U UU
Composites; Delamination; Fatigue; Finite element analysis; Fracture mechanics
Guidelines for VCCT-Based Interlaminar Fatigue and Progressive Failure Finite Element Analysis
Deobald, Lyle R.; Mabson, Gerald E.; Engelstad, Steve; Rao, Prabhakar; Gurvich, Mark R.; Seneviratne, Waruna; Perera, Shenal; O'Brien, Thomas K.; Murri, Gretchen; Ratcliffe, James, G.; Davila, Carlos G.; Carvalho, Nelson; Krueger, Ronald
32
NASA
826611.04.07.01
Unclassified Subject Category 24 Availability: NASA STI Program (757) 864-9658
This document is intended to detail the theoretical basis, equations, references and data that are necessary to enhance the functionality of commercially available Finite Element codes, with the objective of having functionality better suited for the aerospace industry in the area of composite structural analysis. The specific area of focus willbe improvements to composite interlaminar fatigue and progressive interlaminar failure. Suggestions are biased towards codes that perform interlaminar Linear Elastic Fracture Mechanics (LEFM) using Virtual Crack Closure Technique (VCCT)-based algorithms. All aspects of the science associated with composite interlaminar crack growth are not fully developed and the codes developed to predict this mode of failure must be programmed with sufficient flexibility to accommodate new functional relationships as the science matures.