Embed Size (px)
Citation preview

HAL Id: hal-02009423https://hal.archives-ouvertes.fr/hal-02009423
Submitted on 6 Feb 2019
HAL is a multi-disciplinary open accessarchive for the deposit and dissemination of sci-entific research documents, whether they are pub-lished or not. The documents may come fromteaching and research institutions in France orabroad, or from public or private research centers.
L’archive ouverte pluridisciplinaire HAL, estdestinée au dépôt et à la diffusion de documentsscientifiques de niveau recherche, publiés ou non,émanant des établissements d’enseignement et derecherche français ou étrangers, des laboratoirespublics ou privés.
Effect of unstable crack growth on mode II interlaminarfracture toughness of a thermoplastic PEEK composite
Pablo Garcia Perez, Christophe Bouvet, Ameur Chettah, Frédéric Dau,Ludovic Ballère, Patrick Peres
To cite this version:Pablo Garcia Perez, Christophe Bouvet, Ameur Chettah, Frédéric Dau, Ludovic Ballère, etal.. Effect of unstable crack growth on mode II interlaminar fracture toughness of a ther-moplastic PEEK composite. Engineering Fracture Mechanics, Elsevier, 2019, 205, pp.486-497.�10.1016/j.engfracmech.2018.11.022�. �hal-02009423�

��� ������������ ��������� ��� ������ ����� �� ��� �� ��� �������� �������������
����������������������������������
��� ������� ������� ������� ������� �������
����� � �� ��� ���� �������� ���� ������� ��� ��� �� ��� �������
��������� ��� �� � �� ������ ��������� ���� ��� ��� ����� ������
��� � ������ ������� ���
�� ���� ��� �����
�������� ��� �
an author's https://oatao.univ-toulouse.fr/21849
https://doi.org/10.1016/j.engfracmech.2018.11.022
Garcia Perez, Pablo and Bouvet, Christophe and Chettah, Ameur and Dau, Frédéric and Ballère, Ludovic and Peres,
Patrick Effect of unstable crack growth on mode II interlaminar fracture toughness of a thermoplastic PEEK
composite. (2019) Engineering Fracture Mechanics, 205. 486-497. ISSN 0013-7944

Effect of unstable crack growth on mode II interlaminar fracturetoughness of a thermoplastic PEEK composite
P. Garcia Pereza, C. Bouvetb,⁎, A. Chettahc, F. Daua, L. Ballered, P. Pérèsd
aArts et Métiers ParisTech, I2M, Talence, FrancebUniversité de Toulouse, ISAE-SUPAERO, ICA, Toulouse, FrancecUniversité Bourgogne Franche-Comté, ISAT, DRIVE, FrancedAriane Group, Saint-Médard-en-Jalles, France
Keywords:Unstable crack growthDelaminationPolymer matrix composites
A B S T R A C T
An end notched flexure (ENF) test was used to study the effect of growth stability on mode IIinterlaminar fracture toughness (GIIC) of a carbon/PEEK composite. The instability of the ENFtest was used to induce both stable and unstable crack growth with a static loading. Two tech-niques were used to evaluate mode II fracture toughness: the traditional compliance method andthe infra-red thermography technique. The compliance technique has the advantage of beingsimple and it has already been confirmed for standard tests. Nevertheless its results may beinaccurate for unstable crack growth propagation. The infra-red thermography technique enablesfracture toughness to be accurately measured for non-standard tests in which the crack growthmay be unstable.
Both methods are complementary and this study came to the conclusion that GIIC is sensitiveto crack growth velocity. Fracture toughness showed a low value for crack growth start andunstable propagation, and a high value for stable crack growth. The transition between a ductilefracture mode (for low crack growth velocity) and a brittle fracture mode (for high crack growthvelocity) explained the important variability in GIIC values.
1. Introduction
High performance thermoplastics are increasingly considered in composite structures mainly for damage tolerance reasons. Thesematerials are actually considered more damage tolerant than thermoset based composite materials [1,2]. Semi crystalline thermoplastic resins offer a number of advantages over conventional thermoset resins (such as epoxies): a high degree of chemical resistance,excellent damage and impact resistance and they may be used over a wide range of temperatures.
From a general standpoint, it appears from the literature that thermoplastic based composites display a better resistance to impactdamage than epoxy based composites. Among the properties governing the impact behavior of laminated composites, mode I andmode II critical energy release rates (ERR), GIC and GIIC, are of the utmost importance [2 8].
Despite the high difference between the critical ERR of thermoplastic and thermoset composite materials, the gain on impactdamage tolerance is not as great as expected [7,8]. Mode I ERR is about 4 N/mm for pure PEEK resin and about 0.5 N/mm for pureepoxy resin [7]. However, the fracture behavior of composite material is weaker. For example, carbon/PEEK fracture toughness (FT)is about 1.5 N/mm in mode I and 2 N/mm in mode II [9 12], whereas carbon/epoxy T700/M21 FT is about 0.5 N/mm in mode I and
⁎ Corresponding author.E-mail address: [email protected] (C. Bouvet).
https://doi.org/10.1016/j.engfracmech.2018.11.022

1.6 N/mm in mode II [13,14]. Therefore fracture toughness is currently higher for thermoplastic than for thermoset, but the difference is less important for composite than for pure resin. Moreover, impact damage tolerance is mostly driven by mode II FT[15,16], and the difference between thermoset and thermoplastic composite fracture toughness is lower in mode II than in mode I.
Another important point dealing with damage tolerance of thermoplastic composites is the rate sensitivity of the crack growth. Infact, some authors show that critical ERR changes with the velocity of the crack growth. It is particularly the case for interlaminarshear fracture [6,9 11,17]. Friedrich et al. [9 11] performed End Notched Flexure (ENF) tests at room temperature over a range ofcrosshead speeds from 4.2×10⁻⁶ to 9.2× 10⁻² m/s and showed that GIIC of APC 2 PEEK resin decreases from 1.9 to 0.4 N/mmwhen crack growth velocity increases (Fig. 1a). They explained that the APC 2 material exhibits ductile crack growth at low rates(Fig. 2a) and brittle crack growth at high rates (Fig. 2b).
Blackman et al. [18] used an End Loaded Split (ELS) test and a Fixed Ratio Mixed Mode (FRMM) test to evaluate carbon/PEEKfracture toughness under high rates in mixed mode I/II and mode II loadings. They showed that GIIC decreases from 2.5 N/mm at theslowest test rate (of about 10−4 m/s), to 2.2 N/mm at the highest test rate (of about 3m/s). Contrary to these results, Berger andCantwell [19] found that AS4/carbon fiber reinforced PEEK interlaminar fracture toughness increased as the crosshead displacementrate increased. They carried out a double ENF test and their study shows that GIIC increases from 2.2 to 2.7 N/mm for a crossheaddisplacement rate increasing from 1.7× 10⁻⁶ to 8.3× 10 3m/s. They concluded that mode II interlaminar fracture toughness isstrongly influenced by the yield stress of thermoplastic resin. In their study, the temperature influence (from 20 to 150 °C) was alsostudied. The authors concluded that increasing the test temperature has the same effect as decreasing the loading rate; these twophenomena induce similar reductions in the value of GIIC. The authors compared the 25% increase in GIIC (at 20 °C) with the 25%increase in yield stress found by Béguelin et al. [20]. They concluded that the rate sensitivity of the mode II interlaminar fracture
Nomenclature
Latin variables
a crack lengthB sample widthC compliance or specific heat capacityc0 speed of a longitudinal wavedWdiss intrinsic dissipationdWirrev irreversible energyEl Young modulus in the fiber directionF forceG energy release rateGIIC mode II interlaminar fracture toughnessI area moment of inertia of the beamL beam length between supportssthe thermo mechanical couplingu displacement
Greek variables
β Taylor Quinney coefficient
ε ̇ strain rateϕint intrinsic dissipationϕirrev irreversible dissipationϕstored stored energyθ temperature variationρ mass densityΩfis volume containing the crack
Acronyms
ENF end notched flexure testELS end loaded split testERR critical energy release ratesFRMM fixed ratio mixed mode testFT fracture toughnessIRT infrared thermographykll (ktt, kzz) conductivity in l (t, z) directionLVDT linear variable differential transformerPEEK polyether ether ketone
Fig. 1. Effect of the crack growth speed on mode II fracture toughness (a) and plastic zone size (b) [9].
P. Garcia Perez et al.

energy is related to the rate dependent characteristics of the PEEK matrix. At the same time, the results showed that the damage zonelength increases from about 1 to 1.3mm as the loading rate increases from 1.7×10⁻⁶ to 8.3× 10 3m/s [19]. This result is contradictory with Friedrich et al.’s work [9 11] who showed that the damage zone size decreased as the loading rate increased (Fig. 1b).
The goal of this article is to contribute to this complex discussion on the effect of the rate on the GIIC value. Most of the work foundin the literature studies the effect of the loading rate on GIIC because it can be easily evaluated. The authors of this article assert thatthe loading rate is not the appropriate parameter to study fracture toughness variability but crack growth velocity is, even though it ismore difficult to assess. In fact, the same loading rate can induce very different crack growth speeds depending on the boundaryconditions. This fact could partly explain the difference in GIIC values observed in the literature. For example, the ENF test can inducestable (low velocity crack growth) or unstable propagations (high velocity crack growth) [14,21 23]. This instability is often considered a disadvantage and the standard proposes a configuration intended to avoid it [21,22]. But if the goal is to induce fast crackgrowth, this instability is very interesting and enables dynamic crack growth to be assessed by performing a static test.
In this project, several ENF tests were carried out in order to compare stable and unstable crack growth. An ultra high speedcamera was also used to precisely measure crack growth velocity in an unstable ENF test. Then, two experimental techniques wereused to study the effect of crack growth instability on the mode II fracture toughness value.
2. ENF test
The composite material examined in this study is an unidirectional prepreg laminate with IM7 carbon fiber and PEEK resin. TheYoung modulus in the fiber direction, El, is shown in Table 1, where l is the longitudinal direction, t the transverse direction and z theout of plane direction. Plates were manufactured with draping sequence [0]32. The first samples (ENF1 to ENF5) were made with pliesof 0.137mm thickness for a total thickness, h, of 4.4mm. They were used to understand the behavior of the specimen and to observestable and unstable propagation using an infrared camera. The ENF6 to ENF9 samples were made from a different ply batch. The plythickness was 0.145mm for a total thickness of 4.65mm. These tests were filmed with an ultrahigh speed camera to evaluate crackgrowth velocity and with an infrared camera to determine GIIC values.
The samples were prepared with a teflon film inserted at mid thickness in order to initiate the crack. Afterwards, a box cutter wasused to initiate the crack from the Teflon film, which allowed for different initial crack lengths. Then ENF samples were cut to alength of 250mm and a width of 20mm. The geometry of the ENF test is shown in Fig. 3: the plate was simply supported on two10mm diameter cylinders and force was imposed using a 10mm diameter cylinder. The velocity of the central cylinder was imposedat 0.028mm/s. The force, F, was measured during tests using the machine cell force and the displacement, u, was measured using aLVDT sensor placed under the sample.
The first test, ENF1 sample, failed under the loading point. This failure was due to fiber failure just under the cylinder, probablydue to high compression and shear stress concentration in this zone. In order to avoid this premature failure, a rubber piece of about2mm thickness, was set under the upper cylinder (Fig. 3). It spread the applied load over a wider specimen surface without disturbingthe force measurement. As a result, the stress state in the specimen was more uniform. With this rubber piece, no other failure wasobserved under the force cylinder.
-a- -b-
Fig. 2. Mode II ductile behavior (a) and mode II brittle behavior (b) [10].
Table 1Mechanical and thermal properties of carbon/PEEK UD ply [41–43].
Young’s modulus in fiber direction, El 155 GPaThermal conductivity in fiber direction, kll 5.4W·m 1·K 1
Thermal conductivity in transverse direction, ktt and kzz 0.25W·m 1·K 1
Specific heat, C 859 J·kg 1·K 1
Density, ρ 1610 kg·m 3
P. Garcia Perez et al.


21,8
22
22,2
22,4
22,6
22,8
0 0,4 0,8 1,2 1,6 2 2,4 2,8 3,2
Location (mm)
Tem
pera
ture
(°C
)
Frame n° 3860 3861 3862 3864 3882
Fig. 7. Evolution of the temperature versus location for different time for the path defined Fig. 6.
F ilm e d a re a
4.65mm
t
t+2 t
t+ t
t+3 t
t+4 t
t+5 t
t = 9.52 μs crack tip
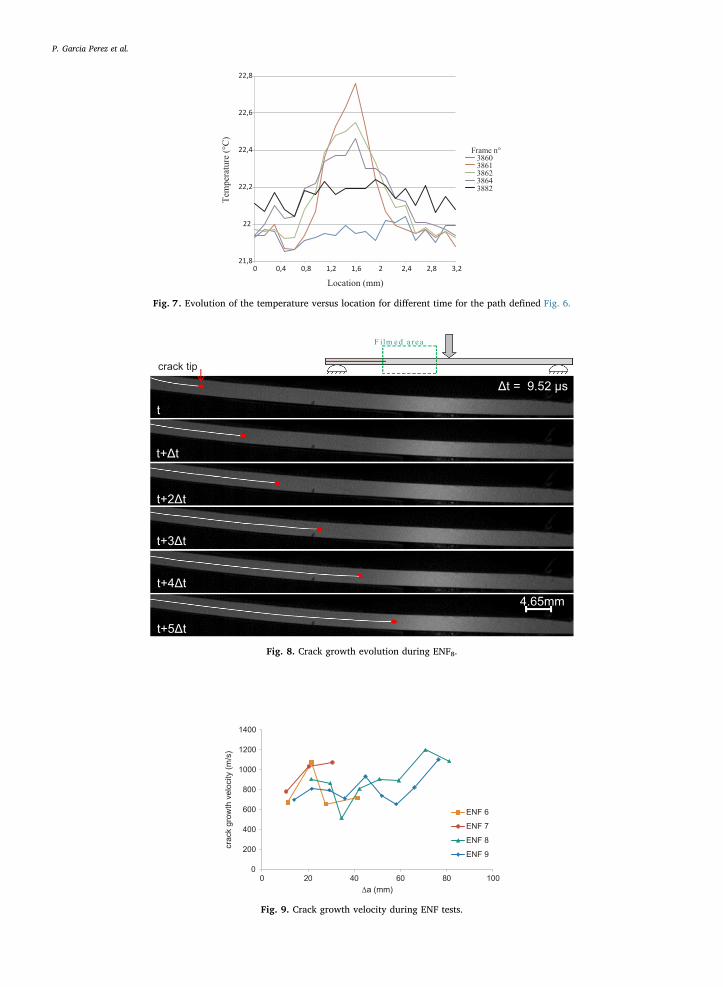
Fig. 8. Crack growth evolution during ENF8.
0
200
400
600
800
1000
1200
1400
0 20 40 60 80 100
crac
k gr
owth
vel
ocity
(m/s
)
a (mm)
ENF 6
ENF 7
ENF 8
ENF 9
Fig. 9. Crack growth velocity during ENF tests.
P. Garcia Perez et al.

monitored for these samples so ENF8 and ENF9 samples were painted white so that crack propagation could be fully observed. Thecrack propagation mean velocity of each test varied from 807m·s−1 to 962m·s−1 with a maximum peak of 1200m·s−1, Fig. 9. Strohet al. [24] shows that, in some specific configurations, crack growth velocity tends to the velocity of a perturbation travelling along afree surface. The maximum velocity is set by the Rayleigh waves speed [25] and can be estimated by − × c0.2 0.4 0, with c0 being thespeed of a longitudinal wave ( =c E ρ/0 ) [26]. This estimation shows that the maximum crack growth velocity in our material variesfrom 1930m·s−1 to 3860m·s−1. Since the velocity of the ENF delamination is as high as 1200m·s−1, it is proven that an ENF staticloading can induce fast damage propagation if an instability condition is reached.
3. Determination of GIIC
3.1. Beam theory
By applying classical beam theory, it is simple to study ENF test crack growth in the framework of linear elastic fracture mechanics [21 23]. If the structure behavior is assumed linear elastic, the energy release rate, G, can be expressed by:
= =G FB
dCda
C uF2
and2
(1)
where B is the sample width, F is the force, a is the crack length, C is the compliance and u is the displacement. Then crack growth isobtained when G equals the critical ERR in mode II, GIIC. If GIIC is assumed constant, the condition of crack growth stability allows forthe expression of the displacement versus force using the beam theory [21 23]:
≤ ≤ = +
≤ ≤ = −
( )( )
a L u E I
a L u E I
If 0 /2 then
If then
FLEI F l
BG
L FLEI F l
BG
38416
3
3/2
2 9616
3
3/2
IIc
IIc
3
2
3
2 (2)
where L is the beam length between boundary conditions (Fig. 3) and I is the area moment of inertia of the beam =(I Bh /12)3 . Thesecurves are plotted in Fig. 10 for two values of GIIC. Higher values of GIIC mean that more energy is needed to obtain crack propagationand so the force should also be higher. In this figure, the elastic behavior of the sample (F=u/C), using the beam theory, is alsoplotted for a= 0 and a= L/2 (the smaller the crack, the higher the stiffness):
≤ ≤ =
≤ ≤ =
+
− −
a L C
a L C
If 0 /2 then
If then
L aEI
L L L aEI
12384
23( )96
3 3
3 3
(3)
If the ENF is controlled with displacement, which is the case of the experimental tests presented here, the stability condition of thecrack growth is reached for a > 0.347 L (Fig. 4). In reality, the problem is more complex, because GIIC is not constant, and the R
stiffness a = 0
GIIC = 1.3 N/mm a > L/2
GIIC = 1.3 N/mm a < L/2
stiffness a = L/2
GIIC = 2.7 N/mm a > L/2
GIIC = 2.7 N/mm a < L/2
a = 0.347 L
a = 0
a < L/2
a > L/2
a = 0.347 L
Displacement (mm)
Fig. 10. Analytical curve of force versus displacement of the ENF test for GIIC= 1.3 N/mm and GIIC= 2.7 N/mm.
P. Garcia Perez et al.


damage mechanisms involved [32,34,37 38]. In the literature, very little information is available on the values of β for resins[27 32]. Li and Lambros [38] measured the ratio of dissipative work converted into heat for a polycarbonate material and they foundthat it varies from 100% for low strain to 50% for high strain. For metallic materials, some further studies exist in the literature. Forexample, Kapoor and Nemat Nasser [37] show that β is close to 1 for a Ta 2.5% Bhalla et al. [39] measured values of β between 0.5and 1 depending on the strain for an annealed 302 stainless steel. With the same material, Zehnder et al. [40] studied cracks in a0.8mm plate for stable tearing growth. They showed that quantitative imaging of the crack tip temperature field using IRT can beused to resolve crack tip energy flux and to measure the energy release rate.
Moreover, the β coefficient in composite materials depends on the damage mode [27,30 34]: β value is close to 1 when damageconsists of cracks, i.e. a brittle fracture mode and β value is low when damage consists of resin “plasticity”, i.e. a ductile fracturemode. This phenomenon may be linked to the fracture modes (Fig. 2) observed by Friedrich et al. [9 11]. If the fracture modechanges during crack growth, the β coefficient can also change. It is likely that the β value is close to 1 for unstable crack growth andβ values may be lower for stable crack growth. As it is difficult to accurately assess β, this study is based on the hypothesis that β isequal to 1. The fact that fast unstable propagation is present during these ENF tests endorses this hypothesis.
For unstable crack growth, the IRT method was adapted by choosing tA just before the crack crossing the studied area and tA+dA
just after the crack crossed the studied area (Fig. 13). Then dA was directly the length of the studied area, multiplied by the width. Infact, the calculation was independent of the thickness, because dissipated energy, dWdiss, was also an integration over the volume,which was reduced to an integration over the surface, if dA is, at the same time, reduced to a length.
This method was used to calculate GIIC (Eq. (8) with β=1) in several lines (n1 to n6 plotted in Fig. 14). These lines correspond tothe volume Ωfis and they represent thermal gauges. The position of the thermal gauges at the front of the specimen is fixed during thetest. When the crack crosses the thermal gauge, temperature varies (similar to what is presented in Fig. 7) and GIIC can be calculatedby integrating the temperature variation over time and the gauge length. These gauges enabled GIIC to be calculated with the crack indifferent positions in order to have an evolution of GIIC with the crack growth (Fig. 12). We can observe a uniform GIIC value for thewhole duration of the unstable propagation. The values of GIIC are shown in Table 2 and they correspond to a time tA+dA=0.03 s(Fig. 14) because fracture toughness is uniform at this time. Mean values of fracture toughness during unstable propagation vary from0.9 N/mm to 1.5 N/mm. When brittle damage linked to unstable propagation takes place, fracture toughness decreases drastically(∼50% of the values obtained at maximum force).
These values are in line with those estimated by beam theory and the compliance method (Fig. 7). This significant correlationpartly justifies the choice of β=1 and must be due to the brittle nature of the crack. As mentioned above, a high fracture toughnessvalue is found for stable crack growth, and a low fracture toughness value is found for unstable crack growth.
Fig. 14. Temperature field during ENF8 test and the thermal gauges used to calculate GIIC via IRT technique.
P. Garcia Perez et al.

4. Conclusion
An ENF test was used to study the effect of growth stability on mode II interlaminar fracture toughness of a carbon/PEEKcomposite. The instability of the ENF test was used to induce both stable (or slow) and unstable (or fast) crack growth with a staticloading. Unstable propagation was filmed with an ultra high speed camera in order to determine crack growth velocity, varying from807m/s to 962m/s. Then two processes were used to evaluate fracture toughness: the standard compliance method and the Infra RedThermography (IRT) technique.
The standard compliance method enabled GIIC to be assessed using force and displacement imposed on the ENF sample, and thecrack growth length was measured during the test [21 23]. Initial fracture toughness varied from 0.6 N/mm (ENF9) to 1.3 N/mm(ENF6 and ENF8). Afterwards, stable propagation took place until the point of maximum force, when GIIC increased to a valuebetween 1.4 N/mm (ENF9) and 3 N/mm (ENF8). The drawback of this method is that it is inaccurate if the crack growth is unstable.
Then an Infra Red Thermography (IRT) process was applied. This technique enabled fracture toughness to be assessed using theheat energy dissipated by the crack growth [30 32]. This technique is very promising because it makes it possible to assess GIIC inunclassical tests for which other techniques are not applicable. Nevertheless, in order to quantitatively evaluate crack growth dissipated energy the Taylor Quinney coefficient [33] is needed. This coefficient represents the ratio of energy dissipated as heat toirreversible energy, and it can be difficult to assess [32 34,38]. This technique was used to estimate fracture toughness during ENFtest with unstable propagation. From its maximum force peak value, GIIC decreased to a value comprised between 0.9 N/mm (ENF9)and 1.5 N/mm (ENF7).
This high variation in the fracture toughness with crack growth velocity is most likely due to the transition between a ductilefracture mode for low velocity (stable process) and a brittle fracture mode for high velocity (unstable propagation).
The complementarity between these two experimental techniques made it possible to determine carbon/PEEK GIIC using an ENFtest with stable or unstable crack propagation. The results obtained using the infra red thermography technique show a significantcorrelation to GIIC values calculated via the standard compliance method.
Acknowledgement
This work was supported by DGA and by Région Aquitaine. The authors wish to thank the “Ecole Nationale d’Ingénieur de Tarbes”for the loan of the infrared camera.
References
[1] Morton J, Godwin EW. Impact response of tough carbon fibre composites. Compos Struct 1989;13(1):1–19.[2] Prevorsek DC, Chin HB, Bhatnagar A. Damage tolerance: design for structural integrity and penetration. Compos Struct 1993;23(2):137–48.[3] De Baere I, Jacques S, Van Paepegem W, Degrieck J. Study of the mode I and II inter-laminar behavior of a carbon fabric reinforced TP. Polym Test
2012;31(2):322–32.[4] Davies P, Benzeggagh ML, De Charentenay FX. The delamination behavior of carbon fiber reinforced PPS. 32nd int SAMPE symposium. 1987. p. 134–46.[5] Lachaud F, Lorrain B, Michel L, Barriol R. Experimental and numerical study of delamination caused by local buckling of TP and TS composites. Compos Sci
Technol 1997;58:727–33.[6] O’Brien K. Composite interlaminar shear fracture toughness GIIc: shear measurement or sheer myth. Technol Memorandum, NASA; 1997.[7] Vieille B, Casado VM, Bouvet C. About the impact behavior of woven-ply carbon fiber-reinforced thermoplastic- and thermosetting-composites: a comparative
study. Compos Struct 2013;101:9–21.[8] Vieille B, Casado VM, Bouvet C. Influence of matrix toughness and ductility on the compression after impact behavior of woven-ply thermoplastic and ther-
mosetting composites: a comparative study. Compos Struct 2014;110:207–18.[9] Friedrich K, Walter R, Carlsson LA, Smiley AJ, Gillepsie JW. Mechanisms for rate effects on interlaminar fracture toughness of carbon/epoxy and carbon/peek
composites. J Mater Sci 1989;24(9):3387–98.[10] Smiley AJ, Pipes RB. Rate sensitivity of mode II interlaminar fracture toughness in graphite/epoxy and graphite/peek composite materials. Compos Sci Technol
1987;29:1–15.[11] Gillepsie JW, Carlsson LA, Smiley AJ. Rate-dependent mode I interlaminar crack growth mechanisms in graphite/epoxy and graphite/peek. Compos Sci Technol
1987;28:1–15.[12] Russell AJ, Street KN. The effect of matrix toughness on delamination: static and fatigue fracture under mode II shear loading of graphite fiber composites. Tough
Compos 1987;ASTM STP 937:275–94.[13] Rivallant S, Bouvet C, Hongkarnjanakul N. Failure analysis of CFRP laminates subjected to compression after impact: FE simulation using discrete interface
elements. Compos Part A 2013;55:83–93.[14] Prombut P, Michel L, Lachaud F, Barrau JJ. Delamination of multidirectional composite laminates at 0°/Theta° ply interfaces. Eng Fract Mech
Table 2Comparison of GIIC calculated via compliance method and IRT technique for initial crack a0, crack at maximum force aFmax and during unstablepropagation a.
Compliance method IRT technique
a0 (mm) GIIC (N/mm) aFmax (mm) GIIC (N/mm) a (mm) Average GIIC (N/mm)
ENF6 31 1.3 34 2.0 – –ENF7 34 1.1 38 2.4 47–100 1.5ENF8 42 1.3 45 3.0 56–103 1.3ENF9 38 0.8 41 1.9 53–103 0.9
P. Garcia Perez et al.

2006;7(16):2427–42.[15] Davies GAO, Zhang X. Impact damage prediction in carbon composite structures. Int J Imp Eng 1995;16:149–70.[16] Hongkarnjanakul N, Bouvet C, Rivallant S. Validation of low velocity impact modelling on different stacking sequences of CFRP laminates and influence of fibre
failure. Compos Struct 2013;106:549–59.[17] Chai H. Interlaminar shear fracture of laminated composites. Int J Fract 1990;43:117–31.[18] Blackman BRK, Dear JP, Kinloch AJ, MacGillivray H, Wang Y, Williams JG, et al. The failure of fibre composites and adhesively bonded fibre composites under
high rates of test. Part III, J Mater Sci 1996;31:4467–77.[19] Berger L, Cantwell WJ. Temperature and loading rate effects in the mode II interlaminar fracture behavior of carbon fiber reinforced PEEK. Polym Compos
2001;22(2):271–81.[20] Beguelin P, Barbezat M, Kausch HH. Mechanical characterization of polymers and composites with a servohydraulic high-speed tensile tester. J Phys III
1991;1(12):1867–80.[21] Allix O, Ladevèze P. Damage analysis of interlaminar fracture specimens. Compos Struct 1995;31:61–74.[22] Davies P. Protocols for interlaminar fracture testing of composites. ESIS-Polymers & Composites Task Group, IFREMER, Centre de Brest; 1993.[23] Pereira AB, Morais AB, Marques AT, Castro PT. Mode II interlaminar fracture of carbon/epoxy multidirectional laminates. Compos Sci Technol 2004;64:1653–9.[24] Stroh AN. A theory of the fracture of metals. Adv Phys 1957;6(24):418–65.[25] Rayleigh JWSB. The theory of sound vol. 2. Macmillan; 1896.[26] Bluhm JL. Fracture arrest, fracture: an advanced treatise. New York: Academic Press; 1969.[27] Soumahoro Z. Etude du couplage thermomécanique dans la propagation dynamique de fissure. Thesis of Ecole Polytechnique; 2005.[28] Dulieu-Barton JM, Stanley P. Development and applications of thermoelastic stress analysis. J Strain Anal 1998;33(2):93–104.[29] Stanley P, Chan WK. The application of thermoelastic stress analysis techniques to composite materials. J Strain Anal 1998;23(3):137–43.[30] Lisle T, Bouvet C, Pastor ML, Margueres P, Prieto Corral R. Damage analysis and fracture toughness evaluation in a thin woven composite laminate under static
tension using infrared thermography. Compos Part A 2013;53:75–87.[31] Lisle T, Bouvet C, Hongkarnjanakul N, Pastor ML, Rivallant S, Margueres P. Measure of fracture toughness of compressive fiber failure in composite structures
using infrared thermography. Compos Sci Technol 2015;112:22–33.[32] Lisle T, Bouvet C, Pastor ML, Rouault T, Margueres P. Damage of woven composite under tensile and shear stress using infrared thermography and micrographic
cuts. J Mater Sci 2015;50:6154–70.[33] Taylor GI, Quinney H. The latent energy remaining in a metal after cold working. R Soc A: Math Phys Eng Sci 1934.[34] Rittel D. On the conversion of plastic work to heat during high strain rate deformation of glassy polymers. Mech Mater 1999;31(2):131–9.[35] Weichert R, Schonert K. On the temperature rise at the tip of a fast running crack. J Mech Phys Sol 1974;22(2):127–33.[36] Weichert R, Schonert K. Heat generation at the tip of a moving crack. J Mech Phys Sol 1978;26(3):151–61.[37] Kapoor R, Nemat-Nasser S. Determination of temperature rise during high strain rate deformation. Mech Mater 1998;27(1):1–12.[38] Li ZH, Lambros J. Strain rate effects on the thermomechanical behavior of polymers. Int J Sol Struct 2001;38(20):3549–62.[39] Bhalla K, Zehnder A, Han X. Thermomechanics of slow stable crack growth: closing the loop between experiments and computational modeling. Engng Fract
Mech 2003;70(17):2439–58.[40] Zehnder A, Babinsky E, Palmer T. Hybrid method for determining the fraction of plastic work converted to heat. Exp Mech 1998;38(4):295–302.[41] HexTow carbon fiber data sheet. Hexcel; 2014.[42] GoodFellow PEEK resin datasheet. GoodFellow; 2014.[43] Lemarchand F. Etude de l'apparition des contraintes résiduelles dans le procédé d'empilement par soudage et consolidation en continu de composites ther-
moplastiques. Thesis of Ecole Nationale des Arts et Métiers; 2010.
P. Garcia Perez et al.