Embed Size (px)
Citation preview

GREATER MANCHESTERCONSTRUCTION SECTOR PIPELINE ANALYSIS
gmchamber.co.uk
Getting the right skills in the right place at the right time is a long-term problem that will continue to be a significant drag on economic growth if we continue to fail to address it. I assure you that the answer is not the blame game and political posturing – we need to take specific actions and we need to do this now.
This doesn’t just frustrate my members, whose employees make up around 30% of the working population of Greater Manchester: it frustrates our colleges and training providers who naturally want to provide relevant training that will lead to sustainable careers; it frustrates our young people and their parents who want simple, clear guidance on where the best job opportunities will be; it frustrates those with work experience who accept they must re-skill to move their careers forward.
Our collective failure to accurately forecast what the skills demand will be at a detailed level is the crux of the problem. We collect ever increasing masses of data but fail to turn this into the detailed forecasts that clearly show what skills are required, at what level, in what sector and when they are needed.
There is no doubt that we, the employers, have often been reluctant to look into the future and forecast the skills they require. We cannot expect the education system to respond instantly. This is not easy, of course, and dramatic shifts in markets and changes in the order book of a business will alter the skills required. The fact that this is tricky, however, is not a reason for not doing something: we must find a way of providing medium- and longer-term forecasts that enable the educators to plan their curriculums and change their courses.
I hardly need to tell you that in the last five years for Greater Manchester, and the UK, business has been as challenging as many of us can remember. However, the times are a-changing and we’re in the early stages of recovery following one of the slowest periods of growth following a recession on record.
As our Quarterly Economic Survey has shown over the last couple of quarters, many Greater Manchester businesses are now beginning to feel – albeit with a degree of caution – much more confident about the future.
With regards to the construction sector, our focus is on helping the sector access the skills
it needs. Construction suffered harshly in the aftermath of the recession, and one of the effects of this was to remove the confidence from employers in their future workloads to be able to take on two- or three-year apprenticeships.
We therefore developed a Shared Apprenticeship Scheme whereby the Chamber employs the apprentices and we work with the industry to rotate those trainees around different sites and different contractors so no one employer needs to worry about their future workstream and whether or not they’ll have the capacity to train an individual in two years’ time.
For us to deliver this project with confidence, we have to accurately understand the future pipeline of construction work so we can plan where we send apprentices to and when. Therefore we undertook the research that is contained in this report.
Our research team has analysed the pipeline of construction projects in Greater Manchester for the next four years and, working with the Construction Industry Training Board, has produced a forecast of the labour required to deliver those projects – not just a headline number – but by individual trades.
But we’ve gone even further, and have analysed the current skills being trained in GM and mapped this against what will be needed to deliver the £15bn of construction activity in the pipeline until 2017. This means that, for the first time, we are beginning to understand what skills, what trades and what apprenticeships need to be created and delivered in GM. Our young people can then see, or be directed to, specific employment opportunities and our employers get the skills they need.
I think this is a unique piece of work that is long overdue and provides a blue print of how we think about planning for skill demand in the future.
Clive Memmott, Chief Executive
CHIEF EXECUTIVE’S FOREWORD
EndorsementsExecutive SummaryEmployer EngagementMacro Environment of the Construction SectorPipeline Info & Labour Training ForecastLabour AnalysisProfessional ServicesStructural/Building Envelope TradesInterior TradesExterior TradesMechanical & ElectricalOperatives/LabourersCase StudiesCurrent Provision AnalysisGovernment Construction Sector PolicyConclusionAppendcesMethodologyFigure SourcesBackground
4567–910–1112-1516171819202122–2425–2728293031–323334
SECTION PAGE
CONTENTS
Contents 3Chief Executive’s Foreword2
“One of the key challenges with managing any business is firstly understanding your pipeline of opportunities and then aligning your resources to bid for and deliver them. This report is a huge step forward in allowing contractors that operate in the Greater Manchester area the chance to do both. The report not only identifies specific projects coming through in the next four years, but also analyses the type of work and the skills needed to deliver them. It will be a valuable guide to all construction businesses in the Greater Manchester region over the next few years as we come out of recession and start to grow again.”
Gary Wintersgill, Managing Director, Kier Construction – Northern
“The Greater Manchester Colleges Group welcome this analysis into the changing needs of the Construction Sector. It will help Colleges and Training Providers plan their provision and introduce new skills to respond to the needs of employers. There is clearly preparatory work which needs to be done, to stimulate the supply of learners to be trained and work with employers to gain their commitment to the changing requirements and in encouraging a local workforce to be recruited. Colleges and Training Providers are in an ideal position to create progression opportunities. With the support of employers this can be done through skills training, employee retraining and work experience. Colleges and Training Providers will be working hard preparing their learners and enabling them to gain sustainable employment.”
Cath Hurst OBE, Principal, Wigan & Leigh College
“Laing O’Rourke endorse the Greater Manchester Construction Sector Pipeline Analysis to all Chamber of Commerce Construction Sector Members as it not only provides an authoritative representation of the ‘announced’ workload pipeline for Greater Manchester but it also provides high quality, representative data that can help us better understand and address the region’s skills requirements.”
Tom Higgins, Regional Director, Laing O’Rourke
“The Chamber is a catalyst bringing together key elements including the pipeline of work and knowledge of the skills shortages we face so that together with a highly successful Shared Apprenticeship scheme supported by a Contractors’ Council we are together committed to achieving a shift towards a more sustainable North West construction industry.
“Irrespective of the size of your organisation – and we as Freemont are testament to the essential role of smaller businesses helping to lead real change – we now need all partners to get involved and help make this shift together.”
Noel Ruane, Director, Freemont, and Chair of the Greater Manchester Construction GTA
“The Construction Industry Training Board is delighted to be a partner in the development of this report. Identifying early on construction projects in the pipeline is really important if we are to maximise the opportunities for local business and the employment of local people. It enables us to identify the support we need to provide to equip people with the right skills and for large and small business to see where there are emerging business opportunities. It is really good to see Greater Manchester at the forefront of this activity.”
Steve Geary, Skills Strategy Director, Construction Industry Training Board
“The GM Chamber Construction Sector Pipeline Analysis is a very informative document which enables us to prioritise our skills training, giving us a focus on how best to work with providers to develop and improve the training programmes in the most appropriate trades.
“This coming together of contractors in the Greater Manchester area provides a real confidence that when working in and around the City, there will be a pool of highly skilled operatives, trained with a syllabus that has been tailored to meet the needs of the project requirements. This in turn will lead to a consistent approach to Quality and Health & Safety standards.”
Mark Nicholson, Operation Director, Carillion Construction Services
ENDORSEMENTS
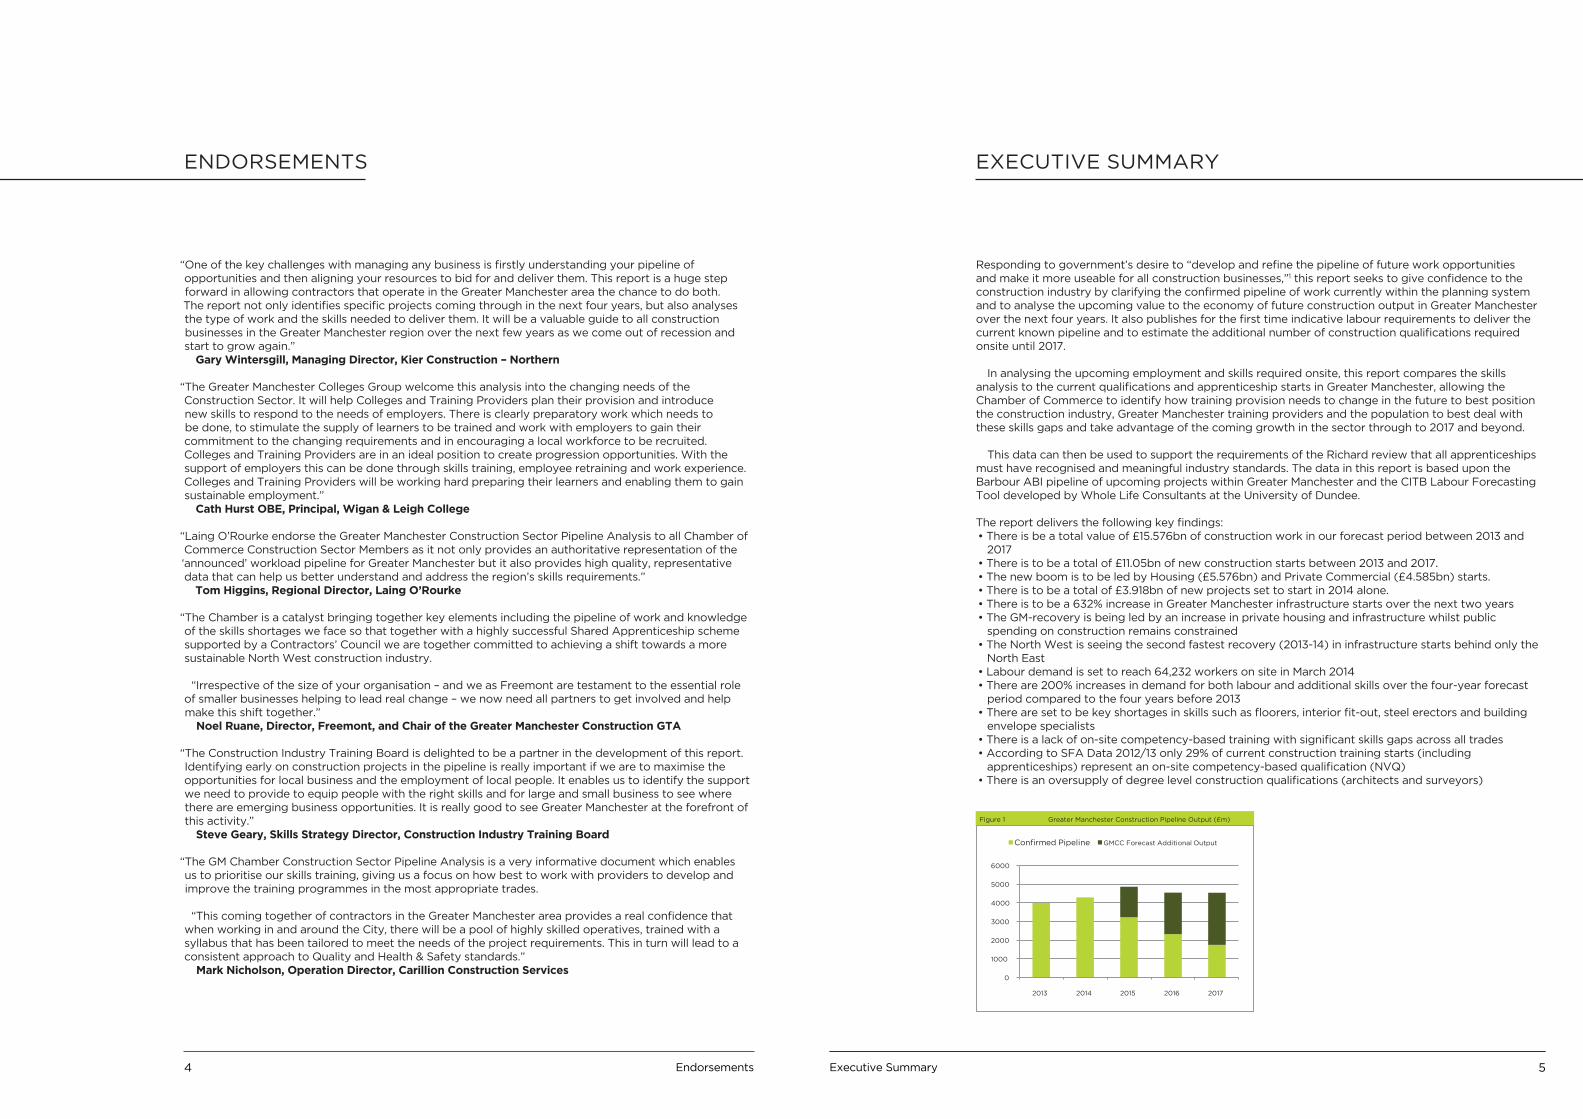
Responding to government’s desire to “develop and refine the pipeline of future work opportunities and make it more useable for all construction businesses,”1 this report seeks to give confidence to the construction industry by clarifying the confirmed pipeline of work currently within the planning system and to analyse the upcoming value to the economy of future construction output in Greater Manchester over the next four years. It also publishes for the first time indicative labour requirements to deliver the current known pipeline and to estimate the additional number of construction qualifications required onsite until 2017.
In analysing the upcoming employment and skills required onsite, this report compares the skills analysis to the current qualifications and apprenticeship starts in Greater Manchester, allowing the Chamber of Commerce to identify how training provision needs to change in the future to best position the construction industry, Greater Manchester training providers and the population to best deal with these skills gaps and take advantage of the coming growth in the sector through to 2017 and beyond.
This data can then be used to support the requirements of the Richard review that all apprenticeships must have recognised and meaningful industry standards. The data in this report is based upon the Barbour ABI pipeline of upcoming projects within Greater Manchester and the CITB Labour Forecasting Tool developed by Whole Life Consultants at the University of Dundee.
The report delivers the following key findings:• There is be a total value of £15.576bn of construction work in our forecast period between 2013 and
2017• There is to be a total of £11.05bn of new construction starts between 2013 and 2017.• The new boom is to be led by Housing (£5.576bn) and Private Commercial (£4.585bn) starts.• There is to be a total of £3.918bn of new projects set to start in 2014 alone.• There is to be a 632% increase in Greater Manchester infrastructure starts over the next two years• The GM-recovery is being led by an increase in private housing and infrastructure whilst public
spending on construction remains constrained• The North West is seeing the second fastest recovery (2013-14) in infrastructure starts behind only the
North East• Labour demand is set to reach 64,232 workers on site in March 2014• There are 200% increases in demand for both labour and additional skills over the four-year forecast
period compared to the four years before 2013• There are set to be key shortages in skills such as floorers, interior fit-out, steel erectors and building
envelope specialists• There is a lack of on-site competency-based training with significant skills gaps across all trades• According to SFA Data 2012/13 only 29% of current construction training starts (including
apprenticeships) represent an on-site competency-based qualification (NVQ)• There is an oversupply of degree level construction qualifications (architects and surveyors)
EXECUTIVE SUMMARY
Figure 1 Greater Manchester Construction Pipeline Output (£m)
0
1000
2000
3000
4000
5000
6000
2013 2014 2015 2016 2017
Confirmed Pipeline GMCC Forecast Additional Output
Executive Summary 5Endorsements4
Greater Manchester Chamber of Commerce has been working with businesses through the Employer Ownership of Skills Pilot to ascertain their training requirements within the sector. Direct engagement with the industry at a workshop in the summer of 2013 showed that within the construction sector there was a large demand for more and better training with a more flexible approach to skills provision. We developed specialist cluster groups to look at key areas including Construction Management; Building Envelope Specialists; Civils & Steel and from here, asked them key questions about their skill requirements.
Construction managers, for example, would prefer training that was more modular-based and flexible with a mixture of classroom assignments and distance learning alongside on-site training. This approach reflects the need to balance training across the workplace and educational establishments. It broadly concurs with the national picture with many employers not willing to give a large amount of time to training when their work is often seasonal.2
There was discussion amongst some cluster groups that they need to be recognised as a recognised career path in the first place; this was particularly apparent with the building envelope trades who require skills-based training around roofing, curtain walling, rain screen and site fixed stud. The workshops also identified a lack of structured training for steelwork within the Greater Manchester conurbation, with a need across all skills to increase health and safety training, particularly in the mechanical and electrical trades. Security and logistics companies highlighted the need for more ICT skills amongst their employees to allow for the automation of more basic site processes. Insulation providers noted that they required more structured management and supervisory courses. All skills requirements in Greater Manchester were found to be dependent upon the industry adopting Business Information Modelling as this will free up time for more
specialist training. There was also agreement amongst all construction employers that the image of the industry needs to be improved within schools with more teaching about the future trends in the industry and highlighting that it is not all dirty manual labour.
This localised research reflects national trends where employers do not rate skills very highly despite other sectors describing the service as being highly important. This is often reflected in render and cladding where skills are not highly valued or maintained by the sector itself despite this being described as one of the most important skills necessary for a construction project. There are also problems of current skills categories being inflexible with, for example, skills within wood trades such as woodworking and timber frame erection being very different occupations and requiring differing specialist training. A recent CITB report showed that only drilling and sawing, shop fitting and stonemasonry had an adequate supply of work outside of London to replace current specialist skills.3
The employer engagement work that The Chamber is involved with is key to getting qualifications that are fit for purpose and will be carried out on an ongoing basis, in conjunction with the regular production of this report.
EMPLOYER ENGAGEMENT
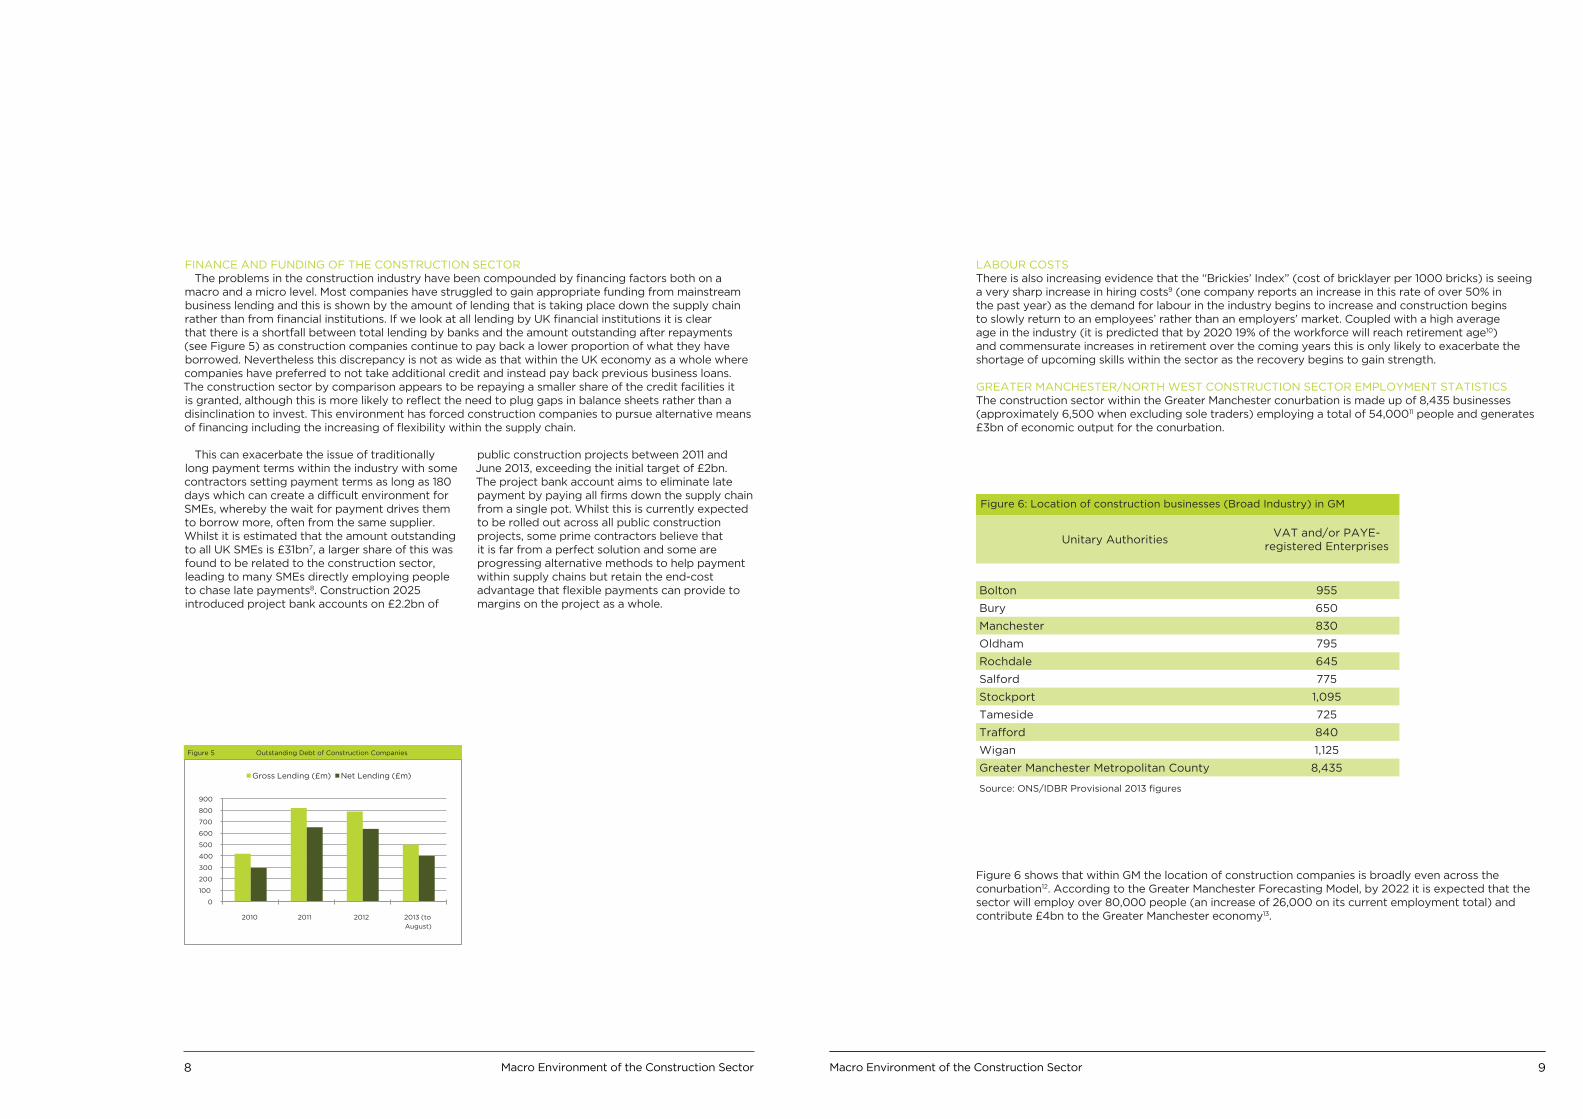
Since 2008 the construction industry has endured two negative periods of contraction; the first was the direct consequence of the credit crunch when new private construction projects diminished. This was, initially, alleviated by continued public sector construction projects up until the 2010 election, after which a reduction of public spending on buildings and infrastructure (alongside the cancellation of existing public construction schemes such as Building Schools for the Future) caused large-scale contraction within the industry. The period between 2008 and 2012 witnessed a 30% fall in construction output by value to £6.443bn (see Figure 2); this situation was exacerbated by the fact that the public sector commissioned 40% of total construction output before the 2010 election. In addition, between 2007 and 2011 the construction sector’s contribution to overall UK GVA declined from 8.9% to 6.7%.
The first half of 2013 saw an 8% rise in North West construction output on the same period of the previous year, to a total of £3.402bn4, indicative of the gradual overall economic recovery in the region and representative of the 1% growth in construction starts in the year to August 20135. The national picture shows that the lack of public investment continues to be a drag on the sector with a fall in social housing and non-residential building starts. This drag on output continues to be offset by a strong private sector recovery elsewhere, particularly with civil engineering and infrastructure starts. This picture of recovery, although not as stark, is reflected in the North West where infrastructure and private housing starts are beginning a gradual recovery in 2013 (see Figure 3). Public housing starts in the North West are only slowly recovering as local government finances remain heavily constrained. (See Methodology part 1)
UK infrastructure, though, remains hugely skewed towards London and the South East with 70% more construction starts by value in the first half of 2013 compared to the North West. The situation has been compounded by the fact that public infrastructure investment per capita in London is 20 times that of the equivalent figure in the North West6. This is shown in Figure 4 where London and the South East have almost twice the amount of infrastructure starts by value over most other English regions (with the exception of Yorkshire and the Humber). When ordered by percentage change on the same period last year, it is clear that the North East and North West have seen the largest increases in infrastructure starts (albeit from a low original base). This underlies the fact that an increase in construction starts is beginning to penetrate the hardest hit regions of the UK.
MACRO ENVIRONMENT OF THE CONSTRUCTION SECTOR
Figure 2 North West Construction Output
-20
-15
-10
-5
0
5
10
15
0
500
1000
1500
2000
2500
3000
2008 Q1 2009 Q1 2010 Q1 2010 Q1 2011 Q1 2013 Q1
NW Construction Output (£m) % change q/q
Figure 3 North West Construction Starts (£m)
0
100
200
300
400
500
600
700
800
900
2008
Q1 2008
Q3 2009
Q1 2009
Q3 2010
Q1 2010
Q32010
Q12010
Q32011
Q1 2011
Q32013
Q1
Public Housing Private Housing Infrastructure
Figure 4 Regional Infrastructure Starts (£m)
0
200
400
600
800
1000
1200
1400
NE NW SW London
& SE
YH EE EM WM
H1 2012 H1 2013
7Employer Engagement6 Macro Environment of the Construction Sector
FINANCE AND FUNDING OF THE CONSTRUCTION SECTORThe problems in the construction industry have been compounded by financing factors both on a
macro and a micro level. Most companies have struggled to gain appropriate funding from mainstream business lending and this is shown by the amount of lending that is taking place down the supply chain rather than from financial institutions. If we look at all lending by UK financial institutions it is clear that there is a shortfall between total lending by banks and the amount outstanding after repayments (see Figure 5) as construction companies continue to pay back a lower proportion of what they have borrowed. Nevertheless this discrepancy is not as wide as that within the UK economy as a whole where companies have preferred to not take additional credit and instead pay back previous business loans. The construction sector by comparison appears to be repaying a smaller share of the credit facilities it is granted, although this is more likely to reflect the need to plug gaps in balance sheets rather than a disinclination to invest. This environment has forced construction companies to pursue alternative means of financing including the increasing of flexibility within the supply chain.
This can exacerbate the issue of traditionally long payment terms within the industry with some contractors setting payment terms as long as 180 days which can create a difficult environment for SMEs, whereby the wait for payment drives them to borrow more, often from the same supplier. Whilst it is estimated that the amount outstanding to all UK SMEs is £31bn7, a larger share of this was found to be related to the construction sector, leading to many SMEs directly employing people to chase late payments8. Construction 2025 introduced project bank accounts on £2.2bn of
public construction projects between 2011 and June 2013, exceeding the initial target of £2bn. The project bank account aims to eliminate late payment by paying all firms down the supply chain from a single pot. Whilst this is currently expected to be rolled out across all public construction projects, some prime contractors believe that it is far from a perfect solution and some are progressing alternative methods to help payment within supply chains but retain the end-cost advantage that flexible payments can provide to margins on the project as a whole.
Figure 5 Outstanding Debt of Construction Companies
0
100
200
300
400
500
600
700
800
900
2010 2011 2012 2013 (to
August)
Gross Lending (£m) Net Lending (£m)
Figure 6 shows that within GM the location of construction companies is broadly even across the conurbation12. According to the Greater Manchester Forecasting Model, by 2022 it is expected that the sector will employ over 80,000 people (an increase of 26,000 on its current employment total) and contribute £4bn to the Greater Manchester economy13.
LABOUR COSTSThere is also increasing evidence that the “Brickies’ Index” (cost of bricklayer per 1000 bricks) is seeing a very sharp increase in hiring costs9 (one company reports an increase in this rate of over 50% in the past year) as the demand for labour in the industry begins to increase and construction begins to slowly return to an employees’ rather than an employers’ market. Coupled with a high average age in the industry (it is predicted that by 2020 19% of the workforce will reach retirement age10) and commensurate increases in retirement over the coming years this is only likely to exacerbate the shortage of upcoming skills within the sector as the recovery begins to gain strength.
GREATER MANCHESTER/NORTH WEST CONSTRUCTION SECTOR EMPLOYMENT STATISTICSThe construction sector within the Greater Manchester conurbation is made up of 8,435 businesses (approximately 6,500 when excluding sole traders) employing a total of 54,00011 people and generates £3bn of economic output for the conurbation.
Unitary AuthoritiesVAT and/or PAYE-
registered Enterprises
Bolton 955
Bury 650
Manchester 830
Oldham 795
Rochdale 645
Salford 775
Stockport 1,095
Tameside 725
Trafford 840
Wigan 1,125
Greater Manchester Metropolitan County 8,435
Source: ONS/IDBR Provisional 2013 figures
Figure 6: Location of construction businesses (Broad Industry) in GM
98 Macro Environment of the Construction Sector Macro Environment of the Construction Sector
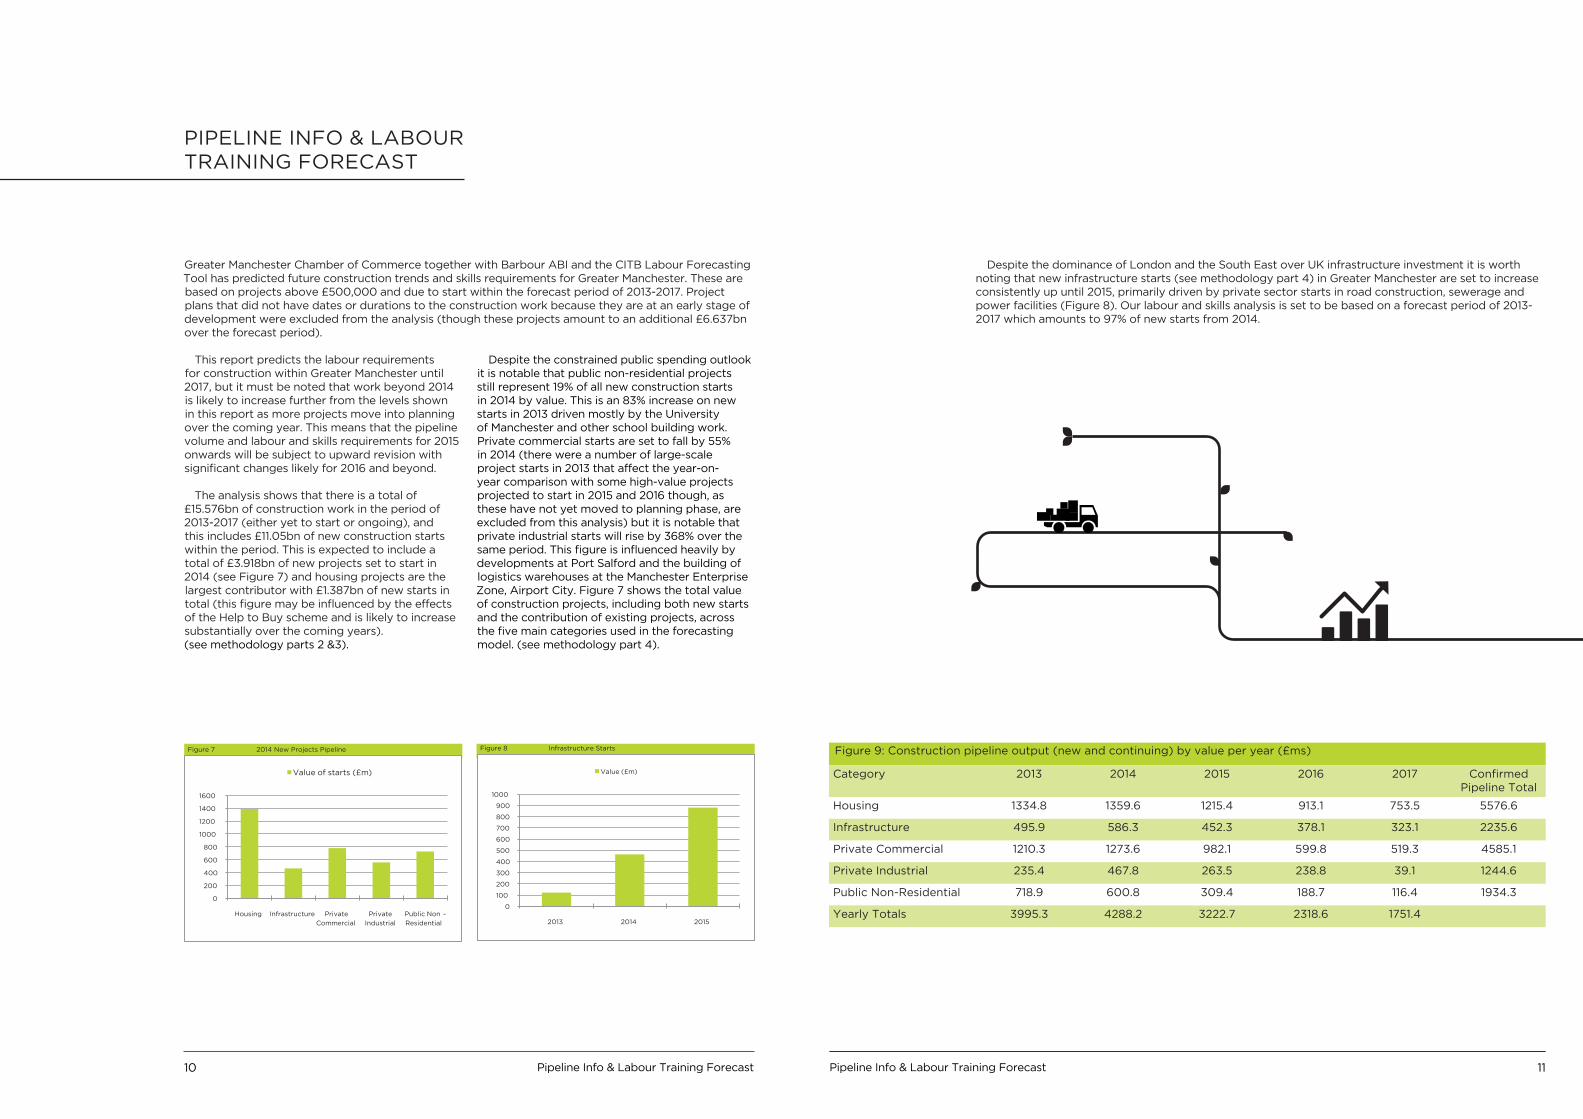
Greater Manchester Chamber of Commerce together with Barbour ABI and the CITB Labour Forecasting Tool has predicted future construction trends and skills requirements for Greater Manchester. These are based on projects above £500,000 and due to start within the forecast period of 2013-2017. Project plans that did not have dates or durations to the construction work because they are at an early stage of development were excluded from the analysis (though these projects amount to an additional £6.637bn over the forecast period).
This report predicts the labour requirements for construction within Greater Manchester until 2017, but it must be noted that work beyond 2014 is likely to increase further from the levels shown in this report as more projects move into planning over the coming year. This means that the pipeline volume and labour and skills requirements for 2015 onwards will be subject to upward revision with significant changes likely for 2016 and beyond.
The analysis shows that there is a total of £15.576bn of construction work in the period of 2013-2017 (either yet to start or ongoing), and this includes £11.05bn of new construction starts within the period. This is expected to include a total of £3.918bn of new projects set to start in 2014 (see Figure 7) and housing projects are the largest contributor with £1.387bn of new starts in total (this figure may be influenced by the effects of the Help to Buy scheme and is likely to increase substantially over the coming years). (see methodology parts 2 &3).
Despite the constrained public spending outlook it is notable that public non-residential projects still represent 19% of all new construction starts in 2014 by value. This is an 83% increase on new starts in 2013 driven mostly by the University of Manchester and other school building work. Private commercial starts are set to fall by 55% in 2014 (there were a number of large-scale project starts in 2013 that affect the year-on-year comparison with some high-value projects projected to start in 2015 and 2016 though, as these have not yet moved to planning phase, are excluded from this analysis) but it is notable that private industrial starts will rise by 368% over the same period. This figure is influenced heavily by developments at Port Salford and the building of logistics warehouses at the Manchester Enterprise Zone, Airport City. Figure 7 shows the total value of construction projects, including both new starts and the contribution of existing projects, across the five main categories used in the forecasting model. (see methodology part 4).
PIPELINE INFO & LABOUR TRAINING FORECAST
Figure 8 Infrastructure Starts
0
100
200
300
400
500
600
700
800
900
1000
2013 2014 2015
Value (£m)
Figure 7 2014 New Projects Pipeline
0
200
400
600
800
1000
1200
1400
1600
Housing Infrastructure Private
Commercial
Private
Industrial
Public Non -
Residential
Value of starts (£m)
Despite the dominance of London and the South East over UK infrastructure investment it is worth noting that new infrastructure starts (see methodology part 4) in Greater Manchester are set to increase consistently up until 2015, primarily driven by private sector starts in road construction, sewerage and power facilities (Figure 8). Our labour and skills analysis is set to be based on a forecast period of 2013-2017 which amounts to 97% of new starts from 2014.
Category 2013 2014 2015 2016 2017 Confirmed Pipeline Total
Housing 1334.8 1359.6 1215.4 913.1 753.5 5576.6
Infrastructure 495.9 586.3 452.3 378.1 323.1 2235.6
Private Commercial 1210.3 1273.6 982.1 599.8 519.3 4585.1
Private Industrial 235.4 467.8 263.5 238.8 39.1 1244.6
Public Non-Residential 718.9 600.8 309.4 188.7 116.4 1934.3
Yearly Totals 3995.3 4288.2 3222.7 2318.6 1751.4
Figure 9: Construction pipeline output (new and continuing) by value per year (£ms)
Pipeline Info & Labour Training Forecast 11Pipeline Info & Labour Training Forecast10
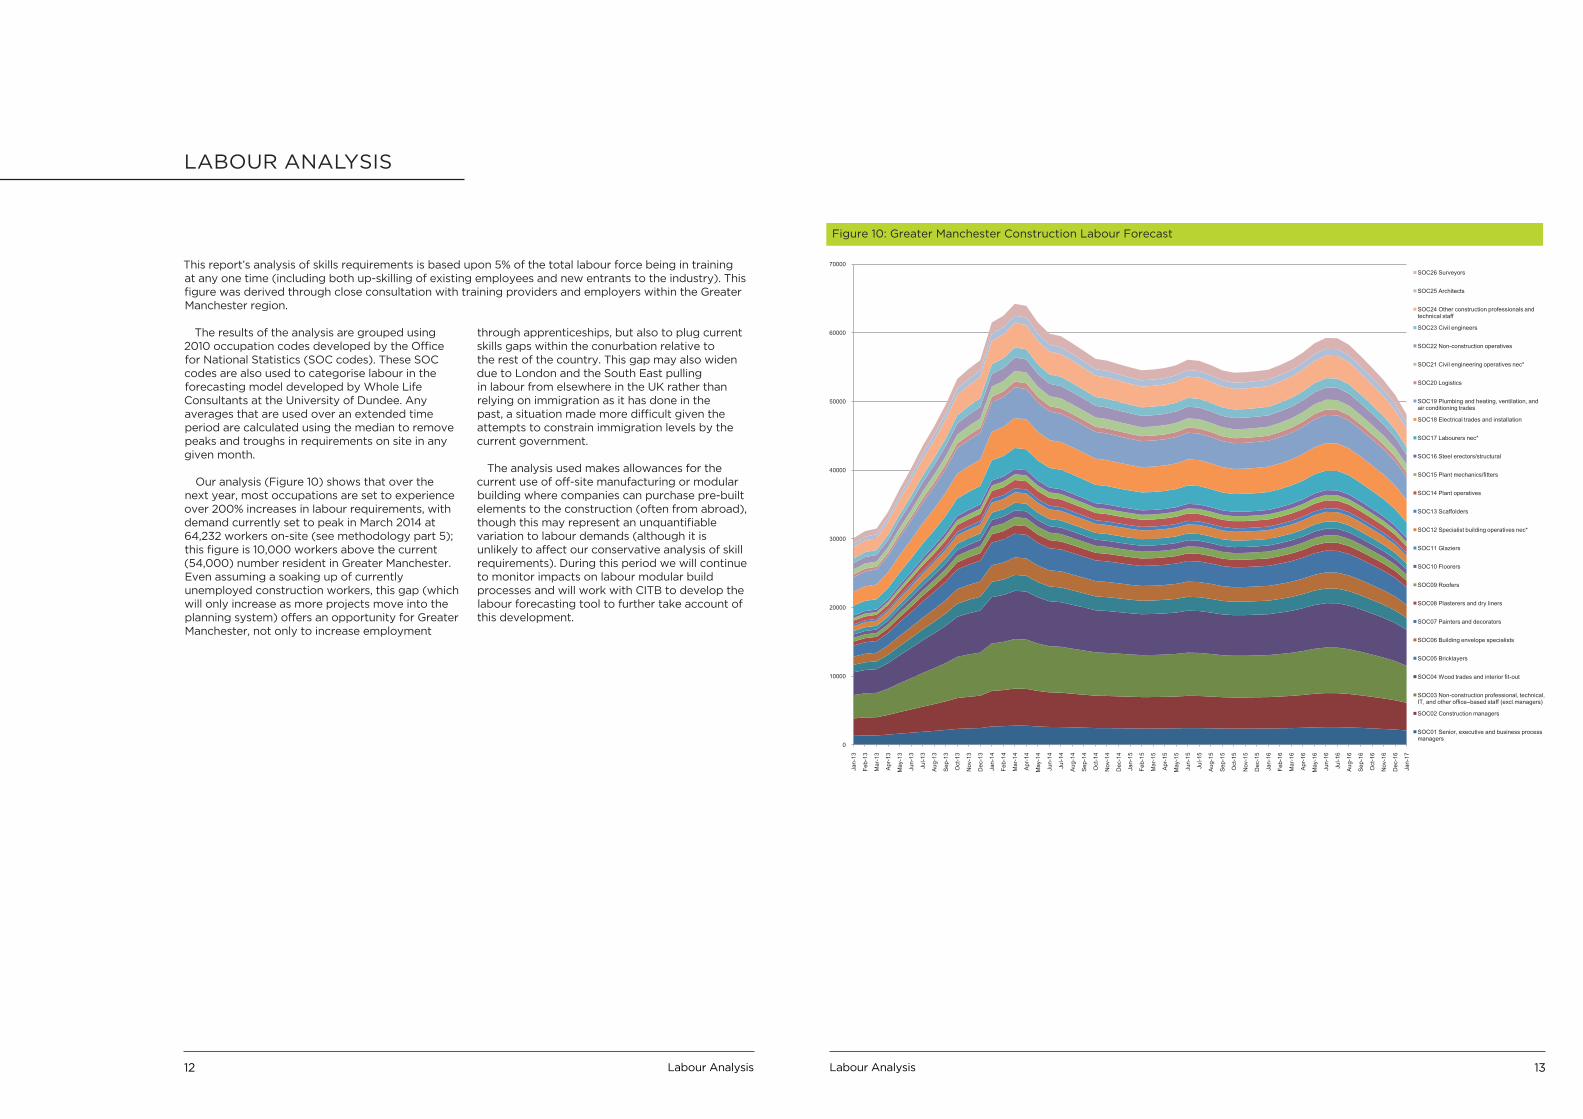
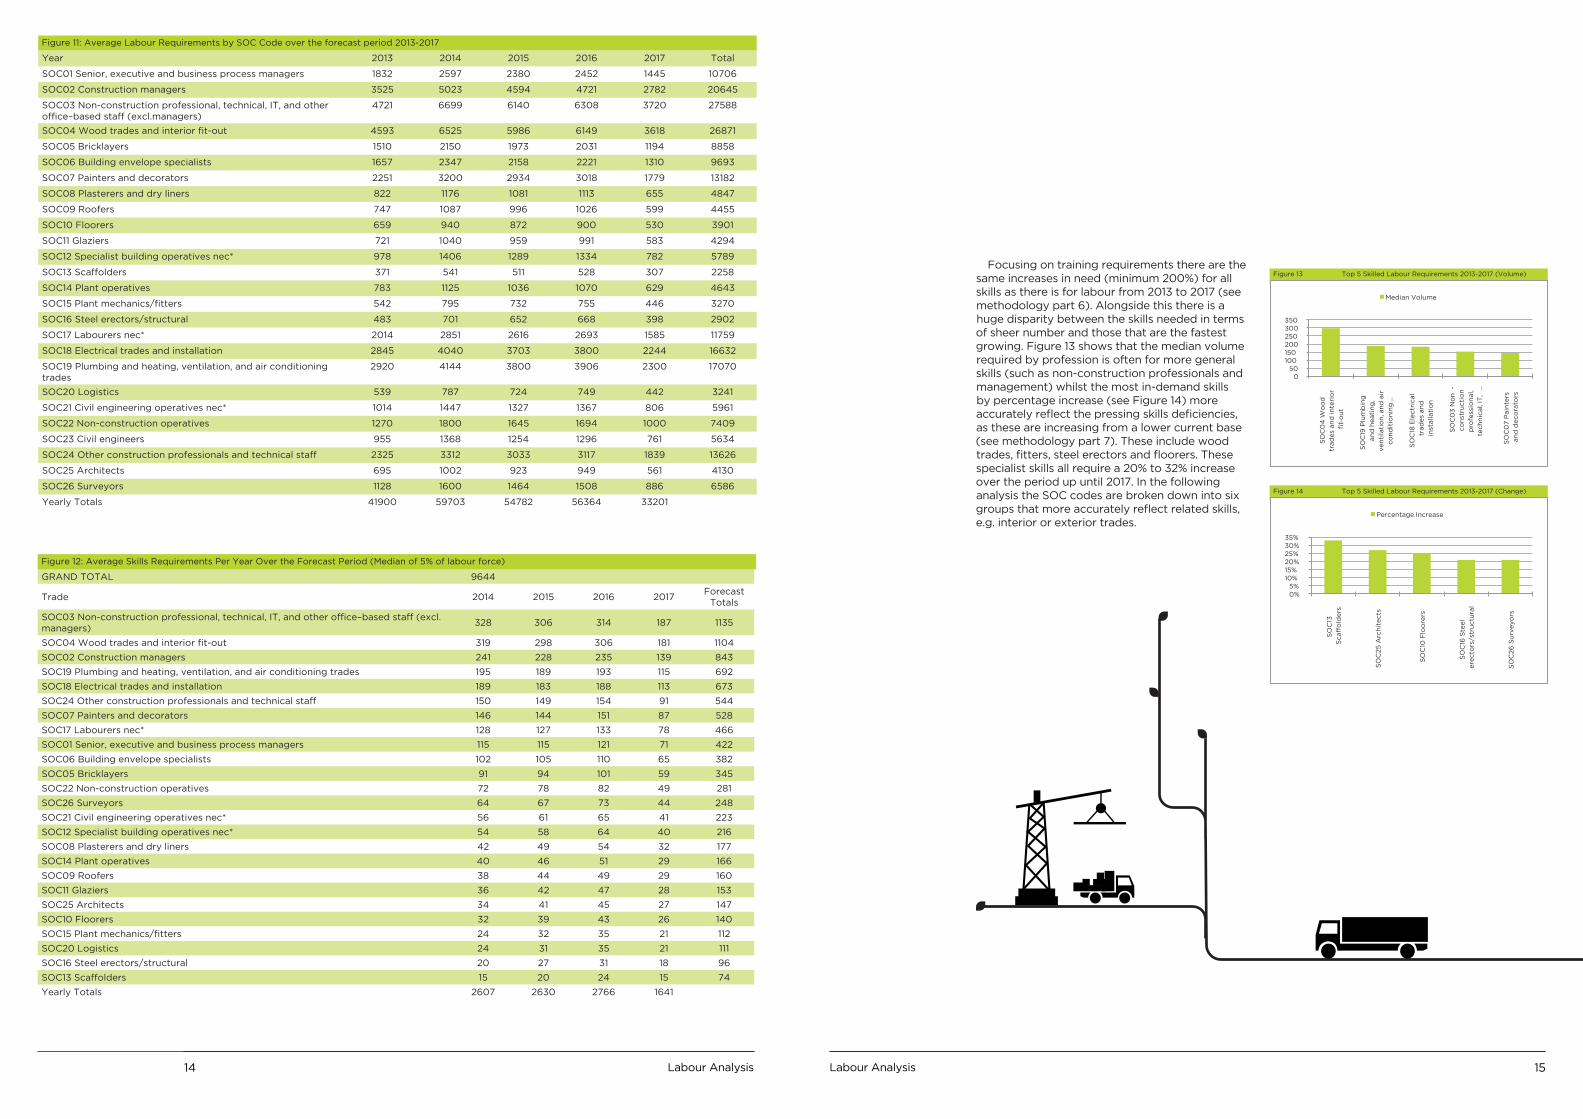
This report’s analysis of skills requirements is based upon 5% of the total labour force being in training at any one time (including both up-skilling of existing employees and new entrants to the industry). This figure was derived through close consultation with training providers and employers within the Greater Manchester region.
The results of the analysis are grouped using 2010 occupation codes developed by the Office for National Statistics (SOC codes). These SOC codes are also used to categorise labour in the forecasting model developed by Whole Life Consultants at the University of Dundee. Any averages that are used over an extended time period are calculated using the median to remove peaks and troughs in requirements on site in any given month.
Our analysis (Figure 10) shows that over the next year, most occupations are set to experience over 200% increases in labour requirements, with demand currently set to peak in March 2014 at 64,232 workers on-site (see methodology part 5); this figure is 10,000 workers above the current (54,000) number resident in Greater Manchester. Even assuming a soaking up of currently unemployed construction workers, this gap (which will only increase as more projects move into the planning system) offers an opportunity for Greater Manchester, not only to increase employment
through apprenticeships, but also to plug current skills gaps within the conurbation relative to the rest of the country. This gap may also widen due to London and the South East pulling in labour from elsewhere in the UK rather than relying on immigration as it has done in the past, a situation made more difficult given the attempts to constrain immigration levels by the current government.
The analysis used makes allowances for the current use of off-site manufacturing or modular building where companies can purchase pre-built elements to the construction (often from abroad), though this may represent an unquantifiable variation to labour demands (although it is unlikely to affect our conservative analysis of skill requirements). During this period we will continue to monitor impacts on labour modular build processes and will work with CITB to develop the labour forecasting tool to further take account of this development.
LABOUR ANALYSIS
0
10000
20000
30000
40000
50000
60000
70000
Jan-
13
Feb-
13
Mar
-13
Apr-
13
May
-13
Jun -
13
Jul-1
3
Aug-
13
Sep-
13
Oct
-13
Nov
-13
Dec
-13
Jan-
14
Feb-
14
Mar
-14
Apr-
14
May
-14
Jun -
14
Jul -1
4
Aug-
14
Sep-
14
Oct
-14
Nov
-14
Dec
-14
Jan -
15
Feb-
15
Mar
-15
Apr-
15
May
-15
Jun -
15
Jul-1
5
Aug-
15
Sep-
15
Oct
-15
Nov
-15
Dec
-15
Jan-
16
Feb-
16
Mar
-16
Apr-
16
May
-16
Jun-
16
Jul-1
6
Aug-
16
Sep-
16
Oct
-16
Nov
-16
Dec
-16
Jan-
17
SOC26 Surveyors
SOC25 Architects
SOC24 Other construction professionals and technical staff
SOC23 Civil engineers
SOC22 Non-construction operatives
SOC21 Civil engineering operatives nec*
SOC20 Logistics
SOC19 Plumbing and heating, ventilation, and air conditioning trades
SOC18 Electrical trades and installation
SOC17 Labourers nec*
SOC16 Steel erectors/structural
SOC15 Plant mechanics/fitters
SOC14 Plant operatives
SOC13 Scaffolders
SOC12 Specialist building operatives nec*
SOC11 Glaziers
SOC10 Floorers
SOC09 Roofers
SOC08 Plasterers and dry liners
SOC07 Painters and decorators
SOC06 Building envelope specialists
SOC05 Bricklayers
SOC04 Wood trades and interior fit-out
SOC03 Non-construction professional, technical, IT, and other office–based staff (excl.managers)
SOC02 Construction managers
SOC01 Senior, executive and business process managers
Figure 10: Greater Manchester Construction Labour Forecast
Labour Analysis 13Labour Analysis12
Year 2013 2014 2015 2016 2017 Total
SOC01 Senior, executive and business process managers 1832 2597 2380 2452 1445 10706
SOC02 Construction managers 3525 5023 4594 4721 2782 20645
SOC03 Non-construction professional, technical, IT, and other office–based staff (excl.managers)
4721 6699 6140 6308 3720 27588
SOC04 Wood trades and interior fit-out 4593 6525 5986 6149 3618 26871
SOC05 Bricklayers 1510 2150 1973 2031 1194 8858
SOC06 Building envelope specialists 1657 2347 2158 2221 1310 9693
SOC07 Painters and decorators 2251 3200 2934 3018 1779 13182
SOC08 Plasterers and dry liners 822 1176 1081 1113 655 4847
SOC09 Roofers 747 1087 996 1026 599 4455
SOC10 Floorers 659 940 872 900 530 3901
SOC11 Glaziers 721 1040 959 991 583 4294
SOC12 Specialist building operatives nec* 978 1406 1289 1334 782 5789
SOC13 Scaffolders 371 541 511 528 307 2258
SOC14 Plant operatives 783 1125 1036 1070 629 4643
SOC15 Plant mechanics/fitters 542 795 732 755 446 3270
SOC16 Steel erectors/structural 483 701 652 668 398 2902
SOC17 Labourers nec* 2014 2851 2616 2693 1585 11759
SOC18 Electrical trades and installation 2845 4040 3703 3800 2244 16632
SOC19 Plumbing and heating, ventilation, and air conditioning trades
2920 4144 3800 3906 2300 17070
SOC20 Logistics 539 787 724 749 442 3241
SOC21 Civil engineering operatives nec* 1014 1447 1327 1367 806 5961
SOC22 Non-construction operatives 1270 1800 1645 1694 1000 7409
SOC23 Civil engineers 955 1368 1254 1296 761 5634
SOC24 Other construction professionals and technical staff 2325 3312 3033 3117 1839 13626
SOC25 Architects 695 1002 923 949 561 4130
SOC26 Surveyors 1128 1600 1464 1508 886 6586
Yearly Totals 41900 59703 54782 56364 33201
Figure 11: Average Labour Requirements by SOC Code over the forecast period 2013-2017
GRAND TOTAL 9644
Trade 2014 2015 2016 2017Forecast
Totals
SOC03 Non-construction professional, technical, IT, and other office–based staff (excl.managers)
328 306 314 187 1135
SOC04 Wood trades and interior fit-out 319 298 306 181 1104
SOC02 Construction managers 241 228 235 139 843
SOC19 Plumbing and heating, ventilation, and air conditioning trades 195 189 193 115 692
SOC18 Electrical trades and installation 189 183 188 113 673
SOC24 Other construction professionals and technical staff 150 149 154 91 544
SOC07 Painters and decorators 146 144 151 87 528
SOC17 Labourers nec* 128 127 133 78 466
SOC01 Senior, executive and business process managers 115 115 121 71 422
SOC06 Building envelope specialists 102 105 110 65 382
SOC05 Bricklayers 91 94 101 59 345
SOC22 Non-construction operatives 72 78 82 49 281
SOC26 Surveyors 64 67 73 44 248
SOC21 Civil engineering operatives nec* 56 61 65 41 223
SOC12 Specialist building operatives nec* 54 58 64 40 216
SOC08 Plasterers and dry liners 42 49 54 32 177
SOC14 Plant operatives 40 46 51 29 166
SOC09 Roofers 38 44 49 29 160
SOC11 Glaziers 36 42 47 28 153
SOC25 Architects 34 41 45 27 147
SOC10 Floorers 32 39 43 26 140
SOC15 Plant mechanics/fitters 24 32 35 21 112
SOC20 Logistics 24 31 35 21 111
SOC16 Steel erectors/structural 20 27 31 18 96
SOC13 Scaffolders 15 20 24 15 74
Yearly Totals 2607 2630 2766 1641
Figure 12: Average Skills Requirements Per Year Over the Forecast Period (Median of 5% of labour force)
Focusing on training requirements there are the same increases in need (minimum 200%) for all skills as there is for labour from 2013 to 2017 (see methodology part 6). Alongside this there is a huge disparity between the skills needed in terms of sheer number and those that are the fastest growing. Figure 13 shows that the median volume required by profession is often for more general skills (such as non-construction professionals and management) whilst the most in-demand skills by percentage increase (see Figure 14) more accurately reflect the pressing skills deficiencies, as these are increasing from a lower current base (see methodology part 7). These include wood trades, fitters, steel erectors and floorers. These specialist skills all require a 20% to 32% increase over the period up until 2017. In the following analysis the SOC codes are broken down into six groups that more accurately reflect related skills, e.g. interior or exterior trades.
Figure 14 Top 5 Skilled Labour Requirements 2013-2017 (Change)
0%5%
10%15%20%25%30%35%
SO
C13
Scaff
old
ers
SO
C25
Arc
hit
ects
SO
C10
Flo
ore
rs
SO
C16
Ste
el
ere
cto
rs/s
tru
ctu
ral
SO
C2
6 S
urv
eyo
rs
Percentage Increase
Figure 13 Top 5 Skilled Labour Requirements 2013-2017 (Volume)
050
100150200250300350
SO
C0
4 W
oo
d
trad
es
an
d in
teri
or
fit-
ou
t
SO
C19
Plu
mb
ing
an
d h
eati
ng
,
ven
tila
tio
n, a
nd
air
co
nd
itio
nin
g …
SO
C18
Ele
ctr
ical
trad
es
an
d
inst
allati
on
SO
C0
3 N
on
-
co
nst
ructi
on
pro
fess
ion
al,
tech
nic
al,
IT,
…
SO
C0
7 P
ain
ters
an
d d
eco
rato
rs
Median Volume
Labour Analysis 15Labour Analysis14
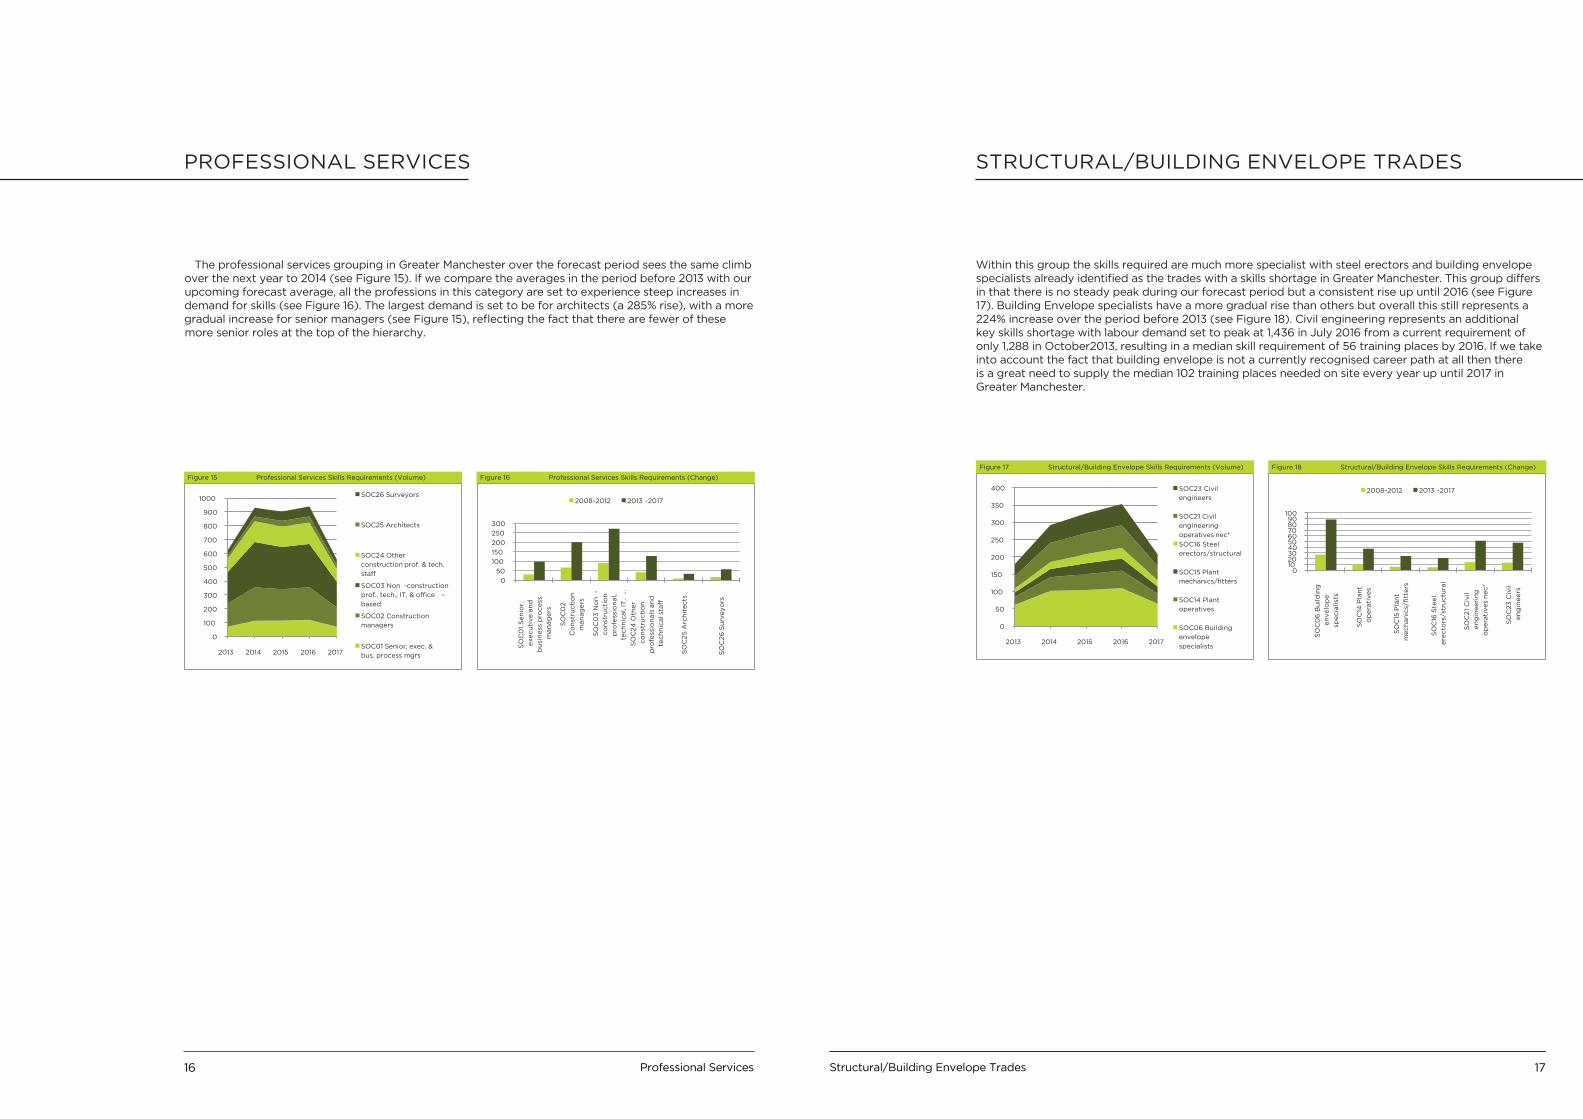
The professional services grouping in Greater Manchester over the forecast period sees the same climb over the next year to 2014 (see Figure 15). If we compare the averages in the period before 2013 with our upcoming forecast average, all the professions in this category are set to experience steep increases in demand for skills (see Figure 16). The largest demand is set to be for architects (a 285% rise), with a more gradual increase for senior managers (see Figure 15), reflecting the fact that there are fewer of these more senior roles at the top of the hierarchy.
PROFESSIONAL SERVICES
Figure 16 Professional Services Skills Requirements (Change)
0
50
100
150
200
250
300S
OC
01
Sen
ior,
execu
tive a
nd
bu
sin
ess
pro
cess
man
ag
ers
SO
C0
2
Co
nst
ructi
on
man
ag
ers
SO
C0
3 N
on
-
co
nst
ructi
on
pro
fess
ion
al,
tech
nic
al,
IT,
…
SO
C24
Oth
er
co
nst
ructi
on
pro
fess
ion
als
an
d
tech
nic
al s
taff
SO
C2
5 A
rch
itects
SO
C26
Su
rveyo
rs
2008-2012 2013 -2017
Figure 15 Professional Services Skills Requirements (Volume)
0
100
200
300
400
500
600
700
800
900
1000
2013 2014 2015 2016 2017
SOC26 Surveyors
SOC25 Architects
SOC24 Other
construction prof. & tech.
staff
SOC03 Non -construction
prof., tech., IT, & office –
based
SOC02 Construction
managers
SOC01 Senior, exec. &
bus. process mgrs
Within this group the skills required are much more specialist with steel erectors and building envelope specialists already identified as the trades with a skills shortage in Greater Manchester. This group differs in that there is no steady peak during our forecast period but a consistent rise up until 2016 (see Figure 17). Building Envelope specialists have a more gradual rise than others but overall this still represents a 224% increase over the period before 2013 (see Figure 18). Civil engineering represents an additional key skills shortage with labour demand set to peak at 1,436 in July 2016 from a current requirement of only 1,288 in October2013, resulting in a median skill requirement of 56 training places by 2016. If we take into account the fact that building envelope is not a currently recognised career path at all then there is a great need to supply the median 102 training places needed on site every year up until 2017 in Greater Manchester.
STRUCTURAL/BUILDING ENVELOPE TRADES
Figure 17 Structural/Building Envelope Skills Requirements (Volume)
0
50
100
150
200
250
300
350
400
2013 2014 2015 2016 2017
SOC23 Civil
engineers
SOC21 Civil
engineering
operatives nec*
SOC16 Steel
erectors/structural
SOC15 Plant
mechanics/fitters
SOC14 Plant
operatives
SOC06 Building
envelope
specialists
Figure 18 Structural/Building Envelope Skills Requirements (Change)
0102030405060708090
100
SO
C0
6 B
uild
ing
en
velo
pe
specia
list
s
SO
C14
Pla
nt
op
era
tives
SO
C15
Pla
nt
mech
an
ics/fi
tters
SO
C16
Ste
el
ere
cto
rs/s
tru
ctu
ral
SO
C2
1 C
ivil
en
gin
eeri
ng
op
era
tives
nec*
SO
C2
3 C
ivil
en
gin
eers
2008-2012 2013 -2017
Structural/Building Envelope Trades 17Professional Services16
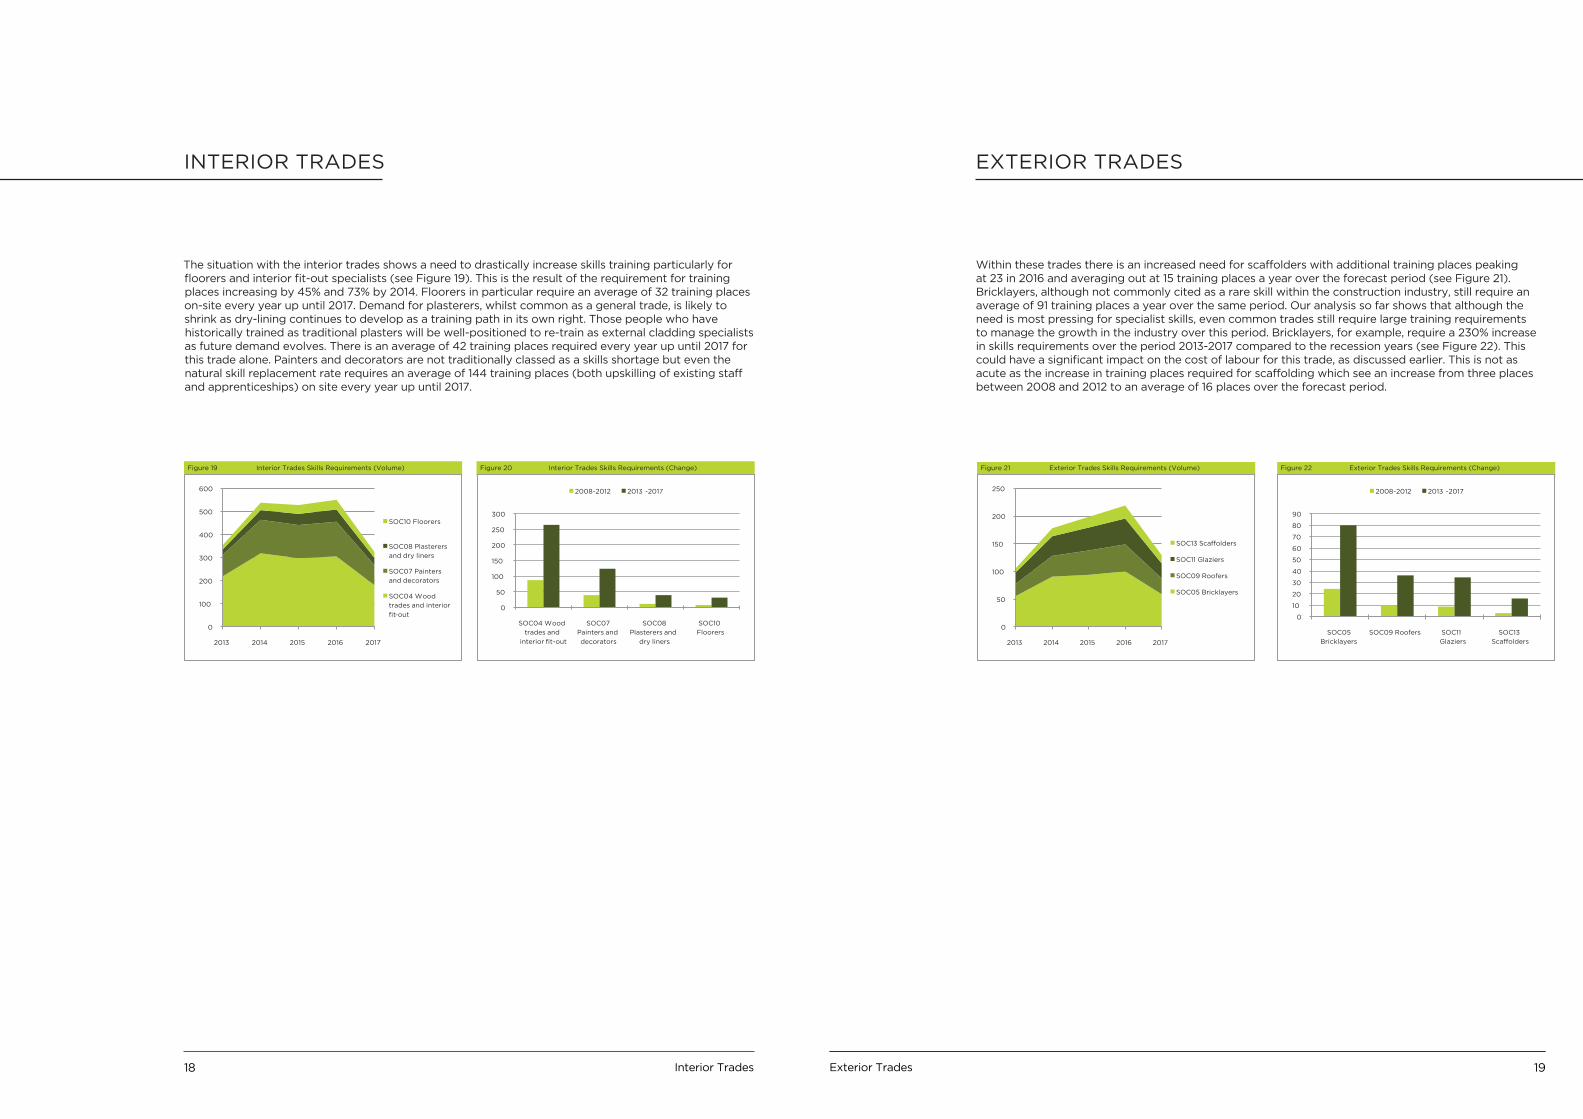
The situation with the interior trades shows a need to drastically increase skills training particularly for floorers and interior fit-out specialists (see Figure 19). This is the result of the requirement for training places increasing by 45% and 73% by 2014. Floorers in particular require an average of 32 training places on-site every year up until 2017. Demand for plasterers, whilst common as a general trade, is likely to shrink as dry-lining continues to develop as a training path in its own right. Those people who have historically trained as traditional plasters will be well-positioned to re-train as external cladding specialists as future demand evolves. There is an average of 42 training places required every year up until 2017 for this trade alone. Painters and decorators are not traditionally classed as a skills shortage but even the natural skill replacement rate requires an average of 144 training places (both upskilling of existing staff and apprenticeships) on site every year up until 2017.
INTERIOR TRADES
Figure 19 Interior Trades Skills Requirements (Volume)
0
100
200
300
400
500
600
2013 2014 2015 2016 2017
SOC10 Floorers
SOC08 Plasterers
and dry liners
SOC07 Painters
and decorators
SOC04 Wood
trades and interior
fit-out
Figure 20 Interior Trades Skills Requirements (Change)
0
50
100
150
200
250
300
SOC04 Wood
trades and
interior fit-out
SOC07
Painters and
decorators
SOC08
Plasterers and
dry liners
SOC10
Floorers
2008-2012 2013 -2017
Within these trades there is an increased need for scaffolders with additional training places peaking at 23 in 2016 and averaging out at 15 training places a year over the forecast period (see Figure 21). Bricklayers, although not commonly cited as a rare skill within the construction industry, still require an average of 91 training places a year over the same period. Our analysis so far shows that although the need is most pressing for specialist skills, even common trades still require large training requirements to manage the growth in the industry over this period. Bricklayers, for example, require a 230% increase in skills requirements over the period 2013-2017 compared to the recession years (see Figure 22). This could have a significant impact on the cost of labour for this trade, as discussed earlier. This is not as acute as the increase in training places required for scaffolding which see an increase from three places between 2008 and 2012 to an average of 16 places over the forecast period.
EXTERIOR TRADES
Figure 21 Exterior Trades Skills Requirements (Volume)
0
50
100
150
200
250
2013 2014 2015 2016 2017
SOC13 Scaffolders
SOC11 Glaziers
SOC09 Roofers
SOC05 Bricklayers
Figure 22 Exterior Trades Skills Requirements (Change)
0
10
20
30
40
50
60
70
80
90
SOC05
Bricklayers
SOC09 Roofers SOC11
Glaziers
SOC13
Scaffolders
2008-2012 2013 -2017
Exterior Trades 19Interior Trades18
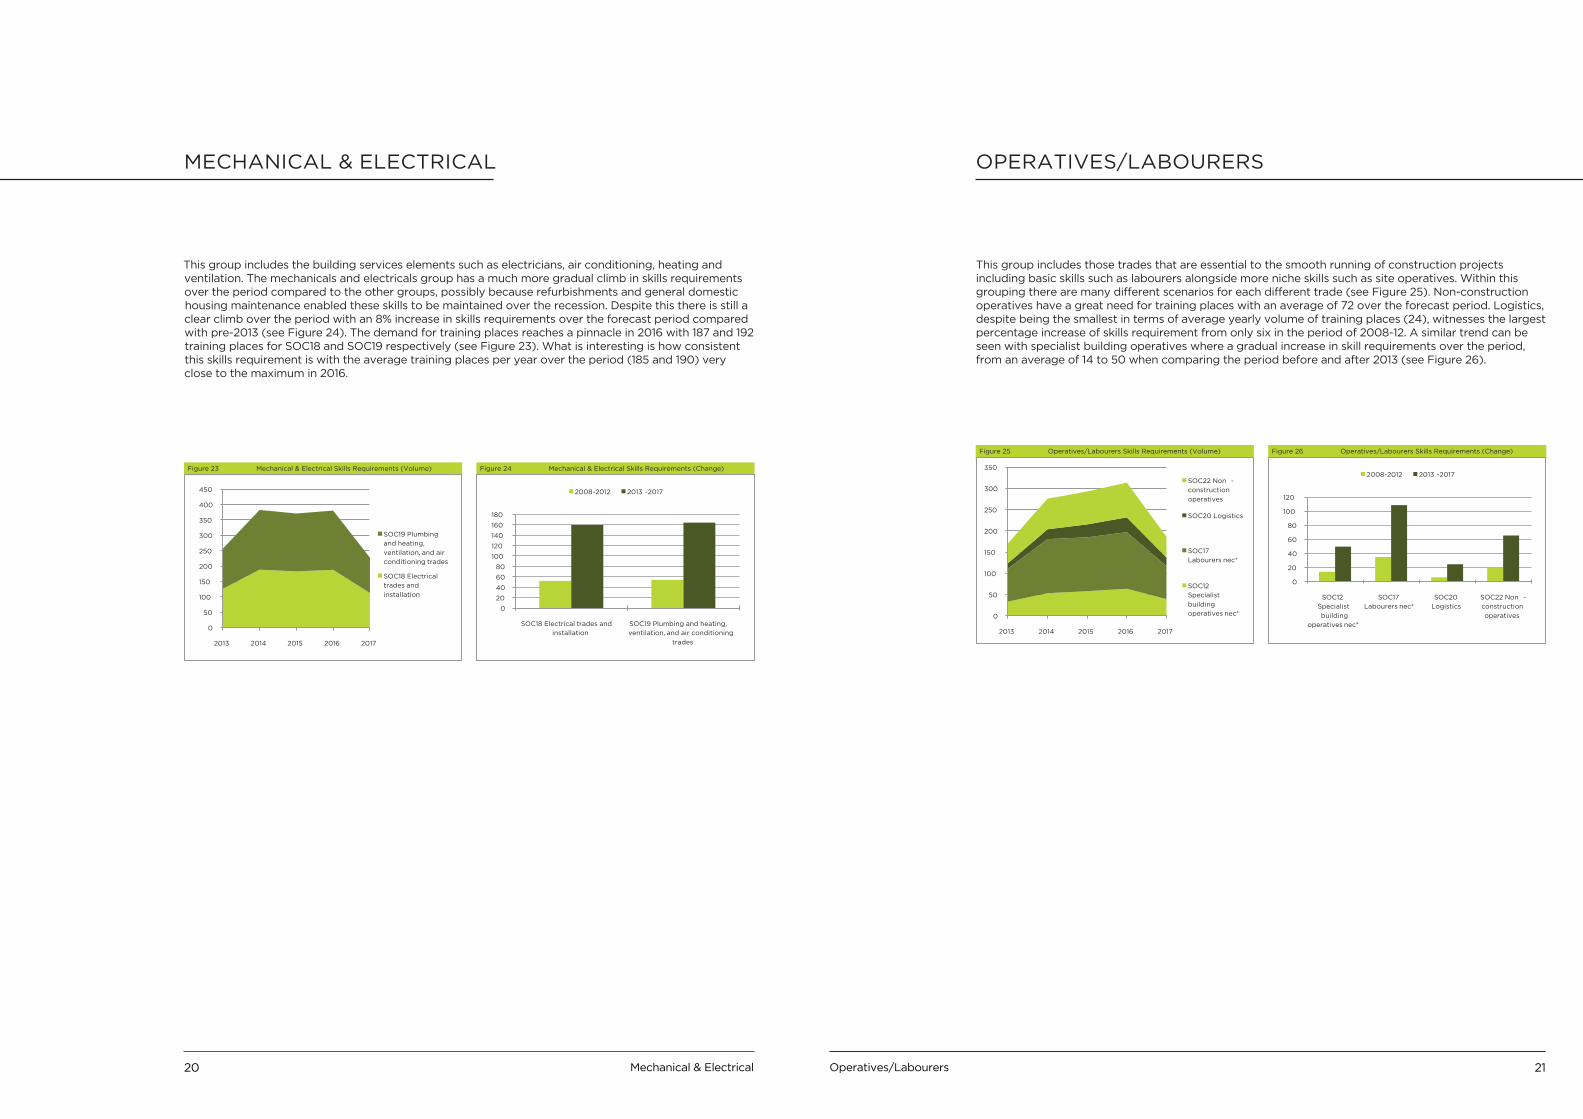
This group includes the building services elements such as electricians, air conditioning, heating and ventilation. The mechanicals and electricals group has a much more gradual climb in skills requirements over the period compared to the other groups, possibly because refurbishments and general domestic housing maintenance enabled these skills to be maintained over the recession. Despite this there is still a clear climb over the period with an 8% increase in skills requirements over the forecast period compared with pre-2013 (see Figure 24). The demand for training places reaches a pinnacle in 2016 with 187 and 192 training places for SOC18 and SOC19 respectively (see Figure 23). What is interesting is how consistent this skills requirement is with the average training places per year over the period (185 and 190) very close to the maximum in 2016.
MECHANICAL & ELECTRICAL
Figure 23 Mechanical & Electrical Skills Requirements (Volume)
0
50
100
150
200
250
300
350
400
450
2013 2014 2015 2016 2017
SOC19 Plumbing
and heating,
ventilation, and air
conditioning trades
SOC18 Electrical
trades and
installation
Figure 24 Mechanical & Electrical Skills Requirements (Change)
0
20
40
60
80
100
120
140
160
180
SOC18 Electrical trades and
installation
SOC19 Plumbing and heating,
ventilation, and air conditioning
trades
2008-2012 2013 -2017
This group includes those trades that are essential to the smooth running of construction projects including basic skills such as labourers alongside more niche skills such as site operatives. Within this grouping there are many different scenarios for each different trade (see Figure 25). Non-construction operatives have a great need for training places with an average of 72 over the forecast period. Logistics, despite being the smallest in terms of average yearly volume of training places (24), witnesses the largest percentage increase of skills requirement from only six in the period of 2008-12. A similar trend can be seen with specialist building operatives where a gradual increase in skill requirements over the period, from an average of 14 to 50 when comparing the period before and after 2013 (see Figure 26).
OPERATIVES/LABOURERS
Figure 25 Operatives/Labourers Skills Requirements (Volume)
0
50
100
150
200
250
300
350
2013 2014 2015 2016 2017
SOC22 Non -
construction
operatives
SOC20 Logistics
SOC17
Labourers nec*
SOC12
Specialist
building
operatives nec*
Figure 26 Operatives/Labourers Skills Requirements (Change)
0
20
40
60
80
100
120
SOC12
Specialist
building
operatives nec*
SOC17
Labourers nec*
SOC20
Logistics
SOC22 Non -
construction
operatives
2008-2012 2013 -2017
Operatives/Labourers 21Mechanical & Electrical20
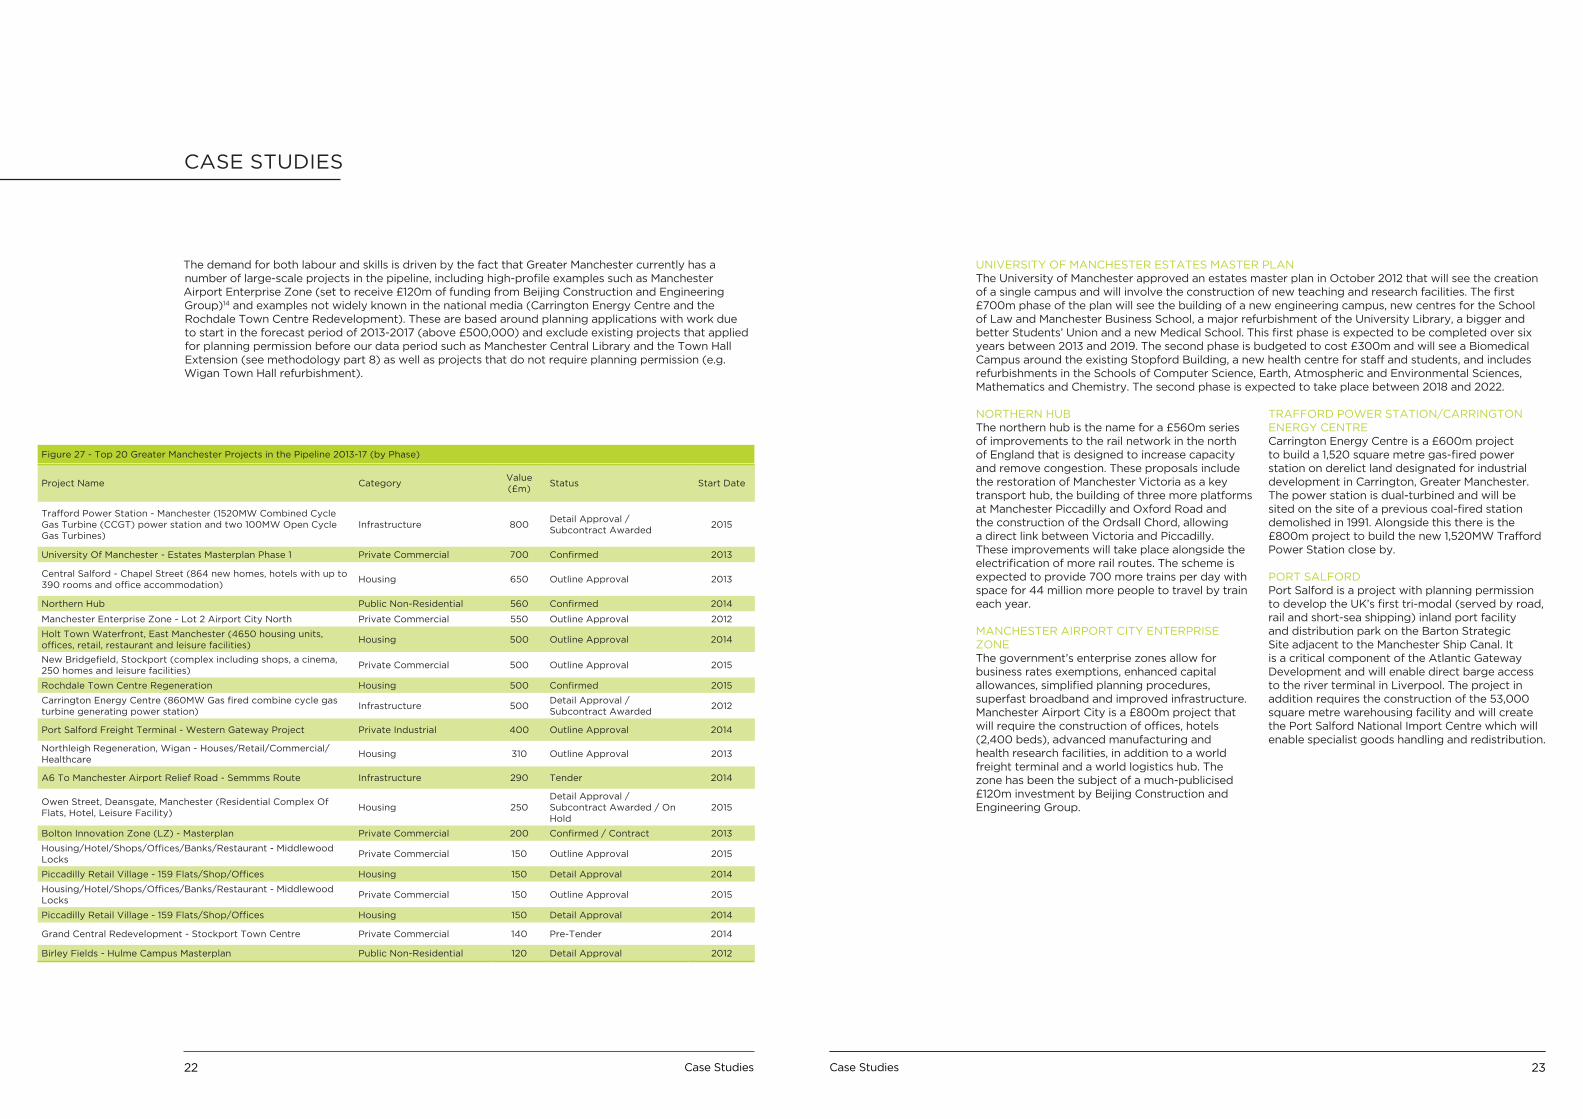
The demand for both labour and skills is driven by the fact that Greater Manchester currently has a number of large-scale projects in the pipeline, including high-profile examples such as Manchester Airport Enterprise Zone (set to receive £120m of funding from Beijing Construction and Engineering Group)14 and examples not widely known in the national media (Carrington Energy Centre and the Rochdale Town Centre Redevelopment). These are based around planning applications with work due to start in the forecast period of 2013-2017 (above £500,000) and exclude existing projects that applied for planning permission before our data period such as Manchester Central Library and the Town Hall Extension (see methodology part 8) as well as projects that do not require planning permission (e.g. Wigan Town Hall refurbishment).
CASE STUDIES
Project Name CategoryValue (£m)
Status Start Date
Trafford Power Station - Manchester (1520MW Combined Cycle Gas Turbine (CCGT) power station and two 100MW Open Cycle Gas Turbines)
Infrastructure 800Detail Approval / Subcontract Awarded
2015
University Of Manchester - Estates Masterplan Phase 1 Private Commercial 700 Confirmed 2013
Central Salford - Chapel Street (864 new homes, hotels with up to 390 rooms and office accommodation)
Housing 650 Outline Approval 2013
Northern Hub Public Non-Residential 560 Confirmed 2014
Manchester Enterprise Zone - Lot 2 Airport City North Private Commercial 550 Outline Approval 2012
Holt Town Waterfront, East Manchester (4650 housing units, offices, retail, restaurant and leisure facilities)
Housing 500 Outline Approval 2014
New Bridgefield, Stockport (complex including shops, a cinema, 250 homes and leisure facilities)
Private Commercial 500 Outline Approval 2015
Rochdale Town Centre Regeneration Housing 500 Confirmed 2015
Carrington Energy Centre (860MW Gas fired combine cycle gas turbine generating power station)
Infrastructure 500Detail Approval / Subcontract Awarded
2012
Port Salford Freight Terminal - Western Gateway Project Private Industrial 400 Outline Approval 2014
Northleigh Regeneration, Wigan - Houses/Retail/Commercial/Healthcare
Housing 310 Outline Approval 2013
A6 To Manchester Airport Relief Road - Semmms Route Infrastructure 290 Tender 2014
Owen Street, Deansgate, Manchester (Residential Complex Of Flats, Hotel, Leisure Facility)
Housing 250Detail Approval / Subcontract Awarded / On Hold
2015
Bolton Innovation Zone (LZ) - Masterplan Private Commercial 200 Confirmed / Contract 2013
Housing/Hotel/Shops/Offices/Banks/Restaurant - Middlewood Locks
Private Commercial 150 Outline Approval 2015
Piccadilly Retail Village - 159 Flats/Shop/Offices Housing 150 Detail Approval 2014
Housing/Hotel/Shops/Offices/Banks/Restaurant - Middlewood Locks
Private Commercial 150 Outline Approval 2015
Piccadilly Retail Village - 159 Flats/Shop/Offices Housing 150 Detail Approval 2014
Grand Central Redevelopment - Stockport Town Centre Private Commercial 140 Pre-Tender 2014
Birley Fields - Hulme Campus Masterplan Public Non-Residential 120 Detail Approval 2012
Figure 27 - Top 20 Greater Manchester Projects in the Pipeline 2013-17 (by Phase)
UNIVERSITY OF MANCHESTER ESTATES MASTER PLANThe University of Manchester approved an estates master plan in October 2012 that will see the creation of a single campus and will involve the construction of new teaching and research facilities. The first £700m phase of the plan will see the building of a new engineering campus, new centres for the School of Law and Manchester Business School, a major refurbishment of the University Library, a bigger and better Students’ Union and a new Medical School. This first phase is expected to be completed over six years between 2013 and 2019. The second phase is budgeted to cost £300m and will see a Biomedical Campus around the existing Stopford Building, a new health centre for staff and students, and includes refurbishments in the Schools of Computer Science, Earth, Atmospheric and Environmental Sciences, Mathematics and Chemistry. The second phase is expected to take place between 2018 and 2022.
NORTHERN HUBThe northern hub is the name for a £560m series of improvements to the rail network in the north of England that is designed to increase capacity and remove congestion. These proposals include the restoration of Manchester Victoria as a key transport hub, the building of three more platforms at Manchester Piccadilly and Oxford Road and the construction of the Ordsall Chord, allowing a direct link between Victoria and Piccadilly. These improvements will take place alongside the electrification of more rail routes. The scheme is expected to provide 700 more trains per day with space for 44 million more people to travel by train each year.
MANCHESTER AIRPORT CITY ENTERPRISE ZONEThe government’s enterprise zones allow for business rates exemptions, enhanced capital allowances, simplified planning procedures, superfast broadband and improved infrastructure. Manchester Airport City is a £800m project that will require the construction of offices, hotels (2,400 beds), advanced manufacturing and health research facilities, in addition to a world freight terminal and a world logistics hub. The zone has been the subject of a much-publicised £120m investment by Beijing Construction and Engineering Group.
TRAFFORD POWER STATION/CARRINGTON ENERGY CENTRECarrington Energy Centre is a £600m project to build a 1,520 square metre gas-fired power station on derelict land designated for industrial development in Carrington, Greater Manchester. The power station is dual-turbined and will be sited on the site of a previous coal-fired station demolished in 1991. Alongside this there is the £800m project to build the new 1,520MW Trafford Power Station close by.
PORT SALFORDPort Salford is a project with planning permission to develop the UK’s first tri-modal (served by road, rail and short-sea shipping) inland port facility and distribution park on the Barton Strategic Site adjacent to the Manchester Ship Canal. It is a critical component of the Atlantic Gateway Development and will enable direct barge access to the river terminal in Liverpool. The project in addition requires the construction of the 53,000 square metre warehousing facility and will create the Port Salford National Import Centre which will enable specialist goods handling and redistribution.
Case Studies 23Case Studies22
A6 RELIEF ROADThe A6 to Manchester Airport Relief Road Scheme will provide 10 kilometres of a new two-lane dual carriageway on an east-west route from the A6 near Hazel Grove (south east Stockport), via the four kilometres of existing A555 to Manchester Airport and the link road to the M56. The project is expected to increase connectivity and reduce congestion within the South-East Manchester area.Rochdale Town Centre RegenerationThe £500m regeneration of the east side of Rochdale town centre is expected to include the construction of hotel, shops, restaurants, a cinema and a 500-space car park spread across 300,000 sq ft. The project includes a £250m deal with developers Genr8 to transform the area around the current bus station and old ‘Black Box’ municipal offices. The Genr8 development forms part of a wider regeneration of Rochdale town centre, with major new and refurbished offices, a museum and new education district already completed. Regeneration has already started on this project with Number 1 Riverside winning the Greater Manchester Chamber of Commerce Building of the Year 2013.
HS2HS2 has yet to gain full parliamentary assent and as a result of it not making any GM planning applications, it is not included in the Barbour ABI pipeline. If the scheme does go ahead then it will make a massive contribution to both labour and skills demand in the conurbation. Phase Two is expected to provide an additional 1,400 permanent jobs in operation and maintenance and up to 10,000 jobs during construction. In addition Phase Two is expected to support a further 48,700-70,300 jobs and the creation of a further 5,200-7,600 homes. Its western leg alone is expected to provide up to 42,900 jobs in Manchester Piccadilly station supported employment.
CURRENT PROVISION ANALYSIS
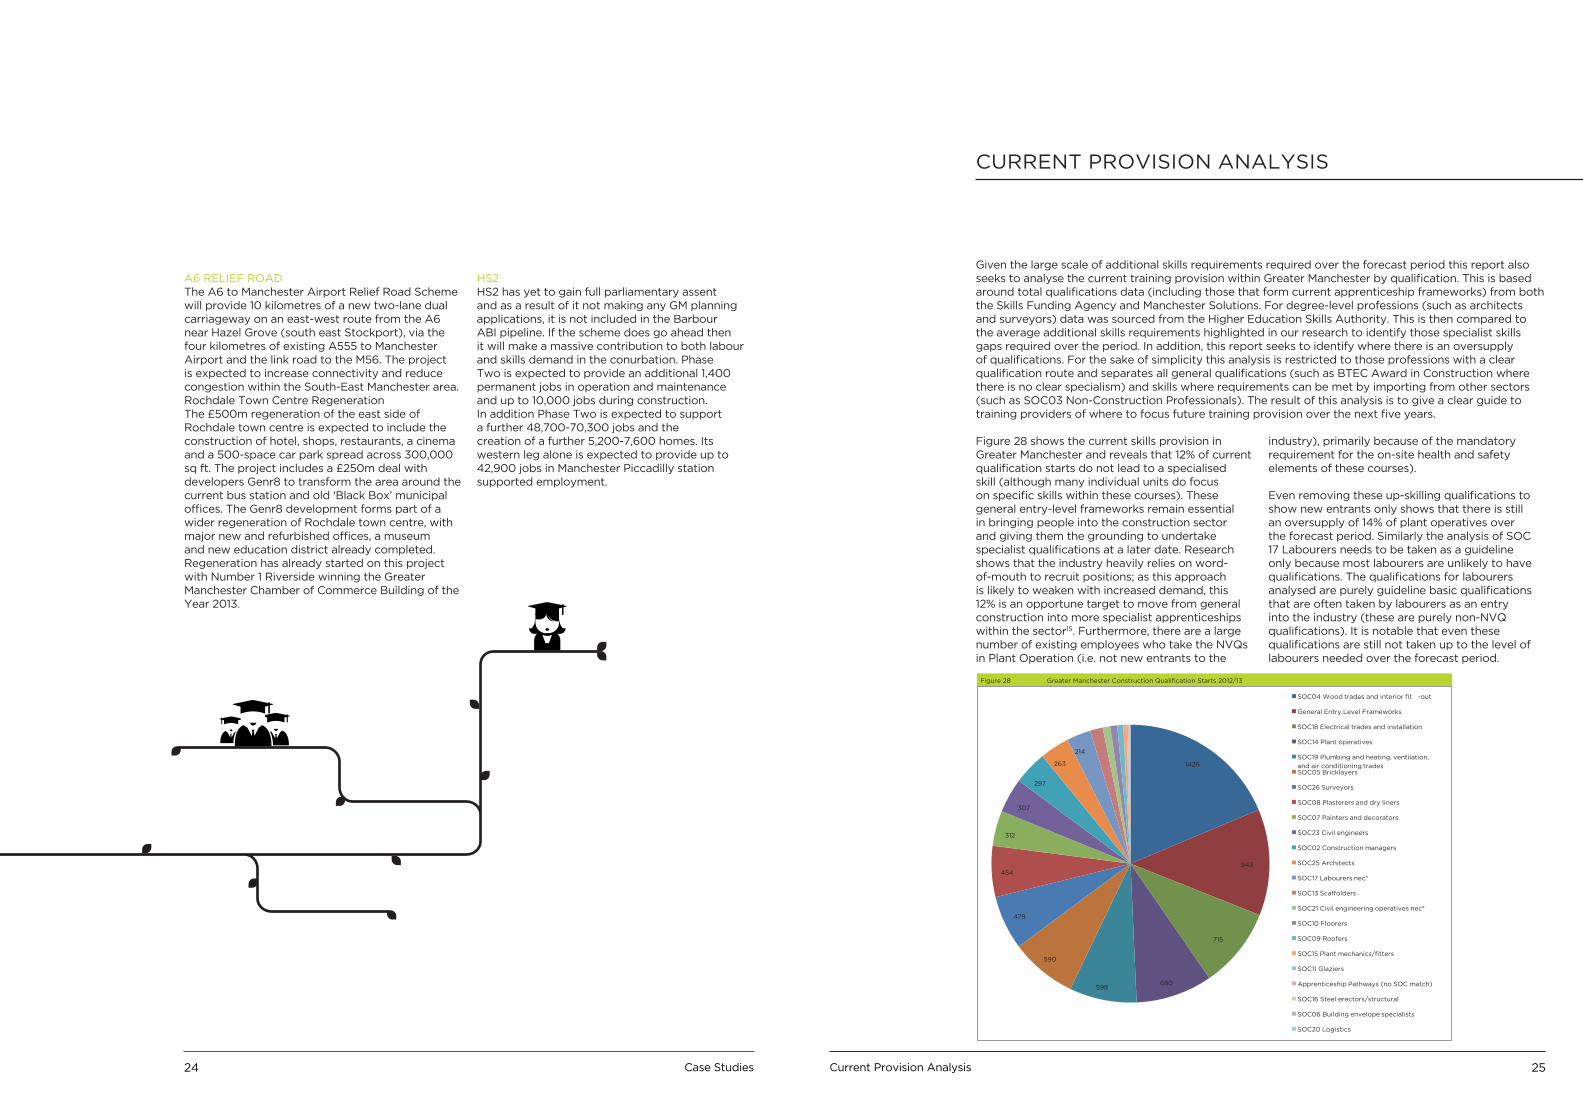
Given the large scale of additional skills requirements required over the forecast period this report also seeks to analyse the current training provision within Greater Manchester by qualification. This is based around total qualifications data (including those that form current apprenticeship frameworks) from both the Skills Funding Agency and Manchester Solutions. For degree-level professions (such as architects and surveyors) data was sourced from the Higher Education Skills Authority. This is then compared to the average additional skills requirements highlighted in our research to identify those specialist skills gaps required over the period. In addition, this report seeks to identify where there is an oversupply of qualifications. For the sake of simplicity this analysis is restricted to those professions with a clear qualification route and separates all general qualifications (such as BTEC Award in Construction where there is no clear specialism) and skills where requirements can be met by importing from other sectors (such as SOC03 Non-Construction Professionals). The result of this analysis is to give a clear guide to training providers of where to focus future training provision over the next five years.
Figure 28 shows the current skills provision in Greater Manchester and reveals that 12% of current qualification starts do not lead to a specialised skill (although many individual units do focus on specific skills within these courses). These general entry-level frameworks remain essential in bringing people into the construction sector and giving them the grounding to undertake specialist qualifications at a later date. Research shows that the industry heavily relies on word-of-mouth to recruit positions; as this approach is likely to weaken with increased demand, this 12% is an opportune target to move from general construction into more specialist apprenticeships within the sector15. Furthermore, there are a large number of existing employees who take the NVQs in Plant Operation (i.e. not new entrants to the
industry), primarily because of the mandatory requirement for the on-site health and safety elements of these courses).
Even removing these up-skilling qualifications to show new entrants only shows that there is still an oversupply of 14% of plant operatives over the forecast period. Similarly the analysis of SOC 17 Labourers needs to be taken as a guideline only because most labourers are unlikely to have qualifications. The qualifications for labourers analysed are purely guideline basic qualifications that are often taken by labourers as an entry into the industry (these are purely non-NVQ qualifications). It is notable that even these qualifications are still not taken up to the level of labourers needed over the forecast period.
Figure 28 Greater Manchester Construction Qualification Starts 2012/13
1426
943
715
680598
590
479
454
312
307
297
263
214
SOC04 Wood trades and interior fit -out
General Entry Level Frameworks
SOC18 Electrical trades and installation
SOC14 Plant operatives
SOC19 Plumbing and heating, ventilation,
and air conditioning tradesSOC05 Bricklayers
SOC26 Surveyors
SOC08 Plasterers and dry liners
SOC07 Painters and decorators
SOC23 Civil engineers
SOC02 Construction managers
SOC25 Architects
SOC17 Labourers nec*
SOC13 Scaffolders
SOC21 Civil engineering operatives nec*
SOC10 Floorers
SOC09 Roofers
SOC15 Plant mechanics/fitters
SOC11 Glaziers
Apprenticeship Pathways (no SOC match)
SOC16 Steel erectors/structural
SOC06 Building envelope specialists
SOC20 Logistics
Current Provision Analysis 25Case Studies24
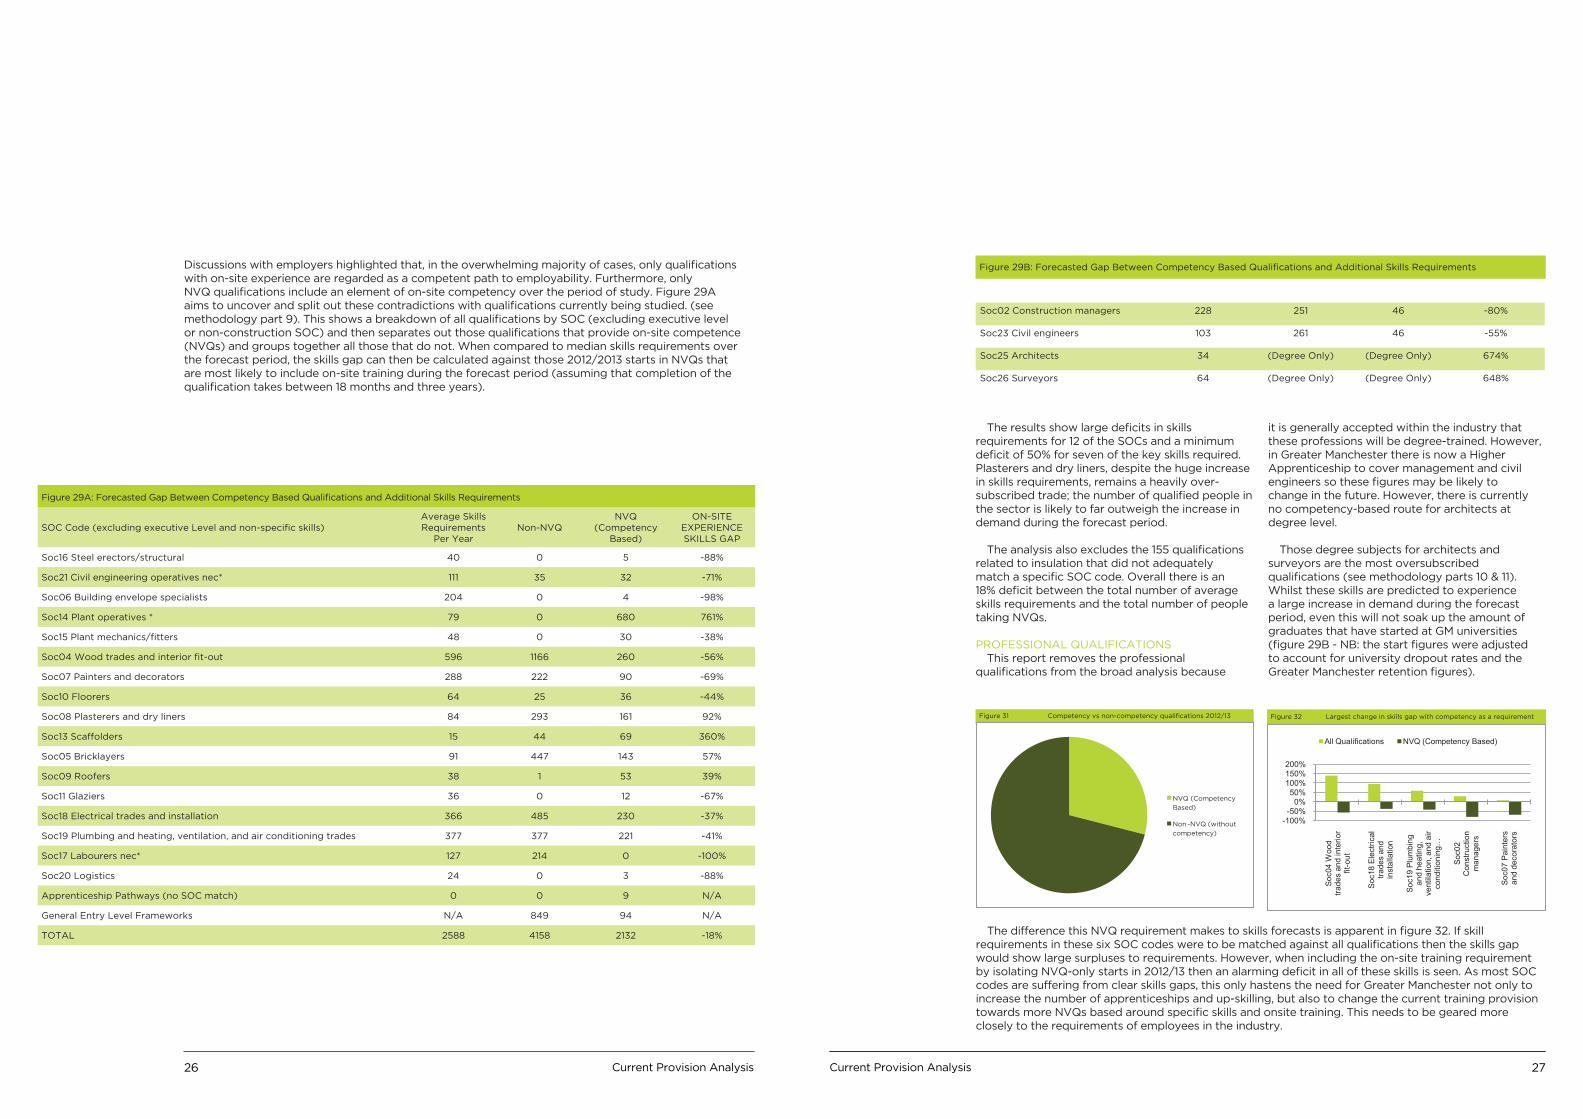
Discussions with employers highlighted that, in the overwhelming majority of cases, only qualifications with on-site experience are regarded as a competent path to employability. Furthermore, only NVQ qualifications include an element of on-site competency over the period of study. Figure 29A aims to uncover and split out these contradictions with qualifications currently being studied. (see methodology part 9). This shows a breakdown of all qualifications by SOC (excluding executive level or non-construction SOC) and then separates out those qualifications that provide on-site competence (NVQs) and groups together all those that do not. When compared to median skills requirements over the forecast period, the skills gap can then be calculated against those 2012/2013 starts in NVQs that are most likely to include on-site training during the forecast period (assuming that completion of the qualification takes between 18 months and three years).
SOC Code (excluding executive Level and non-specific skills)Average Skills Requirements
Per Year Non-NVQ
NVQ (Competency
Based)
ON-SITE EXPERIENCE SKILLS GAP
Soc16 Steel erectors/structural 40 0 5 -88%
Soc21 Civil engineering operatives nec* 111 35 32 -71%
Soc06 Building envelope specialists 204 0 4 -98%
Soc14 Plant operatives * 79 0 680 761%
Soc15 Plant mechanics/fitters 48 0 30 -38%
Soc04 Wood trades and interior fit-out 596 1166 260 -56%
Soc07 Painters and decorators 288 222 90 -69%
Soc10 Floorers 64 25 36 -44%
Soc08 Plasterers and dry liners 84 293 161 92%
Soc13 Scaffolders 15 44 69 360%
Soc05 Bricklayers 91 447 143 57%
Soc09 Roofers 38 1 53 39%
Soc11 Glaziers 36 0 12 -67%
Soc18 Electrical trades and installation 366 485 230 -37%
Soc19 Plumbing and heating, ventilation, and air conditioning trades 377 377 221 -41%
Soc17 Labourers nec* 127 214 0 -100%
Soc20 Logistics 24 0 3 -88%
Apprenticeship Pathways (no SOC match) 0 0 9 N/A
General Entry Level Frameworks N/A 849 94 N/A
TOTAL 2588 4158 2132 -18%
Figure 29A: Forecasted Gap Between Competency Based Qualifications and Additional Skills Requirements
The results show large deficits in skills requirements for 12 of the SOCs and a minimum deficit of 50% for seven of the key skills required. Plasterers and dry liners, despite the huge increase in skills requirements, remains a heavily over-subscribed trade; the number of qualified people in the sector is likely to far outweigh the increase in demand during the forecast period.
The analysis also excludes the 155 qualifications related to insulation that did not adequately match a specific SOC code. Overall there is an 18% deficit between the total number of average skills requirements and the total number of people taking NVQs.
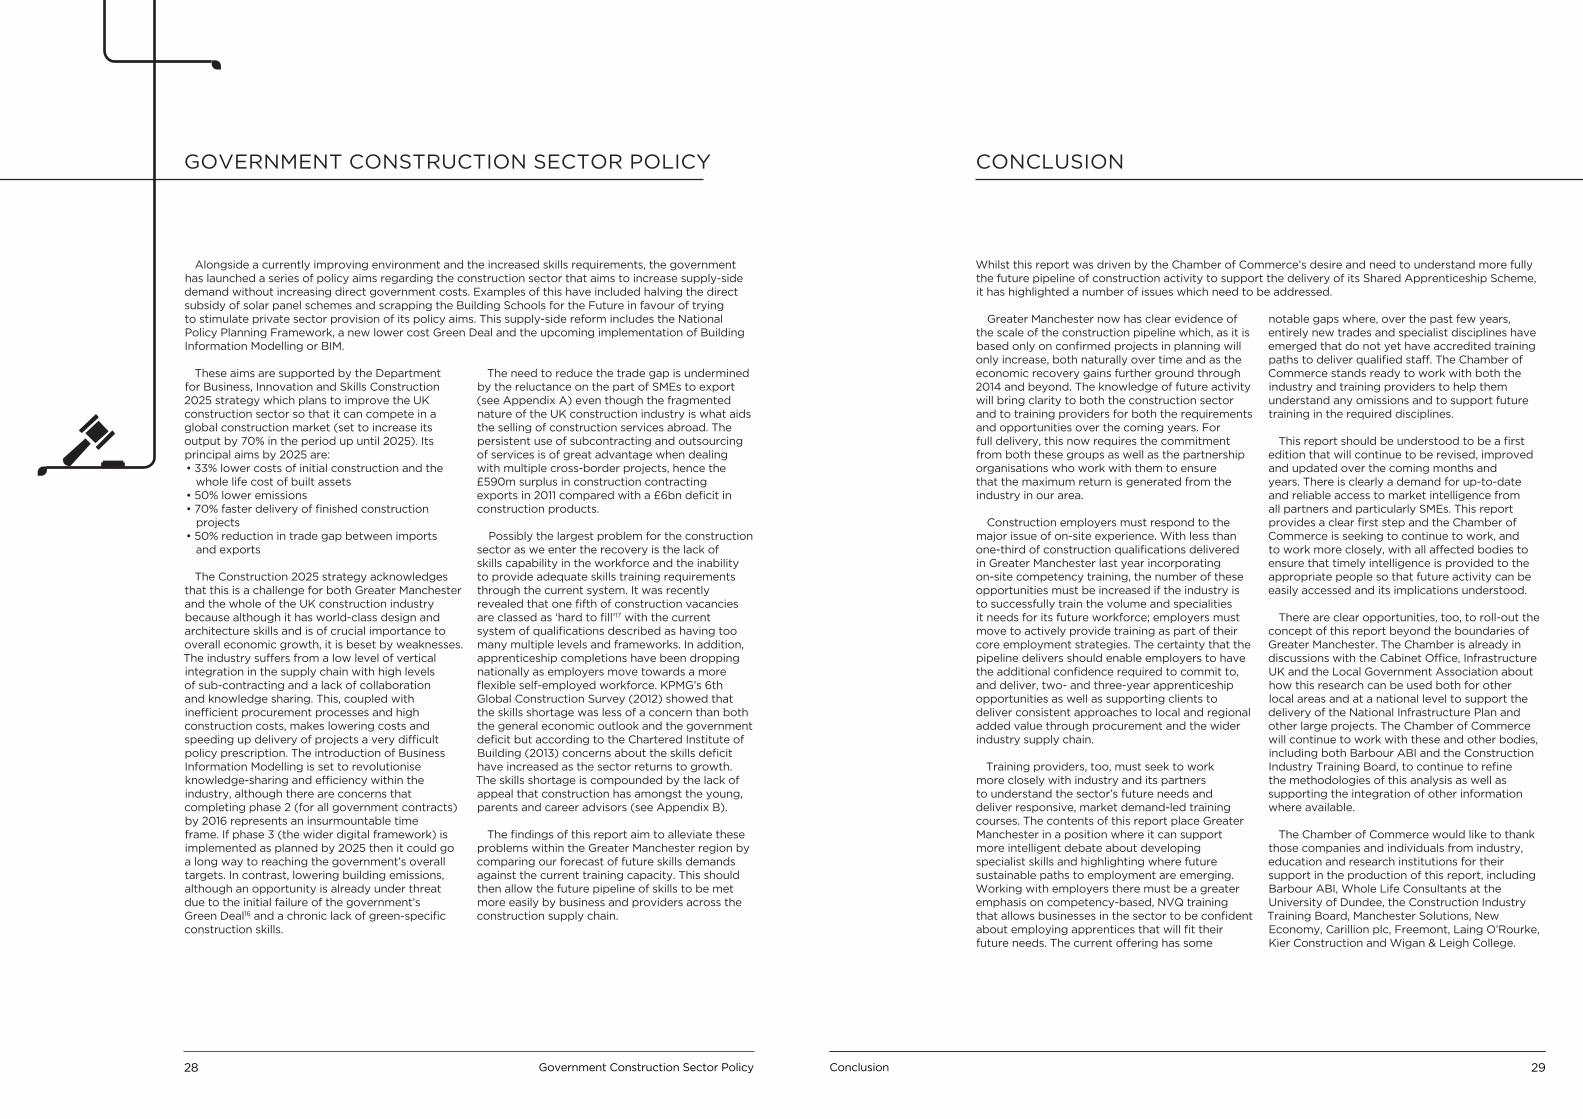
PROFESSIONAL QUALIFICATIONSThis report removes the professional
qualifications from the broad analysis because
it is generally accepted within the industry that these professions will be degree-trained. However, in Greater Manchester there is now a Higher Apprenticeship to cover management and civil engineers so these figures may be likely to change in the future. However, there is currently no competency-based route for architects at degree level.
Those degree subjects for architects and surveyors are the most oversubscribed qualifications (see methodology parts 10 & 11). Whilst these skills are predicted to experience a large increase in demand during the forecast period, even this will not soak up the amount of graduates that have started at GM universities (figure 29B - NB: the start figures were adjusted to account for university dropout rates and the Greater Manchester retention figures).
The difference this NVQ requirement makes to skills forecasts is apparent in figure 32. If skill requirements in these six SOC codes were to be matched against all qualifications then the skills gap would show large surpluses to requirements. However, when including the on-site training requirement by isolating NVQ-only starts in 2012/13 then an alarming deficit in all of these skills is seen. As most SOC codes are suffering from clear skills gaps, this only hastens the need for Greater Manchester not only to increase the number of apprenticeships and up-skilling, but also to change the current training provision towards more NVQs based around specific skills and onsite training. This needs to be geared more closely to the requirements of employees in the industry.
Figure 31 Competency vs non-competency qualifications 2012/13
NVQ (Competency
Based)
Non -NVQ (without
competency)
Soc02 Construction managers 228 251 46 -80%
Soc23 Civil engineers 103 261 46 -55%
Soc25 Architects 34 (Degree Only) (Degree Only) 674%
Soc26 Surveyors 64 (Degree Only) (Degree Only) 648%
Figure 29B: Forecasted Gap Between Competency Based Qualifications and Additional Skills Requirements
Figure 32 Largest change in skills gap with competency as a requirement
-100%-50%
0%50%
100%150%200%
Soc0
4 W
ood
trade
s an
d in
terio
r fit
-out
Soc1
8 El
ectri
cal
trade
s an
d in
stal
latio
n
Soc1
9 Pl
umbi
ng
and
heat
ing,
ve
ntila
tion,
and
air
cond
ition
ing …
Soc0
2 C
onst
ruct
ion
man
ager
s
Soc0
7 Pa
inte
rs
and
deco
rato
rs
All Qualifications NVQ (Competency Based)
Largest change in skills gap with competency as a requirementFigure 32
Current Provision Analysis 27Current Provision Analysis26
Alongside a currently improving environment and the increased skills requirements, the government has launched a series of policy aims regarding the construction sector that aims to increase supply-side demand without increasing direct government costs. Examples of this have included halving the direct subsidy of solar panel schemes and scrapping the Building Schools for the Future in favour of trying to stimulate private sector provision of its policy aims. This supply-side reform includes the National Policy Planning Framework, a new lower cost Green Deal and the upcoming implementation of Building Information Modelling or BIM.
These aims are supported by the Department for Business, Innovation and Skills Construction 2025 strategy which plans to improve the UK construction sector so that it can compete in a global construction market (set to increase its output by 70% in the period up until 2025). Its principal aims by 2025 are:• 33% lower costs of initial construction and the
whole life cost of built assets• 50% lower emissions• 70% faster delivery of finished construction
projects• 50% reduction in trade gap between imports
and exports
The Construction 2025 strategy acknowledges that this is a challenge for both Greater Manchester and the whole of the UK construction industry because although it has world-class design and architecture skills and is of crucial importance to overall economic growth, it is beset by weaknesses. The industry suffers from a low level of vertical integration in the supply chain with high levels of sub-contracting and a lack of collaboration and knowledge sharing. This, coupled with inefficient procurement processes and high construction costs, makes lowering costs and speeding up delivery of projects a very difficult policy prescription. The introduction of Business Information Modelling is set to revolutionise knowledge-sharing and efficiency within the industry, although there are concerns that completing phase 2 (for all government contracts) by 2016 represents an insurmountable time frame. If phase 3 (the wider digital framework) is implemented as planned by 2025 then it could go a long way to reaching the government’s overall targets. In contrast, lowering building emissions, although an opportunity is already under threat due to the initial failure of the government’s Green Deal16 and a chronic lack of green-specific construction skills.
The need to reduce the trade gap is undermined by the reluctance on the part of SMEs to export (see Appendix A) even though the fragmented nature of the UK construction industry is what aids the selling of construction services abroad. The persistent use of subcontracting and outsourcing of services is of great advantage when dealing with multiple cross-border projects, hence the £590m surplus in construction contracting exports in 2011 compared with a £6bn deficit in construction products.
Possibly the largest problem for the construction sector as we enter the recovery is the lack of skills capability in the workforce and the inability to provide adequate skills training requirements through the current system. It was recently revealed that one fifth of construction vacancies are classed as ‘hard to fill’17 with the current system of qualifications described as having too many multiple levels and frameworks. In addition, apprenticeship completions have been dropping nationally as employers move towards a more flexible self-employed workforce. KPMG’s 6th Global Construction Survey (2012) showed that the skills shortage was less of a concern than both the general economic outlook and the government deficit but according to the Chartered Institute of Building (2013) concerns about the skills deficit have increased as the sector returns to growth. The skills shortage is compounded by the lack of appeal that construction has amongst the young, parents and career advisors (see Appendix B).
The findings of this report aim to alleviate these problems within the Greater Manchester region by comparing our forecast of future skills demands against the current training capacity. This should then allow the future pipeline of skills to be met more easily by business and providers across the construction supply chain.
GOVERNMENT CONSTRUCTION SECTOR POLICY
Whilst this report was driven by the Chamber of Commerce’s desire and need to understand more fully the future pipeline of construction activity to support the delivery of its Shared Apprenticeship Scheme, it has highlighted a number of issues which need to be addressed.
Greater Manchester now has clear evidence of the scale of the construction pipeline which, as it is based only on confirmed projects in planning will only increase, both naturally over time and as the economic recovery gains further ground through 2014 and beyond. The knowledge of future activity will bring clarity to both the construction sector and to training providers for both the requirements and opportunities over the coming years. For full delivery, this now requires the commitment from both these groups as well as the partnership organisations who work with them to ensure that the maximum return is generated from the industry in our area.
Construction employers must respond to the major issue of on-site experience. With less than one-third of construction qualifications delivered in Greater Manchester last year incorporating on-site competency training, the number of these opportunities must be increased if the industry is to successfully train the volume and specialities it needs for its future workforce; employers must move to actively provide training as part of their core employment strategies. The certainty that the pipeline delivers should enable employers to have the additional confidence required to commit to, and deliver, two- and three-year apprenticeship opportunities as well as supporting clients to deliver consistent approaches to local and regional added value through procurement and the wider industry supply chain.
Training providers, too, must seek to work more closely with industry and its partners to understand the sector’s future needs and deliver responsive, market demand-led training courses. The contents of this report place Greater Manchester in a position where it can support more intelligent debate about developing specialist skills and highlighting where future sustainable paths to employment are emerging. Working with employers there must be a greater emphasis on competency-based, NVQ training that allows businesses in the sector to be confident about employing apprentices that will fit their future needs. The current offering has some
notable gaps where, over the past few years, entirely new trades and specialist disciplines have emerged that do not yet have accredited training paths to deliver qualified staff. The Chamber of Commerce stands ready to work with both the industry and training providers to help them understand any omissions and to support future training in the required disciplines.
This report should be understood to be a first edition that will continue to be revised, improved and updated over the coming months and years. There is clearly a demand for up-to-date and reliable access to market intelligence from all partners and particularly SMEs. This report provides a clear first step and the Chamber of Commerce is seeking to continue to work, and to work more closely, with all affected bodies to ensure that timely intelligence is provided to the appropriate people so that future activity can be easily accessed and its implications understood.
There are clear opportunities, too, to roll-out the concept of this report beyond the boundaries of Greater Manchester. The Chamber is already in discussions with the Cabinet Office, Infrastructure UK and the Local Government Association about how this research can be used both for other local areas and at a national level to support the delivery of the National Infrastructure Plan and other large projects. The Chamber of Commerce will continue to work with these and other bodies, including both Barbour ABI and the Construction Industry Training Board, to continue to refine the methodologies of this analysis as well as supporting the integration of other information where available.
The Chamber of Commerce would like to thank those companies and individuals from industry, education and research institutions for their support in the production of this report, including Barbour ABI, Whole Life Consultants at the University of Dundee, the Construction Industry Training Board, Manchester Solutions, New Economy, Carillion plc, Freemont, Laing O’Rourke, Kier Construction and Wigan & Leigh College.
CONCLUSION
Conclusion 29Government Construction Sector Policy28
APPENDIX B – APPEAL OF MANUFACTURING
The future need for larger volumes of people to enter the construction sector within Greater Manchester is clear with the industry suffering from a huge image problem as young people bypass the sector in favour of apprenticeships in business and law, retail and social care. Survey data shows18 that the overall appeal of the construction industry as a career option for young people is low (scoring an average of 4.2 out of 10 among 14 to 19 year olds) and only slightly higher among careers advisers (5.6 out of 10). Parents score the industry higher but still at a relatively low level (6.2 out of 10). The industry is also beset by image problems related to low pay, low job security, a lack of gender diversity and the more cyclical nature of its performance relative to other industries.
APPENDIX A – REASONS GIVEN BY SMES FOR NOT EXPORTING
APPENDICES
Do not have a product / service suitable for exporting 66%
Not part of business plan 26%
Have sufficient business in the UK already 11%
Too costly 3%
Lack of management time to pursue export opportunities 2%
Source: BIS Small Business Survey (2012).
Note: Firms could give multiple reasons.
Figure 33: Reasons Given by SMEs For Not Exporting
Young People Parents Career
Advisers
Engineering 14% 13% 6%
Manufacturing 18% 25% 20%
Retail 17% 33% 23%
Source: CITB-ConstructionSkills (March 2013) and Pye Tait consulting (2012).
Note on reading the table: data shows, for example, that only 14% of young people would prefer a career in construction over engineering. This is equivalent to 86% of young people who would prefer engineering over a career in construction.
Figure 34 - Construction has more appeal than:
1) This categorisation outlined in the ‘Orders for New Construction: 2013 Q2’ and based on data supplied to the ONS by Barbour ABI. Housing is generally defined as ‘all buildings that are constructed for residential use’. Within the public sector this classification includes construction items such as local authority housing schemes, hostels (except youth hostels), married quarters for the services and police; old peoples’ homes; orphanages and children’s remand homes; and the provision within housing sites of roads and services for gases, water, electricity, sewage and drainage. Private sector housing includes all privately owned buildings for residential use, such as houses, flats and maisonettes, bungalows, cottages, vicarages, and the provision of services to new developments. Infrastructure is the generic term for the basic physical and organizational structures and facilities needed for the operation of a society or enterprise. These construction items include buildings, roads, power supplies, etc.
2) All projects based on information submitted by Barbour ABI for the Greater Manchester conurbation, these include all projects that have applied for planning permission in the last three years. Please be advised that we have only based our forecasts on projects that have a duration period of construction (or where we have created one from start date/end date).
3) Total value figures are based on the £15.576bn of project values eligible for inclusion within the total labour forecast (a conservative figure). Where a project started prior to the forecast period or carried on long after 2017, we have divided the value figures equally across all years of the project duration. In most cases the contribution of these project values to the forecast period represent the high mid-way point of costs within the project duration.
4) The project types represent the primary categorisation that is required for the forecast model, they have been formulated by cross-checking and condensing the original micro-level categorisation of projects supplied by Barbour-ABI. Infrastructure for example is defined as power generation, sewerage, drainage, roads, bridges, harbours and railway maintenance. Public non-residential is defined as any across a whole range of projects receiving government funding or that are primarily for public use. This includes economic renewal & regeneration projects but also includes courts, universities, schools and public hospitals. Using this methodology railway passenger facilities are classed as infrastructure but a major infrastructure project such as Northern Hub (with substantial public interests both politically and financially) are classed as public non-residential.
5) Labour forecasts have been created using the CITB Labour Forecasting Model developed by Whole Life Consultancy based at the University of Dundee.
6) Additional skills requirements have been estimated using figures derived from 5% of the labour forecast over the period. We have then taken the median average of these figures as they are required over the forecast period. All analysis has been based on the most conservative possible forecasts of additional skills requirements over the period. If projects without duration come to be realised or additional projects are announced over the forecast period these figures are likely to be much higher.
7) All averages across the forecast period are expressed as median except for those figures comparing the forecast period to 2008-2012; these figures are expressed as mean. Median is used as a more fair reflection of the peaks and troughs that occur month by month over the forecast period.
8) Our focus on the top 20 projects does not include many high-profile public non-residential projects currently occurring within Greater Manchester. This is driven by the fact that Barbour-ABI split out the schemes into individual projects that do not have enough value on their own to appear in the top 20.
METHODOLOGY
Methodology 31Appendices30
9) The current skills gap across all SOC codes is based upon data from the Skills Funding Agency and HESA for current qualification starts and apprenticeship frameworks across Greater Manchester for the period 2012/13. It is highly likely that these will be completed during the forecast period. The non-apprenticeship starts assumed a national average dropout rate for NVQ qualifications of 47% from the Department for Education and Skills commissioned report ‘A study into reasons for younger worker drop-out from full NVQs/NVQ Units’ by Philip Thornhill of Prism Management Consultants. This was not applied to apprenticeship framework starts due to the unknown varying dropout rates across different providers. There were 499 apprenticeship starts with no clearly defined pathways assigned to them. This data is only likely to be available from the SFA from the next academic year 2013/2014 as they begin to assign pathway data in 2013. Therefore we have assigned these to the SOC codes based on normalised percentages from data supplied by Manchester Solutions (the largest training provider in Manchester) for the last three academic years.
10) The exception are the starts for the degree professions of surveyors and architects, these are based on university starts in Greater Manchester. These figures were adjusted according to the local university dropout rate and the current Manchester retention rate.
11) The civil engineering skills gap is only based on non-degree qualifications to represent a more accurate pathway open to apprenticeships with on-site experience.
Figures 1, 7, 8, 9, 27: Data taken from the Barbour ABI Pipeline for Greater Manchester based on planning permissions granted over the last three years. These are based on projects above £500,000 and due to start within the forecast period of 2013-2017. Project plans that did not have dates or durations to the construction work because they are at an early stage of development were excluded from the analysis (these projects are expected to amount to contribute an additional £6.637bn over the forecast period).
Figures 2, 3, 4: Data taken from the ONS, Output in the Construction Industry, July 2013 and Orders for New Construction: 2013 Q2.
Figure 5: Data taken from the Bank of England to show monthly amounts outstanding of UK resident monetary financial institutions’ credit facilities and sterling net lending to construction companies (in sterling millions) not seasonally adjusted (September 2013).
Figure 6: Data taken from ONS/IDBR Provisional 2013 figures.
Figures 10-26: Data extracted from the CITB Labour Forecasting Tool developed by Whole Life Consultants at the University of Dundee using the Barbour ABI Pipeline for Greater Manchester.
Figures 28-32: This is based around total qualifications data (including those that form current apprenticeship frameworks) from the Skills Funding Agency (via New Economy) and for degree-level professions (such as architects and surveyors) from the Higher Education Skills Authority. Unidentified pathways were assigned normalised percentages from data supplied by Manchester Solutions (the largest training provider in Manchester) for the last three academic years.
FIGURE SOURCES
Figure Sources 33Methodology32
Greater Manchester Chamber of Commerce is the largest Chamber of Commerce in the United Kingdom, providing business support services to over 4,000 members who collectively employ around one-third of Greater Manchester’s workforce.
Recognised as a leader in its field, Greater Manchester Chamber’s reputation in government circles has grown locally and nationally. At the heart of the area of greatest economic intensity outside London and the South East, the Chamber is the primary body for business support, policy, representation and networking.
The aim of the Chamber is to support businesses and to help create the best climate for the region to prosper. This is achieved by ensuring that those taking decisions on key issues such as transport, taxation and business regulation hear the voice of our members. The representation of our members’ views is central to the work of the policy team at the Chamber; these views are gathered in a range of ways including our local councils, policy committees, sector councils, the main Chamber council, focus groups, meetings with politicians, consultations, our Quarterly Economic Survey (QES) and through bespoke research such as this report.
This report was researched and written by Bobby Lawson, Research Analyst, and edited by Christian Spence, Head of Business Intelligence with specialist sectoral support from Jocelyne Underwood, Construction Sector Lead. If you require any further information about the production or detail of this report, in the first instance please contact Christian Spence on (0161) 237 4045 or email [email protected].
Greater Manchester Chamber of Commerce wishes to thank Manchester Solutions and New Economy for their assistance in the preparation of this report.
Digital copies of this and other Chamber reports can be downloaded from the Chamber’s website at www.gmchamber.co.uk/research.
1. 2025 Vision for the construction sector: Department for Business Innovation and Skills2. CITB-Skills Needs of Specialist in Construction, June 20133. Construction Skills Network, quoted in CITB-Skills Needs of Specialist in Construction, June 20134. ONS, Output in the Construction Industry, July 20135. Glenigan Index, September 20136. IPPR North, Still on the wrong track, June 20137. BACS Payment Schemes Ltd8. Federation of Small Business, Late Payment Policy Report9. John Ashcroft, The Saturday Economist, Housing Market Update, October 201310. New Economy Construction Sector Deep Dive, November 201311. New Economy Construction Workshop Briefing, September 201312. Provisional IDBR Figures, ONS, July 201313. New Economy, Construction Workshop Briefing, September 201314. The Financial Times, China in £800m Manchester Airport Deal, 13 October 201315. New Economy Construction Sector Deep Dive, November 201316. Carillion warns on job losses after failure of Green Deal, Financial Times, 3 October 201317. UK employer skills survey, BIS Construction 2025 Strategy Report18. CITB-Construction Skills (March 2013) and Pye Tait consulting (2012)
BACKGROUND
Background34

gmchamber.co.uk
For further details about information contained within this brochure, contact:
CHRIS FLETCHERDirector of Policy and [email protected]@fletcherchris
CHRISTIAN SPENCEHead of Business [email protected]@GMCCResearch
JOCELYNE UNDERWOODConstruction Sector [email protected]@GMChamberGTA
/greatermanchesterchamber
@gmchamber
Greater Manchester Chamber
/gmchamber