Embed Size (px)
Citation preview

Distribution A: Approved for public release UNCLASIFIED
UNCLASIFIED
Miroslav Tesla, Jennifer A. Cordes, Janet Wolfson RDAR-MEF-E, Building 94, 2nd floor
Fuze and Precision Armaments Directorate AETC, U.S. Army ARDEC, Picatinny Arsenal, NJ 07806-5000
973-724-9503, (fax: 973-724-2417), [email protected]
December 16, 2015, comments and corrections requested
Grand Challenge Prediction Article #: TA2 Test 4
Test Apparatus: VHG Organization: ARDEC
Grand Challenge VHG Test Article 2 Test 4

Distribution A: Approved for public release UNCLASIFIED
UNCLASIFIED
Goals, Scope
2
• Goals: – Joint effort of DOD and DOE to quantify the capabilities of
computational codes to accurately predict the response of an instrumented fuze to a known shock.
– The purpose of the modeling and simulation was to predict the board accelerations in a blind study. Other agencies made similar predictions using a variety of finite element codes. Other tests were also conducted. This paper is limited to the work done at Picatinny Arsenal on a test article 2 (TA2) labeled by the Air Force as Test 4.
• Scope – Model: VHG TA2 Test 4, housing and boards filled with potting, no
electronics components, VHG test apparatus. – Abaqus Explicit 6.14-1, dynamic analysis. – Evaluate: Acceleration during the impact. Predict acceleration
readings for all 4 accelerometers placed on 4 boards. Compare accelerometer readings during VHG test with FEA predictions.

Distribution A: Approved for public release UNCLASIFIED
UNCLASIFIED
Method: Model Information, Procedures and Possible Errors
3
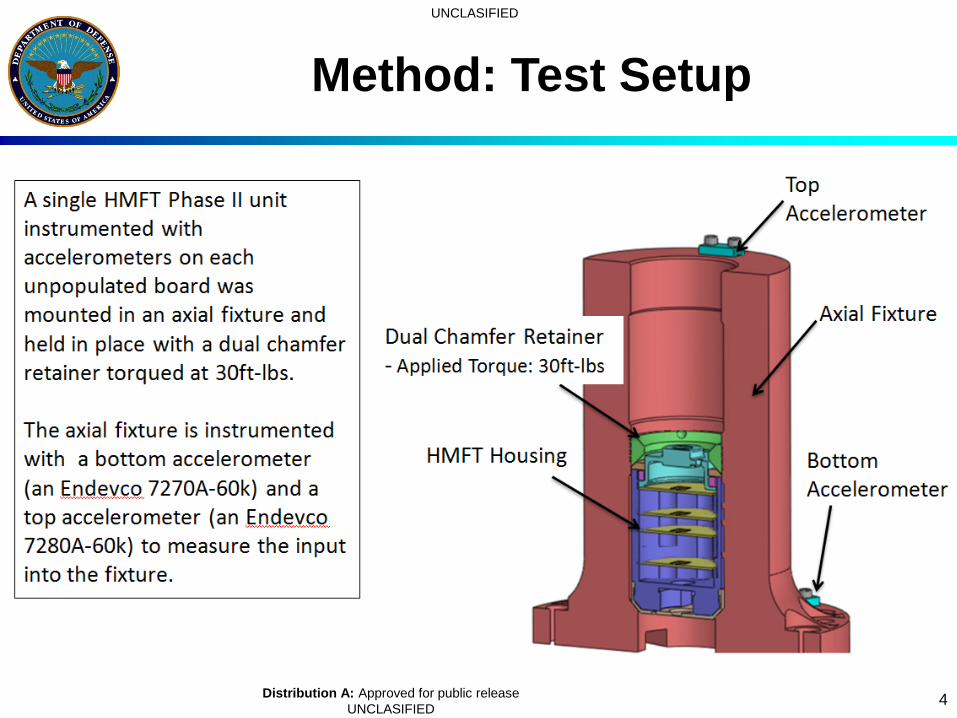
– General Purpose Finite Element Software: Abaqus Explicit 6.14-1 – Analysis: dynamic, non-linear materials, non-linear geometry – Analysis time: 0.004 seconds – Full model – Parts: Imported from CAD or defined in Abaqus CAE. All parts modeled as deformable. – Elements: 8-node linear brick elements reduced integration hourglass – Materials: Viscoelastic model, Orthotropic elastic plastic model and Crushable Foam model. – Loads: Shock load per VHG TA2 Test 4 input data (A1 accelerometer “SN102_test04” - test data
from Eglin). – Boundary: Constrained fixture, assumed – Initial Conditions: No initial velocity – Friction: Friction coefficient 0.3, all contact surfaces. – Damping: material viscoelastic damping and Rayleigh mass proportional damping. – Assumed failure criteria:
• Mises Stress > Ultimate Tensile Strength, assumed failure • Maximum Strain > Material Elongation, assumed failure • Plasticity > ¼ wall thickness, assumed failure for design purposes
– Possible Errors • Geometry was defeatured. • General contact with coefficient of friction 0.30 for all contact. Slipping effects, temperature and pressure
dependences are ignored. • Threaded connections were not modeled, instead contacting surfaces were tied. • Retainer preload was not applied. • It is assumed that potting material filled all cavities above the “Potting Cap”. Weight of parts were
adjusted to match weight of the assembly. Interaction between Closure Ring and Housing were assumed as glued (tie constraints). Fixture and Retainer materials were assumed as steel AISI 4340.
Distribution A: Approved for public release UNCLASIFIED
UNCLASIFIED
Method: Test Setup
4

Distribution A: Approved for public release UNCLASIFIED
UNCLASIFIED
Method: Test Setup
5
Very High G (VHG) shock machine at Eglin AFRL
Tail Mounted HMFT

Distribution A: Approved for public release UNCLASIFIED
UNCLASIFIED
Method: Accelerometers’ Location
6
Board # 4
Board # 3
Board # 2
Board # 1
Distribution A: Approved for public release UNCLASIFIED
UNCLASIFIED
Method: Accelerometers’ Location
7
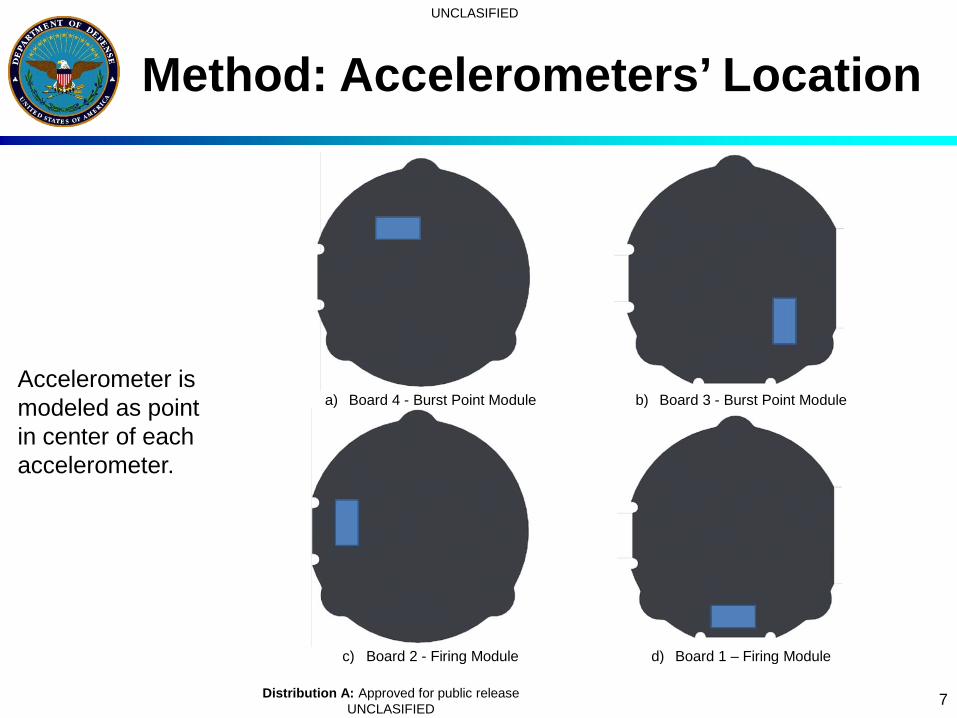
Accelerometer is modeled as point in center of each accelerometer.
a) Board 4 - Burst Point Module b) Board 3 - Burst Point Module
c) Board 2 - Firing Module d) Board 1 – Firing Module
Distribution A: Approved for public release UNCLASIFIED
UNCLASIFIED
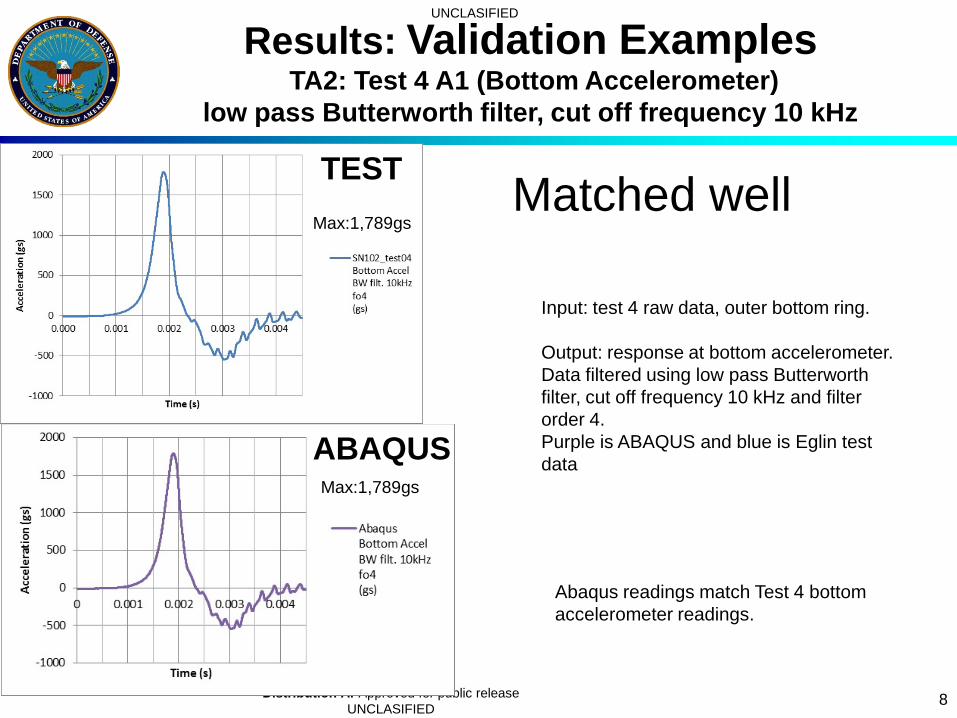
Results: Validation Examples TA2: Test 4 A1 (Bottom Accelerometer)
low pass Butterworth filter, cut off frequency 10 kHz
8
Abaqus readings match Test 4 bottom accelerometer readings.
Input: test 4 raw data, outer bottom ring. Output: response at bottom accelerometer. Data filtered using low pass Butterworth filter, cut off frequency 10 kHz and filter order 4. Purple is ABAQUS and blue is Eglin test data
TEST Max:1,789gs
ABAQUS Max:1,789gs
Matched well

Distribution A: Approved for public release UNCLASIFIED
UNCLASIFIED
Results: Validation Examples TA2: Test 4 A2 (Top Accelerometer)
low pass Butterworth filter, cut off frequency 10 kHz
9
Abaqus readings match Test 4 top accelerometer readings. The Max was within 2.5%.
Input: test 4 raw data, outer bottom ring. Output: response at top accelerometer. Data filtered using low pass Butterworth filter, cut off frequency 10 kHz and filter order 4. Purple is ABAQUS and red is Eglin test data
TEST Max:1,831gs
ABAQUS Max:1,878gs
Matched well
Distribution A: Approved for public release UNCLASIFIED
UNCLASIFIED
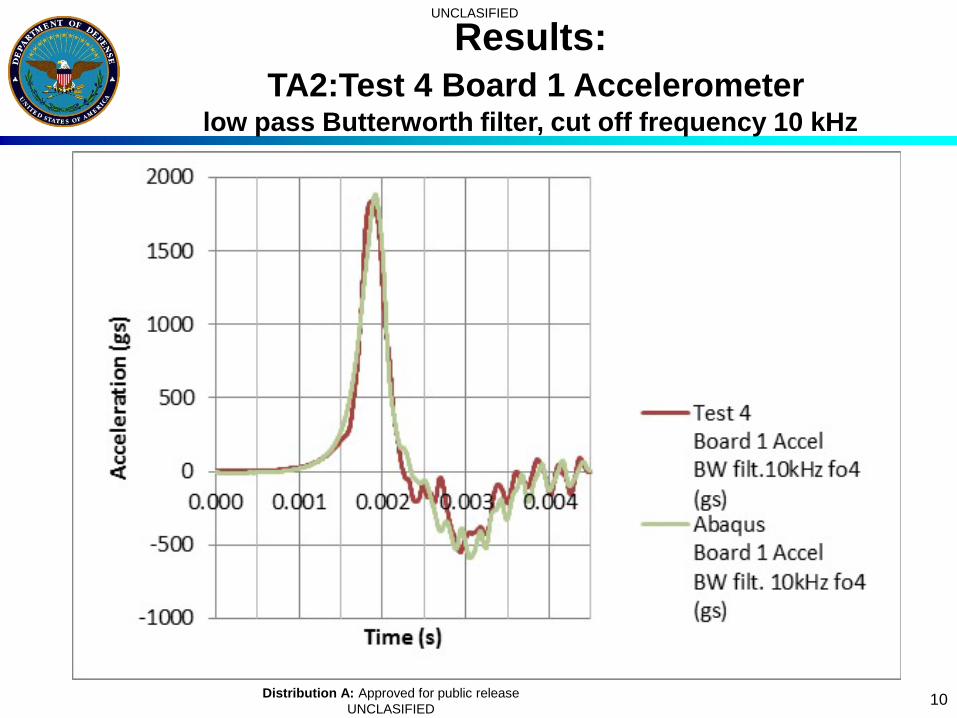
Results: TA2:Test 4 Board 1 Accelerometer
low pass Butterworth filter, cut off frequency 10 kHz
10

Distribution A: Approved for public release UNCLASIFIED
UNCLASIFIED
Results: TA2:Test 4 Board 2 Accelerometer
low pass Butterworth filter, cut off frequency 10 kHz
11

Distribution A: Approved for public release UNCLASIFIED
UNCLASIFIED
Results: TA2:Test 4 Board 3 Accelerometer
low pass Butterworth filter, cut off frequency 10 kHz
12

Distribution A: Approved for public release UNCLASIFIED
UNCLASIFIED
Results: TA2:Test 4 Board 4 Accelerometer
low pass Butterworth filter, cut off frequency 10 kHz
13
Distribution A: Approved for public release UNCLASIFIED
UNCLASIFIED
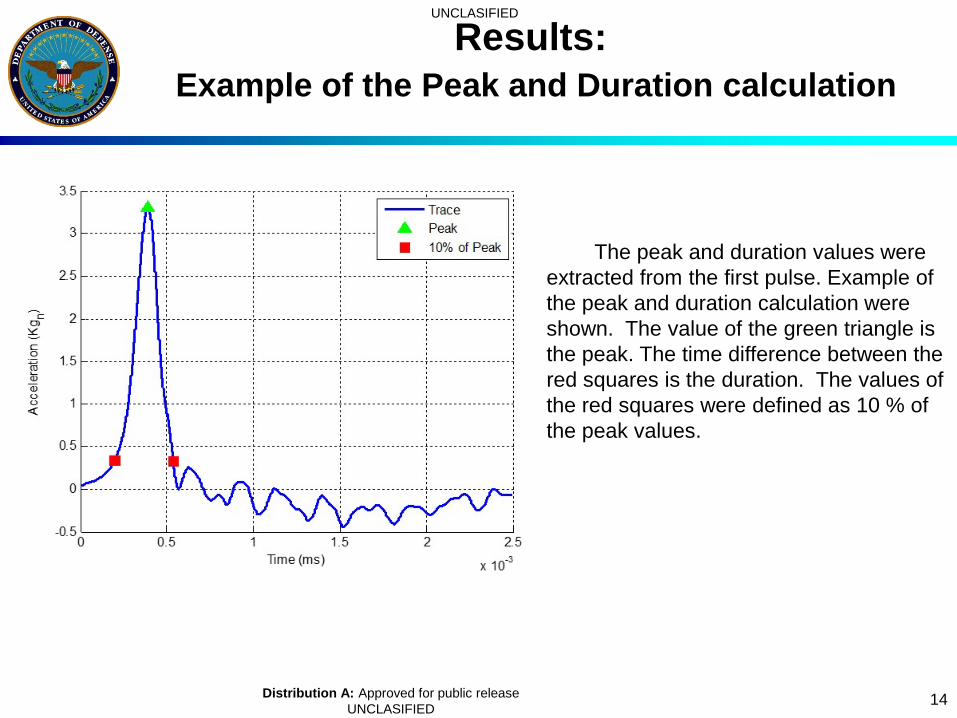
Results: Example of the Peak and Duration calculation
14
The peak and duration values were extracted from the first pulse. Example of the peak and duration calculation were shown. The value of the green triangle is the peak. The time difference between the red squares is the duration. The values of the red squares were defined as 10 % of the peak values.
Distribution A: Approved for public release UNCLASIFIED
UNCLASIFIED
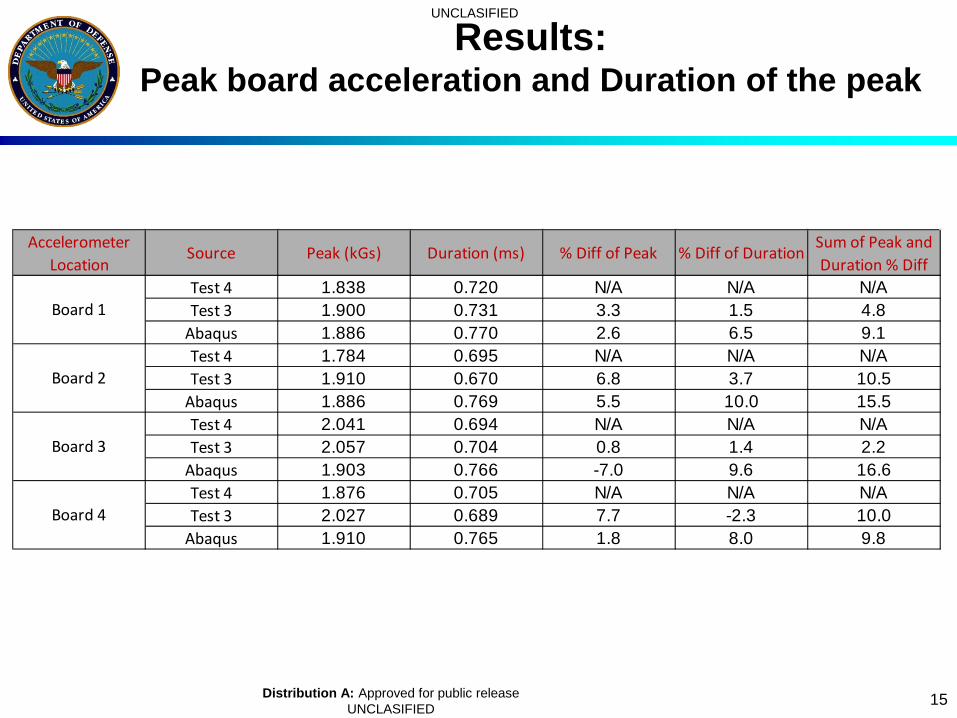
Results: Peak board acceleration and Duration of the peak
15
Accelerometer Location
Source Peak (kGs) Duration (ms) % Diff of Peak % Diff of DurationSum of Peak and Duration % Diff
Test 4 1.838 0.720 N/A N/A N/ATest 3 1.900 0.731 3.3 1.5 4.8
Abaqus 1.886 0.770 2.6 6.5 9.1Test 4 1.784 0.695 N/A N/A N/ATest 3 1.910 0.670 6.8 3.7 10.5
Abaqus 1.886 0.769 5.5 10.0 15.5Test 4 2.041 0.694 N/A N/A N/ATest 3 2.057 0.704 0.8 1.4 2.2
Abaqus 1.903 0.766 -7.0 9.6 16.6Test 4 1.876 0.705 N/A N/A N/ATest 3 2.027 0.689 7.7 -2.3 10.0
Abaqus 1.910 0.765 1.8 8.0 9.8
Board 1
Board 2
Board 3
Board 4

Distribution A: Approved for public release UNCLASIFIED
UNCLASIFIED
Conclusions
16
Conclusions • Modeling and simulation should go hand-in-hand with testing. Tests
provide loads, validation, and material data for modeling and simulation. • Exact predictions for accelerations are difficult due to variations in
materials, tolerances, loads, directionality of loads, constraints, friction, preloads, contact, etc.
• This analysis demonstrates good match between board accelerations collected during Test 4 performed on VHG machine and Abaqus predictions. The peak acceleration was matched within 7.0% for all four boards. The shape of the acceleration response was also reasonably accurate for the four circuit boards.