Embed Size (px)
Citation preview

Graduate Business School
Logistics and Transport Management Master Thesis No. 2006:83
Supervisor: Arne Jensen
The Optimized Configuration of Volvo Car Parts Distribution Centres in China
Shen Si and Geng Yafen
Master Thesis
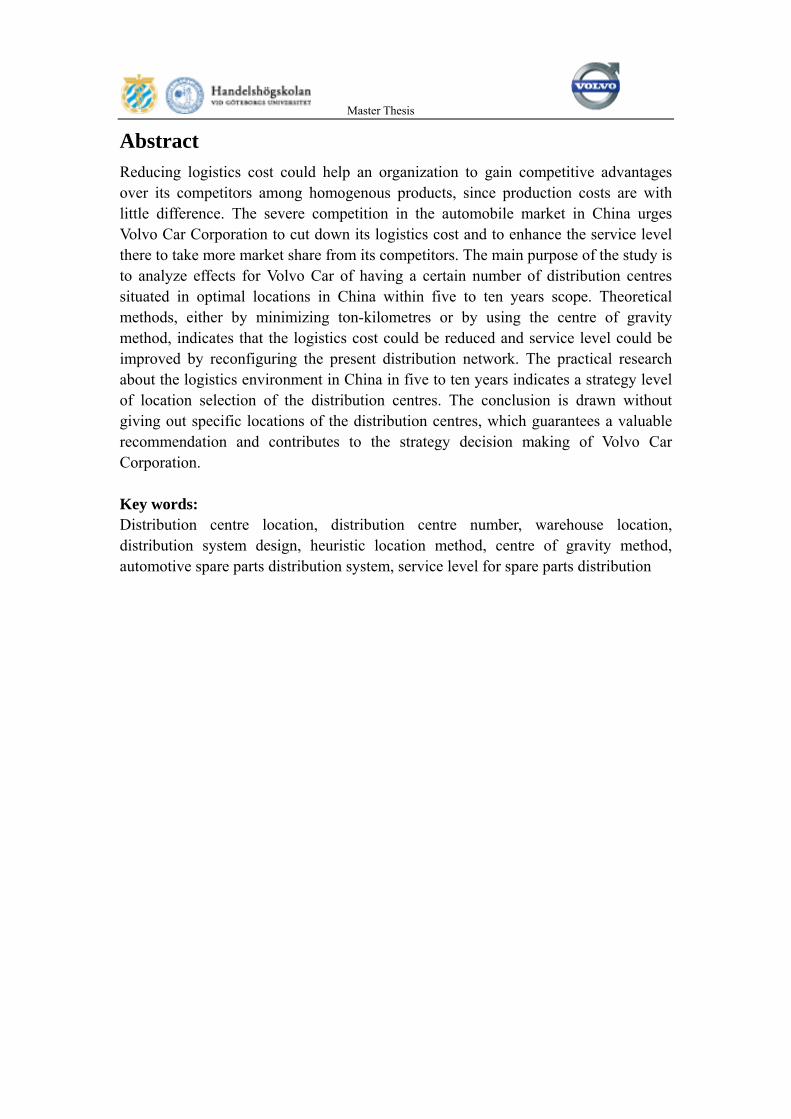
Abstract Reducing logistics cost could help an organization to gain competitive advantages over its competitors among homogenous products, since production costs are with little difference. The severe competition in the automobile market in China urges Volvo Car Corporation to cut down its logistics cost and to enhance the service level there to take more market share from its competitors. The main purpose of the study is to analyze effects for Volvo Car of having a certain number of distribution centres situated in optimal locations in China within five to ten years scope. Theoretical methods, either by minimizing ton-kilometres or by using the centre of gravity method, indicates that the logistics cost could be reduced and service level could be improved by reconfiguring the present distribution network. The practical research about the logistics environment in China in five to ten years indicates a strategy level of location selection of the distribution centres. The conclusion is drawn without giving out specific locations of the distribution centres, which guarantees a valuable recommendation and contributes to the strategy decision making of Volvo Car Corporation. Key words: Distribution centre location, distribution centre number, warehouse location, distribution system design, heuristic location method, centre of gravity method, automotive spare parts distribution system, service level for spare parts distribution

Master Thesis
Acknowledgements First of all, the authors would like to express their great respect to Professor Arne Jensen. Without his patient, valuable and creative guidance, this thesis would never have been. At the same time, the authors stress sincere gratitude to Mr. Christer Olsson as the supervisor from Volvo Car Corporation who has shared as much worthy information and business experiences as possible with the authors to lead to the fulfillment of this thesis. Without his trust in offering the authors the opportunity to involve in the discussion of their future business strategy decision, the thesis would never been started. The authors have spent unforgettable times at Market Area International department in Volvo Car Corporation because of the friendly atmosphere in the department. Therefore, thanks to all the members in the department.
Especially, thanks to Mr. Mikael Nilsen in China who has provided the fundamental direction and sources to this thesis. Thanks to Mr. Carl-Johan Krook who has contributed a lot of sparkling ideas to this thesis. Moreover, Mr. Lars-Erik Magnusson, Mr. Christian Varlet and Mr. Stefan Lindbergh all has been very supportive in the complete of this thesis. Thanks to them all.
Schenker International (H.K.) LTD has provided useful information to the thesis. Thanks to their help as well.
Finally, the authors would like to send great love to their parents and friends, without their love, nothing special would happen in Gothenburg, Sweden.

Master Thesis
Abbreviations
CDC Central Distribution Centre
COG Centre of Gravity
CPI Consumer Price Index
DC Distribution Centre
DCs Distribution Centres
DMS Dealer Management System
HR Human Resource
LT Lead Time
MILP Mixed-Integer Linear Programming
OECD Organization for Economic Co-operation and Development
PAG Premier Automotive Group
RMB Ren Min Bi, unit of Chinese currency
VCC Volvo Car Corporation
VD Volume*Distance
VDR Volume *Distance* Rate
VOR Vehicle Off Road
Table of Contents
Table of Contents
Chapter 1 Introduction ...................................................................................................1 1.1Background ..........................................................................................................................1 1.2 Volvo Car Corporation ........................................................................................................2
1.2.1 Organization.............................................................................................................2 1.2.2 Value chain ...............................................................................................................2
1.3 Problem...............................................................................................................................4 1.4 Purpose................................................................................................................................5 1.5 Delimitations.......................................................................................................................6
1.5.1 Time delimitation .....................................................................................................6 1.5.2 Accessibility of information.....................................................................................6 1.5.3 The scope of the content...........................................................................................6
Chapter 2 Theoretical Framework .................................................................................8 2.1 Value chain..........................................................................................................................8 2.2 Inventory carrying cost .......................................................................................................8 2.3 Heuristic method .................................................................................................................9 2.4 Delimitation of distribution centre hinterlands .................................................................10 2.5 Center-of-gravity method..................................................................................................11 2.6 Mixed-Integer linear programming...................................................................................12 2.7 Sensitivity analysis............................................................................................................13 2.8 Distribution centre location select factors .........................................................................13
Chapter 3 Problem Analysis.........................................................................................15 3.1 Data collection and interpretation .....................................................................................17 3.2 Macro analysis ..................................................................................................................17
3.2.1 Procedure ...............................................................................................................17 3.2.2 Data needs ..............................................................................................................18
3.3 Distribution centre service areas .......................................................................................18 3.3.1 Procedure ...............................................................................................................18 3.3.2 Data needs ..............................................................................................................18
3.4 Micro Analysis ..................................................................................................................19 3.4.1 Procedure ...............................................................................................................19 3.4.2 Data needs ..............................................................................................................19
3.5 External environment analysis ..........................................................................................20 3.5.1 Procedure ...............................................................................................................20 3.5.2 Data needs ..............................................................................................................21
3.6 Conclusion ........................................................................................................................21 Chapter 4 Research Design (Methodology).................................................................22
4.1 Research process ...............................................................................................................22 4.2 Research design.................................................................................................................23
4.2.1 Exploratory research ..............................................................................................23

Table of Contents
4.2.2 Descriptive research ...............................................................................................23 4.2.3 Causal designs........................................................................................................23
4.3 Business research methods................................................................................................24 4.3.1 Quantitative research..............................................................................................24 4.3.2 Qualitative research................................................................................................24
4.4 Data collection ..................................................................................................................24 4.4.1 Type of data............................................................................................................24 4.4.2 Communication method .........................................................................................26
4.5 Data needs and collecting methods ...................................................................................26 4.6 Collected data and interpretation ......................................................................................27
Chapter 5 Macro Solution............................................................................................29 5.1 Introduction.......................................................................................................................29 5.2 Transit time restrictions.....................................................................................................30 5.3 Assumptions ......................................................................................................................31 5.4 Calculation ........................................................................................................................33
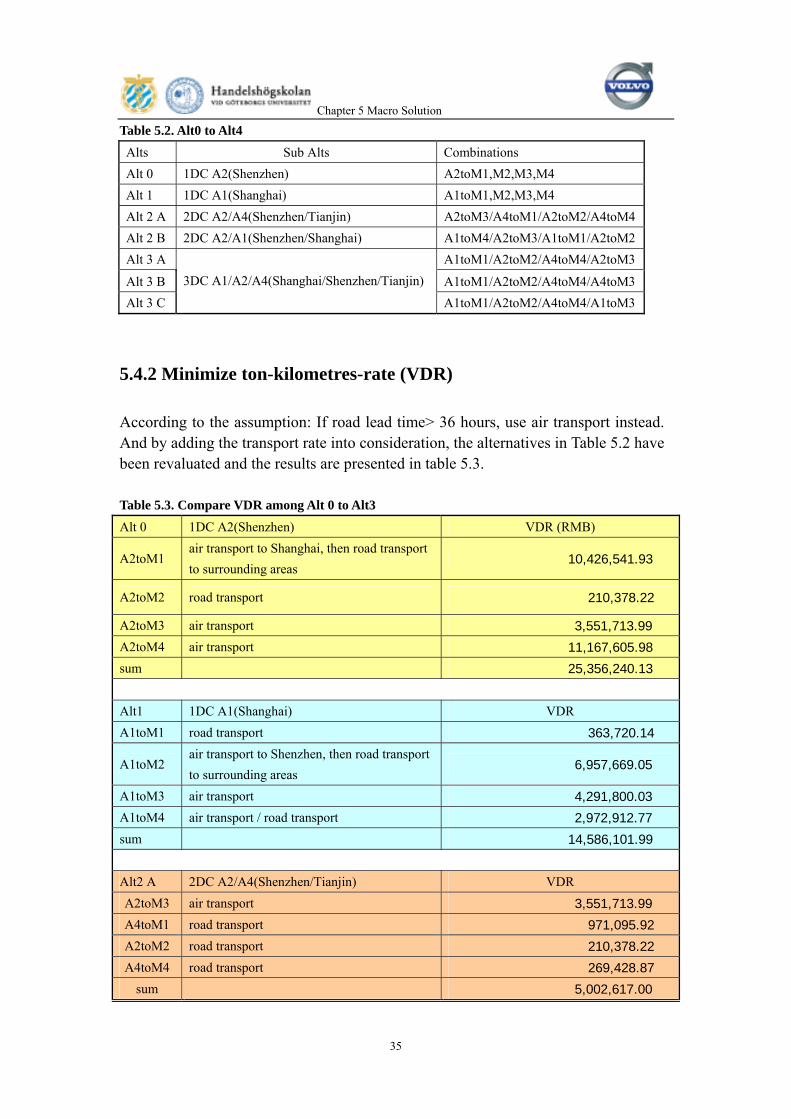
5.4.1 Minimize ton-kilometres (VD)...............................................................................33 5.4.2 Minimize ton-kilometres-rate (VDR).....................................................................35 5.4.3 Capital cost and rental cost ....................................................................................36
5.5 Analysis.............................................................................................................................37 5.6 Macro decision..................................................................................................................40
Chapter 6 Distribution Centre Service Areas...............................................................41 6.1 Problem background .........................................................................................................41 6.2 Time-constraint boundary .................................................................................................42 6.3 Cost-equalization boundary ..............................................................................................43 6.4 Division of distribution centre service areas .....................................................................44
Chapter 7 Micro Solution.............................................................................................45 7.1 Introduction.......................................................................................................................45 7.2 Assumptions of center-of-gravity method.........................................................................45 7.3 Calculation and analysis....................................................................................................47
7.3.1 Calculation of the north location............................................................................47 7.3.2 Calculation of the south location............................................................................50
7.4 Mixed-integer linear programming ...................................................................................54 7.5 Micro decision...................................................................................................................55 7.6 Sensitive analysis ..............................................................................................................55
7.6.1 Price .......................................................................................................................55 7.6.2 Import location .......................................................................................................56 7.6.3 Market expansion ...................................................................................................56
Chapter 8 External Environment Analysis...................................................................57 8.1 Transportation ...................................................................................................................57
8.1.1 Road .......................................................................................................................57 8.1.2 Rail .........................................................................................................................57 8.1.3 Air ..........................................................................................................................59 8.1.4 Sea..........................................................................................................................60

Table of Contents
8.2 Economics and policy .......................................................................................................62 8.2.1 Economics and policy ............................................................................................62 8.2.2 Free Trade Zone .....................................................................................................63
8.3 Analysis and summary ......................................................................................................64 Chapter 9 Conclusion and Recommendation...............................................................66 References....................................................................................................................67 Appendix Ⅰ ................................................................................................................69 Appendix Ⅱ ................................................................................................................71
Table of Contents
Table of Figures Figure 1.1 Volvo car parts value chain from CDC in Sweden to China 2006…………………….......4 Figure 1.1 Inventory carrying cost……………………………………………………………………….…9 Figure 2.2 Difference between heuristic method and theoretical method.................................…...10 Figure 2.3 Delimitation of distribution centre hinterlands .......................................................…...11 Figure 2.4 Center of gravity G in triangle model………………………………………………………. 12 Figure 3.1 Heuristic programme……………………………………………………………………….….16 Figure 4.1 Research Design Process……………………………………………………………………...22 Figure 4.2 How to search published sources of secondary data……………………………………....25 Figure 5.1 Daily orders: remain the current delivery lead-time, reduce transport cost……………30 Figure 5.2 Bulk orders: reduce the average delivery lead-time, reduce transport cost ……………30 Figure 5.3 Divided the market into four areas………………………………………………..…………31 Figure 6.1 Time-constraint boundary………………………………………………………………….….42 Figure 6.2 Cost-equalization boundary…………………………………………………………………..43 Figure 6.3 Distribution centre service areas……………………………………………………………..44 Figure 7.1 Distribution model for DC in Shenzhen……………………………………………………..46 Figure 7.2 LOGWARE data input interface for the north distribution centre module ………….... 48 Figure7.3 LOGWARE roundly computing result of cost minimization for north
distribution centre……………………………………………………………………..……..….49 Figure 7.4 LOGWARE computing result of north distribution centre on coordinate……………….50 Figure 7.5 LOGWARE data input interface for the south distribution centre module……………...51 Figure 7.6 LOGWARE roundly computing result of cost minimization for south
distribution centre…………………………………………………………………………….…52 Figure 7.7 LOGWARE computing result of south distribution centre on coordinate……………….53 Figure 7.8 Two distribution centre decisions with market allocation on the map of China……….54 Figure 8.1 China Ports Top 10…………………………………………………………………………….61 Figure 8.2 Government planned three economic areas in China…………………………………..…63
Table of Tables Table 4.1 Data needs and corresponding method in data collection…………………………..……..26 Table 4.2 Collected data and interpretation…………………………………………………………..….27 Table 5.1 Compare VD among each alternative………………………………………………………...33 Table 5.2 Alt0 to Alt4……………………………………………………………………………………..…35 Table 5.3 Compare VDR among Alt 0 to Alt3………………………………………………………….…35 Table 5.4 Capital cost 2010 (RMB)……………………………………………………………………..…37 Table 5.5 Rental cost 2010 (RMB)…………………………………………………………………………37 Table 5.6 Configuration of distribution centre number and location……………………………..….39

Chapter 1 Introduction
1
Chapter 1 Introduction
1.1Background
China is becoming noticeable in the world due to high increasing rate of GDP. Volvo Car Corporation1 (VCC) which enters this market has a growing market share and profit in China. However, the market expansion gives future challenges of enhancing service level to customers with competitive costs for Volvo Car Corporation. A main alternative to gain competitive advantage in the market is to reduce logistics cost. The logistics cost in China is almost double of which in USA or Japan. It is account of 30% of the China GDP. With the hypothesis that China would possibly reduce the percentage of logistics cost in GDP in 5 to 10 years, Volvo is considering of moving toward to a new supply chain strategy in China, by taking advantages of the improved logistics environment in the future. Entered not very long in the Chinese market, there are still many aspects that can be improved by VCC to reduce its logistics cost and enhance its service level. As a first step, Volvo is considering to reconfigure it distribution centres (DCs) in China, whose function are receiving car parts from central distribution centre (CDC) in Sweden and delivering to the local dealers that serve the end customers. Since the logistics cost of distributing Volvo car part has achieved 9.6 % of the revenue globally. While the figure in China is 11%, almost 3% could be improved. By doing so, Volvo Car could also have more power over its business in China, since its ownership over the parts would possibly extend to inland China, instead of ending at Gothenburg port as today (2006). Therefore, this thesis will serve as a problem solving study to figure out the distribution centre (DC) location selection in China. The information and data required are retrieved either from Volvo Car Corporation, Volvo Car Corporation in China and other relevant official information centres such as National Bureau of statistics of China. The authors of this study are two Master students of Logistics and Transport Management from Gothenburg University in Sweden. The study is supervised by Professor Arne Jensen as well as director Christer Olsson from Volvo Car Corporation.
1 Volvo Car Corporation (VCC), Volvo Car and Volvo, have the same meaning in this thesis

Chapter 1 Introduction
2
1.2 Volvo Car Corporation
1.2.1 Organization
Volvo Car Corporation (VCC)2 is a wholly-owned subsidiary since 1999. It is part of the Premier Automotive Group (PAG) of Ford Motor Company, which also comprising of Aston Martin, Jaguar, and Land Rover. The vision of Volvo is to be the world most desired and successful premium car brand. Volvo currently sells cars in over 100 countries and, only shares a quite small portion (1-2%) of the global market. The largest market is the USA, which accounted for 28% of the total sales volume in 2005. The US is followed by Sweden (12%), Britain (8.6%), Germany (7.9%) and Italy (4.6%). Asia is a small market, however, with one of the most growing market China, which has a market growing rate of 83% in year 2005. The market in China will continue its growth in the future, thus, it is gaining more and more attentions from the Volvo Car Corporation. This study is carried out by the Market Area International department within Parts Supply & Logistics unit. The Parts Supply & Logistics unit belongs to the Customer Service Unit under the Marketing, Sales and Customer Service unit within Volvo Car Corporation. Parts Supply & Logistics, as defined by the corporation, is responsible for global parts logistics. This includes the operation of all Volvo-owned distribution centres, stock levels management and transportation as well as the future development of global parts logistics. The mission for Parts Supply & Logistics is summarized as follows by the unit: 'The logistic system should ensure parts availability, as defined by the market, at the lowest possible cost, by controlling the entire material flow from supplier through dealer network to the end customer'. Hence, this thesis is a preliminary study about the future Volvo business strategy from logistics perspectives to pursue achievement of this mission in China.
1.2.2 Value chain
The current (2006) value chain of Volvo car parts performs similar as any chains of a product in the market. It consists of inbound logistics, operations, outbound logistics, marketing &sales, service, as Porter has defined. However, the scope of this study is mainly about the distribution networks from CDC in Sweden till the end customers in China. The inbound logistics from the suppliers to CDC is not concerned and the operations within a certain DCs will not be discussed as well. 2 http://www.volvocars.com/corporation/default.htm 2006-9-15

Chapter 1 Introduction
3
As what has been illustrated in figure 1.1, the value chain of Volvo car parts delivered to China is pulled by the demand of local customers. The orders go through local dealers, importers and then are responded by CDC. The availability of the parts should be above 95% to satisfy the end customers, which requires off-the-shelf delivery at the dealers. It means most of the customers' requirement should be satisfied immediately when they place order at the dealers. However, when the dealer is out of stock in this situation or when there is a back order, VOR (Vehicle Off Road) comes into process. The policy for VOR is that the parts should be ready within 24 hours and delivered to the customers as soon as possible. VOR is air shipment delivery for unexpected emergency demand from the downstream. It is not encouraged to happen because of high-cost and delay on meeting customers requests, which, however, is not preventable. To keep this service level at the very downstream, the dealers place their orders to the importers through Dealer Management System (DMS). There are three levels of orders: Bulk order, Daily order (Consolidated order), or VOR. Bulk order is for stock keeping at certain level. Daily order is for a more emergency request. In order to support the dealers, the importers refill their stock by entering the ordering system at CDC. In this particular process: Bulk order has a delivery frequency one boat order per two weeks for stock keeping at importers, whose lead time is six weeks; Daily order presents two air orders per week when the importers get a more emergency demand order from the dealers. The lead time for this kind of order is one or two days. VOR, although seldom happens for the market in China, means the shipment would be ready within one day, whenever there is a request. All the shipments would be sent to the importers first who then distribute to the downstream. Any direct delivery from CDC till dealers or end customers would not happen. The parts delivering process to China is act as a customer service to the Volvo car buyers. Therefore, it both performs as a value adding process itself and value adding to the Volvo car sold in China. This research is to enhance these value adding processes and to provide higher service level within the possible lowest cost to Volvo customers.

Chapter 1 Introduction
4
Figure 1.1. Volvo car parts value chain from CDC in Sweden to China 2006
1.3 Problem
It is estimated that Volvo Car would have an increasing sales volume in China in 5 to 10 years. The sales volume of Volvo cars would reach 62,250 units in 2010, which is a
End customers
Dealers
Importers
Research Boundary
Suppliers
Dealer Management System (DMS)
• Bulk order ---1 boat order/ 2 weeks, LT= 6 weeks (4 weeks on transportation) • Daily Order (Consolidated order) ---2 air orders/week, LT=1 or 2 days • VOR as required, be ready in 24 hours
Ordering system in CDC
Transport
Order
• Off-the-shelf delivery • VOR as required, be ready in 24 hours
LT= lead time
Stock Refill
• Bulk Order (Refill order) 1/week, LT=2hours to 6days
• Daily Order 1-2/day, LT= 2hours to 2days
• VOR as required, within 24hours
Upstream
Downstream
Central distribution centre (CDC) in Göteborg

Chapter 1 Introduction
5
700% growth rate compared with 20063. The demand of Volvo cars parts would be increase also, but the growth rate would lagging behind the 700% growing rate, since it takes a few years for brand new cars to wear out and consume parts. So, Volvo has predicted a 400% growing rate in the sales volume of Volvo car parts in 2010. In order to cope with the appealing growing after sale market, to improve the current service level, and to minimize cost for the expected service level, Volvo Car intents to redesign the distribution system in China. The problem in this thesis is to see how to reconfigure the car parts distribution centres in China, including figuring out the optimal number and locations of the DCs as well as the market allocation to each DC, in order to help Volvo Car to be better survived and more profitable in the future dynamic growing market in China.
1.4 Purpose
The purpose of this study is to make a pre-study for Volvo Car Corporation in China of the effects of alternative systems of distribution centres for spare parts with satisfactory performance in term of customer service. It gives recommendations to Volvo Car Corporation on how many DCs they could have in China mainland and where the DCs are located in 5 to 10 years future. The study will find out the ideal logistics network that Volvo Car Corporation could have in China to reduce supply chain cost, add values to the products and provide better customer service. To complete this purpose, the study would decide the optimal number of distribution centres by choosing one from the alternative models. The alternative models represent different options of the number and locations of candidate distribution centres. By evaluating the total cost of each configuration based on transit time (lead time) restrictions and necessary assumptions, and by elaborating the overall transport and economic situation in China, the study would draw a conclusion of where are the satisfying locations. The thesis would base all the calculation on estimated data regarding 5 to 10 years scope in order to simulate the future market. The final recommendation is also based on the predictions of external environment in China as well as the internal business demands from Volvo Car Corporation in 5 to 10 years. Because of the foresight of this study, the authors together with Volvo Car Corporation would also like to present other foreign investors who are interested in China a valuable piece of work.
3 Source: Volvo Car Corporation

Chapter 1 Introduction
6
1.5 Delimitations
1.5.1 Time delimitation
The time span of this study is half a year from August 2006 to January 2007. It means the calculations in this thesis are based on accessible data during this time. It determines that the study about China logistics environment deals only with the main points of each aspect that the study covers, instead of going into details of the facts about China. Also, it means accessible information after this time period will not be addressed.
1.5.2 Accessibility of information
Due to confidential issues, this study does not, in any extent, base on interviews with any potential local third party logistics companies on behalf of Volvo Car Corporation. This is in order not to confuse any kind of parties with the idea that Volvo Car Corporation is willing to give any business offers to them. Therefore, the authors of this study do not get any information about operational cost and transportation cost from any potential local third party logistics companies. Instead, the authors only collect data from Volvo Car Corporation internally, existing business partners such as Schenker and logistics literatures as well as government materials. Together with the time delimitation, the study of logistics environment in China is based on facts that mostly retrieved from online materials published by the central Chinese government. This implies the information retrieved from this study would be to some extents impartial and subjective.
1.5.3 The scope of the content
After interviewing Volvo, the authors have narrowed down the scope of the content in several aspects.
The depth of the content As China is a dynamic market with unpredictable changes everyday. The study could not give recommendation about the exact address of the DC location in 5 to 10 years. The more it goes into detail, the more opportunity of making mistakes it will be. Thus, the thesis would come to a conclusion about the number of distribution centre and which city or special area the distribution centre would be located.
The ownership of the distribution centres
Chapter 1 Introduction
7
The distribution centres in China in the future might be outsourced to a third party logistics or owned by Volvo Car itself or still operated by the existing importer. However, it is not in the scope of this study to consider which kind of operating mode is optimal.
Existing importers There are two existing importers in China: Shenzhen and Shanghai. The latter will be closed down recently. This part of distribution network in China is mainly based on the history that the importer in Shenzhen is an efficient partner for Volvo. It is, to some extent, also the reason why Volvo car chose Hongkong to import the parts, and then trucked to Shenzhen importer. However, in this study, Volvo car expects a blueprint without considering the current location of import ports or importers. The assumption is that the parts could be imported from any efficient ports along the Chinese coast and from any qualified airports, which is studied and decided by the authors.
Local production It is a trend to produce some of the car parts in China as a strategy to lower the product cost. If so, the supply network might be changed. However, under the prediction from Volvo, there would be at least 50% of the products still shipped from the central warehouses in Sweden. Thus, local production in China would not be taken into consideration in this study.

Chapter 2 Theoretical Framework
8
Chapter 2 Theoretical Framework
Theoretical framework explains specific important terms, models and criteria used in this study. It guides the authors to make their decisions based on scientific theories or principles, to ensure the study is reasonable and convincing.
2.1 Value chain
The value chain of an organization is composed of a series of value generating activities that bring the company competitive advantages and create values. Michael Porter’s value chain model4 introduces the sequence of activities as: inbound logistics, operations, outbound logistics, marketing &sales, service. The firm’s infrastructure, HR, technology and procurement are those activities operating across the whole processes. The vertical processes with horizontal activities interacts together to generate profit for the organization. This concept of value chain has been termed as 'value system' by Porter when it extends beyond an individual organization. It can describe the whole supply chain and distribution networks, which in one direction extends to a firm's upstream suppliers and in the other direction to the firm's downstream customers. Thus, in this study the concept of value chain goes beyond a single organization.
2.2 Inventory carrying cost
Robert Lamarre defines inventory carrying cost as: money and other resources (e.g. space) that are tied up when inventory is held. Usually, the cost of inventory carrying cost is expressed as a percentage of inventory value. Typical figures used by inventory professionals vary anywhere from 15% to 43%5. Figure 2.1 illustrates various costs that involve in the inventory carrying cost. In which capital cost is the main factor in determining the inventory carrying cost.
4Michael E. Porter, Competitive advantage, The Free Press, 1985 5Robert Lamarre, Determining the cost of carrying inventory or the magic number, Associates Management Consultants, 2003

Chapter 2 Theoretical Framework
9
Figure 2.1. Inventory carrying cost6
2.3 Heuristic method
Heuristic method aims to achieve satisfying, though not necessarily optimal solution to the real problems within limited research time and for which exact optimal procedures are unavailable or inappropriate, as it is often the case.7 The heuristic method could be used in any business environment and it is getting very popular in the research world, since it represents the reality good enough, very frequently better than the pure theoretical method. The difference between heuristic method and pure theoretical method is shown in Figure 2.2. Heuristic method based on the assumptions that are more close to the reality than theoretical method. But it could not draw an optimal solution to the problems, which usually based on strict scientific restrictions. However, since the heuristic method is guided by thumb of rules, which will lead to a satisfied solution, even it does not go into details of the problems. The thesis tried to solve the distribution centre number and locations problem by producing its own heuristic programme based on the predictions from Volvo of future Volvo car parts market in China. The own heuristic programme would be illustrated more clearly in Chapter 3.
6REM associates 7http://www.lums.lancs.ac.uk/Postgraduate/MScOR/Modules/Heuristic 2007-1-5
Inventory carrying cost
Capital cost Inventory service cost
Storage cost (Rental warehouse)
Inventory risk cost
Handling cost
Insurance Tax Obsolescence
Damage, etc

Chapter 2 Theoretical Framework
10
Figure 2.2. Difference between heuristic method and theoretical method
2.4 Delimitation of distribution centre hinterlands
When distributing goods to different customers in the downstream, it is often the case that the customers would receive their orders from the nearest distribution centre if there are more than one supply points. If this is the case, the market areas that each distribution centre serves should be decided in advance. The service areas that each distribution centre targeting at are also called distribution centre hinterlands. The way to set the delimitation of each distribution centre hinterland could be followed by the rules as followed. First of all, there is a possibility to draw a time-constraint boundary around each distribution centre. The time-constraint boundary decides the service boundary that a certain transport mode would reach with certain time window. See figure 2.3 quoted from McKinnon, 1989, the depot in the figure has the same meaning as distribution centre in this thesis. Additional transport cost would be charged once a market is out of the boundary, since there would be a changing of transport mode or an adding of distribution centres in areas out of boundary to reduce the transit time. Secondly, there is an intersection area formed by the time-constraint boundaries between the neighboring distribution centres. From which distribution centre the intersection area would be served is determined by the capacity of each distribution
Real world
Model world that represents the real world
Heuristic method
Theoretical method
Assumptions close to reality
Theoretical assumptions
Optimal solution
Satisfied solution

Chapter 2 Theoretical Framework
11
centre and the delivery cost from each distribution centre. If the capacity of both distribution centres could satisfy the demand, a cost-equalization boundary needs to be drawn to divide the intersection area. Hence, ISO-cost line should be drawn to represent the same delivery cost from the distribution centre it surrounded. The cost-equalization boundary is then decided by linking the overlapping points of ISO-cost lines around the neighboring distribution centre. The overlapping points must show the same delivery cost from each distribution centre. After all, the cost equalization boundary draws a line between the neighboring distribution centre service areas. The market areas that out of the time-constraint boundaries would be evaluated again to see how much cost should be added to keep a service level as same as the market inside the time-constraint boundary.
Figure 2.3. Delimitation of distribution centre hinterlands Source: Physical distribution systems 1989 [Reproduced with permission from the author Alan C. McKinnon]
2.5 Center-of-gravity method
Center-of-gravity (COG) model applied in this study is a common used tool which optimal decision is given by calculating the minimization of weight and distance distributed, namely ton-kilometer optimization. It is an approximate optimal solution to make the decision both close to plants and customers and counts for the minimal total cost of transport. Center of gravity theory comes from the geometric and physics theories. The center of gravity is a geometric property of any object and also it is the average location of the

Chapter 2 Theoretical Framework
12
weight of an object.8 The location can be found in calculating the coordinates of x and y by finding central gravity G of known points model in mathematic way, as the triangle model demonstrates in figure 2.4.
Figure 2.4. Center of gravity G in triangle model When it is applied to logistics, the center or gravity position represents the position bearing the lowest distribution cost to serve several destinations. The result is carried out by the formula:
TC = total transportation cost (RMB) Min TC=∑ViRidi Vi = volume at point i (Tonnage)
Ri =transportation rate to point i (RMB/ton/km) di = distance to point i from the facility to be located (Kilometre) i = the known point which has goods flow with the facility to be
located Center-of-gravity method could be applied to both single location decision and multiple locations decision. Single location decision could use the formula for deciding only one facility location for the known market, while multiple locations decision will decide two or more facility locations for the predefined market. The predefined market is marked as point 1 to point i, in which the number is decided according to the case. The optimal location decision will be given in a specific point within the market area on the coordinate or map after the calculation. At the same time, the total cost of the optimal decision from the model will be illustrated as well.
2.6 Mixed-Integer linear programming
A mixed-integer linear programming (MILP) is a mathematical program with linear constraints in which a specified subset of the variables is required to take on integer values.9
8http://www.lerc.nasa.gov/WWW/K-12/airplane/cg.html 2006-10-3 9J. T. Linderoth, T. K. Ralphs, Noncommercial Software for Mixed-Integer Linear Programming, 2005
G
Y
X
0
Chapter 2 Theoretical Framework
13
Mixed-Integer linear programming method is emphasized on handling the fixed cost in the optimal way. Also it deals with the allocation of demands. Normally this is conducted by computer software packages due to lots of calculation work and usually the software for commercial purpose is more suitable for this method to use rather than just use the open source to give simple calculation.
2.7 Sensitivity analysis
A sensitivity analysis is the process of varying model input parameters over a reasonable range (range of uncertainty in values of model parameters) and observing the relative change in model response.10 This theory could be used to test the sensitivity effect of varying input factors in the chosen model. Some sensitive factors could bring large changes in results with small changes of input parameters while other insensitivity ones do not to affect the outcomes. Accordingly, this method could be used to analysis the model of center-of-gravity and examine how the changes in the input factors would effect the decision of location. The thesis will chose the factors that are within the model input and this analysis is to help understanding the results better.
2.8 Distribution centre location select factors
As Frank W. Renshaw, P.E. discussed in the Natural SELECTION11 theory, selecting a distribution center site is one of the most important and far-reaching strategic decisions that the management of a growing fulfillment company will make. The factors and selection criteria for the companies vary from industry to industry, from business to business. However, there are general rules imply to all the cases, which is specified as follow:
1. Transport Access to interstate highway system Access to major carriers and terminals Proximity to airports and small-package hubs Adequacy of highways and roads Transportation cost and service
2. Labor 3. Quality of life 4. Site and Local Government
Tax structure and tax abatement opportunities 10http://www.michigan.gov/deq/0,1607,7-135-3313_21698-55865--,00.html 2006-10-3 11Frank W. Renshaw, Natural SELECTION, 2002
Chapter 2 Theoretical Framework
14
Building construction codes and restrictions Availability of financial aid for project Training incentives Planning and zoning

Chapter 3 Problem Analysis
15
Chapter 3 Problem Analysis
Demanding requirement from customers, fierce competition in automobile market and dynamic changing car market in the future, invariably determine the necessarily of having this pre-study to answer the questions of the number and location of the distribution centres. This chapter is going to explain the procedure of problem analysis and the information or data needs in the analysis. The problem analysis is going to be carried out by a heuristic programme produced by the authors, which contains various location selection methods and takes necessary factors into consideration. It will at the end lead to a reasonable answer to the location selection problem. The programme could also be adjusted and applied to similar problem analysis based on given assumptions. The heuristic programme consists of three main parts: Macro analysis, Decision of distribution centre areas and Micro analysis. The first step solves the problem that how many DCs are reasonable. It will also present a macro level about where to locate the DCs-for instance, the southeastern of China mainland. The analysis is based on collected data and interpretation, which will also be applied by later steps. The second step is to adjust and define the areas that are served by each distribution centre by applying the delimitation of distribution centre hinterlands theory. It is based on the conclusion from macro analysis. The last step is to give suggestions on where these DCs are located based on the center of gravity method in micro analysis. It emphasizes on the other factors that has not been discussed in the macro analysis and bases on the distribution areas that has been decided in step two. Step three would at last followed by the analysis of external environment, such as transport, economy situation in China, which explains the real situation in China in 5 to 10 years. This logical heuristic programme process is described as in figure 3.1.

Chapter 3 Problem Analysis
16
Figure 3.1. Heuristic programme

Chapter 3 Problem Analysis
17
3.1 Data collection and interpretation
The authors start the search of information and the collection of data based on Colye’s criteria. Colye12 points out the essential information needs for solving logistics problems are usually as follow:
Customer requirements and key environmental factors Key logistics goals and objectives Profile of the current logistics network and the firm’s positioning to respective
supply chain(s) Benchmark, or target, values for logistics costs and key performance
measurements Identification of gaps between current and desired logistics performance
Necessary data and information needs will be presented in each analysis procedure in this Chapter. The heuristics programme would then solve the problem based on the collected and interpreted data.
3.2 Macro analysis
3.2.1 Procedure
Step 1 Define of the macro analysis The purpose here is to answer the question of how many warehouses there should be and in which area (North, west, south, and east for example) they are located.
Step 2 Modeling alternatives In order to evaluate how many DCs are feasible for Volvo Car to compete in the Chinese market, the study bases on the assumption that there are five modeling alternatives (Alt0 to Alt4) ready to be chosen. Under these five modeling alternatives there would be secondary alternatives. The modeling alternatives evaluate the result of having one to four distribution centres. The upper alternative would be four distribution centres situated in China. As the authors assume that it is not as cost efficient as the other alternatives, though it will bring a higher service level that might even unnecessary. All of the modeling alternatives are under the same transit time restriction assumption according to the criteria from project team.
Step 3 Methods For macro analysis, minimizing the total transport cost with a consideration of major 12John J. Coyle, Edward J. Bardi, C. John Langley Jr., The management of business logistics: a supply chain perspective, South- Western, Thomson Learning, 2003

Chapter 3 Problem Analysis
18
factors in inventory carrying cost would be the basic method to decide the optimal location and number of DCs. For each alternatives, different combinations of DCs will be evaluated under assumptions and certain lead time restrictions. Finally, a comparison analysis of various alternatives in made.
Step4 Result of the macro analysis At this very stage, a matrix should be presented at the end for the reader to understand which modeling alternative is outweighing the others in total logistics cost. The one with the highest key performance indicator would be chosen for deeper analysis in the micro analysis.
3.2.2 Data needs
Estimated car parts sales volume to 46 dealers in 2010 (Tonnage) Actual driving distances between major cities that dealers located (Kilometer) Actual air distance between major cities that dealers located (Kilometer) Estimated road transport rate in 2010(RMB/ton/km) Estimated air transport rate in 2010 (RMB/ton/km) Estimated capital cost in 2010 (RMB) Estimated rental cost for one DC in 2010 (RMB) Transit time between major cities that dealers located (hours) Estimated consumer price index13 (CPI) (%)
3.3 Distribution centre service areas
3.3.1 Procedure
The purpose here is to adjust the service areas that each distribution centre targeting at, since the macro analysis divides the market according to market share and the geographical situation in China. It is a reasonable assumption which might have the same result as retrieved from this part, but it is always good to demonstrate the accuracy of a business decision by theory instead of experience or commonsense.
3.3.2 Data needs
Actual driving distances between major cities that dealers located (Kilometer) Estimated road transport rate in 2010(RMB/ton/km) Transit time between major cities that dealers located (hours)
13 See Appendix Ⅰ
Chapter 3 Problem Analysis
19
3.4 Micro Analysis
3.4.1 Procedure
Step 1 Define of the micro analysis The purpose here is to answer the question of where the distribution centres locate within certain area from the results of Macro analysis and Distribution centre service areas.
Step 2 Methods Two methods would be mentioned here: centre-of-gravity and Mixed-integer linear programming. The method applying in this step gives continuous solution to decide the exact optimal location base on the results from the macro analysis and distribution centre service areas. Actually, only programming of centre-of-gravity will be used in this thesis due to its feasibility and popularity. The mixed-integer linear programming is a more into detail methodology, which is however the most popular methodology used in commercial location models14. Volvo Car is suggested to try this methodology as the situation in China gets clearer in the future. Therefore, the authors will give an introduction of the approach and list the essential information that shall be known before applying it.
Step 3 Result of the micro analysis The results from micro analysis narrow down the decision of macro analysis and give specific optimal location decision that is ready to be evaluated in the external environment analysis part.
3.4.2 Data needs
Location data for dealers, ports, airport converting from longitude and latitude on coordinate (X,Y)
Estimated car parts sales volume to 46 dealers in 2010 (Tonnage) Estimated road transport rate in 2010 Estimated programming coefficient in the centre-of-gravity module
14Ronald H. Ballou, Business logistics management: planning, organizing, and controlling the supply chain, 4th Edition, Prentice Hall, 1992 , P504

Chapter 3 Problem Analysis
20
3.5 External environment analysis
A deep study of the proposed location will be illustrated here. In order to research clearly on this, the background research including the economic situation, infrastructure, transport condition, geographical network layout, government policy, etc are all necessary subparts for this subject. It will study the situation and trends in China, with a focus on the potential locations. If the collected information shows that the proposed location is not realistic, the sub-problems would in turn take a deep study into other locations.
3.5.1 Procedure
Step 1 Sub problems study
3.5.1.1 Sub-problem 1: Transport situation study
Since the transport cost and transport mode are the main perspectives in this thesis to solve the location problem. It is important to know the practical situation and developing trend in 5 to 10 years about transport situation in China. This study will conduct the overall transport situation study into the listing sectors:
Road transport Rail transport Air transport Sea transport
3.5.1.2 Sub-problem 2: Economics and policy
Economic growth and policy trend will be studied in this part in order to understand the background for implementing Volvo Car business strategy in China. Rather than collecting the information about the overall policies, the policies that relevant to this study are emphasized. For instance, the special economic areas with high investment density and Free Trade Zone will be explained. This part is mainly about the government issues and policy study; hence, most information will come from the government official sources such as Ministry of Commerce of China, China daily, etc.
Step 2 Result of external environment analysis Finally, there will be locations that are relatively feasible for Volvo car to set distribution centres.
Chapter 3 Problem Analysis
21
3.5.2 Data needs
Transport statistic data of different transport modes Government economic policy documents Transport evaluating information from academic organization Business information The 11th Five-year plan15
3.6 Conclusion
The conclusion of the heuristics programme is presented here by summarizing the results from the methods and the research on external environment analysis. It is the ending of the whole thesis with recommendations to Volvo Car Corporation in future study and decision making.
15 See Appendix Ⅰ

Chapter 4 Methodology
22
Chapter 4 Research Design (Methodology)
4.1 Research process
Figure 4.1. Research Design Process The research design process is showed in figure 4.1 with a beginning of a defined purpose. The main problem based on it, is then divided into several structured sub problems. Those sub problems generate different aspects of information needs for research input requirements. Data collection is to fulfill these input requirements. The process of analysis and interpretation is to process and analyze the collected data. Before the researchers come to the conclusion of the study, it is also necessary to examine whether those analysis and interpretation of data deal with the problem and whether they are identical with the purpose. Then the process could come to the last step of generating outcome as the conclusion for the study.
Purpose
Problem definition
Sub problem 2
Data Collection
Data Analysis and Interpretation
Sub problem 1 Sub problem n
Conclusion
Feedback
Information need 1 Information need n

Chapter 4 Methodology
23
4.2 Research design
Research Design is a blueprint for completing a research that ensures the study is relevant to the problems. It guides the researchers to collect and analyze data to fulfill the task in an economical way. There are three basic types of research design: exploratory, descriptive and causal.
4.2.1 Exploratory research
The major emphasis in exploratory research is on the discovery of ideas and insights16. It is used to have the researchers to be familiar with the problems, especially, the problems that is large, vague and not within the researcher’s area before. Specifically, the function of exploratory research could be the following:
An exploratory research helps the researcher to bring the problems into small sub-problems, which are easy to be understood and solved.
An exploratory helps the researcher to find out the hypothesis to the problems. It may also be used as a tool to clarify the concept in the study.
The most common tools for exploratory research are:
Literature search: an exploratory research mostly based on secondary data collection to gather the general information and ideas about certain problems.
Interviews: this is a tool to get knowledge from those who familiar with the subjects.
4.2.2 Descriptive research
Descriptive research encompasses an array of research objectivities. It is not simply a gathering of information through internet17. A good descriptive research extracts knowledge from the phenomenon or facts. It could also gives out ideas and prediction about the future.
4.2.3 Causal designs
The causality could be simply understood as the statement ‘A causes B’. The scientific concept of ‘A causes B’ is not the same as the commonsense. It is not saying that A definitely causes B or A is the only factors that causes B, but it mean A is most 16Gilbert A. Churchill, Jr. and Dawn Iacobucc, Marketing research: Methodological foundations, Thomson south-western, 2005, p74 17Gilbert A. Churchill, Jr. and Dawn Iacobucc, Marketing research: Methodological foundations, Thomson south-western, 2005, p107

Chapter 4 Methodology
24
likely causes B. It puts emphasis on the strong relationship between A and B.
4.3 Business research methods
Business research methods include quantitative research and qualitative research. In this study, the authors will analysis the logistics environment in China by referring to the qualitative information. Meanwhile, quantitative data is taken into the calculations. All in all, it is convincing to apply numerical data in order to analyze the facts and forecast the trends.
4.3.1 Quantitative research18
It is entailing the collection of numerical data and as exhibiting a view of relationship between theory and research as deductive, a predilection for a natural science approach (and of positivism in particular), and as having an objectivist conception of social reality.
4.3.2 Qualitative research
It is a research strategy that usually emphasizes words rather than quantification in the collection and analysis of data.
4.4 Data collection
The purpose of writing this study decides the information the authors need for research. According to the research design and method the authors need specified data as research input to process.
4.4.1 Type of data
The data collected could be classified into two types as primary data and secondary data. The sources of secondary data could come from either internal or external.
4.4.1.1 Primary data
It is the data that collected specifically for the study needs at hand.19 In some cases, the researchers need to get the new data by their own work either from calculating
18Alan and Emma, Business research method, Oxford University, 2003 19Kinnear and Taylor, Marketing Research, an applied approach, 5th edition, McGraw-Hill, 1996, p176
Chapter 4 Methodology
25
based on raw data or from communication. It could be conducted by doing survey, questionnaire, telephone interviews etc.
4.4.1.2 Secondary data
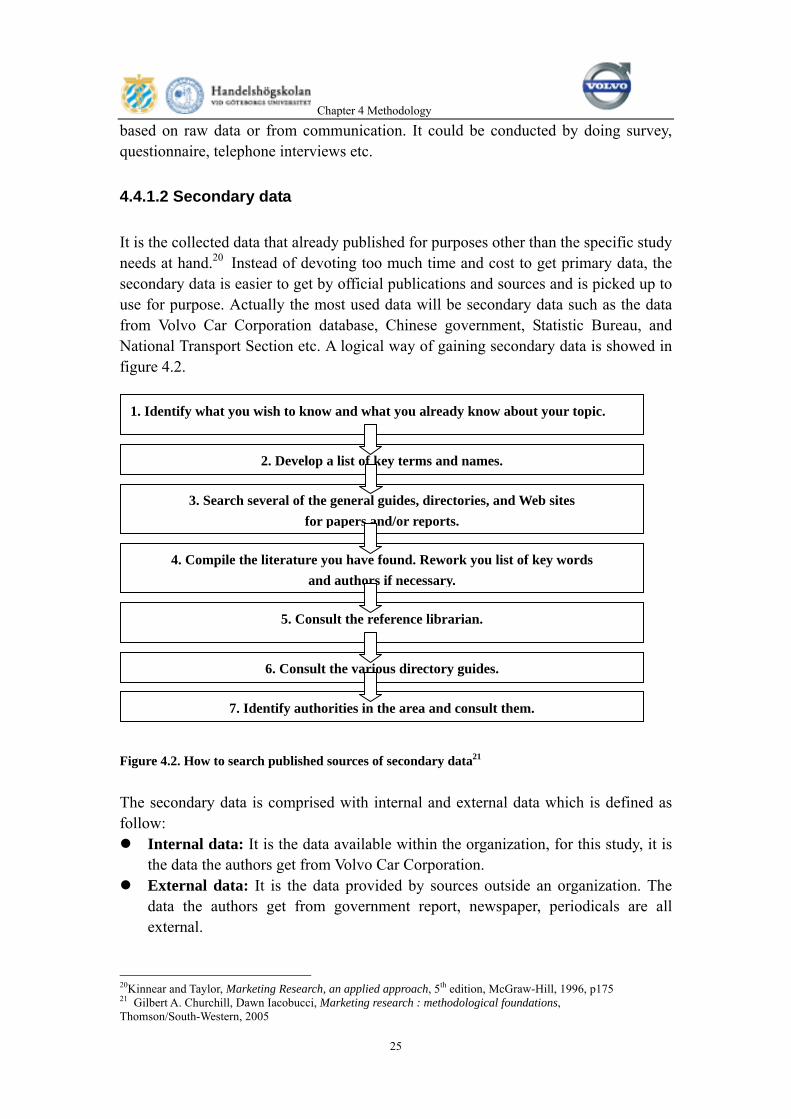
It is the collected data that already published for purposes other than the specific study needs at hand.20 Instead of devoting too much time and cost to get primary data, the secondary data is easier to get by official publications and sources and is picked up to use for purpose. Actually the most used data will be secondary data such as the data from Volvo Car Corporation database, Chinese government, Statistic Bureau, and National Transport Section etc. A logical way of gaining secondary data is showed in figure 4.2.
Figure 4.2. How to search published sources of secondary data21 The secondary data is comprised with internal and external data which is defined as follow:
Internal data: It is the data available within the organization, for this study, it is the data the authors get from Volvo Car Corporation.
External data: It is the data provided by sources outside an organization. The data the authors get from government report, newspaper, periodicals are all external.
20Kinnear and Taylor, Marketing Research, an applied approach, 5th edition, McGraw-Hill, 1996, p175 21 Gilbert A. Churchill, Dawn Iacobucci, Marketing research : methodological foundations, Thomson/South-Western, 2005
2. Develop a list of key terms and names.
1. Identify what you wish to know and what you already know about your topic.
3. Search several of the general guides, directories, and Web sites for papers and/or reports.
4. Compile the literature you have found. Rework you list of key words and authors if necessary.
5. Consult the reference librarian.
6. Consult the various directory guides.
7. Identify authorities in the area and consult them.
Chapter 4 Methodology
26
4.4.2 Communication method
4.4.2.1 Interview
As the Association for Qualitative Research defines, interview is the contact with a respondent, or group of respondents, in order to obtain information for a research project.22 For this study, interviews will be conducted within Volvo Car Corporation to get information and data needed. There will be information needed for the study either from company’s level or from the local level, namely China branch. The authors will conduct the interviews with face by face with the respondent if it is possible. Otherwise, Email via Internet or telephone communication will be applied.
4.4.2.2 Internet method
Due to time and resource limit, Internet would be a powerful objective and method of data collection for this study. It will be used widely and in variable areas. The Internet collection of data is not only a tool to look through and get data from webpage or e-books, but also a multimedia functionality that could be used. During qualitative research, the authors could use online focus groups, online personal interviews, online social surveys (email survey, web survey) to collect data. Online focus group: discussion towards specific questions could be conducted by a
group of associated people using online internet discussion room.
Online personal interviews: specific question towards specific person could use Internet to have interviews by online communication tools
Online social survey: social survey could be uploaded to internet instead of distributing and collection.
4.5 Data needs and collecting methods
The information and data needs presented in Chapter 3 are collected and interpreted by applying the described methodology above. It is shown in table 4.1 how the data and information are collected. Table 4.1. Data needs and corresponding method in data collection Data and information needs Data type Collecting
22http://www.mrs.org.uk/mrindustry/glossary.htm 2006-10-12

Chapter 4 Methodology
27
methods Estimated car parts sales volume to 46 dealers in 2010
(Tonnage) Estimated road transport rate in
2010(RMB/ton/kilometer) Estimated air transport rate in 2010 (RMB/ton/kilometer) Estimated capital cost in 2010 (RMB) Estimated rental cost for one DC in 2010 (RMB)
Primary data Interview
Estimated coefficient in the programming module Primary data Literature Location data for dealers, ports, airport converting from
longitude and latitude on coordinate (X,Y) Primary data Internet
method Actual driving distances between major cities that dealers
located (Kilometer) Actual air distance between major cities that dealers
located (Kilometer) Estimated consumer price index (CPI) (%) Transit time between major cities that dealers located
(hours) 11th five year plan in the transport development section Transport statistic data of different transport modes Government economic policy documents Transport evaluating information from academic
organization Business information
Secondary data
Internet method
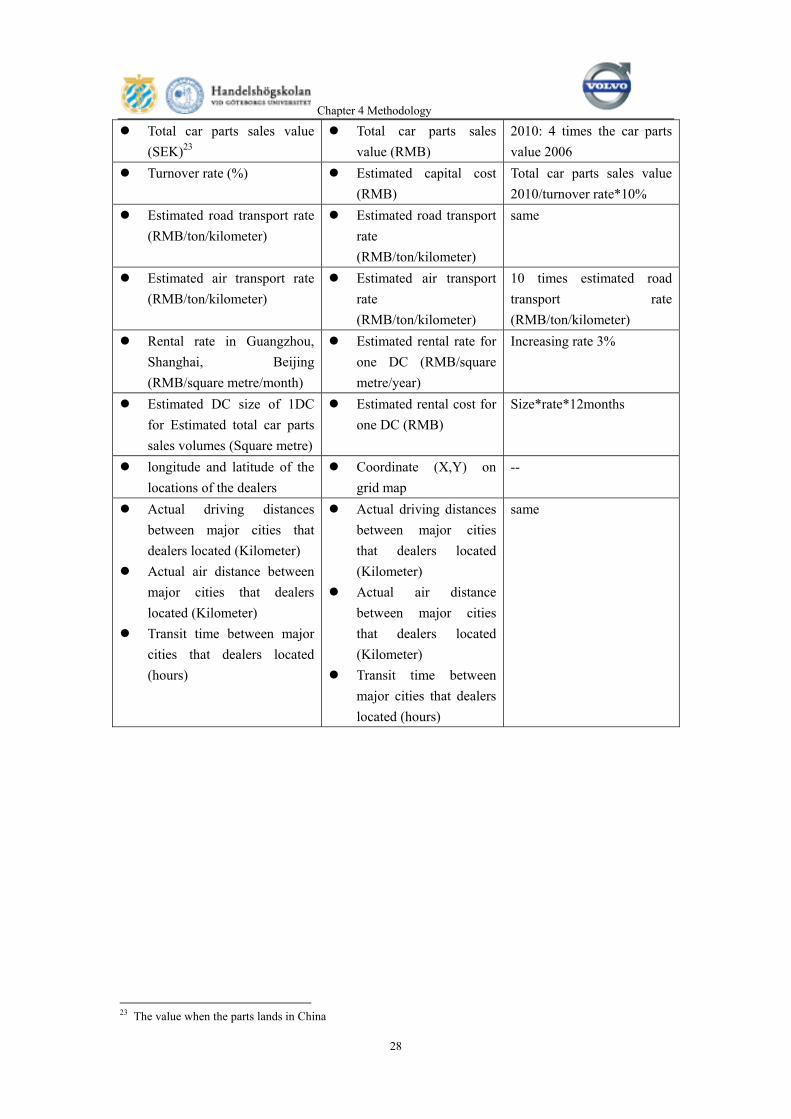
4.6 Collected data and interpretation
According to the data needs shown in table 4.1, necessary data is gathered and interpreted by the authors before applying the methods, including internal data from Volvo and external data from other sources. It is shown in table 4.2. Table 4.2 Collected data and interpretation Collected data (2006) Interpretation (2010/2011) Explanations
Dealers distribution Dealers distribution same A prediction of car sales
market share in each market (%)
Estimated car parts market share in 46 dealers (%)
same
Total car parts sales volume (tonnage)
Estimated total car parts sales volumes (tonnage)
2010: 4 times the car parts sales volume 2006
Chapter 4 Methodology
28
Total car parts sales value (SEK)23
Total car parts sales value (RMB)
2010: 4 times the car parts value 2006
Turnover rate (%) Estimated capital cost (RMB)
Total car parts sales value 2010/turnover rate*10%
Estimated road transport rate (RMB/ton/kilometer)
Estimated road transport rate (RMB/ton/kilometer)
same
Estimated air transport rate (RMB/ton/kilometer)
Estimated air transport rate (RMB/ton/kilometer)
10 times estimated road transport rate (RMB/ton/kilometer)
Rental rate in Guangzhou, Shanghai, Beijing (RMB/square metre/month)
Estimated rental rate for one DC (RMB/square metre/year)
Increasing rate 3%
Estimated DC size of 1DC for Estimated total car parts sales volumes (Square metre)
Estimated rental cost for one DC (RMB)
Size*rate*12months
longitude and latitude of the locations of the dealers
Coordinate (X,Y) on grid map
--
Actual driving distances between major cities that dealers located (Kilometer)
Actual air distance between major cities that dealers located (Kilometer)
Transit time between major cities that dealers located (hours)
Actual driving distances between major cities that dealers located (Kilometer)
Actual air distance between major cities that dealers located (Kilometer)
Transit time between major cities that dealers located (hours)
same
23 The value when the parts lands in China

Chapter 5 Macro Solution
29
Chapter 5 Macro Solution
5.1 Introduction
This chapter will give a solution to the Macro analysis illustrated in chapter 3.1:
What is the optimal number of distribution centres? Where are optimal areas in macro sense of the distribution centres?
Macro solution roots its problem solving procedure based on the heuristic method. Since the heuristic method contributes to reduce the research time, represents the reality and comes to satisfactory solution quality.24 The problem solving first bases on the principle of comparing and minimizing ton-kilometers in deciding the DC numbers and macro level locations. The only factors are volume to each dealer and the distance from candidate DCs to the dealers. Further in the chapter, the transport rate either by road or by air will be taken into consideration, in order to evaluate the total cost by considering the transport cost and major factors in the inventory carrying cost. All the calculation and analysis in Chapter 5.4 is based on the restrictions and assumption in Chapter 5.2 and 5.3.
24Ronald H. Ballou, Business logistics management: planning, organizing, and controlling the supply chain, 4th Edition, Prentice Hall, 1992, p504

Chapter 5 Macro Solution
30
5.2 Transit time restrictions
Figure 5.1. Daily orders: remain the current delivery lead-time, reduce transport cost
Figure 5.2. Bulk orders: reduce the average delivery lead-time, reduce transport cost An optimal choice of the locations and the number of distribution centres could mean that it will minimize the logistics cost and improve the transit time. To simplify the problem, the assumption here is only to consider the delivery lead-time (also as transport transit time) from the candidate DC to the dealers as the indicator that evaluating the delivery lead time and transport cost as the major factor in logistics cost. Today, 90% of the dealers could be reached within 24 hours by air if necessary and only dealers at remote area like Urumqi will be delivered beyond 24 hours. It seems a transit time short enough. However, it happens only toward VOR orders or when the parts are transported to the dealers that closed to the importers. When it comes to bulk orders, there is a transit time of 6 days to remote area, which is a long transit
Volvo Future
Volvo Today
Transport cost
Delivery lead-time (Bulk order)
Volvo Future
Volvo Today
Transport cost
Delivery lead-time (Daily order)

Chapter 5 Macro Solution
31
time comparing with only 2 hours to the nearest dealers from the importers. This is a delivery lead-time that could be improved. The focus of the study, however, starts with the daily orders. Although most of the dealers could be reached within 2 day, the transport mode to most of the dealers is air transport, which is very cost-consuming. If most of the daily orders could be satisfied around 2 days, but by road transport, it is regard as a cost-efficient transit time in this study. In this case, the transit time for bulk order would in average be improved at the same time. The method in this chapter will be contributed in realizing this cost-efficient situation as showed in figure 5.1 and figure 5.2. Both reduce the average delivery lead-time of bulk order and reduce the overall transport cost.
5.3 Assumptions
1. Divide the market into four areas according to the Chinese geographical situation and the market cluster distribution as shown in figure 5.3. Usually, the four areas are regarded as: 1 Eastern China, 2 Southern China, 3 Western China and 4 Northern China.
沈阳Shenyang
杭州Hangzhou
北京Bei j i ng
上海Shanghai
广州Guangzhou
深圳Shenzhen
重庆Chongqi ng
成都Chengdu
天津Ti anj i n
南京Nanj i ng
苏州Suzhou
济南Ji nan
大连Dal i an
武汉Wuhan
郑州Zhengzhou
福州Fuzhou昆明
Kunmi ng 东莞Dongguan
太原Tai yuan
青岛Qi ngdao
宁波Ni ngbo
汕头Shantou佛山
Foshan
中山Zhongshan
哈尔滨Har bi n
南宁Nanni ng
长沙Changsha
厦门Xi amen
石家庄Shi j i azhuang
西安Xi ’an
乌鲁木齐Ur umchi
合肥Hef ei
兰州Lanzhou
南昌Nanchang
3
4
2
1
Figure 5.3. Divided the market into four areas
Chapter 5 Macro Solution
32
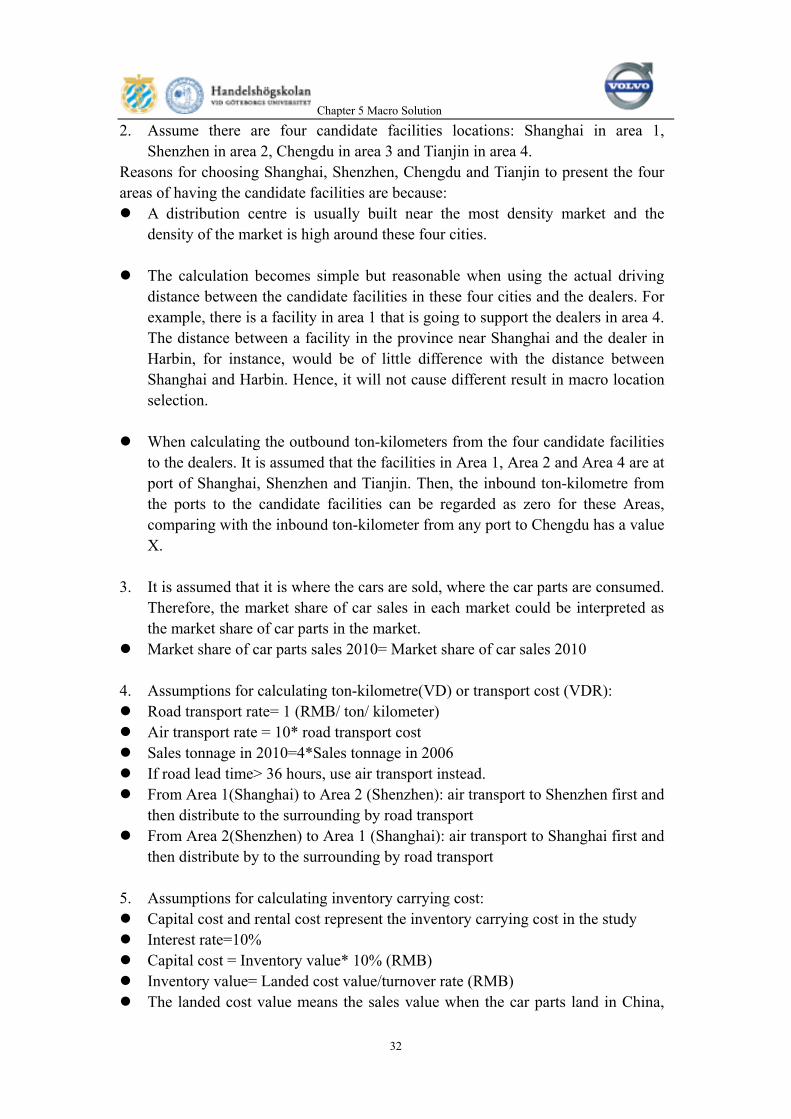
2. Assume there are four candidate facilities locations: Shanghai in area 1, Shenzhen in area 2, Chengdu in area 3 and Tianjin in area 4.
Reasons for choosing Shanghai, Shenzhen, Chengdu and Tianjin to present the four areas of having the candidate facilities are because:
A distribution centre is usually built near the most density market and the density of the market is high around these four cities.
The calculation becomes simple but reasonable when using the actual driving
distance between the candidate facilities in these four cities and the dealers. For example, there is a facility in area 1 that is going to support the dealers in area 4. The distance between a facility in the province near Shanghai and the dealer in Harbin, for instance, would be of little difference with the distance between Shanghai and Harbin. Hence, it will not cause different result in macro location selection.
When calculating the outbound ton-kilometers from the four candidate facilities
to the dealers. It is assumed that the facilities in Area 1, Area 2 and Area 4 are at port of Shanghai, Shenzhen and Tianjin. Then, the inbound ton-kilometre from the ports to the candidate facilities can be regarded as zero for these Areas, comparing with the inbound ton-kilometer from any port to Chengdu has a value X.
3. It is assumed that it is where the cars are sold, where the car parts are consumed.
Therefore, the market share of car sales in each market could be interpreted as the market share of car parts in the market.
Market share of car parts sales 2010= Market share of car sales 2010 4. Assumptions for calculating ton-kilometre(VD) or transport cost (VDR):
Road transport rate= 1 (RMB/ ton/ kilometer) Air transport rate = 10* road transport cost Sales tonnage in 2010=4*Sales tonnage in 2006 If road lead time> 36 hours, use air transport instead. From Area 1(Shanghai) to Area 2 (Shenzhen): air transport to Shenzhen first and
then distribute to the surrounding by road transport From Area 2(Shenzhen) to Area 1 (Shanghai): air transport to Shanghai first and
then distribute by to the surrounding by road transport 5. Assumptions for calculating inventory carrying cost:
Capital cost and rental cost represent the inventory carrying cost in the study Interest rate=10% Capital cost = Inventory value* 10% (RMB) Inventory value= Landed cost value/turnover rate (RMB) The landed cost value means the sales value when the car parts land in China,
Chapter 5 Macro Solution
33
not the final sales value to the dealers of the parts. Turnover rate = 4 Cost of sales value 2010 = 4* cost of sales value 2006 (RMB) Add one more DC: Capital cost increase 30%
6. The rental cost of DC is considered separately from the capital cost Rental cost= Rental rate*12*size of the DC (RMB) Rental rate 2005 refers to the rate that Ford has in China (RMB/ month/square
metre) Rental rate 2010= 46 RMB/square metre/month, which has an annual increasing
rate of 3% over the rental rate 2005. Since the increasing rate of CPI is predicted to be 3% annually between 2006 and 2010.
Add one more DC: total DCs size increase 20% Assume in 2010, there would be 20 000 parts sold to China that need a
distribution centre size of 10 000 square metres 7. Service to the end customers It is assumed that there are 46 parts dealers scatter all over China (the same as today) to serve each market in 2010. Hence, if the warehouses warrant efficient delivery to the dealers, then the end customers would be satisfied as well.
5.4 Calculation
The calculation in this chapter is done by Excel, which will be present to the readers together with the thesis work. The calculation imports all the 46 dealers (markets) into consideration. The distribution of dealers in 2010 is shown in AppendixⅡ. The volume and market share of each dealer is clarified in Appendix Ⅱas well. The meaning of the abbreviations in the calculation shown as follow:
A1 (M1): DC in Shanghai (market area in East) A2 (M2): DC in Shenzhen (market area in South) A3 (M3): DC in Chengdu (market area in West) A4 (M4): DC in Tianjin (market are in North)
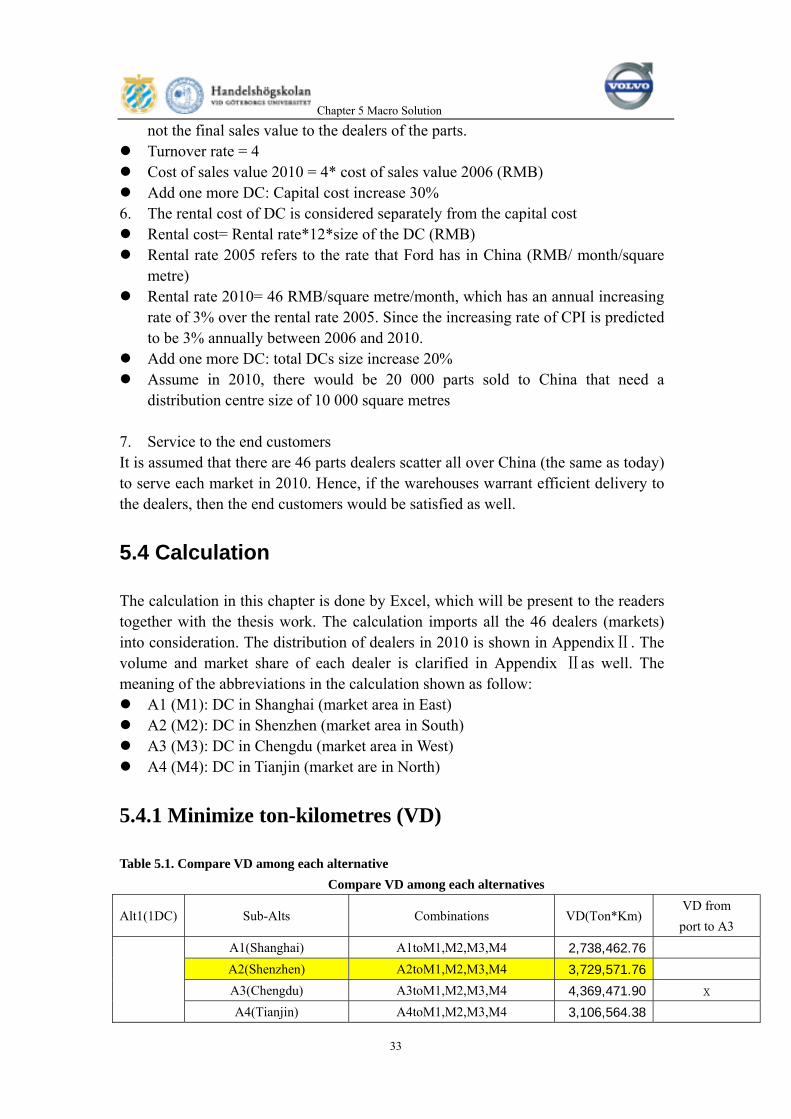
5.4.1 Minimize ton-kilometres (VD)
Table 5.1. Compare VD among each alternative Compare VD among each alternatives
Alt1(1DC) Sub-Alts Combinations VD(Ton*Km) VD from port to A3
A1(Shanghai) A1toM1,M2,M3,M4 2,738,462.76
A2(Shenzhen) A2toM1,M2,M3,M4 3,729,571.76
A3(Chengdu) A3toM1,M2,M3,M4 4,369,471.90 x
A4(Tianjin) A4toM1,M2,M3,M4 3,106,564.38

Chapter 5 Macro Solution
34
Min A1(Shanghai) A1toM1,M2,M3,M4 2,738,462.76
Alt2(2DC) Sub-Alts Combinations VD(Ton*Km) VD from port to A3
A1/A2 A1toM4/A2toM3/A1toM1/A2toM2 2,054,678.13
A1toM4/A3toM2/A1toM1/A3toM3 2,527,015.47 x A1/A3
A1toM2/A3toM4/A1toM1/A3toM3 2,779,786.87 x
A1/A4 A1toM2/A4toM3/A1toM1/A4toM4 2,100,359.33
A2/A3 A2toM1/A3toM4/A2toM2/A3toM3 3,139,030.58 x
A2toM3/A4toM1/A2toM2/A4toM4 2,029,956.39 A2/A4
A2toM1/A4toM3/A2toM2/A4toM4 2,459,603.04
A3/A4 A3toM2/A4toM1/A3toM3/A4toM4 2,502,293.73 x
Min A2/A4(Shenzhen/Tianjin) A2toM3/A4toM1/A2toM2/A4toM4 2,029,956.39
A1/A2(Shanghai/Shenzhen) A1toM4/A2toM3/A1toM1/A2toM2 2,054,678.13
Alt3(3DC) Sub-Alts Combinations VD(Ton*Km) VD from port to A3
A1/A2/A3 A1toM4/A1toM1/A2toM2/A3toM3 1,647,041.03 x
A1toM1/A2toM2/A4toM4/A1toM3 1,453,002.12
A1toM1/A2toM2/A4toM4/A2toM3 1,422,580.62 A1/A2/A4 A1toM1/A2toM2/A4toM4/A4toM3 1,446,996.21
A1/A3/A4 A1toM2/A1toM1/A3toM3/A4toM4 1,668,306.64 x
A2toM2/A3toM3/A4toM4/A2toM1 2,027,550.36 x
A2/A3/A4 A2toM2/A3toM3/A4toM4/A4toM1 1,622,319.29 x
Min A1toM1/A2toM2/A4toM4/A2toM3 1,422,580.62
A1toM1/A2toM2/A4toM4/A4toM3 1,446,996.21
A1/A2/A4 A1toM1/A2toM2/A4toM4/A1toM3 1,453,002.12
Alt4(4DC) Sub-Alts Combinations VD(Ton*Km) VD from port to A3
A1/A2/A3/A4 A1toM1/A2toM2/A3toM3/A4toM4 1,014,943.52 595,873.93
Min A1/A2/A3/A4 A1toM1/A2toM2/A3toM3/A4toM4 1,610,817.45
In table 5.1, the shadow is the optimal choices under each alternative. In order to avoid the errors because of the assumption made about the candidate locations, A second or third minimum VD would be taken into consideration in future analysis when air transport is imported into the method. Although one DC in Shenzhen is not the optimal choice in Alt1, since it is the current situation, it will be regarded as Alt0 and put into analysis later. Alt4 has an increasing ton-kilometre from Alt3, which means four DCs is not cost efficient, will be ignored in further analysis. So, the combinations in table 5.2 will be evaluated further.
Chapter 5 Macro Solution
35
Table 5.2. Alt0 to Alt4
Alts Sub Alts Combinations Alt 0 1DC A2(Shenzhen) A2toM1,M2,M3,M4 Alt 1 1DC A1(Shanghai) A1toM1,M2,M3,M4 Alt 2 A 2DC A2/A4(Shenzhen/Tianjin) A2toM3/A4toM1/A2toM2/A4toM4 Alt 2 B 2DC A2/A1(Shenzhen/Shanghai) A1toM4/A2toM3/A1toM1/A2toM2 Alt 3 A A1toM1/A2toM2/A4toM4/A2toM3
Alt 3 B A1toM1/A2toM2/A4toM4/A4toM3 Alt 3 C
3DC A1/A2/A4(Shanghai/Shenzhen/Tianjin)
A1toM1/A2toM2/A4toM4/A1toM3
5.4.2 Minimize ton-kilometres-rate (VDR)
According to the assumption: If road lead time> 36 hours, use air transport instead. And by adding the transport rate into consideration, the alternatives in Table 5.2 have been revaluated and the results are presented in table 5.3. Table 5.3. Compare VDR among Alt 0 to Alt3
Alt 0 1DC A2(Shenzhen) VDR (RMB)
A2toM1 air transport to Shanghai, then road transport to surrounding areas
10,426,541.93
A2toM2 road transport 210,378.22
A2toM3 air transport 3,551,713.99
A2toM4 air transport 11,167,605.98
sum 25,356,240.13
Alt1 1DC A1(Shanghai) VDR A1toM1 road transport 363,720.14
A1toM2 air transport to Shenzhen, then road transport to surrounding areas
6,957,669.05
A1toM3 air transport 4,291,800.03
A1toM4 air transport / road transport 2,972,912.77
sum 14,586,101.99
Alt2 A 2DC A2/A4(Shenzhen/Tianjin) VDR A2toM3 air transport 3,551,713.99
A4toM1 road transport 971,095.92
A2toM2 road transport 210,378.22
A4toM4 road transport 269,428.87
sum 5,002,617.00

Chapter 5 Macro Solution
36
Alt2 B 2DC A2/A1(Shenzhen/Shanghai) VDR A1toM4 air transport / road transport 2,972,912.77
A2toM3 air transport 3,551,713.99
A1toM1 road transport 363,720.14
A2toM2 road transport 210,378.22
sum 7,098,725.13
min 2DC A2/A4(Shenzhen/Tianjin) 5,002,617.00
Alt3 A 3DC A1/A2/A4(Shanghai/Shenzhen/Tianjin) VDR A1toM1 road transport 363,720.14
A2toM2 road transport 210,378.22
A4toM4 road transport 269,428.87
A2toM3 air transport 3,551,713.99
sum 4,395,241.22
Alt3 B 3DC A1/A2/A4(Shanghai/Shenzhen/Tianjin) VDR A1toM1 road transport 363,720.14
A2toM2 road transport 210,378.22
A4toM4 road transport 210,378.22
A4toM3 air transport 4,003,772.61
sum 4,788,249.20
Alt3 C 3DC A1/A2/A4(Shanghai/Shenzhen/Tianjin) VDR A1toM1 road transport 363,720.14
A2toM2 road transport 210,378.22
A4toM4 road transport 210,378.22
A1toM3 air transport 4,291,800.03
sum 5,076,276.61
min 3DC A1/A2/A4(Shanghai/Shenzhen/Tianjin) 4,395,241.22
5.4.3 Capital cost and rental cost
Capital cost and rental cost are the major factors in inventory carrying cost. Although, the transport cost reduced gradually from Alt 0 to Alt 3 as shown in table 5.3, adding one DCs from the preceding alternatives (except from Alt0 to Alt1), means an increasing account in inventory carrying cost. It is predicted that by adding one more DC, the capital cost will be increased by 30%, for the reason that the total amount of inventory carried in the DCs would be increase. It is also estimated that the total DC size would be 10,000 square metres if there is one distribution centre in 2010, since an estimation of 20,000 Volvo parts would be sold to China. And, by adding one more DC, the rental cost would be

Chapter 5 Macro Solution
37
increased by 20% to the same reason as the increment of capital cost. Therefore, the capital cost and rental cost 2010 as shown in table 5.4 and table 5.5 needed to be taken into consideration when making the location decisions. Table 5.4. Capital cost 2010 (RMB) 1DC Capital cost 2010 10,939,970 2DC Capital cost 2010 14,221,961 3DC Capital cost 2010 18,488,550 Table 5.5. Rental cost 2010 (RMB)
No rental cost per year
1DC 7,476,609
2DC 8,971,930 3DC 10,766,316
5.5 Analysis
After calculating the capital cost and rental cost as shown in table 5.4 and table 5.5, and referring to table 5.3, several points are under concern regarding the total cost shown in table 5.6. First, Alt1, Alt2A, Alt2B and Alt3 all have a reduction rate from Alt0 (the current situation: 1DC in Shenzhen25), which is between 23% and 36%. Due to the potential cost saving, it is encouraging to reconfigure the current distribution centre network. And it is Volvo Car Corporation’s decision to choose one configuration among them. Second, the authors suggests that since more than 85% of the market could be served by road transport within two days if there are two distribution centres; while only around 30% of the market could be reached by road within two days by having 1DC. The choice of having two DCs is better than having only one DC. Third, Alt0 has the highest total cost, which could be reduced by around 36% if Alt2A is chosen. As the total cost of Alt2A is the lowest, it is encouraged to have 2DCs, one in Tianjin and one in Shenzhen. However, if there are three DCs setting up in the locations: Shanghai, Shenzhen and Tianjin, the transport lead time to each dealer will be 24 hours by road, which covers the entire China mainland except the west part of China. This is very appealing, but the total cost has an increment of 5,000,000 RMB to Alt2A, which need to be considered. 25 Start from May 2007

Chapter 5 Macro Solution
38
At last, if Alt2A is chosen due to the lowest cost, the west China: Urumqi, Xi’an, Kunming, Chengdu, Chongqing and Lanzhou will be served by air transport from Shenzhen.

Chapter 5 Macro Solution
39
Table 5.6. Configuration of distribution centre number and location
Chapter 5 Macro Solution
40
5.6 Macro decision
In conclusion, two distribution centres is the optimal number. And the optimal location is one distribution centre in South China around Shenzhen, and another distribution centre in North China around Tianjin.

Chapter 6 Distribution Centre Service Areas
41
Chapter 6 Distribution Centre Service Areas
This chapter would either demonstrate or modify the market areas that each distribution centre serves, which is defined in Chapter 5. In order to make sure it is reasonable to divide the distribution centre hinterlands in a certain way.
6.1 Problem background
Recalled from Chapter 5 Macro analysis, the market has been divided into four areas: North, South, East and West (see figure 5.3) mainly according to the geographical situation in China. Since, it is hard to at the beginning decide where are the DCs, how many of them and which unknown DC serves which market areas. When there are too many unknown questions, working backward is a way to solve it. This is one of the ideas behind the heuristic programme that is to assume there is a solution and see what can derive from that. As the study has tried to solve the problem based on the assumption of four market areas, it is scientific to ‘looking backward’ and see if the assumption is reasonable and whether an adjustment is required. Chapter 2.4 has showed the basic rules to determine the distribution centre service areas. This chapter is going to set the time constraint boundary and cost-equalization boundary based on the answer that there would be one DC in Tianjin and another DC in Shenzhen from Macro analysis.

Chapter 6 Distribution Centre Service Areas
42
6.2 Time-constraint boundary
Figure 6.1. Time-constraint boundary In figure 6.1, there are five lines around the neighboring distribution centres. Each outer layer indicate an eight hour increment in the transit time from the inter circle. The time-constraint boundary for distribution centre in Tianjin and Shenzhen is the dotted lines around each of them. The dotted lines represent 36 hours away from the distribution centres by road transport. The two lines are intersected at the city Wuhan and Hangzhou. In the case of Volvo car parts market, there is no dealer in the intersected area, which means there is no need to use the cost-equalization boundary to divide the intersected area once again. But, the cost-equalization boundary would be presented in Chapter 6.3, to see if there is difference from the time-constraint boundary. In figure 6.1, it also shows that all the west market areas consisted of: Urumqi, Lanzhou, Xi’an, Chengdu, Chongqing and Kunming are out of the time-constraint boundary, which in this case, the air transport should be taken in, to keep the transit time within two days as the logistics goal for Volvo car parts in this thesis. As it is analysis in Chapter 5.5, air transport mode would be applied to serve the west market areas from Shenzhen.

Chapter 6 Distribution Centre Service Areas
43
6.3 Cost-equalization boundary
Figure 6.2. Cost-equalization boundary ISO-lines in figure 6.2 mean the cost per ton from the distribution centre to the destination. The gap between each ISO-line circling around each distribution centre is 500 RMB/ton. Figure 6.2 gave out the cost-equalization boundary by linking the intersected point of ISO-lines 1500 RMB/ton in Wuhan and the intersected point of ISO-lines 2000 RMB/ton near Chongqing.

Chapter 6 Distribution Centre Service Areas
44
6.4 Division of distribution centre service areas
Figure 6.3. Distribution centre service areas In figure 6.3, the market in Changsha belongs to the market area in South, since delivery cost and transit time both are lower than from Tianjian. While the market in Wuhan will be served by distribution centre in Tianjin, due to a lower delivery cost and time than served by Shenzhen distribution centre. Hence, both the time-constraint boundary and the cost-equalization boundary shows that the market in North (Market 4) and East (Market 1) will receive their order from the distribution centre in Tianjin by road, and the market in South (Market 2) will be served by the distribution centre in Shenzhen by road. At last, the market in the West (Market 3) will be served by air from Shenzhen airport. This delimitation of distribution centre hinterlands is consistent with the market area division from Macro analysis.

Chapter 7 Micro Solution
45
Chapter 7 Micro Solution
7.1 Introduction
This chapter is going to deal with the problem described in chapter 3.4
Where are optimal locations in micro sense of the distribution centres? There will be two methods mentioned here, Centre of gravity and Mixed integer linear programming, respectively. However, only centre of gravity will be computed in this study while mixed-integer linear programming is only recommended for Volvo to carry it out in further studies. As the theory formula illustrated in Chapter 2.5, centre of gravity is a kind of circling calculation programming which is better to use computer software rather than manual work. Software computing is used in this study and the results are given in the form of computer plot. The result in this chapter, which based on the solution from macro analysis and distribution centre service areas, will be presented as the theoretical optimal specific solution to the location problem. Final solution will be given in the later chapter after external environment analysis. The computer program used to support the calculating of the center-of-gravity method and mixed-integer linear programming is called LOGWARE. LOGWARE is a collection of selected software programs that is useful for analyzing a variety of logistical problems and case studies.26 It is software only for education purpose. The software is relatively simple comparing to other software that provided by the consulting companies or other professional organizations. But, it is an optimal choice for this study within limited resources. In the future studies, Volvo Car could consider a necessary investment in more robust software.
7.2 Assumptions of center-of-gravity method
The calculation is based on several theoretical assumptions to find out the optimal solution by minimizing the transport cost. 1. The Import ports for the inbound flow are Tianjin port in the north and Shenzhen
port in the south, which is as same as the assumption from macro solution. Later discussion about the import ports will be done in Chapter 8.
26Ronald H. Ballou, Copyright 1992-1999, All rights reserved

Chapter 7 Micro Solution
46
2. Since the six dealers in the west China: Urumqi, Kunming, Xi’an, Chengdu, Chongqing and Lanzhou are out of the time-constraint boundary, this chapter is not going to take them into consideration. Therefore, the air transport flows will not be imported to the COG model. However, since the airport in Shenzhen will be selected to serve the market in the west, it is going to be regarded as one point that receives delivery from the DC in Shenzhen together with other dealers in the South, as shown in figure 7.1.
Figure 7.1. Distribution model for DC in Shenzhen 3. The location of each point: DC in Shenzhen, Shenzhen port, Shenzhen airport,
DC in Tianjin, Tianjin port and all the dealers within the time-constraint boundary is transferred into X and Y coordinates from their geographic longitude and latitude. The linear distance between two points is calculated by COG automatically. The import ports (Shenzhen port and Tianjin port) has more exact longitude and latitude to differ itself from the city it located (Shenzhen and Tianjin) on the grid map. To adjust the data, there are power factor and scaling factor using in calculation. The power factor is to control the linearity of distance and the scaling factor can convert the coordinate distance to the kilometer distance. Power factor is 0.5 as the Logware software usually applies and the scaling factor is 150 under the authors’ estimation.
4. The volume flows to the demand destinations are assumed to be stable and
represent the sales volume in 2010. The figure is estimated by Volvo based on business sales history and experiences.
Shenzhen Port
Shenzhen Airport
DC in Shenzhen
Dealers
Parts flow
Time-constraint boundary

Chapter 7 Micro Solution
47
5. In this Chapter, the road transport rate between major cities refers to the rate provided by Schenker International (H.K.) Ltd. Due to the time delimitation, the data is not fully available. However, based on the rate from Shanghai to other cities provided by Schenker, the authors have conducted experimental calculations. It shows that if 1RMB/ton/kilometer is used instead of the actual rate between two points, the decision of location will not be effected.27 Therefore, 1 RMB/ton/kilometer will be used between the DC in Shenzhen and the dealers in the South (including Shenzhen airport) as well as the DC in Tianjin to the dealers in north and east China. As much larger car parts volumes would be delivered from import ports to the DC, the road transport rate should be lower than 1 RMB/ton/kilometer by considering if considering the discount factors. However, due to little effects of the rate, 1 RMB/ton/kilometer will be used instead.
7.3 Calculation and analysis
All the center of gravity calculation process in this study is conducted by the LOGWARE software version 4 provide by Ronald H. Ballou which is introduced in chapter 7.1. According to the macro decision, preferred solution is two distribution centres, which concerns the main relevant factors including transport cost and inventory carrying cost. The dividing of markets has been made to have the north distribution centre serve north and east market by road and have the south distribution centre to serve south markets by road and west market by air. So only the decisions of two exact locations are needed to be computed by COG module which is the single location decision module in the LOGWARE software. Calculation is going to be conducted two times for deciding locations in the north and south respectively.
7.3.1 Calculation of the north location
In this phase, the calculation will give optimal location solution with minimum transport cost (evaluated by VDR) in the north market. Input data is the data explained in the Chapter 4.6. Problem is solved by the interface in figure 7.2 that twenty three market points for the outbound flow together with the inbound flow from Tianjin port to market in Tianjin
27 Due to confidential agreement between Schenker and the authors, the process of experiment will not be presented in the thesis. More discussion towards the reason of using 1 RMB/ton/kilometre will be illustrated in chapter7.6.1.

Chapter 7 Micro Solution
48
are involved. These twenty four points have their exact own X, Y coordinates on the coordinate plot with the volume coming in or out the expected distribution centre respectively.
Figure 7.2. LOGWARE data input interface for the north distribution centre module (Note: road transport rates are computed in 1 as assumption 5) Centre-of-gravity method gets the results from the continuous improved solution by calculating in rounds. The calculation will find a suboptimal solution in the first round to stimulate the calculation. Then the following rounds will continuously find the solution to improve the results until there is no improvement for the cost performance. The final solution from the rounds calculation which is taken as the optimal solution for the model is based on the previous rounds calculation. The calculation can be seen from figure 7.3. Actually, after 34 rounds, there is no improvement for the calculation. The result shows from the 1000 round in the figure 7.3 presents as the same result as in the 34 round. The final solution for the decision of north distribution centre is decided from any round after the 34 round. The optimal point for the distribution centre lies in (18.72, 19.30) on the coordinate with the minimization cost of 1,395,003.33 RMB.

Chapter 7 Micro Solution
49
Figure 7.3. LOGWARE roundly computing result of cost minimization for north distribution
centre Logware plots the optimal decision on the coordinate with the markets being distributed also. Figure 7.4 shows the result of calculation on plot. Converting the coordinate of (18.72, 19.30) into longitude and latitude, the result indicates the optimal location of north distribution centre is Tianjin port which is the same as assumed in macro analysis.

Chapter 7 Micro Solution
50
Figure 7.4. LOGWARE computing result of north distribution centre on coordinate
7.3.2 Calculation of the south location
The procedure for deciding the south distribution centre is the same circling calculation as what has been done for the decision of north distribution centre. The calculation will give optimal road delivery solution with minimum transportation cost that occurs for satisfying the parts demand. Data input follows the same rule as the north distribution centre calculation as well as from the same source, with the different demand points in the south. Interface of data input is shown in figure7.5 by Logware. The entire factors needed for calculation are listed, including the location on coordinate, estimated volume, transport rate from or to each point, together with power factor and map scaling factor to revise the coordinate distance into the kilometers. There are seventeen demand points calculated, including the point of Shenzhen airport to serve the west market. The market receives outbound flows from the expected distribution centre while the port location in Shenzhen is used as the point for delivering inbound flows to expected distribution centre.

Chapter 7 Micro Solution
51
Figure 7.5. LOGWARE data input interface for the south distribution centre module (Note: road transport rates are presented in 1 as assumption 5) Round calculations come to the result after 51 rounds to give the optimal decision, which is the same as the 1000 round that presented in figure 7.6. Optimal location in the south generates cost of 174,400.08 RMB for road delivery and it locates in the (17.06, 1.94) on the coordinate.

Chapter 7 Micro Solution
52
Figure 7.6. LOGWARE roundly computing result of cost minimization for south distribution
centre Converting this result into the longitude and latitude, the optimal location lies in the port of Shenzhen which is the same port as assumed in the macro analysis for the southern market. Plot indicates in figure 7.7 shows that the south distribution centre will serve the south market by road while the west market will be served by air from the airport in Shenzhen.

Chapter 7 Micro Solution
53
Figure 7.7. LOGWARE computing result of south distribution centre on coordinate By far, two decisions have been made. Port of Tianjin has been calculated as the optimal location for DC in the north of China to serve the northern and eastern market by receiving the inbound flows from CDC in Sweden. The rest of the volume needed, which is demanded mostly for the south of China could be satisfied by the distribution centre in port of Shenzhen and delivered either by road for the southern market or by air for the western market. This allocation of the market as well as the delivery mode can be found in figure 7.8. The dotted line indicates the delivery flows by air to the west China based on macro analysis, while the rest market could be covered by road transport mode, which appears in solid lines in figure 7.8 according to both macro and micro analysis.

Chapter 7 Micro Solution
54
Air deliveryRoad delivery
Tianjin
Shenzhen
Figure 7.8. Two distribution centre decisions with market allocation on the map of China
7.4 Mixed-integer linear programming
The most significant characteristic of mixed-integer linear programming apart it from other methods is that it takes the fix cost into consideration when deciding the warehouse locations. If Volvo Car would like to setup its own warehouses in the future, this kind of approach has its advantages over the previous methods used. There are different formulations that apply to the mixed-integer linear programming. In LOGWARE, one of the formulations is by taking into account the fix cost of the warehouses, the capacity of the warehouses and the minimum throughput of a warehouse, etc. This study is only going to introduce a simple method that applies mixed-integer linear programming, which is called P-median approach as an example. The information needs in this method are more or less the same as centre of gravity method, but fixed cost should also be concerned:
The X and Y coordinate of the dealers and candidate facilities. The output locations will only be restricted among the dealers and candidate facilities.
The transport volumes are consumed at each dealer and are required at the candidate facilities.
What is the transport rate between each pair of dealer and candidate facility that

Chapter 7 Micro Solution
55
support the dealer? What is the fixed cost of the candidate facilities?
The calculation by using this approach will not be presented in this study, since fixed cost is out the scope of the study. However, it gives a basis for in depth location selection. So the authors recommend Volvo to consider this method in further studies, especially when fix cost should be considered.
7.5 Micro decision
The decision from the micro analysis is that the optimal locations of DCs with transport cost minimization is one in Tianjin port and one in port of Shenzhen.
7.6 Sensitive analysis
Factors effect the location of distribution centre decision could all be considered as factors to be involved in the sensitive analysis. However, only those factors that relevant to the calculation appeared in this chapter will be discussed for better understanding of the results from micro decision. Based on experiment running by COG, the model is more sensitive towards the changes of interaction of distance and weight (evaluated by ton-kilometers) rather than the transport rate. Moreover, as professional researcher (C.D.T. Watson-Gandy)’s study of center of gravity28, the solution is always more sensitive to the distance than the volume. It always emphasizes more on the customers in the remote area than the customer with large volume demand but in area closed to the DC. So, based on these analyses, there are some suggestions.
7.6.1 Price
There are several reasons why the transport rate could be replaced by 1 RMB/ton/kilometer in the thesis. First, the transport rate in China is around 1 RMB/ton/kilometer, which is a marginal number compared with the ton-kilometre. It will not affect the location decision, but will affect the exact transport cost. Second, in 5 to 10 years, the road freight rate will not fluctuate significantly in China, since it is still not long enough to have unpredictable changes in the road transport. Third, even if there is an increasing trend in the price, the price in all the Chinese 28C.D.T Watson-Gandy, A note in the centre of gravity in depot location, Management Science, Vol 18, No 8

Chapter 7 Micro Solution
56
market area would be increased simultaneously, which will end up with no affects to the location selection. So, the suggestion made to Volvo Car is that the price fluctuating in China will give effects towards the cost performance but rather than the location of distribution centres.
7.6.2 Import location
As the analysis of price indicates that the model is not sensitive to the price, but on contrast, it is sensitive to the changes of ton-kilometers and one of the factors that affects ton-kilometers is the import position in the model. It is not coincidence that the results from COG are the same as the assumptions made in macro analysis that the locations of DCs should be one in Tianjin port and one in Shenzhen port. Since, the inbound flows from the import ports to the DCs account of 50% of the total tonnages in the total inbound and outbound flows. The biggest proportion of tonnage transported in the system makes the position the biggest power to ton-kilometers, and this will influence the decision to be as close to this position as possible to minimizing the total transport cost. Therefore, the selection of import ports will affect the final result of DCs locations.
7.6.3 Market expansion
Although, the volume and distance in COG method based on the assumption that there are still 46 dealers and the volume would be four times as the volume in 2006. However, the market might expand beyond this assumption, which means more dealers in each market and more volume be delivered to the dealers. If there are more dealers in remote areas, at the same, more volumes delivered to the dealers near the DCs, the location decision will be affected by the increasing ton-kilometres. However, if comparing the two factors, volume increased and distance increased in one model, the locations is more sensitive to the distance increased rather than the volume increased. From practical experience, the decision may be made different from the theory. The DC will have more possibilities to build near the big demand points other than the remote area with much less volume, due to the facts that big market areas are always having better business environment and facilities than the remote area. Volvo should be aware of this factor in making the decisions if there is market expansion in the remote areas beyond the assumption.

Chapter 8 External Environment Analysis
57
Chapter 8 External Environment Analysis
8.1 Transportation
8.1.1 Road
Because of the flexibility of trucking, and its characteristics of convenience for door to door delivery, the road transport is the main choice for delivery finished goods in mainland China. As National Bureau of statistic of China says that road transport takes 72.3% of the total yearly transport in the year 2005 and the amount is growing year by year. However, continuous construction of road network in China is still an important task for Chinese government. There would be fourteen new expressways by the end of 2010. The goal is to realize that areas in east of China connect by expressways; areas in middle of China link by national ways and west of China would be reached. In 2010, the cargo capacity by road would be 1.9 times today29. And the transit time of goods transportation in main road is predicted to be improved simultaneously, that is enabling vehicles to travel 400-500 km within twelve hours and 1,000 km within 24 hours.30 About the rate of road transport, although there are severe competitions between trucking companies which restrict the logistics companies to increase their price, the oil price will not be reduced and the tolls amount which account 20% of the trucking cost in China is not easy to be eliminated in the future, there will be no reduction in the rate. Therefore, Volvo car parts would still mainly be distributed to the customers by road transport as the study predict. Some of the remote areas could be satisfied by road transport instead of air, since there are more expressways and less transit time on the road.
8.1.2 Rail
Railway system long has been the bottleneck of the China economic growth, both passenger and freight transportation. For freight transport, the existing rail network can handle only 35 percent of the demand, the Ministry of Railways officials has indicated in 200531. Among which, up to 90% of the capacity is occupied by the bulk goods mainly coal, minerals and grain. But there is neglect in the business of moving 29http://www.yn.xinhuanet.com/auto/2006-07/11/content_7485878.htm 2007-1-3 30http://www.newswiretoday.com/news/8823/ 2007-1-3 31http://service.china.org.cn/link/wcm/Show_Text?info_id=137941&p_qry=China%20and%20transport%20and%20freight 2007-1-1

Chapter 8 External Environment Analysis
58
the most finish goods by rail, because of the extensive delays, little flexibility in available routes, and the lack of a genuine service orientation.32 Normally, when a country comes to the period of fast development, there is a need for the railway infrastructure setup to keep up with the economic growth demand. Since, it is a rapid, long-distance and low land use transport mode. USA, UK, Germany and France, have come over this threshold at late nineteenth Century, after that they no longer face the bottleneck from railway system. Compared, China has not been in any railway industry’s boom yet. Since 2004, after the approved of ‘The Middle-long term planning for China's railroad networks (until 2020)’, by State Council of the People's Republic of China, the Chinese government is paying unprecedented attention to support the construction of the railway system. In the 11th Five year plan, the government decided to invest four times the amount that in 10th Five year plan in the construction of railway system. It is estimated that the boom of railway in China will last ten years from then. Which means, during 2006 to 2015, a significant improvement of railway system will be achieved in China. Otherwise, if the railway system develops itself in a regular pace it did in the previous years, the supply of railway capacity will not satisfied the demand to a more severe degree than ever. Since the economic growths is much rapid than ever before. The solution to this problem is mainly by building more transport lines, double the tracks, and applying electric system, in order to enhance the capacity of railway system. It is planned that in 2010, 45% of the lines will become double track and using electric system. However, this is mainly for improving the passenger transport. And for freight transport, the focus is still the bulk goods. It is predicted that 60% of the bulk goods could be handled by railway system by the year 2010. For regular goods, the construction of containerization will also be enhanced. The transport of containers is expected to meet 10 million in 2010; an increase of 7.23 million will be added to 2005. For Volvo car parts distribution in China, rail transport is not encouraged to be one of the main transport modes at least between 2006 and 2010. Since the focus of railway development is not in the containerization and the efficient transit between rail and truck or between air and rail in five years. But after the 11th Five years plan, a clearer picture about how the government paves the road for high-value cargos is expected. The key issue here is that whether the railway system could guarantee the certainty of the required delivering time window by Volvo in the future.
32McKINSEY & COMPANY, China’s Evolving Logistics Landscape, GREATER CHINA OFFICE

Chapter 8 External Environment Analysis
59
8.1.3 Air
Air transport is the one of the key transport mode for Volvo in China, since air transport is the main transport mode for remote markets in western China and the only transport mode for emergency VOR orders. Therefore, only air freight transport is discussed here. From 2001 to 200533, the turnover of air freight transport has increased 15.9% annually in average. In the year 2005, China has achieved the transport of air freight 7.89 billion ton mile which takes 30.2% of the overall freight transport. Among those, domestic air freight takes 42.6% of the total. By 2005, there are 1024 national airlines running in China. There are a lot of aviation infrastructures under reconstruction and the government is planning to build more air terminals in China. However, the civil aviation market is still closed for the foreign investors and the low-cost carrier has not being a popular choice for the shippers. The foreign air freight companies could only run the business in the form of joined venture with the local air freight company. By far, world top air freight companies, including Lufthansa, Singapore Air, Korean Air etc. have all entered the market by the way of joint ventures like Feicui Airfreight, Greatwall Airfreight . Market condition now is mainly about the capacity problem that capacity is not enough in the local airfreight company due to the passenger business is more profitable. However, the world top company’s joint venture is taking positive role towards the air freight business. Since the government policy has the trend to encourage international company to run airfreight business. Therefore, to some extend, capacity will be added gradually, the price will be more reasonable and service level could be enhanced accordingly. In 5 to 10 years, more markets could be served with better service by air to VCC, together with the expansion of Volvo market.
Here, the authors also list the ranking of airfreight throughput from National Statistic Beau, July of 2006, to illustrate the trend of airport hub a little bit.
1 Shanghai Pudong 2 Beijing 3 Guangzhou 4 Shenzhen 5 Shanghai 6 Chengdu 7 Kunming
33Source: General Administration of civil aviation of China statistics

Chapter 8 External Environment Analysis
60
8 Hangzhou 9 Xiamen 10 Nanjing
It is of the same trend as the economic growth that Shanghai, Beijing, Guangzhou are still the leading parties with the improvement of Kunming and Chengdu in the west of China. Actually, Kunming has a less developed road transport linking outside, which could be compensate by the air transport. Since Shenzhen airport is selected to serve the west markets in China, which will be emphasized here. It is within the top 37 airports for air freight in the world. The fast growth for the Shenzhen airport gets benefit not only due to its favorable position that a big portion of international freight flow passes by Shenzhen from Hong Kong to inland China, but also the economic development in this area with heavy government investment. Volvo has already got the experience of good cooperation with business partner in Shenzhen and it is also suggested in this study to continue with this cooperation in the near future either from academic examining point of view or from practical point of view.
8.1.4 Sea
Waterway is not the main transport mode compared with road and rail transport mode in inland China, which will not be discussed here. However, it is interesting for VCC to know the development of ports in China, which receive car parts from CDC in Sweden. Hence, the key issue here is to know the situation of potential import ports and the possibility to build distribution centre near ports land. Port development and evaluation is a hot topic in the industry. Very recently, in August, a research34 has been done by the Maritime research organization in China35 to illustrate the topic from the practical point of view. The evaluation, which towards the investment trend, handling capacity, operating ability, port financial condition and nature condition fields, generates a result of 10 top ports in mainland China.
34“Report of integrated competence index of China ports” Dalian Maritime University, 200608 35Maritime research centre, Dalian Maritime Univeristy, Branch of World Maritime University in China

Chapter 8 External Environment Analysis
61
2007-1-9 Master thesis of logistics and transport management
1 Shanghai 6 Tianjin2 Shenzhen 7 Xiamen3 Qingdao 8 Dalian4 Ningbo 9 Lianyungang5 Guangzhou 10 Yingkou
1 Shanghai
6 Tianjin
2 Shenzhen
3 Qingdao
4 Ningbo
5 Guangzhou7 Xiamen
8 Dalian
9 Lianyungang
10 Yingkou
Figure 8.1. China Ports Top 1036 Shanghai is the biggest port with the best international competence among all the other ports. Ningbo port is quite noticeable recently due to its supporting function towards port of Shanghai and the heavy investment trend. In the southern part of China, Shenzhen is the most well known port which supports the port of HongKong and act as the gate for international freight to enter mainland China. The advantages of Shenzhen over Guangzhou are due to the heavy investment and its favorable position. In the northern part, Qingdao port is evaluated as the port with good performance and great potential, which followed by the port of Tianjin from the researchers’ point of view. The research indicates that Qingdao port distinguishes itself from the others by its excellent electronic facility and Tianjin is superior in the field of labor force and government support. Dalian, which is known widely before, now has been overtaken in all fields due to its conservative port developing policy. But still, it is the most important port towards northeast. This ranking gives some hints towards the port development and trends. However, all of the ports have their own features. The ports that suits Volvo in 5 to 10 years should be considered not only from the ranking but also from the economic and policy around the port hinterland. The final suitable ports for this study will be discussed in the chapter 8.3 analysis and summary.
36 Source: Dalian Maritime University- China Branch of World Maritime University (located in Malmö), Statistic
China Bureau

Chapter 8 External Environment Analysis
62
8.2 Economics and policy
8.2.1 Economics and policy
The economic growth will be slowing down from 2007 to 2010 with a rate of 9.25% rather than 10.48% year 2006. This indicates given by the People’s University37 of China evaluates the trend of China’s economic growth. However, it is still a high growth of economic and more foreign investment would be introduced to China in the near 5 to 10 years. The economic growth in China is appearing to investors, but its unbalance in different regions is also well known. Shanghai and Guangdong have formed two economic centers for the whole country, which radiate and active their surroundings areas as well. Much attention has been drawn to these areas as Shanghai-Suzhou-Hangzhou area and Guangdong province. In 2006, new government policy intends to make the economic area more balanced by setting up more economic areas in northern China. Tianjin which is one of the important coast cities in north of China has been selected into the National strategic development layout after government’s evaluation.38 Being the main port in the north of China and the direct hinterland from Beijing capital, more open policy and support will be carried out in Tianjin. Government plans to have the new economic area based on Tianjin which also indicates the surrounding as Jing-Jin-Ji area including Beijing, Tianjin, Hebei as shown in figure 8.2. If the policy being completely conducted, China will have three economic areas including Jing-Jin-Ji area based on Tianjin, Shanghai-Suzhou-Hangzhou area based on Shanghai and the Guangdong province.
37http://www.chinadaily.com.cn/china/2006-11/26/content_742973.htm 2007-1-9 382006-06-06 National Council news about open policy towards Tianjin

Chapter 8 External Environment Analysis
63
Tianjin
Shanghai
Guangdong
Figure 8.2. Government planned three economic areas in China This policy information is quite positive to VCC, since these three main economic areas are the same major markets market that VCC has in China. Then, the new economic developing policy in these areas suits the developing of Volvo Car Corporation in five to ten years. Since the main markets that dealers located will have better investment and facilities. At last, these three areas include the candidate import ports. The same as the assumption and conclusion in macro and micro analysis part, Tianjin and Shenzhen which is within the Guangdong province are the solution of import ports as the optimal distribution centre configuration. Since, they will get the support from government from many perspectives that Volvo need in five to ten years.
8.2.2 Free Trade Zone
The shipping broker industry39 defined Free Trade Zone as: “Free Trade Zone is a port designated by the government of a country for duty-free entry of any non-prohibited goods. Merchandise may be stored, displayed, used for manufacturing, etc., within the zone and exported without duties being paid. Duties are imposed on the merchandise (or items manufactured from the merchandise) only when the goods pass from the zone into an area of the country subject to the Customs Authority. It is
39http://www.shipbrokering.com/shippingterm3.html 2007-1-9

Chapter 8 External Environment Analysis
64
also called FOREIGN TRADE ZONE.” The Chinese government has gradually designate more than 15 ports along the coast line to have the Free Trade Zones for stimulating the trade and economic. The ports that are relevant to our research in this study are all quite popular and among the top ports ranking which have their Free Trade Zones. So, the Free Trade Zone should be considered to see whether it could bring benefits to VCC. The function of Free Trade Zone that might attract VCC is that there are warehouse leasing services in the candidate import ports. Also, it is indicated that the parts and accessories for maintenance purpose could get tariff, import increment tax and import consumption tax fee in the zones. Also, the Free Trade Zone allows overseas enterprises to invest and establish trading, warehousing, export processing and exhibition enterprises within the free trade zones.40 This would encourage international companies to provide better services concerning the business in Free Trade Zones. There are all the relevant news, regulations, procedures, renting information on the website of Free Trade Zones which may be interesting for later research and contact. The authors list some information relevant to the study as follow. China Free Trade Zone website links: Xiamen Free Trade Zone ---- http://www.xmftz.xm.fj.cn/english/english.htm Shanghai Free Trade Zone --- http://www.china-ftz.com/ Shenzhen Free Trade Zone --- http://www.szftz.gov.cn/sze/index.htm Tianjin Free Trade Zone --- http://www.tjftz.gov.cn/ Ningbo Free Trade Zone --- http://www.nftz.gov.cn/ Qingdao Free Trade Zone --- http://www.qdftz.com/Templets/yingwenban.htm
8.3 Analysis and summary
From all the facts and analysis previous in this chapter, economics in China is quite obvious unbalanced with noticeable growth, which is better natural condition and better facilitates in the east than in the west. By looking all over China, some major cities represent the top performance in all perspectives such as Shanghai, Beijing, Shenzhen followed by supporting cities such as Tianjin and Ningbo. Volvo Car market distribution is the same as the distribution of China’s economic development. As shown in Appendix Ⅱ, Volvo Car has four main dealer clusters as North market concentrated in Beijing, East market concentrated in Shanghai, South
40 http://www.szftz.gov.cn/sze/html/index-b.htm 2007-1-9

Chapter 8 External Environment Analysis
65
market concentrated in Shenzhen, and West market concentrated in Chengdu. These fours areas are the ones that famous for the government investment and economic growth, among which, Chengdu maybe less noticeable than the other three as it is in the undeveloped western China. Actually, the market expansions of Volvo Car in 2010 are also quite predictable based on the economic growth trend and policy tendency that Shanghai-Suzhou-Hangzhou, Jing-Jin-Ji and Guangdong province are the major economic areas with more government support in the near future. Location selected from micro and macro analysis is consistent with the development of the economic areas. Hence, it is better to set the DCs on in north coast as in Jing-Jin-Ji area and in south coast as Guangdong province for which they are the best hinterland of production consuming as well service providing. If three DCs are selected, the east coast as in Shanghai-Suzhou- Hangzhou area is the top choice to support east China. The distribution location decision of this study will get much effect from the port selection. Since the ports are act as the inbound receiving point as illustrated in chapter 7.6.2. In the Jing-Jin-Ji area, Tianjin and Qingdao are potential ports to be chosen. However, Tianjin is preferable because it is close to more and bigger markets with better policy support. In the Shanghai-Suzhou-Hangzhou area, Shanghai, Ningbo could be candidate choices. Considering for better facilities and business convince, Shanghai should be chosen in this area. In the Guangdong province, there is also discussion about the port of Shenzhen and Guangzhou. Due to better facilities, investment and cooperation, Shenzhen has the priority to be considered first.

Chapter 9 Conclusion and Recommendation
66
Chapter 9 Conclusion and Recommendation
By running the heuristic programme: Macro solution, Distribution centre service areas, Micro solution, it is convincing that, in five to ten years scope, the optimal distribution centre number is two, the optimal locations areas are Shenzhen port and Tianjin port. However, the authors recommend that Volvo could also consider of having three distribution centres which located in Shanghai, Tianjin and Shenzhen to have the shortest possible transport lead time for daily orders but by having a higher logistics cost. In the heuristic programme, the evaluation of transport cost and major factors in inventory carrying cost based on transit time restriction gives out the total cost of each configuration alternatives. The most satisfying configuration is drawn by analyzing the various alternatives. Then the optimal locations are decided by the centre-of-gravity computing to give the best delivery cost solution after knowing the market allocation by distribution centre service area. Finally, the optimal alternative has been supported by studying the relevant government policy issues both from economic and transport perspectives. In five to ten years, the market will grow so as the China’s economic. The transport situation will get improved but that will not influence the transport mode decision as Volvo taken today, which means road and air transport are mainly concerned. The development of ports and the profit that ports could bring to Volvo Car Corporation would be interesting to learn due to the important fact that the position of ports affects the distribution model. Therefore the authors recommend that Volvo Car Corporation could carry on the study by focusing on the development of the ports in China. Mainly about, the bonded zone and the logistics service those ports could possibly provide.

References
67
References
Literatures Michael Porter, Competitive advantage, The Free Press, 1985 John J. Coyle, Edward J. Bardi, C. John Langley Jr., The management of business logistics: a supply chain perspective, South- Western, Thomson Learning, 2003 Ronald H. Ballou, Business logistics management: planning, organizing, and controlling the supply chain, 4th Edition, Prentice Hall, 1992 Gilbert A. Churchill, Jr. and Dawn Iacobucc, Marketing research: Methodological foundations, Thomson south-western, 2005 Kinnear and Taylor, Marketing Research, an applied approach, 5th edition, McGraw-Hill, 1996 Donald J. Bowersox, David J. Closs, M. Bixby copper, Supply chain logistics management, McGraw-Hill, 2002 Journal and Articles Robert Lamarre, Determining the cost of carrying inventory or the magic number, Associates Management Consultants, 2003 REM associates, Methodology of Calculating Inventory Carrying Costs J. T. Linderoth, T. K. Ralphs, Noncommercial Software for Mixed-Integer Linear Programming, 2005 Frank W. Renshaw, Natural SELECTION, 2002 C.D.T Watson-Gandy, A note in the centre of gravity in depot location, Management Science, Vol 18, No 8 Alan and Emma, Business research method, Oxford University, 2003 McKINSEY & COMPANY, China’s Evolving Logistics Landscape, GREATER CHINA OFFICE
Dalian Maritime University, Report of integrated competence index of China ports, 2006 Thomas L. Freese, Site selection, The logistics handbook, 1994 OECD, Economic Survey of China, 2005 Dennis J, Sweeney and Ronad L.Tatham, An improved long-run model for multiple warehouse location, Management Science, Vol 22, No.7 Alan W. Neebe and Basheer M. Khumawala, An Improved Algorithm for the Multi-commodity Location Problem, Operation Research Society Ltd. Umit Akinc, Multi-Activity Facility Design and Location Problems, Managemnet Science, Vol 31, No3 Internet Links http://www.lums.lancs.ac.uk http://www.lerc.nasa.gov

References
68
http://www.michigan.gov http://stats.oecd.org http://www.dss.gov.cn http://english.peopledaily.com.cn http://www.ctaxnews.com.cn http://www.china.org.cn/english http://www.mrs.org.uk http://service.china.org.cn http://www.moc.gov.cn http://www.chinadaily.com.cn http://www.shipbrokering.com http://www.yn.xinhuanet.com http://www.newswiretoday.com http://service.china.org.cn http://www..chinadaily.com http://www.volvocars.com http://www.webflyer.com http://www.kwe.co.jp http://www.szftz.gov.cn

Appendix
69
Appendix Ⅰ
Concepts
11th Five year plan The Five-Year Plan for National Economic and Social Development, or the Five-Year Plan, mainly aims to arrange national key construction projects, manage the distribution of productive forces and individual sector’s contributions to the national economy, map the direction of future development, and set targets. In 1953, the central government implemented its first five-year plan. Except for a period of economic adjustment between 1963 and 1965, a total of ten five-year plans have been made and implemented to date. The five-year plan for 2006-2010 is called the 11th Five-Year Development Guidelines41. Since the information from the 11th five-year plan is with the top authority, a lot of information searching of China development trend would be retrieved from it.
Consumer price index As defined by OECD (Organization for Economic Co-operation and Development): ‘the Consumer Price Index (CPI) measures the change in the level of prices for a specified basket of goods and services normally purchased by urban and rural residents’.42 CPI gives a weighted average of prices of a certain set of goods and services purchased by consumers. It is the major indicator that measures the inflation or deflation for most of the countries. CPI becomes one of the key economic indictor in China since Jan 200143. The statistic data is released by National Bureau of Statistics, People's Republic of China. The items for CPI China include eight categories: food, tobacco, liquor and articles, clothing, household facilities, articles and services, health care and personal articles, transport and communication, recreation, education and culture, residence. In which, some of the prices are still supervised by the government, such as rent, electricity, public transportation, and drinking water.44
In the study, CPI is used to predict the fluctuation rate of the price in China mainland from 2005 to 2010. By searching the online database of national bureau of statistics, the trends of CPI from year 1985 to year 2004 is given, which is become stable recently year (as shown in figure ⅰ).
41 http://www.china.org.cn/english/MATERIAL/160349.htm 2006-10-15 42http://stats.oecd.org/mei/default.asp?lang=e&subject=8&country=CHN 2006-12-26 43http://english.peopledaily.com.cn/english/200012/07/eng20001207_57187.html 2006-12-26 44http://stats.oecd.org/mei/default.asp?lang=e&subject=8&country=CHN 2006-12-26

Appendix
70
CPI trends from 1985 to 2011
90.0
100.0
110.0
120.0
130.0
19851989199019911992199319941995199619971998199920002001200220032004200520062007200820092010
year
CIP
CPI
CPI urban areas
CPI rural areas
Figure ⅰCPI trends China (preceding year=100) From the official media, it is said that the inflation rate would be keep at a level of 3% in the 11th Five year. It is predicted that if there is no incidental factors or improper in the implementation of the government policy according to the 11th five year development guidelines, the changing rate of CPI annually would be in an interval of 1% to 5%, with a middle value of 3%.45 The Chinese government also announced the annual inflation rate would be around 3% in the 11th Five-year (2006-2010), slightly less than the 3.1% in the 10th Five-year (2000-2005)46. The inflation rate is normally higher that the CPI, since it includes all the products and services including the capital and the means of production, import and export of goods and services, in addition to consumptions. For example, the value inflation rate in 2004 is 6.9%, 3% higher than CPI of the same year. Therefore, the study forecasts an annually 3% (as shown in figure 3.2) increase in CPI between 2006 and 2010. The entire future rate in transportation or warehouses will have the same increment in this study. To clarify, the indicator of transport in CPI may represent the actual price inflation rate in the logistics world more accurately. But, since there is lack of prediction of the indicator transport along, the thesis turns to use CPI. However, the indicator of transport itself in CPI could be found in the statistic data released by National Bureau of Statistics of China each year.
45 http://www.dss.gov.cn/Article_Print.asp?ArticleID=197728 2006-12-25 46 http://www.ctaxnews.com.cn/news/xwmjiazl/luc/t20060419_1284290.htm 2006-12-25
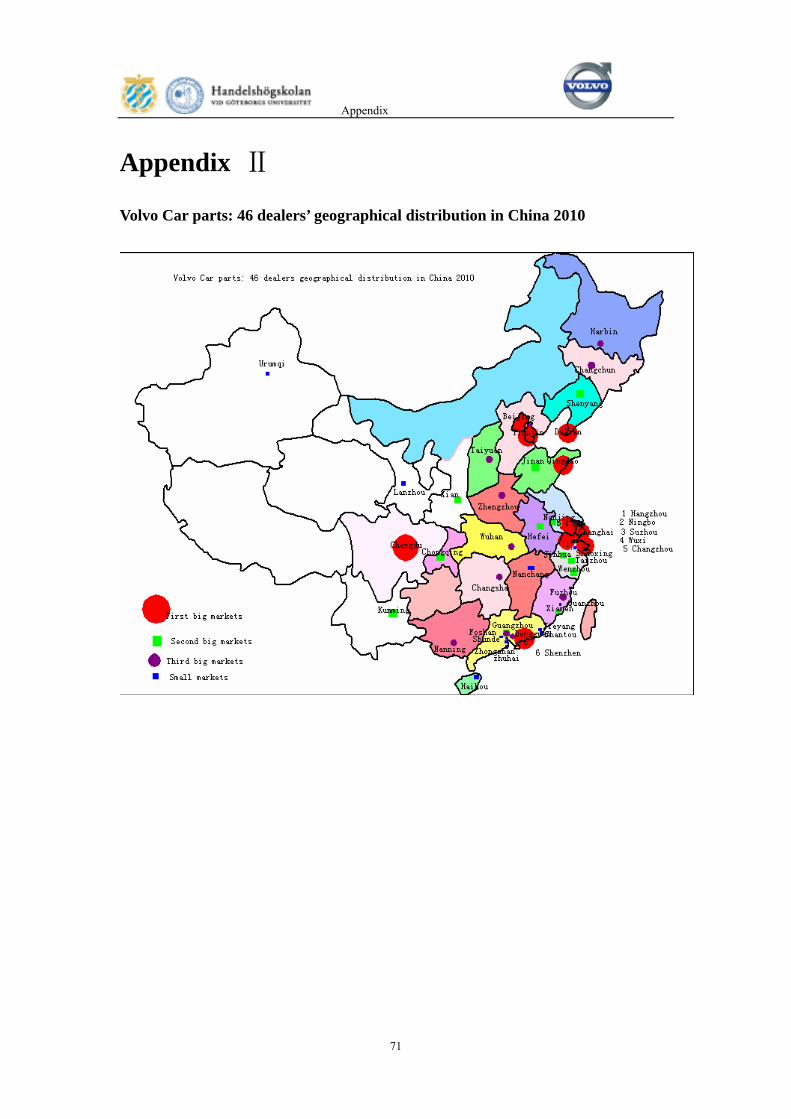
Appendix
71
Appendix Ⅱ
Volvo Car parts: 46 dealers’ geographical distribution in China 2010
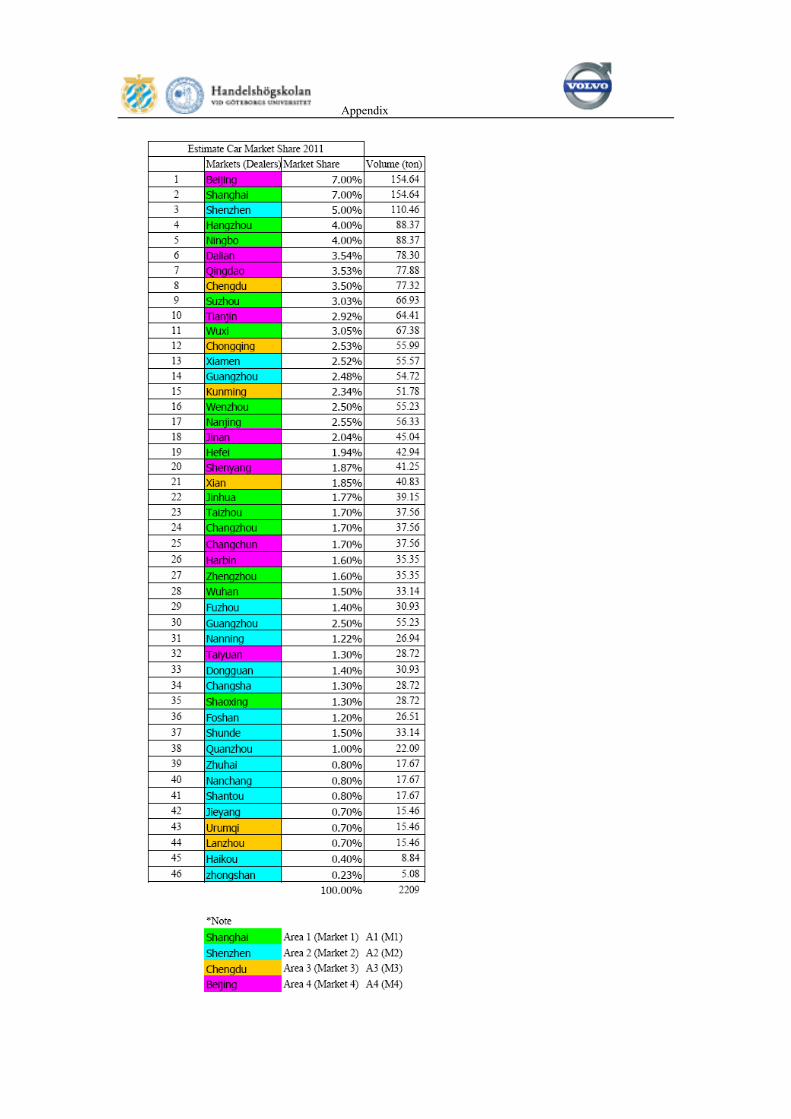
Appendix