Embed Size (px)
Citation preview
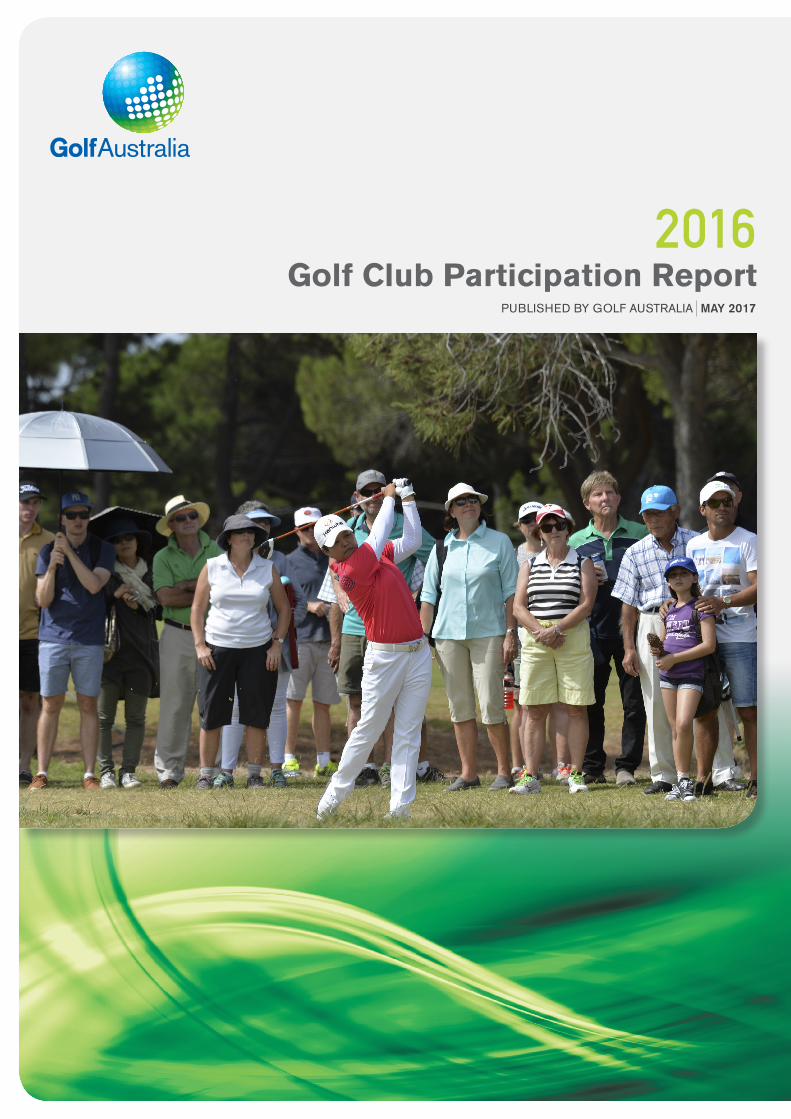
2016 Golf Club Participation Report
PUBLISHED BY GOLF AUSTRALIA MAY 2017

01. KEY FINDINGS ...........................................................................3
02. GROWTH INITIATIVES ...............................................................5
03. REPORT BACKGROUND ...........................................................6Introduction ..................................................................................... 6About The Author ........................................................................... 6
04. NATIONAL CLUB MEMBERSHIP OVERVIEW ......................7Member Golf Association Reporting ......................................... 7Profile Of Australian Clubs .......................................................... 8Course-Based Clubs .................................................................... 9Club Playing Members................................................................10 2016 National Total ...............................................................10 Participation Rate .................................................................10 Historical Trends ....................................................................12 Results by Geographic Area ...............................................13 Social Club Members .........................................................14 Results by Gender .................................................................14 Level of Membership Movement ........................................16Member Age Profile .....................................................................16
Average Age ............................................................................16Age Distribution ......................................................................17Junior Members ......................................................................18
Attraction & Attrition Rates ........................................................19New Member Profile ....................................................................20
05. STATE MEMBERSHIP OUTCOMES .................................... 21Introduction ...................................................................................21New South Wales & ACT ...........................................................21Victoria ............................................................................................23Queensland ...................................................................................24Western Australia .........................................................................25South Australia .............................................................................26Tasmania ........................................................................................27
06. CLUB COMPETITION ROUNDS ........................................... 28National Results ...........................................................................28Results By State ......................................................................... 30Results By Capital City ...............................................................31
07. PROGRAMS, EVENTS, DELIVERERS & OFFICIALS ..........32
CONTENTS
PAGE 2 2016 GOLF CLUB PARTICIPATION REPORT

PAGE 3 2016 GOLF CLUB PARTICIPATION REPORT
The key findings from 2016 are outlined below:
Club Information
• The average club size in Australia is 237 members, with metropolitan clubs on average having more than three times the number of members as regional clubs.
• Two-thirds of clubs in Australia have less than 250 members, with 80% having less than 500 members.
• While clubs of over 1,000 members account for 6% of all clubs across Australia, they account for 30% of individual members.
• There are 313 social clubs affiliated to various state bodies, accounting for 19% of total clubs.
• NSW has the most number of golf course-based clubs with 375, and the highest average member count with 390.
• Western Australia has the highest number of social clubs with 118, and the lowest average member count at golf course-based clubs with 144.
• There are currently 1,347 golf course-based clubs in Australia. There has been a steady decline in clubs over the past 5-year period, from a high of 1,378 in 2012.
Member Movement
• National membership numbers across Australia were reported as 393,975. This result marked a 0.8% decline on numbers reported for the prior 12-month period, equating to a nett loss of 3,132 members.
• History shows that club membership numbers peaked in Australia in 1998 at approximately 500,000 golfers. Since this time, a steady decline has materialised with an overall decline of 27%, averaging 1.2% per annum.
• In the past five-year period a cumulative loss in member numbers of 3% has materialized, which equates to an average decline of 0.6% per year.
• The movement for metropolitan clubs in 2016 was a decline of 1.1%, with an average annual decline of 0.9% evident over the past five years.
• The movement for regional clubs in 2016 was a 1.1% decline, with an average annual decline of 1.1% evident over the past five years.
• Reported member numbers for social clubs have increased over the past five-years from 14,612 in 2012 to 21,558 in 2016, representing an average annual increase of 8.1%.
• Male members declined by 0.2% in the 2016 year, with declines of 0.6% applicable to both metropolitan and regional clubs.
• Female members declined by 3% in 2016, which continues a steady decline over the past five years.
• Given the faster decline in female members relative to males, females now account for just under 20% of national members – down from just under 21% in 2012.
• 36% of clubs experienced a nett increase of more than 2% of members, while 47% experienced a nett decrease of more than 2%.
Age Information
• The average age of club members across the country is just under 56 years, with the average age of male members is eight years younger than females.
• 57% of the national club golf membership base is aged 55 years or greater.
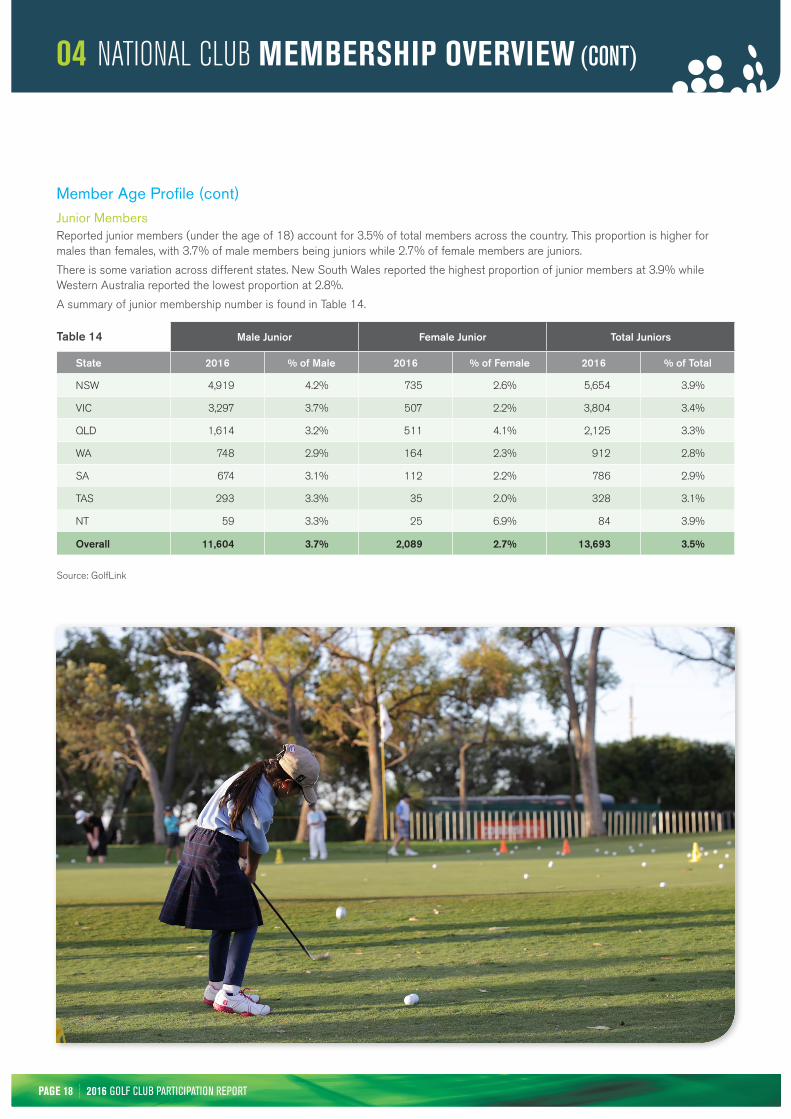
• Reported junior members (under the age of 18) account for 3.5% of total members across the country. This proportion is higher for males than females, with 3.7% of male members being juniors while 2.7% of female members are juniors.
Member Churn
• The national attraction rate is 7.7%, and the attrition rate of 8.7%.
• 50% of new members are under the age of 45 compared to 27% for golf club members generally, indicating a lower age profile for new members.
KEY
FINDINGS01Golf Australia is pleased
to present to you the 2016 Golf Club
Participation Report.

PAGE 4 2016 GOLF CLUB PARTICIPATION REPORT
01 KEY FINDINGS (CONT)
• In 2016 approximately 14.85 million rounds were recorded by GolfLink across the same facility base, a 2.1% increase over the same twelve month period in the prior year.
• Queensland experienced the largest increase in rounds played for the year, recording 5% growth over 2015, largely due to strong outcomes at the beginning and end of the year.
• Slightly softer results were recorded in the metropolitan markets than those recorded nationally with the collective capital cities enjoying only 1.2% growth over 2015. Standout markets were Brisbane and Sydney, with 6.8% and 3.4% rounds growth respectively recorded for these markets.
The key findings for competition rounds played in 2016 are outlined below:
In 2016 approximately 14.85 million rounds were recorded by
GolfLink across the same number of facilities, a 2.1% increase over the
previous year.
2.1%
PAGE 5 2016 GOLF CLUB PARTICIPATION REPORT
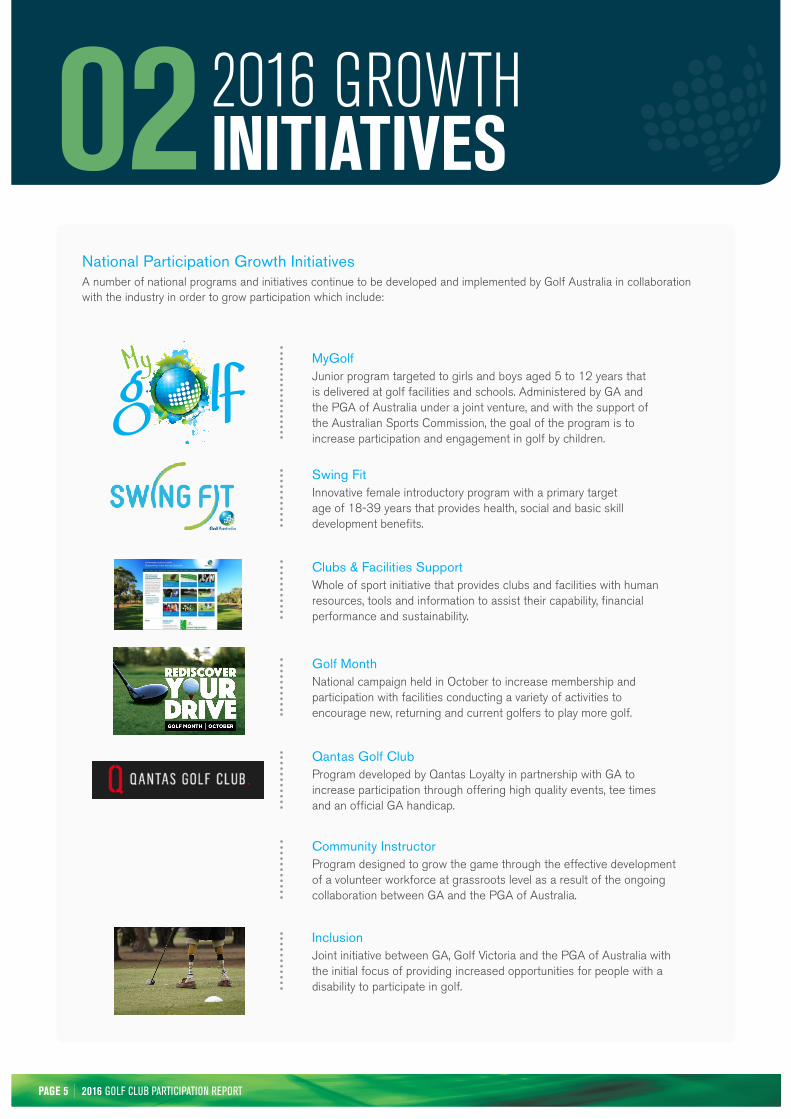
National Participation Growth InitiativesA number of national programs and initiatives continue to be developed and implemented by Golf Australia in collaboration with the industry in order to grow participation which include:
MyGolf Junior program targeted to girls and boys aged 5 to 12 years that is delivered at golf facilities and schools. Administered by GA and the PGA of Australia under a joint venture, and with the support of the Australian Sports Commission, the goal of the program is to increase participation and engagement in golf by children.
Swing FitInnovative female introductory program with a primary target age of 18-39 years that provides health, social and basic skill development benefits.
Clubs & Facilities SupportWhole of sport initiative that provides clubs and facilities with human resources, tools and information to assist their capability, financial performance and sustainability.
Golf MonthNational campaign held in October to increase membership and participation with facilities conducting a variety of activities to encourage new, returning and current golfers to play more golf.
Qantas Golf ClubProgram developed by Qantas Loyalty in partnership with GA to increase participation through offering high quality events, tee times and an official GA handicap.
Community InstructorProgram designed to grow the game through the effective development of a volunteer workforce at grassroots level as a result of the ongoing collaboration between GA and the PGA of Australia.
InclusionJoint initiative between GA, Golf Victoria and the PGA of Australia with the initial focus of providing increased opportunities for people with a disability to participate in golf.
2016 GROWTH
INITIATIVES02
PAGE 6 2016 GOLF CLUB PARTICIPATION REPORT
REPORT
BACKGROUND03IntroductionGolf Australia is pleased to present to you the 2016 National Club Participation Report. It continues to be the goal of Golf Australia to provide the wider golf industry with timely participation information that enables the sport to understand the current landscape and trends in golf participation. Now in its 4th year in this format, it is hoped that this report is becoming an increasingly valuable reference as clubs seek to develop evidenced based strategies that will enhance the future growth and overall sustainability of the game.
About the AuthorSeeking independence of data analysis and subsequent interpretation with this project, Golf Australia sought the expertise of Golf Business Advisory Services (GBAS) to draft this report. GBAS has authored the past three participation reports for Golf Australia, along with a number of other leading industry reference reports covering such topics as club operational and salary benchmarking, membership attrition and retention, national rounds played, and golf retail operations. For more information on GBAS please visit www.golfbas.com
GOLF BUSINESS ADVISORY SERVICES

PAGE 7 2016 GOLF CLUB PARTICIPATION REPORT
Member Golf Association ReportingClub golfer numbers are reported annually each year by the seven respective state and territory member golf association (MGA) bodies. The reported numbers reflect those members who pay a capitation fee to their respective body, generally defined as those classified as ‘having a class of membership that provides regular golf course access.’ The respective reporting periods and the respective membership timing they represent are summarised in the table below:
NATIONAL CLUB MEMBERSHIP OVERVIEW04
State MGA Annual Report Data Collected Period
NSW/ACT * 2015/16 May 2016 Most recent completed financial year
VIC Calendar Year 2016 December 2016 Most recent completed financial year
QLD Calendar Year 2015 December 2015 Most recent completed financial year
SA 2015/16 December 2016 Point in time
WA 2015/16 December 2016 Point in time
TAS Calendar Year 2016 June 2016 Point in time
NT 2015/16 December 2015 Point in time
Note: Throughout this report, New South Wales will refer to data from both New South Wales and the Australian Capital Territory.
As outlined above, different collection and reporting periods exist within the MGA’s. As a result, the reported numbers are not for the same comparable 12-month period. The MGA reports however remain the most accurate data sources available, with data provided by individual club by gender for 76 national regions and 1,660 clubs. As in the past three participation reports, in order for annual trends to be determined, the most recently published (or to be published) numbers have been aggregated and classified as year ending 2016 numbers.
PAGE 8 2016 GOLF CLUB PARTICIPATION REPORT
04 NATIONAL CLUB MEMBERSHIP OVERVIEW (CONT)
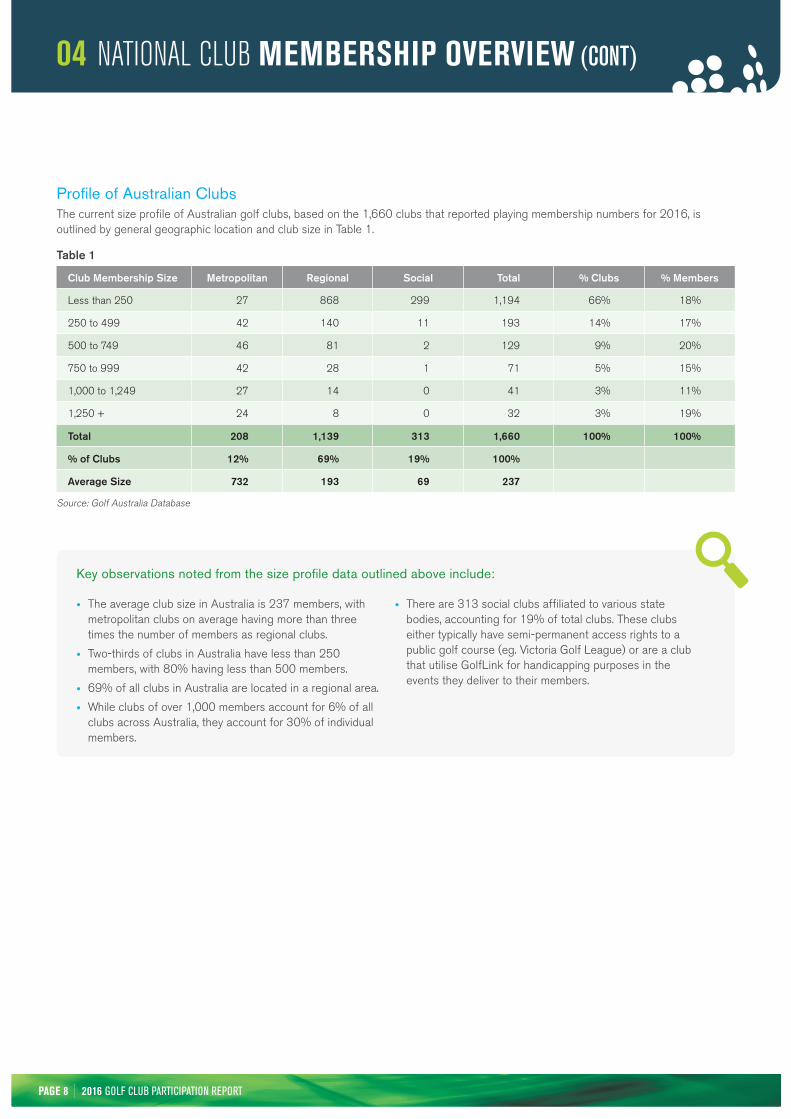
Profile of Australian ClubsThe current size profile of Australian golf clubs, based on the 1,660 clubs that reported playing membership numbers for 2016, is outlined by general geographic location and club size in Table 1.
Club Membership Size Metropolitan Regional Social Total % Clubs % Members
Less than 250 27 868 299 1,194 66% 18%
250 to 499 42 140 11 193 14% 17%
500 to 749 46 81 2 129 9% 20%
750 to 999 42 28 1 71 5% 15%
1,000 to 1,249 27 14 0 41 3% 11%
1,250 + 24 8 0 32 3% 19%
Total 208 1,139 313 1,660 100% 100%
% of Clubs 12% 69% 19% 100%
Average Size 732 193 69 237
Source: Golf Australia Database
Table 1
• The average club size in Australia is 237 members, with metropolitan clubs on average having more than three times the number of members as regional clubs.
• Two-thirds of clubs in Australia have less than 250 members, with 80% having less than 500 members.
• 69% of all clubs in Australia are located in a regional area.
• While clubs of over 1,000 members account for 6% of all clubs across Australia, they account for 30% of individual members.
• There are 313 social clubs affiliated to various state bodies, accounting for 19% of total clubs. These clubs either typically have semi-permanent access rights to a public golf course (eg. Victoria Golf League) or are a club that utilise GolfLink for handicapping purposes in the events they deliver to their members.
Key observations noted from the size profile data outlined above include:

PAGE 9 2016 GOLF CLUB PARTICIPATION REPORT
Profile of Australian Clubs (cont)The current size profile by state/territory for 2016 is outlined in Table 2.
Course-Based ClubsAs depicted in Table 2, there are currently 1,347 golf course-based clubs in Australia. There has been a steady decline in clubs over the past 5-year period, from a high of 1,378 in 2012.
Club Membership Size NSW VIC QLD WA SA TAS NT Total
Social Clubs 0 117 1 118 76 1 0 313
Course-Based Clubs
Less than 250 192 210 152 158 122 53 8 895
250 to 499 59 52 37 11 11 10 2 182
500 to 749 60 29 19 11 5 2 1 127
750 to 999 33 15 12 6 3 1 0 70
1,000 to 1,249 20 13 5 0 3 0 0 41
1,250 + 11 10 6 3 2 0 0 32
Total Course-Based Clubs 375 329 231 189 146 66 11 1,347
Avg Course-Based Club Size 390 301 274 145 163 161 197
Source: Golf Australia Database
State 2012 2013 2014 2015 2016 % change
NSW 389 383 378 378 375 -3.6%
VIC 337 336 332 333 329 -2.4%
QLD 233 234 234 234 231 -0.9%
WA 191 195 195 190 189 -1.0%
SA 149 146 146 146 146 -2.0%
TAS 68 68 68 62 66 -2.9%
NT 11 11 11 11 11 0.0%
Total 1,378 1,373 1,364 1,354 1,347 -2.2%
Source: Golf Australia Database
Table 2
Table 3
• NSW has the most number of golf course-based clubs with 375, and the highest average member count with 390.
• Western Australia has the highest number of social clubs with 118, and the lowest average member count at golf course-based clubs with 144.
Key observations noted from the size profile data outlined above include:
04 NATIONAL CLUB MEMBERSHIP OVERVIEW (CONT)
PAGE 10 2016 GOLF CLUB PARTICIPATION REPORT
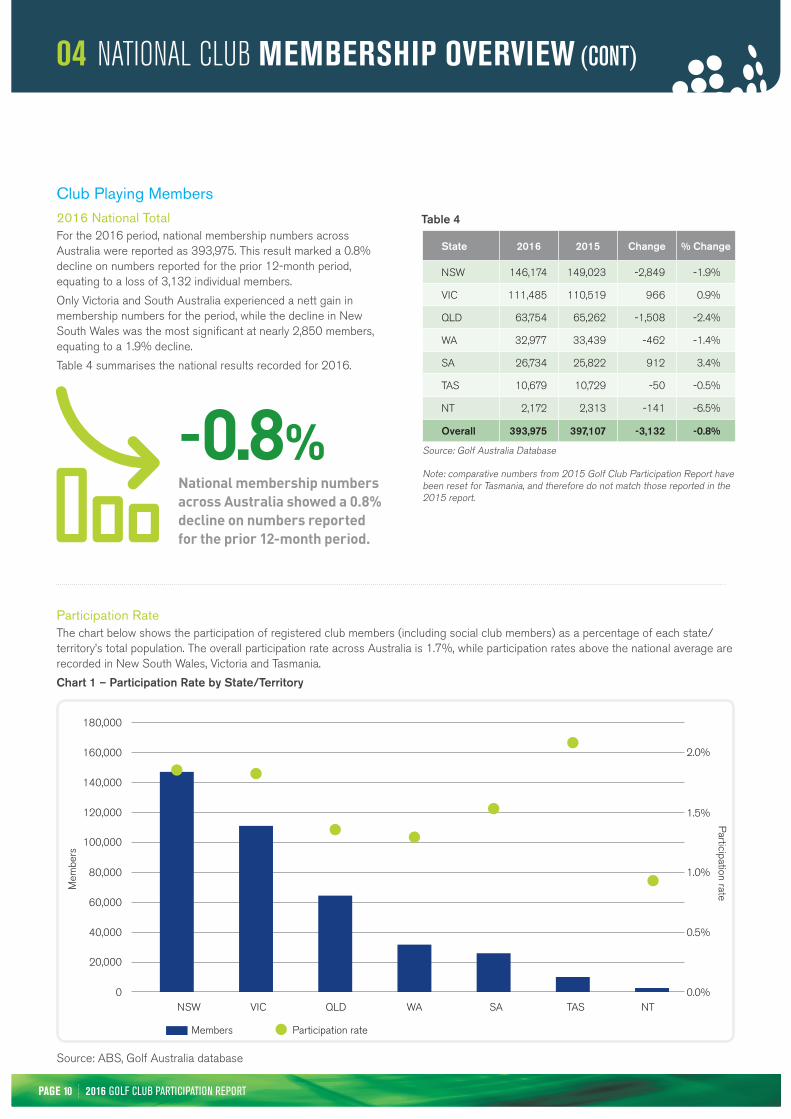
Club Playing Members2016 National TotalFor the 2016 period, national membership numbers across Australia were reported as 393,975. This result marked a 0.8% decline on numbers reported for the prior 12-month period, equating to a loss of 3,132 individual members.
Only Victoria and South Australia experienced a nett gain in membership numbers for the period, while the decline in New South Wales was the most significant at nearly 2,850 members, equating to a 1.9% decline.
Table 4 summarises the national results recorded for 2016.
State 2016 2015 Change % Change
NSW 146,174 149,023 -2,849 -1.9%
VIC 111,485 110,519 966 0.9%
QLD 63,754 65,262 -1,508 -2.4%
WA 32,977 33,439 -462 -1.4%
SA 26,734 25,822 912 3.4%
TAS 10,679 10,729 -50 -0.5%
NT 2,172 2,313 -141 -6.5%
Overall 393,975 397,107 -3,132 -0.8%
Source: Golf Australia Database
Note: comparative numbers from 2015 Golf Club Participation Report have been reset for Tasmania, and therefore do not match those reported in the 2015 report.
National membership numbers across Australia showed a 0.8% decline on numbers reported for the prior 12-month period.
- 0.8%
Table 4
Participation RateThe chart below shows the participation of registered club members (including social club members) as a percentage of each state/territory’s total population. The overall participation rate across Australia is 1.7%, while participation rates above the national average are recorded in New South Wales, Victoria and Tasmania.
Chart 1 – Participation Rate by State/Territory
Source: ABS, Golf Australia database
0
20,000
40,000
60,000
80,000
100,000
120,000
140,000
160,000
180,000
NSW VIC QLD WA SA TAS NT0.0%
1.0%
2.0%
0.5%
1.5%
Members Participation rate
Participation rate
Mem
bers
04 NATIONAL CLUB MEMBERSHIP OVERVIEW (CONT)
PAGE 11 2016 GOLF CLUB PARTICIPATION REPORT
04 NATIONAL CLUB MEMBERSHIP OVERVIEW (CONT)
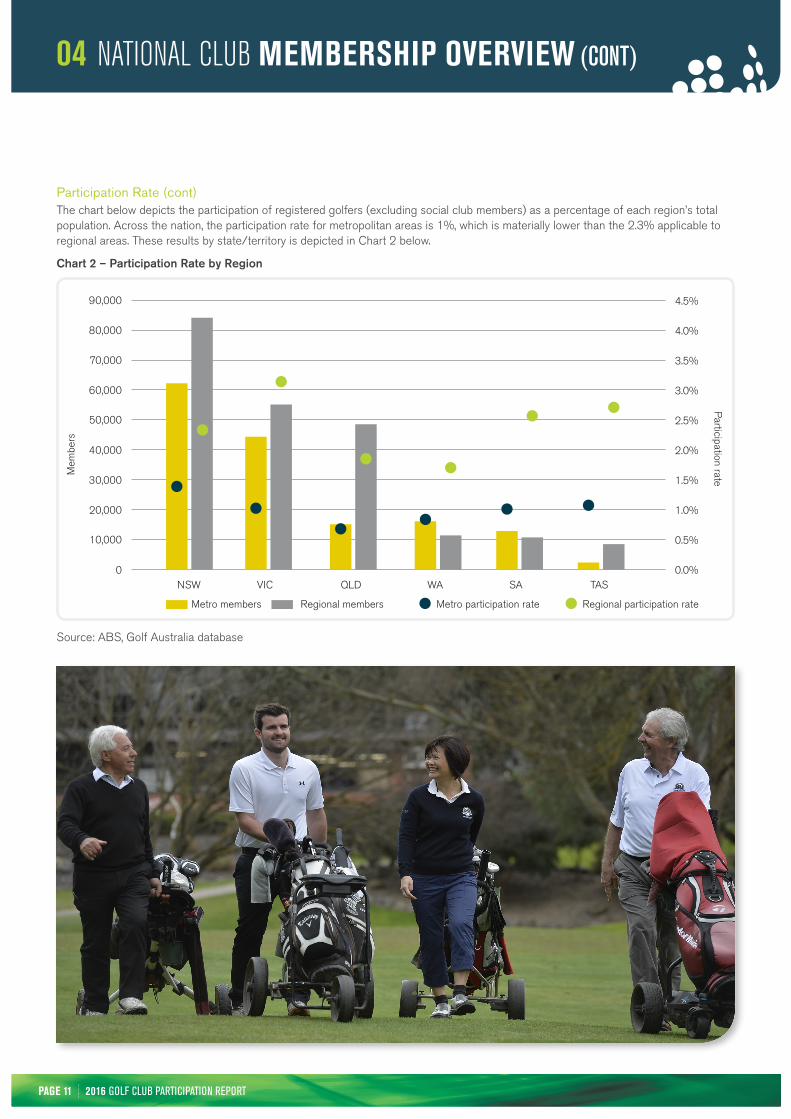
Participation Rate (cont)The chart below depicts the participation of registered golfers (excluding social club members) as a percentage of each region’s total population. Across the nation, the participation rate for metropolitan areas is 1%, which is materially lower than the 2.3% applicable to regional areas. These results by state/territory is depicted in Chart 2 below.
Chart 2 – Participation Rate by Region
Source: ABS, Golf Australia database
0
10,000
20,000
30,000
40,000
50,000
60,000
70,000
80,000
90,000
NSW VIC QLD WA SA TAS0.0%
1.0%
2.0%
3.0%
4.0%
0.5%
1.5%
2.5%
3.5%
4.5%
Metro members Regional members Metro participation rate Regional participation rate
Participation rate
Mem
bers
PAGE 12 2016 GOLF CLUB PARTICIPATION REPORT
In the past five-year period a cumulative loss in total members of 3% has materialized, which equates to an average decline of 0.6% per year. Victoria, Western Australia and South Australia have each experienced a nett increase in member numbers over this period, while material declines are evident in New South Wales, Queensland and Tasmania.
Table 5 summarises the national results recorded for the five-year period 2012 to 2016.
% Change
State 2012 2013 2014 2015 2016 1 Year 5 Year
NSW 156,976 153,594 149,855 149,023 146,174 -1.9% -1.4%
VIC 110,268 111,907 111,026 110,519 111,485 0.9% 0.2%
QLD 67,714 65,781 65,282 65,262 63,754 -2.3% -1.2%
WA 31,409 32,837 33,627 33,439 32,977 -1.4% 1.0%
SA 26,211 25,683 25,909 25,822 26,734 3.5% 0.4%
TAS 11,847 11,310 11,131 10,729 10,679 -0.5% -2.1%
NT 2,293 2,276 2,216 2,313 2,172 -6.1% -1.1%
Metropolitan 158,827 157,203 154,466 153,794 152,172 -1.1% -0.9%
Regional 233,279 228,421 225,404 222,583 220,245 -1.1% -1.1%
Social 14,612 17,764 19,176 20,730 21,558 4.0% 8.1%
Overall 406,718 403,388 399,046 397,107 393,975 -0.8% -0.6%
# Course-Based Clubs 1,378 1,373 1,364 1,354 1,347 -0.5% -0.5%
Source: Golf Australia Database
Note: Total course-based clubs does not include social clubs that operate within a public golf course.
Table 5
04 NATIONAL CLUB MEMBERSHIP OVERVIEW (CONT)
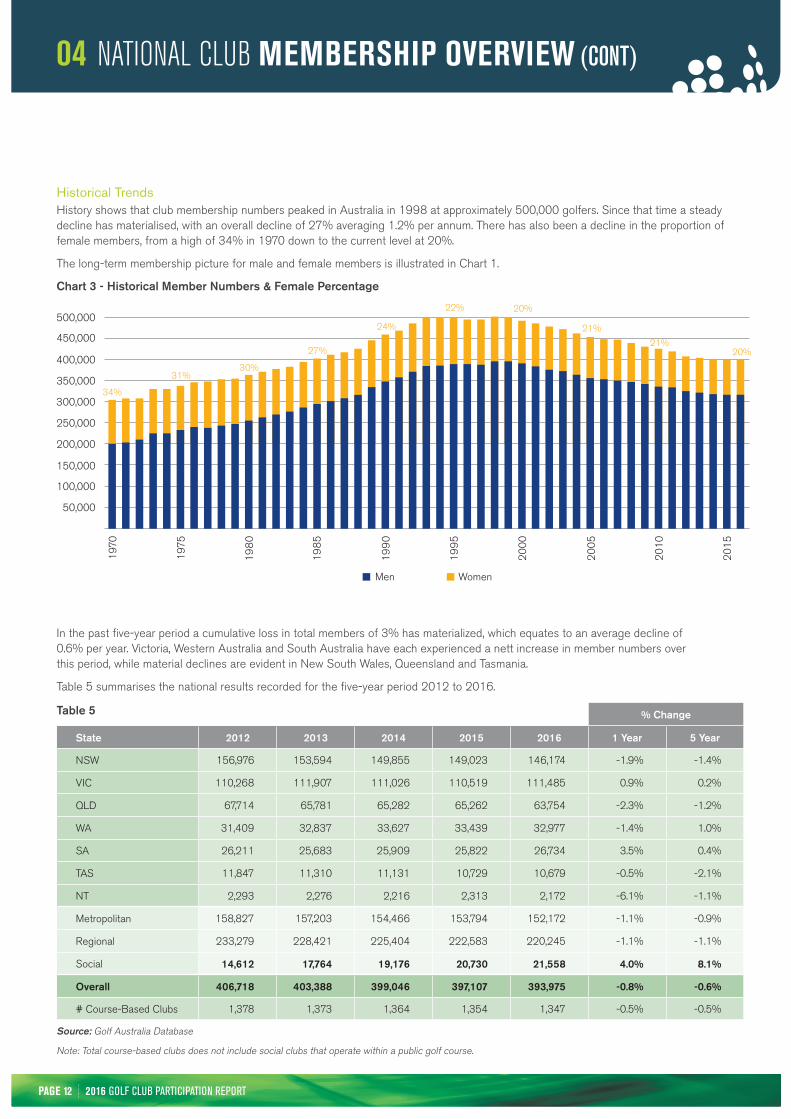
Historical TrendsHistory shows that club membership numbers peaked in Australia in 1998 at approximately 500,000 golfers. Since that time a steady decline has materialised, with an overall decline of 27% averaging 1.2% per annum. There has also been a decline in the proportion of female members, from a high of 34% in 1970 down to the current level at 20%.
The long-term membership picture for male and female members is illustrated in Chart 1.
Chart 3 - Historical Member Numbers & Female Percentage
50,000
197
0
197
5
19
80
19
85
19
90
19
95
20
00
20
05
20
10
20
15
100,000
150,000
34%
31%30%
27%
24%
22% 20%
21%
21%20%
200,000
250,000
300,000
350,000
400,000
450,000
500,000
Men Women

PAGE 13 2016 GOLF CLUB PARTICIPATION REPORT
Source: Golf Australia Database
Note: This table excludes social clubs.
Source: Golf Australia Database
Note: This table excludes social clubs.
% Change
State 2012 2013 2014 2015 2016 1 Year 5 Year
NSW 66,309 65,587 63,515 63,251 62,072 -1.9% -1.3%
VIC 44,042 44,176 43,782 44,265 44,201 -0.1% 0.1%
QLD 16,121 15,715 15,113 14,653 14,737 0.6% -1.8%
WA 16,443 16,317 16,730 16,457 16,054 -2.4% -0.5%
SA 13,553 13,238 13,153 12,990 12,902 -0.7% -1.0%
TAS 2,359 2,170 2,173 2,178 2,206 1.3% -1.3%
Overall 158,827 157,203 154,466 153,794 152,172 -1.1% -0.9%
% Change
State 2012 2013 2014 2015 2016 1 Year 5 Year
NSW 90,667 88,007 86,340 85,772 84,102 -1.9% -1.5%
VIC 56,226 56,321 55,089 53,359 54,694 2.5% -0.6%
QLD 51,593 50,036 50,016 50,184 48,646 -3.1% -1.2%
WA 11,650 11,680 11,737 11,355 11,355 0.0% -0.5%
SA 11,362 10,961 11,071 11,073 10,827 -2.2% -1.0%
TAS 9,488 9,140 8,935 8,527 8,449 -0.9% -2.3%
NT 2,293 2,276 2,216 2,313 2,172 -6.1% -1.1%
Overall 233,279 228,421 225,404 222,583 220,245 -1.1% -1.1%
Club Playing Members (cont)Results by Geographical Area - MetropolitanThe movement for metropolitan clubs in 2016 was a decline of 1.1%, with an average annual decline of 0.9% evident over the past five years. Victoria was the only state with positive movement over this five-year period, while New South Wales and Queensland had the largest declines at an annual rate of 1.3% and 1.8% respectively.
The results for each state/territory for metropolitan areas are represented in Table 6.
Results by Geographical Area - RegionalThe movement for regional clubs in 2016 was a 1.1% decline, with an average annual decline of 1.1% evident over the past five years. All states/territories experienced a decline in regional member numbers, with the largest average decline evident in New South Wales and Tasmania at 1.5% and 2.3% respectively.
The results for each state/territory for regional areas are represented in Table 7.
Table 6
Table 7
04 NATIONAL CLUB MEMBERSHIP OVERVIEW (CONT)
PAGE 14 2016 GOLF CLUB PARTICIPATION REPORT
Source: Golf Australia Database
Note: There are no affiliated social clubs in New South Wales or the Northern Territory.
% Change
State 2012 2013 2014 2015 2016 1 Year 5 Year
VIC 10,000 11,410 12,155 12,895 12,590 -2.4% 4.7%
QLD 0 30 153 425 371 -12.7%
WA 3,316 4,840 5,160 5,627 5,568 -1.0% 10.9%
SA 1,296 1,484 1,685 1,759 3,005 70.8% 18.3%
TAS 0 0 23 24 24 0.0%
Overall 14,612 17,764 19,176 20,730 21,558 4.0% 8.1%
Club Playing Members (cont)Social Club MembersReported member numbers for social clubs have increased over the past five-years from 14,612 in 2012 to 21,558 in 2016, representing an average annual increase of 8.1%. The results for each state/territory are represented in Table 8.
Table 8
% Change
State 2012 2013 2014 2015 2016 1 Year 5 Year
NSW 124,842 122,727 119,669 119,476 117,747 -1.4% -1.2%
VIC 85,850 87,109 86,778 86,539 88,409 2.2% 0.6%
QLD 53,846 53,145 52,473 52,481 51,219 -2.4% -1.0%
WA 24,518 25,701 26,319 26,309 25,890 -1.6% 1.1%
SA 20,981 20,577 20,816 20,726 21,636 4.4% 0.6%
TAS 9,706 9,280 9,153 8,865 8,902 0.4% -1.7%
NT 1,908 1,897 1,850 1,910 1,810 -5.2% -1.0%
Metropolitan 128,191 126,696 124,779 124,110 123,337 -0.6% -0.8%
Regional 182,281 179,739 177,008 175,429 174,452 -0.6% -0.9%
Social 11,179 14,001 15,271 16,767 17,824 6.3% 9.8%
Overall 321,651 320,436 317,058 316,306 315,613 -0.2% -0.4%
Membership by Gender - MaleMale members declined by 0.2% in the 2016 year, with declines of 0.6% applicable to metropolitan and regional clubs. These results were offset by an increase in social club members. There was some variance evident in the results by state/territory, with Victoria, Western Australia and South Australia experiencing an increase in male member numbers over the five-year period.
These results are summarized in Table 9.
Table 9
04 NATIONAL CLUB MEMBERSHIP OVERVIEW (CONT)
Source: Golf Australia database

PAGE 15 2016 GOLF CLUB PARTICIPATION REPORT
Club Playing Members (cont)Membership by Gender - FemaleFemale members declined by 3% in 2016, which continues a steady decline over the past five years. A 3.8% decline was apparent in both New South Wales and Victoria in 2016. Over the past five years, an average annual decline of 1.2% and 2.1% is evident for metropolitan and regional clubs respectively.
These results are summarized in Table 10.
Given the faster decline in female members relative to males, females now account for just under 20% of national members – down from just under 21% in 2012.
The gender mix evident by state for the 2016 year, as summarised in Chart 4, shows some variation between states/territories. Victoria and Western Australia have the highest percentage of female members at 21% while the lowest is in the Northern Territory and Tasmania at 17%.
Chart 4 - Gender Breakdown by State/Territory
female share of membership base
20%100%
90%
80%
70%
50%
60%
40%
30%
20%
10%
Men Women
NSW VIC QLD SA WA TAS NT Total0%
19%
81% 79% 80% 79% 81% 83% 83% 80%
21% 20% 21% 19%17%
20%
Source: Golf Australia Database
17%
83%
% Change
State 2012 2013 2014 2015 2016 1 Year 5 Year
NSW 32,134 30,867 30,186 29,547 28,427 -3.8% -2.4%
VIC 24,418 24,798 24,248 23,980 23,076 -3.8% -1.1%
QLD 13,868 12,636 12,809 12,781 12,535 -1.9% -2.0%
WA 6,891 7,136 7,308 7,130 7,087 -0.6% 0.6%
SA 5,230 5,106 5,093 5,096 5,098 0.0% -0.5%
TAS 2,141 2,030 1,978 1,864 1,777 -4.7% -3.7%
NT 385 379 366 403 362 -10.2% -1.2%
Metropolitan 30,636 30,507 29,687 29,684 28,835 -2.9% -1.2%
Regional 50,998 48,682 48,396 47,154 45,793 -2.9% -2.1%
Social 3,433 3,763 3,905 3,963 3,734 -5.8% 1.7%
Overall 85,067 82,952 81,988 80,801 78,362 -3.0% -1.6%
% of total 20.9% 20.6% 20.5% 20.3% 19.9%
Table 10
04 NATIONAL CLUB MEMBERSHIP OVERVIEW (CONT)
PAGE 16 2016 GOLF CLUB PARTICIPATION REPORT
State Male Female Overall
NSW 55.0 63.4 56.5
VIC 54.2 63.0 55.9
QLD 54.4 61.8 55.7
WA 53.4 59.0 54.5
SA 54.1 62.3 55.5
TAS 54.1 62.9 55.5
NT 48.6 55.6 49.6
Overall 54.4 62.4 55.9
Member Age ProfileAverage AgeThe average age of club members across the country is just under 56 years. In terms of gender, the average age of male members is eight years younger than females, with a similar age disparity being evident across all states/territories.
Full results of the age breakdown for male and female club members by state are depicted in Table 12.
Table 12
Average age of male and female members is 54.4 years and 62.4 years respectively
54.4yrs 62.4yrs
Increase Flat Decrease
Club Size 5% 2-5% <2% variance 2-5% >5%
Less than 250 31% 5% 17% 8% 40%
250 to 499 31% 9% 19% 9% 32%
500 to 749 24% 9% 17% 20% 29%
750 to 999 26% 16% 23% 16% 20%
1,000 to 1,249 29% 12% 37% 15% 7%
1,250 + 16% 8% 32% 30% 14%
Overall 29% 7% 18% 11% 35%
36% 46%
Level of Membership Movement In 2016, 36% of clubs (34% in 2015) experienced a nett increase of more than 2% in membership numbers, while 47% experienced a nett decrease (44% in 2015). Table 11 summarizes the proportion of clubs experiencing positive and negative shifts in their membership base for each size category.
Table 11
Source: Golf Australia Database Note:18 clubs reported no numbers in 2016 and are therefore assumed to have closed. These clubs are excluded from this table
04 NATIONAL CLUB MEMBERSHIP OVERVIEW (CONT)
Source: GolfLink

PAGE 17 2016 GOLF CLUB PARTICIPATION REPORT
Member Age Profile (cont)Age Distribution57% of the national club golf membership base is aged 55 years or greater. The relative breakdown of club members by age bracket for each state/territory is depicted in Table 13.
Table 13
Age group NSW VIC QLD WA SA TAS NT Overall
Under 18 3.9% 3.4% 3.3% 2.8% 2.9% 3.1% 3.9% 3.5%
18-34 11.7% 11.9% 13.0% 13.4% 12.6% 12.7% 17.9% 12.2%
35-44 11.2% 11.5% 11.7% 10.4% 11.7% 10.3% 15.9% 11.3%
45-54 15.4% 15.9% 15.9% 16.6% 14.9% 15.3% 20.8% 15.6%
55-64 21.4% 21.0% 20.1% 22.6% 20.2% 22.8% 24.0% 21.0%
65-74 23.4% 22.5% 23.0% 22.6% 25.2% 24.9% 13.8% 23.1%
75+ 13.1% 13.9% 13.0% 11.6% 12.5% 10.9% 3.7% 12.9%
04 NATIONAL CLUB MEMBERSHIP OVERVIEW (CONT)
Source: GolfLink
PAGE 18 2016 GOLF CLUB PARTICIPATION REPORT
Male Junior Female Junior Total Juniors
State 2016 % of Male 2016 % of Female 2016 % of Total
NSW 4,919 4.2% 735 2.6% 5,654 3.9%
VIC 3,297 3.7% 507 2.2% 3,804 3.4%
QLD 1,614 3.2% 511 4.1% 2,125 3.3%
WA 748 2.9% 164 2.3% 912 2.8%
SA 674 3.1% 112 2.2% 786 2.9%
TAS 293 3.3% 35 2.0% 328 3.1%
NT 59 3.3% 25 6.9% 84 3.9%
Overall 11,604 3.7% 2,089 2.7% 13,693 3.5%
Member Age Profile (cont)Junior MembersReported junior members (under the age of 18) account for 3.5% of total members across the country. This proportion is higher for males than females, with 3.7% of male members being juniors while 2.7% of female members are juniors.
There is some variation across different states. New South Wales reported the highest proportion of junior members at 3.9% while Western Australia reported the lowest proportion at 2.8%.
A summary of junior membership number is found in Table 14.
Table 14
04 NATIONAL CLUB MEMBERSHIP OVERVIEW (CONT)
Source: GolfLink

PAGE 19 2016 GOLF CLUB PARTICIPATION REPORT
Metropolitan Regional Total
State Attraction Attrition Attraction Attrition Attraction Attrition
NSW 6.4% 7.7% 7.1% 8.8% 6.8% 8.3%
VIC 6.0% 6.1% 8.4% 6.3% 7.3% 6.2%
QLD 7.9% 7.3% 10.5% 13.2% 9.9% 11.8%
WA 7.7% 10.1% 10.2% 10.9% 8.7% 10.4%
SA 7.1% 7.7% 8.6% 11.6% 7.8% 9.5%
TAS 9.8% 8.5% 7.8% 8.7% 8.2% 8.6%
NT - - 12.9% 19.0% 12.9% 19.0%
Overall 6.7% 7.5% 8.5% 9.5% 7.7% 8.7%
Attraction & Attrition RatesUtilising data from GolfLink, Golf Australia is able to report annual national club (excluding social clubs) attraction & attrition rates. With new member data (defined as being those golf club members that were allocated a new GolfLink number during the year) sourced from GolfLink merged with year-end member numbers, these rates can be accurately calculated.
Table 15 depicts the relevant attraction and attrition rates for metropolitan and regional clubs, as well as the overall result. This data shows a national attraction rate of 7.7%, and an attrition rate of 8.7%. There is some variation in these rates based on region, with higher rates generally applicable to regional clubs than metropolitan clubs.
Table 15
04 NATIONAL CLUB MEMBERSHIP OVERVIEW (CONT)
2016 results show a national attrition rate of
8.7%
Source: Golf Australia database, GolfLink

PAGE 20 2016 GOLF CLUB PARTICIPATION REPORT
New Member ProfileOutlined earlier in this report is the level of new membership demand recorded in 2016, approximately 8% of total golf club membership. With data sourced from GolfLink, the age profile of new members is depicted in Chart 5. 50% of new members are under the age of 45 compared to 27% for golf club members generally, indicating a lower age profile for new members.
In terms of gender, 85% of new members are male and 15% female. This suggests that the ongoing decline in the proportion of female members (currently 20% of total members) is likely to continue.
Chart 5 - New Member Age Profile
50%
35%
40%
30%
25%
20%
15%
10%
5%
Members generally New members
Under 18 18-34 35-44 45-54 55-64 65-74 75+0%
3.5%7.6%
12.2%
25.5%
11.3%
17.0%
15.6%
18.9% 21.0%18.3%
23.1%
11.0%12.9%
1.7%
of new members in 2016 are under the age of 45 compared to 27% for all golf club members.
04 NATIONAL CLUB MEMBERSHIP OVERVIEW (CONT)
Source: GolfLink

PAGE 21 2016 GOLF CLUB PARTICIPATION REPORT
IntroductionIn terms of the 73 defined intrastate golf districts across the country, 26 regions (36%) experienced positive membership growth over the period, while the other 47 regions (64%) experienced a decline.
Where female members of clubs may be classified in a different district to the male members of the same club, female membership numbers have been allocated to the male districts to allow district analysis to occur. No district analysis has been undertaken for the Northern Territory as no separate golf districts exist. Results for each state are listed in order based on the percentage change from 2015.
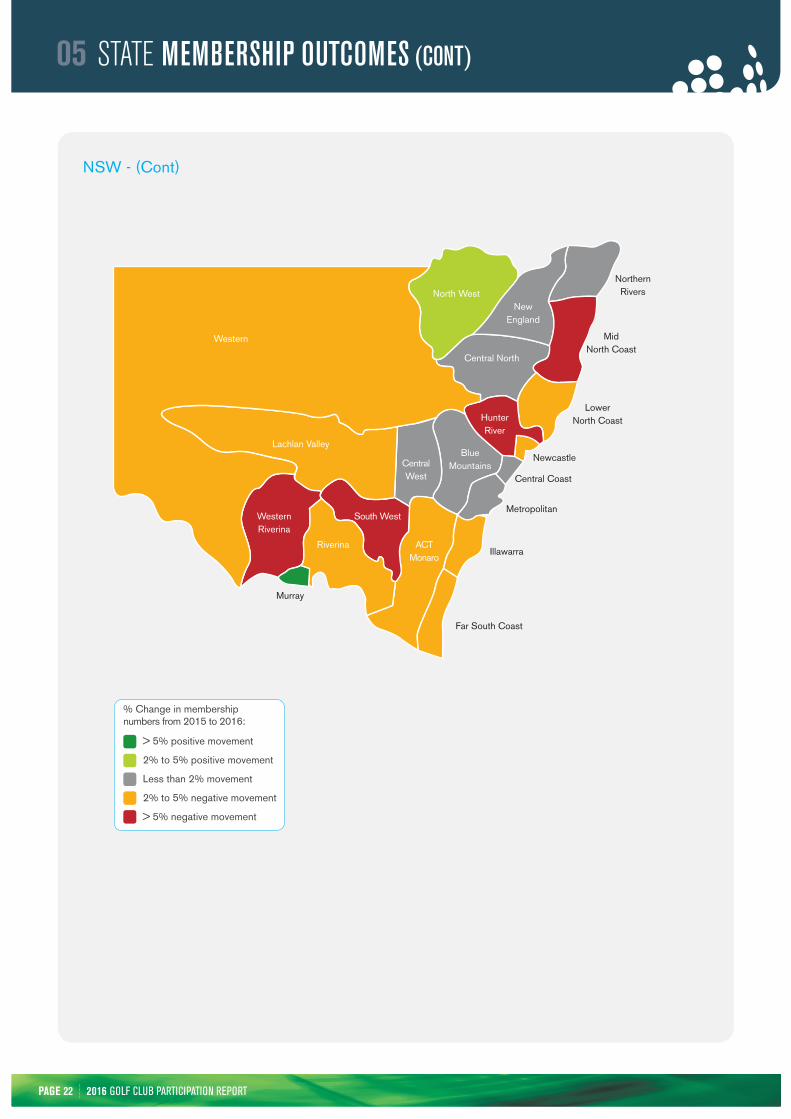
NSW6 of the 21 districts in NSW experienced a nett increase in membership numbers in 2016, with the 12% increase evident in the Murray district continuing a positive five-year trend where an average increase of 9% is evident. The North West and Central Western districts have both experienced a nett increase in member numbers over the past 5-years. These results are depicted in Table 16.
STATE MEMBERSHIP
OUTCOMES05
% Change
Region 2012 2013 2014 2015 2016 1 Year 5 Year
Murray 4,111 4,661 4,984 5,619 6,315 12.4% 9.0%
North West 1,033 1,031 1,055 1,080 1,116 3.3% 1.6%
Central North 2,854 2,860 2,710 2,599 2,626 1.0% -1.7%
Central Coast 7,163 7,196 7,120 6,942 6,994 0.7% -0.5%
New England 1,537 1,509 1,541 1,426 1,428 0.1% -1.5%
Northern Rivers 8,585 8,143 7,798 7,643 7,650 0.1% -2.3%
Central Western 3,500 3,480 3,484 3,628 3,598 -0.8% 0.6%
Metropolitan 66,309 65,587 63,515 63,251 62,072 -1.9% -1.3%
Blue Mountains 2,916 2,673 2,562 2,332 2,288 -1.9% -4.7%
Lower North Coast 5,361 5,202 4,728 4,806 4,710 -2.0% -2.6%
Western 2,137 1,974 1,985 2,056 2,005 -2.5% -1.3%
ACT-Monaro 10,169 9,204 8,963 9,092 8,855 -2.6% -2.7%
Far South Coast 6,033 5,769 5,471 5,321 5,171 -2.8% -3.0%
Newcastle 9,145 8,940 8,795 8,885 8,621 -3.0% -1.2%
Lachlan Valley 1,046 901 914 884 854 -3.4% -4.0%
Illawarra 10,565 9,847 9,344 9,175 8,820 -3.9% -3.5%
Riverina 1,682 1,868 1,935 1,760 1,681 -4.5% 0.0%
Western Riverina 1,862 1,882 1,830 1,765 1,673 -5.2% -2.1%
South West 1,518 1,413 1,373 1,407 1,318 -6.3% -2.8%
Hunter River 3,985 4,260 4,216 4,191 3,848 -8.2% -0.7%
Mid North Coast 5,465 5,194 5,532 5,161 4,531 -12.2% -3.7%
NSW Total 156,976 153,594 149,855 149,023 146,174 -1.9% -1.4%
Table 16
PAGE 22 2016 GOLF CLUB PARTICIPATION REPORT
NSW - (Cont)
Western
Lachlan Valley
Western Riverina
Riverina
Murray
Far South Coast
Illawarra
Metropolitan
Central Coast
Newcastle
Lower North Coast
Mid North Coast
Northern Rivers
New England
North West
Central North
Hunter River
Blue MountainsCentral
West
South West
ACT Monaro
> 5% positive movement
2% to 5% positive movement
Less than 2% movement
2% to 5% negative movement
> 5% negative movement
% Change in membership numbers from 2015 to 2016:
05 STATE MEMBERSHIP OUTCOMES (CONT)
PAGE 23 2016 GOLF CLUB PARTICIPATION REPORT
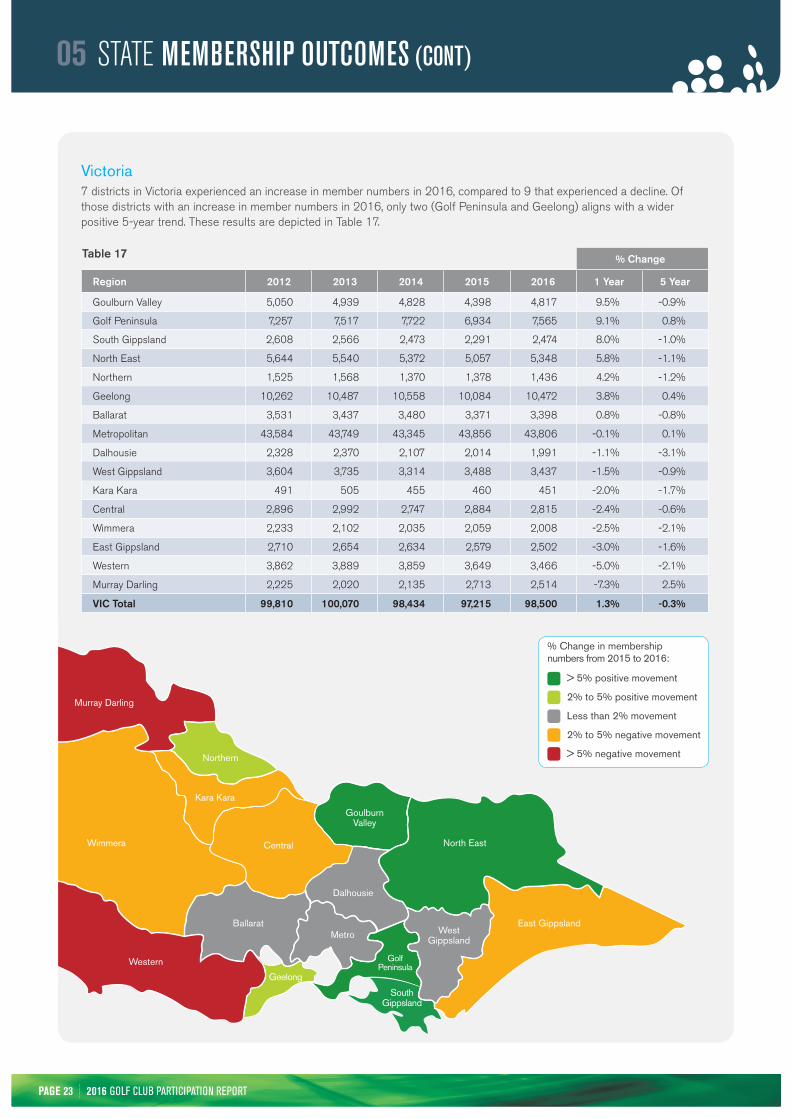
Victoria7 districts in Victoria experienced an increase in member numbers in 2016, compared to 9 that experienced a decline. Of those districts with an increase in member numbers in 2016, only two (Golf Peninsula and Geelong) aligns with a wider positive 5-year trend. These results are depicted in Table 17.
% Change
Region 2012 2013 2014 2015 2016 1 Year 5 Year
Goulburn Valley 5,050 4,939 4,828 4,398 4,817 9.5% -0.9%
Golf Peninsula 7,257 7,517 7,722 6,934 7,565 9.1% 0.8%
South Gippsland 2,608 2,566 2,473 2,291 2,474 8.0% -1.0%
North East 5,644 5,540 5,372 5,057 5,348 5.8% -1.1%
Northern 1,525 1,568 1,370 1,378 1,436 4.2% -1.2%
Geelong 10,262 10,487 10,558 10,084 10,472 3.8% 0.4%
Ballarat 3,531 3,437 3,480 3,371 3,398 0.8% -0.8%
Metropolitan 43,584 43,749 43,345 43,856 43,806 -0.1% 0.1%
Dalhousie 2,328 2,370 2,107 2,014 1,991 -1.1% -3.1%
West Gippsland 3,604 3,735 3,314 3,488 3,437 -1.5% -0.9%
Kara Kara 491 505 455 460 451 -2.0% -1.7%
Central 2,896 2,992 2,747 2,884 2,815 -2.4% -0.6%
Wimmera 2,233 2,102 2,035 2,059 2,008 -2.5% -2.1%
East Gippsland 2,710 2,654 2,634 2,579 2,502 -3.0% -1.6%
Western 3,862 3,889 3,859 3,649 3,466 -5.0% -2.1%
Murray Darling 2,225 2,020 2,135 2,713 2,514 -7.3% 2.5%
VIC Total 99,810 100,070 98,434 97,215 98,500 1.3% -0.3%
Table 17
05 STATE MEMBERSHIP OUTCOMES (CONT)
North East
East GippslandWest
GippslandMetroBallarat
Goulburn Valley
Western
Wimmera
Kara Kara
Central
Northern
Murray Darling
Golf Peninsula
South Gippsland
Geelong
Dalhousie
> 5% positive movement
2% to 5% positive movement
Less than 2% movement
2% to 5% negative movement
> 5% negative movement
% Change in membership numbers from 2015 to 2016:

PAGE 24 2016 GOLF CLUB PARTICIPATION REPORT
Queensland2 of the 14 districts in Queensland experienced a nett increase in membership numbers in 2016, with South-East Queensland also experiencing an increase over the past 5-year period. These results are depicted in Table 18.
Table 18
Far North
North Qld
Central West
South West
Central Highlands
Central
Wide Bay
Sunshine Coast
SEQDarling Downs
Inset: South East
Queensland
Moreton
Sunshine Coast
Metro
South East
Gold Coast
% Change
Region 2012 2013 2014 2015 2016 1 Year 5 Year
South East Qld 4,581 4,517 4,352 4,465 4,835 8.3% 1.1%
Metropolitan 16,121 15,715 15,113 14,653 14,737 0.6% -1.8%
Sunshine Coast 13,275 12,593 12,582 12,587 12,435 -1.2% -1.3%
South West Qld 676 865 847 823 812 -1.3% 3.7%
Central West 239 234 244 258 254 -1.6% 1.2%
Darling Downs 3,635 3,681 3,706 3,839 3,749 -2.3% 0.6%
Far North Qld 3,411 3,237 3,204 3,032 2,952 -2.6% -2.8%
North Qld 4,406 4,271 4,536 4,274 4,108 -3.9% -1.4%
Wide Bay 3,288 3,217 3,198 3,242 3,103 -4.3% -1.2%
Central Qld 3,174 3,263 3,105 3,272 3,121 -4.6% -0.3%
Central Highlands 878 1,014 1,307 1,382 1,285 -7.0% 7.9%
Gold Coast 11,930 11,046 10,848 10,810 9,981 -7.7% -3.5%
Moreton 2,100 2,098 2,087 2,200 2,011 -8.6% -0.9%
QLD Total 67,714 65,751 65,129 64,837 63,383 -2.2% -1.3%
> 5% positive movement
2% to 5% positive movement
Less than 2% movement
2% to 5% negative movement
> 5% negative movement
% Change in membership numbers from 2015 to 2016:
< See South East Queensland inset above
05 STATE MEMBERSHIP OUTCOMES (CONT)

PAGE 25 2016 GOLF CLUB PARTICIPATION REPORT
Kimberley
Pilbara
Mid West
Gascoyne
Goldfields
Wheatbelt
Great Southern
South West
Peel
Metro
Western Australia6 of the 10 districts in Western Australia experienced a nett increase in member numbers, with positive results in 2016 for the Great Southern and Peel districts continuing a positive trend over the past 5-year period. Pilbara is the only other district with a nett increase in member numbers over the past 5-years. These results are depicted in Table 19.
% Change
Region 2012 2013 2014 2015 2016 1 Year 5 Year
Great Southern 1,142 1,263 1,305 1,301 1,394 7.1% 4.1%
Peel 618 681 694 717 765 6.7% 4.4%
Mid West 1,226 1,169 1,164 1,017 1,084 6.6% -2.4%
South-West 4,172 4,108 4,199 3,943 4,029 2.2% -0.7%
Gascoyne 132 129 131 130 132 1.5% 0.0%
Pilbara 402 495 486 422 423 0.2% 1.0%
Metropolitan 16,443 16,317 16,730 16,457 16,054 -2.4% -0.5%
Wheat 2,412 2,295 2,299 2,399 2,241 -6.6% -1.5%
Kimberley 434 468 448 451 410 -9.1% -1.1%
Goldfields 1,112 1,072 1,011 975 877 -10.1% -4.6%
WA Total 28,093 27,997 28,467 27,812 27,409 -1.4% -0.5%
> 5% positive movement
2% to 5% positive movement
Less than 2% movement
2% to 5% negative movement
> 5% negative movement
% Change in membership numbers from 2015 to 2016:
Table 19
05 STATE MEMBERSHIP OUTCOMES (CONT)

PAGE 26 2016 GOLF CLUB PARTICIPATION REPORT
South Australia3 of the 9 districts experienced a nett increase in membership numbers in 2016, however each of those districts have experienced a nett decline over the past 5-year period. Only the Eyre district has experienced a nett increase in member numbers over the past 5-years. These results are depicted in Table 20.
Northern
Mid North
Southern
Southern
South Eastern
Murraylands
Metro
Eyre
Yorke
Riverland
% Change
Region 2012 2013 2014 2015 2016 1 Year 5 Year
Mid North 1,598 1,423 1,404 1,384 1,421 2.7% -2.3%
South Eastern 1,738 1,758 1,667 1,630 1,650 1.2% -1.0%
Northern 1,003 994 990 952 960 0.8% -0.9%
Metropolitan 13,553 13,238 13,153 12,990 12,902 -0.7% -1.0%
Yorke 981 923 938 982 972 -1.0% -0.2%
Eyre 1,157 1,176 1,179 1,226 1,182 -3.6% 0.4%
Southern 3,599 3,408 3,534 3,607 3,449 -4.4% -0.8%
Murraylands 730 717 728 702 665 -5.3% -1.8%
Riverland 556 562 631 590 528 -10.5% -1.0%
SA Total 24,915 24,199 24,224 24,063 23,729 -1.4% -1.0%
Table 20
> 5% positive movement
2% to 5% positive movement
Less than 2% movement
2% to 5% negative movement
> 5% negative movement
% Change in membership numbers from 2015 to 2016:
05 STATE MEMBERSHIP OUTCOMES (CONT)
PAGE 27 2016 GOLF CLUB PARTICIPATION REPORT
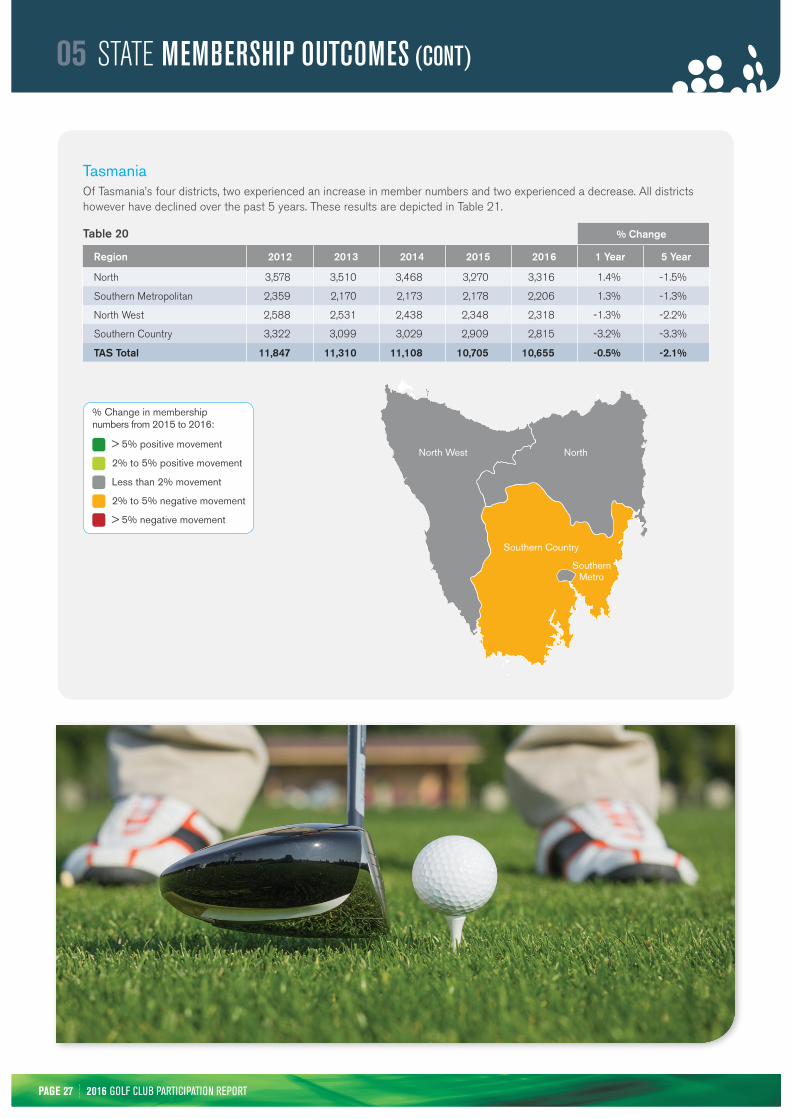
TasmaniaOf Tasmania’s four districts, two experienced an increase in member numbers and two experienced a decrease. All districts however have declined over the past 5 years. These results are depicted in Table 21.
% Change
Region 2012 2013 2014 2015 2016 1 Year 5 Year
North 3,578 3,510 3,468 3,270 3,316 1.4% -1.5%
Southern Metropolitan 2,359 2,170 2,173 2,178 2,206 1.3% -1.3%
North West 2,588 2,531 2,438 2,348 2,318 -1.3% -2.2%
Southern Country 3,322 3,099 3,029 2,909 2,815 -3.2% -3.3%
TAS Total 11,847 11,310 11,108 10,705 10,655 -0.5% -2.1%
Table 20
> 5% positive movement
2% to 5% positive movement
Less than 2% movement
2% to 5% negative movement
> 5% negative movement
% Change in membership numbers from 2015 to 2016:
North
Southern Country
North West
Southern Metro
05 STATE MEMBERSHIP OUTCOMES (CONT)
PAGE 28 2016 GOLF CLUB PARTICIPATION REPORT
CLUB COMPETITIONROUNDS06
Gender 2016 2015 % Change
Male 12,222,707 11,926,154 2.4%
Female 2,627,719 2,615,935 0.4%
Total 14,850,426 14,542,089 2.1%
% male share 82% 82%
Source: GolfLink, Golf Australia, GBAS
Region 2012 2013 2014 2015 2016% Change
1 Year 5 Year
Metropolitan 33.8 34.0 34.8 34.7 35.1 1.0% 0.7%
Regional 29.6 29.8 30.7 30.9 31.4 1.6% 1.2%
Social 27.7 29.9 31.2 32.3 30.9 -4.2% 2.2%
Overall 31.1 31.4 32.2 32.4 32.7 1.0% 1.0%
Source: GolfLink
Male and female competition rounds
in 2016 grew by 2.4% and 0.4% respectively.
We estimate that competition rounds account
for approximately 63% of total rounds played across all course-based golf clubs
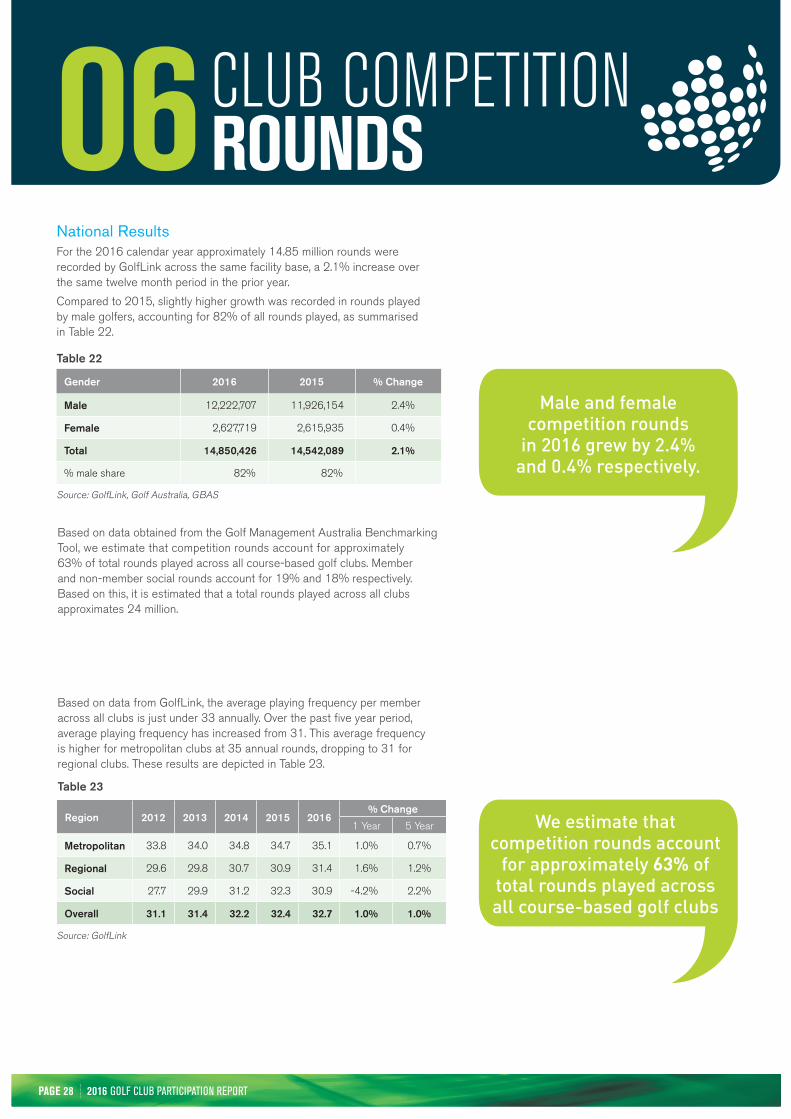
Based on data from GolfLink, the average playing frequency per member across all clubs is just under 33 annually. Over the past five year period, average playing frequency has increased from 31. This average frequency is higher for metropolitan clubs at 35 annual rounds, dropping to 31 for regional clubs. These results are depicted in Table 23.
Table 23
National ResultsFor the 2016 calendar year approximately 14.85 million rounds were recorded by GolfLink across the same facility base, a 2.1% increase over the same twelve month period in the prior year.
Compared to 2015, slightly higher growth was recorded in rounds played by male golfers, accounting for 82% of all rounds played, as summarised in Table 22.
Table 22
Based on data obtained from the Golf Management Australia Benchmarking Tool, we estimate that competition rounds account for approximately 63% of total rounds played across all course-based golf clubs. Member and non-member social rounds account for 19% and 18% respectively. Based on this, it is estimated that a total rounds played across all clubs approximates 24 million.

PAGE 29 2016 GOLF CLUB PARTICIPATION REPORT
1,400,000 35%
1,200,000 30%
1,000,000 25%
800,000 20%
600,000 15%
400,000 10%
200,000 5%
-5%
2015 2016
Jan Feb Mar Apr May Jun Jul Aug Sep Oct Nov Dec
0 0%
-10%
6%
7%
14%
-6% -6% -6%
-2%
-5%
4%
1%
12%
8%
Total % Change
Source: GolfLink, Golf Australia, GBAS
Month over month competition rounds growth was achieved in seven of the twelve monthly periods as illustrated below in Chart 6.
Chart 6
06 CLUB COMPETITION ROUNDS (CONT)

PAGE 30 2016 GOLF CLUB PARTICIPATION REPORT
Results by State/TerritoryQueensland experienced the largest increase in rounds played for the financial year, recording 5% growth over 2015, largely due to strong outcomes at the beginning and end of the year. Queensland was the only state to record growth across each quarter with all other states experiencing disruptive weather during the year.
Annual declines were recorded in South Australia and Tasmania, both materially impacted through the winter months.
Rounds played by state for each quarter of 2016 and the movement recorded over the corresponding period in 2015 are summarised in Table 24.
Table 24
2016 Jan - Mar April - June July - Sept Oct - Dec Total
NSW 1,401,627 1,354,974 1,279,326 1,440,855 5,476,782
VIC 1,103,164 989,648 864,009 998,433 3,955,254
QLD 674,511 689,026 713,224 679,133 2,755,894
WA 293,348 314,065 300,410 299,090 1,206,913
SA 282,611 265,028 234,172 260,285 1,042,096
TAS 100,282 83,739 70,951 86,814 341,786
NT 17,705 18,544 19,012 16,440 71,701
Total 3,873,248 3,715,024 3,481,104 3,781,050 14,850,426
% change over PY
NSW (0.7%) +8.8% (2.4%) +7.0% +3.0%
VIC +3.3% +0.4% (3.0%) +1.5% +0.7%
QLD +8.9% +5.0% +1.5% +6.7% +5.4%
WA (1.8%) +1.1% (1.3%) +4.6% +0.6%
SA +0.4% (2.6%) (4.3%) +1.1% (1.3%)
TAS +2.2% (0.6%) (12.7%) (9.5%) (4.9%)
NT +7.9% (2.7%) (1.8%) +12.4% +3.2%
Total +2.1% +4.0% (2.1%) +4.4% +2.1%
Source: GolfLink, Golf Australia, GBAS
06 CLUB COMPETITION ROUNDS (CONT)

PAGE 31 2016 GOLF CLUB PARTICIPATION REPORT
Results by Capital CitySlightly softer results were recorded in the metropolitan markets than those recorded nationally with the collective capital cities enjoying only 1.2% growth over 2015. Standout markets were Brisbane and Sydney, with 6.8% and 3.4% rounds growth respectively recorded for these markets.
Rounds played by the major metropolitan markets in each state for each quarter of 2016 and the movement recorded over the corresponding period in 2015 are summarised in Table 25.
Table 25
2016 Jan - Mar April - June July - Sept Oct - Dec Total
Sydney 638,867 607,056 602,994 676,746 2,525,663
Brisbane 145,656 144,216 148,759 140,726 579,357
Adelaide 185,129 164,542 146,582 172,072 668,325
Melbourne 545,806 479,610 441,108 497,115 1,963,639
Perth 186,183 188,019 180,752 190,930 745,884
Total 1,701,641 1,583,443 1,520,195 1,677,589 6,482,868
% change over PY
Sydney (0.8%) +6.8% (0.9%) +8.9% +3.4%
Brisbane +12.4% +6.0% +2.7% +6.5% +6.8%
Adelaide (0.6%) (4.0%) (4.5%) +0.1% (2.1%)
Melbourne +2.8% (1.1%) +1.2% +2.7% +1.4%
Perth (10.8%) (9.5%) (10.7%) +5.0% (6.9%)
Total +0.1% +0.9% (1.6%) +5.4% +1.2%
2016 Jan - Mar April - June July - Sept Oct - Dec Total
Total Metropolitan 1,701,641 1,583,443 1,520,195 1,677,589 6,482,868
Total Regional 2,171,607 2,131,581 1,960,909 2,103,461 8,367,558
Total 3,873,248 3,715,024 3,481,104 3,781,050 14,850,426
% change over PY
Total Metropolitan +0.1% +0.9% (1.6%) +5.4% +1.2%
Total Regional +3.7% +6.4% (2.4%) +3.7% +2.8%
Total +2.1% +4.0% (2.1%) +4.4% +2.1%
In 2016, competition rounds in metropolitan and regional areas grew by 1.2% and 2.8% respectively
+1.2% +2.8%
Source: GolfLink, Golf Australia, GBAS
metropolitan
regional06 CLUB COMPETITION ROUNDS (CONT)

PAGE 32 2016 GOLF CLUB PARTICIPATION REPORT
PROGRAM PARTICIPANTS, EVENTS, DELIVERERS & OFFICIALS07
Table 26 summarises a number of key participation areas that are measured by Golf Australia as a requirement to report to the Australian Sports Commission.
Table 26
NB: The data may include the counting of a participant each time they engage in the activity. Participants may be recorded across multiple categories. Development personnel are those employed by Golf Australia, Member Associations and Junior Foundations.
CATEGORY 2012/13 2013/14 2014/15 2015/16
Program Participants
MyGolf National Junior Program 4,846 939 3,480 6,254
Other Non-MyGolf Junior Programs 8,974 12,577 10,586 11,696
Crown Lager Social/GA Social Golf Club 2,478 2,898
Qantas Golf Club 35,486 121,080
Other Casual Golf Programs 7,550 7,027 3,268 6,595
Indigenous 2,513 1,458 1,687 1,888
Disability 1,549 2,224 2,645 5,956
Female 15,005 12,536 7,363 6,380
Seniors 13,213 14,063 4,068 3,595
New Formats 6,342 29,032
Swing Fit 430
Other programs 1,004 2,576 1,305 1,370
57,132 56,298 76,230 194,276
Event Entries (Men/Women/Mixed/Jnrs)
Member Association State & Territory Events 56,575 50,894 56,798 57,573
Junior Foundation Events 7,447 7,696 9,232 8,215
Golf Australia National Events 1,724 1,665 1,545 1,631
PGA Events 98,422 93,829 96,656 82,944
ALPG Events 791 959 952 1,123
164,959 155,043 165,183 151,486
School Delivered Programs Participants
MyGolf Schools 1 (primary) program 45,936 56,499 52,404 47,819
MyGolf Schools 1 (primary) "tasters" 47,556 36,781 26,631 28,202
AASC/Sporting Schools Golf Program 13,820 16,035 8,292 18,124
MyGolf Schools 2 (secondary) program 24,854 22,748 19,619 16,049
MyGolf Schools 2 (secondary) "tasters" 2,312 1,518 518 595
Other Non-MyGolf School Programs 5,687 7,991 7,053 7,214
140,165 141,572 114,517 118,003
School Managed Competitions Participants
SSA 12 Yrs & Under Championship 2,401 3,698 4,623 3,668
SSA 19 Yrs & Under Championship 1,014 1,639 1,503 1,724
3,415 5,337 6,126 5,392
Program Deliverers & Officials
Development Personnel 33 34 34 40
Community Golf Leaders & Coaches 1,383 1,728 1,699 1,496
AASC/Sporting Schools Golf Coaches 678 502 419 182
PGA Coaches 1,615 1,562 1,652 1,662
ALPG Coaches 57 57 72 84
Rules Officials 4,886 4,796 4,563 4,736
Course Raters 418 248 157 96
9,070 8,927 8,596 8,296
© 2017 Golf Australia - All Rights Reserved.
Level 2, 111 Coventry StSouth Melbourne
VIC 3205 AustraliaT: 03 9626 5050