Embed Size (px)
DESCRIPTION
Presentation for GoGMAT's webinar "GMAT 2012: новое поколение, новый формат, новые горизонты"
Citation preview

Апрель 2012

Olga MoskalenkoGMAT tutor,
Quantitative PartGMAT Score 710
Katerina Gridina-But
GoGMAT representative
Speakers:

Старый формат теста GMATдо 5 июня 2012
Новый формат теста GMATс 5 июня 2012
Как оценивается новый формат
Analysis of Argument (30 min)
Analysis of Argument (30 min) 0-6
Analysis of Issue (30 min)
Integrated Reasoning (30 min)
В конце апреля будут известны
деталиQuant Part (37 questions, 75 min)
Quant Part (37 questions, 75 min)
200-800Verbal Part (41 questions, 75 min)
Verbal Part (41 questions, 75 min)

На новой секции предлагаются 12 заданий на 30 минут.
Новая секция Integrated Reasoning не адаптивна
На новой секции Integrated Reasoning можно пользоваться калькулятором.
Официальный результат нового экзамена будет приходить на электронную почту в течение 20 дней.
В новой секции перейти к следующему вопросу можно только ответив на предыдущий.
Задачи Integrated Reasoning проверяют такие способности как:
Комплексный анализ информации из разных источников, таких как графики, текст, числа
Определение релевантной информации из разных источников
Структурирование информации для определения связи и для решения нескольких несвязанных задач
Комбинирование и использование информации для решения комплексных задач на основе данных из разных источников


CountryNumber of Football Players
Age greater than 30
Average Experience (in years)
England 4 2 3Brazil 5 2 4Germany 4 1 5France 6 5 5Italy 6 2 3Portugal 8 6 4Greece 5 1 3Argentina 6 2 3Statement True FalseNo more than one fourth of the XYZ players come from the same countryPortugal has the maximum ratio of players more than 30 years old to the players less than 30 years old.The total experience of all the players is highest for Portugal
The table displays the composition of the team XYZ in the Champions League. There are players from 8 countries as shown below.For each of the following statements, select true, if the statement can be proved true with the above data. Otherwise, select False.
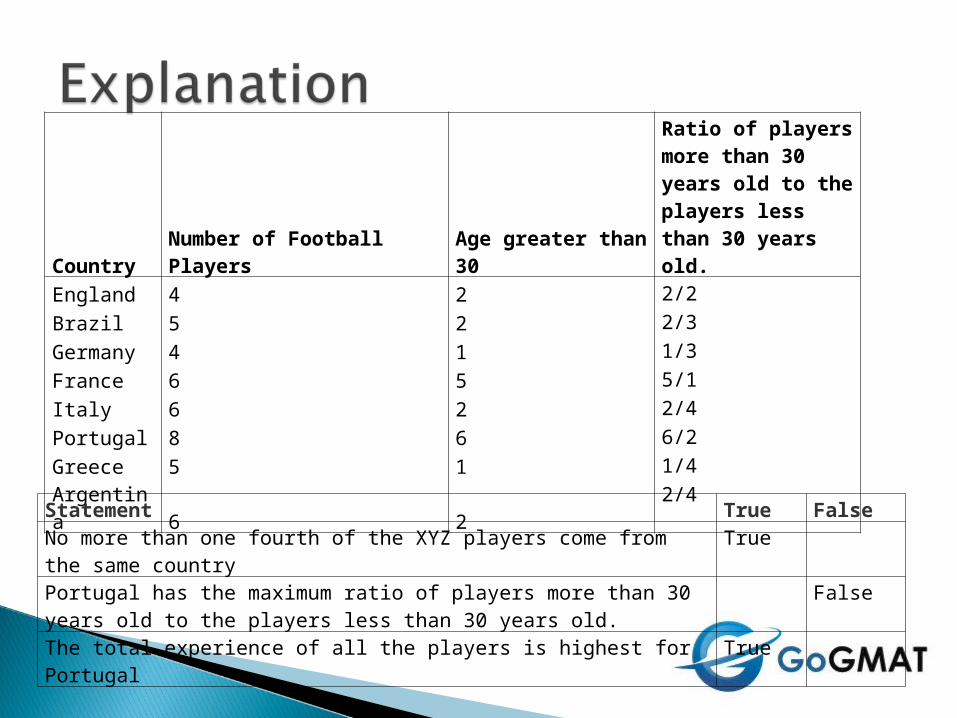
CountryNumber of Football Players
Age greater than 30
Ratio of players more than 30 years old to the players less than 30 years old.
England 4 2 2/2Brazil 5 2 2/3Germany 4 1 1/3France 6 5 5/1Italy 6 2 2/4Portugal 8 6 6/2Greece 5 1 1/4Argentina 6 2 2/4
Statement True FalseNo more than one fourth of the XYZ players come from the same country
True
Portugal has the maximum ratio of players more than 30 years old to the players less than 30 years old.
False
The total experience of all the players is highest for Portugal True
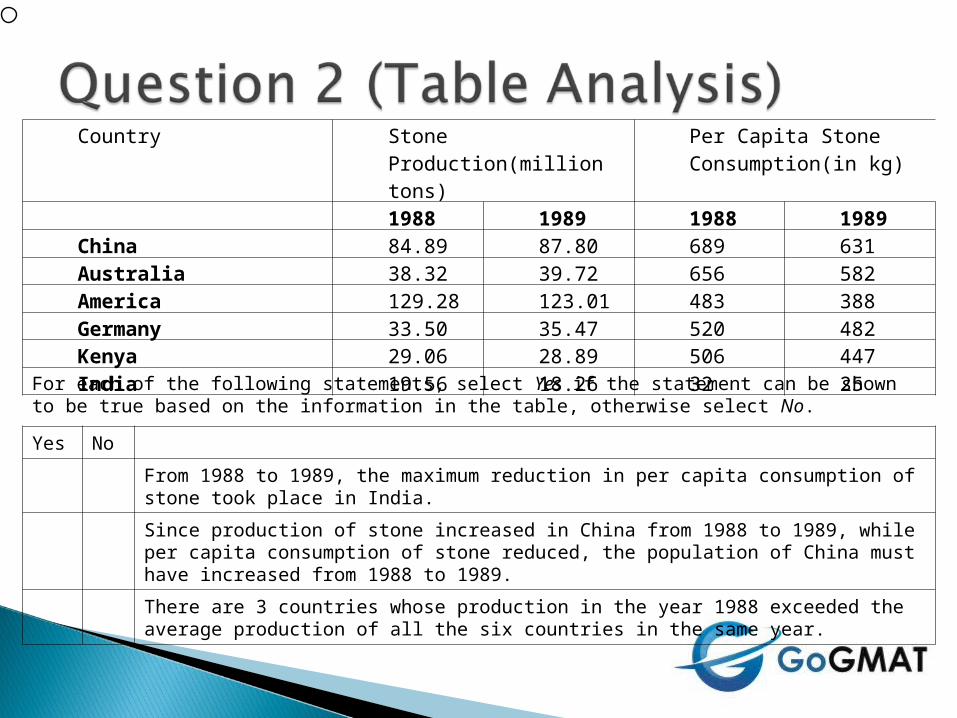
Country Stone Production(million tons)
Per Capita Stone Consumption(in kg)
1988 1989 1988 1989China 84.89 87.80 689 631Australia 38.32 39.72 656 582America 129.28 123.01 483 388Germany 33.50 35.47 520 482Kenya 29.06 28.89 506 447India 19.56 18.26 32 25
For each of the following statements, select Yes if the statement can be shown to be true based on the information in the table, otherwise select No.Yes No
From 1988 to 1989, the maximum reduction in per capita consumption of stone took place in India. Since production of stone increased in China from 1988 to 1989, while per capita consumption of stone reduced, the population of China must have increased from 1988 to 1989.There are 3 countries whose production in the year 1988 exceeded the average production of all the six countries in the same year.
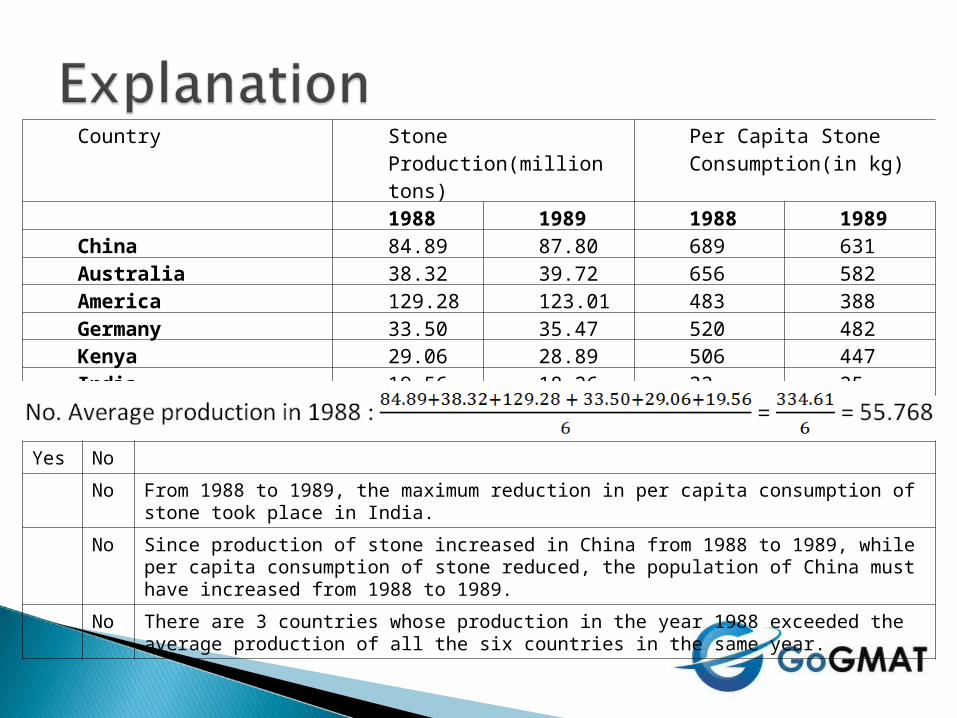
Country Stone Production(million tons)
Per Capita Stone Consumption(in kg)
1988 1989 1988 1989China 84.89 87.80 689 631Australia 38.32 39.72 656 582America 129.28 123.01 483 388Germany 33.50 35.47 520 482Kenya 29.06 28.89 506 447India 19.56 18.26 32 25
Yes NoNo From 1988 to 1989, the maximum reduction in per capita consumption of stone
took place in India. No Since production of stone increased in China from 1988 to 1989, while per capita
consumption of stone reduced, the population of China must have increased from 1988 to 1989.
No There are 3 countries whose production in the year 1988 exceeded the average production of all the six countries in the same year.

A B Number of shirts to be bought
1350900450750500250
Company A sells shirts in batches of 250 and company B in batches of 450 shirts. Company A charges 5000 dollars per batch and company B charges 8000 dollars per batch. If a customer wants to buy 1150 shirts, how many shirts should he buy from each company so that he gets the lowest price per shirt? Assume that companies sell shirts only in batches and extra shirts purchased by the customer are deemed as waste.

The price per shirt for company A = 5000 ÷ 250 = 20 dollars.
The price per shirt for company B = 8000 ÷ 450 = 17.78 dollars.
Hence, the customer should by as many shirts as possible from company B.
Company B Company A450x2=900 250

A new motorcycle produced by ABC Company has a mileage of 40 miles per liter at 40 miles per hour. The mileage drops to 30 miles per liter if the speed reaches 50 miles per hour or drops to 30 miles per hour. What are the maximum and the minimum distance the bike can travel in ten hours and with ten liters of fuel if the speed during the entire journey is constant. Assume that the bike can go only at speeds of 30, 40 and 50 miles per hour. Make only one selection in each column.
Maximum Distance Minimum Distance Distance in miles200300400500600800

Speed Distance Maximum distance that can be traveled with 10 liters
30 miles per hour 10×30 = 300 miles 10×30 = 300 miles min
40 miles per hour 10×40 = 400 miles 10×40 = 400 miles max
50 miles per hour 10×50 = 500 miles 10×30 = 300 miles

The graph below shows the actual and expected revenues for the period January to June 2011. The green color shows the actual value while the violet color shows the expected revenue. All values are in ‘000 dollars.
In which month, the difference between the actual and expected revenues is the highest?
A. January B. February C. March D. June
What is the growth of the actual revenue (in percentage) from January to June?
A. 60% B. 100% C. 86% D. 200

The actual revenue in January was 140, while it was 260 in June. Hence, the % increase was
(260-140)/140×100 = 120/140×100 = 86%
In which month, the difference between the actual and expected revenues is the highest?
A. January B. February C. March D. JuneWhat is the growth of the actual
revenue (in percentage) from January to June?
A. 60% B. 100% C. 86% D. 200

The graph shows the percent profit earned by two companies P and Q on their investments.
In which year the ratio of investment to income was greatest for company P?
Select:20082002200520072004If the income of company P in 2006 was same as the income of company Q in 2003, what would be the ratio of the investment of company P in 2006 to the investment of company Q in 2003?
Select:9:1010:913:1515:13
Let the investment of Company P in 2006 be P. So income is 1.85P
Let the investment of Company Q in 2003 be Q. So income is 1.665Q.
Incomes are equal, so 1.85P = 1.665Q.

The following are emails exchanged between a computer hardware manufacturing firm’s sales manager Justin and there marketing agent Alex.
Mail sent from Alex to Justin:
Good news! We have received the first offer for the new motherboard produced by your company. The offer is $500 a piece, and while I know this is less than your sale price, it is common for buyers to make an aggressively low bid in an effort to bring down the seller's price. Based on my experience, I think you can make a counter offer with a price of $585 per item, and still end up agreeing on a price that is no lower than 10% below your sale price. Just let me know what you would like to do.
Mail sent from Justin to Alex:
We are glad to hear that someone has shown interest in our new product! And yes, their offer is very low compared to our sale price. While we understand the nature of negotiations you described, we are reluctant to end up at a price that's too low for us. After giving it some thought, we think that making a counter offer at $590 makes sense. This will give us room for further negotiations, if the buyer makes another counter offer. Also, there are other concessions we would be willing to make besides price, if you think those can help us reach a deal. Please communicate our counter offer to the buyer, and let us know how it goes.
Mail sent from Alex to Justin:
I talked to the client, and it sounds as though they are willing to negotiate further on the price, although the buyer said that $590 is "a lot more' than they can afford. I mentioned your willingness to negotiate on items other than price, and they have expressed willingness to make this sale happen no later than mid-August so that they can get everything in place before their college reopens. I expect that, if you offer them a price of $530 and agree to make the deal happen by early August, they will accept your offer. Please let me know how you would like to proceed.
Yes NoThe company’s sale price for their motherboards is at least $620 per item.It is possible for the buyer and seller to make a deal in which neither side needs to change its opening offer by more than 15%.Alex is more likely to negotiate to get the deal fixed at a lower price than what the company is ready to accept.

The following are emails exchanged between a factory owner Munshi and his team manager Dan regarding 2 new testing procedures to be used on the factory.
Munshi: Dan, I am explaining both the techniques considering our normal lot size of 1000 pieces. Keep in mind that we would incur a cost of $25 per piece for fixing each defective piece and if a defective piece reaches our buyers, it would attract a penalty of $50 per defective piece. Test A: This test costs $2 per piece. However, the test is not perfect: It sends a certain percentage of defective pieces to the buyer as good. Test B: This test costs $3 per piece, and allows detecting all defective items.I feel that we should always prefer test A, since it is cheaper than Test B.
Dan: Munshi, we have used both tests under practical conditions and found that test A sends 20% of the defective pieces to the buyer as good. This percentage is very high due to which Test B is more economical beyond a certain level.
Munshi: I agree with your analysis, and will need more detailed analysis together with your recommendations on which test to use based on the number of defective pieces in the lot.
Answer the following question based on the information above.If Dan is told that the lot has 160 defective pieces, he should:
1) use Test A only2) use Test B only3) do no testing4) Either use Test A or do not test.


http://[email protected]
www.facebook.com/GoGMATwww.twitter.com/GoGMAT
+7 499 500 55 34+380 44 590 95 41