Embed Size (px)
Citation preview

GlobalIntelligence
04Q4 2017
Data & insights for the new age of communication

Global IntelligenceGlobal Intelligence is an essential briefing for marketers, brought to you by the world’s leading advertising expenditure forecasters. Published quarterly, Global Intelligence is a critical mix of data, insight and commentary, fuelled by Publicis Media’s proprietary tools and authored by our communications experts. Led with an overview of the latest quarterly Advertising Expenditure Forecasts, each issue provides intelligence on key areas of contemporary communication, including digital and mobile, technology and automation, innovation, performance marketing, and branded content.
2 3
04 Leader
06 Hot Spots
20 FMCG
24 Content
28 Search
30 Digital
14 Innovation
08 Q4 2017 summary
22 FMCG: Social
26 Programmatic
16 Digital Giants
10 Q4 2017 summary by medium
18 Artificial Intelligence
12 Market Focus - Russia
Adspend Forecasts
Category Insights
Digital Channels
Marketing Tech
Contents

Global Intelligence | Leader Global Intelligence | Leader
4 5
We are very happy to introduce the fourth edition of Global Intelligence.
Our regular round-up of adspend trends demonstrates how online video, social media and native advertising – all forms of digital display in a broad sense – are leading growth in global adspend. Brands are shifting their budgets into these channels because that’s where consumers are headed: faster data connections and better displays are encouraging consumers to spend more time using their mobile devices, connecting with their friends on social media and viewing videos and other content.
But television remains central to brand advertisers, delivering mass reach and strongly conveying brand values. In this issue we look in detail at FMCG, and show how television has become even more important to FMCG brands over the last few years, even during the rise of the internet.
We also look at how FMCG brands are using global and local pages to engage consumers on social media, and how FMCG companies are reacting to shareholder pressure to improve margins and stimulate growth.
This issue doesn’t just concentrate on FMCG, however. In addition to our regular articles on start-ups, digital giants and search, we look at topics that are relevant to all brands. This includes a new way of planning across the full range of consumer experience to make sense of the complex environment in which brands now operate; how to use AI to tailor and optimise content; why this will enhance, not supplant, human creativity; and the potential value of blockchain technology to the advertising industry.
We hope you enjoy your copy of Global Intelligence. Please get in touch at [email protected] if you’d like to discuss any of the topics raised within.
The enduring power of television in an online age

Adspend Forecasts | Hot Spots Adspend Forecasts | Hot Spots
The world’s advertising hot spotsAverage annual growth in adspend by regional bloc 2017-2020
0%-10% 10%
3.2%
3.0%8.9%
4.4% -2.2% 3.1%
2.1%
6.4%
North America
Canada, USA
Western & Central Europe
Austria, Belgium, Bosnia & Herzegovina, Croatia, Czech Republic, Denmark, Finland, France, Germany, Greece, Hungary, Ireland, Italy, Netherlands, Norway, Poland, Portugal, Romania, Serbia, Slovakia, Slovenia, Spain, Sweden, Switzerland, UK
Eastern Europe& Central Asia
Armenia, Azerbaijan, Belarus, Bulgaria, Estonia, Georgia, Kazakhstan, Latvia, Lithuania, Moldova, Russia, Turkey, Ukraine, Uzbekistan
Latin America
Argentina, Brazil, Chile, Colombia, Costa Rica, Ecuador, El Salvador, Mexico, Panama, Peru, Puerto Rico, Uruguay, Venezuela
Middle East & North Africa
Bahrain, Egypt, Israel, Kuwait, Oman, Qatar, Saudi Arabia, UAE
Advanced Asia
Australia, Hong Kong, New Zealand, Singapore, South Korea
Japan
Fast-track Asia
China, India, Indonesia, Malaysia, Pakistan, Philippines, Taiwan, Thailand, Vietnam
6 7

8
Adspend Forecasts | Q4 2017 summary
Global ad market maintains steady pace of growth
We forecast that global advertising expenditure will grow 4.0% to US$558bn by the end of 2017. This is in line with the steady 4%-5% growth in adspend we have seen since 2011. However, our forecast is down fractionally from the 4.2% growth that we predicted in June. The stronger eurozone economy has yet to feed through to advertising, and we have downgraded our forecasts for seven eurozone markets since then. Mexico’s television market has been disappointingly weak; the extended period of mourning for King Bhumibol Adulyadej has led to a second year of decline for Thailand; and Malaysia’s recovery from the downturn of 2016 has been less rapid than we hoped. These disappointments have been partially offset by the boost provided by Canada’s healthy economy to its ad market, and Russia’s return to full growth after the oil-price crash and imposition of trading sanctions – see our market focus on Russia on pages 12 and 13 for details.
Next year we forecast 4.2% growth in global adspend, boosted by the Winter Olympics in Korea, the football World Cup in Russia, and the mid-term elections in the US.
The US will be the leading contributor of new ad dollars to the global market over the next three years, making up in scale what it lacks in speed. China will come second, combining large scale and rapid growth (though its growth is slowing as its scale increases).
Between 2016 and 2019 we forecast global advertising expenditure to increase by US$69 billion in total. The US will contribute 29% of this extra ad expenditure and China will contribute 22%, followed by Indonesia, which will contribute 5%, and India, the Philippines and Japan, which will each contribute 4%.
The global ad market is growing steadily, and despite disappointing performances in a few markets it is adding more than US$20bn a year. Half of this growth is coming from just two markets, the US and China.
Five of the ten largest contributors will be what we term Rising Markets – i.e. outside North America, Western Europe and Japan. Between them, these five markets (China, Indonesia, India, the Philippines and Russia) will contribute 37% of new adspend over the next three years. We forecast all Rising Markets together to contribute 55% of additional ad expenditure between 2016 and 2019, and to increase their share of the global market from 37% to 39%.
The US and China will contribute the most new ad dollars to 2019
‘Rising Markets’ are gaining ground
2017
2018
2019
Source: Zenith/IMF
GDP
Adspend
Growth of advertising expenditure and GDP 2017-2019 (%)
+ 5.8
+ 4.0
+ 4.2
+ 4.2
+ 5.6
+ 5.5
Adspend Forecasts | Q4 2017 summary
Ten fastest growing markets
14,209
19,705
The ten biggest ad markets
Ad expenditure (US$m)
2017 2020
1USA USA197,474 217,179
2China China80,520 94,728
3Japan Japan42,972 45,691
4UK UK24,353 27,108
5Germany Germany22,192 23,609
6Brazil Brazil13,243 15,185
7Australia Australia11,627 12,949
8France France11,604 12,663
9South Korea South Korea11,551 12,394
10Canada Indonesia9,653 11,776
Growth in ad dollars
(US$m 2016-2019)
Source: Zenith/IMF
‹
‹
‹
‹
‹
‹
‹
‹
‹
‹
China
USA
9
1,322Australia
1,418Germany
1,664Russia
1,942Brazil
2,720Japan
2,755UK
2,951India
3,014Indonesia

10 11
Adspend Forecasts | Q4 2017 summary by medium
Innovative digital formats to drive global ad growth to 2020Digital platforms are continually introducing new formats, and retiring old ones, in their pursuit of maximum effectiveness (and revenue). This innovation is the driving force behind the current growth in global adspend.
Paid search and classified are still growing, but are lagging behind
Television and online video consolidate their lead in brand advertising
Social media in-feed ads, online video and other digital formats such as paid content and native advertising are leading the growth in global advertising. Between 2017 and 2020 they will drive 12% annual growth in total display advertising – a category that includes these formats as well as traditional banners. Total display expenditure will rise from US$97bn to US$137bn over this period, accounting for 56% of all the growth in global ad expenditure. By 2029 total display will account for 50.8% of internet advertising expenditure, exceeding 50% for the first time.
Most of this growth is coming from social media (which will grow at 16% a year) and online video (which will grow at 17% a year). Social media is central to many of its users’ digital lives – it’s where they plan their social life, read their news and document their activities – and brands can use it to communicate with them very effectively. And online video is much better at conveying brand values than traditional display formats like banners. These are no longer mutually exclusive categories; indeed video advertising is now central to the growth strategies of most social media platforms.
We distinguish between television and online video advertising because they are distributed differently, generally sold differently and categorised differently by third-party agencies that monitor advertising expenditure. But for many consumers they are beginning to blur together as smart TVs and other devices deliver internet content to households’ main TV sets. Advertisers are also finding that it makes less and less sense to plan television and online video separately: they work best as complements rather than substitutes. Television supplies reach, while online video offers targeting and personalisation. Together they are becoming more important than ever to advertisers seeking to build brands. Stripping out classified and search – which are essentially direct-response channels – we estimate that television and online video accounted for 48.7% of display advertising in 2017, up from 43.7% in 2010, and expect its share to rise to 49.0% in 2020.
Paid search was the largest internet advertising channel until 2015, when it was overtaken by display. Much of its recent growth has come from innovations in mobile and location-based search, and future growth will come from adapting search ads to voice-activated personal assistants like Siri and Alexa. Expenditure on paid search totalled US$88bn in 2017, and we forecast 8% annual growth to 2020, when it will reach US$111bn. Growth in paid search will therefore lag behind growth in total internet advertising, which will grow at 12% a year.
Classified advertising – advertising on dedicated web pages without editorial content, often for cars, house and jobs – was an important part of the early internet, but its share of total internet expenditure has been shrinking for many years as users have turned to free listings, auction sites and other substitutes. In 2017, we estimate advertisers spent US$18bn on internet classifieds, and we expect this total to rise by just 7% a year to US$22bn in 2019.
Adspend Forecasts | Q4 2017 summary by medium
Average annual growth rate by medium 2017-2020 (%)
Share of global adspend by medium (%)
2020
TelevisionTelevision
34.431.4
Internet display Internet display
17.9 22.5
Paid search
Paid search
16.2
18.2
Newspapers
Newspapers
9.7
7.5
MagazinesMagazines
5.23.9
Outdoor Outdoor
6.7 6.4
Radio Radio
6.2 5.7
Cinema Cinema
0.7 0.9
2017
Internet classified
Internet classified
3.2
3.5
Online video*
Paid search
Newspapers
Cinema
Television
Internet classified
Magazines
Internet display
Radio
Outdoor
* included in internet display
13.8
2.6
8.6
0.9
-5.7
16.9
7.1
12.2
0.9
-4.5

13
Adspend in RussiaRussia’s advertising market is underdeveloped by international standards, accounting for 0.4% of GDP compared to the global average of 0.7%. It is also particularly volatile, with rapidly shifting annual growth rates interspersed by the occasional steep decline. Russian advertising is now in recovery mode after its most-recent downturn, and is currently enjoying rapid growth.
Russia’s ad market recovered quickly from the global financial crisis and grew at double-digit annual rates for the first few years of this decade. In 2014, though, Russia’s economy began to suffer from sanctions imposed by the US and the EU in the aftermath of the conflict in Ukraine, the sanctions it imposed in response, and a withdrawal of international investment. These shocks were exacerbated by a sharp drop in the price of oil – which accounted for 70% of Russia’s exports – and devaluation of the Russian rouble. The economy fell into recession, and the ad market went sharply into reverse, shrinking by 8.8% in 2015.
Since then the economy has slowly recovered, coming out of recession during 2016. The ad market, though, bounced back very quickly in 2016, growing with a strength that consistently exceeds our expectations and ending the year up 9.8%. We expect it to do even better this year as the economic recovery gathers steam. Oil prices are still low, but stable, which has led to some strengthening of the rouble. This, together with low consumer price inflation, has helped
disposable incomes improve, leading to more competition among advertisers to capture their share of higher consumption. We estimate that adspend across all media will be up 12.9% in 2017, and forecast 11.7% growth for 2018.
Internet advertising is growing much faster than the total market, and so is taking share from most other media, particularly print and radio. We estimate it accounted for 35.8% of total adspend in 2017, and expect it to account for 40.0% by 2020.
Social platforms are increasing their shares of internet ad budgets. VK and Odnoklassniki (owned by Mail Group) hold leading positions and are developing new data-led services to increase the efficiency of social advertising. Influence marketing doubled in 2016, reaching about one billion roubles in value. This represents less than 1% of overall internet advertising, but it is expected to grow at least another 60% in 2017.
TV sales have been consolidated into a single sales point, the National Advertising Alliance. The mega-seller announced a 15% price increase for TV ads in 2017, and will probably meet its target. It targets 15% - 25% inflation in 2018, driven by the presidential elections in March and the FIFA World Cup 2018, which will take place in Russia in June and July. The Winter Olympics would normally provide a boost to viewing as well, but we will have to see what effect Russia’s lack of official representation will have.
Adspend Forecasts | Market Focus – Russia
12
Adspend Forecasts | Market Focus – Russia
Adspend in Russia Year-on-year change at current prices (%)
Share of adspend by medium (%)
2017
Total US$5.6bn
Total US$7.3bn
2020
2015 v 2014
2016 v 2015 2017 v 2016 2018 v 2017 2019 v 2018 2020 v 2019
9.8
12.911.7
9.1
6.5
-8.8
TV
45.1
TV
43.7
Internet
35.8
Internet
40.0
Newspapers
1.3
Newspapers
0.9
Outdoor/ transport
9.7
Outdoor/ transport
9.1Magazines
2.8
Magazines
2.1
Cinema
1.2
Cinema
1.0
Radio
4.2
Radio
3.2

14 15
Marketing Tech | Innovation
Start-up watchIn this edition of start-up watch, we focus on four e-commerce businesses helping big brands to experiment with entirely new ways to sell online.
With such a focus placed on ‘brand storytelling’ it‘s easy to forget that no single medium can
match a real product for persuasiveness - yet in this digital age, what options exist for putting product in hand (aside from hiring an experiential agency)? Enter SoPost, whose digital-first approach to targeted product sampling offers end-to-end fulfilment of sampling campaigns using the latest in addressable media, with inbuilt social referral features, and a feedback loop for post-usage research, all at a guaranteed cost per sample.
Duel
SoPost
Brands that use poor-quality product shots that fail to show items in context tend to have low conversion
rates for e-commerce. Duel’s AI-assisted ‘user generated content management system’ helps brands to capture and collate high-quality photographic submissions from real customers. In this way, brands can build a shoppable archive of UGC: an inspiring and informative way to acquire new shoppers and focus them on making a purchase.
Formisimo + NUDGR
On average 67% of people who start typing in an online checkout don’t complete the process.
Formisimo’s advanced platform for form analytics provides unparalleled insight into underlying usability and conversion problems with online forms and checkouts, and gives clear recommendations for improvements. Their newest product uses deep learning to predict basket abandonment, and triggers relevant counter-offers directly on the page.
GoInStore
Online retail is fantastic for seeking out that perfect purchase, but nothing beats a real-life encounter
in a physical retail environment, especially for high-consideration items (think automotive or white goods). This start-up offer a first-person shopping experience for online customers, delivered using mobile technology to stream live via webcam from the view point of an in-store sales person directly to a website visitor.
Marketing Tech | Innovation
Making sense of brand fragmentationThe relationships that brands have with consumers are now more complex and fragmented than ever before. Brands can turn this complexity into advantage by consumer experience planning at the heart of communications strategy.
In recent years, the number of ways in which brands and consumers can interact has multiplied and become ever more complex. New technology allows brands to target their communications to individuals, and personalise them, leading to fragmented brand messaging. Brands and agencies using traditional planning methods are finding it difficult to cope.
Zenith has been working away to transform strategic planning for our clients to focus on the consumer journey and consumer experience. The consumer journey is an overview of consumers’ behaviour as they interact actively or passively with a category over time. This is made up of countless journeys by individuals, which can be followed and understood in much more detail. A simple individual journey might involve, for example, hearing about a brand from a friend, conducting a search for it online, and visiting its website. Consumer experience means a complete overview of all possibilities for brand value to be created over time on this journey.
In building our model, we took inspiration from a narrower definition of UX (user experience), and applied its principles to all potential points
GoInStore gives online customers a first-person shopping experience
of engagement between users and brands over time. The crucial step in this process has been to move to a model in which a category is in perpetual motion. Rather than a consumer journey being a line to a single defined event, we have framed consumer experience as a series of loops of behaviour that have no end – unless people leave the category.
Creating this model has involved codifying different sources of data and signals to create a clear view of each stage of the consumer journey. This solves one of the biggest problems that brand teams face, not knowing what they know.
Putting together a strategy using consumer experience planning powered by consistent data allows us to combine short-term and long-term thinking, triggering particular consumer actions as well as cultivating a brand’s health over time. It means focusing on the most effective points of contact between brands and consumers, while pinpointing those that work best together to deliver results that are greater than the sum of their parts. Consumer experience planning turns complexity into brand advantage.

Marketing Tech | Digital Giants Marketing Tech | Digital Giants
Digital GiantsOur round-up of the latest results from the digital media giants that are transforming global media and communication
Q4 2017
ad revenues year on year
Global reach (all internet users)
of ad revenues from mobile
Market cap
Facebook now has 1.4 billion daily users, almost all of whom access it using mobile devices for some or all of the time. It has 2.1 billion monthly users around the world.
Facebook has been developing its Dynamic Ads service, which decides which ads to serve to consumers based on their previous actions, both on and off Facebook. Brands can decide to target consumers who have viewed but not bought products on their own websites, for example. It has also introduced ‘value optimisation’ – which targets consumers based on Facebook’s assessment of their likelihood to purchase a product based on previous purchases – and value-based Lookalike Audiences, which uses information about a brand’s most valuable current customers to target people with similar characteristics.
+49%
60.4%
88%
US$533bn
paid clicks year on year
Global reach (all internet users)
Global reach (all internet users)
cost per click year on year
Market cap
Market cap
Mobile search and YouTube continue to fuel most of the growth in Google’s revenues (as reported by Google’s holding company, Alphabet). YouTube now has 1.5 billion viewers per month. It is investing in more original content, and YouTube TV, its live TV subscription package, is rolling out across more cities in the US and is now available to two-thirds of US households. YouTube is encouraging brands to use 6-second bumper ads, which it says are the ideal length to capture attention.
Google has recently launched a free Google Attribution tool, which measures the relative impact of ads across channels and devices. It has also ramped up its Store Visits programme, which links exposure to online ads to behaviour in bricks-and-mortar shops. So far this programme has monitored more than 5 billion individual store visits in 17 countries.
+47%
80.4% 32.7%
-18%
US$737bn US$16bn
media and tech brands
audience
Oath is the media subsidiary of Verizon, which bought Yahoo in June and merged it with AOL, which Verizon already owned, under the new name Oath. Oath now consists of more than 50 online media and tech brands, including Yahoo, Flickr, Tumblr, AOL.com, The Huffington Post, TechCrunch and Engadget. Verizon began integrating the businesses as soon as the acquisition was complete, and expected to make substantial cost savings over the next few years.
Verizon has not yet released much detail about Oath’s financial performance, though it has said that it generated US$2bn in revenue in Q3 2017. Oath is dwarfed by the rest of Verizon’s businesses, which generated a total of US$32bn in the same quarter, mostly from US telecoms.
50+ 1bnad revenues year on year
Global reach (all internet users)
Yahoo AOL
active daily users year on year
Twitter now has 330 million monthly users, up 4% year on year. The number of daily active users increased by 14% year on year, so existing users are accessing Twitter more frequently. But the slow and sporadic growth in monthly users, the lack of disclosure of the absolute number of its daily users, and the continued year-on-year decline in ad revenues have reignited analysts’ concerns about Twitter’s potential for sustainable growth.
Twitter’s video ad revenues have been growing rapidly, boosted by its live video events and in-stream insertions, but have been offset by declines in its Promoted Tweet and direct-response ads, leading to a net 8% year-on-year decline in ad revenues in Q3.
-8%
48.5%
+14%
10.6%
16 17

Marketing Tech | Artificial Intelligence
Machines get creativeThe use of AI techniques is now a reality in the media industry, and will soon become a necessity. Here we look at how AI can be used to tailor content, products and services to the benefit of both brands and consumers.
Marketing Tech | Artificial Intelligence
18 19
The number of customer touchpoints and the variety of signals that influence a purchase decision require AI techniques – and particularly machine learning – to understand and optimise. The customer journey will soon encompass virtual-reality purchasing, dynamic pricing, automated voice recognition and digital attribution, managed within a single system and eventually through a natural-language interface.
The optimisation of content using AI applications represents a significant opportunity for marketers. This starts by using image-recognition APIs to understand what components exist in a piece of content, including photographs, video and sound. Faces are particularly useful components to analyse: facial-recognition technology can now quantify the emotional state of each individual in a piece of content. This allows us to classify and segment each piece of content in real time, and in the case of video, frame by frame.
Once we have quantified our content, we can feed this data back into the creative production process and optimise it. This means automatically varying the images, backgrounds and soundtracks of our content so that it achieves its campaign goals more effectively, and ultimately maximises content ROI.
Beyond the optimisation of individual pieces of content, the real opportunity lies in linking together all the content features – each generated by these AI techniques – across a user journey. We can then use machine-learning techniques to ensure that the right content appears at each stage of the journey, and that each piece of content is as effective as possible at producing the desired consumer response at that stage.
These techniques promise to revolutionise e-commerce. Machine-learned recommendation engines will be able to tailor the products and services on offer to individual users, based on each individual’s user journey, and the content that they have responded to the best. These recommendation engines will even be able to adapt their own look and feel, and the way users navigate between their pages, according to individual users’ actions and responses.
This will be particularly important for brands whose consumers face a wide and potentially confusing number of product choices, product variations, or variations in product features. Machine-learning and image-recognition techniques that control and optimise consumer choice have already been used to increase product purchase by up to 15%. As the initial experience becomes more streamlined and efficient, these techniques will be used more frequently to improve customer loyalty and repurchase. The objective is not to replace the creative development or production process, but to use AI to generate data that allows us to better serve a given consumer, and to ensure that their experience improves steadily over time.

Category Insights | FMCG
FMCG (fast-moving consumer goods, or consumer packaged goods) is one of the most important categories for the advertising industry. The world’s three largest advertisers are all FMCG companies, and the sector accounts for about a fifth of total global ad expenditure. The category sells about US$10 trillion worth of goods to consumers across the globe. Branding is vital for FMCG products: competition is intense
between products that are often easily substitutable, and margins are tight so there’s little scope for profitable growth through price promotions. Instead, top-line growth comes from brand-building. Consumers purchase frequently and with relatively little consideration: brands that are familiar, distinctive and easy to buy do best. The goal for FMCG brands is to make choosing them a regular habit. Brands have traditionally gone about this by running long-term ad campaigns in high-impact, mass-reach media, typically television. But as consumers have spent more and more time using the internet, FMCG brands have rapidly shifted their communications online.
We use our Touchpoints ROI Tracker tool to monitor trends in brand communication over the full range of paid, owned and earned touchpoints. One of its outputs is brand experience, which measures the reported importance of each touchpoint in shaping consumer attitudes and influencing consumer behaviour. It tells us that, after a slow start, nearly a quarter of all FMCG brand experience now comes from online touchpoints.
In focus: FMCG
Category Insights | FMCG
20 21
Marketing imperatives
• FMCG advertisers should take care to invest in the quality of their owned digital properties, which are nearly as influential as TV ads, and build partnerships to increase their visibility on retailer websites, where their brands are more likely to grab consumers’ attention.
• Brands should strengthen their presence on TV, which has become even more important for FMCG in the last ten years, as well as taking advantage of new online opportunities.
they are through online touchpoints, as shown below. Television still creates 86% more brand association than the closest online touchpoint, despite the steady rise of brand association from online touchpoints over the last ten years. While brand websites have the highest influence of these online touchpoints, consumers are more likely to recall seeing brands on retail websites and internet search, so these are vital too.
Despite the rise of online media, television is more important than ever for its ability to reach FMCG consumers, create lasting brand experiences, and change consumer behaviour. FMCG brands should certainly increase their online presence where online touchpoints are most influential and create the most brand association, but should not do so at the expense of their television advertising budgets.
Touchpoint ROI Tracker also measures average influence, which is a measure of how much each touchpoint is likely to influence consumer behaviour each time a consumer encounters it. The average influence of online touchpoints has certainly grown a lot over the past ten years, as the following chart shows. The influence of each of these touchpoints has grown by between 15% and 59% since 2006-07, and some of them are now approaching the level of influence per contact that television has. Brand websites in particular have become vital communications assets for FMCG brands. Meanwhile, television has lost none of its influence over the last decade – indeed its average influence has increased by 5%.
Consumers are also much more likely to view and remember brand communications on television than
Average influence per exposure for FMCG brands
Average brand association for FMCG
Source: Touchpoints ROI Tracker Global NormsThe following Touchpoints ROI Tracker categories are included: alcoholic drinks, baby care, beauty, confectionery, food, non-alcoholic drinks, pet care
Brand website
Retail website
Blogger review/recommendation
Social network page/app
Internet video ad
Consumer opinion site/blog
TV ads
TV ads
80
70
60
50
40
30
25
20
15
10
5
0
20
Retail website
Brand website
Social network page/app
Internet video ad
Consumer opinion site/blog
Internet search
Internet search
Internet display ad
Internet display ad
Blogger review/recommendation
Mobile ad/promotion
Mobile ad/promotion
2006-07
2006-07
2008-09
2008-09
2010-11
2010-11
2012-13
2012-13
2014-15
2014-15
2016-17
2016-17
Based on consumer research, Touchpoints ROI Tracker is Publicis Media’s brand contact measurement and planning tool. Since 2004 a total of 1,090 Touchpoints projects have been completed across 66 countries, comprising 963,909 consumer
interviews that provide contact point metrics for 14,476 brands in 325 product and service categories. The data for all projects are stored in a single internet-accessible database. This database provides normative and trend data for 265 touchpoints.
All rights to the MCA® measurement system including CCF™, BEP™ and BES™ are owned by Integration (Marketing and Communications) Limited and licensed to Publicis Media Limited and its affiliates.
Online touchpoints’ share of FMCG Brand Experience (%)
Source: Touchpoints ROI Tracker Global Norms
The following Touchpoints ROI Tracker categories are included: alcoholic drinks, baby care,
beauty, confectionery, food, non-alcoholic drinks, pet care
23.3
19.7
12.8
9.1
4.93.4
2006-07 2010-11 2014-152008-09 2012-13 2016-17

22 23
In focus: FMCG
FMCG brands use social media in many ways: to repurpose existing brand communications at no media cost, create new brand messages for receptive audiences, publicise promotions, offer customer service, and so on. As the previous article shows, social media now has considerable influence on consumers’ behaviour when they encounter
Simply acquiring a fan or follower is just the first step of brand communication on social media – there’s no guarantee the follower will pay any attention. Most platforms filter the posts visible to users, based on an assessment of how interesting they are likely to find them. One of the factors that feed into this assessment is how often a user has interacted with the account – liked, retweeted or commented on a post, for example. A high engagement rate, which is the likelihood that an individual user will interact with a single post, is at once evidence that users are paying attention to an account, and a cause of future interactions.
The following chart looks at the differences in the number of followers and engagement rates for global and local accounts on three social media platforms: Facebook, Twitter and Instagram. Unsurprisingly, on all three platforms the local accounts have substantially fewer followers than the global accounts – between 70% fewer for Facebook and 77% fewer for Instagram. But on both Facebook and Instagram, users are more likely to engage with brands on local accounts than global accounts – in the case of Facebook, more than twice as likely. On Twitter, users are 31% more likely to engage with global accounts than local accounts. It’s also worth noting than engagement rates for both global and local accounts are considerably higher on Instagram than on the other two platforms.
Marketing imperatives
• To maximise engagement, focus more on local accounts on Facebook and Instagram than on global accounts, and do the opposite for Twitter.
• There is currently less competition for user attention on Instagram, so investment in an Instagram strategy has potential for higher returns.
FMCG brands on Twitter
FMCG brands while using it.
It is a common strategy for FMCG brands to run a central social media account with a global reach alongside local accounts for individual countries. The global account normally has more followers than the local accounts – though that’s by no means always the case – but the local pages extend the brand’s total reach by offering tailored content in the local language.
This is illustrated in the chart below, which shows the number of Twitter followers for four FMCG brands, chosen purely for illustrative purposes. Similar patterns occur for other brands and on other social media sites. Both the global and local accounts sense valuable purposes for brands, but where should brands concentrate the bulk of their investment? It turns out that the answer depends on the platform used.
No.
of f
ollo
wer
s (0
00s)
No. o
f follo
wers/co
untry (000s)
Coca-Cola NescafeHeineken Red Bull
Source: Socialtools September 2017
No. international followers (000s) No. local followers (000s) Average local followers/country (000s)
4,500
4,000
3,500
3,000
2,500
2,000
1,500
1,000
500
0
3,386
3,933
149
531
69
694
2,162
1,167
No.
of f
ans/
follo
wer
s (0
00s) A
verage engagement (%
)
Reach and engagement of global and local social media accounts
3.0
2.5
2.0
1.5
1.0
0.5
0.0
800
700
600
500
400
300
200
100
0
Facebook Twitter Instagram
747
222
31
427
99117
140
120
100
80
60
40
20
0
Source: Socialtools September 2017
Average no. fans/followers (000s), global Average no. fans/followers (000s), local Average engagement global Average engagement local
Category Insights | Social Category Insights | Social

Digital Channels | Content
When content marketing turns smart: how data can help creativity
Digital Channels | Content
Marketing automation has given our industry a new way to use insights to continually personalise content, making it more relevant and timely for people as they move along the consumer journey. Here are just a few tips for marketers hoping to enhance their content marketing efforts in a data-driven world.
Dynamic creativity still requires a human touch
Balancing inspiration and the desire for growth
While dynamic creative is powered by data, technology – and in future machine learning – it still requires a human touch to execute effectively. New technology speeds up the processing of audience data to capture insights, in turn allowing brands to design more relevant messages and communicate them at the right time and place of the consumer journey. But this data needs human strategic analysis and an always-on vision – a team that understands the dynamic consumer landscape as well as marketing of a brand.
Get to know your audience
Dynamic creative is a great way to link passions, emotions, attitudes and ideas to data so that we can better connect with audiences. The beauty of this model is that we can tailor it across the customer journey, by audience, so that we build the most immersive and engaging content wherever possible. For example, beauty and CPG brands can easily provide greater value exchange by targeting relevant users with immersive content and how-to guides. For beauty brands, we have seen substantial increases in engagement, sales and efficiency from data-driven content with sequential story telling across the customer journey – from how-to applications to purchase.
Authentic content will always be desirable to consumers. When a brand has important goals for growth in mind (such as increasing sales), it’s important to remain true to a broader brand purpose. REI, for example, inspires audiences to ‘opt outside’ and experience the outdoors with engaging and immersive films that enrich their lives.
When the brand message is amplified with relevant content through the different stages of the customer journey that is socially and programmatically delivered, sales and brand growth will follow.
The future is bright for content, and marketing automation will only make our connections smarter and more strategic. Artificial intelligence will be a huge game changer, delivering algorithms that allow marketers to proactively learn from data patterns and optimise in real-time. It will not replace creativity but instead augment it, helping teams to uncover insights faster and more accurately, then act and implement these insights immediately. It’s better to think of AI as IA (Intelligent Assistance).
Regardless of where you are in your content capabilities, it’s important to act today and follow the consumer journey. Activate your data strategy so you can better understand your consumer, and build content experiences that remain continually relevant.
Furthermore, while data and tech can drive insight, speed and agility, what matters most at the end of the day is content. If the content isn’t engaging, then it doesn’t matter how it is served.
24 25
Mobilise your organisation for success
In this increasingly complex environment, it’s important to create the right organisation to deliver compelling content. This requires assembling the right talent – involving data scientists and technologists – and integrating them with strategy, media and content/creative teams to make this a seamless experience for advertisers. Organisational models should allow for speed and agility to take advantage of moments and the small window of relevancy they present to truly capture an audience. The pace of digital innovation tempts us to rush head-first into using every shiny, new product we come across. However, it is our responsibility as content experts to make sure that we take our time to develop the right opportunities, which are truly consumer-centric and creative, to build relevant and immersive experiences.

Digital Channels | Programmatic: Blockchain Technology
Can the blockchain rebuild trust in advertising?
Digital Channels | Programmatic: Blockchain Technology
26 27
The blockchain is poised to be one of the most disruptive of recent technologies, for businesses and for society as a whole. Blockchain technology solves a very simple problem in the way we transact, the problem of trust. To build trust in transactions, we rely on the quality of information usually hosted in a ledger. Think of buying a home: you rely on a series of documents confirming the quality of the home you are buying, and that the seller truly has the right to sell it. This information sits in a ledger and the reality is that this ledger is not tamper proof. There are ways to alter the ledger and create fake information, leading to distrust in the sales process. To solve this trust issue, institutions from banks to public organisations currently use intermediaries. But the value of these intermediaries is being called into question.
The blockchain is basically an incorruptible distributed ledger of data, which can be used to store informational assets and performs services from managing cryptographic contracts to transferring value. Communities can use blockchain technology to build specific services that do not need intermediaries.
Blockchain technology is currently most prominent in the financial sector, where it has given rise to new cryptocurrencies such as Bitcoin or Ethereum.
In the advertising industry, we have seen trust gradually being eroded between advertisers and publishers by a range of factors linked to the quality of paid digital media, especially viewability, brand safety and fraud. This has been compounded further by a general lack of transparency in the overall media supply chain, especially in programmatic trading.
In theory, blockchain technology provides the framework to make programmatic buying more transparent. We can imagine an open ledger of all programmatic transactions that allows large amounts of information (i.e. blocks) to be added without compromising security. Since the information is encrypted, nobody can alter the chain, so any non-brand-safe or fraudulent activity can be indentified and dealt with. The blockchain can ensure that only fair charges are being made, because buyers and sellers can see exactly what is happening in the media buying and selling process, and hidden costs would be made transparent.
What is blockchain technology?
The blockchain and the advertising industry
Blockchain technology is already being used to develop experimental solutions to problems in the media industry, from valuing user attention to making the programmatic supply chain more transparent and controlling fraud.
Brendan Eich – the creator of JavaScript and Netscape and co-founder of Firefox – has created a new technology built on blockchain called Brave. Brave is a new browser and a system for properly valuing user attention, called the Basic Attention Token. Its aim is to build a decentralised ad exchange using the Basic Attention Token as currency. Publishers will collect these tokens as ads are seen, according to viewability standards that are defined in the Brave browser with powerful user analytics. Users could also receive tokens for their attention if they choose to receive ads, which could in turn be donated to the publishers of their choice. The success of this initiative will depend on its ability to build a critical mass of users.
Dennis Publishing is using blockchain technology to improve programmatic transparency.
It is leading a project to create a prototype supply-side platform that roots out any potential fee-skimming within digital ad transactions so publishers and buyers can see exactly where the money is going. The scheme includes other publishers including the Guardian, the Financial Times, CNN International, Reuters and Mansueto.
MetaX and the Data & Marketing Association have launched adChain, an open protocol on the Ethereum blockchain that tags a piece of creative and follows it on the internet to make sure someone sees it, determining who that was as well as what actions they took afterward. AdChain lets different parties in the industry – from marketer to agency to publisher – work together without dependency.
While blockchain technology is showing tremendous potential to transform many areas of advertising, it’s still in its early days and its scale is limited. For example, an Ethereum-based blockchain processes just 20 transactions per second — many orders of magnitude too small for the programmatic market. Industry specialists believe we are five years away from fully operational blockchain technology in the ad industry.
The blockchain is already here
Current limitations of the blockchain
Digital Channels | Search Digital Channels | Search
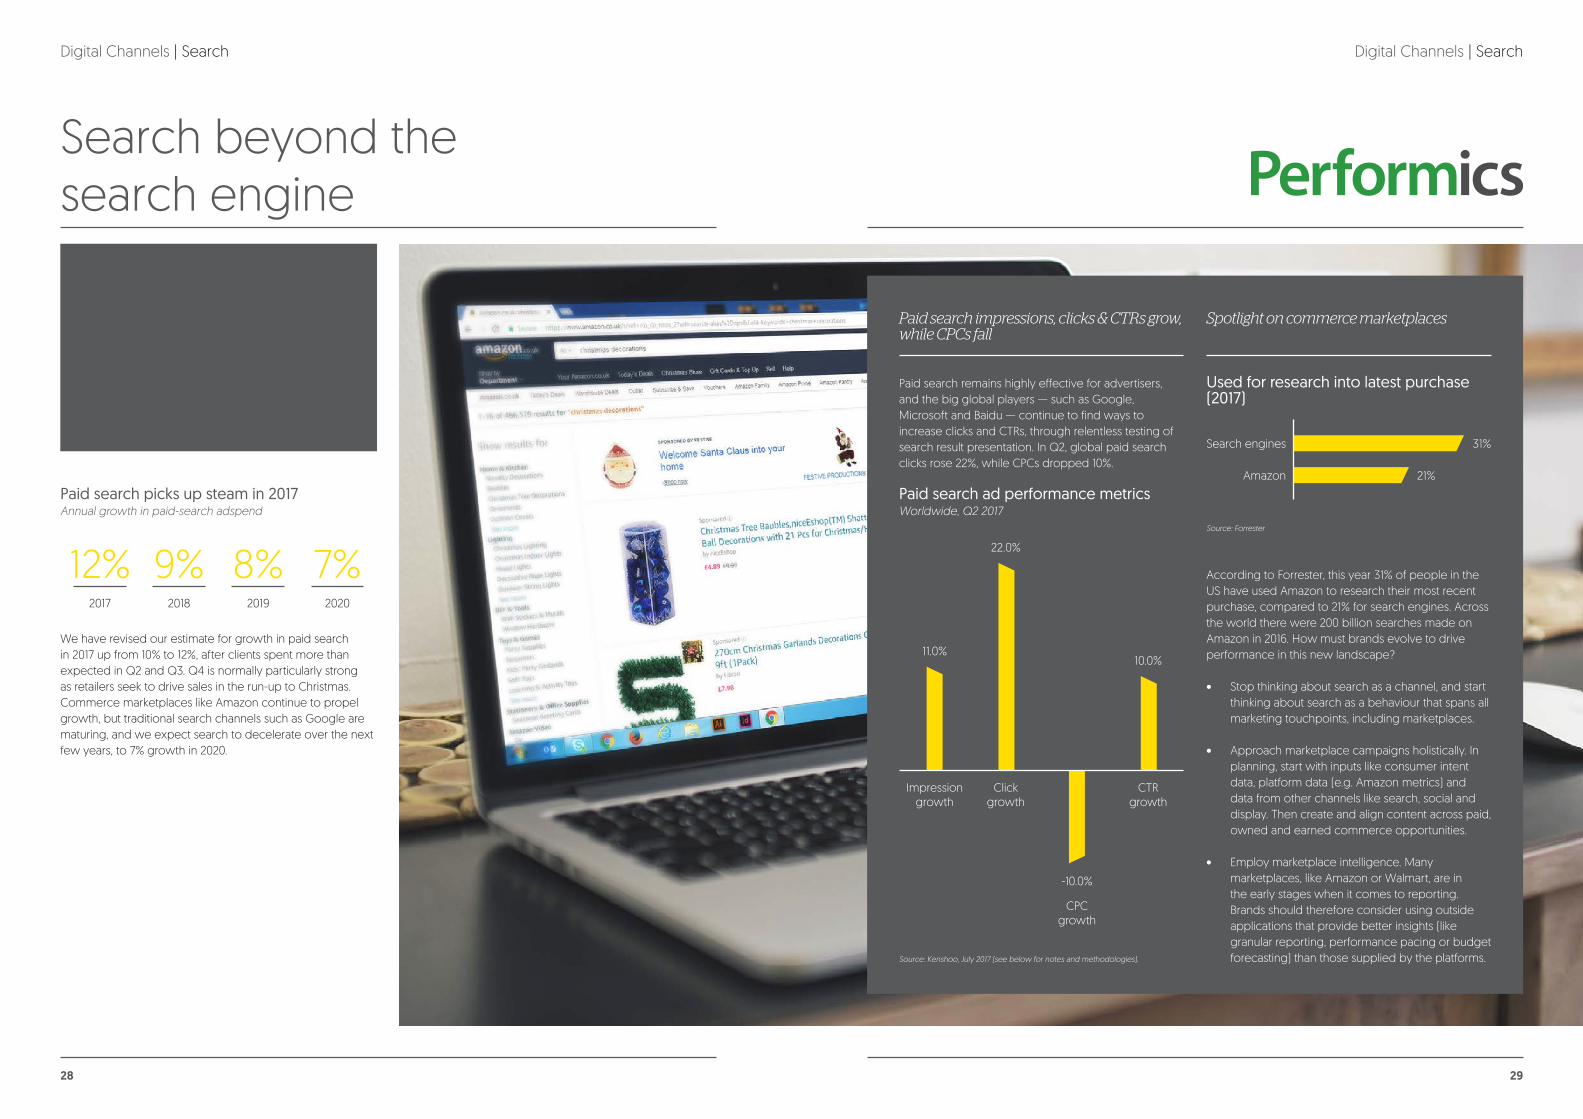
Search beyond the search engine
Spotlight on commerce marketplacesPaid search impressions, clicks & CTRs grow, while CPCs fall
According to Forrester, this year 31% of people in the US have used Amazon to research their most recent purchase, compared to 21% for search engines. Across the world there were 200 billion searches made on Amazon in 2016. How must brands evolve to drive performance in this new landscape?
• Stop thinking about search as a channel, and start thinking about search as a behaviour that spans all marketing touchpoints, including marketplaces.
• Approach marketplace campaigns holistically. In planning, start with inputs like consumer intent data, platform data (e.g. Amazon metrics) and data from other channels like search, social and display. Then create and align content across paid, owned and earned commerce opportunities.
• Employ marketplace intelligence. Many marketplaces, like Amazon or Walmart, are in the early stages when it comes to reporting. Brands should therefore consider using outside applications that provide better insights (like granular reporting, performance pacing or budget forecasting) than those supplied by the platforms.
We have revised our estimate for growth in paid search in 2017 up from 10% to 12%, after clients spent more than expected in Q2 and Q3. Q4 is normally particularly strong as retailers seek to drive sales in the run-up to Christmas. Commerce marketplaces like Amazon continue to propel growth, but traditional search channels such as Google are maturing, and we expect search to decelerate over the next few years, to 7% growth in 2020.
Paid search remains highly effective for advertisers, and the big global players — such as Google, Microsoft and Baidu — continue to find ways to increase clicks and CTRs, through relentless testing of search result presentation. In Q2, global paid search clicks rose 22%, while CPCs dropped 10%.
Paid search ad performance metrics
Source: Kenshoo, July 2017 (see below for notes and methodologies).
Worldwide, Q2 2017Paid search picks up steam in 2017Annual growth in paid-search adspend
2017 20192018 2020
12% 8%9% 7%
Marketing imperatives
• Keep on top of each search provider’s latest innovations in presenting search results to maximise click-through.
• Make sure your search strategy encompasses every site where consumers conduct searches, not just search engines. Ecommerce sites are particularly important.
• Secure access to third-party data sources to support activity on ecommerce platform.
Impression growth
Click growth
CPC growth
CTR growth
11.0%10.0%
-10.0%
22.0%
Used for research into latest purchase (2017)
Source: Forrester
Search engines
Amazon
31%
21%
28 29

30
The digital transformation of FMCGGlobal FMCG companies face the kind of disruption they have never seen before, and so are transforming the way they approach digital marketing.
Digital accountability
Brand suitability
The e-commerce opportunity
Today FMCG companies are being challenged by smaller, more agile competitors with disruptive business models; an infinite shopping shelf as consumers do more of their buying online; and activist shareholders putting pressure on them to make important strategic changes. In response, they are dramatically adapting the way they invest in digital media, scrutinising their marketing expenditure carefully to ensure they can demonstrate value and growth to shareholders.
Today, there are three key trends that characterize how FMCG brands are changing the way they incorporate digital media in their marketing plans.
The programmatic supply chain lacks transparency, so it is difficult and in some cases impossible to ensure that money is going to where it will work most effectively for advertisers. Publishers are also still selling ads that are never viewed, either because they are being served to fraudulent bots or outside a browser’s viewable area. FMCG companies are now demanding more transparency and accountability in the supply channel, and commitments from publishers to reduce levels of advertising fraud and improve viewability. Procter & Gamble’s Marc Pritchard challenged global
publishers and technology providers to clean up their act or face losing Procter & Gamble’s business.
Programmatic trading began as a way for advertisers to buy the right audiences at the right prices, but without reference to the context in which their ads appears. That is no longer good enough for FMCG companies. It is not enough to ensure that an advertiser’s ads never appear in places that would damage the brand – they should actively be placed in content that is deemed to be suitable to the brand.
As their sales in bricks-and-mortar stores have slowed, FMCG have embraced the high-growth opportunities available through e-commerce. Mondelez has set itself an aggressive goal to reach US$1 billion in e-commerce revenues by 2020, while Procter & Gamble says more than US$3 billion of its revenues are now delivered via e-commerce, up 40% year on year. Powerhouse e-commerce companies like Amazon and Alibaba are rolling out their paid advertising services, and are likely to attract keen attention from FMCG companies looking to optimise their visibility on these platforms.
Digital Channels | Digital
Zenith is The ROI agency. We blend data, technology and brilliant specialists to scout out new opportunities, solve complex challenges and grow our clients’ businesses. Zenith is part of Publicis Media, one of four solution hubs within Publicis Groupe [Euronext Paris FR0000130577, CAC40], and has offices within Publicis One. We have over 5,000 brilliant specialists across 95 markets. We are experts in communications & media planning, content, performance marketing, value optimisation and data & analytics. Zenith works with some of the world’s leading brands including Aviva, Coty, Kering, Lactalis, L’Oréal, Nestlé, Nomad Foods, Oracle, RB, SCA, Sanofi and 21st Century Fox.
About Zenith
31