Embed Size (px)
Citation preview

© 2009 International Monetary Fund January 2009 IMF Country Report No. 09/15
[Month, Day], 201 August 2, 2001 Germany: 2008 Article IV Consultation—Staff Report; Staff Supplement; Public Information Notice on the Executive Board Discussion; and Statement by the Executive Director for Germany Under Article IV of the IMF’s Articles of Agreement, the IMF holds bilateral discussions with members, usually every year. In the context of the 2008 Article IV consultation with Germany, the following documents have been released and are included in this package: • The staff report for the 2008 Article IV consultation, prepared by a staff team of the IMF,
following discussions that ended on November 24, 2008, with the officials of Germany on economic developments and policies. Based on information available at the time of these discussions, the staff report was completed on December 9, 2008. The views expressed in the staff report are those of the staff team and do not necessarily reflect the views of the Executive Board of the IMF.
• A staff supplement of January 13, 2009, updating information on recent developments
• A Public Information Notice (PIN) summarizing the views of the Executive Board as expressed during its January 14, 2009 discussion of the staff report that concluded the Article IV consultation.
• A statement by the Executive Director for Germany.
The policy of publication of staff reports and other documents allows for the deletion of market-sensitive information.
Copies of this report are available to the public from
International Monetary Fund • Publication Services 700 19th Street, N.W. • Washington, D.C. 20431
Telephone: (202) 623-7430 • Telefax: (202) 623-7201 E-mail: [email protected] • Internet: http://www.imf.org
Price: $18.00 a copy
International Monetary Fund
Washington, D.C.


INTERNATIONAL MONETARY FUND
GERMANY
Staff Report for the 2008 Article IV Consultation
Prepared by the Staff Representatives for the 2008 Consultation with Germany
Approved by Marek Belka and Tamim Bayoumi
December 9, 2008
Executive Summary Germany faces the prospect of a sizeable, and possibly extended, economic downturn. Following contraction in the second and third quarters of 2008, a further four quarters of negative GDP growth appear likely. In 2009, GDP is projected to fall by 0.8 percent and a sluggish 0.5 percent growth in 2010 would be well below the potential of about 1½ percent. The risk is that corporate and financial sector stresses, thus far dissociated from each other in Germany, may become more intertwined. The longer the global shocks persist, the more severe and prolonged would the weakness be. The authorities have stepped in to protect financial stability. Following the public commitment to fully protect household deposits, the newly-constituted Financial Market Stabilization Fund (FMSF) is to address urgent vulnerabilities—banks’ liquidity, short-term funding, and capitalization. A few transactions have been completed. However, banks face new risks through weakening corporate credit and exposures to emerging markets. It remains important that the Landesbanken be downsized and merged to form viable financial entities for private ownership and operation. The authorities acknowledge the challenge and are examining various options. This crisis has highlighted the need—and created an opportunity—for overhauling the framework for financial stability and prudential regulation. Though faced by legal and political constraints, the authorities are exploring instituting a bank resolution mechanism that can respond in a more timely manner, while also rationalizing the patchwork of deposit insurance schemes within Germany. The global lessons from the crisis will require regulatory and supervisory enhancements. And, as the authorities also recognize, the process of further clarification of authority and accountability within the German system of prudential regulation and supervision must continue. The generally sound fiscal position leaves room for a sizable but targeted stimulus to counter the adverse developments. The authorities regard the measures taken so far as sufficient, but to be complemented, if necessary, with additional stimulus. Staff argued for a more ambitious stimulus now. Targeted payments to economically-weak households could initially raise confidence and spending. Bringing forward the planned reductions in social security contributions and accelerated infrastructure spending could have a stimulus effect with longer-term benefits. However, commitment to long-term fiscal sustainability through the proposed fiscal rule is necessary, as the authorities recognize. Cost efficiencies in healthcare and reform of fiscal federalism remain medium-term challenges despite recent commendable gains in the state of public finances.

2
Contents Page Executive Summary ......................................................................................................................... 1 I. The Context ......................................................................................................................... 3 II. Near-Term Outlook ............................................................................................................. 4 A. Shocks to Growth...................................................................................................... 5 B. Macro-Financial Linkages......................................................................................... 8 C. Spillovers .................................................................................................................. 9 D. Inflation Trends....................................................................................................... 11 III. Risks to Financial Stability................................................................................................ 12 A. Funding Pressures ................................................................................................... 13 B. Capital Adequacy.................................................................................................... 14 IV. Response to the Crisis ....................................................................................................... 17 A. The Stabilization Package ....................................................................................... 17 B. Strengthening the Safety Net................................................................................... 18 C. Prudential Regulation and Supervision ................................................................... 21 V. Competitiveness ................................................................................................................ 23 VI. Balancing Tensions in Public Finances ............................................................................. 24 A. Fiscal Stimulus: Size and Composition................................................................... 25 B. Ensuring Long-Term Fiscal Sustainability.............................................................. 27 VII. Staff Appraisal................................................................................................................... 30 Boxes 1. Volatility from Global Spillovers Add to German Angst .................................................... 7 2. Pass Through from Global Fuel and Food Prices .............................................................. 12 3. Germany’s Fragmented Deposit Protection....................................................................... 20 4. Fiscal Discipline in Germany: A Federal Matter? ............................................................. 29 Figures 1. Credit Market Developments............................................................................................. 32 2. Probabilities of Default by Sector...................................................................................... 33 3. Balance Sheets of Nonfinancial Corporates ...................................................................... 34 4. Central and Eastern Europe: Spillovers from Germany..................................................... 35 Tables 1. Selected Economic Indicators............................................................................................ 36 2. Foreign Claims of Banks on Individual Countries, November 2008................................. 38 3. Core Set of Financial Indicators for Banks, 1999–2007.................................................... 39 4. Encouraged and Other Financial Soundness Indicators, 1999–2007 ................................ 40 5. Medium-Term Balance of Payments, 2005-13.................................................................. 41 6. General Government: Government Operations ................................................................. 42 7. Expenditures Under the Authorities’ Stimulus Packages, October and November, 2008. 44 Annexes I. Germany: Fund Relations .................................................................................................. 45 II. Germany: Statistical Issues................................................................................................ 48

3
I. THE CONTEXT1
1. The authorities have stepped in to protect financial stability. Germany felt the force of the first shocks from the subprime mortgage markets in July 2007. Two banks—IKB and Sachsen LB—had to be rescued at significant cost to the German taxpayer. While the traditional strengths of the Gefinancial system—its retail deposit base and low indebtedness of households and businesses—apparently put a cap on the exposure of the system, systemic concerns have remained live. Following the failure of Lehman Brothers, the liquidity rollover requirements at Hypo Real Estate in early October 2008 were another threat to financial stability. The public commitment to protect household deposits provided initial reassurance. This was followed by a comprehensive package in mid-October to support market liquidity and bank capitalization.
Average Credit Default Swaps for the Four Financial Institutions in Each Country, (In basis points) 1/
0
25
50
75
100
125
150
175
200
225
250
275
300
325
7/3/
077/
27/0
78/
22/0
79/
17/0
710
/11/
0711
/6/0
711
/30/
0712
/26/
071/
21/0
82/
14/0
83/
11/0
84/
4/08
4/30
/08
5/26
/08
6/19
/08
7/15
/08
8/8/
089/
3/08
9/29
/08
10/2
3/08
11/1
8/08
12/1
2/08
1/7/
09
GermanySwitzerlandUnited KingdomUnited States
CDS spreads of German financial institutions have been lower than in other hot spots.
Source: Bloomberg, and IMF Staff calculations.
1/ Four largest financial institutions for each country are as follows: Germany - Deutsche Bank, Commerzbank AG, Munich Reinsurance, and Bayerische Hypo & Vereinsbank AG. Switzerland - Credit Suisse, Swiss Reinsurance, UBS AG, and Zurich Allied AG. United Kingdom - HBOS, Barclays Bank, HSBC Bank, and Royal Bank of Scotland. United States - Citigroup, Bank of America, JP Morgan Chase, and Wells Fargo & Co.
rman
2. Given strong spillovers, policy measures to contain the risk of a self-reinforcing and costly slump will achieve more if coordinated internationally. Global impulses, felt forcefully in Germany, are rapidly transmitted to other economies. A German economic slowdown lowers growth in the rest of Europe, which feeds back to Germany. Moreover, a likely reduction of German banks’ exposure to emerging markets would generate cascading spillovers. Thus, giving due consideration to its domestic objectives, Germany stands to benefit from an internationally coordinated approach to managing global risks.
• In this regard, actions to strengthen the financial safety net will buttress the recent initiatives. Germany’s request for an FSAP update is timely.
• A similar risk management philosophy should apply to economic, especially fiscal, policy
1 The staff team comprised Mr. Ashoka Mody (head), Mmes. Alina Carare, Franziska Ohnsorge (EUR); Messrs. Andreas Jobst, Steven Seelig (MCM), Sven Jari Stehn (FAD) and Ms. Maike Luedersen (LEG). The mission took place during November 12–24, 2008.

4
II. NEAR-TERM OUTLOOK
3. The German economy is experiencing a sharp turnaround. The ongoing fall in confidence—especially in business confidence, reflecting the sharp drop in foreign orders—accelerated with the elevated financial stress since September 2008. Following robust GDP growth at an annualized rate of about 3½ percent just before the crisis hit in mid-2007, the econocontracted in the second and third quarters2008, and a further four quarters of negative GDP growth now appear likely. The expeturnaround reflects German volatility to external impulses (as discussed below), anlarger than in all other G-7 countries exthe United K
my of
cted
d is cept
ingdom.
0
weakness be.
High Frequency Indicators(rescaled to a range 0-100)
0
20
40
60
80
100
120
Jan-
05
Apr-
05
Jul-0
5
Oct
-05
Jan-
06
Apr-
06
Jul-0
6
Oct
-06
Jan-
07
Apr-
07
Jul-0
7
Oct
-07
Jan-
08
Apr-
08
Jul-0
8
Oct
-08
Consumer Confidence IndexForeign OrdersBusiness Climate Index (IFO)
Sentiment has weakened.
4. Staff’s and authorities’ growth projections have largely converged, and the risks are viewed as tilted principally to the downside. Broadly in line with the authorities’ projections, staff expects GDP to grow at 1.7 percent in 2008, followed by a contraction of 0.8 percent in 2009 (Table 1). The projection of a tentative recovery in 201reflects the assessment that the recent upswing was not associated with sustained productivitygains, and financial restructuring will also dampen growth. Corporate and financial sector stresses, thus far dissociated from each other in Germany, may become more intertwined. Moreover, the longer the global shocks persist, the more severe and prolonged would the
Real GDP Growth(4-quarter annual average, in percent)
-2.0
-1.0
0.0
1.0
2.0
3.0
4.0
5.0
Uni
ted
Stat
es
Can
ada
Italy
Fran
ce
Japa
n
Ger
man
y
Uni
ted
King
dom
Pre-crisis, Q3 2006-Q2 2007 Post-Lehman failure, Q4 2008-Q3 2009
The turnaround in German growth will be large.
1/ Based on November World Economic Outlook Quarterly Forecast Update.
Growth and Risk Balance(in percent, 75 and 85 percent confidence intervals)
-2
-1
0
1
2
3
4
2001 2002 2003 2004 2005 2006 2007 2008 2009-2
-1
0
1
2
3
4Risks to GDP growth are tilted to the downside.
Contribution to Real GDP Growth(in percent)
1.2
0.0-0.2
1.20.8
3.02.5
1.7
-0.8
0.5
-2.5
-1.5
-0.5
0.5
1.5
2.5
3.5
4.5
2001 2002 2003 2004 2005 2006 2007 2008 2009 2010
Foreign contributionInvestment ConsumptionReal GDP
Growth is slowing sharply.

5
5. Whether—and the degree to which—downside risks materialize will depend on the evolution of expectations. The economy is being driven, in part, by current conditions but, increasingly, by expectations with regard to the next 6 to 12 months. The forward-looking sentiment is at historic lows. Moreover, the gap between the perception of the present and the future has grown sharply, to an unprecedented size. Pessimistic expectations may further worsen operating conditions and hence become self-fulfilling. As such, to thextent that the forward-looking indicators remain at low levels, they may create a further drag on the economy, and pull theeconomy into scenarios b
e
elow the baseline projection.
70
85
100
115
130
1995
M1
1995
M10
1996
M7
1997
M4
1998
M1
1998
M10
1999
M7
2000
M4
2001
M1
2001
M10
2002
M7
2003
m4
2004
m1
2004
m10
2005
m7
2006
m4
2007
m1
2007
m10
2008
m7
-16
-8
0
8
16
24
32
Deviation between current conditions and expectationsCurrent ConditionsExpectations
Expectations have increasingly diverged from current conditions.
IFO Business Climate Index: Current Conditions and Expectations
A. Shocks to Growth
6. The primary shock has been slowing world demand. Since the mid-1990s, German growth has been powered by exports. Not surprisingly, the principal source of the current slowdown has been the curtailment of foreign orders. The projected weakness of the world economy (and especially the U.S. economy) implies that this source of growth will remain heavily restricted. Movements in the euro exchange rate have some bearing on German exports, but staff analysis suggests that they mainly cause a shift in composition rather than a significant overall change.
Real Private Consumption and Real Exports(Index, 1995=100)
95
145
195
245
295
1995 1997 1999 2001 2003 2005 2007
Exports of goods and nonfactorservicesPrivate consumption
Germany has been reliant on export growth.
-6
-3
0
3
6
9
12
15
18
2001
Q1
2001
Q4
2002
Q3
2003
Q2
2004
Q1
2004
Q4
2005
Q3
2006
Q2
2007
Q1
2007
Q4
2008
Q3
2009
Q2
-2
-1
0
1
2
3
4
5
6
Real ExportsWorld real GDP (right axis)US real GDP (right axis)
(Year-on-year percent change)
German exports will contract along with US growth.
7. The German consumer’s conservatism will continue to amplify the deceleration. The German consumer remained on the sidelines during the recent upswing. Even when employment and earnings began to finally increase towards the peak of the cycle, the threat of inflation apparently held consumption back. The authorities emphasize some temporary

6 Rising unemployment expectations predict higher unemployment.
improvement in consumption from lower oil prices and the current labor market conditions. However, staff views low consumption growth to reflect a strong preference for precautionary savings in Germany. Increased exposure to volatility from global spillovers has recently held consumption back (Box 1 below). With financial and growth volatility expected to remain elevated in the coming quarters, and with unemployment expectations rising, consumption growth is projected to remain low. In contrast to staff, the authorities expect lower investment growth.
Unemployment Expectations and Unemployment Rate(balance of responses in percent, and percent)
-40
-20
0
20
40
60
80
Jan-01 Jan-03 Jan-05 Jan-07 Jan-096
7
8
9
10
11
12
Unemployment expectations 1 year ahead (lagged 1 year)Actual unemployment rate (right scale)
Source: European Commission. How do you expect the number of people unemployed in this country to change over the next 12 months? Answers range from "increase sharply" to "decrease sharply."
8. The worsening business outlook—with rapidly shrinking foreign and domestic order books—will trigger postponement of investment. Investment volatility has traditionally amplified export volatility and the current downturn is no exception. The slowing global manufacturing cycle has sharply curtailed incentives to invest. Investment is projected to fall by 2¾ percent in 2009, contributing ⅔ percentage point tothe decline in output. The fiscalmeasures approved in fall 2008 (see ¶37) to provide investment incentives will not be ablethese macroeconomic headwInvestment is expected to remain weak in 2010.
Volatility of Components of Real GDP(standard deviation of forecast error)
00.010.020.030.040.050.060.07
Exp
orts
Impo
rts
Gro
ss F
ixed
Inve
stm
ent
Con
stru
ctio
n
Gro
ss F
ixed
Inve
stm
ent
Mac
hine
ry&E
quip
.
Pub
licC
onsu
mpt
ion
Priv
ate
Con
sum
ptio
n
Investment volatility has amplified export volatility.
to stem inds.

7
Box 1. Volatility from Global Spillovers Add to German Angst After a sustained decline, GDP growth volatility has increased since the mid-nineties, in Germany and some other industrial countries. This rise in volatility1/ reflects spillovers of other countries’ own idiosyncratic shocks, as the world has become more integrated (with trade in goods and financial assets). This, in turn, contributed to the slow consumption growth in recent years. Increased GDP volatility and Germany’s above-average stock market volatility added to the concerns about tail risks (extreme losses with low probabilities). For precautionary reasons, consumers have preferred to restrain consumption and build buffer-stock savings. During 2002-2007, this effect lowered consumption growth by ½ percentage point. ______________________________ 1/ Measured as time-varying variances of growth innovations.
0102030405060708090
100
1977
Q1
1980
Q4
1984
Q3
1988
Q2
1992
Q1
1995
Q4
1999
Q3
2003
Q2
2007
Q1
Common Spillovers Own
Share of Variances for Each Type of Shock in Total
(In percent)
Germany's rising volatility reflects increased spillovers.
0
1
2
3
4
5
6
1977
Q1
1980
Q4
1984
Q3
1988
Q2
1992
Q1
1995
Q4
1999
Q3
2003
Q2
2007
Q1
TotalSpillovers + CommonCommon
Weighted Averages of Volatilities for Denmark, Germany, Japan, Netherlands, Sweden,
Switzerland, US (In percent)
GDP growth volatility is rising in several industrialized countries.
Germany: Trade Openness
40
50
60
70
80
90
1977
Q1
1980
Q1
1983
Q1
1986
Q1
1989
Q1
1992
Q1
1995
Q1
1998
Q1
2001
Q1
2004
Q1
2007
Q1
Germany: Financial Openness
0
75
150
225
300
375
450
1977
1980
1983
1986
1989
1992
1995
1998
2001
2004
2007
Total Financial Assets and Liabilities (In percent of GDP)
Nominal Exports and Imports (In percent of GDP)
-2.5-2.0-1.5-1.0-0.50.00.51.01.52.02.5
1992 1994 1996 1998 2000 2002 2004 2006
Change in unemployment rateWealth/income ratioStock market volatilityGDP volatility
Contributions to Predicted Consumption Growth(Deviation from G7 Average Growth, in percent)
Stock market and GDP volatility have dampened consumption.

8
B. Macro-Financial Linkages
9. These developments in the real economy do not, as yet, reflect a credit crunch, although that may be changing. Lending standards have tightened somewhat, but more so for large firms than for the small- and medium-sized sector. Yet, overall, bank credit to enterprises has remained relatively robust, declining only slightly in the third quarter of 2008 as demand weakened (Figure 1). Moreover, credit growth has been broad based by type of lending institution. As such, limits on bank credit availability have apparently not constrained growth. That may be changing. Staff analysis suggests that banks have been competing on tightening margins, substituting in some casesfor the drying up of the corporate bond market. The authorities agree that with higher fundcosts and worsening asset quality, a sharper contraction of credit is
1 2 3 4 5
Loans to large enterprises
Loans to small- and medium-sized enterprises
Loans to households for house purchases
Other loans to households
Survey: Contribution of
Financial Turmoil to Tightening
Lending Standards 1/
Credit standard have tightened, but especially for large enterprises.
Q2 Q3 Q4 (expected)1/ +/- one standard deviation around average. On a scale of 1 (significant easing) to 5 (significant tightening). Sources: Bundesbank; IMF staff calculations.
ing
likely, contributing to a financial accelerator-like process.
t
er
s
n
sheets (Figure 3), the projected GDP
10. The corporate bond market is pricing in significant economic weakening. A financial accelerator is evident in corporaof German GDP growth (Figure 2). Thesharp rise in spreads in late-Septemband early October suggests that themarket expects a sizeable growthslowdown along with increased corporate defaults that will keep spreadsup. The recent level of spreads predicta slowing economy through much of 2009. Although this ongoing dowcycle started from a point of strength, including in corporate sector balance
e bond spreads, which have proved a keen predictor
Real GDP Growth (year-on-year in percent) and Corporate Bond Spread (quarterly average, in percentage points)
-3
-2
-1
0
1
2
3
4
5
6
-1.0
-0.5
0.0
0.5
1.0
1.5
2.0
2.5
3.0
3.5
2001Q1 2002Q2 2003Q3 2004Q4 2006Q1 2007Q2 2008Q3 2009Q4
Real GDP growth (left scale)Corporate bond spread (brought forward 1 year, right scale)
Staff baseline
Prediction based on
bond spreads
Corporate bond spreads are consistent with prolonged weakness.

9
growth rates are lower than in the previous recession. This reflects levels of financial stress (and sentiment) that are significantly worse than during the corresponding phase of the previous downturn.2
GDP Growth Rates During 2002 and 2008 Recessions 1/(year-on-year, from quarter 1 to 8)
-2.0-1.00.01.02.03.0
1 2 3 4 5 6 7 8
2002 2008
The current recession is likely to be deeper and longer …
1/ Recession in 2002 started in Q4, while recession in 2008 started in Q2.
2002 2008
Average annual GDP growth 1/ 0.2 0.0IFO Business expectations 2/ 90.3 81.4Corporate spreads 2/ 1.3 3.2
1/ For eight quarters, from the first quarter of the recession.2/ At the beginning of the third quarter of the recession (October 2008, and April 2003 respectively).
… because of greater stress than in the 2002 recession.
C. Spillovers
11. With its strong international linkages, spillovers into and from Germany are substantial. The Staff Report for the 2007 Article IV consultation concluded that U.S. and European growth impulses have a significant bearing on German growth, manifest at present in Germany’s sharp response to the deceleration in world trade. Growth impulses from Germany were contained in the past but are more prominent now. The authorities agree that an economic slowdown in Germany lowers growth in the rest of Europe, which feeds back to Germany.
12. Over time, Germany has become more exposed to emerging market shocks, with implications for ongoing developments. German economic ties to Central Europe are particularly significant: through FDI, trade, and bank subsidiaries (Figure 4). From June 2007, just before the crisis started, to September 2008, German banks’ exposure to emerging markets via loans and credit derivatives doubled to about $450 billion (Table 2), 4 percent of all German banking assets and 12 percent of all German banks’ foreign claims. This expansion occurred at a time when other lenders and investors were retrenching from emerging market assets. A likely scaling back of German banks’ exposure to emerging markets would generate cascading spillovers.
2 The 2008 WEO shows that elevated financial stress is associated with longer duration of weakness and substantially-larger output losses.

10
Source: BIS, Bundesbank, ECB, IMF staff calculations. 1/ Consolidated lending statistics, ultimate risk basis, in accordance with BIS reporting standards. 2/ German emerging market claims (in percent of all emerging market claims). 3/ Equity market composite of all emerging market debtor countries. Equity market composite is weighted by GDP at current prices.
0
100
200
300
400
500
600
700
800D
ec-0
5
Mar
-06
Jun-
06
Sep-
06
Dec
-06
Mar
-07
Jun-
07
Sep-
07
Dec
-07
Mar
-08
Jun-
08
Sep-
08
5
7
9
11
13
15
17
19
Percent of emerging market claims in all cross-borderclaims of German banks (right scale)Central and Eastern Europe
Asia & Pacific
Africa & Middle East
Latin America/Caribbean
German Banks: Foreign Claims on Emerging Markets (In billions of US Dollars; unless otherwise specified) 1/
German banks have increased their emerging market exposure, especially to Central and Eastern Europe...,
100
200
300
400
Dec
-05
Mar
-06
Jun-
06
Sep-
06
Dec
-06
Mar
-07
Jun-
07
Sep-
07
Dec
-07
Mar
-08
Jun-
08
Sep-
08
6
8
10
12
14
Emerging Market Claims (right scale) 2/
Equity Market Composite 3/
German Banks Share of Foreign Claims in Emerging Markets (percent) and Emerging Market Equity Index
(December 2005=100) 1/
... while other banks have reduced their exposure.
13. Spillovers are also manifest in a heightened concordance of sentiment, particularly in an economic downturn. Sentiment in the eurozone becomes more closely aligned when economic prospects worsen. Today, sentiment is more tightly aligned than in the recent past, suggesting that a strong negative reinforcement could continue to hurt growth. German loss of confidence contributes to the contagion of pessimism in the eurozone.
Euro Area sentiments are more closely aligned in economic downturns.
Source: WEO and GlobalInsight.
Common factor in households' expectations of their financial situation expectations
20
30
40
50
60
70
80
Jan-
01
Aug
-01
Mar
-02
Oct
-02
May
-03
Dec
-03
Jul-0
4
Feb-
05
Sep
-05
Apr
-06
Nov
-06
Jun-
07
Jan-
08
Aug
-08
0.0
0.5
1.0
1.5
2.0
2.5
3.0
3.5
Variance explained by first principal component (left scale)Real GDP growth (year-on-year, right scale)
Common factor in consumers' expectations of the general economic situation
20
30
40
50
60
70
80
Jan-
01
Aug
-01
Mar
-02
Oct
-02
May
-03
Dec
-03
Jul-0
4
Feb-
05
Sep
-05
Apr
-06
Nov
-06
Jun-
07
Jan-
08
Aug
-08
0.0
0.5
1.0
1.5
2.0
2.5
3.0
3.5
Variance explained by first principal component (left scale)Real GDP growth (year-on-year, right scale)

11
D. Inflation Trends
14. Inflation has remained contained and is expected to decline fast. Through the period of rising food and fuel prices, German inflation expectations have been solidly anchored. Inflation rose mainly in the headlines, with core inflation remaining low. There is no evidence that second-round effects threatened at any point. Food and energy prices did not feed into the core categories (Box 2), nor did wages experience an unusual spike. Indeed, real wages dropped sharply when inflation rose. With the moderation of food and fuel prices, inflation is projected to decline from 2.8 percent in 2008 to below 1.0 percent in 2009. Downside risks to growth imply downside risks to inflation.
Core
Energy
Food
0.00.51.01.52.02.53.03.54.04.5
Jan-
05
Apr-0
5
Jul-0
5
Oct
-05
Jan-
06
Apr-0
6
Jul-0
6
Oct
-06
Jan-
07
Apr-0
7
Jul-0
7
Oct
-07
Jan-
08
Apr-0
8
Jul-0
8
Contribution to Inflation (Year-on-year percent, Harmonized Index)
Well-anchored inflation expectations have contained core inflation.
-4.0
-3.0
-2.0
-1.0
0.0
1.0
2.0
3.0
4.0
5.0
2005
Q1
2005
Q3
2006
Q1
2006
Q3
2007
Q1
2007
Q3
2008
Q1
2008
Q3
Productivity
Real earnings
Productivity and Real Earnings Per Hour Worked (Annual Percent Change, Seasonally Adjusted)
-1.5
-1.0
-0.5
0.0
0.5
1.0
1.5
2.0
2.5
3.0
3.5
2001
2002
2003
2004
2005
2006
2007
2008
Q1
2008
Q2
2008
Q3
NegotiatedActualDrift
Wages (Annual percent change; except 2008)
Wage pressures have remained moderate while productivity growth has slowed.
Source: Federal Statistical Office, Federal Labor Office, and Bundesbank.1/ Wage drift is the difference between actual and negotiated wage increases (monthly basis).

12
Box 2. Pass Through from Global Fuel and Food Prices
The influence of global fuel and food prices felt in Germany is broadly in line with the impact observed in other advanced economies. International fuel prices are passed through to domestic commodity prices to a significantly greater extent than are food prices. However, once passed through, food prices have a larger impact on core inflation. The size of these transmission coefficients—the extent of prices transmitted over a year—is consistent with the relatively modest effects that were felt in Germany during the recent run up in food and fuel prices.
Food Fuel Food Fuel
Germany 0.11 0.28 0.22 -0.02France 0.05 0.24 0.61 0.02Italy 0.07 0.20 0.43 -0.03UK 0.16 0.23 0.27 -0.03US 0.09 0.38 0.00 0.01
Memorandum itemAdvanced economies 0.06 0.23 0.20 0.01
Source: IMF (World Economic Outlook, Fall 2008, Helbling and others)
Pass-Through from International Commodities Prices to Core Inflation, 1995 - 2008International to Domestic
Commodities PricesDomestic Commodities Prices to Core Inflation
III. RISKS TO FINANCIAL STABILITY
15. The global financial crisis has highlighted important vulnerabilities of the German financial system. Though traditionally conservative, segments of the banking system were exposed to substantial risks. The exposures interacted vigorously with global financial turbulence. As of end-September 2008, Germany accounted for about a quarter of European bank write downs. Of these, about two thirds have been in public or quasi-public sector banks. Two large private banks—Hypo Real Estate and Commerzbank—have sought assistance through the government’s financial stabilization package, as discussed below. Looking ahead, the system faces two key vulnerabilities:
• The rollover of wholesale funding: funding conditions remain tight, and bunching of maturing debt obligations creates rollover risk.
• The availability of adequate capital buffers: the low absolute level of capital will be further stressed as profits fall and asset quality worsens with the economic slowdown.

13
Capital Adequacy Ratio (CAR) 1/
Total Assets
Share of Public Funds
In percent of total
assets 2/ Total 3/ 2007In percent of equity Total 3/ 2007 Total 3/
Private banksDeutsche Bank AG 11.6 1.9 56.6 2,974.2 10.6 3.3 18.7 6.2 ... 0.0Dresdner Bank AG 13.8 3.0 21.8 736.4 3.7 1.8 16.9 ... ... ...Commerzbank AG 10.8 2.6 23.7 907.5 2.2 0.8 9.3 ... ... ...DZ Bank AG n.a. 2.5 16.2 635.0 2.5 2.0 15.4 ... ... ...Hypo Real Estate Holding 9.4 2.4 2.2 90.8 1.1 0.7 51.1 ... ... ...Postbank AG 9.2 2.6 7.8 298.8 0.8 0.8 10.2 ... ... ...IKB Deutsche Industriebank 12.3 2.4 1.8 75.4 15.0 ... 844.6 12.4 9.0 100.0
Public banksBayerische Landesbank 11.4 3.0 18.1 611.9 7.0 4.7 38.7 ... ... ...Landesbank Baden-Württemberg 9.7 0.5 15.3 652.8 4.5 2.0 29.3 ... ... ...WestLB 9.1 1.5 6.5 421.8 4.3 4.1 66.0 7.3 ... 68.5HSH Nordbank AG 10 3.1 9.2 296.7 3.6 2.0 39.0 1.9 ... 76.2Landesbank Sachsen AG 9.9 1.7 2.1 125.2 2.4 2.4 115.3 0.4 0.4 0.0Nord/LB 9.5 3.1 9.2 296.7 0.6 0.3 6.5 ... ... ...Helaba 11.4 2.8 7.2 255.8 0.5 0.3 6.9 ... ... ...
Total ... ... 197.8 8,378.8 58.8 25.2 29.7 28.2 9.4 ...as percent of global ... ... 4.4 10.2 11.3 11.8 ... 7.4 16.7 ...as percent of Europe ... ... 9.0 16.2 22.3 24.2 ... 14.5 30.4 ...
Memorandum items:Global 4/5/ ... 5.4 4,466.7 81,997.2 522.5 213.1 11.7 380 56.4 ...
of which: Americas 13.6 9.2 1,474.8 16,117.2 263.3 104.2 17.9 194.5 30.9 ...of which: Europe 13.9 4.3 2,197.1 51,569.1 235.1 97.9 10.7 163.3 25.6 ...
of which: Germany 11.4 2.2 207.1 11,305.9 58.8 25.2 28.4 28.2 9.4 ...of which: Asia 14.2 5.2 904.9 17,314.8 24.1 11.1 2.7 22.2 0.0 ...
Source: Annual Reports, Bloomberg, Bankscope, Moody's KMV, The Banker, IFS statistics, IMF staff estimates.1/ Bank regulatory capital to risk-weighted assets (CAR) according to revised Basel Capital Accord.2/ At end-2007, in percent of total assets.3/ Since start of the crisis in June 2007 until September 2008.4/ Includes only commercial banks.5/ Median CAR values in the respective region.
Capital InjectionEquity Writedowns
Balance Sheet Magnitude of Financial Crisis(In billions of U.S. dollars unless noted otherwise)
A. Funding Pressures
16. Traditionally reliant on a strong retail depositor base, German banks had increased their demand for wholesale funding. This was so especially over the years 2004–2007. Starting in mid-2007, but especially since early 2008, these funding sources have contracted sharply. The continued risk that market liquidity will not be rolled over prean important short-term source vulnerability. These concerns were especially manifest in the case of Hypo Real Estate.
sents of
17. Funding pressures are manifest even in the highly-secure covered bond (Pfandbrief) market. Backed by high-grade mortgages retained on their books (with loan-to-value ratios in the 60–80 percent range) or by loans to the public sector, German covered bonds have been considered almost as safe as Bunds. However, since the
Germany: Securitized Asset Issuance(billion U.S. dollars)
0
10
20
30
40
50
60
70
80
90
2004 2005 2006 2007 2008 YTD
Collaterilized debtobligations (CDO)Asset-backedsecurities (ABS)Mortgage-backedsecurities (MBS)
After rising rapidly, banks' wholesale funding sources have contracted sharply.

14
spring of 2008, spreads on these bonds have tended to increase, and, following the sharp rise in September, have stabilized at historically-high levels. Trading in the secondary Pfandbrief market has nearly halted since early September, as bondholders are apparently using their Pfandbrief positions as collateral for receiving liquidity from the central bank. Planned issues of covered bonds have been cancelled or cut in volume as the primary market demand has shrunk. Wholesale investors apparently prefer the large ongoing and expected issues of directly government-guaranteed debt.
Covered Bond Market Spreads (Over middle Euribor 10-year interest rate swaps;
in basis points)
-15
15
45
75
105
135
165
195
Jan-
07Fe
b-07
Mar
-07
May
-07
Jun-
07Ju
l-07
Sep-
07O
ct-0
7D
ec-0
7Ja
n-08
Feb-
08Ap
r-08
May
-08
Jun-
08Au
g-08
Sep-
08N
ov-0
8
-15
15
45
75
105
135
165
195
United Kingdom
Spain
Ireland
France
German MortgagePfandbriefe
Even in the covered bond market, liquidity has dried up.
0
100
200
300
400
500
600
700
800
Ger
man
y
Euro
pe
Ger
man
y
Euro
pe
Ger
man
y
Euro
pe
Ger
man
y
Euro
pe
Ger
man
y
Euro
pe
Ger
man
y
Euro
pe
2003 2004 2005 2006 2007 2008 (toNov)
Jumbo Bonds - Germany Non-Jumbo Bonds - GermanyJumbo Bonds - Europe Non-Jumbo Bonds - Europe
German and European Covered Bond Issuance 1/(In billions of U.S. Dollars)
Even in the covered bond market, liquidity has dried up. Even in the covered bond market, liquidity has dried up. Even in the covered bond market, liquidity has dried up. Even in the covered bond market, liquidity has dried up. Even in the covered bond market, liquidity has dried up. Even in the covered bond market, liquidity has dried up. Even in the covered bond market, liquidity has dried up. Even in the covered bond market, liquidity has dried up.
Source: Datastream; and IMF staff estimates and calculations. 1/ Data for non-Jumbo bonds for the second half of 2008 not available.
Even in the covered bond market, liquidity has dried up.
B. Capital Adequacy
18. Though banks are in compliance with their regulatory capital requirements, their high leverage ratios and falling profits will add to stress. At about 4½ percent, the equity-to-consolidated assets ratio of the German banking system is low even by European standards (Tables 3 and 4). The gap between the risk-weighted capital ratio and the leverage ratio is particularly large for the big commercial banks, the Landesbanken, and the mortgage banks. This reflects the favorable risk weighting of their assets (including portfolios of derivatives instruments) under current regulatory guidelines. Moreover, bank profits had fallen sharply by mid-2008 and, with the
Operating Profit (2007-2008)8.6
2.9 3.11.9
0.70.5 1.2 0.5 0.4-1.1
-2
0
2
4
6
8
10
12
Deu
tsch
eBa
nk
Com
mer
zban
k
Hyp
o-Ve
rein
sban
k(H
VB
)
Dre
sdne
rBa
nk
Deu
tsch
ePo
stba
nk
2007 (end-June)2008 (end-June)
Private banks' profitability has fallen.

15
economic downturn, are likely to remain low in 2009. As asset quality worsens, and the need for additional provisioning increases, so will the need for additional capital.
France Italy 2/ Japan Spain 3/ UK 4/ US GermanyBank Regulatory Capital to Risk-Weighted Assets 10.1 10.4 12.9 11.4 12.6 12.8 12.9Bank Capital to Assets 5.5 7.7 5.0 7.0 7.9 10.3 4.3Bank Nonperforming Loans to Total Loans 2.7 4.8 1.5 0.7 0.9 1.4 2.7Bank Provisions to Nonperforming Loans 61.4 49.5 28.8 204.8 … 93.1 77.3Bank Return on Assets 0.4 0.7 0.2 1.1 0.4 0.8 0.2Bank Return on Equity 9.8 9.7 3.2 19.9 6.2 7.8 4.7Loan-Deposit Ratio 58.6 126.5 75.7 102.7 71.4 104.1 66.0Short-term Funding Ratio 26.6 8.4 7.5 5.8 23.5 19.2 30.7Tier 1 Capital to Total Capital 63.8 82.1 80.4 69.7 61.1 88.4 68.6Off-balance Sheet Items to Total Liabilities 25.2 10.9 2.8 24.9 54.1 192.9 16.0
Sources: National authorities, Bankscope, Moody's KMV, IMF staff estimates.1/ The sum of ratios including all asset or liabilities can sum up to greater than unity due to the aggregation of averages.2/ Consolidated reports for banking groups and individual reports for banks not belong to groups.
4/ Bank Provisions to Nonperforming Loans: data for large banking groups; Bank Return on Assets: before tax.
3/ Bank Nonperforming Loans to Total Loans: Doubtful exposures to other resident sectors over total lending to other resident sectors; Bank Provisions to Nonperforming Loans: allowances and provisions to doubtful exposures.
(In percent)Banking Sector - Performance and Soundness Indicators: Selected Countries, end-2007 1/
19. The need for more capital is also dictated by the heightened financial volatility. Since the start of the crisis in July 2007, market assessments of the probabilities of default on bank debt have increased (Figure 2). This has been a function primarily of increased uncertainty regarding the quality of assets amid deteriorating credit conditions reflected in the low market valuation of German bank relative to European peers. As a consequence, a large share of German banking assets has moved into sub-investment-grade credit ratings categories while overall default risk has increased.
Source: Reuters-Thomson, Datastream, Bloomberg, and IMF staff estimates.
Banking Sector: Market-Based Estimated Default Probability (Factor Analysis, in percent) 1/
0.0
0.1
0.2
0.3
0.4
0.5
0.6
0.7
Sep
-07
Oct
-07
Nov
-07
Dec
-07
Jan-
08
Feb-
08
Mar
-08
Apr-0
8
May
-08
Jun-
08
Jul-0
8
Aug
-08
Sep
-08
Oct
-08
Banking Sector VolatilityMarket leverage componentStock market volatility component
1/ Median values. The default frequency has been estimated for each constituent entity over a one-year risk horizon and subsequently
S&P rating scale
AAA
-AA
BBB
BB
Elevated default probabilities reflect high volatility.
Selected Banks: Comparison of Multiples (Nov. 21, 2008)
Deutsche BankHypo Real
Estate
Deutsche Postbank
KBC
HSBC
Unicredit
SocGen
HBOS
Erste BankSEB
Commerzbk.
BNP ParibasSantander
NordeaBBVA
Hypo-Vereinsbank
-0.2
0.3
0.8
1.3
1.8
2.3
0 5 10 15 20 25 30Return on Equity (in percent) 1/
Pric
e / B
ook
Val
ue
1/ ROE after tax and depreciation on the basis of reported capital at end-June 2008.
German banks have low return on equity and price-to-book value ratios.

16
Implied ratings of banks have fallen sharply.
January 2007
BB14.1%
BBB35.4%
CCC1.5%
B1.4%
A43.7%
AA3.9%
Share of investment grade-rated banks: 84%
November 2008
BBB61%
BB26%
A1%
AA12%
Share of investment grade-rated banks: 74%
Rating Breakdown of Banking Sector (Asset weighted, Standard & Poor's rating scale, in percent)
20. Looking ahead, the economic slowdown will generate further pressures. The relatively low debt ratios of companies and households and the significant role of retail deposits in the funding of banks will continue to cushion the impact of the current shocks. The low debt ratios have been accompanied by modest increases in equity prices and flat house prices. Despite that, the nonfinancial sector is now more broadly affected than during the earlier stages of the crisis. The borrowing costs for nonfinancial corporates, especially for the lower-quality borrowers have increased sharply as perceptions of default probabilities have increased. This has occurred across various sub-sectors (construction, automobiles, engineering, and chemicals) and not only for low-grade entities, as would be expected during a slowdown, but also for highly-rated corporates.
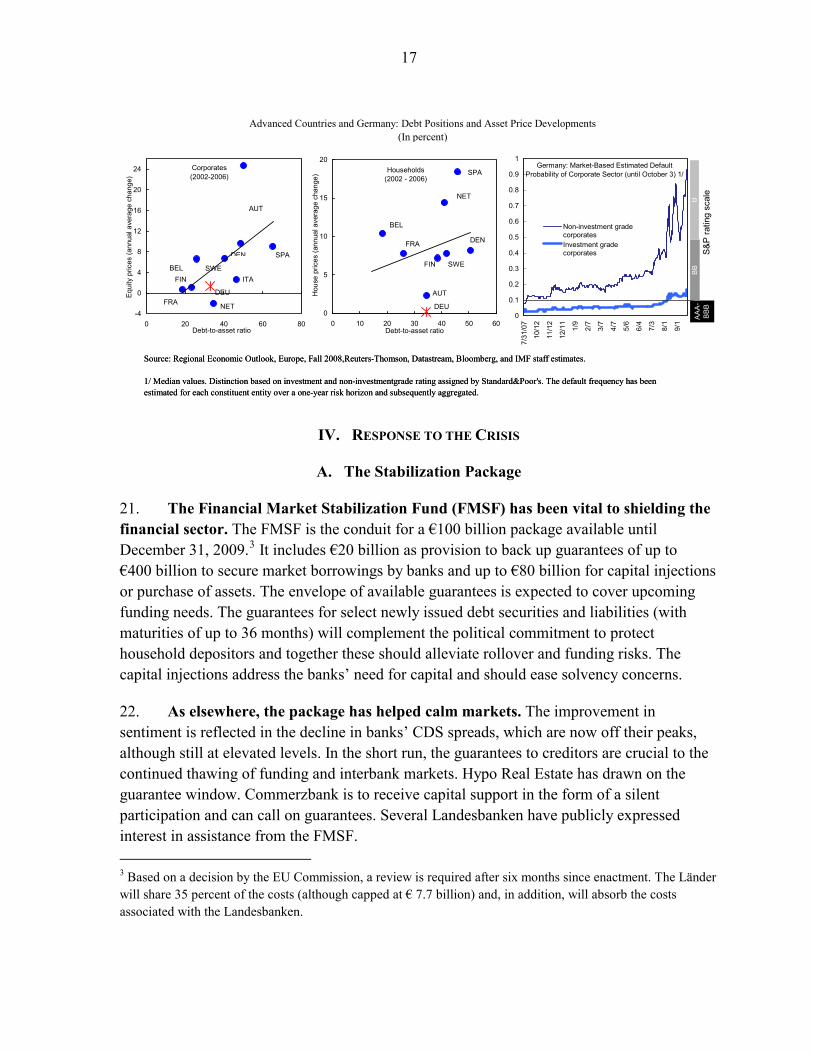
17
Source: Regional Economic Outlook, Europe, Fall 2008,Reuters-Thomson, Datastream, Bloomberg, and IMF staff estimates.
1/ Median values. Distinction based on investment and non-investmentgrade rating assigned by Standard&Poor's. The default frequency has been estimated for each constituent entity over a one-year risk horizon and subsequently aggregated.
Advanced Countries and Germany: Debt Positions and Asset Price Developments(In percent)
-4
0
4
8
12
16
20
24
0 20 40 60 80Debt-to-asset ratio
Equ
ity p
rices
(ann
ual a
vera
ge c
hang
e)
Corporates (2002-2006)
FRADEU
NET
SPADEN
AUT
BELFIN
SWEITA
0
5
10
15
20
0 10 20 30 40 50 60Debt-to-asset ratio
Hou
se p
rices
(ann
ual a
vera
ge c
hang
e)
Households (2002 - 2006)
FRA
DEU
NET
SPA
DEN
AUT
BEL
FSWEFIN
0
0.1
0.2
0.3
0.4
0.5
0.6
0.7
0.8
0.9
1
7/31
/07
10/1
2
11/1
2
12/1
1
1/9
2/7
3/7
4/7
5/6
6/4
7/3
8/1
9/1
Non-investment gradecorporatesInvestment gradecorporates S
&P ra
ting
scal
eA
AA
-B
BB
BB
B
Germany: Market-Based Estimated Default Probability of Corporate Sector (until October 3) 1/
Source: Regional Economic Outlook, Europe, Fall 2008,Reuters-Thomson, Datastream, Bloomberg, and IMF staff estimates.
1/ Median values. Distinction based on investment and non-investmentgrade rating assigned by Standard&Poor's. The default frequency has been estimated for each constituent entity over a one-year risk horizon and subsequently aggregated.
IV. RESPONSE TO THE CRISIS
A. The Stabilization Package
21. The Financial Market Stabilization Fund (FMSF) has been vital to shielding the financial sector. The FMSF is the conduit for a €100 billion package available until December 31, 2009.3 It includes €20 billion as provision to back up guarantees of up to €400 billion to secure market borrowings by banks and up to €80 billion for capital injections or purchase of assets. The envelope of available guarantees is expected to cover upcoming funding needs. The guarantees for select newly issued debt securities and liabilities (with maturities of up to 36 months) will complement the political commitment to protect household depositors and together these should alleviate rollover and funding risks. The capital injections address the banks’ need for capital and should ease solvency concerns.
22. As elsewhere, the package has helped calm markets. The improvement in sentiment is reflected in the decline in banks’ CDS spreads, which are now off their peaks, although still at elevated levels. In the short run, the guarantees to creditors are crucial to the continued thawing of funding and interbank markets. Hypo Real Estate has drawn on the guarantee window. Commerzbank is to receive capital support in the form of a silent participation and can call on guarantees. Several Landesbanken have publicly expressed interest in assistance from the FMSF. 3 Based on a decision by the EU Commission, a review is required after six months since enactment. The Länder will share 35 percent of the costs (although capped at € 7.7 billion) and, in addition, will absorb the costs associated with the Landesbanken.

18
23. The German package is sizeable but the approach, unlike in the U.S. and the U.K., has thus far been more hands off. The authorities are relying on banks’ assessments in seeking public assistance. They indicated that they are not yet ready to implement a more proactive approach, as suggested by staff. The conditionality associated with the FMSF’s assistance appears milder than in the U.K. but more stringent than in the U.S. Also, the German authorities are able to provide Tier I capital through silent participations that do not dilute existing shareholder positions. This approach appears appropriate based on the banks’ current solvency position, but might need to be revised and tightened, on a case-by-case basis, to more aggressively dilute shareholders if significant additional losses are identified. The challenge for the authorities will be to support viable banks while providing incentives for the recourse to private capital markets. Regular financial reporting and audits will provide transparency and accountability.4
24. The proactive restructuring of the Landesbanken requires early attention. The economic role of the Landesbanken is in question, highlighted by their investments in imprudent ventures. Moreover, the financial crisis has revealed the serious risks—to their viability and, thereby, to systemic stability—associated with their wholesale funding approach. Downsizing these banks, separating them into “good” banks and “bad” banks, and incorporating the “good” banks (to enable the introduction of private capital) should be among the options for their restructuring. Proposals to combine these troubled institutions need careful assessment since larger troubled banks would pose even greater systemic problems. The authorities agree that the Landesbanken must be restructured but believe that the Lander, as principal owners, must take the initiative. Staff recommended that SoFFin could work with the Landesbanken and their owners to break the impasse.
B. Strengthening the Safety Net
25. Reforms to achieve early intervention and effective bank resolution are essential. The German bank resolution framework is not in line with sound international practices or the recommendation of the Financial Stability Forum that calls for a broad range of resolution tools. Banks play a key role in the economy, and run specific risks that may materialize quickly with a major impact on the economy. In return, banks should be subject to a special resolution regime, typically including the ability for the authorities to take a range of quick and decisive actions concerning failing banks that would permit limiting shareholders’ rights. The German legal framework is constrained in this regard by the general corporate legal regime, which is more respectful of property rights. As a consequence, bank resolution, often
4 Speedy review of individual cases by DG Competition of the European Commission will provide needed legal certainty to transactions.

19
under the leadership of the associations, may take longer and possibly result in declining asset values and delays in depositor access to their funds.
26. The authorities have taken a first step in this direction and are exploring further enhancements. The financial stabilization package allows for speedy shareholder dilution in recapitalizations. These powers need to be broadened beyond the 50 percent dilution currently allowed for the FMSF. The deposit protection scheme for cooperative banks, where shareholder voting rights are less of a concern, has successfully been used to fund a full range of resolution tools to deal with its financially distressed/insolvent member banks. The authorities are exploring ways to strengthen the bank resolution framework.
27. The authorities are considering broader changes to deposit insurance, in concert with recent European initiatives. A sound deposit insurance framework is a key component of the financial safety net. The recent crisis revealed important limitations of the patchwork of statutory and private schemes, which offer differing levels of protection to depositors (Box 3).
• The lack of public awareness about relevant coverage and features (including financial strength and the legal obligations of the schemes) created incentives for sudden movements of deposits between different segments of the banking sector.
• Coverage under the statutory schemes (€20,000; 0.7 times GDP per capita) is low by international comparison and includes a coinsurance element that risked undermining depositor confidence.
• The time limits for depositor reimbursements under the statutory schemes are rather long and prevent prompt access to deposits, further contributing to uncertainty.
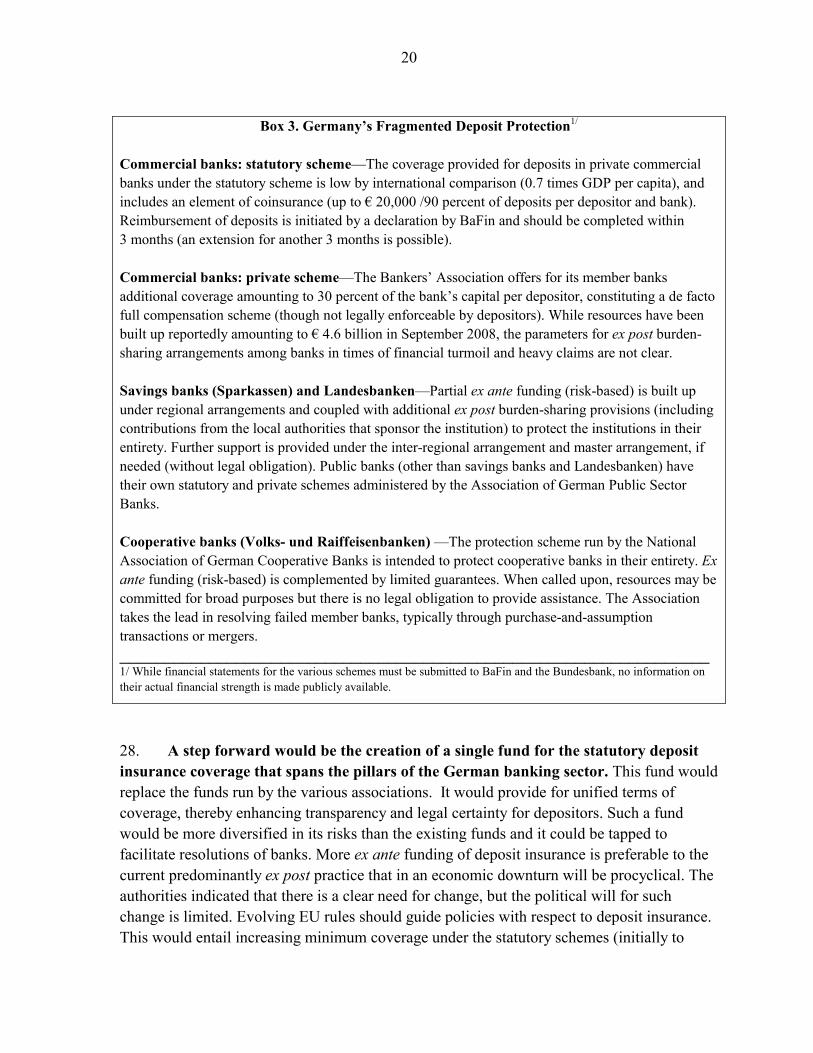
20
Box 3. Germany’s Fragmented Deposit Protection1/
Commercial banks: statutory scheme—The coverage provided for deposits in private commercial banks under the statutory scheme is low by international comparison (0.7 times GDP per capita), and includes an element of coinsurance (up to € 20,000 /90 percent of deposits per depositor and bank). Reimbursement of deposits is initiated by a declaration by BaFin and should be completed within 3 months (an extension for another 3 months is possible). Commercial banks: private scheme—The Bankers’ Association offers for its member banks additional coverage amounting to 30 percent of the bank’s capital per depositor, constituting a de facto full compensation scheme (though not legally enforceable by depositors). While resources have been built up reportedly amounting to € 4.6 billion in September 2008, the parameters for ex post burden-sharing arrangements among banks in times of financial turmoil and heavy claims are not clear. Savings banks (Sparkassen) and Landesbanken—Partial ex ante funding (risk-based) is built up under regional arrangements and coupled with additional ex post burden-sharing provisions (including contributions from the local authorities that sponsor the institution) to protect the institutions in their entirety. Further support is provided under the inter-regional arrangement and master arrangement, if needed (without legal obligation). Public banks (other than savings banks and Landesbanken) have their own statutory and private schemes administered by the Association of German Public Sector Banks. Cooperative banks (Volks- und Raiffeisenbanken) —The protection scheme run by the National Association of German Cooperative Banks is intended to protect cooperative banks in their entirety. Ex ante funding (risk-based) is complemented by limited guarantees. When called upon, resources may be committed for broad purposes but there is no legal obligation to provide assistance. The Association takes the lead in resolving failed member banks, typically through purchase-and-assumption transactions or mergers. __________________________________________________________________ 1/ While financial statements for the various schemes must be submitted to BaFin and the Bundesbank, no information on their actual financial strength is made publicly available.
28. A step forward would be the creation of a single fund for the statutory deposit insurance coverage that spans the pillars of the German banking sector. This fund would replace the funds run by the various associations. It would provide for unified terms of coverage, thereby enhancing transparency and legal certainty for depositors. Such a fund would be more diversified in its risks than the existing funds and it could be tapped to facilitate resolutions of banks. More ex ante funding of deposit insurance is preferable to the current predominantly ex post practice that in an economic downturn will be procyclical. The authorities indicated that there is a clear need for change, but the political will for such change is limited. Evolving EU rules should guide policies with respect to deposit insurance. This would entail increasing minimum coverage under the statutory schemes (initially to

21
€50,000 and possibly to €100,000 when adopted as the EU minimum) and procedures put in place to facilitate prompt access to insured deposits. In light of the experience with Northern Rock and subsequent removal of coinsurance in the U.K., Estonia, and others, the authorities should remove the coinsurance feature of the statutory schemes. Supplementary coverage could be allowed provided it did not compromise transparency.
C. Prudential Regulation and Supervision
29. Beyond the immediate crisis response, lessons from the crisis call for enhancements to the regulatory and supervisory framework. The authorities are taking steps to implement Pillar II of Basel II and to introduce recommendations that respond to the recent crisis. In this regard, the consultation paper on the European Capital Requirements Directive (CRD) has identified three salient issues: a college of supervisors for cross-border banks, capital requirements for securitization, and binding limits on interbank exposures. The enhanced capital requirements for securitization will force German banks, some of whom have recently engaged heavily in these transactions, to face their responsibilities and also to leave traces in their prudential returns to more easily draw supervisors’ attention. Additional recommendations by the Financial Stability Forum (FSF) that will require attention include: the review of banks’ liquidity contingency plans, sharing with other countries’ authorities of their crisis management experience, and consistent approaches to liquidity for cross border banks. The authorities indicated that salaries at BaFin are at the lower end of supervisory compensation in Europe, which could impede acquiring the expertise to oversee the complex risks and the new challenges.
30. At the same time, the case for a tighter bank regulatory and supervisory process has become more compelling. To respond promptly to problem situations, supervisors have a heightened need for information on the current status of bank soundness. As such, greater consolidation of regulatory and supervisory resources could yield significant benefits. This implies:
• Significantly reduced reliance on external auditors. Such reliance creates the scope for significant delays in identifying financial stress.
• Prudential regulation and supervision should be linked to a system of macro-surveillance and stability analysis.
• As recommended by the FSF, Bundesbank would need ready access to firm level supervisory information to facilitate their emergency liquidity support activities.
31. Alternative structural approaches could improve supervision. Should all prudential oversight be placed under the authority of the Bundesbank, as provider of liquidity to the banking sector, its operational independence would need to be assured. Another option would be to place all supervision in BaFin, but here compensation limits could become

22
problematic, especially since the specialized skills for the implementation of Basel II are in scarce supply. Under either option, the authorities may wish to also explore the “twin peaks” model whereby prudential and market conduct supervision and regulation of the financial sector are placed in separate agencies. This model is being used by the Dutch authorities. The authorities indicated that they plan to retain the “integrated supervisor” model but intend to undertake a more detailed review by March 2009.
V. COMPETITIVENESS
-4
-2
0
2
4
6
8
10
12
14
1991 1993 1995 1997 1999 2001 2003 2005 20071/ Adjusted for Germany's and its trading partners' business cycle.
80
85
90
95
100
105
110
115
120
125
130
Current account balance (left scale)CPI-based REER (right scale)ULC-based REER (right scale)
ULC- and CPI-based REER and Current Account Balance (index, and in percent of GDP, respectively) 1/
The ULC-based REER has tracked current account developments.
rnal
32. The authorities agree that Germany enjoys a small competitiveness advantage, though the CGER methodology results in divergent assessments. It is customary to take a simple average of the three approaches, which gives a competitiveness advantage (margin) of 5½ percent. That is similar to the assessment of the macro-balances approach, which in staff’s view best reflects German conditions. Under this approach, a country’s savings-investment balance is judged against an equilibrium computed using several norms, which include estimates of long-term societal preferences for precautionary savings and demographic factors. By this measure, the competitiveness advantage is about 4 per-cent. In contrast, by the so-called “extesustainability” approach, the “equilibrium” current account surplus is that needed to maintain net foreign assets at the current level. But since Germans evidently prefer to save to accumulate foreign assets, as the macro-balances approach recognizes, the external sustainability approach overstates the competitiveness advantage.
Macro- balances
External Sustainability
Equilibrium Real Exchange Rate
Current account norm 4.0 0.6 ...Underlying current account balance/ 6.5 6.5 ...Current account projection for 2013 1/ ...
Competitiveness gap -4 -15 21/ See Table 5.
ApproachGermany: Competitiveness Assessment
Current Account Balance(in percent of GDP)
CA norm Germany
CA norm Eurozone
-4
-2
0
2
4
6
8
10
1997 1999 2001 2003 2005 2007 2009 2011 2013
GermanyEurozone
Germany's current account surplus reflects a high equilibrium norm.
33. The equilibrium real exchange rate (ERER) measure, which reflects a disadvantage, may also not be an appropriate measure for Germany. The ERER measures competitiveness using the CPI-based real exchange rate (REER). While German inflation has moved with that in the eurozone, German wages have fallen in real terms and, in particular, relative to major European countries. With

23
85 percent of German exports in the manufacturing industry, the manufacturing unit labor cost (ULC)-based real exchange rate index better tracks competitiveness than the CPI-based one. Since 2003, the current account balance has steadily improved consistent with the continued real depreciation in the ULC-based real exchange rate, while the CPI-based REER has appreciated. Germany’s increasing gap between the CPI- and ULC-based real exchangerates is particularly noteworthy when compared to other major European economies. Tdifference also contributes to the European REER reflecting an overvaluation or a
his
competitiveness disadvantage.
Compared to its main trading partners, only Germany's ULC-based REER has depreciated, …ULC- and CPI-Based Real Exchange Rate Index (2000=100)
Source: IFS.
Germany
80
85
90
95
100
105
110
115
120
125
1991 1995 1999 2003 2007
ULC-basedCPI-based
France
80
85
90
95
100
105
110
115
120
1991 1995 1999 2003 2007
ULC-basedCPI-based
Italy
80
90
100
110
120
130
140
150
1991 1995 1999 2003 2007
ULC-basedCPI-based
34. While moderation in reaadvantage cannot be assumed. Germany has recently enjoyed strong export growth. However, export shareshave not necessarily increased, eithin world trade or in the eurozone. Thus, wage moderation has helped principally stem the decline in market shares. Germany has gained relative toother advanced economies, incthose in the eurozone, but has continued to lose ground to lowage economies despite the wage moderation and efforts to position its products in more differentiated markets. For now, this process may continue with the claims on a growth dividend remaining muted in the difficult economic
l wage
er
luding
wer
environment. But wage claims are likely to resurface and productivity gains are not assured.
s has helped Germany, sustainability of this
Share of German-Origin Imports of Total Imports(in percent)
1516171819202122232425
...stemming the decline in Germany's world market share.
6
7
8
9
10
11
12
13
Eurozone (left scale)Non-Eurozone (right scale)
1990 1993 1996 1999 2002 2005 2008

24
VI. BALANCING TENSIONS IN PUBLIC FINANCES
35. Following impressive expenditure-based consolidation in prior years, the headline deficit is set to be balanced in 2008. The pressure on the deficit increased in 2008 on account of revenue losses (of about ½ percent of GDP resulting from corporate income tax reform and the reduction in unemployment contributions) and the increase in civil service wages (one-tenth percent of GDP). Compensating for these factors were cyclical gains in revenues and reduced social benefits with higher employment (Table 6). Though the earlier bank rescue measures raised the deficit, the recent financial sector stabilization package has not had an impact on the deficsince the support leads to an acquisition of a financial asset; bu
it
t it does imply higher public debt that finances the support.
General Government Balance (In percent of GDP)
42
43
44
45
46
47
48
49
50
2001 2003 2005 2007 2009 2011
Revenues
Expenditures
Deficit
Fiscal consolidation has been expenditure-based.
36. For 2009, the headline deficit will rise with the cyclical downturn. Policy measures approved in fall 2008 to raise social benefits, change social security contributions, and provide investment incentives are expected to raise the deficit by about 0.2 percentage point of GDP in 2009. The bigger impact on the headline deficit will come from the worsening economic situation. As a result of cyclical pressures, the general government deficit is expected to be 1.1 percent of GDP. The authorities currently project the deficit at ½ percent of GDP, but with the likely revision in their economic outlook assumptions, their projection will be close to that of staff.
2003 2004 2005 2006 2007 2008 2009
Overall balance -4.0 -3.8 -3.3 -1.5 -0.2 0.0 -1.1Revenue 44.5 43.3 43.5 43.8 43.9 44.0 44.1 of which
Direct taxes 10.4 10.0 10.1 10.8 11.2 11.1 11.1Indirect taxes 11.8 11.8 11.8 12.1 12.6 12.5 12.5
Primary expenditure 44.0 42.8 42.7 41.1 39.9 39.9 41.1 Social benefits 27.5 26.8 26.6 25.8 24.6 24.8 25.7 of which
Pensions 12.5 12.3 12.2 11.8 11.4 11.2 11.6 Health 7.7 7.4 7.5 7.4 7.4 7.5 7.7
Other expenditures 16.5 16.1 16.0 15.4 15.2 15.1 15.4
Structural balance -3.2 -2.6 -2.2 -1.2 -0.2 -0.5 -0.6
Proj.
General Government Fiscal Position (Percent of GDP)

25
A. Fiscal Stimulus: Size and Composition
37. A moderate fiscal stimulus in 2008 may be followed by a broadly neutral stance in 2009. The fiscal stimulus of 2008 largely results from the tax breaks referred to above. In 2009, the severe macroeconomic downturn will precede the deterioration of the tax base (buoyed, in part, by the agreed wage increases under the 2008 wage negotiation rounds), creating a structural fiscal improvement. This will be offset by the stimulus packages announced in early October and early November (Table 7). As such, the structural deficit will be broadly stable.
A broadly neutral fiscal stance is expected for 2009.
-5
-4
-3
-2
-1
0
1
2
2002 2003 2004 2005 2006 2007 2008 2009
OverallCyclical and one offStructural
General Government Balance (Percent of GDP)
Maastricht
38. Significant frontloaded and internationally-coordinated fiscal stimulus is necessary. Staff viewed the authorities’ measures as relatively modest, especially in 2009 when they are most needed to boost demand. Staff proposed that, assuming multipliers of 0.4-0.5, bringing GDP growth to zero in 2009 would require a frontloaded fiscal stimulus of 1½ to 2 percent of GDP. The authorities were concerned that such an effort would open the door to demands from diverse lobbies, undermining hard-won consolidation, and may prove ineffective if multipliers are smaller. Staff acknowledged this risk, but argued that this concern needs to be weighed against the threat that with anxiety at unusually high levels—and even with the benefit of the FMSF—a self-reinforcing costly loss in output could ensue. The authorities and staff agreed that—given extensive evidence of trade, financial, and sentiment spillovers—the stimulus would be particularly effective if German actions were part of a joint European effort to bolster demand.
2008 2009 2010One-off payments to low-income households 3.6Accelerated health care reform 10.0 8.5Accelerated public investment 24.9 0.5Authorities' Fall 2008 fiscal measures 4.8 14.8
Total 3.6 39.7 23.8 (in percent of GDP) 0.1 1.6 0.9
Illustrative Fiscal Stimulus Package(in billions of euros, unless otherwise specified)
39. The international experience points to important lessons for making a stimulus effective. Drawing on these lessons, the practical implications for Germany were discussed (see text table below for possible measures and their likely effectiveness):
• Staff expressed concern that private investment incentives (through accelerated depreciation) and increased lending to small- and medium-sized firms through the

26
development bank, KfW, were unlikely to raise investment while business confidence was low.
• The stimulus could be initiated by transfer payments to vulnerable households (to impart an immediate demand impulse). The focus on the poorer households would direct funds to where they would most likely be spent and also mollify those who have felt that the dividend from the recent upswing eluded them. The existing system of means-tested social benefits already identifies likely recipients.
• Bringing forward the proposed reduction in social security contributions—by increasing immediately the federal government contribution to the Health fund—would reduce high labor tax rates and, while boosting sluggish private consumption, also support potential growth.
• Accelerating maintenance investment and infrastructure projects already in the pipeline could significantly boost output and, therefore, confidence, but, as most infrastructure investment is undertaken at the local level, these may require federal top-up payments to municipalities.
• In contrast, a value-added tax rate reduction would be less appropriate. Staff agreed with the authorities that a VAT cut would be ineffective because it would raise policy uncertainty by reversing the 2007 hike and it would counteract the long-term goal of moving towards indirect taxation.
Though cautious about the efficacy of transfer payments, the authorities agreed that lowering the social security contributions, and accelerating public infrastructure projects are sensible measures, and could be part of a package, should one be needed at a later date. For the time being, they will monitor the economic situation, and the effectiveness of the already announced measures.

27
Measure Cost-Effectiveness
Lag from Enactment 1/
Uncertainty about Effects
Comments
ExpendituresOne-off transfer payments to low-income households through social benefit system
Large Short Small Advantage: Exising social benefit system identifies low-income households with the highest multipliers.Disadvantage: Political pressures to continue one-off payments.
Targeted transfers to cash-strapped state and local governments to avoid cut backs in key services
Large Short Small Advantage: Given spending bias of states' fiscal policy, transfers likely to be spent rapidly. Disadvantage: Political pressures to continue one-off payments.
Targeted public investment program on projects that can be rolled out and finished quickly
Large Medium Small Disadvantage: Tends to take 2-3 quarters to develop and enact. The disadvantage could be mitigated by implementing infrastructure maintenance projects and accelerating projects that are in advanced stages of the pre-implementation process.
Incentives for new investment Small Medium Large Disadvantage: Stimulus may be delayed because of lags in developing new investment programs and may be ineffective given current business confidence. May be difficult to repeal in the upswing.
RevenuesReduce social security contributions by raising federal transfer to Health Fund to full amount planned for 2016
Large Small Small Advantage: Implementation already planned for 2016. Raises take-home wage of poorer households, which could not be reached with a personal income tax rate cut because of incomes below the threshold for income tax payments. Disadvantage: Benefit increases with income.
Withholding holiday for employee social security contributions
Medium Medium Large Advantage: Increase in take-home pay tends to be more effective than income tax rebate. Disadvantage: Households may save increase in take-home pay in anticipation of end-of-year payment.
Income tax rebate Large Medium Large Disadvantage: Rebate that increases in proportion to tax liability and, hence, income is less effective than uniform rebate because it is less well-targeted. Processing time may cause delays.
Extending operating loss and carry-back provisions
Small Medium Large Advantage: Provisions can ease cash constraints and enhance effectiveness of investment incentives. Disadvantage: Provisions have little effect in themselves.
Source: Congressional Budget Office, Fund staff assessments, World Economic Outlook.1/ Approximate time between enactment and when the policy would have achieved the bulk of its effect on aggregate demand. Short means less than 1/2 a year. "Medium" means 1/2-1 year. "Long" means more than 1 year.
Fiscal Stimulus Measures (in approximate order of effectiveness)
B. Ensuring Long-Term Fiscal Sustainability
40. Sustainability of public finances requires a recommitment to a fiscal rule. The authorities aim to amend the Basic Law to establish a rule that limits the structural budget balance to close to zero from 2011. The importance of such a rule is even greater now that the stimulus will add to the challenge of ensuring long-term fiscal sustainability. The proposed fiscal rule—which staff stressed should be applied also to the states—would provide the mechanism to regain lost ground with ambitious initiatives to achieve fiscal sustainability as the economy embarks on its recovery path. The authorities welcomed staff’s emphasis on this principle. Reintroduction of a wealth tax, greater flexibility in the retirement age, and cost efficiencies, especially in health care and fiscal decentralization, will need to be actively considered.

28
41. Despite the Agenda 2010 labor market and social security reforms, public finances remain vulnerable. The authorities estimate that, under a benign scenario, public sector debt could stabilize at about 10 percent of GDP. Staff projections—including the recent pension increases above the established formula—caution, however, that public sector debt could reach 50 percent of GDP. If additional downside fiscal risks materialize without prompt offsetting measures, public sector debt could quickly rise manifold. Of particular importance are the risks associated with healthcare costs due to an aging population.
Debt Simulations (in percent of GDP 2004 - 2050)
0
50
100
150
200
250
300
350
1970 1980 1990 2000 2010 2020 2030 2040 2050
Low aging costs and plannedadjustmentMedium aging costs and plannedadjustmentMedium aging costs and sloweradjustmentLarge aging costs and plannedadjustmentLarge aging costs and slowadjustment
Debt simulations vary greatly with aging cost.
42. Further cost savings measures could be generated beyond the 2007 healthcare reform. In particular, further rationalization could be achieved in pharmaceutical expenditures. Also, incentives for efficiency-enhancing competition could be strengthened. From 2009, a Health Fund, financed by the federal budget and individual contributions, will allocate funds to insurers of the public health insurance system. In addition, the insured will be required to pay fees directly to the insurers, of on average, five percent of the total estimated costs for the year. While this set up provides some incentives to insurers to reduce costs—because lower fees charged to the insured will attract more clients—it also creates incentives to attract the healthier and wealthier. The OECD has suggested that alternative fee structures may create stronger cost saving incentives. The authorities recognize that easing the pressure of healthcare costs will continue to require new efforts.
43. States need to contribute to fiscal consolidation. To date, states have added to the accumulation of public debt. The cooperative system of uniform spending standards and equalizing fiscal transfers, characterized by a high degree of revenue sharing by international comparison, has muted incentives for fiscal discipline. In particular, states receiving net transfers have engaged in pro-cyclical expenditure and delayed debt consolidation (Box 4). Several reforms should be considered: (a) structural-deficit or expenditure-based fiscal rules at the federal and state levels to strengthen fiscal discipline and reduce pro-cyclicality; (b) a surveillance mechanism, based on consistent reporting standards; (c) increased state-level tax autonomy to increase incentives for revenue collection and reduce dependence on supple-mentary federal grants. The authorities welcomed the staff’s support for a fiscal rule which would help long-term fiscal sustainability. They agreed also that a broader federalism reform would be desirable but did not see much scope for progress during this legislative period.
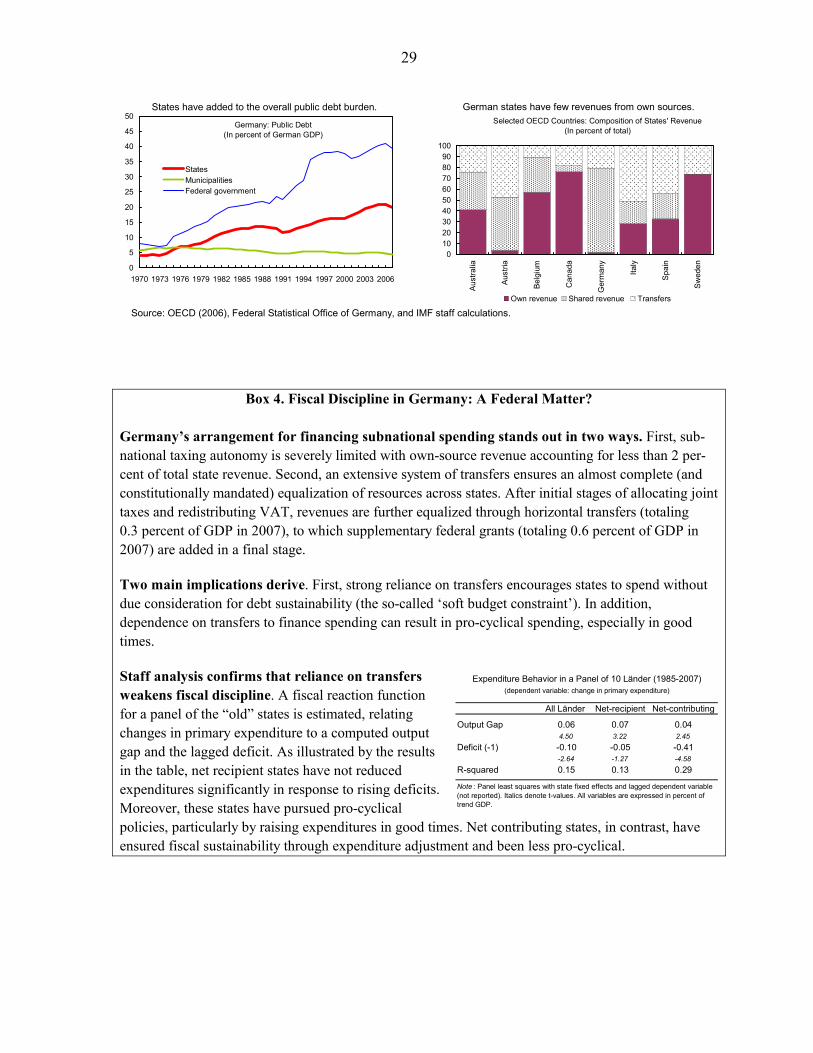
29
Source: OECD (2006), Federal Statistical Office of Germany, and IMF staff calculations.
Germany: Public Debt(In percent of German GDP)
0
5
10
15
20
25
30
35
40
45
50
1970 1973 1976 1979 1982 1985 1988 1991 1994 1997 2000 2003 2006
StatesMunicipalitiesFederal government
States have added to the overall public debt burden.Selected OECD Countries: Composition of States' Revenue
(In percent of total)
0102030405060708090
100
Aus
tralia
Aus
tria
Bel
gium
Can
ada
Ger
man
y
Italy
Spa
in
Sw
eden
Own revenue Shared revenue Transfers
German states have few revenues from own sources.
Box 4. Fiscal Discipline in Germany: A Federal Matter? Germany’s arrangement for financing subnational spending stands out in two ways. First, sub-national taxing autonomy is severely limited with own-source revenue accounting for less than 2 per-cent of total state revenue. Second, an extensive system of transfers ensures an almost complete (and constitutionally mandated) equalization of resources across states. After initial stages of allocating joint taxes and redistributing VAT, revenues are further equalized through horizontal transfers (totaling 0.3 percent of GDP in 2007), to which supplementary federal grants (totaling 0.6 percent of GDP in 2007) are added in a final stage.
Two main implications derive. First, strong reliance on transfers encourages states to spend without due consideration for debt sustainability (the so-called ‘soft budget constraint’). In addition, dependence on transfers to finance spending can result in pro-cyclical spending, especially in good times.
Staff analysis confirms that reliance on transfers weakens fiscal discipline. A fiscal reaction function for a panel of the “old” states is estimated, relating changes in primary expenditure to a computed output gap and the lagged deficit. As illustrated by the results in the table, net recipient states have not reduced expenditures significantly in response to rising deficits. Moreover, these states have pursued pro-cyclical policies, particularly by raising expenditures in good times. Net contributing states, in contrast, have ensured fiscal sustainability through expenditure adjustment and been less pro-cyclical.
All Länder Net-recipient Net-contributing
Output Gap 0.06 0.07 0.044.50 3.22 2.45
Deficit (-1) -0.10 -0.05 -0.41-2.64 -1.27 -4.58
R-squared 0.15 0.13 0.29
Note : Panel least squares with state fixed effects and lagged dependent variable (not reported). Italics denote t-values. All variables are expressed in percent of trend GDP.
Expenditure Behavior in a Panel of 10 Länder (1985-2007)(dependent variable: change in primary expenditure)

30
VII. STAFF APPRAISAL
44. Germany faces the prospect of a sizeable, and possibly extended, economic downturn. Following GDP contraction in the second and third quarters of 2008, a further four quarters of negative GDP growth and sluggish recovery thereafter appear likely. In 2009, GDP is projected to fall by 0.8 percent and the 0.5 percent growth in 2010 would be well below the potential of about 1½ percent. The risk is that corporate and financial sector stresses, thus far dissociated from each other in Germany, may become more intertwined. The longer the global shocks persist, the more severe and prolonged would be the weakness.
45. Given strong spillovers, policy measures to contain the risk of a self-reinforcing and costly slump will achieve more if coordinated internationally. Global impulses, felt forcefully in Germany, are rapidly transmitted to other economies. A German economic slowdown lowers growth in the rest of Europe, which feeds back to Germany, despite its small competitiveness advantage. Moreover, a necessary reduction of German banks’ exposure to emerging markets would generate cascading spillovers. Thus, giving due consideration to its domestic objectives, Germany stands to benefit from an internationally coordinated approach to managing global risks.
• In this regard, continued actions to strengthen the financial safety net will buttress the recent initiatives. Germany’s request for an FSAP update is timely.
• A similar risk-management philosophy should apply to fiscal policy.
46. The Financial Market Stabilization Fund (FMSF), which has been vital to shielding the financial sector, could be a stepping stone for broader financial reforms. The German approach has differed from that in other countries: it is voluntary and banks may choose from a range of stabilization measures. Given the low absolute level of capital in several banks, a more proactive recapitalization is desirable, particularly in view of expected asset quality deterioration. Moreover, SoFFin, the agency administering the FMSF, could use its authority more broadly for enhancing the soundness of the financial sector.
• The proactive restructuring and downsizing of the Landesbanken requires early attention. SoFFin could fruitfully work with the Landesbanken in achieving this goal.
• The authorities should possess the ability to act expeditiously under a special bank resolution regime. A move in that direction has been made for bank recapitalizations under SoFFin allowing dilution of shareholder rights. In this line, further modifications of the legal framework for orderly bank resolutions are warranted.
47. A critical element of the financial safety net, deposit protection should be strengthened. The multiple protection schemes have typically relied on ex post burden-sharing, which elevates risks in periods of stress. A base layer of mandatory deposit

31
insurance—ex ante funded by contributions from all banks—would provide unified terms of protection for depositors and reduce incentives to shift deposits among the existing schemes. Evolving European Union rules should provide guidance on policies related to deposit insurance.
48. The case for a tighter bank regulatory and supervisory process has become more compelling. To respond promptly to problem situations, supervisors have a heightened need for information on the current status of bank soundness. This implies, first, significantly reduced reliance on external auditors. Additionally, prudential regulation and supervision should be linked to a system of macro-surveillance and stability analysis. As such, greater consolidation of regulatory and supervisory resources could yield significant benefits.
49. Additional significant fiscal stimulus that is frontloaded, well targeted, and internationally coordinated is necessary. Following sustained fiscal prudence, the authorities have rightly taken steps to stimulate the economy. But their net size, timing, and focus on bolstering private investment imply that the immediate benefit will be limited.
• Bringing GDP growth to zero in 2009 would require a fiscal stimulus of 1½ to 2 percent of GDP. Such an effort would be particularly effective if German actions were part of a joint European effort to bolster demand.
• The German stimulus would likely be most effective if initiated by transfer payments to vulnerable households (to impart an immediate demand impulse), followed by bringing forward the proposed reduction in social security contributions (to lower labor taxation) and accelerating infrastructure projects (possibly through top-up federal payments to local communities). In contrast, a value-added tax rate reduction would be less appropriate.
50. These actions must be accompanied by a credible long-term commitment to fiscal sustainability. This remains a concern, especially with regard to trends in healthcare costs and the debt accumulation by the states.
• Containing healthcare costs requires further rationalization of pharmaceutical expenditures and strengthened efficiency-enhancing competition.
• More states taxation autonomy and a redesign of supplementary federal grants are required to improve states incentives for fiscal discipline.
• The proposed fiscal rule, limiting the structural budget balance to close to zero, should be applied also to the states, and would help regain lost ground and ensure fiscal sustainability.
51. It is proposed that the next Article IV consultation be held on the standard 12-month cycle.

32
Figure 1. Germany: Credit Market Developments
Source: Bundesbank, and IMF staff calculations.
Loans to the Private Sector(Annualized growth rates, seasonally adjusted, percent)
-1
0
1
2
3
4
5
6
7
Jan-
00
Jan-
01
Jan-
02
Jan-
03
Jan-
04
Jan-
05
Jan-
06
Jan-
07
Jan-
08
12-month6-month
Credit growth may be beginning to slow.
Loans to the Private Sector in Germany(Cont. to year-on-year growth, percent)
-1.5
0.5
2.5
4.5
2004Jan
May
Sep
2005Jan
May
Sep
2006Jan
May
Sep
2007Jan
May
Sep
2008Jan
May
Sep
Housing loansOther loans to householdsLoans to financial enterprisesLoans to non-financial enterprisesAll banks
Despite the decline, credit growth to nonfinancial enterprises was relatively robust.
Lending to Domestic Non-Financial Enterprises(Cont. to year-on-year growth, percent)
-6
-4
-2
0
2
4
6
8
10
12
Mar
-00
Mar
-01
Mar
-02
Mar
-03
Mar
-04
Mar
-05
Mar
-06
Mar
-07
Mar
-08
Big banks LandesbankenRegional banks Subsidiaries of foreign banksSavings banks CooperativesOther banks All banks
All types of lending institutions have contributed to credit growth.

33
Figure 2. Germany: Probabilities of Default by Sector(in percent)
Source: Bloomberg, Fund staff estimates.
Financial Sector
0.0
0.1
0.2
0.3
0.4
0.5
0.6
0.7
10/2
2/07
11/2
2/07
12/2
2/07
1/22
/08
2/22
/08
3/22
/08
4/22
/08
5/22
/08
6/22
/08
7/22
/08
8/22
/08
9/22
/08
10/2
2/08
BanksInsurance companiesInvestment Management
S&P rating scale
AAA
AAA
BB
bBBB
Industry
0.0
0.3
0.6
0.9
1.2
1.5
10/2
2/07
11/2
2/07
12/2
2/07
1/22
/08
2/22
/08
3/22
/08
4/22
/08
5/22
/08
6/22
/08
7/22
/08
8/22
/08
9/22
/08
10/2
2/08
Automotive SectorConsumer DurablesConsumer ProductsMachinery and EquipmentSteel and Metal Products
S&P rating scale
AAA
A
AA
BB
BBB
B
Construction
0.0
0.5
1.0
1.5
2.0
2.5
3.0
1/31
/06
3/31
/06
5/31
/06
7/31
/06
9/30
/06
11/3
0/06
1/31
/07
3/31
/07
5/31
/07
7/31
/07
9/30
/07
11/3
0/07
1/31
/08
3/31
/08
5/31
/08
7/31
/08
9/30
/08
S&P rating scale
AAA-A
BB
BBB
B

34
Figure 3. Germany: Balance Sheets of Nonfinancial Corporates
Source: Bundesbank.
Financial Net Worth (In percent of GDP)
-80
-70
-60
-50
-40
-30
-20
1991
1.Q
1992
1.Q
1993
1.Q
1994
1.Q
1995
1.Q
1996
1.Q
1997
1.Q
1998
1.Q
1999
1.Q
2000
1.Q
2001
1.Q
2002
1.Q
2003
1.Q
2004
1.Q
2005
1.Q
2006
1.Q
2007
1.Q
2008
1.Q
Corporates enter this recession with lower net worth, ...
Money Market Paper and Short-Term Loans
0
5
10
15
20
25
30
1991
1.Q
1992
1.Q
1993
1.Q
1994
1.Q
1995
1.Q
1996
1.Q
1997
1.Q
1998
1.Q
1999
1.Q
2000
1.Q
2001
1.Q
2002
1.Q
2003
1.Q
2004
1.Q
2005
1.Q
2006
1.Q
2007
1.Q
2008
1.Q
0
2
4
6
8
10
12
14
16
18
In percent of GDP
In percent of total liabilities (rightscale)
... but fewer short-term liabilities, ...
Capital Position
0
5
10
15
20
25
30
1994 1996 1997 1999 2001 2003 2005106
108
110
112
114
116
118
Capital in percent of assets
Long-term capital in percent offixed assets (right scale)
... a better capital position, ...
Liquidity Position
124
126
128
130
132
134
136
138
140
142
1994 1996 1997 1999 2001 2003 20050
2
4
6
8
10
12
14
16
18
20
Liquid assets in percent of short-term liabilitiesCash flow in percent of externalfinancing (right scale)
... and greater liquidity.

35
Figure 4. Central and Eastern Europe: Spillovers from Germany
Source: Bundesbank, BIS, Direction of Trade Statistics.
Exports to Germany from New Central and Eastern European Member States
(In percent of source countries' GDP)
8.0
8.5
9.0
9.5
10.0
10.5
11.0
11.5
12.0
12.5
13.0
1998 2000 2002 2004 2006
Stock of German FDI Assets, 2006(In percent of recipient country GDP)
0
2
4
6
8
10
12
14
16
18
Hun
gary
Cze
ch
Slo
vaki
a
Pol
and
Rom
ania
Latv
ia
Lith
uani
a
Bul
garia
Est
onia
Slo
veni
a
Rus
sia
Sales Generated by German FDI Assets , 2006 (In percent of recipient country GDP)
0
5
10
15
2025
30
35
40
45
50C
zech
Hun
gary
Slo
vaki
a
Pol
and
Bul
garia
Rom
ania
Slo
veni
a
Est
onia
Lith
uani
a
Latv
ia
Rus
sia
Claims of BIS-Reporting Western European Banks on Eastern European Creditors, Nov.
2008 (In percent of debtor country GDP)
05
1015202530354045
Hun
gary
Latv
ia
Pol
and
Lith
uani
a
Cze
ch R
epub
lic
Esto
nia
Rus
sia
Ukr
aine
Turk
ey
Germany AustriaItaly France
Claims of BIS-Reporting German Banks on Eastern European Creditors, November
2008 (In percent of German banking system assets)
0
0.1
0.2
0.3
0.4
0.5
0.6
0.7
Pol
and
Rus
sia
Hun
gary
Turk
ey
Cze
ch R
epub
lic
Ukr
aine
Latv
ia
Slo
vak
Rep
ublic
Rom
ania
Lith
uani
a
Exports to Germany, 2007(In percent of exporter's GDP)
0
5
10
15
20
25
Cze
ch R
epub
lic
Hun
gary
Slo
vak
Rep
ublic
Slo
veni
a
Pol
and
Bulg
aria
Lith
uani
a
Rom
ania
Esto
nia
Latv
ia
Eastern Europe's dependence on exports to Germany has risen and is especially large in the Czech and Slovak Republics and Hungary.
The Czech and Slovak Republics and Hungary rely particularly heavily on German FDI.
While German banks' exposure to Eastern European banks is limited, the Hungarian, Latvian, and Polish banking systems are exposed to German banks.

36
Total area 357,041 square kilometersTotal population (2007) 82.2 millionGDP per capita (2007) US$ 40,400
2002 2003 2004 2005 2006 2007 2008 1/ 2009 1/ 2010 1/
Demand and supply Private consumption -0.8 0.1 0.1 0.2 1.0 -0.4 -0.2 -0.3 0.1 Public consumption 1.5 0.4 -0.7 0.4 0.6 2.2 2.7 2.5 2.0 Gross fixed investment -6.1 -0.3 -0.3 1.1 7.7 4.3 5.4 -2.7 -0.5 Construction -5.8 -1.6 -3.9 -3.0 5.0 1.8 3.3 -1.3 0.0 Machinery and equipment -7.5 1.1 4.5 6.0 11.1 6.9 5.9 -5.0 -0.9 Final domestic demand -1.4 0.1 -0.1 0.4 2.3 1.1 1.6 -0.3 0.4 Inventory accumulation 2/ -0.6 0.5 0.0 -0.4 0.0 0.1 -0.3 0.6 0.0 Total domestic demand -2.0 0.6 -0.1 0.0 2.1 1.1 1.5 0.4 0.4 Exports of goods and nonfactor services 4.3 2.5 10.2 7.7 12.7 7.5 4.6 -1.5 3.7 Imports of goods and nonfactor services -1.4 5.4 7.3 6.5 11.9 5.0 4.8 1.0 4.0 Foreign balance 2/ 2.0 -0.8 1.4 0.7 1.0 1.4 0.3 -1.2 0.1
GDP 0.0 -0.2 1.2 0.8 3.0 2.5 1.7 -0.8 0.5 Output gap (In percent of potential GDP) -0.2 -1.7 -1.9 -2.3 -0.8 0.4 0.9 -1.0 0.0
Employment and unemployment Labor force 42.5 42.6 43.0 43.3 43.2 43.3 43.4 43.5 43.5 Employment 39.0 38.6 38.8 38.8 39.0 39.7 40.2 39.9 39.8 Unemployment 3/ 3.5 3.9 4.2 4.6 4.2 3.6 3.2 3.6 3.7Unemployment rate (in percent) 4/ 7.7 8.8 9.2 10.6 9.8 8.4 7.3 8.3 8.5
Prices and incomes GDP deflator 1.4 1.2 1.0 0.7 0.5 1.8 1.3 1.1 1.0 Consumer price index (harmonized) 1.4 1.0 1.8 1.9 1.8 2.3 2.8 1.0 0.8 Average hourly earnings (total economy) 2.0 1.7 0.4 1.0 1.1 1.4 1.0 0.7 0.2 Unit labor cost (industry) 1.5 -1.3 -3.1 -4.2 -4.0 -3.1 -0.6 -0.8 -1.3 Real disposable income 5/ -0.2 0.5 0.2 0.3 0.9 0.0 0.5 -0.1 0.1 Personal saving ratio (in percent) 9.9 10.3 10.4 10.6 10.5 10.8 11.4 11.6 11.5
1/ IMF staff projections. 2/ Growth contribution. 3/ National accounts definition 4/ Eurostat definition. 5/ Deflated by the national accounts deflator for private consumption.
Sources: Deutsche Bundesbank; Federal Statistical Office; IMF, World Economic Outlook; IMF, International Financial Statistics; and staff estimates and projections.
Table 1. Germany: Selected Economic Indicators
(Percentage change)
(In millions of persons, unless otherwise indicated)
(Percentage change)

37
2002 2003 2004 2005 2006 2007 2008 1/ 2009 1/ 2010 1/
Public finances 6/ 7/ General government Expenditure 1,031 1,049 1,041 1,050 1,052 1,069 1,097 1,129 1,152 (In percent of GDP) 48.1 48.5 47.1 46.8 45.3 44.1 44.0 45.2 45.4 Revenue 953 962 958 976 1,016 1,065 1,098 1,102 1,108 (In percent of GDP) 44.4 44.5 43.3 43.5 43.8 43.9 44.0 44.1 43.7
Overall balance -78 -87 -84 -74 -36 -4 1 -27 -45 (In percent of GDP) -3.7 -4.0 -3.8 -3.3 -1.5 -0.2 0.0 -1.1 -1.8 Structural balance -62 -70 -57 -52 -28 -5 -11 -16 -24 (In percent of potential GDP) -2.9 -3.2 -2.6 -2.3 -1.2 -0.2 -0.5 -0.6 -1.0
Federal government Overall balance -36 -40 -51 -57 -30 -19 -15 -30 -41 (In percent of GDP) -1.7 -1.8 -2.3 -2.6 -1.3 -0.8 -0.6 -1.2 -1.6 General government debt 1,278 1,358 1,430 1,489 1,533 1,575 1,706 1,802 1,847 (In percent of GDP) 59.6 62.8 64.7 66.4 66.0 65.0 68.4 72.1 72.8
Balance of payments Trade balance 8/ 124.2 118.8 139.6 144.4 146.3 189.2 204.6 195.5 187.5 Services balance -35.7 -34.5 -29.3 -24.9 -15.6 -16.3 -15.8 -20.8 -23.6 Factor income balance -18.0 -15.1 20.4 25.7 37.6 42.0 26.6 13.0 10.6 Net private transfers -15.7 -15.2 -16.7 -17.6 -14.4 -16.1 -19.5 -19.5 -19.8 Net official transfers -11.8 -10.0 -11.2 -11.0 -12.5 -14.5 -13.0 -13.0 -13.2 Current account 43.0 44.0 102.9 116.6 141.5 184.2 182.9 155.1 141.4 (In percent of GDP) 2.0 2.0 4.7 5.2 6.1 7.6 7.3 6.2 5.6 Foreign exchange reserves (e. o. p.) 9/ 40.5 32.5 29.3 33.7 28.6 27.7 32.0 ... ...
Monetary data Money and quasi-money (M3) 10/ 11/ ... 3.5 2.2 5.2 4.9 10.6 10.1 ... ... Credit to private sector 10/ 0.9 0.0 -0.2 2.2 3.5 3.2 6.3 ... ...
Interest rates Three-month interbank rate 12/ 3.3 2.3 2.1 2.1 3.7 4.8 5.1 ... ... Yield on ten-year government bonds 12/ 4.8 4.1 4.1 3.6 3.8 4.3 4.0 ... ...
Exchange rates Euro per US$ (annual average) 12/ 1.06 0.88 0.80 0.80 0.80 0.73 0.75 ... ... Nominal effective rate (1990=100) 13/ 104.7 112.6 115.7 114.7 114.9 119.7 117.5 ... ... Real effective rate (1990=100) 14/ 101.4 105.9 105.5 102.2 99.1 97.9 94.0 ... ...
6/ Data for federal government are on an administrative basis. Data for the general government are on a national accounts basis.
8/ Including supplementary trade items. 9/ Data for 2008 refer to October. 10/ Data for 2008 refer to the change to September. 11/ Data reflect Germany's contribution to M3 of the euro area; data not shown for 2002 because of a series break. 12/ Data for 2008 refer to October. 13/ Data for 2008 refer to October. 14/ Based on relative normalized unit labor cost in manufacturing. Data for 2008 refer to October.
Debt data are end-of-year data for the general government in accordance with Maastricht 7/ Government expenditure in 2000 includes, as a negative entry, the proceeds from the sales of mobile phone licenses of euro 50.8 billion (2.5 percent of GDP). The proceeds also affect the financial (but not structural) balances and the government
Table 1. Germany: Selected Economic Indicators (concluded)
(In billions of Euros, unless otherwise indicated)
(Percentage change)
(Period average in percent)

38
BIS 2/
Total LoansCredit
Derivatives
Share of Credit
Derivatives
All countries 4,135.7 5,561.7 4,619.3 942.4 16.9in percent of total assets 36.6 49.2 40.9 8.3in percent of GDP 165.4 222.4 184.7 37.7
Mature market countries 3,690.0 4,934.8 4,072.7 862.1 17.5in percent of total assets 32.6 43.6 36.0 7.6in percent of GDP 147.6 197.3 162.9 34.5
Emerging market countries 445.7 584.1 539.9 44.2 7.6in percent of total assets 3.9 5.2 4.8 0.4in percent of GDP 17.8 23.4 21.6 1.8
Africa & Middle East 61.0 73.9 69.4 4.5 6.1(in percent of total assets) 0.5 0.7 0.6 0.0
of which:Egypt 4.7 5.6 5.6 0.1 0.9Liberia 9.2 9.3 9.2 0.1 1.2South Africa 7.5 7.9 6.9 1.1 13.5Saudi Arabia 3.1 5.7 5.3 0.4 6.8United Arab Emirates 10.9 12.5 11.6 1.0 7.8
Asia & Pacific 115.7 127.5 110.8 16.8 13.2(in percent of total assets) 1.0 1.1 1.0 0.1
of which:China 25.0 28.6 26.1 2.5 8.8India 23.2 26.6 23.7 2.9 10.8Indonesia 7.1 7.6 7.3 0.2 3.2South Korea 29.6 36.6 29.7 6.9 18.8Taiwan, China 5.6 4.6 3.7 0.9 19.8
Central and Eastern Europe 229.0 196.7 186.3 10.4 5.3(in percent of total assets) 2.0 1.7 1.6 0.1
of which:Czech Republic 15.3 16.4 14.8 1.6 9.8Hungary 36.6 41.1 39.9 1.2 2.9Latvia 4.5 5.4 5.3 0.2 3.1Lithuania 4.6 4.2 4.2 0.0 0.1Poland 48.4 73.2 71.5 1.7 2.3Romania 5.2 6.1 6.1 0.1 0.9Russia 51.2 66.6 63.5 3.1 4.7Slovakia 4.0 4.7 4.5 0.2 5.2Turkey 18.8 31.0 27.1 3.9 12.6Ukraine 5.7 6.5 6.5 0.0 0.4
Latin America/Caribbean 40.0 186.0 173.4 12.5 6.7(in percent of total assets) 0.4 1.6 1.5 0.1
of which:Argentina 2.9 4.1 4.0 0.1 3.5Brazil 18.0 19.8 17.5 2.4 12.0Chile 6.2 8.7 7.0 1.7 19.3Mexico 8.4 11.2 8.7 2.5 22.4Venezuela 1.1 2.2 1.9 0.3 13.2
Memorandum items:Total bank assets 11,305.9Nominal GDP 2,500.8
*projected based on historical trend. 1/ Foreign claims include all international claims plus local claims of foreign affiliates in local currency. The difference between the claims to all countries and the sum of mature and emerging market exposures is due to offshore center exposures. 2/ BIS data is based on the consolidated lending statistic compiled by the Bundesbank (end-Sept. 2008). 3/ The data are derived from the "Groß- und Millionenkreditmeldung" stipulated in §§ 13 and 14 KWG (Credit Services Act). Under the Credit Services Act, debtors are obliged to register all loans (and other credit-like obligations) of EUR 1.5 million or higher with the Bundesbank on a quarterly basis. In this context, the definition of credit also included equity and counterparty risk exposure from credit default swaps (CDS). Specific details on the obligation to register are stipulated in the Groß- und Millionenkreditverordnung (GroMikV). Credit derivative exposures are recorded as off-shore transactions at their nominal value if available, otherwise the book value applies. The presented data reflect gross amounts without recognition of collateral.
Bundesbank Credit Registry 3/
Sources: BIS, Deutsche Bundesbank, ECB, IMF staff estimates.
Table 2. Germany: foreign claims of banks on individual countries, November 2008 1/(In billions of US dollars; unless otherwise specified)

39
Table 3. Germany: The Core Set of Financial Soundness Indicators for Banks, 1999-2007(In percent)
1999 2000 2001 2002 2003 2004 2005 2006 2007
Capital adequacyRegulatory capital to risk-weighted assets 10.8 10.9 11.2 11.9 12.4 12.4 12.2 12.5 12.9
Commercial banks 10.9 11.3 12.0 12.7 12.8 12.5 11.6 12.5 13.3Landesbanken 9.9 10.0 10.4 11.5 13.0 12.2 12.1 11.7 11.6Savings banks 10.8 10.6 10.7 11.1 11.4 12.0 12.5 13.0 13.0Credit cooperatives 11.1 11.0 10.9 10.9 11.6 12.0 12.1 12.2 12.9
Regulatory Tier I capital to risk-weighted assets 1/ 6.9 7.0 7.2 7.8 8.2 8.0 8.0 8.2 8.5Commercial banks 7.3 7.6 8.2 8.7 9.0 8.3 7.9 8.4 10.6Landesbanken 5.6 5.5 5.8 7.0 7.8 7.1 7.3 7.1 7.1Savings banks 7.0 6.9 7.0 7.2 7.4 7.7 8.0 8.4 8.4Credit cooperatives 7.2 7.3 7.3 7.5 8.0 8.3 8.5 9.1 8.7
Asset composition and qualitySectoral distribution of loans to total loans
Loan to households 31.2 30.6 29.7 29.5 29.7 29.3 28.5 27.6 25.6Commercial banks 31.0 29.2 27.5 26.8 26.1 25.8 24.8 23.9 21.8Landesbanken 8.3 8.2 7.9 7.5 7.5 7.1 6.8 6.2 5.2Savings banks 63.8 63.6 62.4 61.9 62.9 62.3 62.2 61.1 58.2Credit cooperatives 66.6 68.0 66.4 67.0 68.1 68.3 69.3 68.5 66.3
Loans to non-financial corporations 17.3 17.4 17.1 16.6 16.0 15.2 14.5 14.3 14.1Commercial banks 22.3 20.7 19.3 17.7 15.6 14.3 13.3 12.6 12.4Landesbanken 18.9 19.5 19.7 18.9 18.5 17.8 16.7 17.0 16.2Savings banks 17.7 18.5 18.8 18.6 18.3 18.0 17.6 17.3 17.6Credit cooperatives 13.0 13.6 13.4 13.2 12.9 12.4 12.0 12.1 12.4
NPLs to gross loans 4.1 4.6 4.5 5.0 5.2 4.9 4.0 3.4 2.7Commercial banks 5.0 5.7 5.2 5.2 5.1 4.5 3.3 2.6 1.8Landesbanken 2.5 2.7 2.8 3.7 4.4 4.1 2.9 2.0 1.5Savings banks 5.7 5.6 5.9 6.4 6.8 6.9 6.6 5.9 5.1Credit cooperatives 6.4 6.9 7.2 8.0 8.1 8.2 7.3 6.6 5.5
NPLs net of provisions to capital 38.6 44.0 45.4 47.8 50.4 44.5 34.6 28,6** 22.7Commercial banks 38.5 40.7 51.2 47.2 54.5 41.2 30.6 24,6** 15.5Landesbanken 2/ 26.0 29.6 27.9 31.6 34.9 37.4 25.0 16.1a) 11.3Savings banks 51.6 49.2 52.1 53.6 58.0 54.2 50.4 43,6** 35.4Credit cooperatives 49.7 51.9 53.5 61.0 58.3 57.2 49.0 43.0 35.9
Earnings and profitabilityReturn on average assets (after-tax) 0.2 0.2 0.2 0.1 -0.1 0.1 0.3 0.3 0.2
Commercial banks 0.3 0.3 0.2 0.0 -0.3 -0.1 0.5 0.3 0.5Landesbanken 0.1 0.1 0.1 0.1 -0.2 0.0 0.2 0.3 0.0Savings banks 0.2 0.3 0.2 0.2 0.2 0.2 0.3 0.2 0.2Credit cooperatives 0.2 0.2 0.2 0.3 0.3 0.3 0.5 0.5 0.3
Return on average equity (after-tax) 6.5 6.1 4.6 2.9 -1.5 1.9 9.2 7.5 4.7Commercial banks 7.0 7.3 4.2 0.0 -6.6 -1.4 15.5 9.1 15.6Landesbanken 5.9 4.2 4.0 1.9 -5.2 -0.8 5.6 9.7 0.9Savings banks 6.1 6.1 5.1 4.7 4.0 5.0 5.6 5.0 4.2Credit cooperatives 4.7 4.1 4.4 6.6 5.2 5.3 9.0 8.5 5.1
Interest margin to gross income 73.2 67.8 69.8 73.4 70.2 73.5 68.2 68.2 72.9Commercial banks 61.7 52.7 56.2 63.7 56.5 64.9 55.3 61.8 66.3Landesbanken 77.6 72.4 75.0 75.8 79.0 79.4 83.2 70.3 91.6Savings banks 81.3 80.9 80.8 81.3 80.6 79.6 79.0 77.7 75.1Credit cooperatives 77.1 76.5 78.3 79.1 75.4 75.5 74.7 65.3 71.3
Noninterest expenses to gross income 66.0 68.4 71.4 67.2 66.5 65.5 61.0 62.3 65.0Commercial banks 73.9 75.4 80.4 74.2 74.0 73.5 59.8 66.0 65.5Landesbanken 54.8 55.9 57.1 56.1 53.1 53.5 59.3 53.6 61.3Savings banks 65.7 68.9 69.9 66.5 66.4 64.9 66.0 65.8 69.5Credit cooperatives 71.2 74.5 76.7 73.1 69.6 68.7 70.0 64.3 70.5
LiquidityLiquid assets to total short-term liabilities 2/ ... 120.9 121.1 121.0 123.5 124.4 122.0 120.9 119.4
Commercial banks ... 109.0 111.0 110.9 111.7 110.2 110.7 111.8 113.0Landesbanken ... 110.2 104.0 107.1 115.5 129.9 122.4 118.8 115.5Savings banks ... 202.5 212.6 211.6 207.8 221.6 224.2 206.9 190.9Credit cooperatives ... 178.8 184.0 193.4 189.6 193.4 181.4 174.8 167.1
Sensitivity to market risk Net open positions in FX to capital 11.3 11.0 10.7 11.4 6.7 6.9 6.9 6.7 6.9
Commercial banks 11.9 7.3 7.2 5.2 6.1 4.4 5.7 10.1 6.2Landesbanken 10.1 11.7 11.6 14.7 4.6 6.7 5.6 4.2 6.6Savings banks 11.9 13.6 14.3 13.8 12.2 11.1 11.7 10.1 10.9Credit cooperatives 19.7 21.8 21.7 20.8 16.1 15.6 14.0 11.3 10.7
* A methodological break in the supervisory time series on the capital adequacy of German banks has taken place in 2007 due to substantial changes in the regulatory reporting framework, following Basel II.
a) Due to one off data availability, comparability of 2006 data with other years limited.
1/ 1998-2006 according to Capital Adequacy Regulation, Principle I. Since 2007 according to Solvency Regulation.
Source: Deutsche Bundesbank. The authorities provide annual data only and disseminate them once a
** Revised data.2/ 2000-2007 data compiled in accordance with IMF's FSI Compilation Guide. Data not available before July 1, 2000.

40
Table 4. Germany: Encouraged and Other Financial Soundness Indicators, 1999-2007(In percent, unless otherwise indicated)
1999 2000 2001 2002 2003 2004 2005 2006 2007
Corporate sectorTotal debt to equity 1/ 81.0 98.0 106.5 153.6 131.6 121.8 111.6 103.2 96.5Total debt to GDP 2/ 145.5 160.7 163.4 165.9 164.1 155.1 153.7 155.4 158.0Return on invested capital 3/ 4/ 6.5 6.3 7.4 8.7 8.3 8.9 9.0 8.6 8.5Earnings to interest and principal expenses 1/ 5/ 561.9 495.6 513.8 536.9 570.8 715.3 748.1 762.0 756.0Number of applications for protection from creditors 1/ 6/ 18,006 18,389 21,019 23,642 23,840 22,474 19,540 16,408 13,599
Deposit-taking institutionsCapital to assets 3.7 3.7 3.8 4.1 4.2 4.0 4.1 4.3 4.3
Commercial banks 5.0 4.7 4.9 5.2 5.0 4.4 4.4 4.4 4.3Landesbanken 3.3 3.4 3.8 3.8 4.0 4.0 4.0 3.9 3.8Savings banks 3.8 3.9 4.0 4.2 4.3 4.5 4.6 4.8 5.0Credit cooperatives 4.6 4.9 4.7 4.9 5.1 5.3 5.4 5.7 5.5
Geographical distribution of loans to total loansGermany 85.4 83.6 81.3 80.0 78.6 76.8 75.2 72.6 71.1EU-member countries 8.6 9.6 11.6 13.2 14.6 16.9 17.3 19.5 20.4Others 6.0 6.8 7.1 6.8 6.8 6.3 7.5 7.9 8.5
FX loans to total loans 7.8 9.3 10.2 9.6 9.1 9.6 10.2 10.5 11.5 Personnel expenses to noninterest expenses 54.8 54.1 53.1 53.1 53.8 54.4 55.1 56.4 54.7
Commercial banks 51.3 50.4 49.2 48.5 49.4 49.7 50.7 52.5 51.7Landesbanken 51.0 51.9 49.8 49.6 49.0 50.2 50.5 55 51.7Savings banks 59.9 60.0 59.3 59.5 60.6 61.3 61.8 61.5 58.5Credit cooperatives 58.5 57.8 58.4 59.0 59.0 59.2 60.1 60.9 59.8
Trading and fee income to total income 26.8 32.2 30.2 26.6 29.8 26.5 31.8 31.8 27.1Commercial banks 38.3 47.3 43.8 36.3 43.5 35.1 44.7 38.2 33.7Landesbanken 22.4 27.6 25.0 24.2 21.0 20.6 16.8 29.7 8.4Savings banks 18.7 19.1 19.2 18.7 19.4 20.4 21.0 22.3 24.9Credit cooperatives 22.9 23.5 21.7 20.9 24.6 24.5 25.3 34.7 28.7
Customer deposits to total (non-interbank) loans 63.5 63.9 64.0 65.4 67.1 70.0 71.8 75.2 76.2Commercial banks 62.6 63.0 68.6 74.2 78.4 85.3 85.5 95.7 92.6Landesbanken 35.2 38.4 34.3 30.1 32.8 35.4 40.6 42.9 45.7Savings banks 104.7 101.8 101.1 100.3 99.8 101.0 102.2 103.3 105.4Credit cooperatives 113.6 108.0 110.3 110.8 111.7 113.2 113.6 113.1 114.7
Spread between highest and lowest interbank rates 7/ … … … … ... ... 2.0 2.6 4.6Spread between reference loan and deposit rates 8/ … … … … 379 366 353 317 285
Insurance sectorSolvency ratio, Life … … 199 170 176 177 190 203.8 n.a.Solvency ratio, Non-life … 350 343 337 346 286 255 310.7 n.a.Return on average equity, Life 9/ 11.4 12.5 7.0 3.4 5.7 5.8 9.7 9.5 n.a.Return on average equity, Non-life 9/ 7.3 8.7 8.9 2.8 4.1 3.0 4.5 4.6 n.a.
Market liquidityAverage bid-ask spread in the securities market (government bills) … … … … … … 0.0 0.0 0.0Average bid-ask spread in the securities market (corporate securities) … … … … … … 0.1 0.1 0.1
HouseholdsHousehold debt to GDP 1/ 72.9 73.4 72.7 72.4 72.5 71.2 69.9 67.4 63.8Household debt service and principal payments to income 1/ 5/ 4.7 5.1 5.0 4.7 4.2 3.9 3.7 3.8 4.1
Real estate marketsReal estate prices, new dwellings 10/ 99 100 101 102 100 100 100 101 102Real estate prices, resale 10/ 108 108 108 105 104 102 100 100 100Residential real estate loans to total loans 16.2 16.4 16.1 16.2 18.0 17.8 17.8 17.7 16.5Commercial real estate loans to total loans 6.4 6.4 6.2 6.2 6.6 6.4 6.1 5.8 5.4
2/ Total debt to corporate gross value added.
8/ Spread in basis points.9/ Profits after tax devided by equity.10/ Residential property index (yearly average, 2005 = 100); aggregation of data for new dwellings and resale is not available.
4/ Invested capital estimated as balance sheet total less other accounts payable (AF.7 according to ESA 1995).5/ Excluding principal payments.6/ Resident enterprises that filed for bankruptcy.7/ Spread between highest and lowest three month money market rates as reported by Frankfurt banks (basis points).
3/ Return defined as net operating income less taxes, where net operating income and taxes are
Source: Deutsche Bundesbank. The authorities provide annual data only and disseminate them once a year.1/ Indicator compiled according to definitions of the Compilation Guide on FSIs.
compiled according to the FSI Compilation Guide.

41
2005 2006 2007 2008 2009 2010 2011 2012 2013
Current account 117 141 184 183 155 141 144 159 180 In percent of GDP 5.2 6.1 7.6 7.3 6.2 5.6 5.5 6.0 6.5
Trade balance 144 146 189 205 196 187 189 205 233 Exports 791 904 987 1,039 1,031 1,077 1,135 1,214 1,317 Imports -646 -758 -798 -835 -835 -890 -946 -1,009 -1,084 Nonfactor services -25 -16 -16 -16 -21 -24 -26 -29 -34 Exports 134 152 161 162 159 166 175 187 203 Imports -159 -168 -178 -178 -180 -190 -201 -216 -237 Balance on Factor Income 26 38 42 27 13 11 15 16 14 Credit 161 195 232 207 180 216 239 248 254 Debit -135 -158 -190 -180 -167 -206 -224 -232 -240 Current transfers, net -29 -27 -31 -33 -33 -33 -34 -32 -33 Capital and financial accounts -136 -156 -225 -183 -155 -141 -144 -159 -180 Capital account, net -1 0 0 0 0 0 0 0 FDI, net -22 -32 -85 -57 -33 -27 -27 -28 -29 Portfolio investment, net -40 -17 63 65 65 66 68 70 7 Other -75 -111 -203 -191 -187 -181 -184 -201 -223 Reserve assets 2 3 -1 0 0 0 0 0
Errors and omissions 19 15 41 0 0 0 0 0
Source: WEO.
Projections
(In billions of Euros, unless otherwise indicated)
Table 5. Germany: Medium-Term Balance of Payments, 2005-13
0
2
0
0
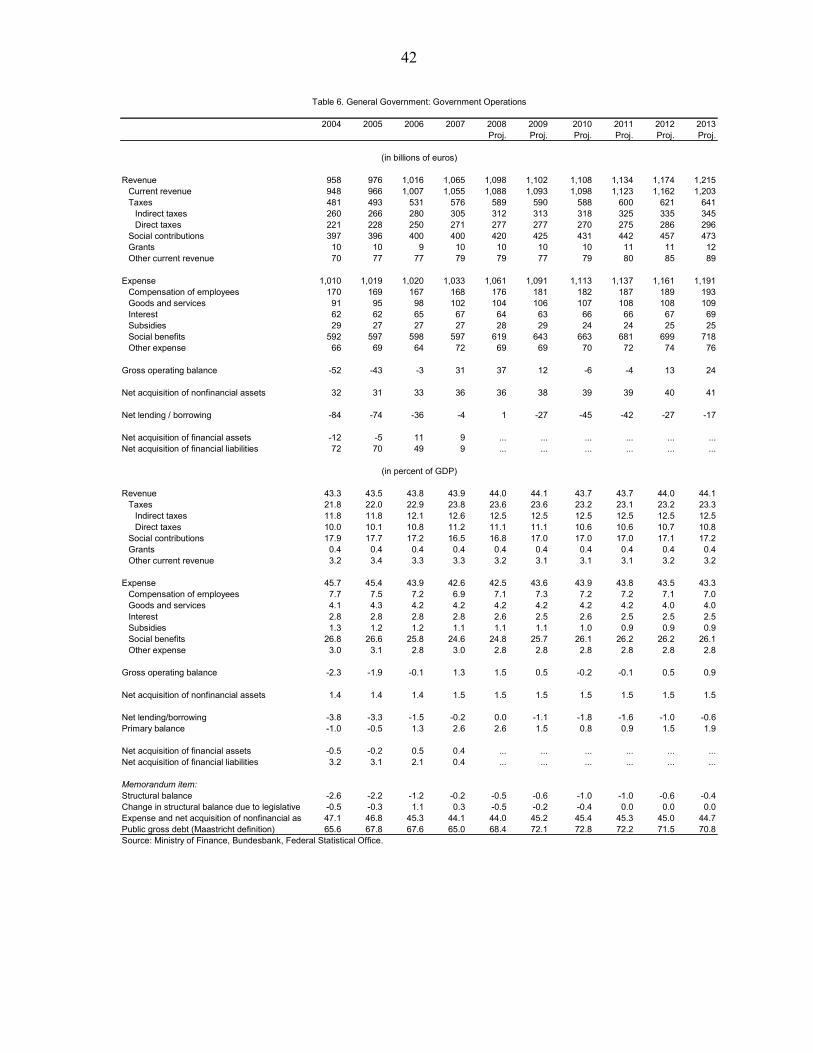
42
2004 2005 2006 2007 2008 2009 2010 2011 2012 2013Proj. Proj. Proj. Proj. Proj. Pro
Revenue 958 976 1,016 1,065 1,098 1,102 1,108 1,134 1,174 1,215Current revenue 948 966 1,007 1,055 1,088 1,093 1,098 1,123 1,162 1,203Taxes 481 493 531 576 589 590 588 600 621 641
Indirect taxes 260 266 280 305 312 313 318 325 335 345Direct taxes 221 228 250 271 277 277 270 275 286 296
Social contributions 397 396 400 400 420 425 431 442 457 473Grants 10 10 9 10 10 10 10 11 11 1Other current revenue 70 77 77 79 79 77 79 80 85 8
Expense 1,010 1,019 1,020 1,033 1,061 1,091 1,113 1,137 1,161 1,191Compensation of employees 170 169 167 168 176 181 182 187 189 193Goods and services 91 95 98 102 104 106 107 108 108 109Interest 62 62 65 67 64 63 66 66 67 69Subsidies 29 27 27 27 28 29 24 24 25 2Social benefits 592 597 598 597 619 643 663 681 699 718Other expense 66 69 64 72 69 69 70 72 74 7
Gross operating balance -52 -43 -3 31 37 12 -6 -4 13 24
Net acquisition of nonfinancial assets 32 31 33 36 36 38 39 39 40 41
Net lending / borrowing -84 -74 -36 -4 1 -27 -45 -42 -27 -17
Net acquisition of financial assets -12 -5 11 9 ... ... ... ... ... ...Net acquisition of financial liabilities 72 70 49 9 ... ... ... ... ... ...
Revenue 43.3 43.5 43.8 43.9 44.0 44.1 43.7 43.7 44.0 44.1Taxes 21.8 22.0 22.9 23.8 23.6 23.6 23.2 23.1 23.2 23.3
Indirect taxes 11.8 11.8 12.1 12.6 12.5 12.5 12.5 12.5 12.5 12.5Direct taxes 10.0 10.1 10.8 11.2 11.1 11.1 10.6 10.6 10.7 10.8
Social contributions 17.9 17.7 17.2 16.5 16.8 17.0 17.0 17.0 17.1 17.2Grants 0.4 0.4 0.4 0.4 0.4 0.4 0.4 0.4 0.4 0.4Other current revenue 3.2 3.4 3.3 3.3 3.2 3.1 3.1 3.1 3.2 3.2
Expense 45.7 45.4 43.9 42.6 42.5 43.6 43.9 43.8 43.5 43.3Compensation of employees 7.7 7.5 7.2 6.9 7.1 7.3 7.2 7.2 7.1 7.0Goods and services 4.1 4.3 4.2 4.2 4.2 4.2 4.2 4.2 4.0 4.0Interest 2.8 2.8 2.8 2.8 2.6 2.5 2.6 2.5 2.5 2.5Subsidies 1.3 1.2 1.2 1.1 1.1 1.1 1.0 0.9 0.9 0.9Social benefits 26.8 26.6 25.8 24.6 24.8 25.7 26.1 26.2 26.2 26.1Other expense 3.0 3.1 2.8 3.0 2.8 2.8 2.8 2.8 2.8 2.8
Gross operating balance -2.3 -1.9 -0.1 1.3 1.5 0.5 -0.2 -0.1 0.5 0.9
Net acquisition of nonfinancial assets 1.4 1.4 1.4 1.5 1.5 1.5 1.5 1.5 1.5 1.5
Net lending/borrowing -3.8 -3.3 -1.5 -0.2 0.0 -1.1 -1.8 -1.6 -1.0 -0.6Primary balance -1.0 -0.5 1.3 2.6 2.6 1.5 0.8 0.9 1.5 1.9
Net acquisition of financial assets -0.5 -0.2 0.5 0.4 ... ... ... ... ... ...Net acquisition of financial liabilities 3.2 3.1 2.1 0.4 ... ... ... ... ... ...
Memorandum item:Structural balance -2.6 -2.2 -1.2 -0.2 -0.5 -0.6 -1.0 -1.0 -0.6 -0.4Change in structural balance due to legislative -0.5 -0.3 1.1 0.3 -0.5 -0.2 -0.4 0.0 0.0 0.0Expense and net acquisition of nonfinancial as 47.1 46.8 45.3 44.1 44.0 45.2 45.4 45.3 45.0 44.7Public gross debt (Maastricht definition) 65.6 67.8 67.6 65.0 68.4 72.1 72.8 72.2 71.5 70.8Source: Ministry of Finance, Bundesbank, Federal Statistical Office.
Table 6. General Government: Government Operations
(in billions of euros)
(in percent of GDP)
j.
29
5
6

43
2004 2005 2006 2007 2008 2009 2010 2011 2012 2013Proj. Proj. Proj. Proj. Proj. Proj. Proj. Proj.
Net financial worth -1,047 -1,116 -1,117 -1,080 … … … … … …
Financial assets 466 475 494 508 … … … … … …Currency and Deposits 148 154 190 201 … … … … … …Securities and shares 149 165 175 178 … … … … … …Loans 73 65 60 59 … … … … … …Other assets 96 91 69 71 … … … … … …
Financial liabilities 1,513 1,592 1,611 1,588 … … … … … …Currency and deposits 6 6 6 7 … … … … … …Securities and shares 1,049 1,126 1,151 1,152 … … … … … …Loans 455 456 449 426 … … … … … …Other liabilities 4 4 4 4 … … … … … …
Transactions, net -84 -76 -38 0 … … … … … …
Financial assets -12 -5 11 9 … … … … … …Currency and Deposits -5 5 36 10 … … … … … …Securities and shares -7 3 0 2 … … … … … …Loans -7 -7 -5 -1 … … … … … …Other assets 7 -6 -20 -2 … … … … … …
Financial liabilities 72 70 49 9 … … … … … …Currency and deposits 1 1 1 1 … … … … … …Securities other than shares 69 70 53 30 … … … … … …Loans 1 1 -6 -22 … … … … … …Other liabilities 1 -1 2 0 … … … … … …
Other economic flows, net -20 6 37 37 … … … … … …
Financial assets 7 14 7 6 … … … … … …Currency and Deposits -1 0 0 1 … … … … … …Securities and shares 6 13 9 1 … … … … … …Loans 0 0 -1 0 … … … … … …Other assets 2 1 -1 3 … … … … … …
Financial liabilities 27 8 -30 -31 … … … … … …Currency and deposits 0 0 0 0 … … … … … …Securities other than shares 29 8 -28 -29 … … … … … …Loans -1 0 0 -1 … … … … … …Other liabilities -1 1 -2 -1 … … … … … …
Net financial worth -47.4 -49.8 -48.1 -44.6 … … … … … …
Financial assets 21.1 21.2 21.3 21.0 … … … … … …Currency and Deposits 6.7 6.8 8.2 8.3 … … … … … …Securities and shares 6.7 7.4 7.5 7.3 … … … … … …Loans 3.3 2.9 2.6 2.4 … … … … … …Other assets 4.4 4.1 3.0 2.9 … … … … … …
Financial liabilities 68.4 70.9 69.4 65.6 … … … … … …Currency and deposits 0.2 0.3 0.3 0.3 … … … … … …Securities other than shares 47.4 50.2 49.6 47.5 … … … … … …Loans 20.6 20.3 19.4 17.6 … … … … … …Other liabilities 0.2 0.2 0.2 0.1 … … … … … …
Transactions, net -3.8 -3.4 -1.6 0.0 … … … … … …
Financial assets -0.5 -0.2 0.5 0.4 … … … … … …Financial liabilities 3.2 3.1 2.1 0.4 … … … … … …
Other economic flows, net -0.9 0.3 1.6 1.5 … … … … … …
Financial assets 0.3 0.6 0.3 0.2 … … … … … …Financial liabilities 1.2 0.3 -1.3 -1.3 … … … … … …
Source: Ministry of Finance, Bundesbank, Federal Statistical Office.
(in billions of euros)
(in percent of GDP)
Table 6. General Government: Balance Sheet (concluded)

44
2009 2010October package
Increased health insurance contribution from 14.9 percent to 15.5 percent of gross wages--tax on employers' portion
265 530
Personal income tax deductibility of 20 percent of cost of household help 80Personal income tax deductibility of health care contributions 7820Increased child benefit by Euro 10 (Euro 16 for third child and more) and child tax deduction to Euro 6000 from Euro 5808
2275 2145
School start benefit of Euro 100 for first graders of parents who are social assistance recipients
140 140
Reduction in unemployment contribution from 3.3 to 2.8 percent 4000 3200
November packageTransport investment (water, rail, road) 1000 1000Income tax deductibility of handimen services 900Subsidy for energy-efficient building (expansion of existing KfW program) 42 220Other KfW-programs incl. regional lending for investment purposes 73 76Degressive depreciation of 25 percent of investment in immovables 1940 4325Temporary suspension of car excise tax to end-June 2009 380 135Temporary special depreciation of capital market investment 235 370Increased funds for Joint Taskforce for Improvement of Regional Economic Structure
200 100
Extension of short-term labor benefit from 12 to 18 months 300 300
Contractionary measures (October 2008 package)Reduction in unemployment contribution from 3.3 to 2.8 percent of gross wages--tax on employers' portion
-65 -210
Increased health insurance contribution from 14.9 percent to 15.5 percent of gross wages
-6000 -6000
Net fiscal stimulus 4785 14831 (in percent of GDP) 0.2 0.6
(in millions of euros; unless otherwise specified)Table 7. Expenditures under the Authorities' Stimulus Packages, October and November, 2008

45
ANNEX I. Germany: Fund Relations
(As of November 30, 2008) • Mission: November 12 to 24, 2008 in Frankfurt, Bonn, and Berlin. The concluding statement
of the mission is available at http://www.imf.org/external/np/ms/2008/112408.htm.
• Staff team: Mr. Mody (Head), Mmes. Carare, and Ohnsorge, (EUR) and Messrs. Seelig and Jobst (MCM), Mr. Stehn (FAD), and Ms. Luedersen (LEG).
• Country interlocutors: The Bundesbank President Weber, Federal Financial Supervisory Authority (BaFin) President Sanio, State Secretaries Asmussen (Finance), and Pfaffenbach (Economy), members of the German Council of Economic Experts, and senior representatives at the Chancellery, several ministries, the Bundesbank, and BaFin. Mr. von Stenglin, the Alternate Executive Director for Germany, also participated in the discussions. Meetings took place with parliamentarians, Länder representatives, labor unions, employers, research institutes, and financial market participants.
• Fund relations: The previous Article IV consultation took place on February 22, 2008. The associated Executive Board’s assessment and staff report are available at http://www.imf.org/external/pubs/cat/longres.cfm?sk=21759.0.
I. Membership Status: Joined August 14, 1952. II. General Resources Account: SDR Million % Quota Quota 13,008.20 100.00 Fund holdings of currency 11,461.65 88.11 Reserve position in Fund 1,546.61 11.89 III. SDR Department: SDR Million % Allocation Net cumulative allocation 1,210.76 100.00 Holdings 1,426.90 117.85 IV. Outstanding Purchases and Loans: None V. Financial Arrangements: None VI. Projected Payments to Fund: (SDR Million; based on existing use of resources and present holdings of SDRs):

46
Forthcoming 2008 2009 2010 2011 2012
Principal -- -- -- -- -- Charges/Interest __-- 0.09 0.09 0.09 0.09 Total 0.09 0.09 0.09 0.09 0.09
VII. Exchange Rate Arrangement: Germany’s currency is the euro, which floats freely and independently against other currencies. Germany is an Article VIII member and maintains an exchange system free of restrictions on payments and transfers for current international transactions. It maintains measures adopted for security reasons, which have been notified to the Fund for approval in accordance with the procedures of Decision 144 and does so solely for the preservation of national or international security. VIII. Anti-Money Laundering/Combating the Financing of Terrorism (AML/CFT) The authorities have moved towards a more risk-based approach, in which the intensity of audits and inspections should reflect institutions' AML/CFT risk. A dialogue with the associations of certified public accountants and other auditors has led to a revised AML/CFT assessment methodology in 2005. Legal revisions also granted the BaFin the power to freeze funds without a court order or other involvement of prosecution authorities if facts suggest that funds serve the purpose of terrorist financing. BaFin can now also require financial holding groups and financial conglomerates to develop a coordinated risk management approach for the whole group. An assessment under the international standard for AML/CFT will be conducted by the Fund's Legal Department in May 2009. The assessment will address, amongst other matters, improvements of AML/CFT laws concerning non-bank financial institutions and concerns surrounding remittance flows either through or from Germany to allegedly fund terrorist activity. IX. Staff Analytical Work on Germany, 2003-08 Growth and Competitiveness
• Growth Linkages within Europe, IMF Country Report No. 08/81. • Economic Impact of Shortages of Skilled Labor in Germany, IMF Country Report No.
08/81. • What explains Germany’s Rebounding Export Market Share? CESifo Working Paper
No. 1957. • Long-run Growth in Germany. IMF Country Report No. 06/17. • Does Excessive Regulation Impede Growth in Germany? IMF Country Report
No. 06/17.

47
• The Performance of Germany’s Non-Financial Corporate Sector – An International
Perspective. IMF Country Report No. 06/17. • Investment Trends in OECD Countries: Long-Term Developments and Future
Prospects. IMF Country Report No. 04/340. • Does PPP hold in the Long Run? Germany and Switzerland. IMF Country Report No.
04/340. • Business Investment in the Current Cycle. IMF Country Report No. 03/342.
Inflation • Inflation Smoothing and the Modest Effect of VAT in Germany, IMF Working Paper
No. 08/175.
Fiscal Policy and Entitlement Programs
• Tax Reform and Debt Sustainability in Germany: An Assessment Using the Global Fiscal Model. IMF Country Report No. 06/436.
• Business Tax Reform. IMF Country Report No. 06/436. • Why is Germany’s Deficit so Large?, IMF Country Report No. 06/17. • A Preliminary Public Sector Balance Sheet for Germany, IMF Country Report
No. 06/17. • Germany: A Long-Run Fiscal Scenario Based on Current Policies, IMF Country
Report No. 06/17. • Pensions and Growth. IMF Country Report No. 04/340. • Federalism and the Political Economy of Adjustment. IMF Country Report No.
04/340.
Labor Markets
• The Employment Effects of Labor and Product Markets Deregulation and their Implications for Structural Reform. CESifo Working Paper No 1709, May 2006.
• Employment, Unemployment, and Labor Supply in Germany. IMF Country Report No. 04/340.
• The Unbearable Stability of the German Wage Structure: Evidence and Interpretation. IMF Staff Papers, August 2004.
The Financial System
• Landesbanken: A Measure of the Costs for Taxpayers. IMF Country Report No. 06/436.
• The German Banking Sector: Credit Decline, Soundness and Efficiency. IMF Country Report No. 06/17.
• Germany’s Three-Pillar Banking System. IMF Occasional Paper 233 (2004). • Germany’s Financial System: International Linkages and the Transmission of
Financial Shocks. IMF Country Report No. 03/342.
Corporate Governance • Germany’s Corporate Governance Reforms: Has the System Become Flexible
Enough?, IMF Working Paper No. 08/179.

48
ANNEX II. Germany: Statistical Issues Data provision is adequate for surveillance. Germany has a full range of statistical publications and subscribes to the Fund’s Special Data Dissemination Standard (SDDS). A ROSC Data Module report was published in January 2006. The authorities make substantial use of the Internet to facilitate on-line access to data and press information. Germany adopted the European System of Integrated Economic Accounts 1995 (ESA95) in 1999. The 2005 ROSC Data Module mission found that the macroeconomic statistics generally follow internationally accepted standards and guidelines on concepts and definitions, scope, classification and sectorization, and basis for recording. However, the sources for estimating value added for a few categories of service industries could be improved. A direct source for quarterly changes in inventories, which is an important contributor to short-term deviation in the trend GDP growth rate, is lacking. There is no systematic, proactive process to monitor the ongoing representativeness of the samples of local units and products between rebases of the producer price index. Comprehensive data reporting systems support the accuracy and reliability of the government finance and balance of payments statistics. However, although explanatory documentation exists, differences between the general government data in the ESA95 classification and the general government cash data on an administrative basis is impairing fiscal analysis; Germany publishes—through Eurostat—general government revenue, expenditure, and balance on an accrual basis on a quarterly basis (ESA95) and submits annual data for publication in the Government Financial Statistics Yearbook, in GFSM 2001 format. Monthly data are only disseminated on a cash-basis. Germany is participating in the Coordinated Compilation Exercise for financial soundness indicators (FSIs). In 2006, as part of this exercise, the German authorities compiled a comprehensive set of FSI data and metadata.
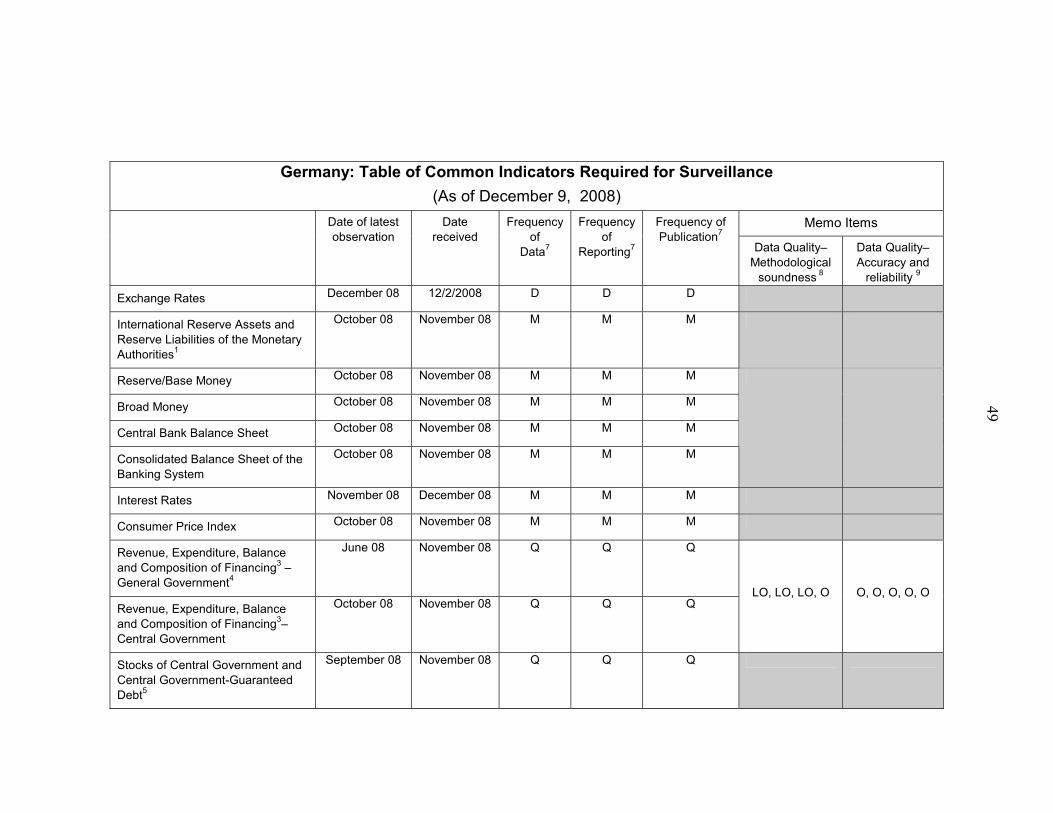
Germany: Table of Common Indicators Required for Surveillance (As of December 9, 2008)
Memo Items Date of latest observation
Date received
Frequency of
Data7
Frequency of
Reporting7
Frequency of Publication7
Data Quality–Methodological
soundness 8
Data Quality–Accuracy and
reliability 9
Exchange Rates December 08 12/2/2008 D D D
International Reserve Assets and Reserve Liabilities of the Monetary Authorities1
October 08 November 08 M M M
Reserve/Base Money October 08 November 08 M M M
Broad Money October 08 November 08 M M M
Central Bank Balance Sheet October 08 November 08 M M M
Consolidated Balance Sheet of the Banking System
October 08 November 08 M M M
Interest Rates November 08 December 08 M M M
Consumer Price Index October 08 November 08 M M M
Revenue, Expenditure, Balance and Composition of Financing3 – General Government4
June 08 November 08 Q Q Q
Revenue, Expenditure, Balance and Composition of Financing3– Central Government
October 08 November 08 Q Q Q
LO, LO, LO, O
O, O, O, O, O
Stocks of Central Government and Central Government-Guaranteed Debt5
September 08 November 08 Q Q Q
49

50
Germany: Table of Common Indicators Required for Surveillance (As of December 9, 2008)
External Current Account Balance September 08 November 08 M M M
Exports and Imports of Goods and Services
September 08 November 08 M M M
O, O, LO, O
O, O, O, O, O
GDP/GNP Q3 08 November 08 Q Q Q O, O, O, O LO, O, O, O, O
Gross External Debt H1 08
November 08 Semi-annual
Semi-annual
Semi-annual
International Investment Position6 Q1 08 July 08
1 Includes reserve assets pledged or otherwise encumbered as well as net derivative positions. 2 Both market-based and officially-determined, including discount rates, money market rates, rates on treasury bills, notes, and bonds. 3 Foreign, domestic bank, and domestic nonbank financing. 4 The general government consists of the central government (budgetary funds, extra budgetary funds, and social security funds) and state and local governments. 5 Including currency and maturity composition 6 Includes external gross financial asset and liability positions vis-a vis nonresidents.
7 Daily (D); weekly (W); monthly (M); quarterly (Q); annually (A); irregular (I); and not available (NA) 8 Reflects the assessment provided in the data ROSC (published on January 18, 2006, and based on the findings of the mission that took place during July 5–20, 2005) for the dataset corresponding to the variable in each row. The assessment indicates whether international standards concerning concepts and definitions, scope, classification/sectorization, and basis for recording are fully observed (O); largely observed (LO); largely not observed (LNO); not observed (NO); and not available (NA). 9 Same as footnote 9, except referring to international standards concerning (respectively) source data, assessment of source data, statistical techniques, assessment and validation of intermediate data and statistical outputs, and revision studies.

INTERNATIONAL MONETARY FUND
GERMANY
Staff Report for the 2008 Article IV Consultation Supplementary Information
Prepared by the European Department
Approved by Marek Belka and Tamim Bayoumi
January 13, 2009
This supplement provides information on economic developments since the staff report was issued. The new information does not alter the thrust of the staff appraisal.
1. Plummeting sentiments and orders have required a large downward revision in GDP growth projections, especially for 2009. A much worse than anticipated fourth quarter is estimated to bring growth in 2008 down to 1.3 percent, as against the WEO November 2008 and staff report projection of 1.7 percent (Text Table). But along with the sharp downturn in global consensus forecasts, the growth projection for Germany in 2009 has been marked down to -2½ percent from -¾ percent.
2. These revisions reflect an extraordinary drop in world trade and a sharp rise in corporate stress. German exports are decelerating rapidly along with world trade. Corporate stress is reflected in increasing bankruptcies and in corporate bond spreads, which shot up after the failure of Lehman Brothers and have remained high despite easing in the credit and money markets. Weakening world trade and corporate stress are feeding on each other worldwide: Germany, with its high dependence on exports, is caught in that spiral. Domestic consumption and investment can be expected to remain weak. The fiscal stimulus (including the likely addition) will help prevent a further weakening of domestic demand, absent which the 2009 outcome would have been dire.
3. Recovery in 2010 is likely to be slow. Assuming that the fiscal stimulus plans—in Germany and also in the United States and China—remain on schedule, they will help the recovery. However, with the continued weakness in corporate balance sheets, the global
2007 2008 2009 2010
Real GDP growth 2.5 1.3 -2.5 0.1Revisions from November 2008 WEO and Staff Report ... -0.4 -1.7 -0.4
Q4 on Q4 growth 1/ 1.7 -1.2 -1.0 0.4
1/ Q4 on Q4 growth rate for 2008 is estimated from the annual average growth rate figure for 2008 released on January 14th 2009,and all figures for 2009 and 2010 are projections.Source: Federal Statistical Office, and IMF staff calculations.
Real GDP Growth Developments and Projections 1/

2
investment cycle is unlikely to resume with sufficient vigor for German exporters to see a strong renewal in orders and for consumers to feel confident about their employment and income prospects.
Source: Bundesbank, IFO, Federal Statistical Office, World Economic Outlook, JPMorgan, Consensus Forecast.
1/ For all charts vertical line indicates information available until the calculation of the November forecast.2/ Real GDP Growth and Projections (year-on-year in percent, left scale) and Corporate Bond Spread (quarterly average, in percentage points, right scale) .
IFO Business Climate index components
75
80
85
90
95
100
105
110
115
120
2004
m1
2004
m5
2004
m9
2005
m1
2005
m5
2005
m9
2006
m1
2006
m5
2006
m9
2007
m1
2007
m5
2007
m9
2008
m1
2008
m5
2008
m9
Expectations
Current situation
Information available until November forecast 1/
Business assessments, especially expectations have steadily declined.
-8
-6
-4
-2
1
3
5
2001
q1
2001
q4
2002
q3
2003
q2
2004
q1
2004
q4
2005
q3
2006
q2
2007
q1
2007
q4
2008
q3
2009
q2
2010
q1
-0.5
0.5
1.5
2.5
3.5
Real GDP growth and projections (left scale; blue - projectionfrom corporate spread, red dotted - WEO projection)
Corporate bond spread (brought forward 1 year, right scale)
Prediction based on bond spreads
Corporate bond spreads are consistent with prolonged weakness.
Real GDP growth, Projections and Corporate Bond Spread 2/
WEO forecast
-2
-1
0
1
2
3
Jan
14, 2
008
Feb
11, 2
008
Mar
10,
200
8
Apr
14,
200
8
May
12,
200
8
Jun
09, 2
008
Jul 1
4, 2
008
Aug
11,
200
8
Sep
08,
200
8
Oct
13,
200
8
Nov
10,
200
8
Dec
08,
200
8
6
7
8
9
10
Euro AreaJapanUSAChina (right scale)
GDP growth (percent)
-7
-4
-1
2
5
8
11
14
17
20
2001
Q1
2001
Q3
2002
Q1
2002
Q3
2003
Q1
2003
Q3
2004
Q1
2004
Q3
2005
Q1
2005
Q3
2006
Q1
2006
Q3
2007
Q1
2007
Q3
2008
Q1
2008
Q3
2009
Q1
2009
Q3
0
1
2
3
4
5
6
Real exports growth (left scale)
World real GDP growth (right scale, November 2008 WEO)
US real GDP growth (right scale, November 2008 WEO)
(Year-on-year percent change)
German exports are set to contract along with world trade.
Global consensus forecasts for 2009 have been sharply lowered.

3
4. The authorities have announced a significant increase in the fiscal stimulus. Under a new package, as widely reported in the press, 50 billion euros are expected to be spent over two years. The additional 0.9 percent of GDP envisaged for 2009 will bring the total stimulus for this year to 1¼ of GDP (Text Table). The Staff Report had recommended a stimulus of 1½ to 2 percent of GDP: but with the dramatic and continuing deterioration in economic prospects, a boost of at least 2 percent of GDP would have been desirable. The reduction in social security contributions is in line with the recommendation of the Staff Report, as is the step up in public infrastructure spending. The commuter subsidy and the cut in personal income tax rates are likely to be less effective, in staff’s view. The total stimulus in 2010 will amount to 0.6 percent of GDP.
5. Support by Soffin has provided stability to the financial system, but further asset quality deterioration will imply continued need for such support. CDS spreads of financial institutions are off their post-Lehman peaks. Bank lending has remained in positive territory. Guarantees issued by Soffin will facilitate rollover of banks’ funding. But funding conditions remain tight, as reflected in the Deutsche Bank decision to pay the penalty required to extend a maturing obligation. Moreover, with deterioration in bank asset quality, capital needs are likely to rise. Commerzbank recently required a second capital injection. In this regard, regular financial reporting of FMSF transactions, including their approval status by the European Commission, would provide transparency and bolster confidence. Finally, the continuing need for support to Landesbanken remains a concern. The burden of this support has appropriately fallen on the states, but the implication is that rationalization of these financial institutions should be high priority.
Average Credit Default Swaps for the Four Financial Institutions in Each Country, (In basis points) 1/
0
25
50
75
100
125
150
175
200
225
250
275
300
325
7/3/
077/
27/0
78/
22/0
79/
17/0
710
/11/
0711
/6/0
711
/30/
0712
/26/
071/
21/0
82/
14/0
83/
11/0
84/
4/08
4/30
/08
5/26
/08
6/19
/08
7/15
/08
8/8/
089/
3/08
9/29
/08
10/2
3/08
11/1
8/08
12/1
2/08
1/7/
09
GermanySwitzerlandUnited KingdomUnited States
CDS spreads of German financial institutions have been lower than in other hot spots.
Source: Bloomberg, and IMF Staff calculations.
1/ Four largest financial institutions for each country are as follows: Germany - Deutsche Bank, Commerzbank AG, Munich Reinsurance, and Bayerische Hypo & Vereinsbank AG. Switzerland - Credit Suisse, Swiss Reinsurance, UBS AG, and Zurich Allied AG. United Kingdom - HBOS, Barclays Bank, HSBC Bank, and Royal Bank of Scotland. United States - Citigroup, Bank of America, JP Morgan Chase, and Wells Fargo & Co.
Until end-November Bank Lending Continued to Grow
-2
0
2
4
6
8
Jan-
00
Jul-0
0
Jan-
01
Jul-0
1
Jan-
02
Jul-0
2
Jan-
03
Jul-0
3
Jan-
04
Jul-0
4
Jan-
05
Jul-0
5
Jan-
06
Jul-0
6
Jan-
07
Jul-0
7
Jan-
08
Jul-0
8
Bank Lending Growth (Nominal Credit to Entreperises and Individuals; Y-o-y percentage change)
2009 2010October and November packages 0.2 0.4Commuter subsidy 0.3 0.0January package* 0.9 0.2Total 1.3 0.6*Assumptions based on news reports.
Increase in General Government Deficit Due to Legislative Measures
(in percent of GDP)

4
GERMANY
2002 2003 2004 2005 2006 2007 2008 1/ 2009 1/ 2010 1/
Real economy (change in percent) Real GDP 0.0 -0.2 1.2 0.8 3.0 2.5 1.3 -2.5 0.1 Total domestic demand -2.0 0.6 -0.1 0.0 2.1 1.1 1.6 -0.1 0.2 CPI (average) 1.4 1.0 1.8 1.9 1.8 2.3 2.8 0.2 0.1 Standardized unemployment rate (in percent) 7.7 8.8 9.2 10.6 9.8 8.4 7.3 8.5 9.1 Employment growth -0.6 -0.9 0.4 -0.1 0.7 1.7 1.5 -0.2 -0.7 Gross national saving (percent of GDP) 20.3 19.9 22.2 22.6 24.3 26.3 25.2 23.6 23.5 Gross domestic investment (percent of GDP) 18.3 17.9 17.5 17.4 18.2 18.7 19.2 20.4 19.8
Public finance (percent of GDP) General government balance -3.7 -4.0 -3.8 -3.3 -1.5 -0.2 -0.1 -3.3 -4.6 General government structural balance -2.9 -3.2 -2.8 -2.3 -1.2 -0.3 -0.3 -2.1 -2.7 General government debt 59.6 62.8 64.7 66.4 66.0 65.0 68.7 76.1 80.1
Money and credit (end of year, percent change) 2/ Credit to private sector 0.9 0.0 -0.2 2.2 3.5 3.2 6.6 ... ... M3 ... 3.5 2.2 5.2 4.9 10.6 11.1 ... ...
Interest rates (percent) Money market rate 3/ 3.3 2.3 2.1 2.1 3.7 4.8 3.4 ... ... Government bond yield 3/ 4.8 4.1 4.1 3.6 3.8 4.3 3.2 ... ... Balance of payments (percent of GDP) Current account balance 2.0 2.0 4.7 5.2 6.1 7.6 6.0 3.3 3.8 Trade balance 5.8 5.5 6.3 6.4 6.3 7.8 7.1 5.0 5.5 Exports 30.2 30.5 33.0 35.2 38.9 40.7 41.5 40.2 41.3 volume (annual percent change) 3.5 3.1 10.6 7.6 12.7 7.7 3.9 -4.9 2.7 Imports 24.4 25.1 26.7 28.8 32.6 32.9 34.5 35.2 35.9 volume (annual percent change) -0.3 6.7 8.6 6.8 13.5 5.1 5.2 1.5 3.2 Net oil imports (billions of US$) 27.9 37.0 42.5 61.4 78.8 79.8 111.1 57.3 68.7
FDI balance 1.7 1.1 -1.1 -1.0 -1.4 -3.5 -2.3 -1.3 -1.0 Official reserves minus gold (billions of US$) 4/ 51.2 50.7 48.8 45.1 41.7 44.3 43.9 ... ...
Exchange rate Exchange rate regime Present rate (January 12, 2009) Nominal effective rate (2000=100) 3/ 102.5 108.4 110.5 110.3 112.3 115.9 115.8 ... ... Real effective rate (2000=100) 5/ 101.4 105.9 105.5 102.2 98.6 98.0 95.1 ... ...
Sources: Deutsche Bundesbank; IMF, International Financial Statistics; IMF, World Economic Outlook; Eurostat; and staff projections.
1/ Staff estimates and projections, if not otherwise indicated.
3/ Data for 2008 refers to December. 4/ Data for 2008 refers to November. 5/ Based on relative normalized unit labor cost in manufacturing. Data for 2008 refers to December. 6/ At risk of poverty rate: cut-off point: 60% of median equivalised income after social transfers.
2/ Reflects Germany's contribution to M3 of the euro area. Data not shown for 2002 due to a series break. Data for 2008 refers to November.
Social indicators: GDP per capita (2007): US$40,391.7; Population (2008): 82.06 millions; Gini coefficient (2000): 0.28; at-risk-of-poverty rate 6/ (2005; percent): 13; life expectancy at birth (2007; years): 76.9 (male), 82.1 (female).
Selected Economic and Social Indicators
Participant in euro zoneEuro 0.7 per US$

Public Information Notice (PIN) No. 09/05 International Monetary Fund
700 19th Street, NW Washington, D. C. 20431 USA
FOR IMMEDIATE RELEASE January 22, 2009
IMF Executive Board Concludes 2008 Article IV Consultation with Germany
On January 14, 2009, the Executive Board of the International Monetary Fund (IMF) concluded the Article IV consultation with Germany.1 Background After robust growth in 2006 and 2007, real GDP slowed in 2008 and is now set to decline sharply. World demand is decelerating and confidence indicators are deteriorating. Financial market stress has spilled over into sentiment and the real economy. The German consumer’s conservatism under the current uncertain conditions will amplify the export slowdown and investment decisions are likely to be postponed. In 2008, GDP is projected to grow at 1.3 percent. An economic contraction of 2½ percent is projected for 2009, followed by a slow recovery in 2010. The risks remain tilted to the downside. The financial market turbulence has exposed vulnerabilities in the German financial system. Already in summer 2007, the failure of IKB and Sachsen LB required government intervention. In the aftermath of the failure of Lehman Brothers in Fall 2008, confidence in the system was again threatened by the liquidity rollover requirements at Hypo Real Estate. A public commitment to protect household deposits provided initial stability. This was followed by a comprehensive package in mid-October 2008 to support market liquidity and bank capitalization as part of a globally-coordinated effort.
1 Under Article IV of the IMF's Articles of Agreement, the IMF holds bilateral discussions with members, usually every year. A staff team visits the country, collects economic and financial information, and discusses with officials the country's economic developments and policies. On return to headquarters, the staff prepares a report, which forms the basis for discussion by the Executive Board. At the conclusion of the discussion, the Managing Director, as Chairman of the Board, summarizes the views of Executive Directors, and this summary is transmitted to the country's authorities.

2
Fiscal consolidation in recent years along with growth in incomes and employment during 2007 supported a balanced budget in 2008. In 2009 and 2010, however, the deficit is expected to widen with a weakening economy and labor market. The authorities’ stimulus package is expected to provide a needed impulse to domestic demand, but will also increase the deficit. To address concerns with regard to long-term fiscal sustainability, the authorities aim to introduce a deficit rule that would constrain the structural fiscal balance to about zero. But more ambitious plans for fiscal federalism reform have been postponed until 2019. Executive Board Assessment
Executive Directors noted that, in the past three months, Germany has come under heightened pressure from the global economic and financial turmoil, reflecting the economy’s high degree of openness and integration with the world economy. With the sharp drop in world trade and continuing weakness in domestic demand, Germany faces the prospect of a sizeable, and possibly extended, economic downturn. Corporate and financial sector stresses in the German economy—thus far relatively dissociated from each other—risk becoming more intertwined in the period ahead. Against this background, Directors welcomed the recent initiatives by the German authorities to strengthen significantly the financial safety net and to give valuable economic stimulus. They recognized that the fundamentals of the German economy remain strong, and applauded the sustained fiscal prudence of the last few years that has created the needed room for a sizeable fiscal boost to the economy. Directors welcomed the German authorities’ continuing priority to maintaining financial stability and stabilizing the real economy. Global policy actions and measures to contain the risk of a costly global self-reinforcing slump should preferably be coordinated regionally and internationally for maximum effect. Germany has a special leadership role to play in this process, given the size of its economy and the substantial spillovers into and from Germany. Directors noted that the global financial crisis has highlighted important vulnerabilities of the German financial system, which could be intensified by the economic slowdown in Germany. They welcomed the authorities’ decisive response, noting in particular the creation of the Financial Market Stabilization Fund (FMSF) as vital to shielding the financial sector. A number of guarantees have been issued, which will help banks meet their short-term funding needs. Directors also welcomed the efforts to buttress capital positions. Given the low level of capital in several banks, further recapitalization may be desirable in view of expected asset quality deterioration. Directors also recommended that the agency administering the FMSF use its authority more broadly for enhancing the soundness of the financial sector. In particular, Directors called for a proactive restructuring and downsizing of the Landesbanken, which are a continuing drain on public finances and a threat to financial stability. Directors called for strengthened deposit insurance, a critical element of the financial safety net, given the risks associated with the existing multiple protection schemes that have typically relied on ex post burden-sharing. A base layer of mandatory deposit insurance—ex ante funded by contributions from all banks—would provide unified terms

3
of protection for depositors and reduce incentives to shift deposits among the existing schemes. The evolving European Union rules should provide guidance on coverage limits. Directors observed that the case for a tighter bank regulatory and supervisory process has become more compelling. To respond promptly to problem situations, the authorities were encouraged to place greater reliance on timely supervisory assessments independently of the banks’ annual external audit cycle, and to link prudential regulation and supervision to a system of macro-surveillance and stability analysis. In this context, greater consolidation of regulatory and supervisory resources could yield significant benefits. Directors welcomed the authorities’ conjunctural fiscal stimulus packages in the past four months aimed at supporting domestic demand and guarding against cumulating the drop in consumer and business confidence. They considered these packages timely. Directors welcomed in particular the significant impetus offered by the latest package. Among the components of the package, they noted that the accelerated reduction in social security contributions and the step up of spending on infrastructure projects are well-targeted and likely to provide both short-term stimulus and lasting benefits. Directors acknowledged the complexity of judging precisely the degree of optimal fiscal impulse when the global situation is in rapid flux, often in unexpected ways. In view of the sizeable recent deterioration in economic prospects and given Germany’s fundamentally strong fiscal position, a number of Directors would have favored an even more proactive stimulus. A number of others, however, supported the authorities’ considered approach of maintaining equal emphasis on discretionary measures to spur the economy and adhering to fiscal prudence. All Directors welcomed the authorities’ reiteration of their commitment to medium-term fiscal sustainability, which will be crucial for ensuring the long-term credibility of public finances in accordance with the Stability and Growth Pact. Directors noted that trends in healthcare costs and debt accumulation by the states remain a concern. Further rationalization of pharmaceutical expenditures and strengthened efficiency-enhancing competition remain attractive avenues for containing healthcare costs. Directors noted the possible benefits from more state tax autonomy and a redesign of supplementary federal grants to improve states’ incentives for fiscal discipline. They welcomed the proposed fiscal rule limiting the structural budget balance to close to zero, and recommended that it be applied also to the states.
Public Information Notices (PINs) form part of the IMF's efforts to promote transparency of the IMF's views and analysis of economic developments and policies. With the consent of the country (or countries) concerned, PINs are issued after Executive Board discussions of Article IV consultations with member countries, of its surveillance of developments at the regional level, of post-program monitoring, and of ex post assessments of member countries with longer-term program engagements. PINs are also issued after Executive Board discussions of general policy matters, unless otherwise decided by the Executive Board in a particular case. The staff report (use the free Adobe Acrobat Reader to view this pdf file) for the 2008 Article IV Consultation with Germany is also available.

4
Germany: Selected Economic Indicators 2004 2005 2006 2007 2008 1/Economic activity and prices (Change in percent, unless otherwise noted) Real GDP 1.2 0.8 3.0 2.5 1.3 Net exports 2/ 1.4 0.7 1.0 1.4 -0.2 Total domestic demand -0.1 0.0 2.1 1.1 1.6 Private consumption 0.1 0.2 1.0 -0.4 0.0 Gross fixed investment -0.3 1.1 7.7 4.3 4.1 Construction investment -3.9 -3.0 5.0 1.8 2.7 Gross national saving (percent of GDP) 21.8 22.1 23.7 25.9 25.0 Gross domestic investment (percent of GDP) 17.1 16.9 17.6 18.3 19.0 Labor force 3/ 43.0 43.3 43.2 43.3 43.4 Employment 3/ 38.8 38.8 39.0 39.7 40.3 Standardized unemployment rate (in percent) 9.2 10.6 9.8 8.4 7.3 Unit labor costs (industry; hourly data) -3.1 -4.2 -4.0 -3.1 -1.2 GDP deflator 1.0 0.7 0.5 1.8 1.4 Harmonized CPI index 1.8 1.9 1.8 2.3 2.8
Public finance (In percent of GDP) General government balance 4/ -3.8 -3.3 -1.5 -0.2 -0.1 Structural government balance -2.6 -2.3 -1.2 -0.3 -0.3 General government gross debt 64.7 66.4 66.0 65.0 68.7
Money and credit (Change in percent over 12 months) Private sector credit 5/ -0.2 2.2 3.5 3.2 6.6 M3 5/ 2.2 5.2 4.9 10.6 11.1
Interest rates (In percent ) Three-month money market rate 6/ 2.1 2.1 3.7 4.8 3.4 Ten-year government bond yield 6/ 4.1 3.6 3.8 4.3 3.2
Balance of payments (In billions of euros, unless otherwise noted) Exports 7/ 850.3 924.6 1,056.3 1,148.6 1,206.6 Imports 7/ 739.9 805.1 925.5 975.6 1,047.6 Trade balance (percent of GDP) 6.3 6.4 6.3 7.8 7.1 Current account balance 102.9 116.6 141.5 184.2 149.4 Current account (percent of GDP) 4.7 5.2 6.1 7.6 6.0
Exchange rate (Period average) Euro per U.S. dollar 6/ 0.80 0.80 0.80 0.73 0.74 Nominal effective rate (1990=100) 6/ 115.7 114.7 114.9 119.7 115.8 Real effective rate (1990=100) 8/ 105.5 102.2 99.1 97.9 95.1 Sources: Deutsche Bundesbank; IMF, International Financial Statistics; IMF, World Economic Outlook; and staff projections.
1/ 2008 estimated, unless otherwise indicated. 2/ Contribution to GDP growth. 3/ Domestic definition on a national accounts basis; according to new integrated system of economic accounts (ESA95). 4/ On a national accounts basis; according to new integrated system of economic accounts (ESA95). 5/ Data for 2008 refer to November. M3 refers to Germany’s contribution in the euro area. 6/ Data for 2008 refer to December. 7/ Goods and services. 8/ Based on relative normalized unit labor cost in manufacturing. Data for 2008 refer to December.

Statement by Klaus-Dieter Stein, Executive Director for Germany January 9, 2009
We would like to thank the staff for a concise and focused report which offers a balanced reflection of what my authorities considered to be a very constructive and candid dialogue during the consultations. We broadly share staff’s assessment that the environment for conducting economic and fiscal policy has become extremely challenging given the worsening of economic indicators as the financial crisis spills over to the real ecnomy. However, employment and real disposable income have expanded in Germany almost up to the end of 2008 as some key elements which have triggered and reinforced the crisis of the global economy have not featured highly in the past course of the German economy: housing prices remained stable in recent years, predominantly deposit-based financing of lending, low exposure of pension system to capital market developments, low debt ratios of corporates and households. To be clear, however, my authorities have and will act forcefully to the abrupt change in economic conditions. Essentially, this crisis will be temporary and the crisis response of the German government is being carefully framed in order to protect the economy from harm, yet not foregoing the commitment to credible economic and fiscal policies based on sound principles which my authorities deem crucial to master the long-term budgetary challenges and to maintain confidence in a sustainable fiscal policy. Economic Situation Highly integrated in the world and European economies, Germany faces severe strains from a global demand shock as the financial crisis leaves its marks on the real economy. The economy has entered a recession in 2008 and GDP is likely to contract sharply in 2009 as production will continue to decline following a reversal in export demand. Revised growth forecasts of major economic research institutes range between 1.4 percent and 1.6 percent for real GDP growth in 2008 and between -2.7 percent and -1.2 percent for 2009. For 2010 the economy is expected to gradually stabilize. The government will issue a revised official growth forecast on 21 January. The high degree of uncertainty at the current juncture notwithstanding, my authorities consider the fundamentals of the German economy as still being reasonably strong. The corporate sector has in recent years moved forward with consoli-dation of balance sheets and the maintenance of strong cash-flows while price-competitiveness has been favorable. Thanks to higher wage growth and a turnaround in

commodity prices, aggregate demand conditions have been upheld. Nevertheless, domestic demand will not be able to make up for the drastic drop in German firms’ foreign order volume – identified as the primary shock and principle source of the current slowdown. Although the private sector has until recently resisted the economic downturn, a significant fall in demand for capital investment goods and tighter credit conditions will leave their mark. A credit crunch triggered by financing shortfalls in the banking sector is however unlikely at the current juncture. Nevertheless, corporate sector investments will be scaled back significantly given lower capacity utilization, revised profit forecasts and more restrictive financing conditions as corporate bond spreads have increased. My authorities concur with staff that business sentiment has been deteriorating more rapidly than in previous downturns. Yet, they emphasize that the danger of self-fulfilling pessimistic expectations is clearly prevalent. Against this background, “proactive” projections are to be avoided as indicators more directly mirroring real developments draw a more benign picture. For example, in October, industrial capacity utilization was still slightly above its long-term average. Furthermore, the projected decline in the output gap is not exceptionally strong compared with the previous downturn. Financial sector The current situation in the financial sector remains strained. Interbankmarkets are still not functioning properly and confidence is still lacking. The profit situation of financial institutions remains depressed by the high losses ascribed to structured and other products, and falling interest margins. Yet, an important segment of the market has based its business model mainly on deposits and is therefore more shielded against the risks of the wholesale market. Overall, financial sector stress is nevertheless expected to persist for the next quarters as the economy is not likely to recover before 2010. The government has responded speedily and decisively to the financial crisis. The new financial market stabilization law has been implemented rapidly and the stabilization fund (Sonderfonds Finanzmarktstabilisierung - SoFFin) is increasingly used by banks. From the start, the financial rescue package has had a dual approach aimed at promoting liquidity and solvency. In order to eliminate liquidity shortages and to support refinancing in the capital markets, SoFFin has been authorized to guarantee newly issued refinancing instruments. The Fund may also recapitalize financial institutions, in particular through the purchase of shares or silent participations. With the option of
2

acquiring problematic assets, it can also improve capital ratios. At present, 95 bn euros of guarantees are committed (out of an overall envelope of 400 bn euros) and 8.2 bn euros in recapitalization support (out of maximum envelope of 80 bn euros). The central principle of SoFFin – its balanced focus and voluntary participation – has so far proven adequate. The originally feared stigmatization of participating institutions cannot be confirmed. The principle of voluntary participation ensures that primarily the owners are accountable for the solution of individual problems of their institutions. SoFFin is only intervening on a subsidiary basis. In fact, several banks managed a recapitalization on their own without using the recapitalization credit line of SoFFin. In 2009, a new asset-class will be established (government-guaranteed bank bonds) clearly improving incentives for banks to participate in SoFFin. My authorities share staff’s recommendation to move forward with the restructuring of the Landesbanken. They consider that substantial reform including a downsizing and the development of a viable business model is needed. State governments have indicated that they would like to preserve their decision autonomy with respect to the future role of their institutions. The institutions concerned have also already considered various options by themselves. My authorities consider the German bank resolution framework as broadly adequate. Section 46b of the Banking Act provides the possibility to (i) issue a ban on sales and payments by the concerned institution and (ii) prohibit the acceptance of payments not intended for the discharge of debts to the institution (moratorium). Objections by the institutions (and their shareholders) have in principle no postponing effect. This moratorium allows the supervisor, shareholders, and other stakeholders to negotiate a rescue plan. Therefore, my authorities consider that BaFin as the supervisor has sufficient instruments at hand to deal with a quickly evolving problem situation in an institution. As to supervision, the revised guideline governing the respective responsibilities of BaFin and the Bundesbank ensures the clear division of labor in the field of banking supervision in Germany. Cooperation during the recent financial crisis has proven to be efficient. The division of responsibilities ensures on the one hand that the Bundesbank has access to all supervisory information. On the other hand, synergies from banking supervision and monetary policies can be gained without questioning the independence of the Bundesbank. Fiscal policy
3

The German government is fully committed to the rules of the Stability and Growth Pact at EU level. This pact provides the framework under normal circumstances to achieve and maintain a budgetary position of close to balance or in surplus. For exceptional circumstances, it provides the budgetary space to weather any economic downturn, in the first place through the full operation of automatic stabilizers and, if needed, also through additional fiscal policy measures. EU level coordination of additional fiscal policy measures requires primarily a common understanding on the application of the Pact at the current juncture – given the exceptional circumstances. In light of the unusual degree of uncertainty about the impact of any specific measures, it is crucial to give due account of countries’ individual circumstances. For my authorities, structural consolidation of public budgets remains the key objective given the challenges to long-term sustainability of public finances. Framing short-term (temporary) policy responses accordingly will avoid putting hard-won structural consolidation at risk. This is crucial for confidence-building underpinning that policies are viable to guarantee sound public finances in the monetary union. The government has responded to the global economic slowdown speedily and decisively with an important fiscal stimulus package - which is already in effect - designed to secure growth and employment. The package adopted by the Cabinet on 7 October and 5 November 2008 predominantly contains growth-oriented measures that can be implemented in a timely manner. The objective is to create strong stimuli for private and public-sector investments, inter alia by investment funding to SMEs, tax incentives, targeted support to families and infrastructure investment. Furthermore, the Federal Constitutional Court has reinstated the commuting allowance (tax subsidy) which has an additional stimulus effect. The total volume of both, the package and the commuting allowance in 2009 and 2010 will amount to approximately 40 bn euros (or over 1 ½ percent of GDP). My authorities underline that the decisive factor with regard to actually stimulating economic activity is not solely the level of public sector spending, but the economic impact of the measures adopted. The high degree of uncertainty on the impact of specific policies notwithstanding, the measures adopted by the federal government are targeted and will mainly remain in effect for a limited time only, while having a lasting impact. In the coming years, some measures of the package will facilitate investments and orders from enterprises, private households and regional and municipal governments. The measures will cost 11 bn euros in two years but are expected to trigger 50 bn euros in private investment. An additional fiscal stimulus package is currently under consideration.
4

My authorities emphasize that a short-term fiscal spending strategy - without ensuring medium-term fiscal sustainability - may not deliver the effectiveness wished for. A loss of confidence in fiscal sustainability would significantly aggravate the crisis. The government is considering the implementation of a new constitutional fiscal rule which would ensure a compensation of short-term discretionary fiscal policy measures in the next upswing. My authorities explicitly welcome the staff’s assessment on the usefulness of such a rule which is currently being discussed in the Federalism Commission II. Furthermore, my authorities welcome the staff’s recommendation for a new preventive budget surveillance mechanism. To this end, my authorities have recommended the establishment of a stability council. On the other hand, staff recommends that fiscal rules at the level of individual states need to be altered to ensure greater tax autonomy and to avoid pro-cyclical expenditure behavior at state level. My authorities are more cautious to these recommendations as, (i) the expenditure fluctuations of individual states would be higher without the federal financial equalization and (ii) the revenue base, in particular between east and west German states, is very different so that more tax autonomy would reinforce revenue shortfalls and render budget consolidation in the end more difficult. Structural Reform The structural position of the German economy remains sound, but reform challenges remain. German economic policy has – over the recent years preceding the crisis – been targeted (i) at further increasing trend growth and implementing policy responses to the challenges posed by population ageing, while (ii) at the same time anchoring reforms in a sufficiently broad consensus balancing efficiency considerations with social security concerns. The strategy has served Germany well and will remain valid over the medium-term. Going forward, the government will advance further reforms in the health care sector as cost-saving measures and efficiency-enhancing competition in the health care system are important to ensure sustainable public finances. Continual effects of previous growth-oriented structural reforms. The structural reform measures referred to in the context of last year’s Article IV consultation, the business tax reform and the significant reduction of contribution rates to unemployment insurance result in the coming years in a relief for enterprises and individuals of well above 1 percent of GDP per annum. In addition, federal budget spending for research and development will continue to increase in 2009 and 2010.
5