Embed Size (px)
Citation preview
©2014 International Monetary Fund
IMF Country Report No. 14/192
SPAIN 2014 ARTICLE IV CONSULTATION—STAFF REPORT; STAFF SUPPLEMENT; PRESS RELEASE; AND STATEMENT BY THE EXECUTIVE DIRECTOR FOR SPAIN
Under Article IV of the IMF’s Articles of Agreement, the IMF holds bilateral discussions with members, usually every year. In the context of the 2014 Article IV consultation with Spain, the following documents have been released and are included in this package: The Staff Report prepared by a staff team of the IMF for the Executive Board’s
consideration on July 7, 2014, following discussions that ended on May 27, 2014, with the officials of Spain on economic developments and policies. Based on information available at the time of these discussions, the staff report was completed on June 20, 2014.
An Informational Annex prepared by the IMF.
A Staff Supplement of June 30, 2014 updating information on recent developments.
A Press Release summarizing the views of the Executive Board as expressed during its July 7, 2014 consideration of the staff report that concluded the Article IV consultation with Spain.
A Statement by the Executive Director for Spain
The following document has been or will be separately released. Selected Issues Paper
The publication policy for staff reports and other documents allows for the deletion of market-sensitive information.
Copies of this report are available to the public from
International Monetary Fund Publication Services PO Box 92780 Washington, D.C. 20090
Telephone: (202) 623-7430 Fax: (202) 623-7201 E-mail: [email protected] Web: http://www.imf.org
Price: $18.00 per printed copy
International Monetary Fund Washington, D.C.
July 2014
SPAIN STAFF REPORT FOR THE 2014 ARTICLE IV CONSULTATION
KEY ISSUES Context. Spain has turned the corner. Growth has resumed, labor market trends are improving, the current account is in surplus, banks are healthier, and sovereign yields are at record lows. But unemployment is unacceptably high, incomes have fallen, trend productivity growth is low, and the deleveraging of high debt burdens—public and private—is weighing on growth.
Policies. Spain’s overarching policy priority must be to ensure the recovery is strong, long-lasting, and most pressingly, job-rich. This requires:
Reducing the drag on domestic demand from private sector deleveraging with a more comprehensive, coordinated, approach to corporate debt restructuring, and by introducing a personal insolvency framework.
Bolstering banks’ ability to support the recovery by continuing to raise capital levels over time, including by limiting cash dividends and bonuses.
Creating jobs for the low skilled by sharply cutting the fiscal cost of employing them, compensated by higher indirect revenues.
Making the labor market more inclusive and responsive to economic conditions by striking a better balance between highly-protected/permanent and precarious/temporary contracts, and further helping firms adapt working conditions (wages, hours) to their specific circumstances.
Helping the unemployed improve their skills and enhancing the support they receive to find a job.
Removing regulatory barriers that prevent firms from growing, hiring, and becoming more productive, especially at the regional level.
Gradually, but steadily, reducing the fiscal deficit to keep debt on a sustainable path, and making the tax system more growth and job friendly.
Policies by Spain’s European partners, in particular, sufficient monetary easing by the ECB to achieve its inflation targets.
June 20, 2014
SPAIN
2 INTERNATIONAL MONETARY FUND
Approved By Ranjit Teja and Mark Flanagan
A staff team comprising J. Daniel (Head), K. Fletcher, P. Lopez Murphy, P. Medas (all EUR), M. Saiyid (MCM), H. Hesse (SPR), V. Lledo (FAD), and C. DeLong (LEG) visited Madrid on May 12–27, 2014, to conduct the 2014 Article IV Consultation discussions. The mission was supported by two experts (M. Balz and I. Lieberman). The mission also visited Valladolid. A. Gavira (COM) joined for the concluding meetings. Mr. Varela and Ms. Navarro from the Executive Director’s office attended the discussions. C. Cheptea, S. Chinta, and A. Myaing supported the mission from Headquarters. The mission met Economy and Competitiveness Minister De Guindos, Finance and Public Administration Minister Montoro, Bank of Spain Governor Linde, other senior officials, and financial, industry, academic, parliament, and union representatives.
CONTENTS
CONTEXT: EMERGING FROM THE CRISIS ________________________________________________________ 4
OUTLOOK: A CONTINUING RECOVERY AMID RISKS __________________________________________ 10
THE POLICY AGENDA: GROWTH AND JOBS ___________________________________________________ 13
A. Strategy _________________________________________________________________________________________13
B. Private Debt—Reducing Debt Overhang ________________________________________________________14
C. Banks—Encouraging Lending ___________________________________________________________________16
D. Labor Market—Spurring Employment __________________________________________________________19
E. Improving the Business Environment ____________________________________________________________21
F. Fiscal Policy—Minimizing the Drag on Growth __________________________________________________24
G. Europe—Easing and Transmitting ECB policy ___________________________________________________29
H. Some Questions and Answers on Staff Analysis ________________________________________________30
STAFF APPRAISAL _______________________________________________________________________________ 34
BOXES 1. The Current Account Has Improved Significantly, but Vulnerabilities Remain High ______________ 8 2. Reducing Regulatory Barriers to Trade Across Spain: The Market Unity Reform ________________24 3. How Policies in the Euro Area Could Help Spain’s Ongoing Adjustment ________________________30
FIGURES 1. The Recovery Is Gaining Steam ___________________________________________________________________ 5 2. A Summary of Spain’s Recent Structural Reforms ________________________________________________ 6
SPAIN
INTERNATIONAL MONETARY FUND 3
3. The Legacy from the Crisis _______________________________________________________________________ 9 4. Non Financial Corporations Are Deleveraging __________________________________________________15 5. Despite Substantial Consolidation, Fiscal Challenges Remain ___________________________________28 6. Imbalances Built up During the Boom Years Are Being Gradually Addressed ___________________36 7. Financial Market Indicators Have Improved _____________________________________________________37 8. Credit Conditions Remain Challenging __________________________________________________________38 9. Household Finances Are Strained _______________________________________________________________39 10. Despite the Current Account Surplus, Net External Liabilities Remains High ___________________40
TABLES 1. Main Economic Indicators _______________________________________________________________________41 2. Selected Financial Soundness Indicators ________________________________________________________42 3. General Government Operations ________________________________________________________________43 4. General Government Balance Sheet _____________________________________________________________44 5. Balance of Payments ____________________________________________________________________________45 6. International Investment Position _______________________________________________________________46
APPENDICES I. Public Debt Sustainability Analysis _______________________________________________________________47 II. Key Recommendations—Independent Tax Reform Committee _________________________________56
SPAIN
4 INTERNATIONAL MONETARY FUND
CONTEXT: EMERGING FROM THE CRISIS Spain is emerging from a deep double-dip recession…
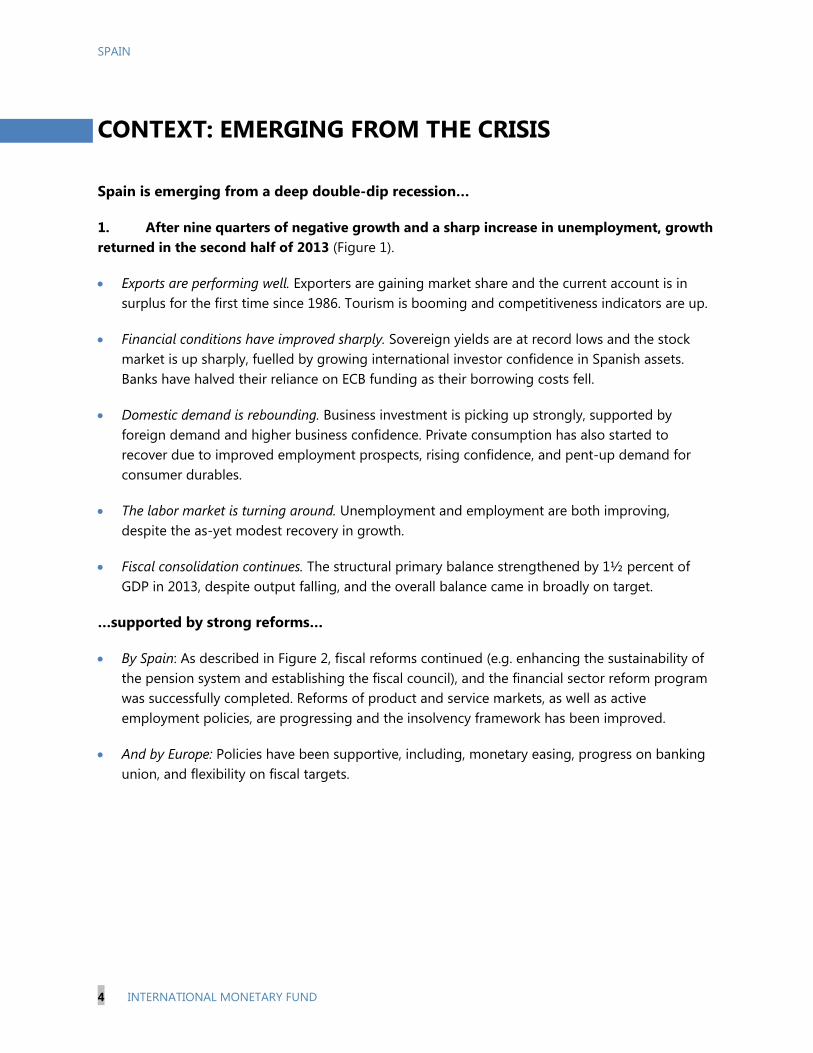
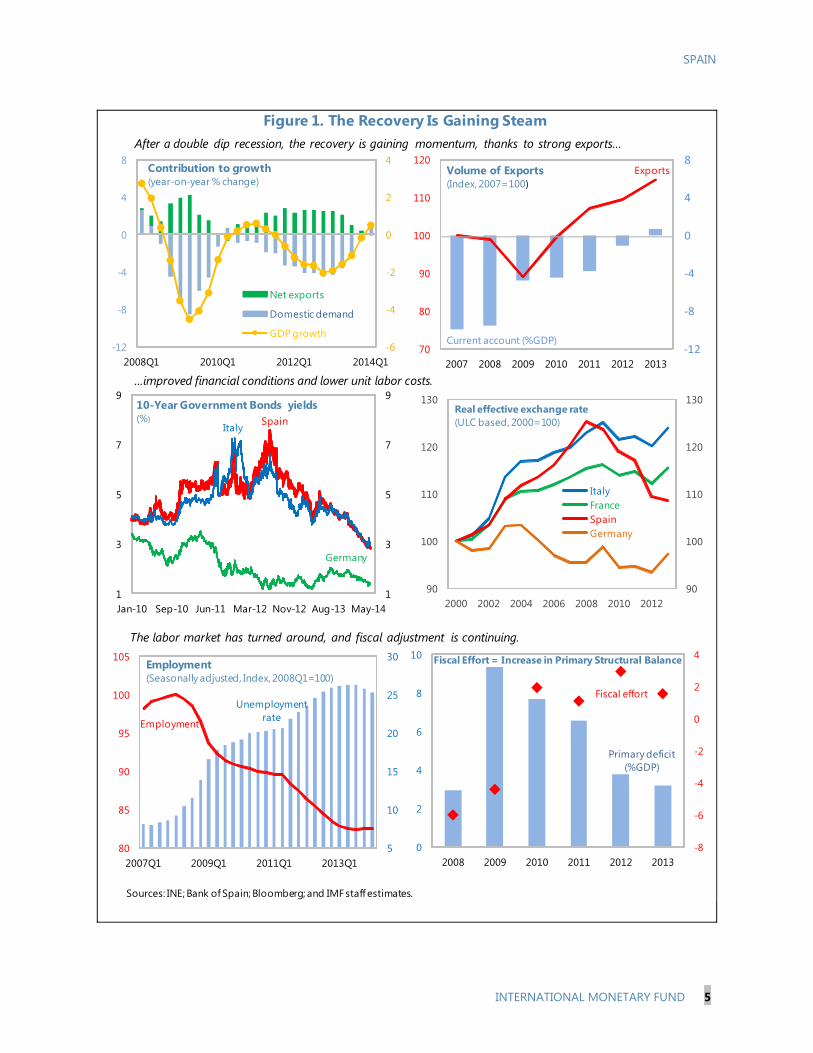
1. After nine quarters of negative growth and a sharp increase in unemployment, growth returned in the second half of 2013 (Figure 1).
Exports are performing well. Exporters are gaining market share and the current account is in surplus for the first time since 1986. Tourism is booming and competitiveness indicators are up.
Financial conditions have improved sharply. Sovereign yields are at record lows and the stock market is up sharply, fuelled by growing international investor confidence in Spanish assets. Banks have halved their reliance on ECB funding as their borrowing costs fell.
Domestic demand is rebounding. Business investment is picking up strongly, supported by foreign demand and higher business confidence. Private consumption has also started to recover due to improved employment prospects, rising confidence, and pent-up demand for consumer durables.
The labor market is turning around. Unemployment and employment are both improving, despite the as-yet modest recovery in growth.
Fiscal consolidation continues. The structural primary balance strengthened by 1½ percent of GDP in 2013, despite output falling, and the overall balance came in broadly on target.
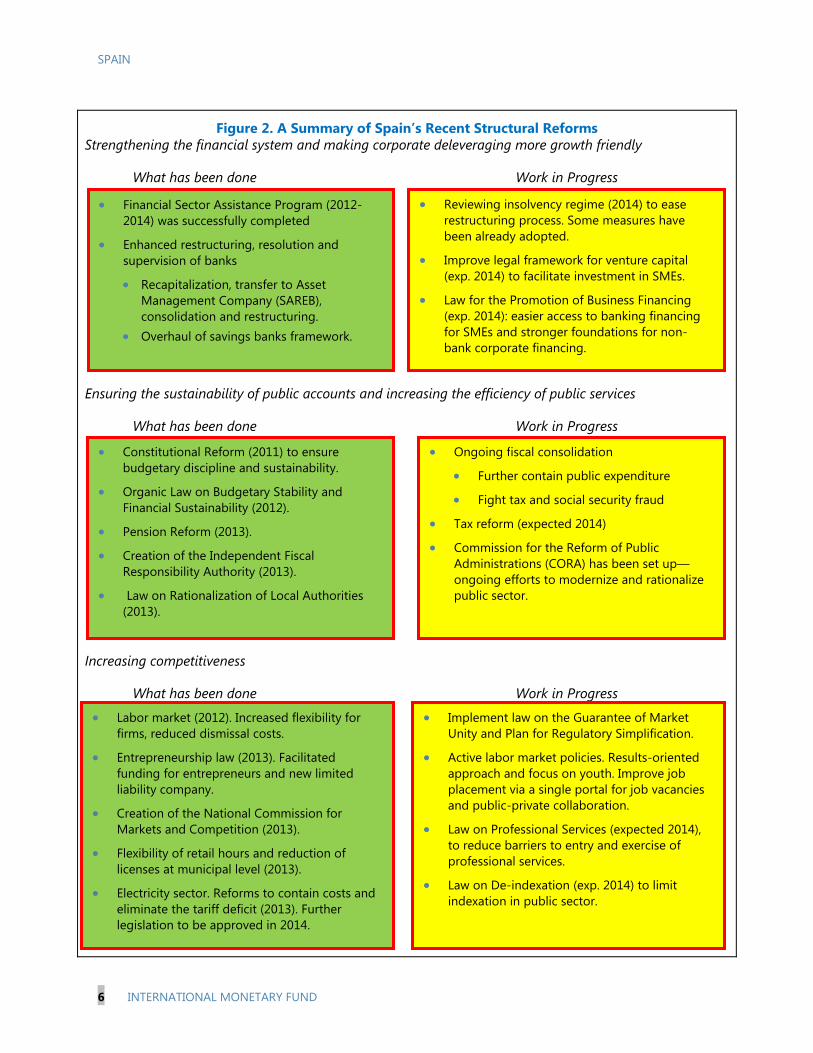
…supported by strong reforms…
By Spain: As described in Figure 2, fiscal reforms continued (e.g. enhancing the sustainability of the pension system and establishing the fiscal council), and the financial sector reform program was successfully completed. Reforms of product and service markets, as well as active employment policies, are progressing and the insolvency framework has been improved.
And by Europe: Policies have been supportive, including, monetary easing, progress on banking union, and flexibility on fiscal targets.
SPAIN
INTERNATIONAL MONETARY FUND 5
Figure 1. The Recovery Is Gaining Steam
Sources: INE; Bank of Spain; Bloomberg; and IMF staff estimates.
1
3
5
7
9
1
3
5
7
9
Jan-10 Sep-10 Jun-11 Mar-12 Nov-12 Aug-13 May-14
10-Year Government Bonds yields (%) Spain
Germany
Italy
After a double dip recession, the recovery is gaining momentum, thanks to strong exports…
...improved financial conditions and lower unit labor costs.
The labor market has turned around, and fiscal adjustment is continuing.
-6
-4
-2
0
2
4
-12
-8
-4
0
4
8
2008Q1 2010Q1 2012Q1 2014Q1
Net exports
Domestic demand
GDP growth
Contribution to growth(year-on-year % change)
‐12
-8
-4
0
4
8
70
80
90
100
110
120
2007 2008 2009 2010 2011 2012 2013
Volume of Exports (Index, 2007=100)
Exports
Current account (%GDP)
5
10
15
20
25
30
80
85
90
95
100
105
2007Q1 2009Q1 2011Q1 2013Q1
Employment(Seasonally adjusted, Index, 2008Q1=100)
Employment
Unemployment rate
-8
-6
-4
-2
0
2
4
0
2
4
6
8
10
2008 2009 2010 2011 2012 2013
Fiscal Effort = Increase in Primary Structural Balance
Fiscal effort
Primary deficit (%GDP)
90
100
110
120
130
90
100
110
120
130
2000 2002 2004 2006 2008 2010 2012
ItalyFranceSpainGermany
Real effective exchange rate (ULC based, 2000=100)
SPAIN
6 INTERNATIONAL MONETARY FUND
Figure 2. A Summary of Spain’s Recent Structural Reforms Strengthening the financial system and making corporate deleveraging more growth friendly
What has been done Work in Progress Ensuring the sustainability of public accounts and increasing the efficiency of public services
What has been done Work in Progress Increasing competitiveness
What has been done Work in Progress
Financial Sector Assistance Program (2012-2014) was successfully completed
Enhanced restructuring, resolution and supervision of banks
Recapitalization, transfer to Asset Management Company (SAREB), consolidation and restructuring.
Overhaul of savings banks framework.
Reviewing insolvency regime (2014) to ease restructuring process. Some measures have been already adopted.
Improve legal framework for venture capital (exp. 2014) to facilitate investment in SMEs.
Law for the Promotion of Business Financing (exp. 2014): easier access to banking financing for SMEs and stronger foundations for non-bank corporate financing.
Constitutional Reform (2011) to ensure budgetary discipline and sustainability.
Organic Law on Budgetary Stability and Financial Sustainability (2012).
Pension Reform (2013).
Creation of the Independent Fiscal Responsibility Authority (2013).
Law on Rationalization of Local Authorities (2013).
Labor market (2012). Increased flexibility for firms, reduced dismissal costs.
Entrepreneurship law (2013). Facilitated funding for entrepreneurs and new limited liability company.
Creation of the National Commission for Markets and Competition (2013).
Flexibility of retail hours and reduction of licenses at municipal level (2013).
Electricity sector. Reforms to contain costs and eliminate the tariff deficit (2013). Further legislation to be approved in 2014.
Ongoing fiscal consolidation
Further contain public expenditure
Fight tax and social security fraud
Tax reform (expected 2014)
Commission for the Reform of Public Administrations (CORA) has been set up—ongoing efforts to modernize and rationalize public sector.
Implement law on the Guarantee of Market Unity and Plan for Regulatory Simplification.
Active labor market policies. Results-oriented approach and focus on youth. Improve job placement via a single portal for job vacancies and public-private collaboration.
Law on Professional Services (expected 2014), to reduce barriers to entry and exercise of professional services.
Law on De-indexation (exp. 2014) to limit indexation in public sector.
SPAIN
INTERNATIONAL MONETARY FUND 7
…but the legacy of the boom/bust cycle persists
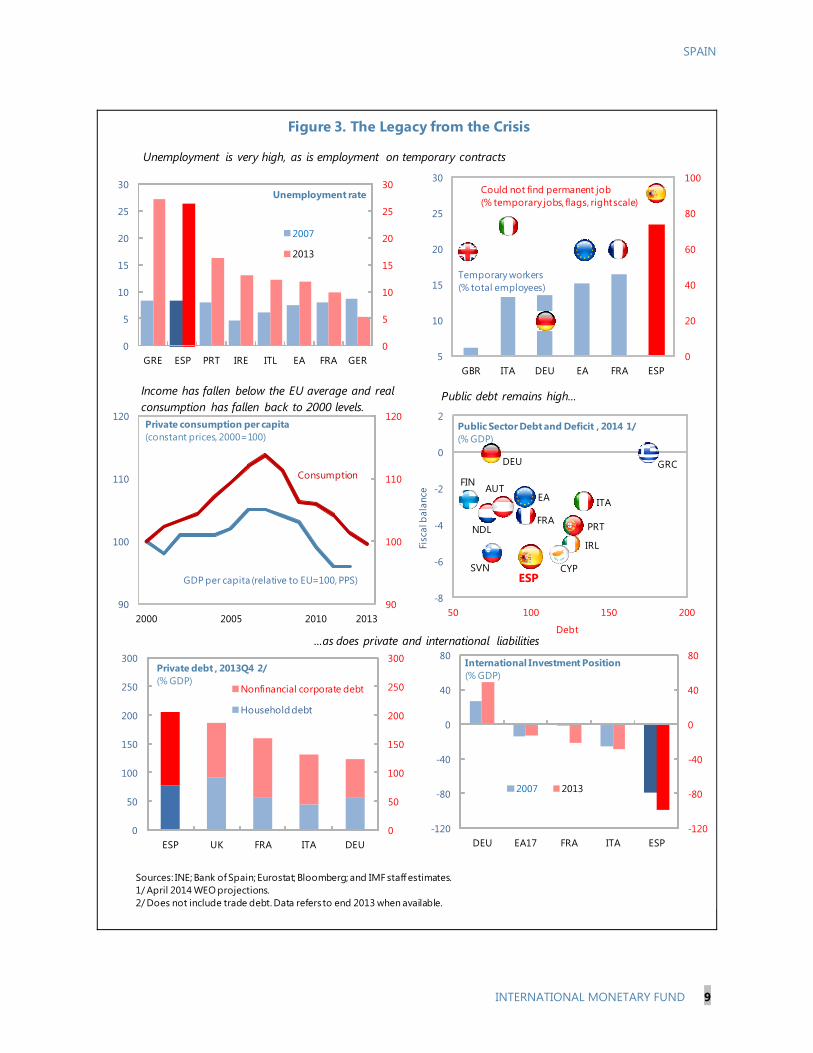
2. Unemployment, at 26 percent and little changed from last year’s consultation, remains the most pernicious legacy of the crisis (Figure 3). The majority of the unemployed have been without a job for at least a year—about 3½ million people (15 percent of the labor force). And with unemployment particularly high among the young (55 percent) and low skilled, there is a high risk of permanent skill destruction. The labor market also remains highly fragmented with a large share of workers dependent on temporary and involuntarily part-time jobs. The labor force is declining sharply (partly via net emigration).
3. Livings standards have fallen significantly since the start of the crisis. Reflecting the large increase in unemployment, median income has fallen, and income inequality and the risk of poverty and social exclusion have increased. The approximately four million who became unemployed since 2007 suffered large falls in income (about half on average), whereas the median income of those employed increased in nominal terms. GDP per capita has also fallen below the European average.
4. And the economy is heavily indebted.
Public debt is high and rising. Despite important progress, at 6½ percent of GDP in 2013, the fiscal deficit was among the largest in the Euro area and public debt jumped from 36 percent of GDP in 2007 to 94 percent of GDP in 2013.
Private debt is even larger, though falling. Corporate debt is well over historical and international averages. Households’ net wealth has fallen by about 124 percent of GDP (about one fifth) since end-2007, while debt as share of disposable income remains close to historical highs.
As a result, Spain is heavily indebted to the rest of the world. The net international investment
position (NIIP), one of the most negative in the Euro area, deteriorated further in 2013 (due to valuation losses) to reach almost 100 percent of GDP (Box 1).
SPAIN
8 INTERNATIONAL MONETARY FUND
Box 1. The Current Account Has Improved Significantly, but Vulnerabilities Remain High
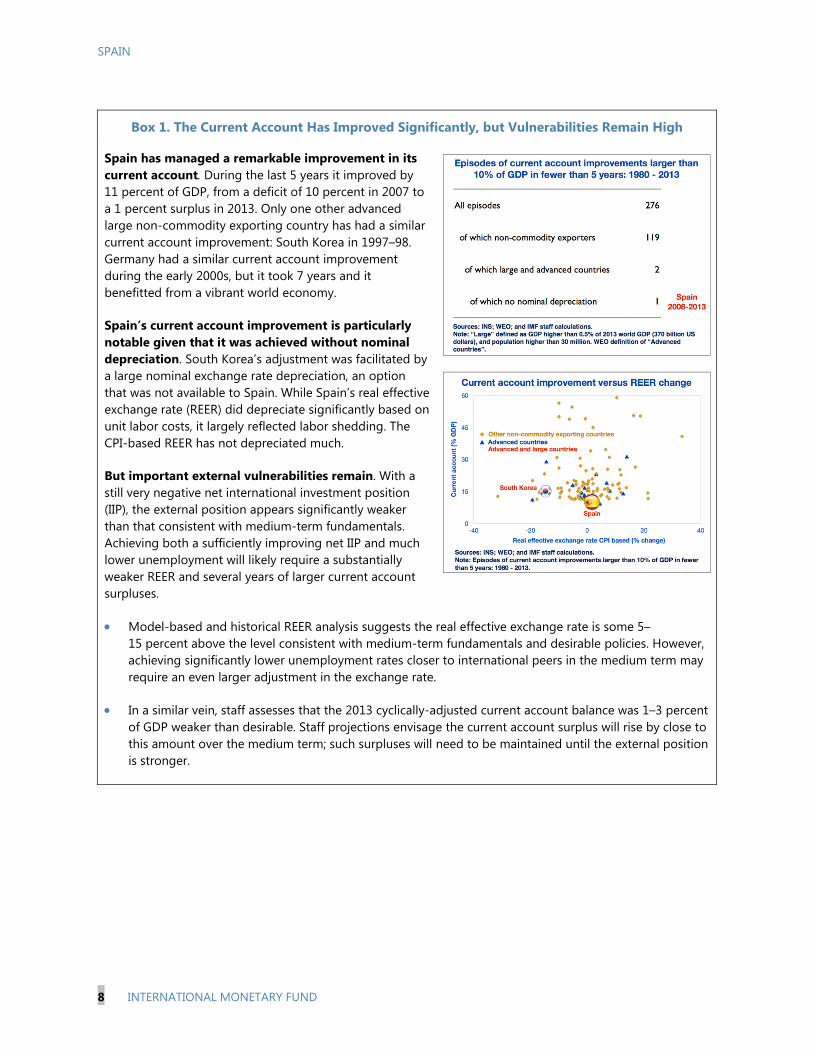
Spain has managed a remarkable improvement in its current account. During the last 5 years it improved by 11 percent of GDP, from a deficit of 10 percent in 2007 to a 1 percent surplus in 2013. Only one other advanced large non-commodity exporting country has had a similar current account improvement: South Korea in 1997–98. Germany had a similar current account improvement during the early 2000s, but it took 7 years and it benefitted from a vibrant world economy.
Spain’s current account improvement is particularly notable given that it was achieved without nominal depreciation. South Korea’s adjustment was facilitated by a large nominal exchange rate depreciation, an option that was not available to Spain. While Spain’s real effective exchange rate (REER) did depreciate significantly based on unit labor costs, it largely reflected labor shedding. The CPI-based REER has not depreciated much.
But important external vulnerabilities remain. With a still very negative net international investment position (IIP), the external position appears significantly weaker than that consistent with medium-term fundamentals. Achieving both a sufficiently improving net IIP and much lower unemployment will likely require a substantially weaker REER and several years of larger current account surpluses.
Model-based and historical REER analysis suggests the real effective exchange rate is some 5–15 percent above the level consistent with medium-term fundamentals and desirable policies. However, achieving significantly lower unemployment rates closer to international peers in the medium term may require an even larger adjustment in the exchange rate.
In a similar vein, staff assesses that the 2013 cyclically-adjusted current account balance was 1–3 percent of GDP weaker than desirable. Staff projections envisage the current account surplus will rise by close to this amount over the medium term; such surpluses will need to be maintained until the external position is stronger.
SPAIN
INTERNATIONAL MONETARY FUND 9
Figure 3. The Legacy from the Crisis
Sources: INE; Bank of Spain; Eurostat; Bloomberg; and IMF staff estimates.1/ April 2014 WEO projections.2/ Does not include trade debt. Data refers to end 2013 when available.
Unemployment is very high, as is employment on temporary contracts
Income has fallen below the EU average and real consumption has fallen back to 2000 levels.
...as does private and international liabilities
0
5
10
15
20
25
30
0
5
10
15
20
25
30
GRE ESP PRT IRE ITL EA FRA GER
2007
2013
Unemployment rate
0
50
100
150
200
250
300
0
50
100
150
200
250
300
ESP UK FRA ITA DEU
Nonfinancial corporate debt
Household debt
Private debt , 2013Q4 2/(% GDP)
-120
-80
-40
0
40
80
-120
-80
-40
0
40
80
DEU EA17 FRA ITA ESP
2007 2013
International Investment Position (% GDP)
EAAUT
CYP
FIN
FRA
DEU GRC
IRL
ITA
NDL PRT
SVNESP
-8
-6
-4
-2
0
2
50 100 150 200
Fisc
al b
alan
ce
Debt
Public Sector Debt and Deficit , 2014 1/(% GDP)
90
100
110
120
90
100
110
120
2000 2005 2010 2013
Private consumption per capita (constant prices, 2000=100)
Consumption
GDP per capita (relative to EU=100, PPS)
Public debt remains high...
0
20
40
60
80
100
5
10
15
20
25
30
GBR ITA DEU EA FRA ESP
Temporary workers (% total employees)
Could not find permanent job (% temporary jobs, flags, right scale)
SPAIN
10 INTERNATIONAL MONETARY FUND
OUTLOOK: A CONTINUING RECOVERY AMID RISKS 5. Growth is likely to continue to strengthen, reflecting reforms and the closing of the large output gap as demand recovers. The outlook has improved significantly compared to last year’s consultation, mainly due to: (1) much stronger euro area financial market conditions and confidence; (2) improving labor market trends, helped by the 2012 labor reform (3) firms (driven by exporters) investing despite the deleveraging and (4) a more gradual projected path of fiscal consolidation. Higher growth also reflects the closing of the larger output gap (as reflected by the lack of inflationary pressure). Specifically:
Building on the momentum that started in late 2013, growth is expected to increase to around 1¼ percent in 2014 and progressively further over the medium term. Business investment will likely play a leading role as firms take advantage of rising exports and large operating margins to invest and hire. Private consumption is likely to rebound from depressed levels, supported by the strengthening labor market.
The contribution from net exports will likely be more subdued in the near term due to an increase in imports (reflecting the stronger domestic demand), keeping the current account surplus from rising further. But, over time, continued reform efforts should further improve the contribution from net exports.
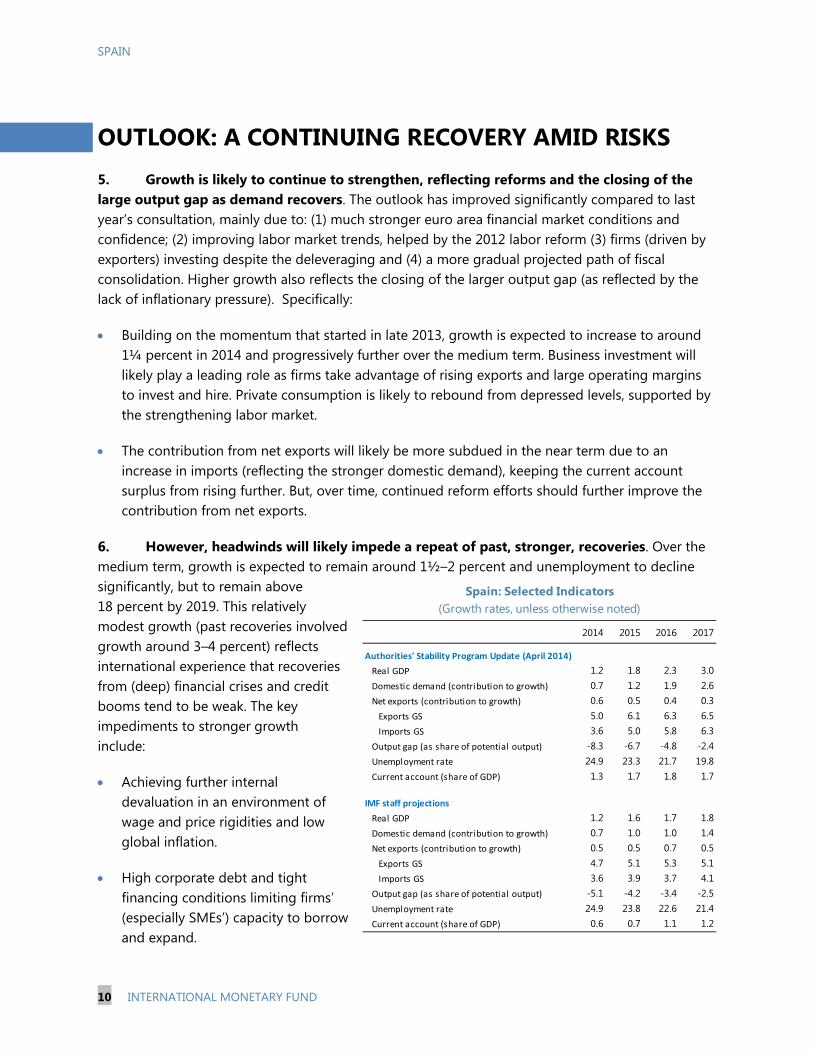
6. However, headwinds will likely impede a repeat of past, stronger, recoveries. Over the medium term, growth is expected to remain around 1½–2 percent and unemployment to decline significantly, but to remain above 18 percent by 2019. This relatively modest growth (past recoveries involved growth around 3–4 percent) reflects international experience that recoveries from (deep) financial crises and credit booms tend to be weak. The key impediments to stronger growth include:
Achieving further internal devaluation in an environment of wage and price rigidities and low global inflation.
High corporate debt and tight financing conditions limiting firms’ (especially SMEs’) capacity to borrow and expand.
2014 2015 2016 2017
Authorities' Stability Program Update (April 2014)
Real GDP 1.2 1.8 2.3 3.0Domestic demand (contribution to growth) 0.7 1.2 1.9 2.6Net exports (contribution to growth) 0.6 0.5 0.4 0.3
Exports GS 5.0 6.1 6.3 6.5Imports GS 3.6 5.0 5.8 6.3
Output gap (as share of potential output) -8.3 -6.7 -4.8 -2.4Unemployment rate 24.9 23.3 21.7 19.8Current account (share of GDP) 1.3 1.7 1.8 1.7
IMF staff projections
Real GDP 1.2 1.6 1.7 1.8Domestic demand (contribution to growth) 0.7 1.0 1.0 1.4Net exports (contribution to growth) 0.5 0.5 0.7 0.5
Exports GS 4.7 5.1 5.3 5.1Imports GS 3.6 3.9 3.7 4.1
Output gap (as share of potential output) -5.1 -4.2 -3.4 -2.5Unemployment rate 24.9 23.8 22.6 21.4Current account (share of GDP) 0.6 0.7 1.1 1.2
(Growth rates, unless otherwise noted)Spain: Selected Indicators
SPAIN
INTERNATIONAL MONETARY FUND 11
Household finances remaining constrained by their high debt and low savings rate, as well as by high unemployment and modest wage growth.
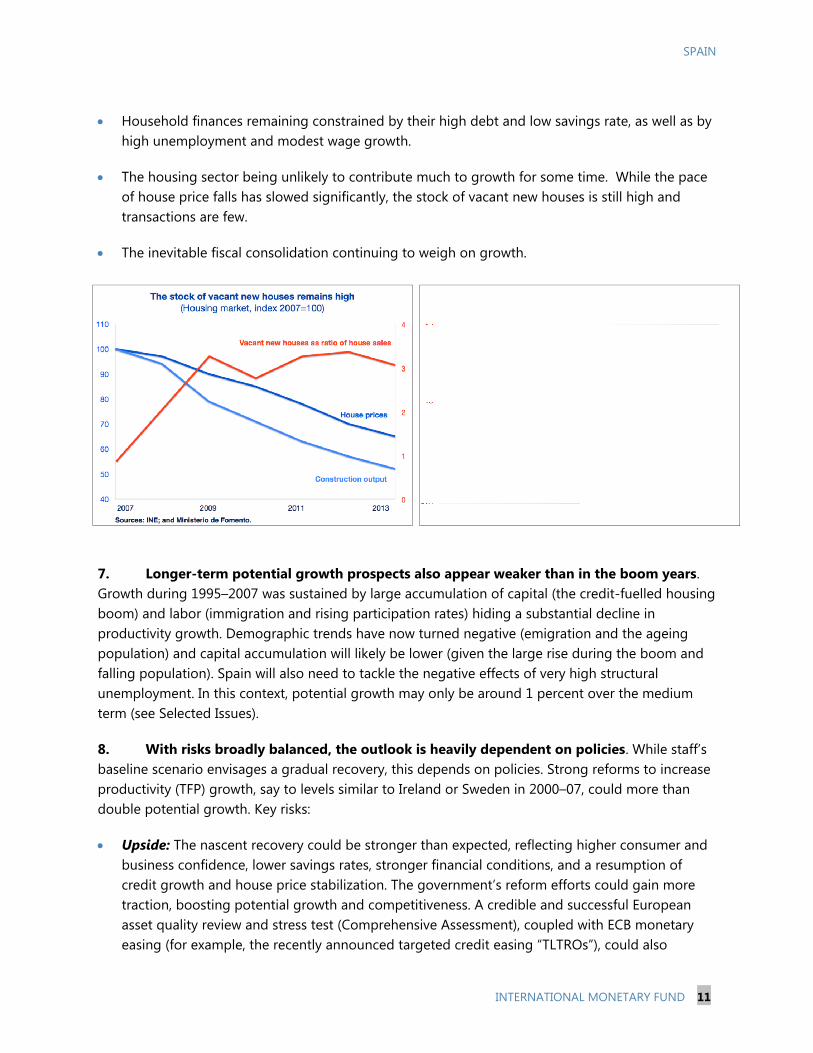
The housing sector being unlikely to contribute much to growth for some time. While the pace of house price falls has slowed significantly, the stock of vacant new houses is still high and transactions are few.
The inevitable fiscal consolidation continuing to weigh on growth.
7. Longer-term potential growth prospects also appear weaker than in the boom years. Growth during 1995–2007 was sustained by large accumulation of capital (the credit-fuelled housing boom) and labor (immigration and rising participation rates) hiding a substantial decline in productivity growth. Demographic trends have now turned negative (emigration and the ageing population) and capital accumulation will likely be lower (given the large rise during the boom and falling population). Spain will also need to tackle the negative effects of very high structural unemployment. In this context, potential growth may only be around 1 percent over the medium term (see Selected Issues).
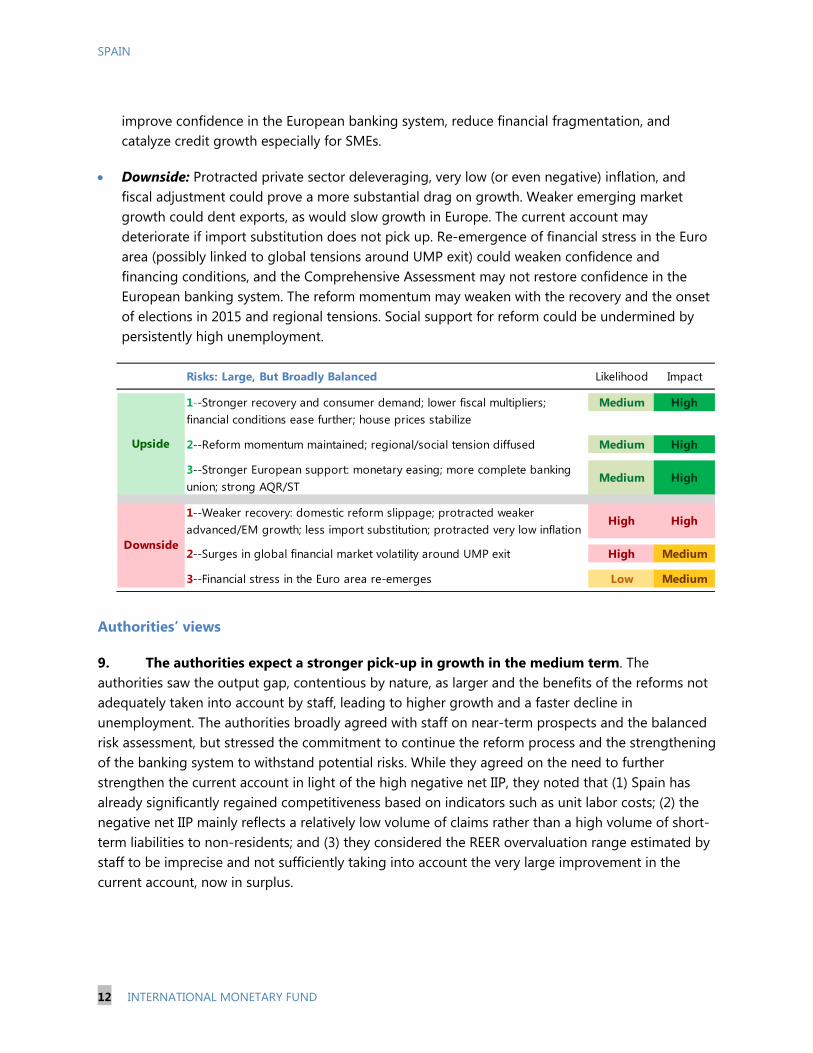
8. With risks broadly balanced, the outlook is heavily dependent on policies. While staff’s baseline scenario envisages a gradual recovery, this depends on policies. Strong reforms to increase productivity (TFP) growth, say to levels similar to Ireland or Sweden in 2000–07, could more than double potential growth. Key risks:
Upside: The nascent recovery could be stronger than expected, reflecting higher consumer and business confidence, lower savings rates, stronger financial conditions, and a resumption of credit growth and house price stabilization. The government’s reform efforts could gain more traction, boosting potential growth and competitiveness. A credible and successful European asset quality review and stress test (Comprehensive Assessment), coupled with ECB monetary easing (for example, the recently announced targeted credit easing “TLTROs”), could also
SPAIN
12 INTERNATIONAL MONETARY FUND
improve confidence in the European banking system, reduce financial fragmentation, and catalyze credit growth especially for SMEs.
Downside: Protracted private sector deleveraging, very low (or even negative) inflation, and fiscal adjustment could prove a more substantial drag on growth. Weaker emerging market growth could dent exports, as would slow growth in Europe. The current account may deteriorate if import substitution does not pick up. Re-emergence of financial stress in the Euro area (possibly linked to global tensions around UMP exit) could weaken confidence and financing conditions, and the Comprehensive Assessment may not restore confidence in the European banking system. The reform momentum may weaken with the recovery and the onset of elections in 2015 and regional tensions. Social support for reform could be undermined by persistently high unemployment.
Authorities’ views
9. The authorities expect a stronger pick-up in growth in the medium term. The authorities saw the output gap, contentious by nature, as larger and the benefits of the reforms not adequately taken into account by staff, leading to higher growth and a faster decline in unemployment. The authorities broadly agreed with staff on near-term prospects and the balanced risk assessment, but stressed the commitment to continue the reform process and the strengthening of the banking system to withstand potential risks. While they agreed on the need to further strengthen the current account in light of the high negative net IIP, they noted that (1) Spain has already significantly regained competitiveness based on indicators such as unit labor costs; (2) the negative net IIP mainly reflects a relatively low volume of claims rather than a high volume of short-term liabilities to non-residents; and (3) they considered the REER overvaluation range estimated by staff to be imprecise and not sufficiently taking into account the very large improvement in the current account, now in surplus.
Risks: Large, But Broadly Balanced Likelihood Impact
1--Stronger recovery and consumer demand; lower fiscal multipliers; Medium Highfinancial conditions ease further; house prices stabilize
2--Reform momentum maintained; regional/social tension diffused Medium High
3--Stronger European support: monetary easing; more complete banking union; strong AQR/ST
Medium High
1--Weaker recovery: domestic reform slippage; protracted weaker advanced/EM growth; less import substitution; protracted very low inflation
High High
2--Surges in global financial market volatility around UMP exit High Medium
3--Financial stress in the Euro area re-emerges Low Medium
Upside
Downside
SPAIN
INTERNATIONAL MONETARY FUND 13
THE POLICY AGENDA: GROWTH AND JOBS
A. Strategy
10. Spain’s overarching macro policy priority is to ensure the recovery is strong and long-lasting. Critically, the recovery also has to be inclusive, especially so that the unemployed benefit from more job opportunities. This means:
Helping firms expand, hire, and invest. Firms have been under incessant pressure to reduce costs, including by cutting jobs. The necessary process of reducing firms’ debt could help growth and job creation if more of it were to come from creditors restructuring the excessive debt of operationally-viable firms. Efforts should also continue to bolster banks’ ability to support the economy.
Lowering regulatory barriers. Lowering regulatory barriers that constrain Spain’s businesses would help them become more efficient and increase employment. Together with continued wage moderation, this would help ensure the recovery translates into more jobs for the unemployed, greater job security for the employed, and lower costs of living. To ensure that the low-skilled unemployed are hired, these actions should be accompanied by more ambitious policies to improve their skills, but also to reduce the high tax cost of employing them.
Pursuing growth- and job-friendly fiscal consolidation. Spain has made strong progress in cutting its deficit in the last two years in highly challenging conditions. But the deficit is still very large, and debt is rapidly approaching 100 percent of GDP. Getting debt to trend down is vital to ensure the recovery is long-lasting and will require further efforts to reduce the deficit. These efforts need to be gradual and well-designed to minimize the drag on growth and employment. They also need to be complemented by reforms that boost growth and employment, which will ease the consolidation process.
More support from Europe. Action to address low inflation and financial fragmentation in the Euro area would help the recovery in both the Euro area and in Spain.
11. A comprehensive, multi-year, approach. Implementing these reforms should make the recovery much stronger and more job-rich. But the gains may not be enough to generate the high and sustained growth rates that Spain needs to reduce unemployment to international norms and to catch up with its higher income peers in Europe. This can be done—Sweden in the 1990s, Australia in the 1980s point the way. But it may require more fundamental and wide-ranging
SPAIN
14 INTERNATIONAL MONETARY FUND
reforms beyond those laid out in this report, including in areas like education, institutions, barriers keeping firms small, and a cross-party determination to carry them out over many years. Clear and ambitious goals (e.g. getting to the Top 10 in the Doing Business Indicators) could help define such a roadmap and build national consensus for the more difficult reforms.
B. Private Debt—Reducing Debt Overhang
Context
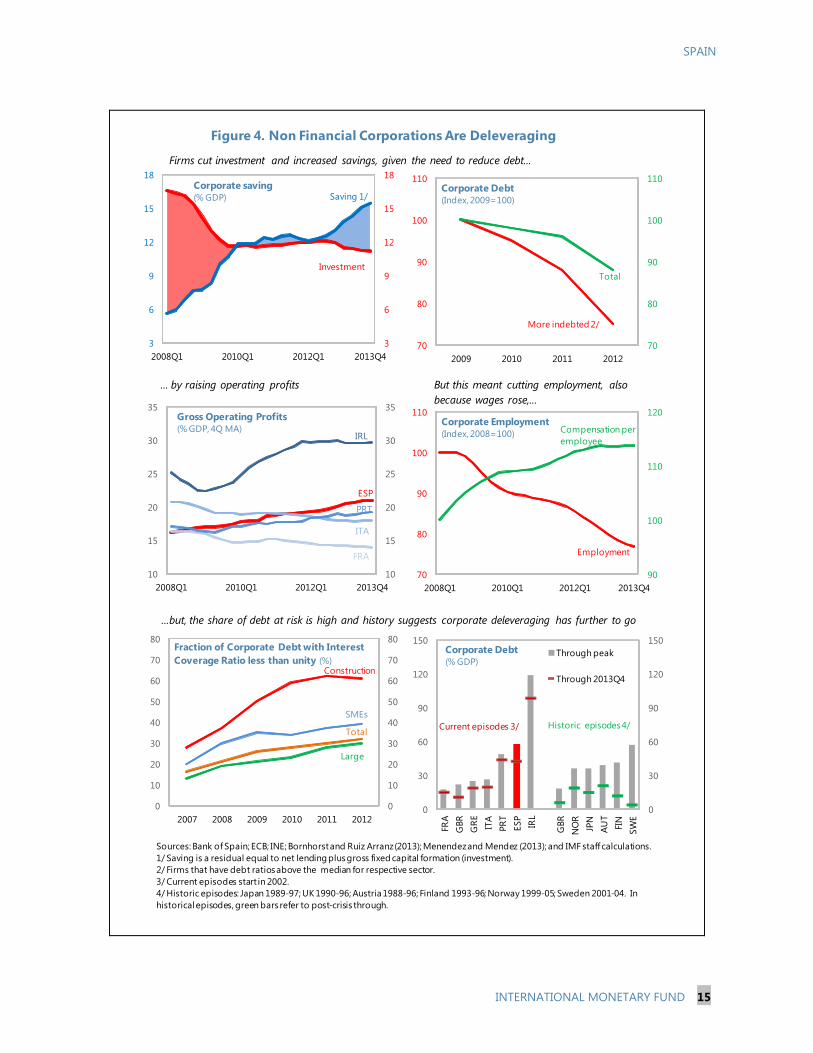
12. Private sector debt, while falling, remains very high (Figure 4). Firms have been reducing their debt faster than households, mainly via a sharp fall in net borrowing. This reflected sharply lower investment and rising profit margins, the latter partly via a reduction in employment. The decline in debt, investment, and employment has been more acute in those sectors that were more leveraged before the crisis: the construction/real estate sector and SMEs.
13. The steadily-rising share of firms under financial distress undermines the strength of the overall recovery. Some of these firms may not be operationally viable. But others may be viable and would invest, hire, and grow were it not for their excessive debt burden. By reducing these firms’ financial stress and allowing them to grow, all parties could gain. The government has recently introduced measures to facilitate out-of-court debt restructuring for viable firms under financial stress (see Selected Issues). These include a mediation process for smaller firms and, for larger firms, legal and regulatory incentives for debt-to-equity swaps. Further, the government recently announced plans to: (1) strengthen the in-court debt restructuring process along the lines of the recent enhancements in out-of-court mechanisms (2) foster liquidation as a going concern (i.e., transferring the business as a whole) instead of piecemeal liquidation (3) introduce a code of good practice to facilitate debt restructuring for SMEs and the self-employed and (4) create an inter-ministerial committee to monitor the debt restructuring process.
Staff views
14. A more comprehensive, pro-active, strategy would help address private, especially SME, debt overhang. The recent measures go in the right direction, but more measures are likely necessary to accelerate the corporate restructuring process for viable debtors and assist the recovery. In court restructuring options are too limited, and processes are too expensive and slow. Public creditors (tax agency, social security) have little flexibility for out-of-court debt restructuring and are not brought to the negotiating table with other creditors, which is particularly problematic for SMEs. A comprehensive and voluntary strategy, catalyzed by the official sector and aligning the incentives of all stakeholders, could “fast-forward” the restructuring and enhance growth prospects (for example, Korea in the late 1990s). An oversight body, with both public and private participation, could usefully oversee, coordinate, and drive the overall process, including by reporting qualitative and quantitative debt restructuring statistics.
15. The authorities could usefully evaluate “all the tools of the trade” to support corporate restructuring. Based on international experience, these include: (1) further increasing the
SPAIN
INTERNATIONAL MONETARY FUND 15
Sources: Bank of Spain; ECB; INE; Bornhorst and Ruiz Arranz (2013); Menendez and Mendez (2013); and IMF staff calculations.1/ Saving is a residual equal to net lending plus gross fixed capital formation (investment).2/ Firms that have debt ratios above the median for respective sector. 3/ Current episodes start in 2002.4/ Historic episodes: Japan 1989-97; UK 1990-96; Austria 1988-96; Finland 1993-96; Norway 1999-05; Sweden 2001-04. In historical episodes, green bars refer to post-crisis through.
Figure 4. Non Financial Corporations Are Deleveraging
... by raising operating profits But this meant cutting employment, also because wages rose,...
Firms cut investment and increased savings, given the need to reduce debt...
0
30
60
90
120
150
0
30
60
90
120
150
FRA
GBR
GRE ITA
PRT
ESP
IRL
GBR
NO
RJP
NAU
TFI
NSW
E
Corporate Debt(% GDP)
Through peak
Through 2013Q4
Historic episodes 4/Current episodes 3/
...but, the share of debt at risk is high and history suggests corporate deleveraging has further to go
90
100
110
120
70
80
90
100
110
2008Q1 2010Q1 2012Q1 2013Q4
Corporate Employment(Index, 2008=100)
Employment
Compensation per employee
70
80
90
100
110
70
80
90
100
110
2009 2010 2011 2012
Corporate Debt(Index, 2009=100)
More indebted 2/
Total
10
15
20
25
30
35
10
15
20
25
30
35
2008Q1 2010Q1 2012Q1 2013Q4
Gross Operating Profits(% GDP, 4Q MA)
ESP
IRL
FRA
ITA
PRT
0
10
20
30
40
50
60
70
80
0
10
20
30
40
50
60
70
80
2007 2008 2009 2010 2011 2012
Fraction of Corporate Debt with Interest Coverage Ratio less than unity (%)
SMEs
Construction
Large
Total
3
6
9
12
15
18
3
6
9
12
15
18
2008Q1 2010Q1 2012Q1 2013Q4
Corporate saving(% GDP) Saving 1/
Investment
SPAIN
16 INTERNATIONAL MONETARY FUND
effectiveness of in court and out of court workouts by providing more tools to public creditors to fully engage in the process (to maximize tax collection from a forward-looking perspective), facilitating going concern sales, speeding up procedures, and introducing a personal insolvency regime to help individual entrepreneurs; (2) for larger firms, issuing centralized guidelines for voluntary out of court workouts, coupled with independent mediation by a centralized body ; and (3) for SMEs, developing a menu of standardized voluntary workouts for operationally viable firms, including harmonized restructuring terms, and indicative targets for financial institutions to offer/agree to restructurings. In this regard, the recently-announced plans to continue improving the corporate debt restructuring process are thus highly welcome. Authorities’ views
16. The authorities were open to further measures to grease the corporate restructuring machinery. While they viewed recent measures as having addressed the most important issues and the restructuring process as proceeding at an appropriate pace, they saw merit in the idea of a coordinating body to oversee the process. The authorities also saw a possible role for a code of good practices, similar to the one for individuals.
17. The authorities stressed that recent reforms to the insolvency regime are significant, and further reforms should be examined with caution. The recent reforms introduced to facilitate out of court restructuring are promising and time is needed to assess their effectiveness. However, they are considering further reforms to (1) increase the scope and flexibility of in court restructuring options; (2) speed up in court procedures; and (3) harmonize out of court mechanisms, including those for SMEs. The authorities were skeptical about involving public creditors more fully in restructuring processes (recognizing actions already in force that are poorly known by the public, and the need to analyze the effective share of public credit in the total debt of these companies) and were concerned that introducing it at the current juncture could undermine Spain’s strong payment culture and jeopardize financial stability. In their view, introducing a personal insolvency framework with a possibility of a fresh start may warrant consideration in the medium term, but should be carefully studied.
C. Banks—Encouraging Lending
Context
18. The ESM-supported program was successfully completed in January 2014 (see staff’s final monitoring report). The efforts helped make the system stronger, safer, and better able to support the recovery.
Capital has been bolstered. The Core Tier 1 ratio reached 11.8 percent at end-2013,
SPAIN
INTERNATIONAL MONETARY FUND 17
compared with 9.6 percent at the start of the financial sector program, due to injections of public capital, equity issuance, bail-in, constraints on dividends, and shrinking risk-weighted assets (the result of deleveraging and the transfer of risky assets out of banks’ balance sheets).
Provisioning has increased. The coverage ratio (specific reserves to NPLs) rose to 46 percent at end-2013, up from 36 percent at the start of the program.
Funding has become cheaper and more stable. Deposit and wholesale funding rates fell substantially during the program. Deposits volumes also stabilized with fewer non-resident deposits; reliance on debt issuance and ECB borrowing fell.
Market confidence has returned. Banks’ equity prices have risen strongly—price to book ratios are above unity for the system and above European peers. Bank risk premia (CDS spreads) are much lower.
Correspondingly, there has been some upside surprise in the sale prices of some public stakes in state-intervened institutions, and banks have been able to sell some problem loan portfolios to foreign investors.
But the system still faces important challenges.
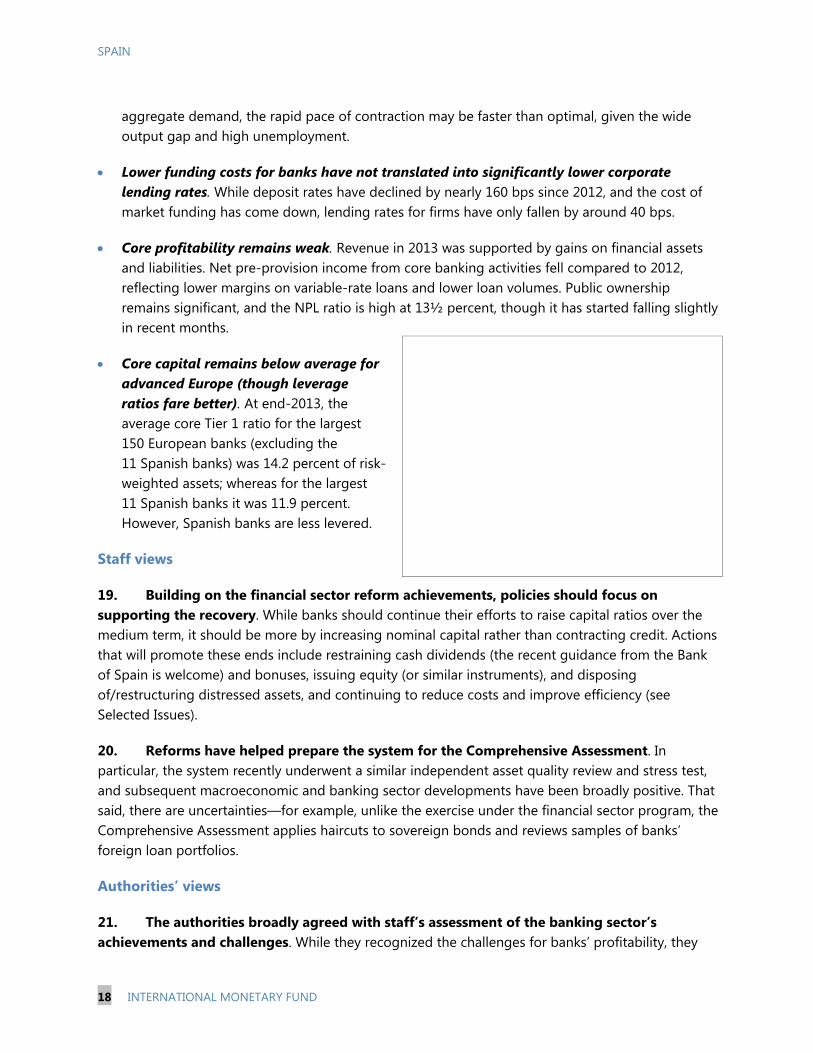
Credit is contracting rapidly. This outcome reflects a variety of factors, including weak credit demand, elevated default risk, and the necessary deleveraging of an overleveraged private sector. That said, the pace of credit contraction, with bank credit to firms declining by about 11 percent in March, is one of the fastest amongst advanced economies and only marginally reflects the contraction of the real estate sector. To the degree that credit contraction comes at the cost of less
SPAIN
18 INTERNATIONAL MONETARY FUND
aggregate demand, the rapid pace of contraction may be faster than optimal, given the wide output gap and high unemployment.
Lower funding costs for banks have not translated into significantly lower corporate lending rates. While deposit rates have declined by nearly 160 bps since 2012, and the cost of market funding has come down, lending rates for firms have only fallen by around 40 bps.
Core profitability remains weak. Revenue in 2013 was supported by gains on financial assets and liabilities. Net pre-provision income from core banking activities fell compared to 2012, reflecting lower margins on variable-rate loans and lower loan volumes. Public ownership remains significant, and the NPL ratio is high at 13½ percent, though it has started falling slightly in recent months.
Core capital remains below average for advanced Europe (though leverage ratios fare better). At end-2013, the average core Tier 1 ratio for the largest 150 European banks (excluding the 11 Spanish banks) was 14.2 percent of risk-weighted assets; whereas for the largest 11 Spanish banks it was 11.9 percent. However, Spanish banks are less levered.
Staff views
19. Building on the financial sector reform achievements, policies should focus on supporting the recovery. While banks should continue their efforts to raise capital ratios over the medium term, it should be more by increasing nominal capital rather than contracting credit. Actions that will promote these ends include restraining cash dividends (the recent guidance from the Bank of Spain is welcome) and bonuses, issuing equity (or similar instruments), and disposing of/restructuring distressed assets, and continuing to reduce costs and improve efficiency (see Selected Issues).
20. Reforms have helped prepare the system for the Comprehensive Assessment. In particular, the system recently underwent a similar independent asset quality review and stress test, and subsequent macroeconomic and banking sector developments have been broadly positive. That said, there are uncertainties―for example, unlike the exercise under the financial sector program, the Comprehensive Assessment applies haircuts to sovereign bonds and reviews samples of banks’ foreign loan portfolios.
Authorities’ views
21. The authorities broadly agreed with staff’s assessment of the banking sector’s achievements and challenges. While they recognized the challenges for banks’ profitability, they
SPAIN
INTERNATIONAL MONETARY FUND 19
expected improvement in margins due to (1) deposits rolling over at lower rates (2) the efforts to reduce operating costs and (3) lower provisioning needs. The authorities also viewed the system as well-prepared for the Comprehensive Assessment.
D. Labor Market—Spurring Employment
Context
22. The labor reform is gaining traction, helping improve employment dynamics early in the recovery. The 2012 reform (together with agreement by social partners on wages) appears to be moderating wage increases and creating jobs, suggesting the reform may have lowered the growth threshold for generating positive net employment (previously the economy needed to grow close to 2 percent). Evidence from surveys of firms also suggests that firms with more wage moderation are most likely to maintain or expand employment.
23. The government has also taken additional steps to help foster employment. It introduced a temporary reduction in employer’s social security contributions for new (net) hiring on permanent contracts in 2014. A reform of active labor market policies was launched in 2013 with greater focus on results. There is also a new initiative for youth employment to improve training/subsidies, quality of jobs, and promote entrepreneurship.
24. But more measures appear necessary to tackle the enormous employment challenge. The prospects for reducing unemployment over the medium term to levels close to Spain’s European peers are dim. Structural unemployment is estimated at very high levels by OECD and EC (above 20 percent). Even the government’s projections envisage unemployment above 19 percent by 2017. This reflects limited progress in addressing some of the structural labor market weaknesses. Over the six years of the crisis, wages have
been slow to respond, putting the burden of adjustment on employment. The constraints at the firm level to adjust labor conditions to the crisis also contributed to the exceptionally large job losses and to the closing of firms. The greater flexibility for firm-level agreements is beginning to be used, mainly by large firms.
SPAIN
20 INTERNATIONAL MONETARY FUND
The high degree of labor market duality is part of the problem. As the OECD review (2013) notes, the Spanish labor market is segmented between well-protected “insiders” on permanent contracts and precarious “outsiders”, who cycle between temporary jobs and unemployment. This institutional set up encourages rigidity in wage demands by insiders, since it places the burden of adjustment on outsiders (who have the same wages but lower firing costs). It also hurts productivity, as there is less investment in temporary workers and long spells in unemployment reduce human capital.
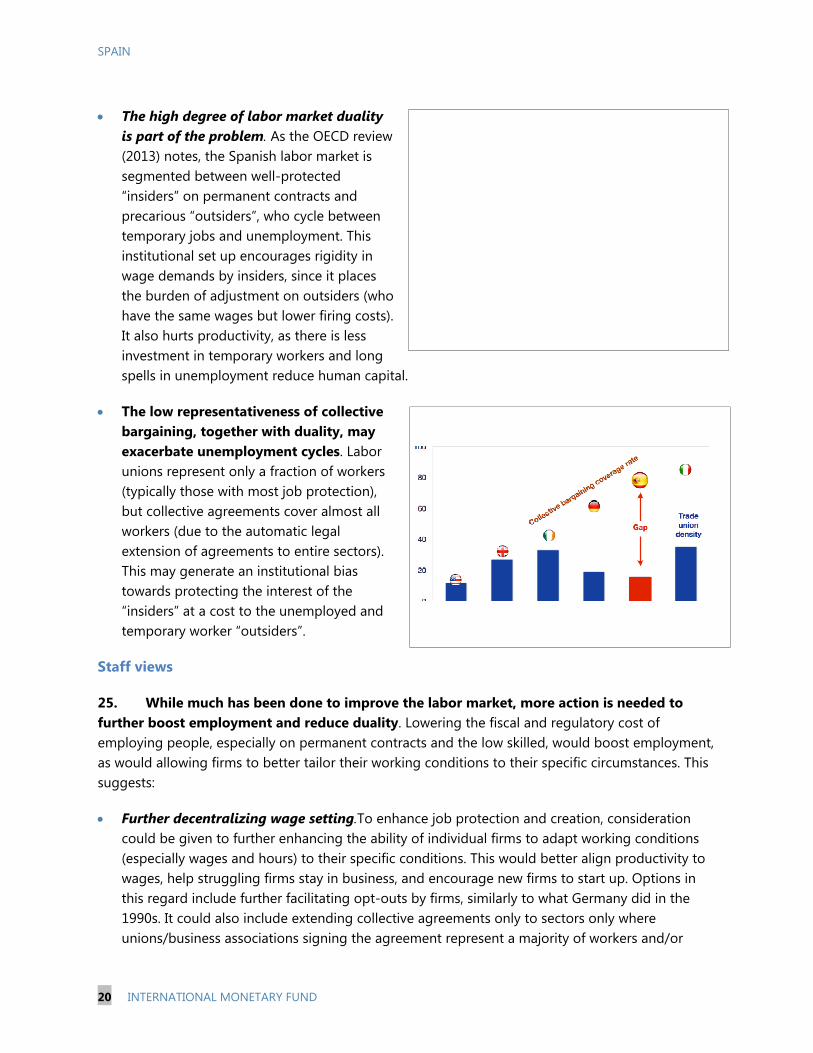
The low representativeness of collective bargaining, together with duality, may exacerbate unemployment cycles. Labor unions represent only a fraction of workers (typically those with most job protection), but collective agreements cover almost all workers (due to the automatic legal extension of agreements to entire sectors). This may generate an institutional bias towards protecting the interest of the “insiders” at a cost to the unemployed and temporary worker “outsiders”.
Staff views
25. While much has been done to improve the labor market, more action is needed to further boost employment and reduce duality. Lowering the fiscal and regulatory cost of employing people, especially on permanent contracts and the low skilled, would boost employment, as would allowing firms to better tailor their working conditions to their specific circumstances. This suggests:
Further decentralizing wage setting.To enhance job protection and creation, consideration could be given to further enhancing the ability of individual firms to adapt working conditions (especially wages and hours) to their specific conditions. This would better align productivity to wages, help struggling firms stay in business, and encourage new firms to start up. Options in this regard include further facilitating opt-outs by firms, similarly to what Germany did in the 1990s. It could also include extending collective agreements only to sectors only where unions/business associations signing the agreement represent a majority of workers and/or
SPAIN
INTERNATIONAL MONETARY FUND 21
increasing the number of employees for a firm to be automatically covered (e.g. Finland, Italy), thus assisting SMEs.
Cutting employer social security contributions for the low paid. These taxes are among the highest in Europe and could be a major constraint on labor demand, especially for the low skilled. The fiscal cost could be offset by broader tax reform (see Section F).
Reducing duality by making hiring on permanent contracts more attractive. This can be achieved, for example, by increasing dismissal costs for new permanent contracts gradually with tenure and from a lower initial level (severance payments for permanent contracts remain above the OECD average). It would also be less costly to the budget than subsidizing permanent contracts.
Improving active labor market policies to improve the skills of the unemployed and to help them find work. To a large extent this means implementing aggressively the new employment strategy (including for youth unemployment), especially by regions. For example, implementing plans to more widely use private job placement agencies, improving training services, including by opening them up to competition, and establishing a single portal for job vacancies throughout Spain.
Authorities’ views
26. The authorities noted the increasing success of the labor reform and argued the focus should be on implementation, especially of active labor market policies. The 2012 labor reform has helped achieve wage moderation, greater internal flexibility for firms, and create jobs early in the recovery. The focus is now on active employment policies, especially implementing the new strategy based on results and public-private partnerships. The authorities saw some merit in principle with staff’s proposal to reduce social security contributions for the low skilled, but stressed the similar benefits from the recent flat rate for permanent contracts that needed to be assessed before considering changes, and the fiscal cost of staff’s proposal.
E. Improving the Business Environment
Context
27. Spain will need to significantly raise productivity to sustain high growth. Despite strong growth performance in the pre-crisis period, this was entirely due to large accumulation of capital (partly the construction boom) and labor (large-scale immigration and rising participation rates).
SPAIN
22 INTERNATIONAL MONETARY FUND
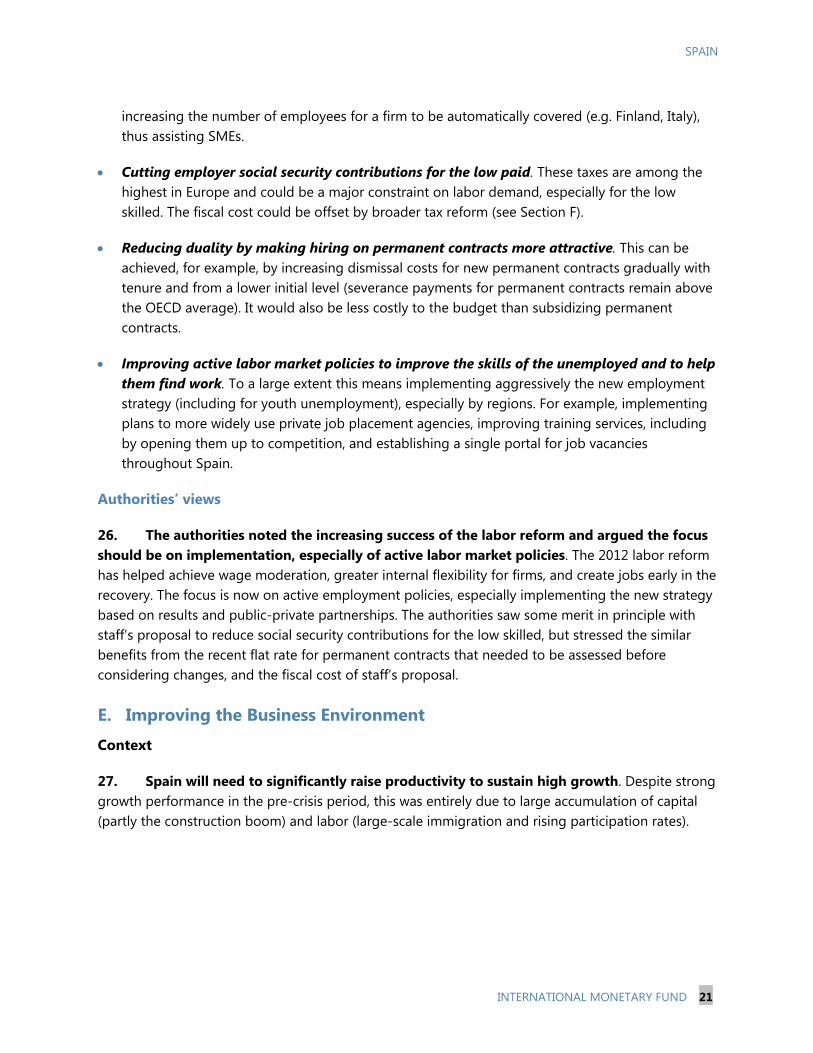
Total factor productivity (TFP) growth has been on a declining trend since the 1990s. Spain and Italy had the worst productivity performance among OECD economies in the years preceding the crisis. While it rebounded somewhat recently, the improvement partially reflects temporary factors (e.g. large labor shedding in the construction sector), and TFP growth remains low (see Selected Issues).
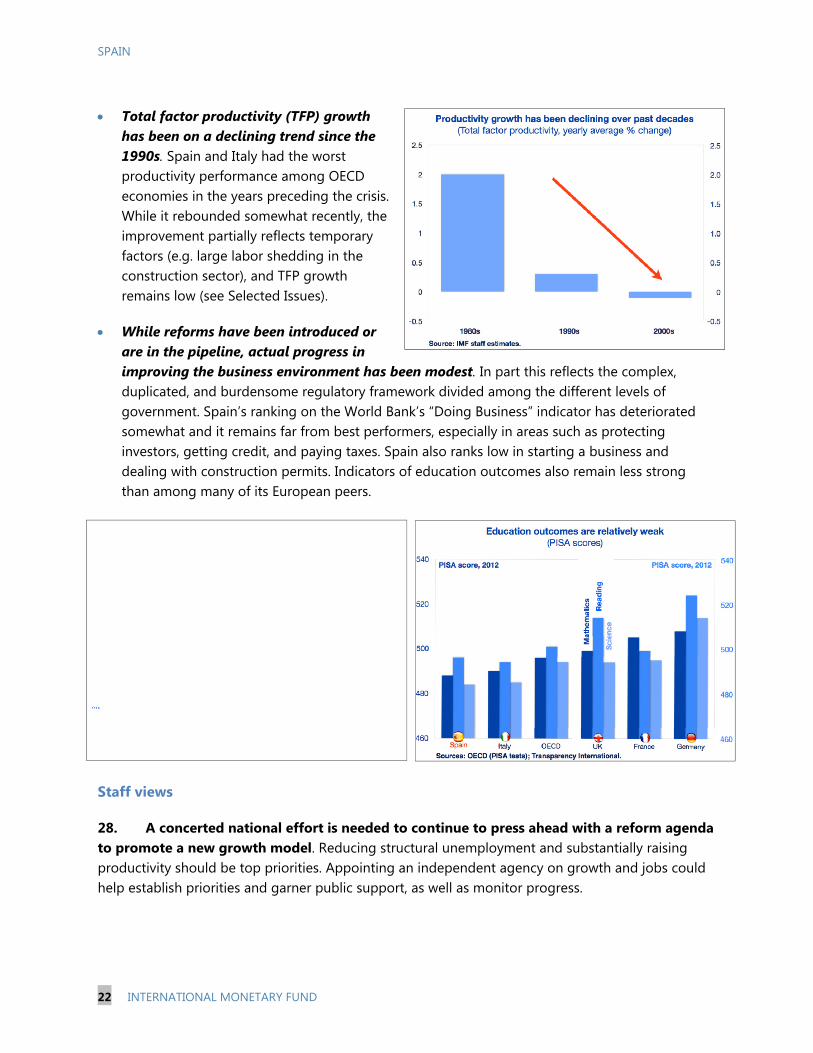
While reforms have been introduced or are in the pipeline, actual progress in improving the business environment has been modest. In part this reflects the complex, duplicated, and burdensome regulatory framework divided among the different levels of government. Spain’s ranking on the World Bank’s “Doing Business” indicator has deteriorated somewhat and it remains far from best performers, especially in areas such as protecting investors, getting credit, and paying taxes. Spain also ranks low in starting a business and dealing with construction permits. Indicators of education outcomes also remain less strong than among many of its European peers.
Staff views
28. A concerted national effort is needed to continue to press ahead with a reform agenda to promote a new growth model. Reducing structural unemployment and substantially raising productivity should be top priorities. Appointing an independent agency on growth and jobs could help establish priorities and garner public support, as well as monitor progress.
SPAIN
INTERNATIONAL MONETARY FUND 23
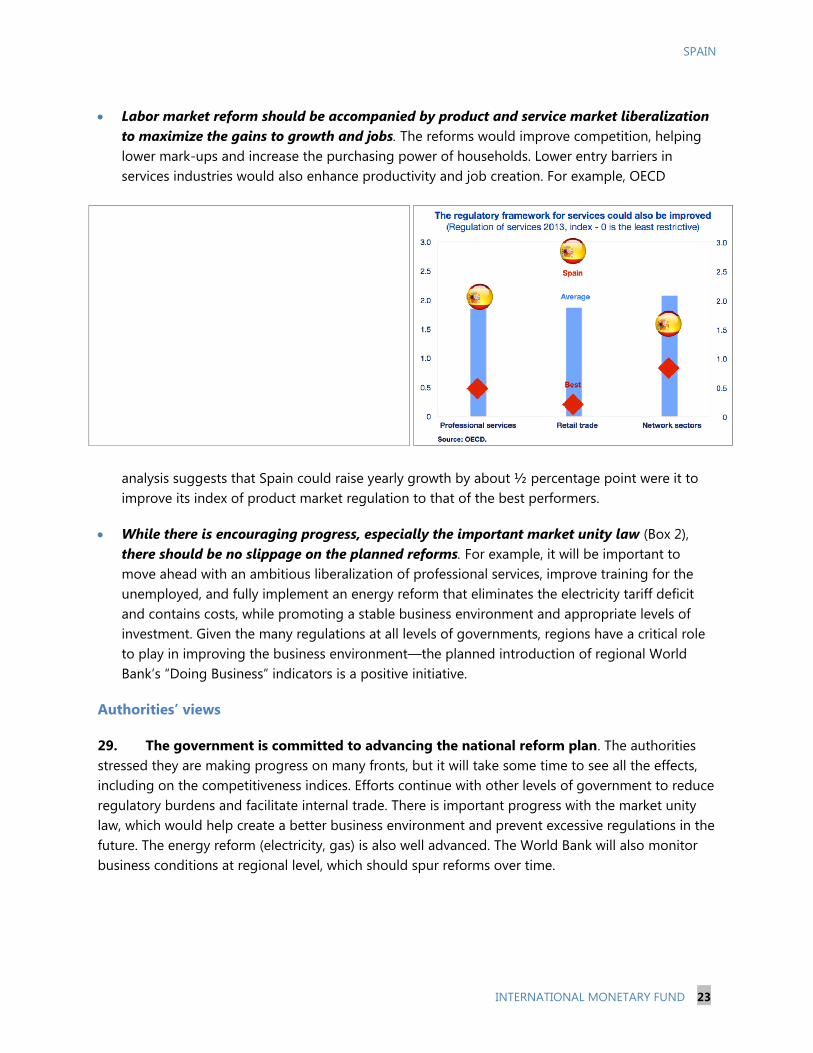
Labor market reform should be accompanied by product and service market liberalization to maximize the gains to growth and jobs. The reforms would improve competition, helping lower mark-ups and increase the purchasing power of households. Lower entry barriers in services industries would also enhance productivity and job creation. For example, OECD
analysis suggests that Spain could raise yearly growth by about ½ percentage point were it to improve its index of product market regulation to that of the best performers.
While there is encouraging progress, especially the important market unity law (Box 2), there should be no slippage on the planned reforms. For example, it will be important to move ahead with an ambitious liberalization of professional services, improve training for the unemployed, and fully implement an energy reform that eliminates the electricity tariff deficit and contains costs, while promoting a stable business environment and appropriate levels of investment. Given the many regulations at all levels of governments, regions have a critical role to play in improving the business environment—the planned introduction of regional World Bank’s “Doing Business” indicators is a positive initiative.
Authorities’ views
29. The government is committed to advancing the national reform plan. The authorities stressed they are making progress on many fronts, but it will take some time to see all the effects, including on the competitiveness indices. Efforts continue with other levels of government to reduce regulatory burdens and facilitate internal trade. There is important progress with the market unity law, which would help create a better business environment and prevent excessive regulations in the future. The energy reform (electricity, gas) is also well advanced. The World Bank will also monitor business conditions at regional level, which should spur reforms over time.
SPAIN
24 INTERNATIONAL MONETARY FUND
Box 2. Reducing Regulatory Barriers to Trade Across Spain: The Market Unity Reform
Spain is undertaking a major reform aimed at reducing barriers to trade across Spain’s different regions. Firms operating in Spain face at least three different, and sometimes overlapping, layers of regulations (central, regional, and local). The Market Unity program, approved by the Spanish government in 2012, is intended to reduce the fragmentation of the domestic market by rationalizing the regulatory framework for economic activities, reinforcing cooperation among administrations, and by encouraging a new culture based on smart regulation.
The law on the Market Unity is the cornerstone of the program. It defines the principles, operational framework, appeal process, resolution procedures, and cooperation and supervision networks. Under the law, an ambitious screening process is being carried at all levels of government—about 2,700 regulatory barriers have already been identified (mainly at the subnational level) and, as such, are in contradiction to the new law—the next step is to eliminate them.
The reform introduced a new, expeditious, appeal process for companies. As an alternative to administrative appeals, firms can enter into an expeditious appeal process when the public action (e.g. regulations, licensing requirements) is in contradiction to market unity and creates barriers to business or trade across regions. The appeal process is done through the Secretary of Market Unity—an agency that assists the Council of Market Unity. While the process is still in its infancy, there have already been already a few successful cases (e.g. barriers to sell agricultural and pharmaceutical products across different regions).
The success of the reform will require strong commitment, and cooperation, by both central and subnational governments. Existing regulations need to be swiftly aligned to the new legal framework. New legislation/regulation will also need to be compliant. Adequate resources need to be available to ensure the appeal process, a crucial feature of the reform, is effective.
F. Fiscal Policy—Minimizing the Drag on Growth
Context
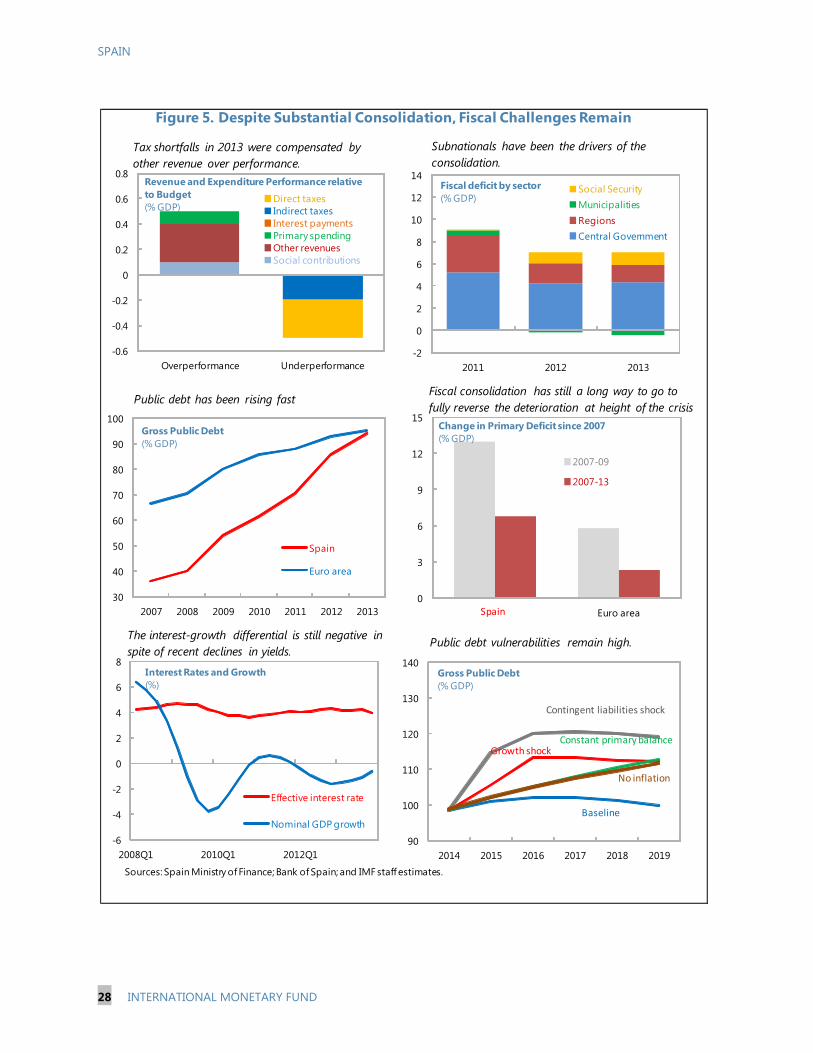
30. Fiscal consolidation continued in 2013, but public debt is still rising (Figure 5). Even as the authorities sought to minimize the negative impulse to demand through a gradual adjustment, Spain still achieved a remarkable reduction of the fiscal deficit during 2012–13 in the middle of a recession. But the overall deficit is still very large, and debt, already above the Euro area average, is rapidly approaching 100 percent of GDP. Putting debt onto a firmly-declining path to reduce vulnerabilities, consistent with EU rules, requires maintaining a primary surplus of at least 2 percent of GDP. This entails improving the primary balance by some 6 percent of GDP compared with 2013, about the same as the improvement since 2009 (though macroeconomic conditions will likely be much more favorable).
31. The quality of fiscal consolidation is improving. While fiscal consolidation has at times relied on across-the-board spending measures, compression of public investment, and ad hoc tax increases, policy is shifting towards more efficient ways to spend and raise revenues. In particular:
A strong pension reform was passed that is designed to ensure the sustainability of the system.
SPAIN
INTERNATIONAL MONETARY FUND 25
A public administration reform (CORA) to reduce wasteful spending by eliminating duplication and overlapping functions within and across different government levels is ongoing.
The recently-created fiscal council (AIReF) should improve the credibility and design of the fiscal consolidation process, including by monitoring and evaluating policies at all government levels.
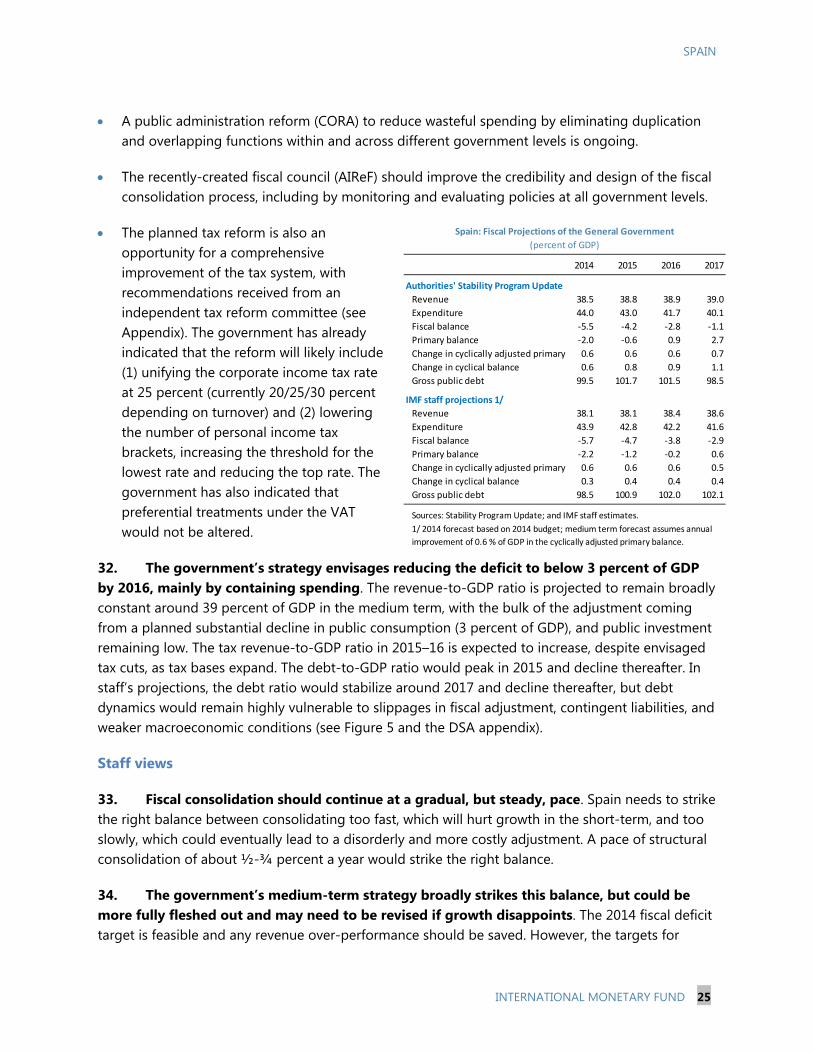
The planned tax reform is also an opportunity for a comprehensive improvement of the tax system, with recommendations received from an independent tax reform committee (see Appendix). The government has already indicated that the reform will likely include (1) unifying the corporate income tax rate at 25 percent (currently 20/25/30 percent depending on turnover) and (2) lowering the number of personal income tax brackets, increasing the threshold for the lowest rate and reducing the top rate. The government has also indicated that preferential treatments under the VAT would not be altered.
32. The government’s strategy envisages reducing the deficit to below 3 percent of GDP by 2016, mainly by containing spending. The revenue-to-GDP ratio is projected to remain broadly constant around 39 percent of GDP in the medium term, with the bulk of the adjustment coming from a planned substantial decline in public consumption (3 percent of GDP), and public investment remaining low. The tax revenue-to-GDP ratio in 2015–16 is expected to increase, despite envisaged tax cuts, as tax bases expand. The debt-to-GDP ratio would peak in 2015 and decline thereafter. In staff’s projections, the debt ratio would stabilize around 2017 and decline thereafter, but debt dynamics would remain highly vulnerable to slippages in fiscal adjustment, contingent liabilities, and weaker macroeconomic conditions (see Figure 5 and the DSA appendix).
Staff views
33. Fiscal consolidation should continue at a gradual, but steady, pace. Spain needs to strike the right balance between consolidating too fast, which will hurt growth in the short-term, and too slowly, which could eventually lead to a disorderly and more costly adjustment. A pace of structural consolidation of about ½-¾ percent a year would strike the right balance.
34. The government’s medium-term strategy broadly strikes this balance, but could be more fully fleshed out and may need to be revised if growth disappoints. The 2014 fiscal deficit target is feasible and any revenue over-performance should be saved. However, the targets for
2014 2015 2016 2017
Authorities' Stability Program Update
Revenue 38.5 38.8 38.9 39.0
Expenditure 44.0 43.0 41.7 40.1
Fiscal balance -5.5 -4.2 -2.8 -1.1
Primary balance -2.0 -0.6 0.9 2.7
Change in cyclically adjusted primary 0.6 0.6 0.6 0.7
Change in cyclical balance 0.6 0.8 0.9 1.1
Gross public debt 99.5 101.7 101.5 98.5
IMF staff projections 1/
Revenue 38.1 38.1 38.4 38.6
Expenditure 43.9 42.8 42.2 41.6
Fiscal balance -5.7 -4.7 -3.8 -2.9
Primary balance -2.2 -1.2 -0.2 0.6
Change in cyclically adjusted primary 0.6 0.6 0.6 0.5
Change in cyclical balance 0.3 0.4 0.4 0.4
Gross public debt 98.5 100.9 102.0 102.1
Sources: Stability Program Update; and IMF staff estimates.
Spain: Fiscal Projections of the General Government
(percent of GDP)
1/ 2014 forecast based on 2014 budget; medium term forecast assumes annual
improvement of 0.6 % of GDP in the cyclically adjusted primary balance.
SPAIN CORRECTED: 7/2/14
26 INTERNATIONAL MONETARY FUND
2015–17 may need to be relaxed if nominal GDP growth disappoints (while maintaining the underlying improvement), and vice versa if nominal GDP growth exceeds projections. A more detailed specification of the projected fiscal measures, especially after 2015, and more conservative assumptions on the impact of tax reform, would add to credibility and reduce uncertainty.
35. While there is further scope for improving spending efficiency, there is a case for revenue to play a larger role.
The public administration reform (CORA) is a welcome initiative. It could usefully be complemented by a public expenditure review (as in the UK and Italy) across all levels of government of key functions. Improving the targeting of social spending could increase the protection of the most vulnerable and generate efficiency savings.
Given the size of the adjustment still required, Spain’s relatively low revenue ratio compared to its Euro area peers, and the possibly increasingly limited scope for high-quality spending reductions, there is a case for relying more on revenue to achieve the consolidation goals.
36. The forthcoming tax reform is thus a critical opportunity to support the fiscal consolidation goals with a more growth and job friendly tax system. The main elements should include:
Enhancing the overall revenue ratio by relying more on indirect taxes. Raising excise duties and environmental levies, and gradually reducing preferential treatments in the VAT, would bring Spain’s collection effort more into line with its European peers. It will be critical to explicitly protect the most vulnerable by increasing the support for them via the transfer and tax system―possible options could include income tax credits for the low paid and enhancing regional minimum income programs.
Sharply cutting taxes on employing the low paid. The overriding need to generate jobs, especially for those with the lowest skills, argues for sharply and permanently cutting social
SPAIN
INTERNATIONAL MONETARY FUND 27
security contributions paid by employers on the low paid. International experience indicates that such measures are more likely to deliver a strong and durable impact on employment than those of a more temporary and less well-targeted nature (see Selected Issues). To protect the social security system, reductions in social security contributions should be in the form of tax credits financed by transfers from the budget.
Broadening the base of direct taxes by cutting exemptions and special treatments. To promote growth, encourage firms to become larger, and to avoid losing competitiveness, the base of corporate taxes should be broadened. This would give scope to reduce the top rate to 25 percent as planned, while still maintaining the effective rate (and thus revenue). The scope to significantly cut top personal income tax rates is limited, given the need to protect revenue and progressivity. Revenue and progressivity could also be enhanced by other measures, such as lowering the threshold for the top personal income tax rate and more fully using recurrent property and inheritance taxes, and reducing tax fraud.
Authorities’ views
37. While agreeing the fiscal targets over the next years are ambitious, the authorities are confident that they will be met, notably in the context of the envisaged strong recovery. The authorities underscored that the fiscal effort in recent years was among the highest in advanced economies, showing the deep commitment to preserve the sustainability of public finances. They also highlighted evidence on the high procyclicality of tax revenue bases, which explains why tax revenue-to-GDP ratios and the cyclical balance are likely to increase more in a context of a sustained recovery based on domestic demand.
38. The authorities concurred that a growth and job friendly fiscal consolidation would need to rely both on revenues and high quality spending. They saw more scope for additional spending savings, for instance, through the implementation of measures aimed at streamlining public administration at different government levels. The authorities saw scope for broadening the bases of income taxes, reducing tax evasion, and stressed the importance of ensuring income taxes incentivized economic activity. While agreeing in principle that there may be scope for increasing reliance on indirect taxes in the medium term, they did not see merit in increasing preferential VAT rates, especially as it could stifle the recovery. The authorities expect that the public debt-to-GDP ratio will start declining after 2015.
SPAIN
28 INTERNATIONAL MONETARY FUND
Figure 5. Despite Substantial Consolidation, Fiscal Challenges Remain
Sources: Spain Ministry of Finance; Bank of Spain; and IMF staff estimates.
Tax shortfalls in 2013 were compensated by other revenue over performance.
Public debt has been rising fast
The interest-growth differential is still negative in spite of recent declines in yields.
Public debt vulnerabilities remain high.
-0.6
-0.4
-0.2
0
0.2
0.4
0.6
0.8
Overperformance Underperformance
Revenue and Expenditure Performance relative to Budget(% GDP)
Direct taxesIndirect taxesInterest paymentsPrimary spendingOther revenuesSocial contributions
-2
0
2
4
6
8
10
12
14
2011 2012 2013
Fiscal deficit by sector (% GDP)
Social SecurityMunicipalitiesRegionsCentral Government
Subnationals have been the drivers of the consolidation.
30
40
50
60
70
80
90
100
2007 2008 2009 2010 2011 2012 2013
Spain
Euro area
Gross Public Debt (% GDP)
Fiscal consolidation has still a long way to go to fully reverse the deterioration at height of the crisis
0
3
6
9
12
15
Euro area
Change in Primary Deficit since 2007(% GDP)
2007-09
2007-13
Spain
-6
-4
-2
0
2
4
6
8
2008Q1 2010Q1 2012Q1
Effective interest rate
Nominal GDP growth
Interest Rates and Growth(%)
90
100
110
120
130
140
2014 2015 2016 2017 2018 2019
Gross Public Debt (% GDP)
Contingent liabilities shock
Baseline
Growth shockConstant primary balance
No inflation
SPAIN
INTERNATIONAL MONETARY FUND 29
G. Europe—Easing and Transmitting ECB policy
Context
39. Decisive action by Spain’s European partners has supported Spain’s recovery. In particular, the ECB’s LTROs and the OMTs have greatly contributed to the critically-important improvement in sovereign yields. Important progress has also been made in enhancing the banking union. However, Euro area inflation remains very low and could remain well below target for a protracted period. While the ECB has lowered its policy rate since 2011, it has not transmitted into lower lending rates for Spanish SMEs (which account for almost two thirds of total employment). On June 5, the ECB announced a further wide range of actions, including (1) lower policy rates; (2) targeted credit easing (TLTROs); and (3) extension of fixed rate full allotment.
Staff views
40. As described in Box 3, Euro Area policies could help the recovery in Spain. In particular, it could do so by lowering the borrowing costs of Spanish firms and households, reducing the risk of protracted very low, even negative, inflation, and by increasing demand across the Euro area and hence for Spanish exports. Staff has been recommending more monetary easing by the ECB to achieve the ECB’s price stability objective, and support Euro area demand while reducing financial fragmentation. Financial fragmentation would also be reduced by completing the banking union, including a common fiscal backstop, and a sound and credible Comprehensive Assessment. Recent ECB actions should help address insufficient demand (as evidenced by low inflation) and financial fragmentation in Spain, in particular, by providing term funding for bank credit to SMEs. But if Euro area inflation remains too low, the ECB should consider a more substantial balance sheet expansion, including through asset purchases.
Authorities’ views
41. While much has been achieved, the authorities agreed that further European actions are warranted. They noted that the monetary transmission mechanism remains impaired, and that financial fragmentation is a key driver for higher Spanish borrowing rates for SMEs (compared with European peer countries). They agreed that the recent actions by the ECB towards achieving its inflation target and repairing the transmission mechanism are warranted, and would also help Europe’s recovery. They also considered that a weaker Euro and stronger domestic demand by other Euro area countries would contribute towards rebalancing within the Euro area. The authorities emphasized their support for the recent banking union agreement.
SPAIN
30 INTERNATIONAL MONETARY FUND
Box 3. How Policies in the Euro Area Could Help Spain’s Ongoing Adjustment
Supportive monetary policy to achieve inflation targets
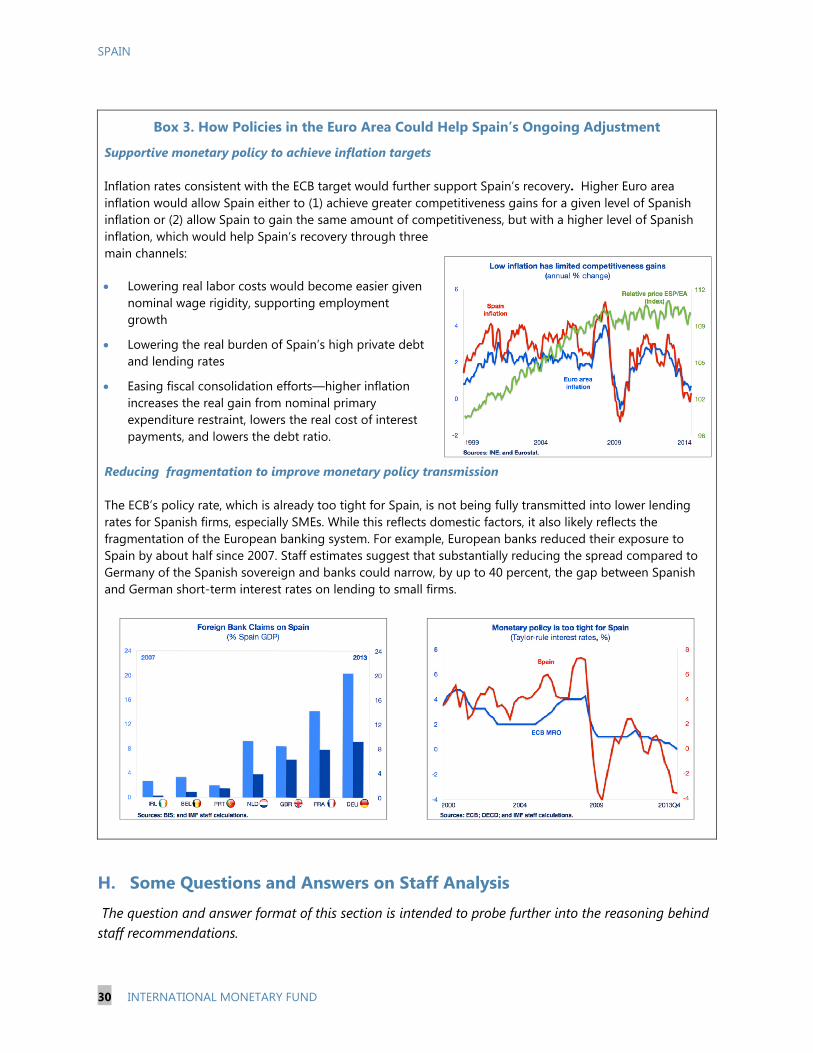
Inflation rates consistent with the ECB target would further support Spain’s recovery. Higher Euro area inflation would allow Spain either to (1) achieve greater competitiveness gains for a given level of Spanish inflation or (2) allow Spain to gain the same amount of competitiveness, but with a higher level of Spanish inflation, which would help Spain’s recovery through three main channels:
Lowering real labor costs would become easier given nominal wage rigidity, supporting employment growth
Lowering the real burden of Spain’s high private debt and lending rates
Easing fiscal consolidation efforts—higher inflation increases the real gain from nominal primary expenditure restraint, lowers the real cost of interest payments, and lowers the debt ratio.
Reducing fragmentation to improve monetary policy transmission
The ECB’s policy rate, which is already too tight for Spain, is not being fully transmitted into lower lending rates for Spanish firms, especially SMEs. While this reflects domestic factors, it also likely reflects the fragmentation of the European banking system. For example, European banks reduced their exposure to Spain by about half since 2007. Staff estimates suggest that substantially reducing the spread compared to Germany of the Spanish sovereign and banks could narrow, by up to 40 percent, the gap between Spanish and German short-term interest rates on lending to small firms.
H. Some Questions and Answers on Staff Analysis
The question and answer format of this section is intended to probe further into the reasoning behind staff recommendations.
SPAIN
INTERNATIONAL MONETARY FUND 31
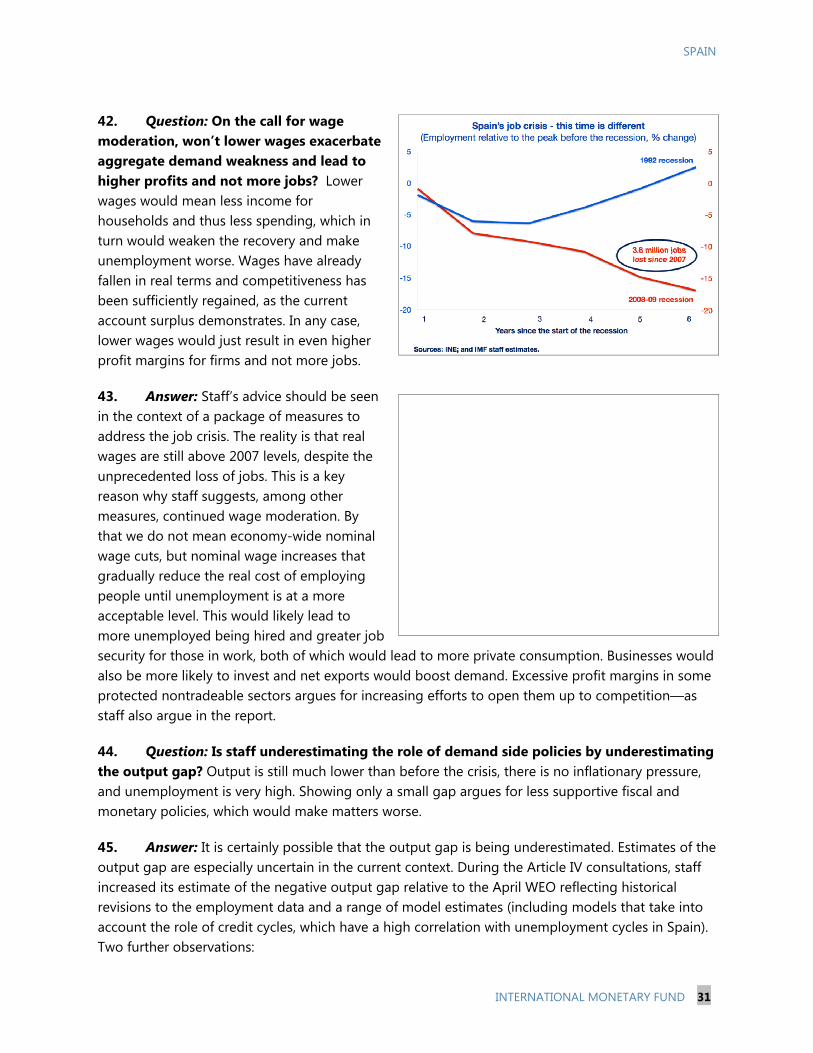
42. Question: On the call for wage moderation, won’t lower wages exacerbate aggregate demand weakness and lead to higher profits and not more jobs? Lower wages would mean less income for households and thus less spending, which in turn would weaken the recovery and make unemployment worse. Wages have already fallen in real terms and competitiveness has been sufficiently regained, as the current account surplus demonstrates. In any case, lower wages would just result in even higher profit margins for firms and not more jobs.
43. Answer: Staff’s advice should be seen in the context of a package of measures to address the job crisis. The reality is that real wages are still above 2007 levels, despite the unprecedented loss of jobs. This is a key reason why staff suggests, among other measures, continued wage moderation. By that we do not mean economy-wide nominal wage cuts, but nominal wage increases that gradually reduce the real cost of employing people until unemployment is at a more acceptable level. This would likely lead to more unemployed being hired and greater job security for those in work, both of which would lead to more private consumption. Businesses would also be more likely to invest and net exports would boost demand. Excessive profit margins in some protected nontradeable sectors argues for increasing efforts to open them up to competition—as staff also argue in the report.
44. Question: Is staff underestimating the role of demand side policies by underestimating the output gap? Output is still much lower than before the crisis, there is no inflationary pressure, and unemployment is very high. Showing only a small gap argues for less supportive fiscal and monetary policies, which would make matters worse.
45. Answer: It is certainly possible that the output gap is being underestimated. Estimates of the output gap are especially uncertain in the current context. During the Article IV consultations, staff increased its estimate of the negative output gap relative to the April WEO reflecting historical revisions to the employment data and a range of model estimates (including models that take into account the role of credit cycles, which have a high correlation with unemployment cycles in Spain). Two further observations:
SPAIN
32 INTERNATIONAL MONETARY FUND
Even if one were to assume a higher output gap, it does not follow that unemployment will fall much further in the next five years. The reality is that unemployment in Spain has a large structural component that, in the absence of stronger structural reforms, is expected to persist for a very long time. Indeed, even the authorities’ projections, which assume a much higher output gap, still has unemployment around 20 percent by 2017.
Assuming a larger output gap (and that it would close relatively quickly) could also give rise to misleading policy implications. It could suggest that further labor market improvements or fiscal consolidation were not necessary—potentially leading to delays on needed adjustments and constraining long-term growth potential. It would also cast doubt on how sustainable the turnaround in the current account really is—a large output gap would suggest the improvement is more cyclical and that external vulnerabilities are higher.
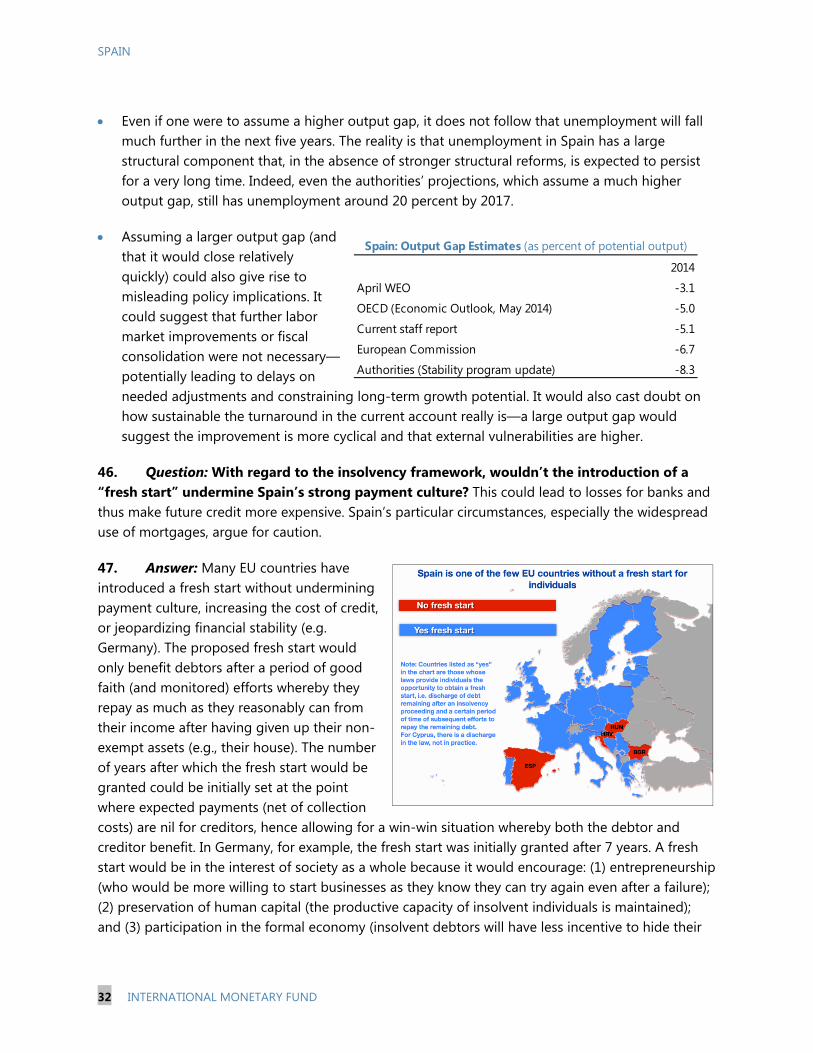
46. Question: With regard to the insolvency framework, wouldn’t the introduction of a “fresh start” undermine Spain’s strong payment culture? This could lead to losses for banks and thus make future credit more expensive. Spain’s particular circumstances, especially the widespread use of mortgages, argue for caution.
47. Answer: Many EU countries have introduced a fresh start without undermining payment culture, increasing the cost of credit, or jeopardizing financial stability (e.g. Germany). The proposed fresh start would only benefit debtors after a period of good faith (and monitored) efforts whereby they repay as much as they reasonably can from their income after having given up their non-exempt assets (e.g., their house). The number of years after which the fresh start would be granted could be initially set at the point where expected payments (net of collection costs) are nil for creditors, hence allowing for a win-win situation whereby both the debtor and creditor benefit. In Germany, for example, the fresh start was initially granted after 7 years. A fresh start would be in the interest of society as a whole because it would encourage: (1) entrepreneurship (who would be more willing to start businesses as they know they can try again even after a failure); (2) preservation of human capital (the productive capacity of insolvent individuals is maintained); and (3) participation in the formal economy (insolvent debtors will have less incentive to hide their
Spain: Output Gap Estimates (as percent of potential output)
2014
April WEO -3.1
OECD (Economic Outlook, May 2014) -5.0
Current staff report -5.1
European Commission -6.7
Authorities (Stability program update) -8.3
SPAIN
INTERNATIONAL MONETARY FUND 33
income from perpetual capture by creditors). And while the high reliance on mortgages argues for caution, it also argues for action to ensure the bankruptcy regime is sound.
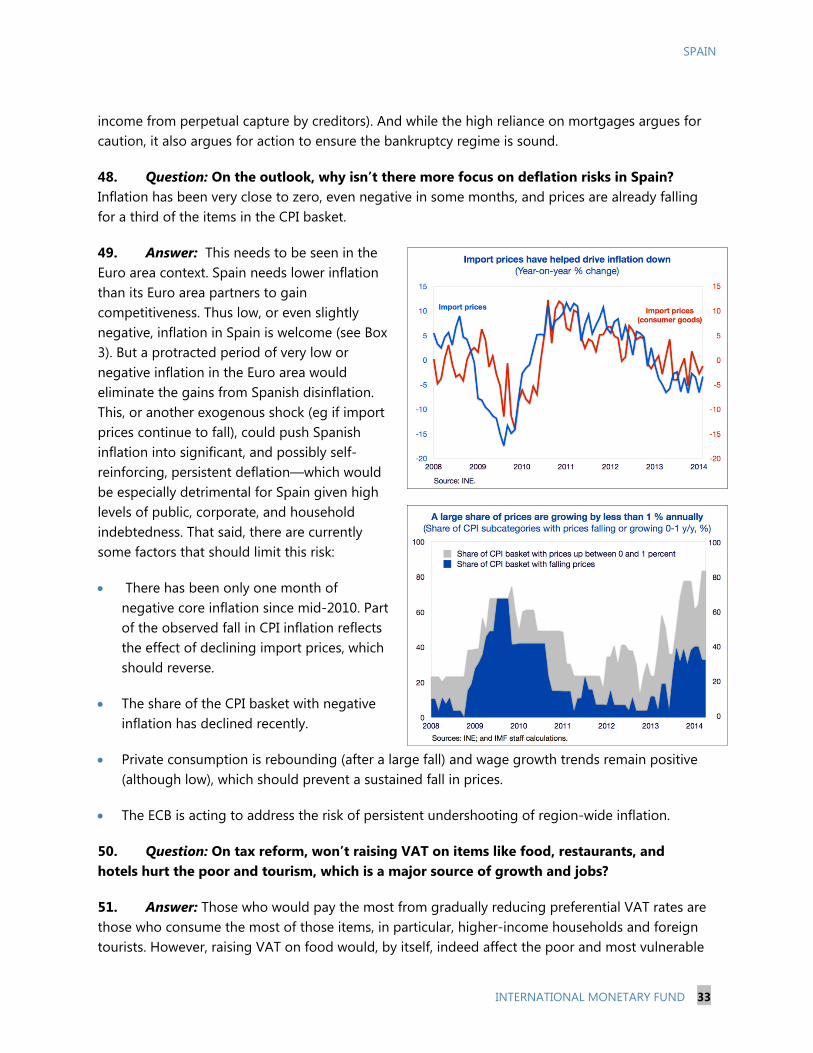
48. Question: On the outlook, why isn’t there more focus on deflation risks in Spain? Inflation has been very close to zero, even negative in some months, and prices are already falling for a third of the items in the CPI basket.
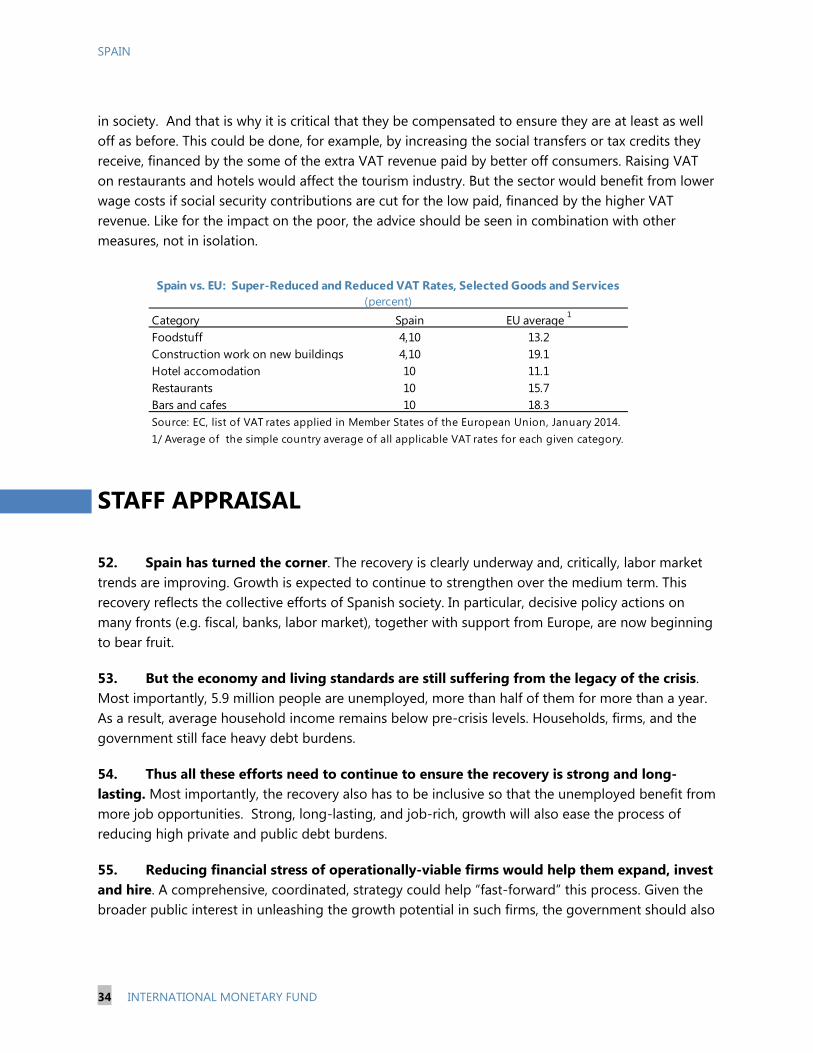
49. Answer: This needs to be seen in the Euro area context. Spain needs lower inflation than its Euro area partners to gain competitiveness. Thus low, or even slightly negative, inflation in Spain is welcome (see Box 3). But a protracted period of very low or negative inflation in the Euro area would eliminate the gains from Spanish disinflation. This, or another exogenous shock (eg if import prices continue to fall), could push Spanish inflation into significant, and possibly self-reinforcing, persistent deflation—which would be especially detrimental for Spain given high levels of public, corporate, and household indebtedness. That said, there are currently some factors that should limit this risk:
There has been only one month of negative core inflation since mid-2010. Part of the observed fall in CPI inflation reflects the effect of declining import prices, which should reverse.
The share of the CPI basket with negative inflation has declined recently.
Private consumption is rebounding (after a large fall) and wage growth trends remain positive (although low), which should prevent a sustained fall in prices.
The ECB is acting to address the risk of persistent undershooting of region-wide inflation.
50. Question: On tax reform, won’t raising VAT on items like food, restaurants, and hotels hurt the poor and tourism, which is a major source of growth and jobs?
51. Answer: Those who would pay the most from gradually reducing preferential VAT rates are those who consume the most of those items, in particular, higher-income households and foreign tourists. However, raising VAT on food would, by itself, indeed affect the poor and most vulnerable
SPAIN
34 INTERNATIONAL MONETARY FUND
in society. And that is why it is critical that they be compensated to ensure they are at least as well off as before. This could be done, for example, by increasing the social transfers or tax credits they receive, financed by the some of the extra VAT revenue paid by better off consumers. Raising VAT on restaurants and hotels would affect the tourism industry. But the sector would benefit from lower wage costs if social security contributions are cut for the low paid, financed by the higher VAT revenue. Like for the impact on the poor, the advice should be seen in combination with other measures, not in isolation.
STAFF APPRAISAL
52. Spain has turned the corner. The recovery is clearly underway and, critically, labor market trends are improving. Growth is expected to continue to strengthen over the medium term. This recovery reflects the collective efforts of Spanish society. In particular, decisive policy actions on many fronts (e.g. fiscal, banks, labor market), together with support from Europe, are now beginning to bear fruit.
53. But the economy and living standards are still suffering from the legacy of the crisis. Most importantly, 5.9 million people are unemployed, more than half of them for more than a year. As a result, average household income remains below pre-crisis levels. Households, firms, and the government still face heavy debt burdens.
54. Thus all these efforts need to continue to ensure the recovery is strong and long-lasting. Most importantly, the recovery also has to be inclusive so that the unemployed benefit from more job opportunities. Strong, long-lasting, and job-rich, growth will also ease the process of reducing high private and public debt burdens.
55. Reducing financial stress of operationally-viable firms would help them expand, invest and hire. A comprehensive, coordinated, strategy could help “fast-forward” this process. Given the broader public interest in unleashing the growth potential in such firms, the government should also
Spain vs. EU: Super-Reduced and Reduced VAT Rates, Selected Goods and Services (percent)
Category Spain EU average 1
Foodstuff 4,10 13.2Construction work on new buildings 4,10 19.1Hotel accomodation 10 11.1Restaurants 10 15.7Bars and cafes 10 18.3Source: EC, list of VAT rates applied in Member States of the European Union, January 2014.1/ Average of the simple country average of all applicable VAT rates for each given category.
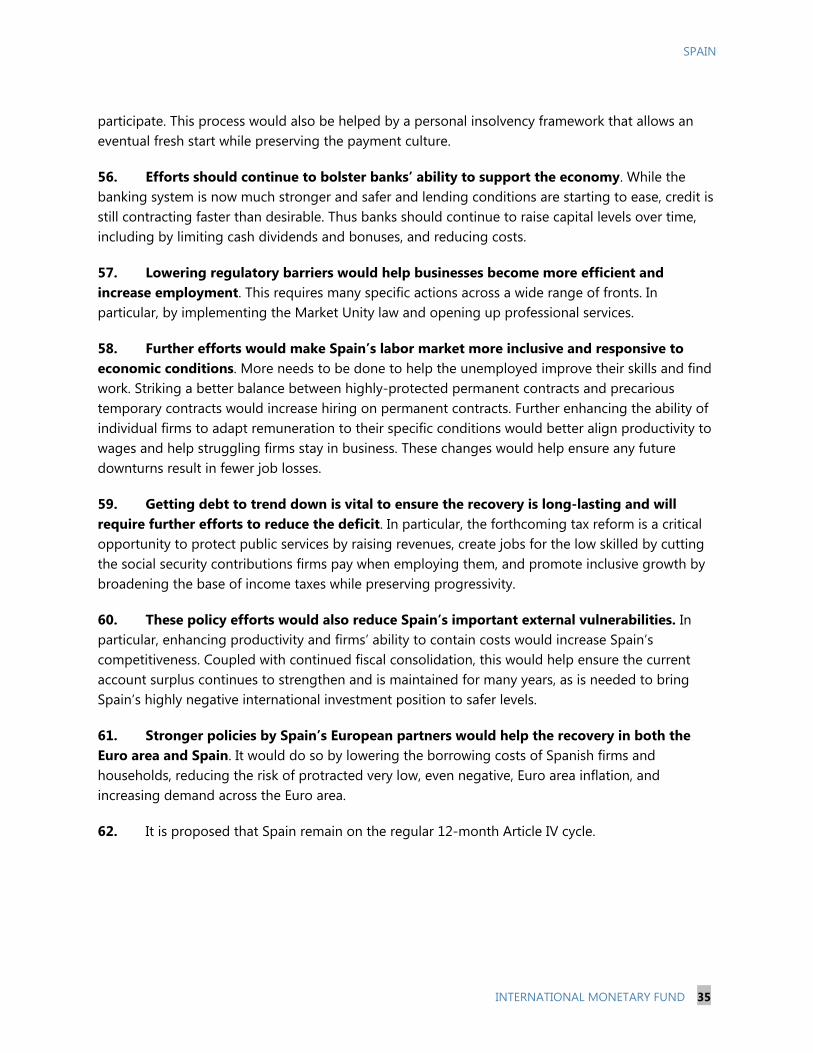
SPAIN
INTERNATIONAL MONETARY FUND 35
participate. This process would also be helped by a personal insolvency framework that allows an eventual fresh start while preserving the payment culture.
56. Efforts should continue to bolster banks’ ability to support the economy. While the banking system is now much stronger and safer and lending conditions are starting to ease, credit is still contracting faster than desirable. Thus banks should continue to raise capital levels over time, including by limiting cash dividends and bonuses, and reducing costs.
57. Lowering regulatory barriers would help businesses become more efficient and increase employment. This requires many specific actions across a wide range of fronts. In particular, by implementing the Market Unity law and opening up professional services.
58. Further efforts would make Spain’s labor market more inclusive and responsive to economic conditions. More needs to be done to help the unemployed improve their skills and find work. Striking a better balance between highly-protected permanent contracts and precarious temporary contracts would increase hiring on permanent contracts. Further enhancing the ability of individual firms to adapt remuneration to their specific conditions would better align productivity to wages and help struggling firms stay in business. These changes would help ensure any future downturns result in fewer job losses.
59. Getting debt to trend down is vital to ensure the recovery is long-lasting and will require further efforts to reduce the deficit. In particular, the forthcoming tax reform is a critical opportunity to protect public services by raising revenues, create jobs for the low skilled by cutting the social security contributions firms pay when employing them, and promote inclusive growth by broadening the base of income taxes while preserving progressivity.
60. These policy efforts would also reduce Spain’s important external vulnerabilities. In particular, enhancing productivity and firms’ ability to contain costs would increase Spain’s competitiveness. Coupled with continued fiscal consolidation, this would help ensure the current account surplus continues to strengthen and is maintained for many years, as is needed to bring Spain’s highly negative international investment position to safer levels.
61. Stronger policies by Spain’s European partners would help the recovery in both the Euro area and Spain. It would do so by lowering the borrowing costs of Spanish firms and households, reducing the risk of protracted very low, even negative, Euro area inflation, and increasing demand across the Euro area.
62. It is proposed that Spain remain on the regular 12-month Article IV cycle.
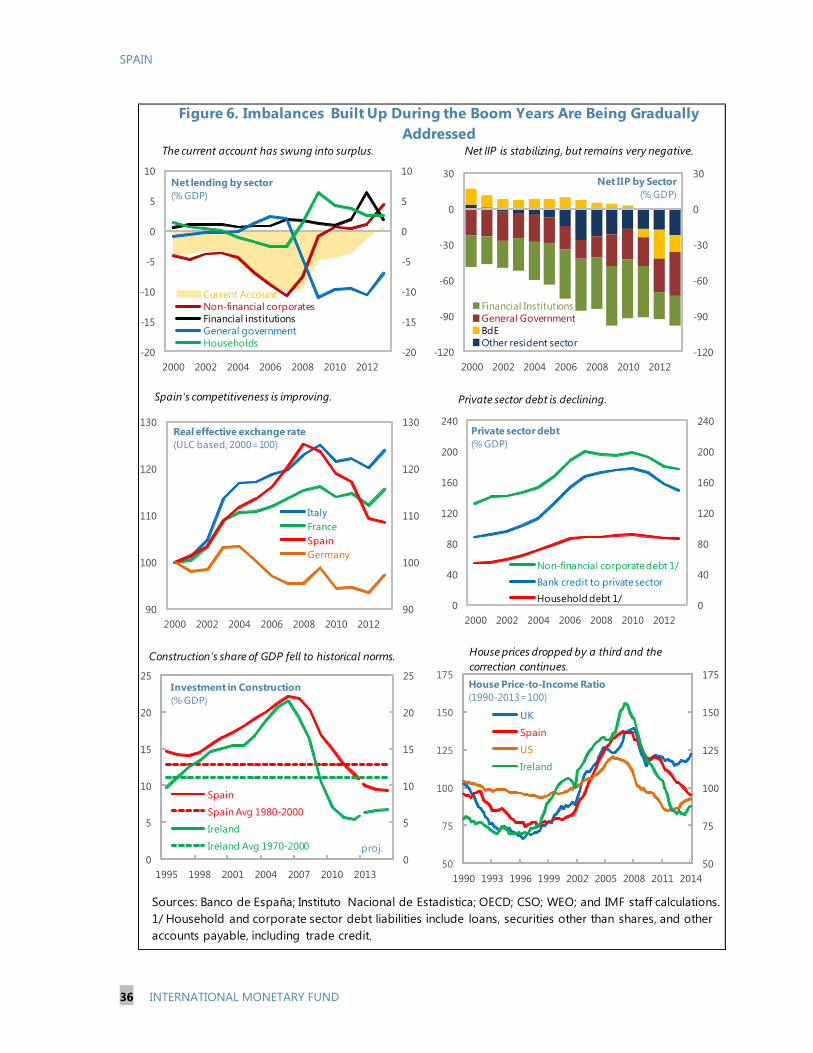
SPAIN
36 INTERNATIONAL MONETARY FUND
Figure 6. Imbalances Built Up During the Boom Years Are Being GraduallyAddressed
Sources: Banco de España; Instituto Nacional de Estadistica; OECD; CSO; WEO; and IMF staff calculations.1/ Household and corporate sector debt liabilities include loans, securities other than shares, and other accounts payable, including trade credit.
-120
-90
-60
-30
0
30
-120
-90
-60
-30
0
30
2000 2002 2004 2006 2008 2010 2012
Financial InstitutionsGeneral GovernmentBdEOther resident sector
Net IIP by Sector(% GDP)
-20
-15
-10
-5
0
5
10
-20
-15
-10
-5
0
5
10
2000 2002 2004 2006 2008 2010 2012
Current AccountNon-financial corporatesFinancial institutionsGeneral governmentHouseholds
Net lending by sector(% GDP)
0
5
10
15
20
25
0
5
10
15
20
25
1995 1998 2001 2004 2007 2010 2013
Spain
Spain Avg 1980-2000
Ireland
Ireland Avg 1970-2000
Investment in Construction(% GDP)
proj.
The current account has swung into surplus. Net IIP is stabilizing, but remains very negative.
Private sector debt is declining.Spain's competitiveness is improving.
House prices dropped by a third and the correction continues.
Construction's share of GDP fell to historical norms.
50
75
100
125
150
175
50
75
100
125
150
175
1990 1993 1996 1999 2002 2005 2008 2011 2014
UK
Spain
US
Ireland
House Price-to-Income Ratio(1990-2013=100)
0
40
80
120
160
200
240
0
40
80
120
160
200
240
2000 2002 2004 2006 2008 2010 2012
Non-financial corporate debt 1/Bank credit to private sectorHousehold debt 1/
Private sector debt (% GDP)
90
100
110
120
130
90
100
110
120
130
2000 2002 2004 2006 2008 2010 2012
ItalyFranceSpainGermany
Real effective exchange rate (ULC based, 2000=100)
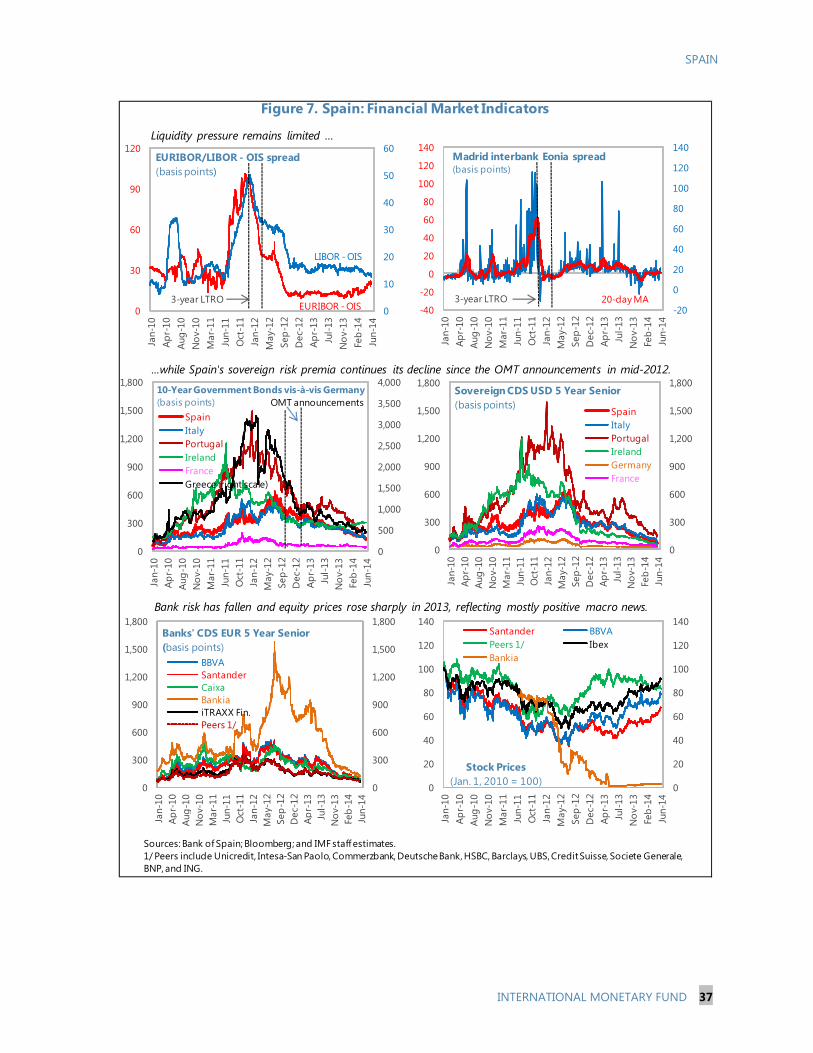
SPAIN
INTERNATIONAL MONETARY FUND 37
Figure 7. Spain: Financial Market Indicators
Sources: Bank of Spain; Bloomberg; and IMF staff estimates.1/ Peers include Unicredit, Intesa-San Paolo, Commerzbank, Deutsche Bank, HSBC, Barclays, UBS, Credit Suisse, Societe Generale, BNP, and ING.
0
10
20
30
40
50
60
0
30
60
90
120Ja
n-10
Apr-
10Au
g-10
Nov
-10
Mar
-11
Jun-
11O
ct-1
1Ja
n-12
May
-12
Sep-
12D
ec-1
2Ap
r-13
Jul-1
3N
ov-1
3Fe
b-14
Jun-
14
EURIBOR/LIBOR - OIS spread(basis points)
EURIBOR - OIS
LIBOR - OIS
3-year LTRO-20
0
20
40
60
80
100
120
140
-40
-20
0
20
40
60
80
100
120
140
Jan-
10Ap
r-10
Aug-
10N
ov-1
0M
ar-1
1Ju
n-11
Oct
-11
Jan-
12M
ay-1
2Se
p-12
Dec
-12
Apr-
13Ju
l-13
Nov
-13
Feb-
14Ju
n-14
Madrid interbank Eonia spread(basis points)
20-day MA
0
500
1,000
1,500
2,000
2,500
3,000
3,500
4,000
0
300
600
900
1,200
1,500
1,800
Jan-
10Ap
r-10
Aug-
10N
ov-1
0M
ar-1
1Ju
n-11
Oct
-11
Jan-
12M
ay-1
2Se
p-12
Dec
-12
Apr-
13Ju
l-13
Nov
-13
Feb-
14Ju
n-14
10-Year Government Bonds vis-à-vis Germany(basis points)
SpainItalyPortugalIrelandFranceGreece (right scale)
OMT announcements
0
300
600
900
1,200
1,500
1,800
0
300
600
900
1,200
1,500
1,800
Jan-
10Ap
r-10
Aug-
10N
ov-1
0M
ar-1
1Ju
n-11
Oct
-11
Jan-
12M
ay-1
2Se
p-12
Dec
-12
Apr-
13Ju
l-13
Nov
-13
Feb-
14Ju
n-14
Sovereign CDS USD 5 Year Senior(basis points)
SpainItalyPortugalIrelandGermanyFrance
0
300
600
900
1,200
1,500
1,800
0
300
600
900
1,200
1,500
1,800
Jan-
10Ap
r-10
Aug-
10N
ov-1
0M
ar-1
1Ju
n-11
Oct
-11
Jan-
12M
ay-1
2Se
p-12
Dec
-12
Apr-
13Ju
l-13
Nov
-13
Feb-
14Ju
n-14
Banks' CDS EUR 5 Year Senior(basis points)
BBVASantanderCaixaBankiaiTRAXX Fin.Peers 1/
0
20
40
60
80
100
120
140
0
20
40
60
80
100
120
140
Jan-
10Ap
r-10
Aug-
10N
ov-1
0M
ar-1
1Ju
n-11
Oct
-11
Jan-
12M
ay-1
2Se
p-12
Dec
-12
Apr-
13Ju
l-13
Nov
-13
Feb-
14Ju
n-14
Stock Prices(Jan. 1, 2010 = 100)
Santander BBVAPeers 1/ IbexBankia
3-year LTRO
Liquidity pressure remains limited …
...while Spain's sovereign risk premia continues its decline since the OMT announcements in mid-2012.
Bank risk has fallen and equity prices rose sharply in 2013, reflecting mostly positive macro news.
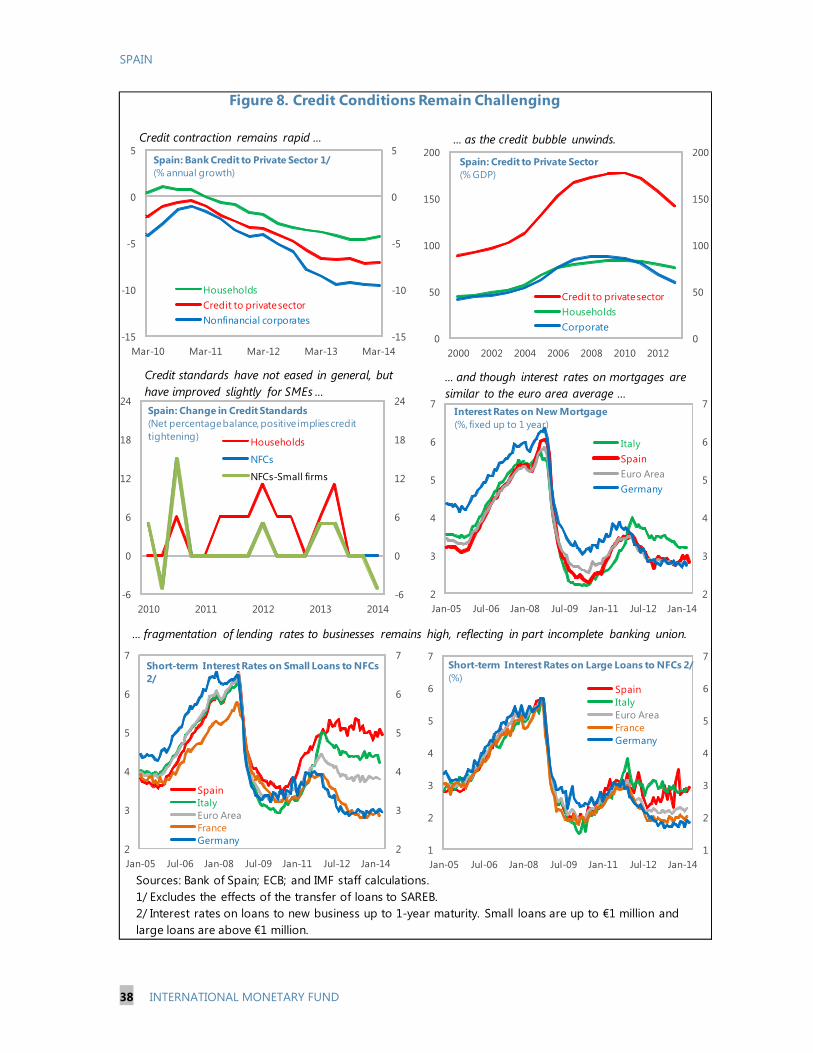
SPAIN
38 INTERNATIONAL MONETARY FUND
Sources: Bank of Spain; ECB; and IMF staff calculations.1/ Excludes the effects of the transfer of loans to SAREB.2/ Interest rates on loans to new business up to 1-year maturity. Small loans are up to €1 million and large loans are above €1 million.
0
50
100
150
200
0
50
100
150
200
2000 2002 2004 2006 2008 2010 2012
Credit to private sectorHouseholdsCorporate
Spain: Credit to Private Sector(% GDP)
Figure 8. Credit Conditions Remain Challenging
... fragmentation of lending rates to businesses remains high, reflecting in part incomplete banking union.
... and though interest rates on mortgages are similar to the euro area average ...
Credit standards have not eased in general, but have improved slightly for SMEs ...
Credit contraction remains rapid ...
2
3
4
5
6
7
2
3
4
5
6
7
Jan-05 Jul-06 Jan-08 Jul-09 Jan-11 Jul-12 Jan-14
SpainItalyEuro AreaFranceGermany
Short-term Interest Rates on Small Loans to NFCs 2/
1
2
3
4
5
6
7
1
2
3
4
5
6
7
Jan-05 Jul-06 Jan-08 Jul-09 Jan-11 Jul-12 Jan-14
SpainItalyEuro AreaFranceGermany
Short-term Interest Rates on Large Loans to NFCs 2/(%)
... as the credit bubble unwinds.
2
3
4
5
6
7
2
3
4
5
6
7
Jan-05 Jul-06 Jan-08 Jul-09 Jan-11 Jul-12 Jan-14
ItalySpainEuro AreaGermany
Interest Rates on New Mortgage(%, fixed up to 1 year)
-15
-10
-5
0
5
-15
-10
-5
0
5
Mar-10 Mar-11 Mar-12 Mar-13 Mar-14
HouseholdsCredit to private sectorNonfinancial corporates
Spain: Bank Credit to Private Sector 1/(% annual growth)
-6
0
6
12
18
24
-6
0
6
12
18
24
2010 2011 2012 2013 2014
Households
NFCs
NFCs-Small firms
Spain: Change in Credit Standards (Net percentage balance, positive implies credit tightening)
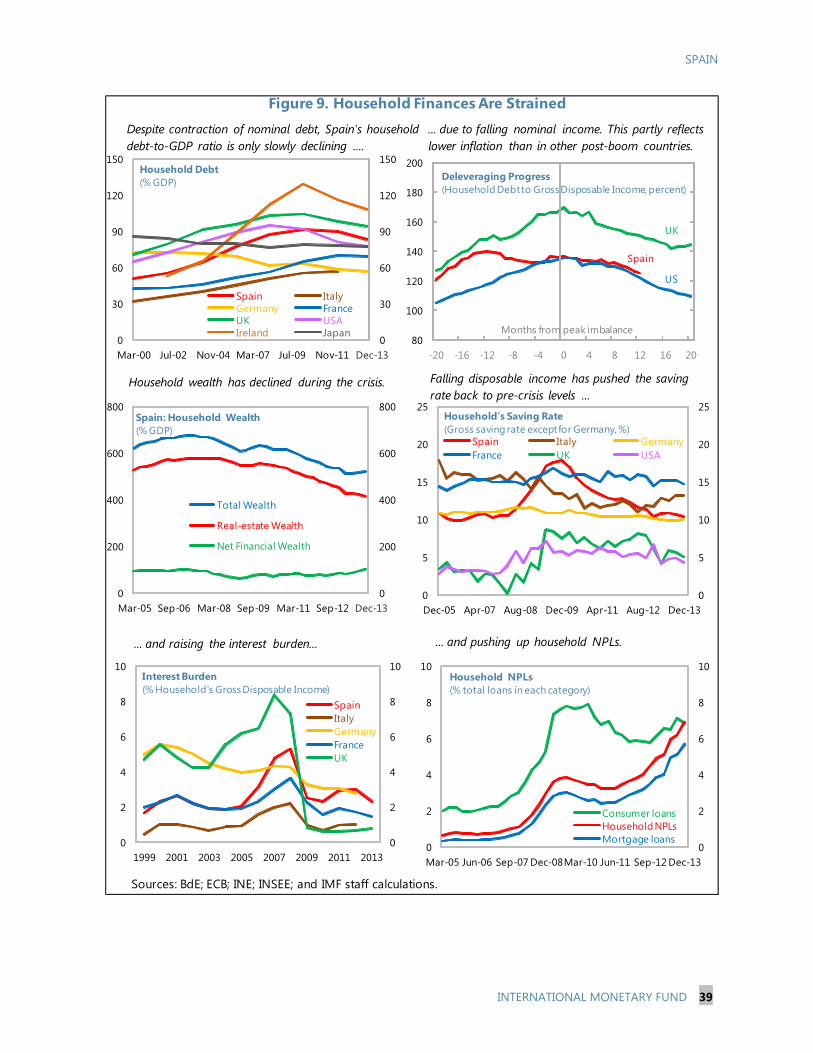
SPAIN
INTERNATIONAL MONETARY FUND 39
Figure 9. Household Finances Are Strained
Sources: BdE; ECB; INE; INSEE; and IMF staff calculations.
0
30
60
90
120
150
0
30
60
90
120
150
Mar-00 Jul-02 Nov-04 Mar-07 Jul-09 Nov-11
Spain ItalyGermany FranceUK USAIreland Japan
Household Debt(% GDP)
Dec-13
0
2
4
6
8
10
0
2
4
6
8
10
1999 2001 2003 2005 2007 2009 2011 2013
SpainItalyGermanyFranceUK
Interest Burden(% Household's Gross Disposable Income)
80
100
120
140
160
180
200
-20 -16 -12 -8 -4 0 4 8 12 16 20
Deleveraging Progress(Household Debt to Gross Disposable Income, percent)
Months from peak imbalance
UK
US
Spain
0
5
10
15
20
25
0
5
10
15
20
25
Dec-05 Apr-07 Aug-08 Dec-09 Apr-11 Aug-12 Dec-13
Spain Italy Germany France UK USA
Household's Saving Rate(Gross saving rate except for Germany, %)
0
2
4
6
8
10
0
2
4
6
8
10
Mar-05 Jun-06 Sep-07 Dec-08Mar-10 Jun-11 Sep-12 Dec-13
Consumer loansHousehold NPLsMortgage loans
Household NPLs(% total loans in each category)
Despite contraction of nominal debt, Spain's household debt-to-GDP ratio is only slowly declining ....
... due to falling nominal income. This partly reflects lower inflation than in other post-boom countries.
Falling disposable income has pushed the saving rate back to pre-crisis levels ...
... and raising the interest burden...
Household wealth has declined during the crisis.
... and pushing up household NPLs.
0
200
400
600
800
0
200
400
600
800
Mar-05 Sep-06 Mar-08 Sep-09 Mar-11 Sep-12
Total Wealth
Real-estate Wealth
Net Financial Wealth
Spain: Household Wealth(% GDP)
Dec-13
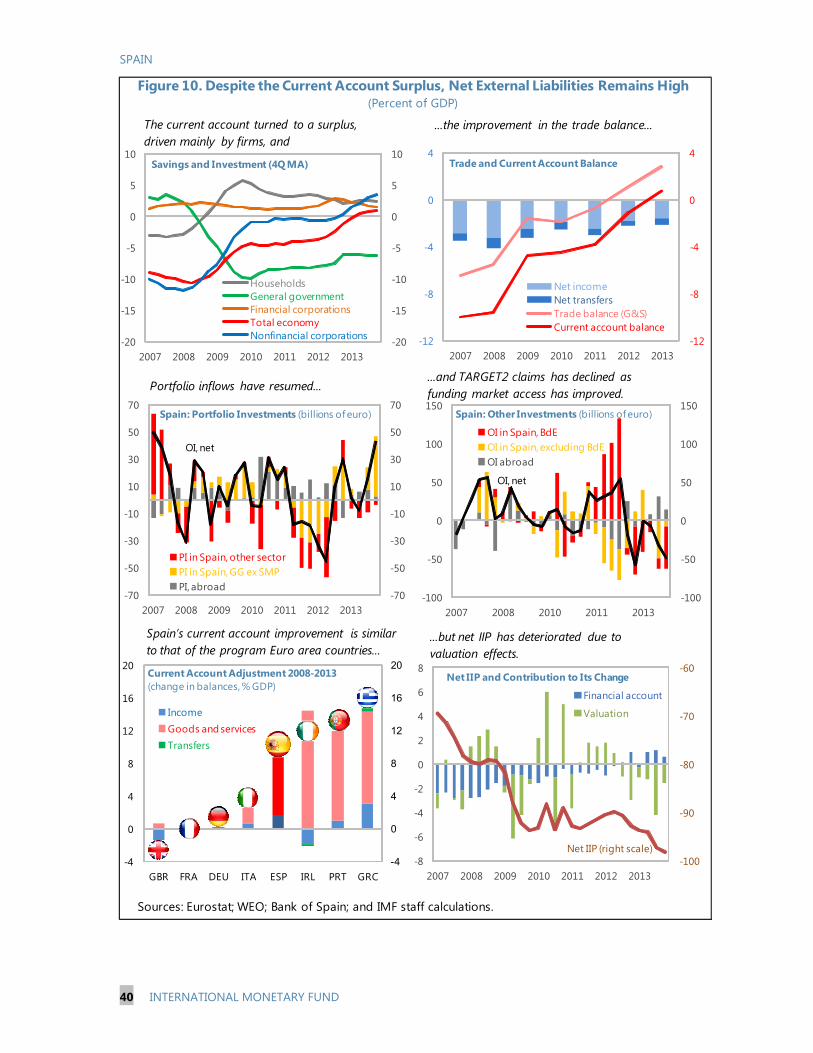
SPAIN
40 INTERNATIONAL MONETARY FUND
Figure 10. Despite the Current Account Surplus, Net External Liabilities Remains High (Percent of GDP)
Sources: Eurostat; WEO; Bank of Spain; and IMF staff calculations.
The current account turned to a surplus, driven mainly by firms, and
Portfolio inflows have resumed...
Spain’s current account improvement is similar to that of the program Euro area countries...
-100
-90
-80
-70
-60
-8
-6
-4
-2
0
2
4
6
8
2007 2008 2009 2010 2011 2012 2013
Financial account
Valuation
Net IIP and Contribution to Its Change
Net IIP (right scale)
-100
-50
0
50
100
150
-100
-50
0
50
100
150
2007 2008 2010 2011 2013
OI in Spain, BdEOI in Spain, excluding BdEOI abroad
Spain: Other Investments (billions of euro)
-70
-50
-30
-10
10
30
50
70
-70
-50
-30
-10
10
30
50
70
2007 2008 2009 2010 2011 2012 2013
PI in Spain, other sectorPI in Spain, GG ex SMPPI, abroad
Spain: Portfolio Investments (billions of euro)
OI, net
-4
0
4
8
12
16
20
-4
0
4
8
12
16
20
GBR FRA DEU ITA ESP IRL PRT GRC
Current Account Adjustment 2008-2013(change in balances, % GDP)
IncomeGoods and servicesTransfers
...the improvement in the trade balance...
...and TARGET2 claims has declined as funding market access has improved.
...but net IIP has deteriorated due to valuation effects.
-12
-8
-4
0
4
-12
-8
-4
0
4
2007 2008 2009 2010 2011 2012 2013
Net incomeNet transfersTrade balance (G&S)Current account balance
Trade and Current Account Balance
OI, net
-20
-15
-10
-5
0
5
10
-20
-15
-10
-5
0
5
10
2007 2008 2009 2010 2011 2012 2013
HouseholdsGeneral governmentFinancial corporationsTotal economyNonfinancial corporations
Savings and Investment (4Q MA)
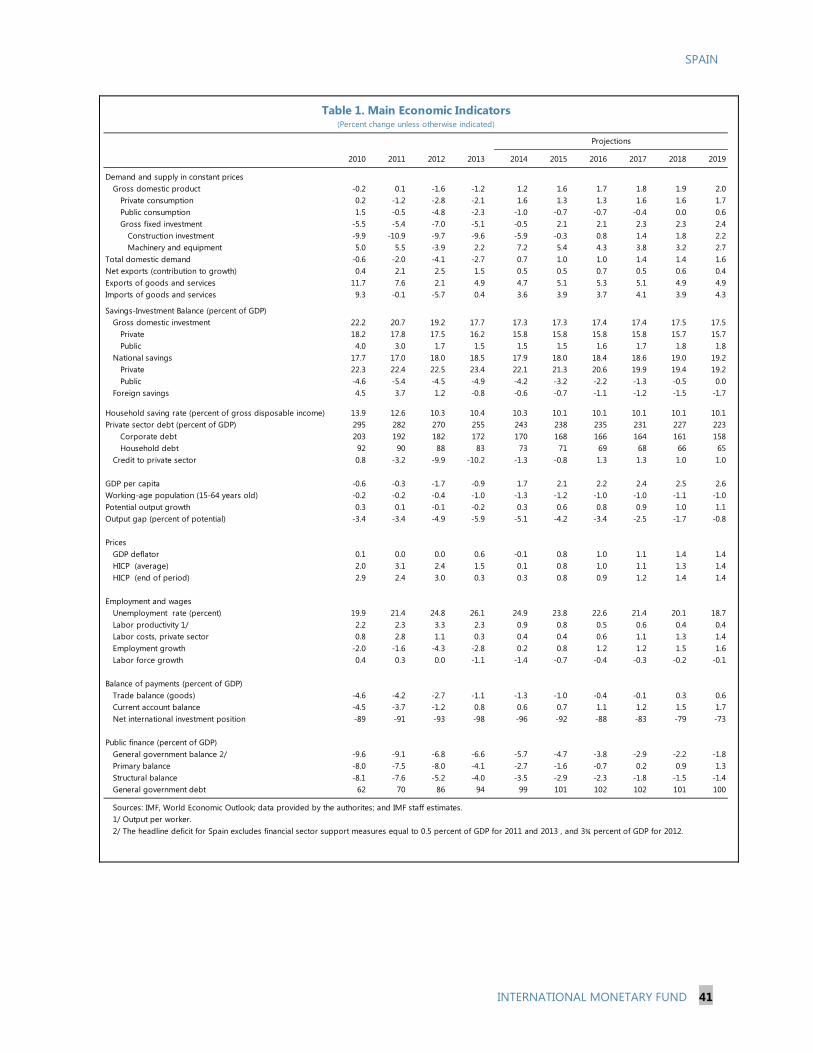
SPAIN
INTERNATIONAL MONETARY FUND 41
2010 2011 2012 2013 2014 2015 2016 2017 2018 2019
Demand and supply in constant pricesGross domestic product -0.2 0.1 -1.6 -1.2 1.2 1.6 1.7 1.8 1.9 2.0
Private consumption 0.2 -1.2 -2.8 -2.1 1.6 1.3 1.3 1.6 1.6 1.7Public consumption 1.5 -0.5 -4.8 -2.3 -1.0 -0.7 -0.7 -0.4 0.0 0.6Gross fixed investment -5.5 -5.4 -7.0 -5.1 -0.5 2.1 2.1 2.3 2.3 2.4
Construction investment -9.9 -10.9 -9.7 -9.6 -5.9 -0.3 0.8 1.4 1.8 2.2Machinery and equipment 5.0 5.5 -3.9 2.2 7.2 5.4 4.3 3.8 3.2 2.7
Total domestic demand -0.6 -2.0 -4.1 -2.7 0.7 1.0 1.0 1.4 1.4 1.6Net exports (contribution to growth) 0.4 2.1 2.5 1.5 0.5 0.5 0.7 0.5 0.6 0.4Exports of goods and services 11.7 7.6 2.1 4.9 4.7 5.1 5.3 5.1 4.9 4.9Imports of goods and services 9.3 -0.1 -5.7 0.4 3.6 3.9 3.7 4.1 3.9 4.3
Savings-Investment Balance (percent of GDP) Gross domestic investment 22.2 20.7 19.2 17.7 17.3 17.3 17.4 17.4 17.5 17.5 Private 18.2 17.8 17.5 16.2 15.8 15.8 15.8 15.8 15.7 15.7 Public 4.0 3.0 1.7 1.5 1.5 1.5 1.6 1.7 1.8 1.8 National savings 17.7 17.0 18.0 18.5 17.9 18.0 18.4 18.6 19.0 19.2 Private 22.3 22.4 22.5 23.4 22.1 21.3 20.6 19.9 19.4 19.2 Public -4.6 -5.4 -4.5 -4.9 -4.2 -3.2 -2.2 -1.3 -0.5 0.0 Foreign savings 4.5 3.7 1.2 -0.8 -0.6 -0.7 -1.1 -1.2 -1.5 -1.7
Household saving rate (percent of gross disposable income) 13.9 12.6 10.3 10.4 10.3 10.1 10.1 10.1 10.1 10.1Private sector debt (percent of GDP) 295 282 270 255 243 238 235 231 227 223
Corporate debt 203 192 182 172 170 168 166 164 161 158Household debt 92 90 88 83 73 71 69 68 66 65
Credit to private sector 0.8 -3.2 -9.9 -10.2 -1.3 -0.8 1.3 1.3 1.0 1.0
GDP per capita -0.6 -0.3 -1.7 -0.9 1.7 2.1 2.2 2.4 2.5 2.6Working-age population (15-64 years old) -0.2 -0.2 -0.4 -1.0 -1.3 -1.2 -1.0 -1.0 -1.1 -1.0Potential output growth 0.3 0.1 -0.1 -0.2 0.3 0.6 0.8 0.9 1.0 1.1Output gap (percent of potential) -3.4 -3.4 -4.9 -5.9 -5.1 -4.2 -3.4 -2.5 -1.7 -0.8
PricesGDP deflator 0.1 0.0 0.0 0.6 -0.1 0.8 1.0 1.1 1.4 1.4HICP (average) 2.0 3.1 2.4 1.5 0.1 0.8 1.0 1.1 1.3 1.4HICP (end of period) 2.9 2.4 3.0 0.3 0.3 0.8 0.9 1.2 1.4 1.4
Employment and wagesUnemployment rate (percent) 19.9 21.4 24.8 26.1 24.9 23.8 22.6 21.4 20.1 18.7Labor productivity 1/ 2.2 2.3 3.3 2.3 0.9 0.8 0.5 0.6 0.4 0.4Labor costs, private sector 0.8 2.8 1.1 0.3 0.4 0.4 0.6 1.1 1.3 1.4Employment growth -2.0 -1.6 -4.3 -2.8 0.2 0.8 1.2 1.2 1.5 1.6Labor force growth 0.4 0.3 0.0 -1.1 -1.4 -0.7 -0.4 -0.3 -0.2 -0.1
Balance of payments (percent of GDP)Trade balance (goods) -4.6 -4.2 -2.7 -1.1 -1.3 -1.0 -0.4 -0.1 0.3 0.6Current account balance -4.5 -3.7 -1.2 0.8 0.6 0.7 1.1 1.2 1.5 1.7Net international investment position -89 -91 -93 -98 -96 -92 -88 -83 -79 -73
Public finance (percent of GDP)General government balance 2/ -9.6 -9.1 -6.8 -6.6 -5.7 -4.7 -3.8 -2.9 -2.2 -1.8Primary balance -8.0 -7.5 -8.0 -4.1 -2.7 -1.6 -0.7 0.2 0.9 1.3Structural balance -8.1 -7.6 -5.2 -4.0 -3.5 -2.9 -2.3 -1.8 -1.5 -1.4General government debt 62 70 86 94 99 101 102 102 101 100
Sources: IMF, World Economic Outlook; data provided by the authorites; and IMF staff estimates.1/ Output per worker.2/ The headline deficit for Spain excludes financial sector support measures equal to 0.5 percent of GDP for 2011 and 2013 , and 3¾ percent of GDP for 2012.
Table 1. Main Economic Indicators(Percent change unless otherwise indicated)
Projections
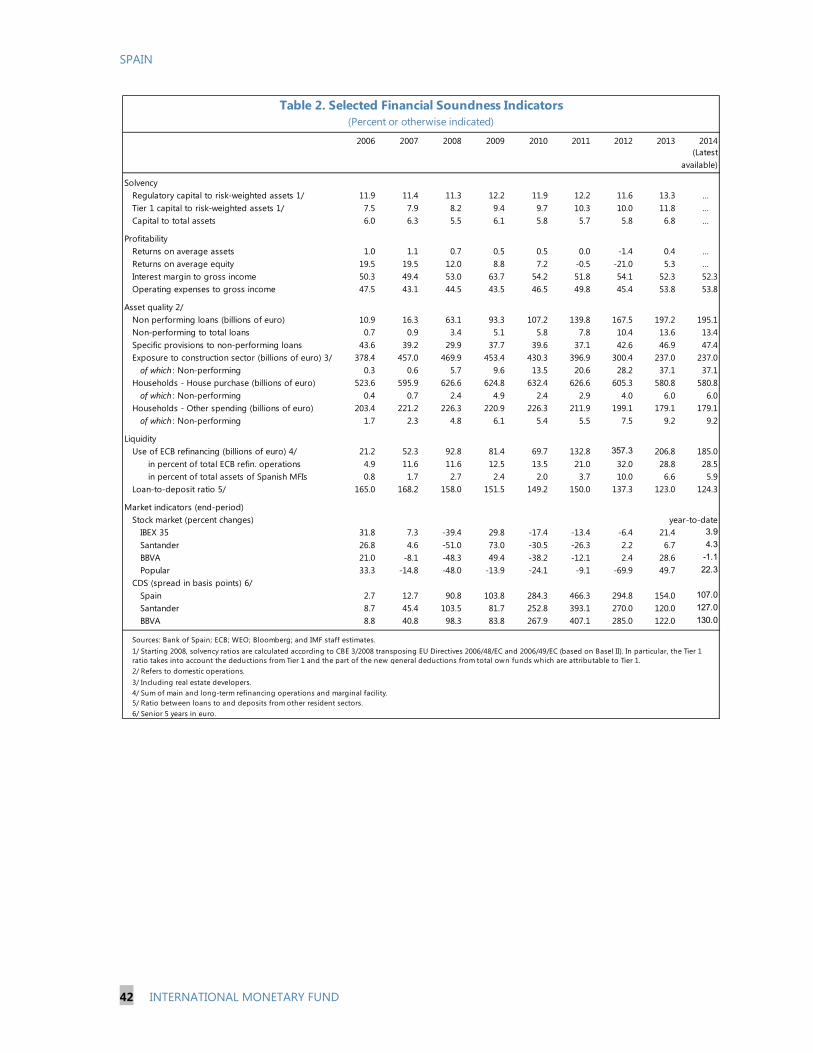
SPAIN
42 INTERNATIONAL MONETARY FUND
2006 2007 2008 2009 2010 2011 2012 2013 2014(Latest
available)
SolvencyRegulatory capital to risk-weighted assets 1/ 11.9 11.4 11.3 12.2 11.9 12.2 11.6 13.3 …Tier 1 capital to risk-weighted assets 1/ 7.5 7.9 8.2 9.4 9.7 10.3 10.0 11.8 …Capital to total assets 6.0 6.3 5.5 6.1 5.8 5.7 5.8 6.8 …
ProfitabilityReturns on average assets 1.0 1.1 0.7 0.5 0.5 0.0 -1.4 0.4 …Returns on average equity 19.5 19.5 12.0 8.8 7.2 -0.5 -21.0 5.3 …Interest margin to gross income 50.3 49.4 53.0 63.7 54.2 51.8 54.1 52.3 52.3Operating expenses to gross income 47.5 43.1 44.5 43.5 46.5 49.8 45.4 53.8 53.8
Asset quality 2/Non performing loans (billions of euro) 10.9 16.3 63.1 93.3 107.2 139.8 167.5 197.2 195.1Non-performing to total loans 0.7 0.9 3.4 5.1 5.8 7.8 10.4 13.6 13.4Specific provisions to non-performing loans 43.6 39.2 29.9 37.7 39.6 37.1 42.6 46.9 47.4Exposure to construction sector (billions of euro) 3/ 378.4 457.0 469.9 453.4 430.3 396.9 300.4 237.0 237.0
of which : Non-performing 0.3 0.6 5.7 9.6 13.5 20.6 28.2 37.1 37.1Households - House purchase (billions of euro) 523.6 595.9 626.6 624.8 632.4 626.6 605.3 580.8 580.8
of which : Non-performing 0.4 0.7 2.4 4.9 2.4 2.9 4.0 6.0 6.0Households - Other spending (billions of euro) 203.4 221.2 226.3 220.9 226.3 211.9 199.1 179.1 179.1
of which : Non-performing 1.7 2.3 4.8 6.1 5.4 5.5 7.5 9.2 9.2
LiquidityUse of ECB refinancing (billions of euro) 4/ 21.2 52.3 92.8 81.4 69.7 132.8 357.3 206.8 185.0
in percent of total ECB refin. operations 4.9 11.6 11.6 12.5 13.5 21.0 32.0 28.8 28.5in percent of total assets of Spanish MFIs 0.8 1.7 2.7 2.4 2.0 3.7 10.0 6.6 5.9
Loan-to-deposit ratio 5/ 165.0 168.2 158.0 151.5 149.2 150.0 137.3 123.0 124.3
Market indicators (end-period)Stock market (percent changes) year-to-date
IBEX 35 31.8 7.3 -39.4 29.8 -17.4 -13.4 -6.4 21.4 3.9
Santander 26.8 4.6 -51.0 73.0 -30.5 -26.3 2.2 6.7 4.3
BBVA 21.0 -8.1 -48.3 49.4 -38.2 -12.1 2.4 28.6 -1.1
Popular 33.3 -14.8 -48.0 -13.9 -24.1 -9.1 -69.9 49.7 22.3
CDS (spread in basis points) 6/Spain 2.7 12.7 90.8 103.8 284.3 466.3 294.8 154.0 107.0
Santander 8.7 45.4 103.5 81.7 252.8 393.1 270.0 120.0 127.0
BBVA 8.8 40.8 98.3 83.8 267.9 407.1 285.0 122.0 130.0
Sources: Bank of Spain; ECB; WEO; Bloomberg; and IMF staff estimates.
2/ Refers to domestic operations.3/ Including real estate developers.4/ Sum of main and long-term refinancing operations and marginal facility.5/ Ratio between loans to and deposits from other resident sectors.6/ Senior 5 years in euro.
(Percent or otherwise indicated)Table 2. Selected Financial Soundness Indicators
1/ Starting 2008, solvency ratios are calculated according to CBE 3/2008 transposing EU Directives 2006/48/EC and 2006/49/EC (based on Basel II). In particular, the Tier 1 ratio takes into account the deductions from Tier 1 and the part of the new general deductions from total own funds which are attributable to Tier 1.
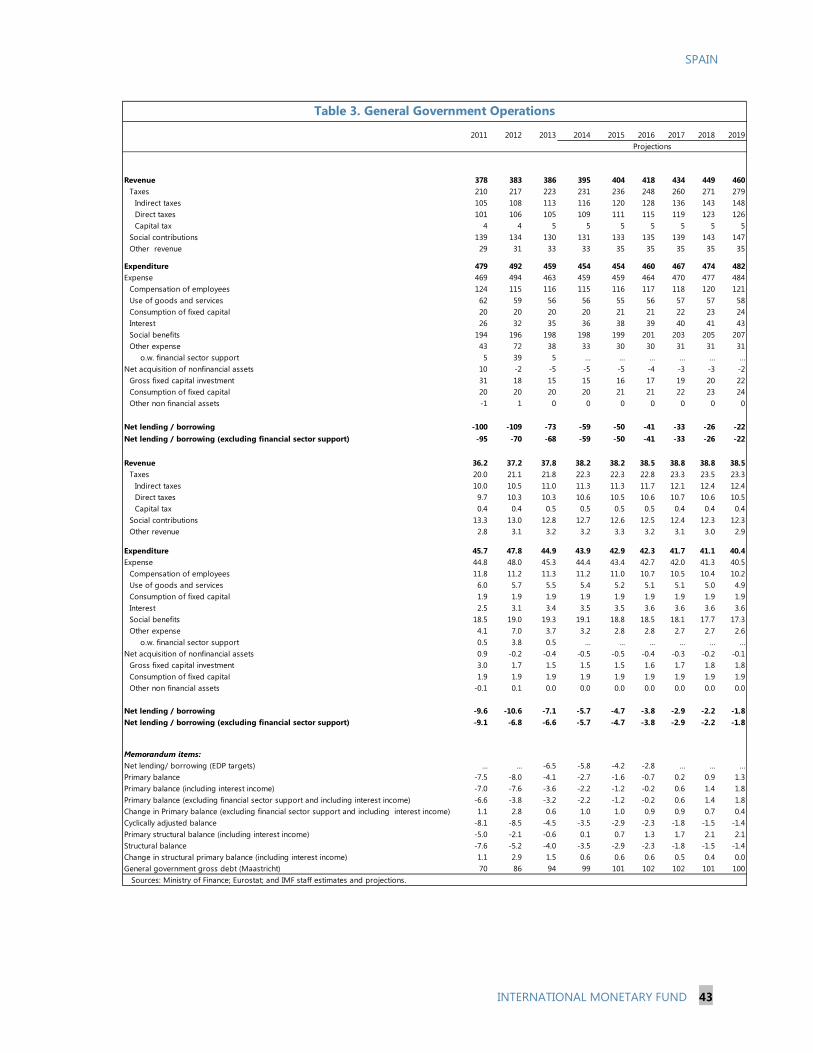
SPAIN
INTERNATIONAL MONETARY FUND 43
2011 2012 2013 2014 2015 2016 2017 2018 2019
Revenue 378 383 386 395 404 418 434 449 460Taxes 210 217 223 231 236 248 260 271 279
Indirect taxes 105 108 113 116 120 128 136 143 148Direct taxes 101 106 105 109 111 115 119 123 126Capital tax 4 4 5 5 5 5 5 5 5
Social contributions 139 134 130 131 133 135 139 143 147Other revenue 29 31 33 33 35 35 35 35 35
Expenditure 479 492 459 454 454 460 467 474 482Expense 469 494 463 459 459 464 470 477 484
Compensation of employees 124 115 116 115 116 117 118 120 121Use of goods and services 62 59 56 56 55 56 57 57 58Consumption of fixed capital 20 20 20 20 21 21 22 23 24Interest 26 32 35 36 38 39 40 41 43Social benefits 194 196 198 198 199 201 203 205 207Other expense 43 72 38 33 30 30 31 31 31
o.w. financial sector support 5 39 5 … … … … … …Net acquisition of nonfinancial assets 10 -2 -5 -5 -5 -4 -3 -3 -2
Gross fixed capital investment 31 18 15 15 16 17 19 20 22Consumption of fixed capital 20 20 20 20 21 21 22 23 24Other non financial assets -1 1 0 0 0 0 0 0 0
Net lending / borrowing -100 -109 -73 -59 -50 -41 -33 -26 -22Net lending / borrowing (excluding financial sector support) -95 -70 -68 -59 -50 -41 -33 -26 -22
Revenue 36.2 37.2 37.8 38.2 38.2 38.5 38.8 38.8 38.5Taxes 20.0 21.1 21.8 22.3 22.3 22.8 23.3 23.5 23.3
Indirect taxes 10.0 10.5 11.0 11.3 11.3 11.7 12.1 12.4 12.4Direct taxes 9.7 10.3 10.3 10.6 10.5 10.6 10.7 10.6 10.5Capital tax 0.4 0.4 0.5 0.5 0.5 0.5 0.4 0.4 0.4
Social contributions 13.3 13.0 12.8 12.7 12.6 12.5 12.4 12.3 12.3Other revenue 2.8 3.1 3.2 3.2 3.3 3.2 3.1 3.0 2.9
Expenditure 45.7 47.8 44.9 43.9 42.9 42.3 41.7 41.1 40.4Expense 44.8 48.0 45.3 44.4 43.4 42.7 42.0 41.3 40.5
Compensation of employees 11.8 11.2 11.3 11.2 11.0 10.7 10.5 10.4 10.2Use of goods and services 6.0 5.7 5.5 5.4 5.2 5.1 5.1 5.0 4.9Consumption of fixed capital 1.9 1.9 1.9 1.9 1.9 1.9 1.9 1.9 1.9Interest 2.5 3.1 3.4 3.5 3.5 3.6 3.6 3.6 3.6Social benefits 18.5 19.0 19.3 19.1 18.8 18.5 18.1 17.7 17.3Other expense 4.1 7.0 3.7 3.2 2.8 2.8 2.7 2.7 2.6
o.w. financial sector support 0.5 3.8 0.5 … … … … … …Net acquisition of nonfinancial assets 0.9 -0.2 -0.4 -0.5 -0.5 -0.4 -0.3 -0.2 -0.1
Gross fixed capital investment 3.0 1.7 1.5 1.5 1.5 1.6 1.7 1.8 1.8Consumption of fixed capital 1.9 1.9 1.9 1.9 1.9 1.9 1.9 1.9 1.9Other non financial assets -0.1 0.1 0.0 0.0 0.0 0.0 0.0 0.0 0.0
Net lending / borrowing -9.6 -10.6 -7.1 -5.7 -4.7 -3.8 -2.9 -2.2 -1.8Net lending / borrowing (excluding financial sector support) -9.1 -6.8 -6.6 -5.7 -4.7 -3.8 -2.9 -2.2 -1.8
Memorandum items:Net lending/ borrowing (EDP targets) … … -6.5 -5.8 -4.2 -2.8 … … …Primary balance -7.5 -8.0 -4.1 -2.7 -1.6 -0.7 0.2 0.9 1.3Primary balance (including interest income) -7.0 -7.6 -3.6 -2.2 -1.2 -0.2 0.6 1.4 1.8Primary balance (excluding financial sector support and including interest income) -6.6 -3.8 -3.2 -2.2 -1.2 -0.2 0.6 1.4 1.8Change in Primary balance (excluding financial sector support and including interest income) 1.1 2.8 0.6 1.0 1.0 0.9 0.9 0.7 0.4Cyclically adjusted balance -8.1 -8.5 -4.5 -3.5 -2.9 -2.3 -1.8 -1.5 -1.4Primary structural balance (including interest income) -5.0 -2.1 -0.6 0.1 0.7 1.3 1.7 2.1 2.1Structural balance -7.6 -5.2 -4.0 -3.5 -2.9 -2.3 -1.8 -1.5 -1.4Change in structural primary balance (including interest income) 1.1 2.9 1.5 0.6 0.6 0.6 0.5 0.4 0.0General government gross debt (Maastricht) 70 86 94 99 101 102 102 101 100 Sources: Ministry of Finance; Eurostat; and IMF staff estimates and projections.
Projections
Table 3. General Government Operations

SPAIN
44 INTERNATIONAL MONETARY FUND
Table 4. General Government Balance Sheet
2008 2009 2010 2011 2012 2013
Financial assets 276 306 298 321 343 342Currency and Deposits 102 120 95 78 85 71Securities other than shares 34 28 22 14 5 5Loans 26 35 42 53 64 68Other assets 113 123 139 176 190 199
Liabilities 523 663 715 825 953 1,064Currency and deposits 3 3 4 4 4 4Securities other than shares 378 498 526 609 674 811Loans 78 90 108 124 212 192Other liabilities 63 72 78 88 64 57
Financial assets 26.2 28.1 28.4 30.6 32.3 32.5Currency and Deposits 9.7 11.0 9.1 7.4 8.0 6.8Securities other than shares 3.3 2.6 2.1 1.4 0.5 0.4Loans 2.5 3.2 4.0 5.1 6.0 6.4Other assets 10.8 11.4 13.2 16.7 17.8 18.9
Liabilities 49.6 60.9 68.3 78.6 89.7 101.2Currency and deposits 0.3 0.3 0.3 0.4 0.3 0.4Securities other than shares 35.9 45.8 50.2 58.0 63.4 77.2Loans 7.4 8.3 10.3 11.8 19.9 18.3Other liabilities 6.0 6.6 7.4 8.4 6.0 5.5
Memorandum items: (billions of euro)Public debt (EDP) 437 565 645 737 885 961Net lending/borrowing -49 -116 -101 -100 -109 -72Change in public debt (EDP) … 128 80 93 147 76Change in financial assets … 30 -8 23 23 -1Change in net financial assets … -98 -88 -70 -125 -77Unexplained change in net financial assets … 19 13 30 -15 -5
Sources: Bank of Spain and Staff estimates.
(billions of euro)
(percent of GDP)
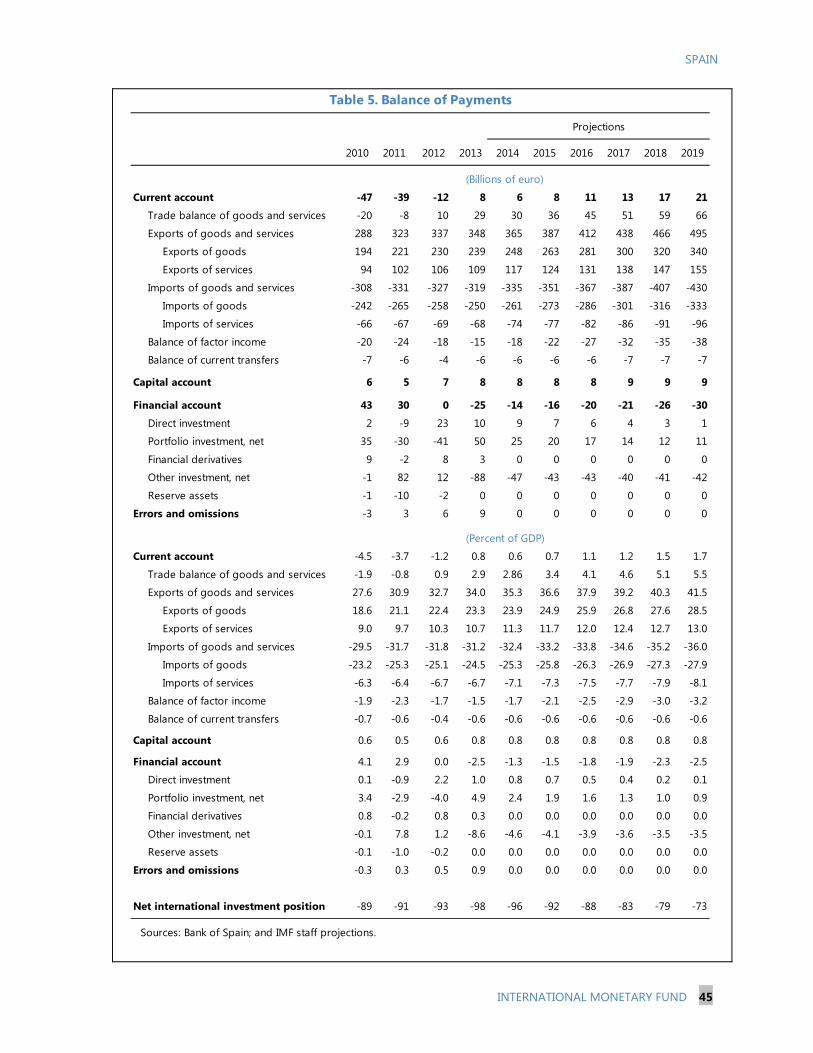
SPAIN
INTERNATIONAL MONETARY FUND 45
2010 2011 2012 2013 2014 2015 2016 2017 2018 2019
Current account -47 -39 -12 8 6 8 11 13 17 21
Trade balance of goods and services -20 -8 10 29 30 36 45 51 59 66
Exports of goods and services 288 323 337 348 365 387 412 438 466 495
Exports of goods 194 221 230 239 248 263 281 300 320 340
Exports of services 94 102 106 109 117 124 131 138 147 155
Imports of goods and services -308 -331 -327 -319 -335 -351 -367 -387 -407 -430
Imports of goods -242 -265 -258 -250 -261 -273 -286 -301 -316 -333
Imports of services -66 -67 -69 -68 -74 -77 -82 -86 -91 -96
Balance of factor income -20 -24 -18 -15 -18 -22 -27 -32 -35 -38
Balance of current transfers -7 -6 -4 -6 -6 -6 -6 -7 -7 -7
Capital account 6 5 7 8 8 8 8 9 9 9
Financial account 43 30 0 -25 -14 -16 -20 -21 -26 -30
Direct investment 2 -9 23 10 9 7 6 4 3 1
Portfolio investment, net 35 -30 -41 50 25 20 17 14 12 11
Financial derivatives 9 -2 8 3 0 0 0 0 0 0
Other investment, net -1 82 12 -88 -47 -43 -43 -40 -41 -42
Reserve assets -1 -10 -2 0 0 0 0 0 0 0
Errors and omissions -3 3 6 9 0 0 0 0 0 0
Current account -4.5 -3.7 -1.2 0.8 0.6 0.7 1.1 1.2 1.5 1.7
Trade balance of goods and services -1.9 -0.8 0.9 2.9 2.86 3.4 4.1 4.6 5.1 5.5
Exports of goods and services 27.6 30.9 32.7 34.0 35.3 36.6 37.9 39.2 40.3 41.5
Exports of goods 18.6 21.1 22.4 23.3 23.9 24.9 25.9 26.8 27.6 28.5
Exports of services 9.0 9.7 10.3 10.7 11.3 11.7 12.0 12.4 12.7 13.0
Imports of goods and services -29.5 -31.7 -31.8 -31.2 -32.4 -33.2 -33.8 -34.6 -35.2 -36.0
Imports of goods -23.2 -25.3 -25.1 -24.5 -25.3 -25.8 -26.3 -26.9 -27.3 -27.9
Imports of services -6.3 -6.4 -6.7 -6.7 -7.1 -7.3 -7.5 -7.7 -7.9 -8.1
Balance of factor income -1.9 -2.3 -1.7 -1.5 -1.7 -2.1 -2.5 -2.9 -3.0 -3.2
Balance of current transfers -0.7 -0.6 -0.4 -0.6 -0.6 -0.6 -0.6 -0.6 -0.6 -0.6
Capital account 0.6 0.5 0.6 0.8 0.8 0.8 0.8 0.8 0.8 0.8
Financial account 4.1 2.9 0.0 -2.5 -1.3 -1.5 -1.8 -1.9 -2.3 -2.5
Direct investment 0.1 -0.9 2.2 1.0 0.8 0.7 0.5 0.4 0.2 0.1
Portfolio investment, net 3.4 -2.9 -4.0 4.9 2.4 1.9 1.6 1.3 1.0 0.9
Financial derivatives 0.8 -0.2 0.8 0.3 0.0 0.0 0.0 0.0 0.0 0.0
Other investment, net -0.1 7.8 1.2 -8.6 -4.6 -4.1 -3.9 -3.6 -3.5 -3.5
Reserve assets -0.1 -1.0 -0.2 0.0 0.0 0.0 0.0 0.0 0.0 0.0
Errors and omissions -0.3 0.3 0.5 0.9 0.0 0.0 0.0 0.0 0.0 0.0
Net international investment position -89 -91 -93 -98 -96 -92 -88 -83 -79 -73
Sources: Bank of Spain; and IMF staff projections.
Table 5. Balance of Payments
Projections
(Billions of euro)
(Percent of GDP)
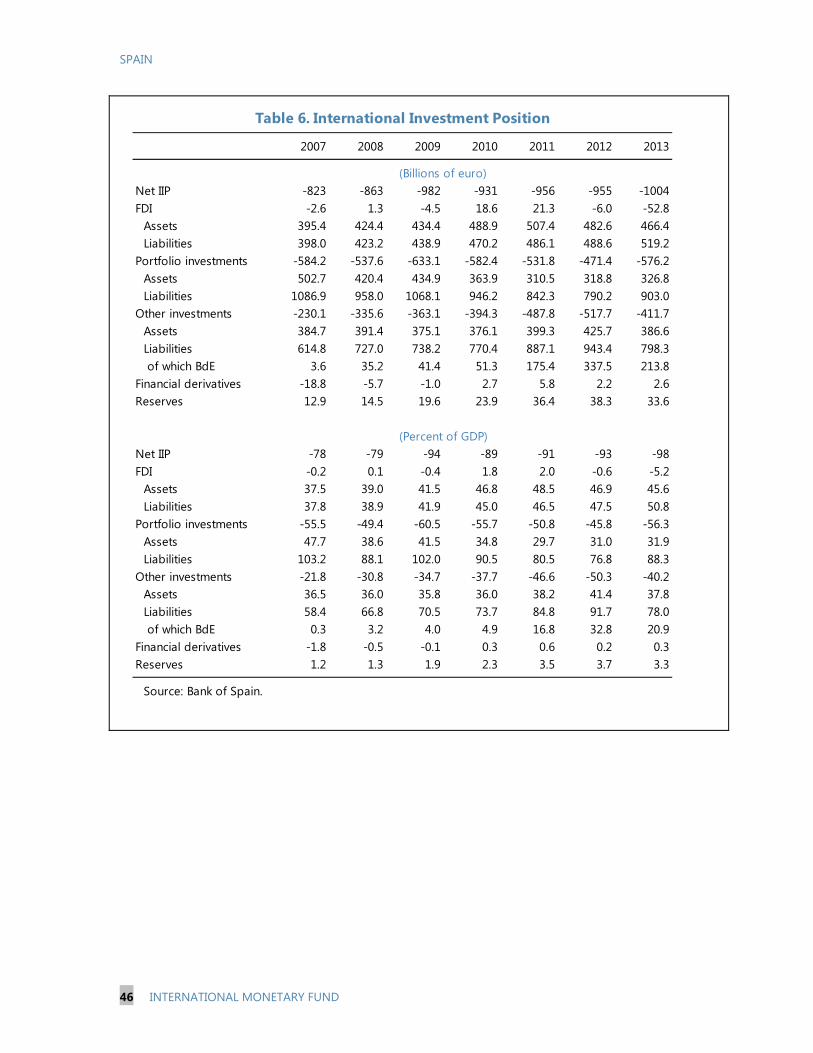
SPAIN
46 INTERNATIONAL MONETARY FUND
2007 2008 2009 2010 2011 2012 2013
Net IIP -823 -863 -982 -931 -956 -955 -1004FDI -2.6 1.3 -4.5 18.6 21.3 -6.0 -52.8
Assets 395.4 424.4 434.4 488.9 507.4 482.6 466.4Liabilities 398.0 423.2 438.9 470.2 486.1 488.6 519.2
Portfolio investments -584.2 -537.6 -633.1 -582.4 -531.8 -471.4 -576.2Assets 502.7 420.4 434.9 363.9 310.5 318.8 326.8Liabilities 1086.9 958.0 1068.1 946.2 842.3 790.2 903.0
Other investments -230.1 -335.6 -363.1 -394.3 -487.8 -517.7 -411.7Assets 384.7 391.4 375.1 376.1 399.3 425.7 386.6Liabilities 614.8 727.0 738.2 770.4 887.1 943.4 798.3 of which BdE 3.6 35.2 41.4 51.3 175.4 337.5 213.8
Financial derivatives -18.8 -5.7 -1.0 2.7 5.8 2.2 2.6Reserves 12.9 14.5 19.6 23.9 36.4 38.3 33.6
Net IIP -78 -79 -94 -89 -91 -93 -98FDI -0.2 0.1 -0.4 1.8 2.0 -0.6 -5.2
Assets 37.5 39.0 41.5 46.8 48.5 46.9 45.6Liabilities 37.8 38.9 41.9 45.0 46.5 47.5 50.8
Portfolio investments -55.5 -49.4 -60.5 -55.7 -50.8 -45.8 -56.3Assets 47.7 38.6 41.5 34.8 29.7 31.0 31.9Liabilities 103.2 88.1 102.0 90.5 80.5 76.8 88.3
Other investments -21.8 -30.8 -34.7 -37.7 -46.6 -50.3 -40.2Assets 36.5 36.0 35.8 36.0 38.2 41.4 37.8Liabilities 58.4 66.8 70.5 73.7 84.8 91.7 78.0 of which BdE 0.3 3.2 4.0 4.9 16.8 32.8 20.9
Financial derivatives -1.8 -0.5 -0.1 0.3 0.6 0.2 0.3Reserves 1.2 1.3 1.9 2.3 3.5 3.7 3.3
Source: Bank of Spain.
Table 6. International Investment Position
(Billions of euro)
(Percent of GDP)
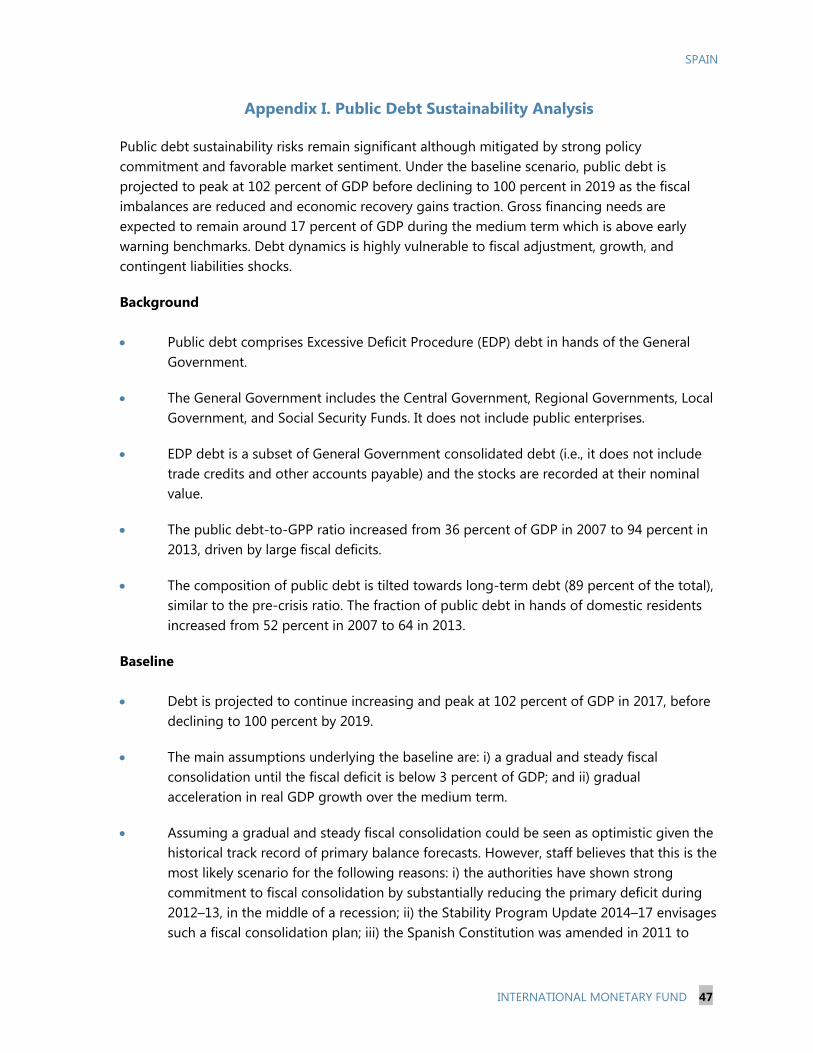
SPAIN
INTERNATIONAL MONETARY FUND 47
Appendix I. Public Debt Sustainability Analysis
Public debt sustainability risks remain significant although mitigated by strong policy commitment and favorable market sentiment. Under the baseline scenario, public debt is projected to peak at 102 percent of GDP before declining to 100 percent in 2019 as the fiscal imbalances are reduced and economic recovery gains traction. Gross financing needs are expected to remain around 17 percent of GDP during the medium term which is above early warning benchmarks. Debt dynamics is highly vulnerable to fiscal adjustment, growth, and contingent liabilities shocks.
Background Public debt comprises Excessive Deficit Procedure (EDP) debt in hands of the General
Government.
The General Government includes the Central Government, Regional Governments, Local Government, and Social Security Funds. It does not include public enterprises.
EDP debt is a subset of General Government consolidated debt (i.e., it does not include trade credits and other accounts payable) and the stocks are recorded at their nominal value.
The public debt-to-GPP ratio increased from 36 percent of GDP in 2007 to 94 percent in 2013, driven by large fiscal deficits.
The composition of public debt is tilted towards long-term debt (89 percent of the total), similar to the pre-crisis ratio. The fraction of public debt in hands of domestic residents increased from 52 percent in 2007 to 64 in 2013.
Baseline Debt is projected to continue increasing and peak at 102 percent of GDP in 2017, before
declining to 100 percent by 2019.
The main assumptions underlying the baseline are: i) a gradual and steady fiscal consolidation until the fiscal deficit is below 3 percent of GDP; and ii) gradual acceleration in real GDP growth over the medium term.
Assuming a gradual and steady fiscal consolidation could be seen as optimistic given the historical track record of primary balance forecasts. However, staff believes that this is the most likely scenario for the following reasons: i) the authorities have shown strong commitment to fiscal consolidation by substantially reducing the primary deficit during 2012–13, in the middle of a recession; ii) the Stability Program Update 2014–17 envisages such a fiscal consolidation plan; iii) the Spanish Constitution was amended in 2011 to
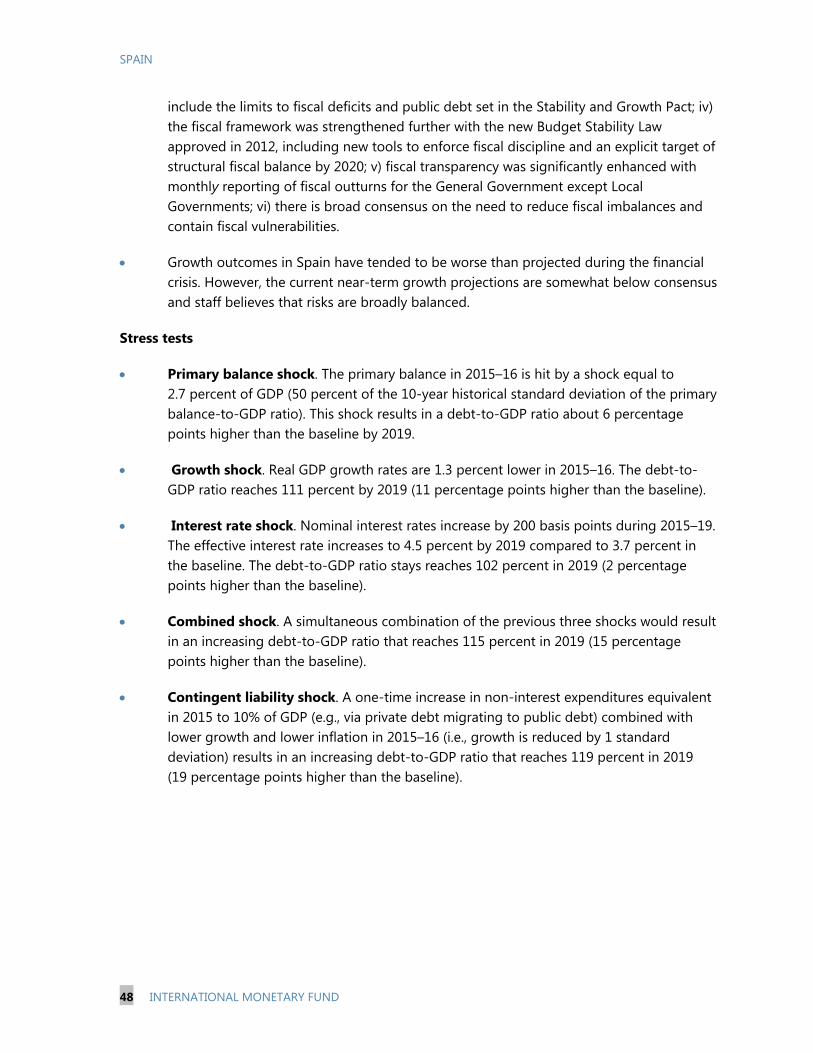
SPAIN
48 INTERNATIONAL MONETARY FUND
include the limits to fiscal deficits and public debt set in the Stability and Growth Pact; iv) the fiscal framework was strengthened further with the new Budget Stability Law approved in 2012, including new tools to enforce fiscal discipline and an explicit target of structural fiscal balance by 2020; v) fiscal transparency was significantly enhanced with monthly reporting of fiscal outturns for the General Government except Local Governments; vi) there is broad consensus on the need to reduce fiscal imbalances and contain fiscal vulnerabilities.
Growth outcomes in Spain have tended to be worse than projected during the financial crisis. However, the current near-term growth projections are somewhat below consensus and staff believes that risks are broadly balanced.
Stress tests
Primary balance shock. The primary balance in 2015–16 is hit by a shock equal to 2.7 percent of GDP (50 percent of the 10-year historical standard deviation of the primary balance-to-GDP ratio). This shock results in a debt-to-GDP ratio about 6 percentage points higher than the baseline by 2019.
Growth shock. Real GDP growth rates are 1.3 percent lower in 2015–16. The debt-to-GDP ratio reaches 111 percent by 2019 (11 percentage points higher than the baseline).
Interest rate shock. Nominal interest rates increase by 200 basis points during 2015–19. The effective interest rate increases to 4.5 percent by 2019 compared to 3.7 percent in the baseline. The debt-to-GDP ratio stays reaches 102 percent in 2019 (2 percentage points higher than the baseline).
Combined shock. A simultaneous combination of the previous three shocks would result in an increasing debt-to-GDP ratio that reaches 115 percent in 2019 (15 percentage points higher than the baseline).
Contingent liability shock. A one-time increase in non-interest expenditures equivalent in 2015 to 10% of GDP (e.g., via private debt migrating to public debt) combined with lower growth and lower inflation in 2015–16 (i.e., growth is reduced by 1 standard deviation) results in an increasing debt-to-GDP ratio that reaches 119 percent in 2019 (19 percentage points higher than the baseline).
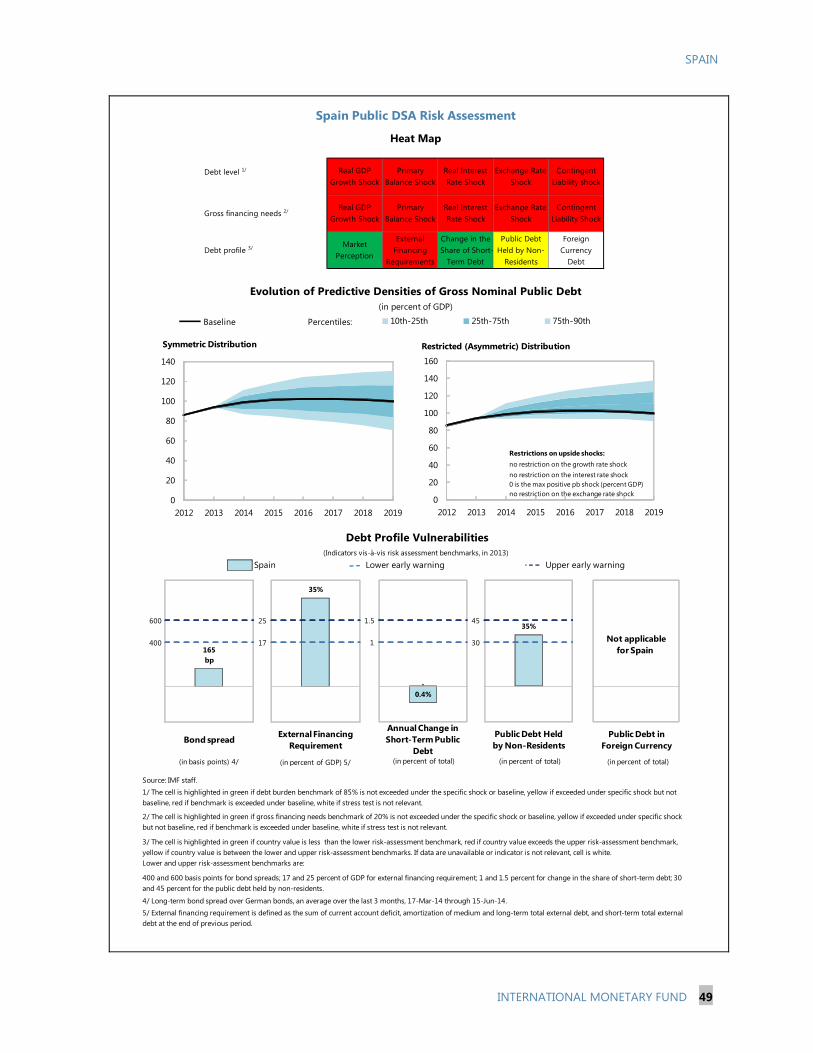
SPAIN
INTERNATIONAL MONETARY FUND 49
Spain
Source: IMF staff.
5/ External financing requirement is defined as the sum of current account deficit, amortization of medium and long-term total external debt, and short-term total external debt at the end of previous period.
4/ Long-term bond spread over German bonds, an average over the last 3 months, 17-Mar-14 through 15-Jun-14.
2/ The cell is highlighted in green if gross financing needs benchmark of 20% is not exceeded under the specific shock or baseline, yellow if exceeded under specific shock but not baseline, red if benchmark is exceeded under baseline, white if stress test is not relevant.
400 and 600 basis points for bond spreads; 17 and 25 percent of GDP for external financing requirement; 1 and 1.5 percent for change in the share of short-term debt; 30 and 45 percent for the public debt held by non-residents.
Market Perception
Debt level 1/ Real GDP Growth Shock
Primary Balance Shock
3/ The cell is highlighted in green if country value is less than the lower risk-assessment benchmark, red if country value exceeds the upper risk-assessment benchmark, yellow if country value is between the lower and upper risk-assessment benchmarks. If data are unavailable or indicator is not relevant, cell is white. Lower and upper risk-assessment benchmarks are:
Change in the Share of Short-
Term Debt
Foreign Currency
Debt
Public Debt Held by Non-
Residents
Primary Balance Shock
Real Interest Rate Shock
Exchange Rate Shock
Contingent Liability Shock
Exchange Rate Shock
Contingent Liability shock
Spain Public DSA Risk Assessment
1/ The cell is highlighted in green if debt burden benchmark of 85% is not exceeded under the specific shock or baseline, yellow if exceeded under specific shock but not baseline, red if benchmark is exceeded under baseline, white if stress test is not relevant.
Real Interest Rate Shock
External Financing
Requirements
Real GDP Growth Shock
Heat Map
Upper early warning
Evolution of Predictive Densities of Gross Nominal Public Debt(in percent of GDP)
Debt profile 3/
Lower early warning(Indicators vis-à-vis risk assessment benchmarks, in 2013)
Debt Profile Vulnerabilities
Gross financing needs 2/
1 2
Not applicable for Spain
400
600
165 bp
1 2
17
25
35%
1 2
1
1.5
-0.4%1 2
Bond spread External Financing Requirement
Annual Change in Short-Term Public
Debt
Public Debt in Foreign Currency
(in basis points) 4/ (in percent of GDP) 5/ (in percent of total) (in percent of total)
0
20
40
60
80
100
120
140
2012 2013 2014 2015 2016 2017 2018 2019
10th-25th 25th-75th 75th-90thPercentiles:Baseline
Symmetric Distribution
0
20
40
60
80
100
120
140
160
2012 2013 2014 2015 2016 2017 2018 2019
Restricted (Asymmetric) Distribution
no restriction on the growth rate shockno restriction on the interest rate shock0 is the max positive pb shock (percent GDP)no restriction on the exchange rate shock
Restrictions on upside shocks:
30
4535%
1 2
Public Debt Held by Non-Residents
(in percent of total)
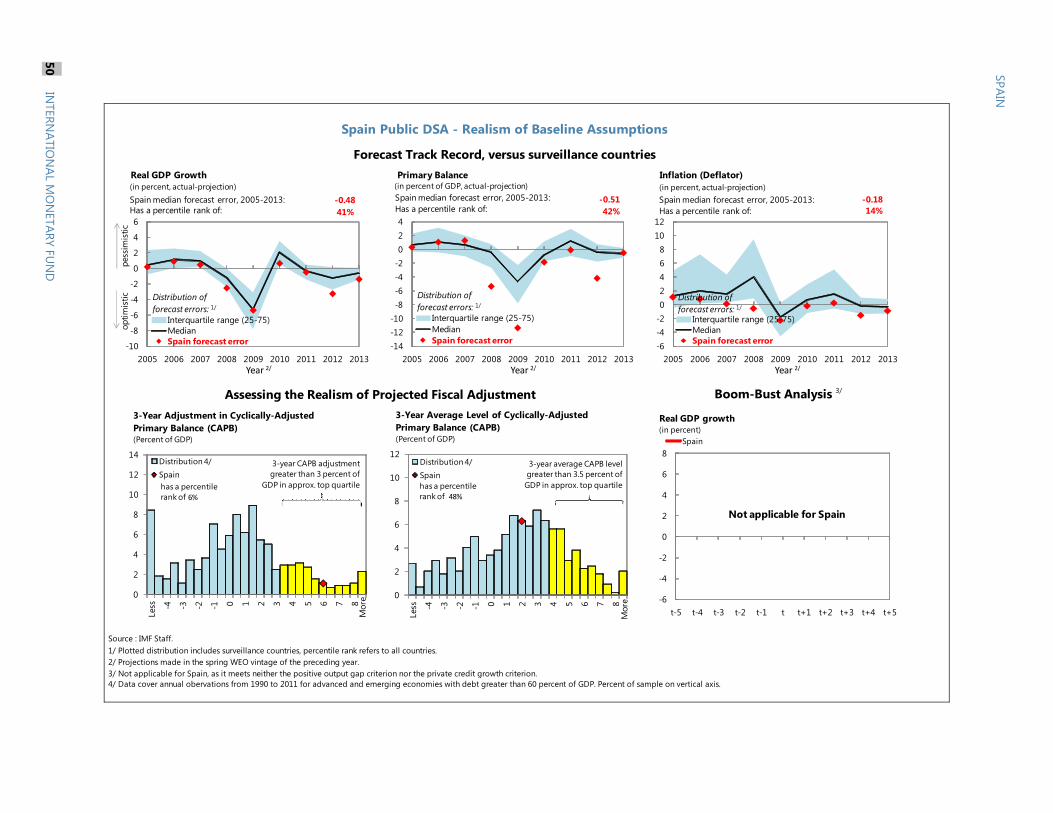
Source : IMF Staff.1/ Plotted distribution includes surveillance countries, percentile rank refers to all countries.2/ Projections made in the spring WEO vintage of the preceding year.3/ Not applicable for Spain, as it meets neither the positive output gap criterion nor the private credit growth criterion.
4/ Data cover annual obervations from 1990 to 2011 for advanced and emerging economies with debt greater than 60 percent of GDP. Percent of sample on vertical axis.
Spain Public DSA - Realism of Baseline Assumptions
Forecast Track Record, versus surveillance countries
Boom-Bust Analysis 3/Assessing the Realism of Projected Fiscal Adjustment
-10
-8
-6
-4
-2
0
2
4
6
2005 2006 2007 2008 2009 2010 2011 2012 2013Year 2/
Real GDP Growth
Interquartile range (25-75)MedianSpain forecast error
-0.4841%Has a percentile rank of:
Spain median forecast error, 2005-2013:
Distribution of forecast errors: 1/
(in percent, actual-projection)
-14-12-10-8-6-4-2024
2005 2006 2007 2008 2009 2010 2011 2012 2013Year 2/
Primary Balance
Interquartile range (25-75)MedianSpain forecast error
-0.5142%Has a percentile rank of:
Spain median forecast error, 2005-2013:
Distribution of forecast errors: 1/
(in percent of GDP, actual-projection)
-6-4-202468
1012
2005 2006 2007 2008 2009 2010 2011 2012 2013Year 2/
Inflation (Deflator)
Interquartile range (25-75)MedianSpain forecast error
-0.1814%Has a percentile rank of:
Spain median forecast error, 2005-2013:
Distribution of forecast errors: 1/
(in percent, actual-projection)
pess
imis
ticop
timis
tic
-6
-4
-2
0
2
4
6
8
t-5 t-4 t-3 t-2 t-1 t t+1 t+2 t+3 t+4 t+5
Real GDP growth
Spain(in percent)
Not applicable for Spain
0
2
4
6
8
10
12
14
Less -4 -3 -2 -1 0 1 2 3 4 5 6 7 8
Distribution 4/Spain
3-Year Adjustment in Cyclically-Adjusted Primary Balance (CAPB)(Percent of GDP)
Mor
e
3-year CAPB adjustment greater than 3 percent of
GDP in approx. top quartilehas a percentile rank of 6%
0
2
4
6
8
10
12
Less -4 -3 -2 -1 0 1 2 3 4 5 6 7 8
Distribution 4/Spain
3-Year Average Level of Cyclically-Adjusted Primary Balance (CAPB)(Percent of GDP)
Mor
e
3-year average CAPB level greater than 3.5 percent of GDP in approx. top quartilehas a percentile
rank of 48%
SPAIN
50 IN
TERNATIO
NAL M
ON
ETARY FUN
D
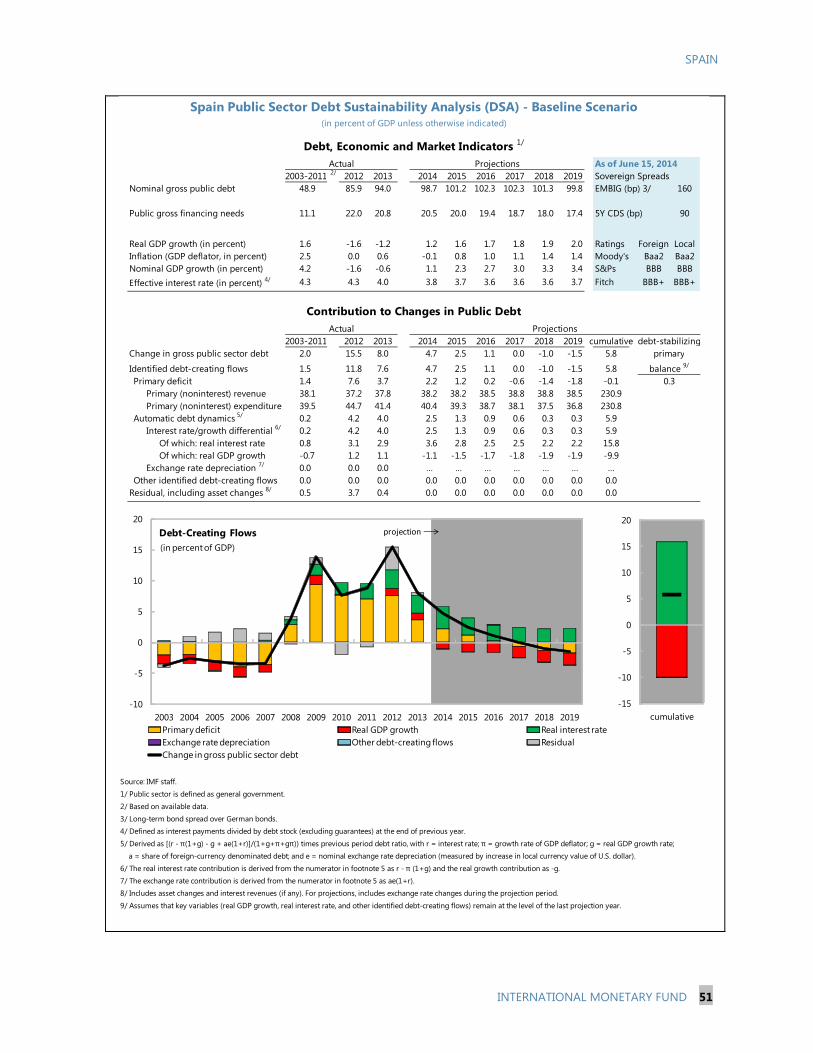
SPAIN
INTERNATIONAL MONETARY FUND 51
As of June 15, 20142/ 2012 2013 2014 2015 2016 2017 2018 2019 Sovereign Spreads
Nominal gross public debt 48.9 85.9 94.0 98.7 101.2 102.3 102.3 101.3 99.8 EMBIG (bp) 3/ 160
Public gross financing needs 11.1 22.0 20.8 20.5 20.0 19.4 18.7 18.0 17.4 5Y CDS (bp) 90
Real GDP growth (in percent) 1.6 -1.6 -1.2 1.2 1.6 1.7 1.8 1.9 2.0 Ratings Foreign LocalInflation (GDP deflator, in percent) 2.5 0.0 0.6 -0.1 0.8 1.0 1.1 1.4 1.4 Moody's Baa2 Baa2Nominal GDP growth (in percent) 4.2 -1.6 -0.6 1.1 2.3 2.7 3.0 3.3 3.4 S&Ps BBB BBBEffective interest rate (in percent) 4/ 4.3 4.3 4.0 3.8 3.7 3.6 3.6 3.6 3.7 Fitch BBB+ BBB+
2012 2013 2014 2015 2016 2017 2018 2019 cumulativeChange in gross public sector debt 2.0 15.5 8.0 4.7 2.5 1.1 0.0 -1.0 -1.5 5.8
Identified debt-creating flows 1.5 11.8 7.6 4.7 2.5 1.1 0.0 -1.0 -1.5 5.8Primary deficit 1.4 7.6 3.7 2.2 1.2 0.2 -0.6 -1.4 -1.8 -0.1
Primary (noninterest) revenue 38.1 37.2 37.8 38.2 38.2 38.5 38.8 38.8 38.5 230.9Primary (noninterest) expenditure 39.5 44.7 41.4 40.4 39.3 38.7 38.1 37.5 36.8 230.8
Automatic debt dynamics 5/ 0.2 4.2 4.0 2.5 1.3 0.9 0.6 0.3 0.3 5.9Interest rate/growth differential 6/ 0.2 4.2 4.0 2.5 1.3 0.9 0.6 0.3 0.3 5.9
Of which: real interest rate 0.8 3.1 2.9 3.6 2.8 2.5 2.5 2.2 2.2 15.8Of which: real GDP growth -0.7 1.2 1.1 -1.1 -1.5 -1.7 -1.8 -1.9 -1.9 -9.9
Exchange rate depreciation 7/ 0.0 0.0 0.0 … … … … … … …Other identified debt-creating flows 0.0 0.0 0.0 0.0 0.0 0.0 0.0 0.0 0.0 0.0
Residual, including asset changes 8/ 0.5 3.7 0.4 0.0 0.0 0.0 0.0 0.0 0.0 0.0
Source: IMF staff.1/ Public sector is defined as general government.
2/ Based on available data.3/ Long-term bond spread over German bonds.4/ Defined as interest payments divided by debt stock (excluding guarantees) at the end of previous year.
5/ Derived as [(r - π(1+g) - g + ae(1+r)]/(1+g+π+gπ)) times previous period debt ratio, with r = interest rate; π = growth rate of GDP deflator; g = real GDP growth rate;a = share of foreign-currency denominated debt; and e = nominal exchange rate depreciation (measured by increase in local currency value of U.S. dollar).
6/ The real interest rate contribution is derived from the numerator in footnote 5 as r - π (1+g) and the real growth contribution as -g.7/ The exchange rate contribution is derived from the numerator in footnote 5 as ae(1+r). 8/ Includes asset changes and interest revenues (if any). For projections, includes exchange rate changes during the projection period.
9/ Assumes that key variables (real GDP growth, real interest rate, and other identified debt-creating flows) remain at the level of the last projection year.
Spain Public Sector Debt Sustainability Analysis (DSA) - Baseline Scenario
0.3balance 9/
primary
(in percent of GDP unless otherwise indicated)
Debt, Economic and Market Indicators 1/
2003-2011Actual
Projections
Contribution to Changes in Public DebtProjections
2003-2011Actual
debt-stabilizing
-10
-5
0
5
10
15
20
2003 2004 2005 2006 2007 2008 2009 2010 2011 2012 2013 2014 2015 2016 2017 2018 2019
Debt-Creating Flows
Primary deficit Real GDP growth Real interest rate Exchange rate depreciation Other debt-creating flows ResidualChange in gross public sector debt
projection
(in percent of GDP)
-15
-10
-5
0
5
10
15
20
cumulative
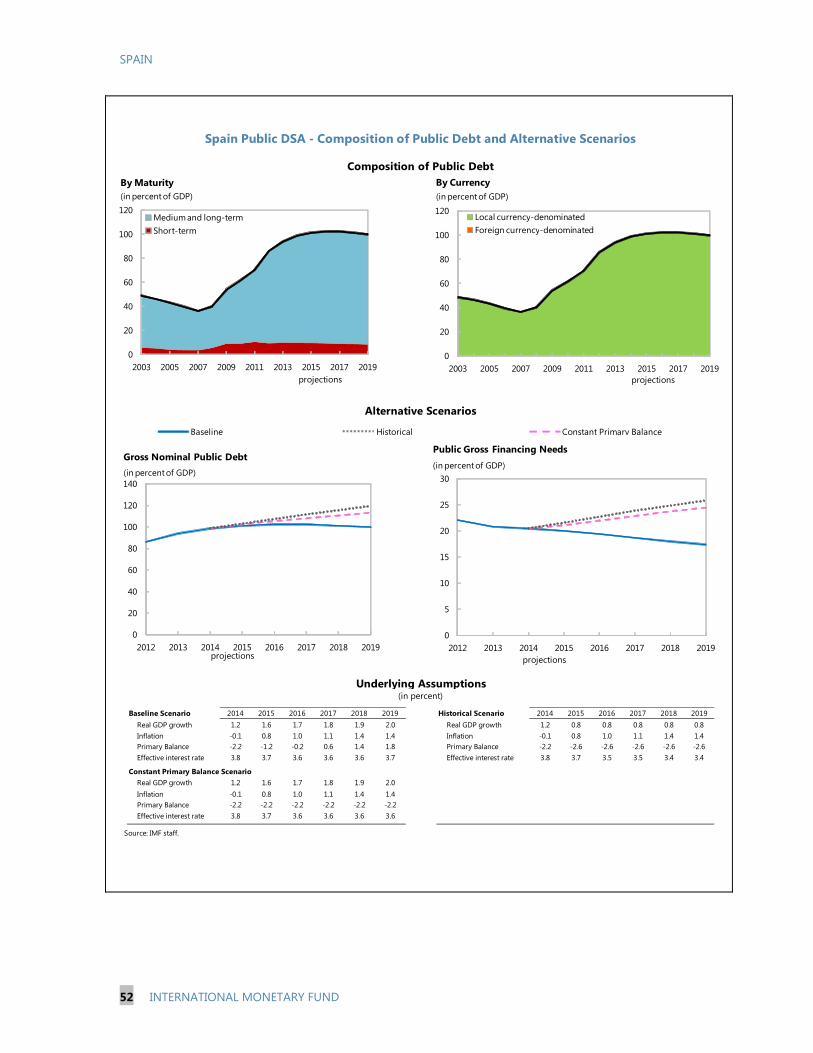
SPAIN
52 INTERNATIONAL MONETARY FUND
Baseline Scenario 2014 2015 2016 2017 2018 2019 Historical Scenario 2014 2015 2016 2017 2018 2019Real GDP growth 1.2 1.6 1.7 1.8 1.9 2.0 Real GDP growth 1.2 0.8 0.8 0.8 0.8 0.8Inflation -0.1 0.8 1.0 1.1 1.4 1.4 Inflation -0.1 0.8 1.0 1.1 1.4 1.4Primary Balance -2.2 -1.2 -0.2 0.6 1.4 1.8 Primary Balance -2.2 -2.6 -2.6 -2.6 -2.6 -2.6Effective interest rate 3.8 3.7 3.6 3.6 3.6 3.7 Effective interest rate 3.8 3.7 3.5 3.5 3.4 3.4
Constant Primary Balance ScenarioReal GDP growth 1.2 1.6 1.7 1.8 1.9 2.0Inflation -0.1 0.8 1.0 1.1 1.4 1.4Primary Balance -2.2 -2.2 -2.2 -2.2 -2.2 -2.2Effective interest rate 3.8 3.7 3.6 3.6 3.6 3.6
Source: IMF staff.
Spain Public DSA - Composition of Public Debt and Alternative Scenarios
Composition of Public Debt
Alternative Scenarios
Baseline Historical Constant Primary Balance
Underlying Assumptions(in percent)
0
20
40
60
80
100
120
140
2012 2013 2014 2015 2016 2017 2018 2019
Gross Nominal Public Debt(in percent of GDP)
projections
0
5
10
15
20
25
30
2012 2013 2014 2015 2016 2017 2018 2019
Public Gross Financing Needs(in percent of GDP)
projections
0
20
40
60
80
100
120
2003 2005 2007 2009 2011 2013 2015 2017 2019
By Currency
Local currency-denominatedForeign currency-denominated
projections
(in percent of GDP)
0
20
40
60
80
100
120
2003 2005 2007 2009 2011 2013 2015 2017 2019
By Maturity
Medium and long-termShort-term
projections
(in percent of GDP)
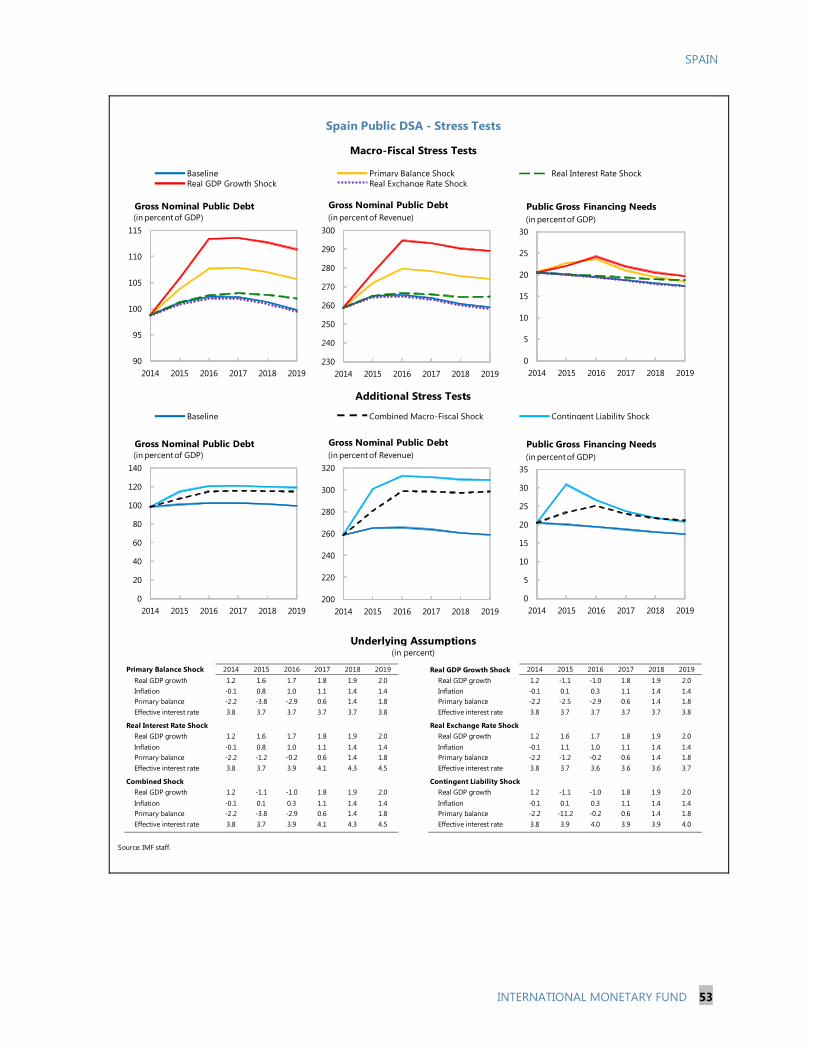
SPAIN
INTERNATIONAL MONETARY FUND 53
Primary Balance Shock 2014 2015 2016 2017 2018 2019 Real GDP Growth Shock 2014 2015 2016 2017 2018 2019Real GDP growth 1.2 1.6 1.7 1.8 1.9 2.0 Real GDP growth 1.2 -1.1 -1.0 1.8 1.9 2.0Inflation -0.1 0.8 1.0 1.1 1.4 1.4 Inflation -0.1 0.1 0.3 1.1 1.4 1.4Primary balance -2.2 -3.8 -2.9 0.6 1.4 1.8 Primary balance -2.2 -2.5 -2.9 0.6 1.4 1.8Effective interest rate 3.8 3.7 3.7 3.7 3.7 3.8 Effective interest rate 3.8 3.7 3.7 3.7 3.7 3.8
Real Interest Rate Shock Real Exchange Rate ShockReal GDP growth 1.2 1.6 1.7 1.8 1.9 2.0 Real GDP growth 1.2 1.6 1.7 1.8 1.9 2.0Inflation -0.1 0.8 1.0 1.1 1.4 1.4 Inflation -0.1 1.1 1.0 1.1 1.4 1.4Primary balance -2.2 -1.2 -0.2 0.6 1.4 1.8 Primary balance -2.2 -1.2 -0.2 0.6 1.4 1.8Effective interest rate 3.8 3.7 3.9 4.1 4.3 4.5 Effective interest rate 3.8 3.7 3.6 3.6 3.6 3.7
Combined Shock Contingent Liability ShockReal GDP growth 1.2 -1.1 -1.0 1.8 1.9 2.0 Real GDP growth 1.2 -1.1 -1.0 1.8 1.9 2.0Inflation -0.1 0.1 0.3 1.1 1.4 1.4 Inflation -0.1 0.1 0.3 1.1 1.4 1.4Primary balance -2.2 -3.8 -2.9 0.6 1.4 1.8 Primary balance -2.2 -11.2 -0.2 0.6 1.4 1.8Effective interest rate 3.8 3.7 3.9 4.1 4.3 4.5 Effective interest rate 3.8 3.9 4.0 3.9 3.9 4.0
Source: IMF staff.
(in percent)
Real Exchange Rate Shock
Combined Macro-Fiscal Shock
Additional Stress Tests
Baseline
Underlying Assumptions
Contingent Liability Shock
Spain Public DSA - Stress Tests
Macro-Fiscal Stress Tests
Baseline Primary Balance ShockReal GDP Growth Shock
Real Interest Rate Shock
90
95
100
105
110
115
2014 2015 2016 2017 2018 2019
Gross Nominal Public Debt(in percent of GDP)
230
240
250
260
270
280
290
300
2014 2015 2016 2017 2018 2019
Gross Nominal Public Debt(in percent of Revenue)
0
5
10
15
20
25
30
2014 2015 2016 2017 2018 2019
Public Gross Financing Needs(in percent of GDP)
0
20
40
60
80
100
120
140
2014 2015 2016 2017 2018 2019
Gross Nominal Public Debt(in percent of GDP)
200
220
240
260
280
300
320
2014 2015 2016 2017 2018 2019
Gross Nominal Public Debt(in percent of Revenue)
0
5
10
15
20
25
30
35
2014 2015 2016 2017 2018 2019
Public Gross Financing Needs(in percent of GDP)
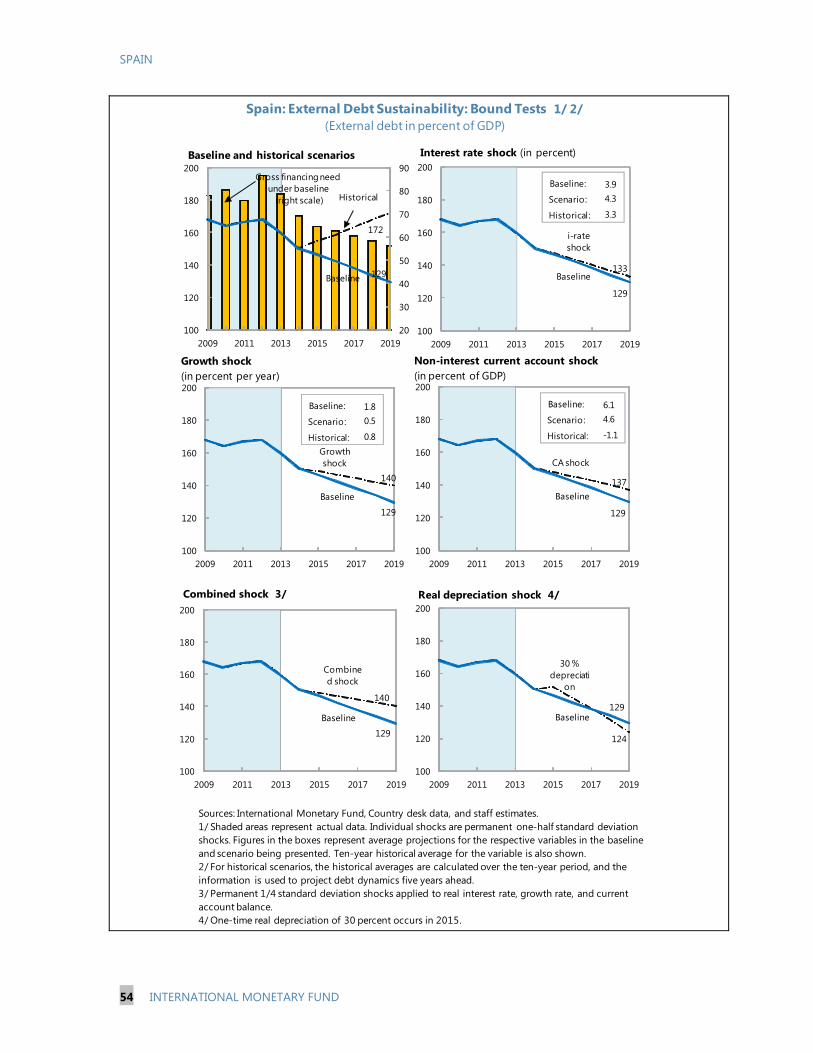
SPAIN
54 INTERNATIONAL MONETARY FUND
i-rate shock
133Baseline
129
100
120
140
160
180
200
2009 2011 2013 2015 2017 2019
Interest rate shock (in percent)
Spain: External Debt Sustainability: Bound Tests 1/ 2/(External debt in percent of GDP)
Sources: International Monetary Fund, Country desk data, and staff estimates.1/ Shaded areas represent actual data. Individual shocks are permanent one-half standard deviation shocks. Figures in the boxes represent average projections for the respective variables in the baseline and scenario being presented. Ten-year historical average for the variable is also shown. 2/ For historical scenarios, the historical averages are calculated over the ten-year period, and the information is used to project debt dynamics five years ahead.3/ Permanent 1/4 standard deviation shocks applied to real interest rate, growth rate, and current account balance.4/ One-time real depreciation of 30 percent occurs in 2015.
Historical
172
Baseline 129
20
30
40
50
60
70
80
90
100
120
140
160
180
200
2009 2011 2013 2015 2017 2019
Baseline and historical scenarios
CA shock
137Baseline
129
100
120
140
160
180
200
2009 2011 2013 2015 2017 2019
Combined shock
140
Baseline
129
100
120
140
160
180
200
2009 2011 2013 2015 2017 2019
Combined shock 3/
30 % depreciati
on
124
Baseline129
100
120
140
160
180
200
2009 2011 2013 2015 2017 2019
Real depreciation shock 4/
Gross financing need under baseline
(right scale)
Non-interest current account shock (in percent of GDP)
Growth shock
140
Baseline
129
100
120
140
160
180
200
2009 2011 2013 2015 2017 2019
Baseline:
Scenario:
Historical:
3.94.3
3.3
Baseline:
Scenario:
Historical:
1.80.5
0.8
Baseline:
Scenario:
Historical:
6.14.6
-1.1
Growth shock (in percent per year)
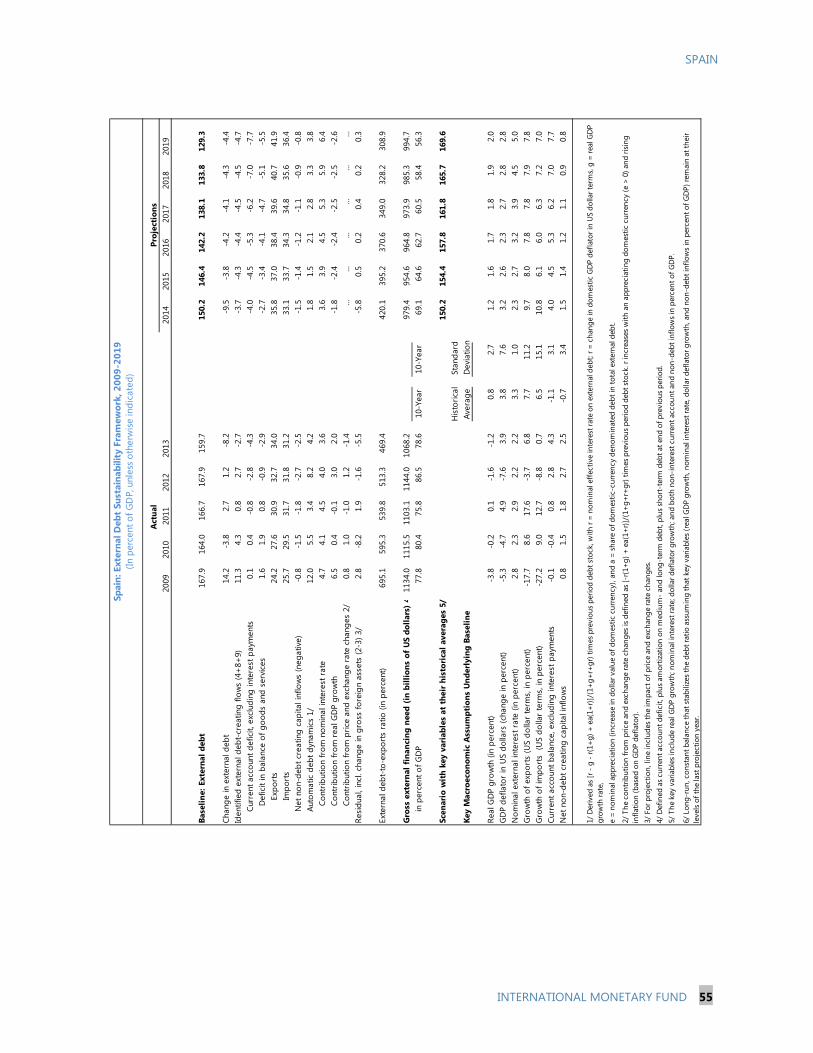
SPAIN
INTERNATIONAL MONETARY FUND 55
Proj
ecti
ons
2009
2010
2011
2012
2013
2014
2015
2016
2017
2018
2019
Base
line:
Ext
erna
l deb
t16
7.9
164.
016
6.7
167.
915
9.7
150.
214
6.4
142.
213
8.1
133.
812
9.3
Chan
ge in
ext
erna
l deb
t14
.2-3
.82.
71.
2-8
.2-9
.5-3
.8-4
.2-4
.1-4
.3-4
.4Id
entif
ied
exte
rnal
deb
t-cr
eatin
g flo
ws
(4+
8+9)
11.3
4.3
0.8
2.7
-2.7
-3.7
-4.3
-4.4
-4.5
-4.5
-4.7
Curr
ent a
ccou
nt d
efic
it, e
xclu
ding
inte
rest
pay
men
ts0.
10.
4-0
.8-2
.8-4
.3-4
.0-4
.5-5
.3-6
.2-7
.0-7
.7D
efic
it in
bal
ance
of g
oods
and
ser
vice
s1.
61.
90.
8-0
.9-2
.9-2
.7-3
.4-4
.1-4
.7-5
.1-5
.5Ex
port
s24
.227
.630
.932
.734
.035
.837
.038
.439
.640
.741
.9Im
port
s 25
.729
.531
.731
.831
.233
.133
.734
.334
.835
.636
.4N
et n
on-d
ebt c
reat
ing
capi
tal i
nflo
ws
(neg
ativ
e)-0
.8-1
.5-1
.8-2
.7-2
.5-1
.5-1
.4-1
.2-1
.1-0
.9-0
.8Au
tom
atic
deb
t dyn
amic
s 1/
12.0
5.5
3.4
8.2
4.2
1.8
1.5
2.1
2.8
3.3
3.8
Cont
ribut
ion
from
nom
inal
inte
rest
rat
e4.
74.
14.
54.
03.
63.
63.
94.
55.
35.
96.
4Co
ntrib
utio
n fr
om r
eal G
DP
grow
th
6.5
0.4
-0.1
3.0
2.0
-1.8
-2.4
-2.4
-2.5
-2.5
-2.6
Cont
ribut
ion
from
pric
e an
d ex
chan
ge r
ate
chan
ges
2/
0.8
1.0
-1.0
1.2
-1.4
......
......
......
Resi
dual
, inc
l. ch
ange
in g
ross
fore
ign
asse
ts (2
-3) 3
/2.
8-8
.21.
9-1
.6-5
.5-5
.80.
50.
20.
40.
20.
3
Exte
rnal
deb
t-to
-exp
orts
rat
io (i
n pe
rcen
t)69
5.1
595.
353
9.8
513.
346
9.4
420.
139
5.2
370.
634
9.0
328.
230
8.9
Gro
ss e
xter
nal f
inan
cing
nee
d (i
n bi
llion
s of
US
dolla
rs)
411
34.0
1115
.511
03.1
1144
.010
68.2
979.
495
4.6
964.
897
3.9
985.
399
4.7
in p
erce
nt o
f GD
P77
.880
.475
.886
.578
.610
-Yea
r10
-Yea
r69
.164
.662
.760
.558
.456
.3
Scen
ario
wit
h ke
y va
riab
les
at t
heir
his
tori
cal a
vera
ges
5/15
0.2
154.
415
7.8
161.
816
5.7
169.
6H
isto
rical
Stan
dard
Ke
y M
acro
econ
omic
Ass
umpt
ions
Und
erly
ing
Base
line
Aver
age
Dev
iatio
n
Real
GD
P gr
owth
(in
perc
ent)
-3.8
-0.2
0.1
-1.6
-1.2
0.8
2.7
1.2
1.6
1.7
1.8
1.9
2.0
GD
P de
flato
r in
US
dolla
rs (c
hang
e in
per
cent
)-5
.3-4
.74.
9-7
.63.
93.
87.
63.
22.
62.
32.
72.
82.
8N
omin
al e
xter
nal i
nter
est r
ate
(in p
erce
nt)
2.8
2.3
2.9
2.2
2.2
3.3
1.0
2.3
2.7
3.2
3.9
4.5
5.0
Gro
wth
of e
xpor
ts (U
S do
llar
term
s, in
per
cent
)-1
7.7
8.6
17.6
-3.7
6.8
7.7
11.2
9.7
8.0
7.8
7.8
7.9
7.8
Gro
wth
of i
mpo
rts
(US
dolla
r te
rms,
in p
erce
nt)
-27.
29.
012
.7-8
.80.
76.
515
.110
.86.
16.
06.
37.
27.
0Cu
rren
t acc
ount
bal
ance
, exc
ludi
ng in
tere
st p
aym
ents
-0
.1-0
.40.
82.
84.
3-1
.13.
14.
04.
55.
36.
27.
07.
7N
et n
on-d
ebt c
reat
ing
capi
tal i
nflo
ws
0.8
1.5
1.8
2.7
2.5
-0.7
3.4
1.5
1.4
1.2
1.1
0.9
0.8
e =
nom
inal
app
reci
atio
n (in
crea
se in
dol
lar v
alue
of d
omes
tic c
urre
ncy)
, and
a =
sha
re o
f dom
estic
-cur
renc
y de
nom
inat
ed d
ebt i
n to
tal e
xter
nal d
ebt.
3/ F
or p
roje
ctio
n, li
ne in
clud
es th
e im
pact
of p
rice
and
exch
ange
rate
cha
nges
.4/
Def
ined
as
curr
ent a
ccou
nt d
efic
it, p
lus
amor
tizat
ion
on m
ediu
m-
and
long
-ter
m d
ebt,
plus
sho
rt-t
erm
deb
t at e
nd o
f pre
viou
s pe
riod.
5/
The
key
var
iabl
es in
clud
e re
al G
DP
grow
th; n
omin
al in
tere
st ra
te; d
olla
r def
lato
r gro
wth
; and
bot
h no
n-in
tere
st c
urre
nt a
ccou
nt a
nd n
on-d
ebt i
nflo
ws
in p
erce
nt o
f GD
P.
6/ L
ong-
run,
con
stan
t bal
ance
that
sta
biliz
es th
e de
bt ra
tio a
ssum
ing
that
key
var
iabl
es (r
eal G
DP
grow
th, n
omin
al in
tere
st ra
te, d
olla
r def
lato
r gro
wth
, and
non
-deb
t inf
low
s in
per
cent
of G
DP)
rem
ain
at th
eir
leve
ls o
f the
last
pro
ject
ion
year
.
Spai
n: E
xter
nal D
ebt
Sust
aina
bilit
y Fr
amew
ork,
200
9-20
19(In
per
cent
of G
DP,
unl
ess
othe
rwis
e in
dica
ted)
Act
ual
1/ D
eriv
ed a
s [r
- g
- r(
1+g)
+ e
a(1+
r)]/
(1+
g+r+
gr) t
imes
pre
viou
s pe
riod
debt
sto
ck, w
ith r
= n
omin
al e
ffec
tive
inte
rest
rate
on
exte
rnal
deb
t; r =
cha
nge
in d
omes
tic G
DP
defla
tor i
n U
S do
llar t
erm
s, g
= re
al G
DP
grow
th ra
te,
2/ T
he c
ontr
ibut
ion
from
pric
e an
d ex
chan
ge ra
te c
hang
es is
def
ined
as
[-r(
1+g)
+ e
a(1+
r)]/
(1+
g+r+
gr) t
imes
pre
viou
s pe
riod
debt
sto
ck. r
incr
ease
s w
ith a
n ap
prec
iatin
g do
mes
tic c
urre
ncy
(e >
0) a
nd ri
sing
in
flatio
n (b
ased
on
GD
P de
flato
r).
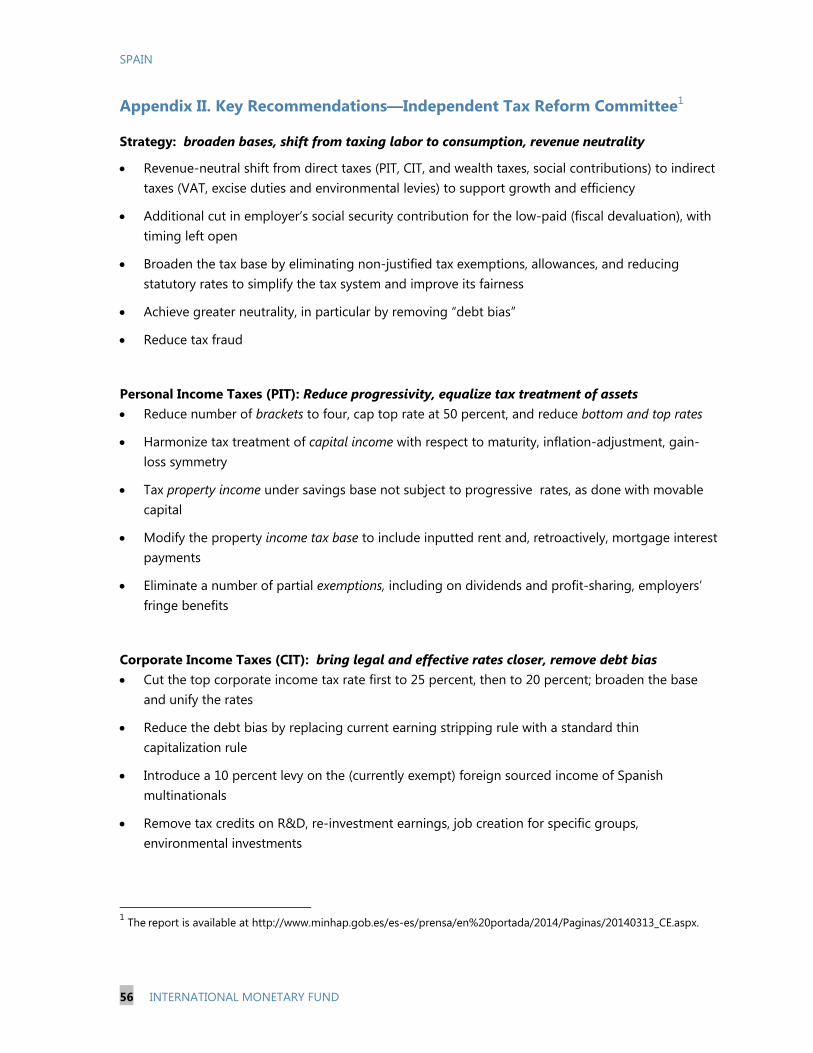
SPAIN
56 INTERNATIONAL MONETARY FUND
Appendix II. Key Recommendations—Independent Tax Reform Committee1
Strategy: broaden bases, shift from taxing labor to consumption, revenue neutrality
Revenue-neutral shift from direct taxes (PIT, CIT, and wealth taxes, social contributions) to indirect taxes (VAT, excise duties and environmental levies) to support growth and efficiency
Additional cut in employer’s social security contribution for the low-paid (fiscal devaluation), with timing left open
Broaden the tax base by eliminating non-justified tax exemptions, allowances, and reducing statutory rates to simplify the tax system and improve its fairness
Achieve greater neutrality, in particular by removing “debt bias”
Reduce tax fraud
Personal Income Taxes (PIT): Reduce progressivity, equalize tax treatment of assets Reduce number of brackets to four, cap top rate at 50 percent, and reduce bottom and top rates
Harmonize tax treatment of capital income with respect to maturity, inflation-adjustment, gain-loss symmetry
Tax property income under savings base not subject to progressive rates, as done with movable capital
Modify the property income tax base to include inputted rent and, retroactively, mortgage interest payments
Eliminate a number of partial exemptions, including on dividends and profit-sharing, employers’ fringe benefits
Corporate Income Taxes (CIT): bring legal and effective rates closer, remove debt bias Cut the top corporate income tax rate first to 25 percent, then to 20 percent; broaden the base
and unify the rates
Reduce the debt bias by replacing current earning stripping rule with a standard thin capitalization rule
Introduce a 10 percent levy on the (currently exempt) foreign sourced income of Spanish multinationals
Remove tax credits on R&D, re-investment earnings, job creation for specific groups, environmental investments
1 The report is available at http://www.minhap.gob.es/es-es/prensa/en%20portada/2014/Paginas/20140313_CE.aspx.
SPAIN
INTERNATIONAL MONETARY FUND 57
Social Security Contributions: modernize then cut Transform social security contributions into a payroll tax (harmonize labor income base under
PIT)…
…merge social security administration into general tax administration…
only then reduce employer social security contributions
Restrict rebates (wage subsidies) to vulnerable groups not reachable by active labor market policies
Property and wealth Taxes: simplify and streamline Eliminate wealth, transfer and stamp taxes
Reduce exemptions under the inheritance and gift tax
Value-Added Taxes (VAT): mobilize revenues by broadening base of standard rate Increase reduced rates to standard for all items except housing, transportation, and tourism
Increase tourism rates subject to fiscal devaluation; increase super-reduced rates subject to compensation for the poor.
Remove exemptions (e.g. postal services) not dependent on EC regulations.
Excise and Environmental Taxes: align with EU practices and directives Increase excises in alcohol and tobacco to EU averages
Split tax on hydrocarbons into taxes on energy and carbon emissions; increase rate on diesel towards gasoline first
Switch electricity tax from ad-valorem to specific (kilowatt-hours)
Eliminate environmental taxes imposed by regions
Tax Decentralization: harmonize and devolve Empower the Fiscal and Financial Policy Council to set common nationwide limits on devolved
taxes. Allow regions to establish co-payment schemes for public services under their remit.
Tax Fraud: reduce scope for abuse
Eliminate (simplified and beneficial) regimes (e.g. under VAT, PIT) for small taxpayers
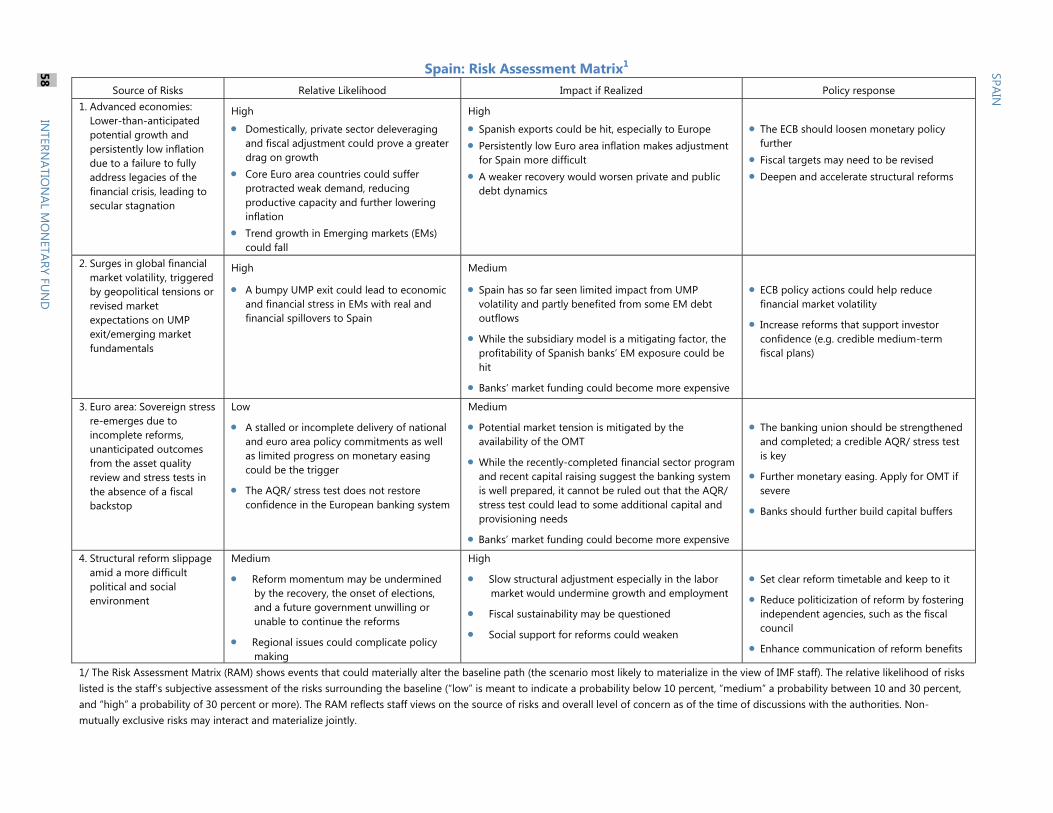
Spain: Risk Assessment Matrix1 Source of Risks Relative Likelihood Impact if Realized Policy response
1. Advanced economies: Lower-than-anticipated potential growth and persistently low inflation due to a failure to fully address legacies of the financial crisis, leading to secular stagnation
High
Domestically, private sector deleveraging and fiscal adjustment could prove a greater drag on growth
Core Euro area countries could suffer protracted weak demand, reducing productive capacity and further lowering inflation
Trend growth in Emerging markets (EMs) could fall
High
Spanish exports could be hit, especially to Europe Persistently low Euro area inflation makes adjustment
for Spain more difficult A weaker recovery would worsen private and public
debt dynamics
The ECB should loosen monetary policy further
Fiscal targets may need to be revised Deepen and accelerate structural reforms
2. Surges in global financial market volatility, triggered by geopolitical tensions or revised market expectations on UMP exit/emerging market fundamentals
High
A bumpy UMP exit could lead to economic and financial stress in EMs with real and financial spillovers to Spain
Medium
Spain has so far seen limited impact from UMP volatility and partly benefited from some EM debt outflows
While the subsidiary model is a mitigating factor, the profitability of Spanish banks’ EM exposure could be hit
Banks’ market funding could become more expensive
ECB policy actions could help reduce financial market volatility
Increase reforms that support investor confidence (e.g. credible medium-term fiscal plans)
3. Euro area: Sovereign stress re-emerges due to incomplete reforms, unanticipated outcomes from the asset quality review and stress tests in the absence of a fiscal backstop
Low
A stalled or incomplete delivery of national and euro area policy commitments as well as limited progress on monetary easing could be the trigger
The AQR/ stress test does not restore confidence in the European banking system
Medium
Potential market tension is mitigated by the availability of the OMT
While the recently-completed financial sector program and recent capital raising suggest the banking system is well prepared, it cannot be ruled out that the AQR/ stress test could lead to some additional capital and provisioning needs
Banks’ market funding could become more expensive
The banking union should be strengthened and completed; a credible AQR/ stress test is key
Further monetary easing. Apply for OMT if severe
Banks should further build capital buffers
4. Structural reform slippage amid a more difficult political and social environment
Medium
Reform momentum may be undermined by the recovery, the onset of elections, and a future government unwilling or unable to continue the reforms
Regional issues could complicate policy making
High
Slow structural adjustment especially in the labor market would undermine growth and employment
Fiscal sustainability may be questioned
Social support for reforms could weaken
Set clear reform timetable and keep to it
Reduce politicization of reform by fostering independent agencies, such as the fiscal council
Enhance communication of reform benefits
1/ The Risk Assessment Matrix (RAM) shows events that could materially alter the baseline path (the scenario most likely to materialize in the view of IMF staff). The relative likelihood of risks listed is the staff’s subjective assessment of the risks surrounding the baseline (“low” is meant to indicate a probability below 10 percent, “medium” a probability between 10 and 30 percent, and “high” a probability of 30 percent or more). The RAM reflects staff views on the source of risks and overall level of concern as of the time of discussions with the authorities. Non-mutually exclusive risks may interact and materialize jointly.
SPAIN
58 INTERN
ATION
AL MO
NETARY FU
ND
SPAIN
SPAIN STAFF REPORT FOR THE 2014 ARTICLE IV CONSULTATION—INFORMATIONAL ANNEX Prepared By
European Department (In Consultation with Other Departments)
FUND RELATIONS ________________________________________________________________________ 2
STATISTICAL ISSUES ______________________________________________________________________ 4
CONTENTS
June 20, 2014
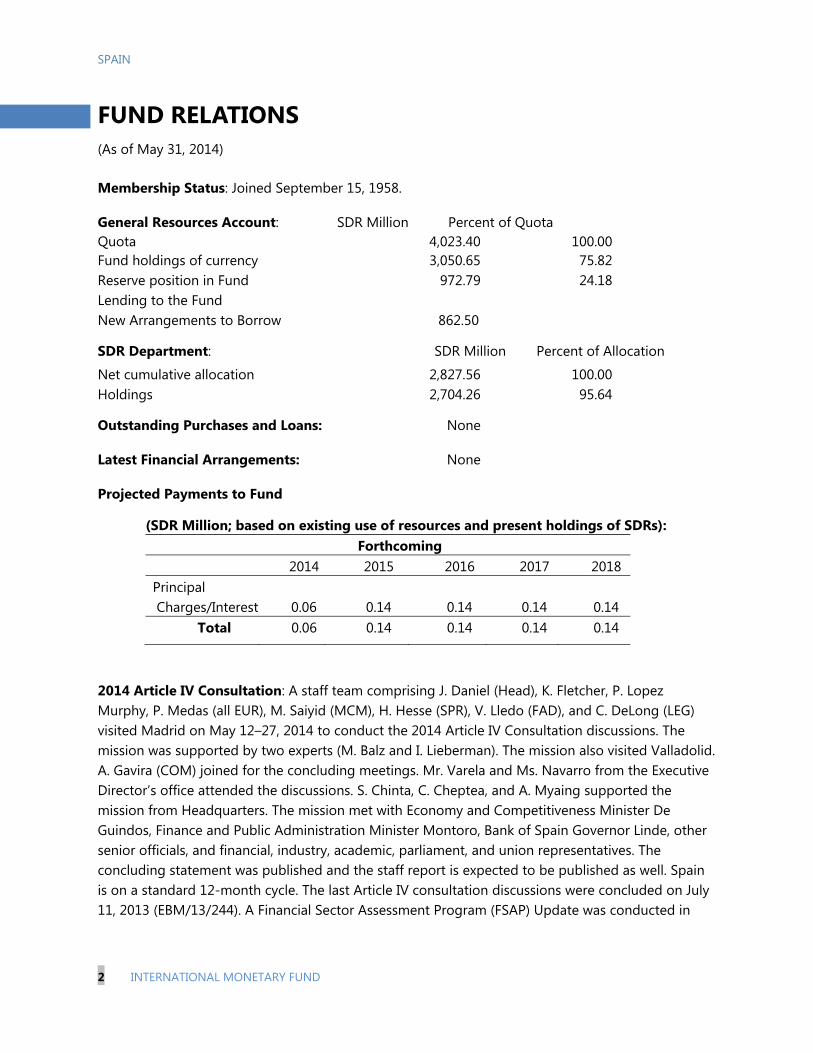
SPAIN
2 INTERNATIONAL MONETARY FUND
FUND RELATIONS(As of May 31, 2014)
Membership Status: Joined September 15, 1958.
General Resources Account: SDR Million Percent of Quota Quota 4,023.40 100.00 Fund holdings of currency 3,050.65 75.82 Reserve position in Fund 972.79 24.18 Lending to the Fund New Arrangements to Borrow 862.50
SDR Department: SDR Million Percent of Allocation
Net cumulative allocation 2,827.56 100.00 Holdings 2,704.26 95.64
Outstanding Purchases and Loans: None
Latest Financial Arrangements: None
Projected Payments to Fund
(SDR Million; based on existing use of resources and present holdings of SDRs): Forthcoming
2014 2015 2016 2017 2018 Principal Charges/Interest 0.06 0.14 0.14 0.14 0.14
Total 0.06 0.14 0.14 0.14 0.14
2014 Article IV Consultation: A staff team comprising J. Daniel (Head), K. Fletcher, P. Lopez Murphy, P. Medas (all EUR), M. Saiyid (MCM), H. Hesse (SPR), V. Lledo (FAD), and C. DeLong (LEG) visited Madrid on May 12–27, 2014 to conduct the 2014 Article IV Consultation discussions. The mission was supported by two experts (M. Balz and I. Lieberman). The mission also visited Valladolid. A. Gavira (COM) joined for the concluding meetings. Mr. Varela and Ms. Navarro from the Executive Director’s office attended the discussions. S. Chinta, C. Cheptea, and A. Myaing supported the mission from Headquarters. The mission met with Economy and Competitiveness Minister De Guindos, Finance and Public Administration Minister Montoro, Bank of Spain Governor Linde, other senior officials, and financial, industry, academic, parliament, and union representatives. The concluding statement was published and the staff report is expected to be published as well. Spain is on a standard 12-month cycle. The last Article IV consultation discussions were concluded on July 11, 2013 (EBM/13/244). A Financial Sector Assessment Program (FSAP) Update was conducted in
SPAIN
INTERNATIONAL MONETARY FUND 3
two missions (February 1–21 and April 12–25, 2012). On June 8, 2012, the FSAP discussions were concluded and the documents published.
Exchange Rate Arrangements and Restrictions: Spain’s currency is the euro, which floats freely and independently against other currencies. Spain has accepted the obligations of Article VIII, Sections 2, 3, and 4, and maintains an exchange rate system free of restrictions on payments and transfers for current international transactions, other than restrictions notified to the Fund under Decision No. 144 (52/51).
SPAIN
4 INTERNATIONAL MONETARY FUND
STATISTICAL ISSUES(As of June 4, 2014)
I. Assessment of Data Adequacy for Surveillance General: Data provision is adequate for surveillance.
II. Data Standards and Quality Subscriber to the Fund’s Special Data Dissemination Standard (SDDS) since September 1996.
No data ROSC available.
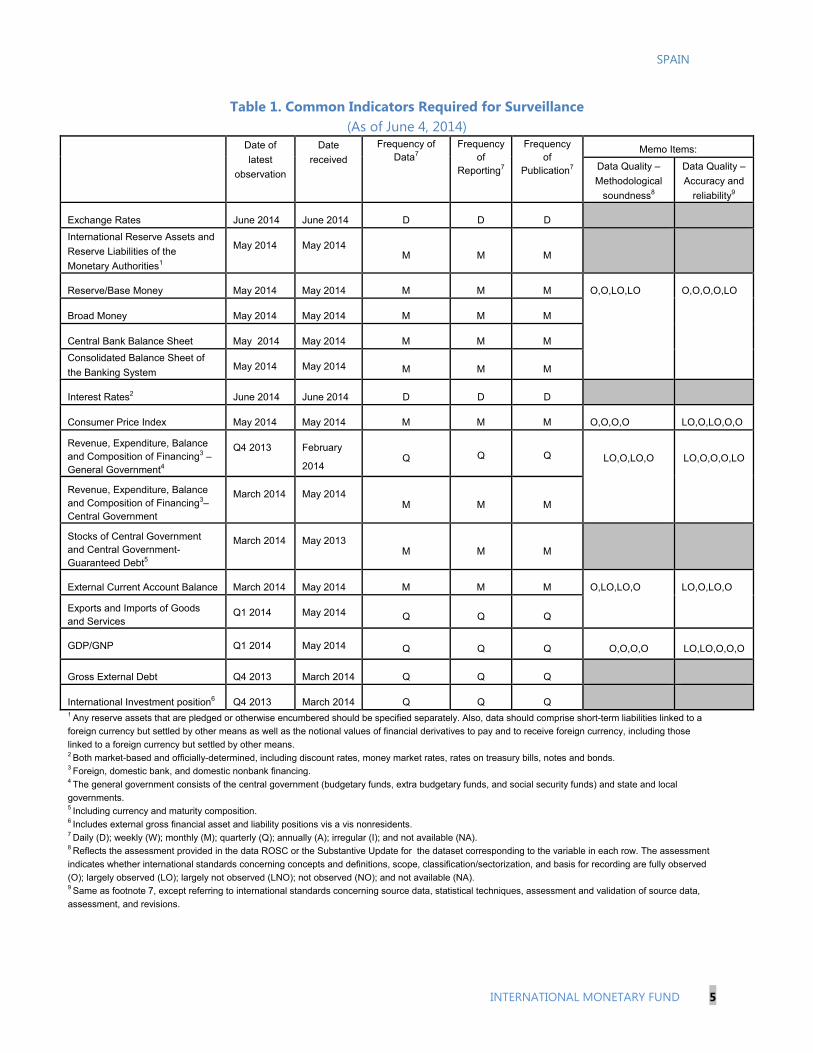
SPAIN
INTERNATIONAL MONETARY FUND 5
Table 1. Common Indicators Required for Surveillance (As of June 4, 2014)
Date of
latest
observation
Date
received
Frequency of Data7
Frequency of
Reporting7
Frequency of
Publication7
Memo Items:
Data Quality –
Methodological
soundness8
Data Quality –
Accuracy and
reliability9
Exchange Rates June 2014 June 2014 D D D
International Reserve Assets and
Reserve Liabilities of the
Monetary Authorities1
May 2014 May 2014 M M M
Reserve/Base Money May 2014 May 2014 M M M O,O,LO,LO O,O,O,O,LO
Broad Money May 2014 May 2014 M M M
Central Bank Balance Sheet May 2014 May 2014 M M M
Consolidated Balance Sheet of
the Banking System May 2014 May 2014 M M M
Interest Rates2 June 2014 June 2014 D D D
Consumer Price Index May 2014 May 2014 M M M O,O,O,O LO,O,LO,O,O
Revenue, Expenditure, Balance and Composition of Financing3 – General Government4
Q4 2013 February
2014 Q Q Q LO,O,LO,O LO,O,O,O,LO
Revenue, Expenditure, Balance and Composition of Financing3– Central Government
March 2014 May 2014 M M M
Stocks of Central Government and Central Government-Guaranteed Debt5
March 2014 May 2013 M M M
External Current Account Balance March 2014 May 2014 M M M O,LO,LO,O LO,O,LO,O
Exports and Imports of Goods and Services
Q1 2014 May 2014 Q Q Q
GDP/GNP Q1 2014 May 2014 Q Q Q O,O,O,O LO,LO,O,O,O
Gross External Debt Q4 2013 March 2014 Q Q Q
International Investment position6 Q4 2013 March 2014 Q Q Q 1 Any reserve assets that are pledged or otherwise encumbered should be specified separately. Also, data should comprise short-term liabilities linked to a
foreign currency but settled by other means as well as the notional values of financial derivatives to pay and to receive foreign currency, including those
linked to a foreign currency but settled by other means. 2 Both market-based and officially-determined, including discount rates, money market rates, rates on treasury bills, notes and bonds. 3 Foreign, domestic bank, and domestic nonbank financing. 4 The general government consists of the central government (budgetary funds, extra budgetary funds, and social security funds) and state and local
governments. 5 Including currency and maturity composition. 6 Includes external gross financial asset and liability positions vis a vis nonresidents.
7 Daily (D); weekly (W); monthly (M); quarterly (Q); annually (A); irregular (I); and not available (NA). 8 Reflects the assessment provided in the data ROSC or the Substantive Update for the dataset corresponding to the variable in each row. The assessment
indicates whether international standards concerning concepts and definitions, scope, classification/sectorization, and basis for recording are fully observed
(O); largely observed (LO); largely not observed (LNO); not observed (NO); and not available (NA). 9 Same as footnote 7, except referring to international standards concerning source data, statistical techniques, assessment and validation of source data,
assessment, and revisions.
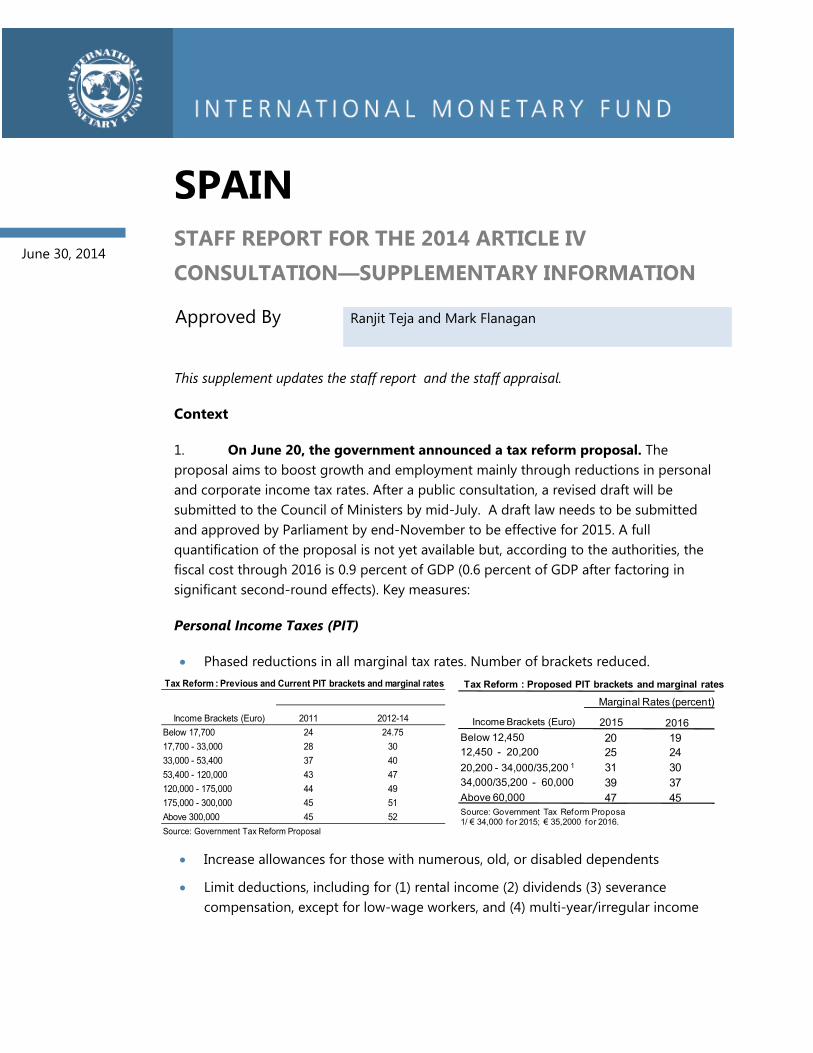
SPAIN STAFF REPORT FOR THE 2014 ARTICLE IV CONSULTATION—SUPPLEMENTARY INFORMATION Approved By
Ranjit Teja and Mark Flanagan
This supplement updates the staff report and the staff appraisal.
Context
1. On June 20, the government announced a tax reform proposal. The proposal aims to boost growth and employment mainly through reductions in personal and corporate income tax rates. After a public consultation, a revised draft will be submitted to the Council of Ministers by mid-July. A draft law needs to be submitted and approved by Parliament by end-November to be effective for 2015. A full quantification of the proposal is not yet available but, according to the authorities, the fiscal cost through 2016 is 0.9 percent of GDP (0.6 percent of GDP after factoring in significant second-round effects). Key measures:
Personal Income Taxes (PIT)
Phased reductions in all marginal tax rates. Number of brackets reduced.
Increase allowances for those with numerous, old, or disabled dependents
Limit deductions, including for (1) rental income (2) dividends (3) severance compensation, except for low-wage workers, and (4) multi-year/irregular income
June 30, 2014
2011 2012-14
Below 17,700 24 24.75
17,700 - 33,000 28 30
33,000 - 53,400 37 40
53,400 - 120,000 43 47
120,000 - 175,000 44 49
175,000 - 300,000 45 51
Above 300,000 45 52
Source: Government Tax Reform Proposal
Income Brackets (Euro)
Tax Reform : Previous and Current PIT brackets and marginal rates
2015 2016Below 12,450 20 1912,450 - 20,200 25 2420,200 - 34,000/35,200 1 31 3034,000/35,200 - 60,000 39 37Above 60,000 47 45Source: Government Tax Reform Proposa1/ € 34,000 for 2015; € 35,2000 for 2016.
Tax Reform : Proposed PIT brackets and marginal rates
Income Brackets (Euro)
Marginal Rates (percent)
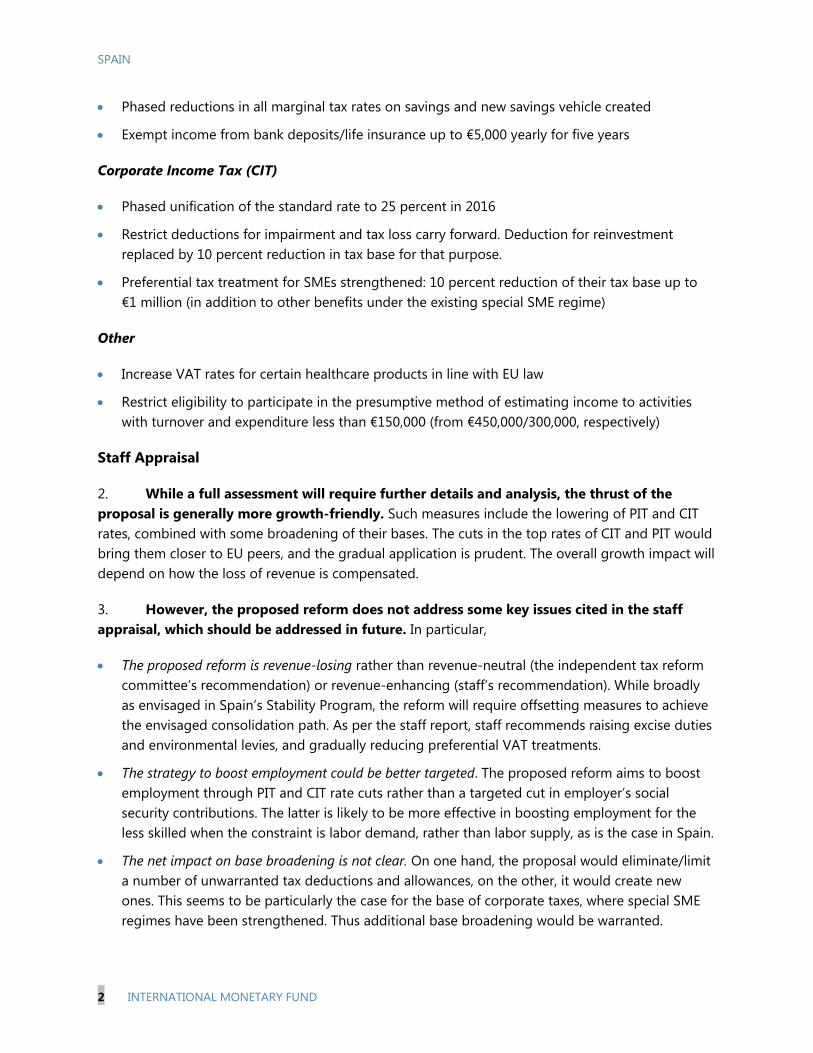
SPAIN
2 INTERNATIONAL MONETARY FUND
Phased reductions in all marginal tax rates on savings and new savings vehicle created
Exempt income from bank deposits/life insurance up to €5,000 yearly for five years
Corporate Income Tax (CIT)
Phased unification of the standard rate to 25 percent in 2016
Restrict deductions for impairment and tax loss carry forward. Deduction for reinvestment replaced by 10 percent reduction in tax base for that purpose.
Preferential tax treatment for SMEs strengthened: 10 percent reduction of their tax base up to €1 million (in addition to other benefits under the existing special SME regime)
Other
Increase VAT rates for certain healthcare products in line with EU law
Restrict eligibility to participate in the presumptive method of estimating income to activities with turnover and expenditure less than €150,000 (from €450,000/300,000, respectively)
Staff Appraisal
2. While a full assessment will require further details and analysis, the thrust of the proposal is generally more growth-friendly. Such measures include the lowering of PIT and CIT rates, combined with some broadening of their bases. The cuts in the top rates of CIT and PIT would bring them closer to EU peers, and the gradual application is prudent. The overall growth impact will depend on how the loss of revenue is compensated.
3. However, the proposed reform does not address some key issues cited in the staff appraisal, which should be addressed in future. In particular,
The proposed reform is revenue-losing rather than revenue-neutral (the independent tax reform committee’s recommendation) or revenue-enhancing (staff’s recommendation). While broadly as envisaged in Spain’s Stability Program, the reform will require offsetting measures to achieve the envisaged consolidation path. As per the staff report, staff recommends raising excise duties and environmental levies, and gradually reducing preferential VAT treatments.
The strategy to boost employment could be better targeted. The proposed reform aims to boost employment through PIT and CIT rate cuts rather than a targeted cut in employer’s social security contributions. The latter is likely to be more effective in boosting employment for the less skilled when the constraint is labor demand, rather than labor supply, as is the case in Spain.
The net impact on base broadening is not clear. On one hand, the proposal would eliminate/limit a number of unwarranted tax deductions and allowances, on the other, it would create new ones. This seems to be particularly the case for the base of corporate taxes, where special SME regimes have been strengthened. Thus additional base broadening would be warranted.
Press Release No. 14/336
FOR IMMEDIATE RELEASE
July, 10, 2014
IMF Executive Board Concludes 2014 Article IV Consultation with Spain
On July 7, 2014, the Executive Board of the International Monetary Fund (IMF) concluded the
2014 Article IV consultation1 with Spain.
After a protracted double-dip recession, Spain has turned the corner. Growth has resumed, and
unemployment is falling. Exporters are gaining market share and the current account is in surplus
for the first time in decades. Financial conditions have improved sharply, with sovereign yields
at record lows. Business investment is rebounding strongly and private consumption has also
started to recover due to improved employment prospects and rising confidence.
But the legacy of the crisis persists. Unemployment, at 26 percent, remains unacceptably high,
with the majority of the unemployed without a job for at least a year. The labor market remains
highly fragmented with a large share of workers dependent on temporary and involuntarily part-
time jobs. Livings standards have fallen, trend productivity growth is low, and the deleveraging
of high debt burdens—public and private—is weighing on growth.
The outlook has improved significantly compared to last year’s consultation. Several factors are
helping the recovery, including much stronger euro area financial market conditions and
confidence; improving labor market trends, helped by the 2012 labor reform; and business
investment rebounding, driven by robust exports. The contribution to growth from net exports
will likely be more subdued in the near term due to an increase in imports (reflecting the stronger
domestic demand), but, over time, continued reform efforts should further improve the
contribution from net exports.
The reform agenda is progressing on several fronts, which is critical for a strong, long-lasting
and job-rich recovery. Fiscal reforms have continued (e.g. pension reform and establishing the
1 Under Article IV of the IMF's Articles of Agreement, the IMF holds bilateral discussions with members, usually
every year. A staff team visits the country, collects economic and financial information, and discusses with officials
the country's economic developments and policies. On return to headquarters, the staff prepares a report, which
forms the basis for discussion by the Executive Board.
International Monetary Fund
700 19th
Street, NW
Washington, D. C. 20431 USA
2
fiscal council) and a tax reform has been announced. The financial sector reform program was
successfully completed, helping make the system stronger, safer and better able to support the
recovery. There is a concerted effort aimed at reducing barriers to trade across Spain’s different
regions, with the Law on Market Unity as the cornerstone. The government also plans to further
liberalize professional services, and to push ahead with implementation of new active
employment policies and the electricity reform. Measures were introduced to facilitate corporate
debt restructuring, including by facilitating out-of-court debt restructuring for viable firms under
financial stress, and additional measures in this area have recently been announced. European
policies have also been supportive, including, monetary easing, progress on banking union, and
flexibility on fiscal targets.
Executive Board Assessment2
Executive Directors welcomed the improving Spanish economy, thanks to strong policy actions
by the authorities and policies at the European level. However, the legacy of the crisis persists, as
unemployment remains high and public and private debt levels are elevated. Directors stressed
that continued decisive policy action, with support from European partners, will be critical to
ensure a sustainable, strong, and job-rich growth.
Directors welcomed the recent measures to improve the corporate debt restructuring process.
They encouraged the authorities to make further efforts to reduce the private sector’s debt
overhang, especially for small and medium-sized enterprises. Directors generally encouraged
consideration of a personal insolvency framework that allows an eventual fresh start while
preserving the payment culture.
Directors welcomed the positive signs in the labor market, which reflect the 2012 labor reform
and recent wage moderation. However, noting that high unemployment remains a pressing
challenge, they encouraged additional reforms aimed at improving the skills of the unemployed,
further decentralizing wage setting mechanisms, and reducing labor market duality between
temporary and permanent contracts. Directors also highlighted that additional steps toward
flexible wage setting at the firm and sector level would make the labor market more inclusive
and responsive to economic conditions.
Directors stressed that labor market reform should be accompanied by product and service
market liberalization to maximize the gains to growth and jobs. These include implementing the
ambitious efforts to reduce barriers to business across Spain’s regions, such as the Market Unity
Law, and to open up professional services. Directors underscored the need to continue the
2 At the conclusion of the discussion, the Managing Director, as Chairman of the Board, summarizes the views of
Executive Directors, and this summary is transmitted to the country's authorities. An explanation of any qualifiers
used in summings up can be found here: http://www.imf.org/external/np/sec/misc/qualifiers.htm.
3
aggressive reform agenda in order to continue achieving productivity gains and reduce Spain’s
external vulnerabilities.
Directors welcomed the authorities’ commitment to fiscal consolidation. The envisaged steady
and growth-friendly consolidation path strikes the right balance between protecting growth in the
short term and putting debt on a declining trend. Given the large adjustment still needed over the
medium term and Spain’s relatively low revenue and spending ratios, Directors recommended
further improvements to spending efficiency, and enhancing the proposed tax reform to boost
employment through cuts in social security contributions and increasing indirect tax revenue
while protecting the most vulnerable.
Directors commended the authorities for the successfully-completed ESM-supported financial
sector program, which helped make the financial system stronger, safer, and better able to
support the recovery. Continued progress in raising capital levels over time, including by
limiting cash dividends and bonuses, would further strengthen the system and foster credit.
Directors considered that stronger policies by European partners to help lower borrowing costs in
Spain would support the recovery in both the euro area and in Spain.
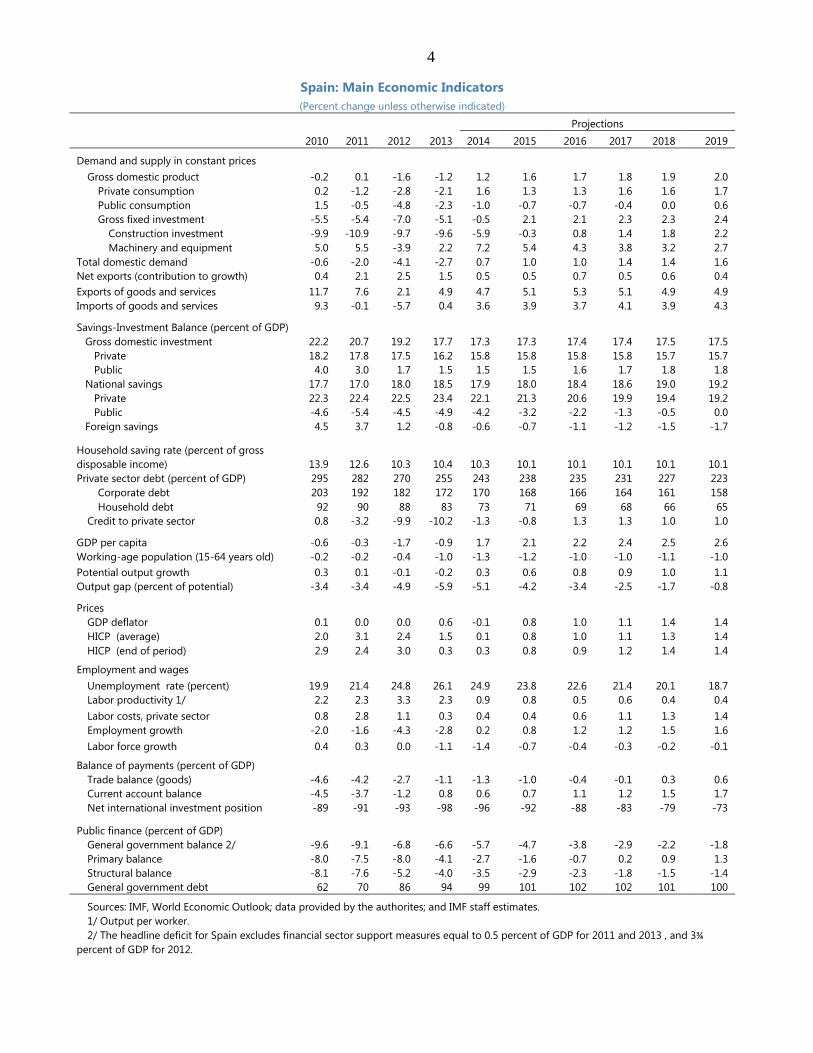
4
Spain: Main Economic Indicators
(Percent change unless otherwise indicated)
Projections
2010 2011 2012 2013 2014 2015 2016 2017 2018 2019
Demand and supply in constant prices
Gross domestic product -0.2 0.1 -1.6 -1.2 1.2 1.6 1.7 1.8 1.9 2.0
Private consumption 0.2 -1.2 -2.8 -2.1 1.6 1.3 1.3 1.6 1.6 1.7
Public consumption 1.5 -0.5 -4.8 -2.3 -1.0 -0.7 -0.7 -0.4 0.0 0.6
Gross fixed investment -5.5 -5.4 -7.0 -5.1 -0.5 2.1 2.1 2.3 2.3 2.4
Construction investment -9.9 -10.9 -9.7 -9.6 -5.9 -0.3 0.8 1.4 1.8 2.2
Machinery and equipment 5.0 5.5 -3.9 2.2 7.2 5.4 4.3 3.8 3.2 2.7
Total domestic demand -0.6 -2.0 -4.1 -2.7 0.7 1.0 1.0 1.4 1.4 1.6
Net exports (contribution to growth) 0.4 2.1 2.5 1.5 0.5 0.5 0.7 0.5 0.6 0.4
Exports of goods and services 11.7 7.6 2.1 4.9 4.7 5.1 5.3 5.1 4.9 4.9
Imports of goods and services 9.3 -0.1 -5.7 0.4 3.6 3.9 3.7 4.1 3.9 4.3
Savings-Investment Balance (percent of GDP)
Gross domestic investment 22.2 20.7 19.2 17.7 17.3 17.3 17.4 17.4 17.5 17.5
Private 18.2 17.8 17.5 16.2 15.8 15.8 15.8 15.8 15.7 15.7
Public 4.0 3.0 1.7 1.5 1.5 1.5 1.6 1.7 1.8 1.8
National savings 17.7 17.0 18.0 18.5 17.9 18.0 18.4 18.6 19.0 19.2
Private 22.3 22.4 22.5 23.4 22.1 21.3 20.6 19.9 19.4 19.2
Public -4.6 -5.4 -4.5 -4.9 -4.2 -3.2 -2.2 -1.3 -0.5 0.0
Foreign savings 4.5 3.7 1.2 -0.8 -0.6 -0.7 -1.1 -1.2 -1.5 -1.7
Household saving rate (percent of gross
disposable income) 13.9 12.6 10.3 10.4 10.3 10.1 10.1 10.1 10.1 10.1
Private sector debt (percent of GDP) 295 282 270 255 243 238 235 231 227 223
Corporate debt 203 192 182 172 170 168 166 164 161 158
Household debt 92 90 88 83 73 71 69 68 66 65
Credit to private sector 0.8 -3.2 -9.9 -10.2 -1.3 -0.8 1.3 1.3 1.0 1.0
GDP per capita -0.6 -0.3 -1.7 -0.9 1.7 2.1 2.2 2.4 2.5 2.6
Working-age population (15-64 years old) -0.2 -0.2 -0.4 -1.0 -1.3 -1.2 -1.0 -1.0 -1.1 -1.0
Potential output growth 0.3 0.1 -0.1 -0.2 0.3 0.6 0.8 0.9 1.0 1.1
Output gap (percent of potential) -3.4 -3.4 -4.9 -5.9 -5.1 -4.2 -3.4 -2.5 -1.7 -0.8
Prices
GDP deflator 0.1 0.0 0.0 0.6 -0.1 0.8 1.0 1.1 1.4 1.4
HICP (average) 2.0 3.1 2.4 1.5 0.1 0.8 1.0 1.1 1.3 1.4
HICP (end of period) 2.9 2.4 3.0 0.3 0.3 0.8 0.9 1.2 1.4 1.4
Employment and wages
Unemployment rate (percent) 19.9 21.4 24.8 26.1 24.9 23.8 22.6 21.4 20.1 18.7
Labor productivity 1/ 2.2 2.3 3.3 2.3 0.9 0.8 0.5 0.6 0.4 0.4
Labor costs, private sector 0.8 2.8 1.1 0.3 0.4 0.4 0.6 1.1 1.3 1.4
Employment growth -2.0 -1.6 -4.3 -2.8 0.2 0.8 1.2 1.2 1.5 1.6
Labor force growth 0.4 0.3 0.0 -1.1 -1.4 -0.7 -0.4 -0.3 -0.2 -0.1
Balance of payments (percent of GDP)
Trade balance (goods) -4.6 -4.2 -2.7 -1.1 -1.3 -1.0 -0.4 -0.1 0.3 0.6
Current account balance -4.5 -3.7 -1.2 0.8 0.6 0.7 1.1 1.2 1.5 1.7
Net international investment position -89 -91 -93 -98 -96 -92 -88 -83 -79 -73
Public finance (percent of GDP)
General government balance 2/ -9.6 -9.1 -6.8 -6.6 -5.7 -4.7 -3.8 -2.9 -2.2 -1.8
Primary balance -8.0 -7.5 -8.0 -4.1 -2.7 -1.6 -0.7 0.2 0.9 1.3
Structural balance -8.1 -7.6 -5.2 -4.0 -3.5 -2.9 -2.3 -1.8 -1.5 -1.4
General government debt 62 70 86 94 99 101 102 102 101 100
Sources: IMF, World Economic Outlook; data provided by the authorites; and IMF staff estimates.
1/ Output per worker.
2/ The headline deficit for Spain excludes financial sector support measures equal to 0.5 percent of GDP for 2011 and 2013 , and 3¾
percent of GDP for 2012.
Statement by Mr. Varela, Alternate Executive Director for Spain, Ms. Garrido, Government-Provided Advisor, and Ms. Navarro, Advisor to the
Executive Director July 7, 2014
Thanks to the efforts of the Spanish people, the decisive policy actions by the Government and the improvement in market conditions and policies at the EU level, the Spanish economy has made a clear turn around entering into an expansionary phase since last year’s Article IV Consultations. After three quarters of growth, the recovery is gathering momentum and the significant correction of major imbalances continues. Building on the progress achieved so far, the overarching objective now is to cement the recovery making it as strong and sustainable as possible and to reduce the still too high unemployment rate. The authorities are well aware that the demanding task ahead leaves no room for complacency and remain firmly committed to maintaining the reform drive to ensure a sustainable job-rich growth for the Spanish economy. We thank staff for the intensive and candid dialogue during the thorough mission held in Spain and the balanced report and SIPs that contain many constructive and useful recommendations, which are in line with the authorities’ goals. The authorities broadly agree with the overall strategy to address the current challenges. Recent developments and outlook The recovery started in the second half of 2013 and now is gaining strength driven by an improvement in confidence, better labor market performance and more conducive financial conditions. Both government and staff are forecasting a 1.2 percent growth rate in 2014, amply surpassing the expectations of a year ago (0.5 percent by the Spanish authorities, 0.0 by IMF staff). Going forward, growth is expected to gradually pick up. For 2015, the authorities estimate a 1.8 percent GDP increase in 2015, only slightly higher than staff’s 1.6 percent.
In Q1 2014, GDP accelerated to 0.4 percent qoq (0.5 yoy, 1.5 annualized) from 0.2 in Q4 2013, linking three quarters of positive growth, due to a substantial increase of domestic demand caused by a rise of private consumption and a strong expansion of equipment investment. Even with the modest growth rates experienced so far, labor markets are starting to improve responding to the reforms introduced in 2012 and the recovery of activity. The seasonally adjusted unemployment recorded in March 2014 its largest decrease since Q3 2005, dropping 1 percent yoy, with a reduction of 354,000 people. Still, total unemployment rate continues to be unacceptably high at 25.3 percent.
2
Inflation reached a minimum in March 2014, as the HIPC annual rate hit -0.2, but it has since returned to moderate positive values. In June, it stood at 0.1 (0.5 percent in the euro area average). In this context, wages and labor costs continue moderate while productivity goes on increasing, albeit at a more subdued rate than in recent years. Both trends will likely persist in light of the restructuring of factors of production, the existence of idle capacity and resources, as well as changes in incentives thanks to recent deep structural reforms, thus leading to a further decline in Unit Labor Costs and improved competitiveness. Market sentiment has significantly improved, reflecting an increased confidence in the Spanish economy and improved euro area outlook. Risk premia have remarkably declined, with spreads dropping to pre-crisis levels. Also, foreign direct investment has increased by 52 percent in 2013, for a total of almost 40 billion US dollars, making Spain the ninth recipient country of FDI in the world and the first in Europe. The current account adjustment has been remarkable from a peak of 10 percent deficit in 2007 to a 0.8 surplus in 2013, with exports gaining quota share and tourism hitting new records. It is expected that this trend will continue, albeit at a moderate rate due to the gradual strengthening of domestic demand, while the net IIP, which was affected by negative valuation effects despite the current account surplus, enters into a declining path this year. On medium-term growth prospects, the authorities agree with staff’s assessment of risks and the main headwinds affecting recovery. However they have more confidence on the effects of both far-reaching structural reforms already implemented and current macroeconomic policies. Furthermore, there is a significant amount of underutilized resources in the Spanish economy that give potential for sustained growth, as they are gradually reallocated to new sectors. Monetary conditions in the euro area will be important to make progress on internal devaluation deleveraging and improving financial conditions. The steps taken by the ECB go undoubtedly in the right direction. Fiscal policy The substantial efforts taken to improve public finances have continued. The deficit of the General Government was reduced from 10.6 to 7.1 percent of GDP in 2013 (6.6 percent of GDP, net of the one-off financial support for the recapitalization of banks). The primary deficit was reduced from 8.0 to 4.1 percent of GDP. Against the backdrop of a severe recession, the structural effort has been remarkable, 1.2 percent of GDP according to staff, while the structural primary balance was positive for the first time since 2007 with a surplus of 1.4 percent of GDP. This adds to the substantial efforts in 2012 when Spain recorded the second highest structural effort among advanced economies.
3
Far-reaching fiscal-structural reforms have also been implemented since 2012 to contribute to a lasting improvement of public finances. The fiscal framework has been strengthened. An independent fiscal institution (AIReF) has been created and the last steps to make it fully operational are being completed. Commercial arrears to public sector suppliers have been addressed and cleared. Mechanisms to prevent and combat tax fraud have been significantly enhanced. A comprehensive review of expenditure bases at the Central Government level has been undertaken to streamline and increase efficiency (CORA), while Regions and Local governments can adhere to these efforts. This has been complemented with significant reforms in public administration, healthcare, education and local administration, all resulting in significant structural savings. The authorities remain firmly committed to fiscal consolidation. In view of the significant deficit reduction targeted for 2015 and to further ensure the credibility of the adjustment, the deficit reduction in 2014 has been accelerated to 5.5 percent of GDP (instead of the previous 5.8 percent). Over the medium term, fiscal consolidation will further advance in line with EU arrangements. The fiscal strategy set up in the Stability Program aims at bringing down the fiscal deficit below 3 percent of GDP in 2016 and reaching the medium-term objective (MTO) of a balanced budgetary position in structural terms in 2017, which is more stringent than required by the Stability and Growth Pact. The fiscal consolidation plan has been designed to minimize the drag on growth and facilitate job creation, while also focusing on the protection of vulnerable groups. On the expenditure side, priority will continue to be given to expenditure restraint, focusing especially on the resizing of public administration and other current expenditures to pay due attention to the composition of the adjustment. It must also be noted that a wide range of reforms adopted during the last two years have entailed a comprehensive review of many expenditure items (pensions, healthcare, public administration, local administration, etc.) and will continue creating savings. Special attention will continue to be paid to boosting public expenditure efficiency. In this regard, a revision of public expenditures at the regional level has been recently initiated to rationalise and increase efficiency. Important steps have also been taken to reduce contingent liabilities and the electricity tariff deficit has been addressed and (as of 2014) eliminated. As staff recognizes, the December 2013 pension reform has been an important milestone for underpinning the sustainability of the pension system. According to the latest projections, public pension expenditure is expected to decline from 10 percent of GDP in 2010 (which is below the EU average) to 9.6 percent in 2060 (EU average estimated at 12.9 percent of GDP), compared with a projected 13.7 percent of GDP in 2060 before the reform.
4
On the revenue side, progress has been made in the last years in the rebalancing of direct and indirect taxation in the direction of a fiscal devaluation. In 2010 and 2012, indirect taxation was significantly strengthened. The 2012 reform in VAT was implemented to increase the standard and reduced rates broadening the tax base and reducing goods subject to preferential treatment. New environmental taxes were introduced and some excise taxes increased. Reductions in social security contributions have also been introduced in 2013 and 2014, including through the temporary €100 flat rate contribution. A substantial tax reform is currently under preparation and is envisaged to be in effect in 2015. Following the report for tax reform commissioned to a Committee of Experts, the planned reform on direct taxes was unveiled on June 20, 2014 aiming at boosting economic activity, corporate competitiveness and job creation. The reform envisages, among other changes, gradual reductions in rates and a broadening of the bases for Personal Income Tax and Corporate Income Tax and further strengthening tools to fight against fraud, which is warranted to increase the revenue-GDP ratio. The planned reform also included some increases in VAT rates in line with EU legislation. The fiscal effects of the reform were already incorporated into the Stability Program, so no significant additional fiscal costs can be expected. The authorities also envisage additional reforms to certain indirect and environmental taxation in the near term. Financial sector and credit The financial sector program was successfully completed in January 2014. Thanks to extensive reforms and policy actions, with the support of the Euro Area partners, capital, liquidity and efficiency levels of the financial system have been bolstered and the framework of governance, regulation and supervision has been enhanced. The financial sector now has also a more efficient size and structure after undergoing a remarkable downsizing. After the recapitalisation of parts of the banking sector, a deep cleaning up of troubled assets compounded with very demanding provisioning requirements and an accurate classification of refinanced/restructured loans, balance sheets are now sounder. Banks’ solvency position remains comfortable, with Core Tier 1 ratio reaching 11.8 percent at the end of 2013. The quality of instruments composing the capital of most banks has also improved with Tier 2 and additional Tier 1 capital instruments decreasing. The forward-looking evaluation of the solvency of Spanish Banks conducted in November 2013 by the Bank of Spain in application of a new supervisory tool confirmed the fairly comfortable solvency position of banks at an aggregated level under different macroeconomic scenarios considered. Profitability has also improved. The Spanish banks recorded positive results in 2013 (more than €11 bn in profits), not only as a result of lower provisioning needs after the extraordinary efforts made in 2012 to meet the additional requirements imposed, but also
5
due to the efficiency gains achieved (operating costs are now 24 percent the pre-crisis levels) and earnings resilience resulting from banks’ geographically diversified business models. While credit to the private sector has been falling steadily since the onset of the crisis, a change in this trend is now being seen. Recent data shows that the contraction of credit to the private sector is decelerating and the flow of new credit has been growing yoy both for SMEs and households for eight and five months, respectively. However, credit recovery remains a challenge, in particular for SMEs. Against this backdrop, measures have been taken to facilitate SMEs access to finance including the development of non-banking financing alternatives. MARF, the alternative bond market for SMEs, is now operational. The volume of ICO´s (State Finance Agency) lending program for SMEs has substantially increased. A comprehensive package is currently in the pipeline with additional measures to further ease financing to SMEs and non-financial corporations. Ongoing progress in addressing financial fragmentation in the euro area will also be helpful. Mindful of the remaining challenges, the authorities have continued promoting measures to cement and further improve the resilience of the banking sector. Recent actions by Bank of Spain are noteworthy, notably its guidance to ensure the reclassification of doubtful credit under uniform criteria, the recommendation of a conservative dividend policy to foster capital increases, and a new supervisory tool to assess the sensitivity of Spanish banks’ solvency to shocks. These achievements and progress, together with the improved the economic outlook in Spain and the euro area, have been acknowledged by markets, as shown by the reduction of systemic risk indicators for Spain and in the gross recourse to the Eurosystem by Spanish banks, as well as by the high and rising Spanish banks’ price-to-book values compared to that of European peers. The authorities are thus confident that the Spanish financial system is well prepared for the ECB’s comprehensive assessment and to contribute to a strong economic recovery. Corporate and personal debt management Aware of the need to continue the deleveraging process of corporate and households, the authorities have been adopting measures to facilitate it while preserving financial stability and growth. Recent data confirms that private deleveraging is progressing at a good pace. According to the ECB, corporate and household debt in Spain dropped 4.6 and 4.4 percentage points respectively from 2012 Q4 to 2013 Q4. In both cases, it has been the largest decline among the five largest European economies.
6
Following significant steps taken to reinforce the personal insolvency framework in 2013, the Government approved and implemented in 2014 a set of major changes enhancing corporate debt restructuring and insolvency frameworks. A Royal Decree Law approved in March 2014 introduced new tools to foster the restructuring process, including new types of in and out-of-court refinancing agreements and debt for equity swaps that can be used by any type of companies, including SMEs. The law on entrepreneurship of September 2013 also included specific measures to facilitate out-of-court insolvency agreements and promote a second chance. Further to that, the authorities—in line with staff recommendations during the mission—have decided to further reinforce the corporate debt restructuring framework. The main steps, recently announced, include a rebalancing of the in-court debt restructuring process, fostering liquidation as a going concern, expanding restructuring options for SMEs, setting up a Code of Good Practices for SMEs and self-employed and creating an inter-ministerial commission to monitor debt restructuring processes and to foster institutional coordination. Once these measures are in place, it is expected that the remaining specific recommendations mentioned in the staff report, both for large firms and SMEs, will also be addressed. Regarding a deeper involvement of public creditors in the debt restructuring process and the establishment of a new personal insolvency framework that provides for a full discharge of debts, the authorities have different views from staff on the scope and timing to implement them. They think more study is warranted on the fiscal and financial impact of those measures and on the strong payment culture that prevails in Spain (with household NPL at relatively low levels), in a context where NPLs are starting to contract and the recovery is still at an early stage. Structural reforms The labor market reform is proving successful so far. Labor market flexibility has substantially increased, allowing firms to better adapt wages and labor conditions to their real needs, wages are moderating and, importantly, the reform has substantially reduced the job-creating GDP growth threshold. In an unprecedented development, even with growth rates under 1 percent, employment is now being created. The authorities remain vigilant and ready to take additional measures, if needed, but believe that the reform will continue to unfold to its full potential as past practices are transformed and inertia is overcome. The authorities also consider that the current context calls for decisive action on activation policies. In this vein, a new Activation for Employment Strategy 2014–16 has been recently launched in close coordination with the Youth Guarantee Implementation
7
Plan. This new strategy will include a common framework with the regions (given that execution and management is carried out at the regional level) setting common priorities, evaluations and monitoring of policies in a result-oriented manner. Other measures include a deep reform of the vocational training system, close coordination with private job placement agencies, and the creation of a Single Portal with all job vacancies at the national level. These measures are fully in line with staff’s recommendations. The labor reform has significantly contributed to reduce duality and, at the same time, has had a positive impact on increasing permanent contracts, as recognized by the OCDE. Since 2007 to 2013 temporary employment has dropped from 31.5 percent to 23.1 percent, an 8.4 percent less. Concerning social security contributions, reductions were introduced in 2013 for hiring young people and a temporary €100 flat rate contribution has been created in 2014 for new permanent contracts to support employment. As noted before, these measures go in the same direction as the fiscal devaluation suggestions made by staff. The later will imply savings of 75 percent in the tax wedge for firms and it will help creating more jobs, also among low-skilled workers. The Corporate Income Tax cuts contemplated in the tax reform will also help fostering investment and creating employment across the board. The authorities have continued advancing with the implementation of their ambitious product and services structural reform agenda to foster long-term growth and competitiveness. A great number of critical measures have been adopted to enhance competition, increase productivity, improve the business environment and remove barriers to the growth of firms, in line with staff’s recommendations. The law on the guarantee of market unity adopted in December 2013 is a major effort to improve the business environment and reduce administrative burdens. This reform tackles the fragmentation of the domestic market arising from different layers of regulation in more than 30 sectors and is expected to have significant impact on productivity and growth. The new framework also creates an open-ended process to address possible regulatory barriers that could emerge going forward. A “regional doing business indicator” prepared in collaboration with the World Bank will help monitoring and promoting good regulation across regions. Measures have also been put in place under the law on entrepreneurship of September 2013 to reduce the cost and time of creation of companies, support their growth and internationalization, and simplify administrative burdens. The reform of professional services and associations is in progress. A draft bill containing far-reaching liberalization measures (including strict limits on registration requirements and revision of membership fees) is expected to be adopted this year. By reinforcing

8
competition and efficiency, this reform will result in important gains in productivity, competitiveness, growth and job potential. In addition, the rental market reform adopted in 2013 will increase efficiency in this market and reduce the home-ownership bias, which is expected to have positive effects on labor mobility. Significant reforms have also been adopted to enhance the R&I framework, as well as in the retail market, transport, energy and telecommunications sectors.