Embed Size (px)
Citation preview

© 2009 International Monetary Fund January 2009 IMF Country Report No. 09/28
[Month, Day], 201 August 2, 2001 Qatar: 2008 Article IV Consultation—Staff Report; Staff Statement; and Public Information Notice on the Executive Board Discussion Under Article IV of the IMF’s Articles of Agreement, the IMF holds bilateral discussions with members, usually every year. In the context of the 2008 Article IV consultation with Qatar, the following documents have been released and are included in this package: • The staff report for the 2008 Article IV consultation, prepared by a staff team of the IMF,
following discussions that ended on November 17, 2008, with the officials of Qatar on economic developments and policies. Based on information available at the time of these discussions, the staff report was completed on December 30, 2008. The views expressed in the staff report are those of the staff team and do not necessarily reflect the views of the Executive Board of the IMF.
• A staff statement of January 21, 2009, updating information on recent developments.
• A Public Information Notice (PIN) summarizing the views of the Executive Board as expressed during its January 21, 2009 discussion of the staff report that concluded the Article IV consultation.
The documents listed below will be separately released. Statistical Appendix
The policy of publication of staff reports and other documents allows for the deletion of market-sensitive information.
Copies of this report are available to the public from
International Monetary Fund • Publication Services 700 19th Street, N.W. • Washington, D.C. 20431
Telephone: (202) 623-7430 • Telefax: (202) 623-7201 E-mail: [email protected] • Internet: http://www.imf.org
International Monetary Fund
Washington, D.C.


INTERNATIONAL MONETARY FUND
QATAR
Staff Report for the 2008 Article IV Consultation
Prepared by Staff Representatives for the 2008 Consultation with Qatar
Approved by Juan Carlos Di Tata and David Marston
December 30, 2008
• Discussions: November 4–17, 2008.
• Team: Messrs. Leon (Head), Prasad, Kumah, Williams, and Espinoza (all MCD).
• Meetings: The mission met with the Minister of Economy and Finance; the Governor of the Qatar Central Bank (QCB); the Chairman and Chief Executive Officer of the Qatar Financial Center (QFC); other senior government and central bank officials; and representatives of the private sector.
• Exchange arrangement: Peg to the U.S. dollar. Qatar is an Article VIII country, but maintains security-related exchange restrictions that have been notified to the Fund.
• Past surveillance: The authorities and the Fund have generally agreed on policy priorities. The 2007 Article IV consultation was concluded on November 26, 2007; PIN available at http://www.imf.org/external/np/sec/pn/2007/pn07141.htm.
• Economic statistics: Broadly adequate for surveillance; can improve data frequency, timeliness, and coverage. General Data Dissemination System (GDDS) participant since December 30, 2005.

2
Contents Page
Executive Summary ............................................................................................................................ 3
I. Recent Economic Developments ..................................................................................................... 4
II. Medium-Term Economic Outlook and Risks................................................................................. 9
III. Policy Discussions....................................................................................................................... 13 A. Impact of the Global Financial Crisis........................................................................................... 13 B. Inflation......................................................................................................................................... 16 C. Financial Sector Development...................................................................................................... 18 D. Exchange Rate Issues ................................................................................................................... 18 E. GCC Monetary Union................................................................................................................... 21
IV. Structural Reforms and Statistics ................................................................................................ 21
V. Staff Appraisal.............................................................................................................................. 22 Tables 1. Qatar: Selected Macroeconomic Indicators, 2004–09 .................................................................. 25 2a. Qatar: Summary of Government Finance, 2004/05–2008/09 ..................................................... 26 2b. Qatar: Summary of Government Finance, 2004/05–2008/09 ..................................................... 27 3. Qatar: Depository Corporations Survey, 2005–09........................................................................ 28 4. Qatar: Balance of Payments, 2005–09 .......................................................................................... 29 5. Qatar: Vulnerability Indicators, 2003–07...................................................................................... 30 6. Qatar: Medium-Term Baseline Scenario, 2005–13....................................................................... 31 Figures 1. Qatar: Recent Economic Developments, 2004–08.......................................................................... 6 2. Qatar: Medium-Term Outlook, 2005–13 ...................................................................................... 12 Boxes 1. GCC and Qatar Projects: A Medium-Term Outlook..................................................................... 11 2. Qatar’s Banking System................................................................................................................ 14 3. Economic Growth and Inflation Trade-off.................................................................................... 17 4. Qatar—Real Exchange Rate Assessment...................................................................................... 19

3
EXECUTIVE SUMMARY
During the policy discussions, there was a broad concurrence of views between staff and the authorities on inflation, the financial sector, and exchange rate issues. Qatar’s medium-term outlook is positive, with downside risks from a prolonged global financial crisis, persistently low oil prices, a large decline in real estate prices, and an escalation in geopolitical tensions. The authorities
• Consider containing inflation as a high priority. • Remain vigilant on financial sector developments and stand ready to take any action
required to preserve financial stability. • Are committed to the implementation of ongoing investment projects, and are willing to
increase government capital spending, if needed, to maintain economic activity. • Noted staff’s assessment that the Qatari riyal might be slightly undervalued, and reiterated
their commitment to maintaining a peg to the U.S. dollar in the period leading up to the Gulf Cooperation Council (GCC) Monetary Union.
• Indicated that the implementation of a unified financial services regulator in Qatar is likely
to be more gradual than initially envisaged.
Staff recommendations
• Continue to proactively manage vulnerabilities and expectations arising from the global crisis.
• Build an early warning system to identify risks in the banking system. Also conduct stress
tests for a combination of risks and publish results on a periodic basis.
• Continue to contain government current expenditure and phase the implementation of new investments as part of inflation management. The freeze on rent increases and price controls is distortionary and should be applied on a temporary basis.
• Maintain the peg to the U.S. dollar during the period leading up to the formation of the monetary union in 2010.
• Improve the quality of macroeconomic statistics and the provision of international investment position data to the Fund to strengthen the effectiveness of the surveillance process.

4
I. RECENT ECONOMIC DEVELOPMENTS
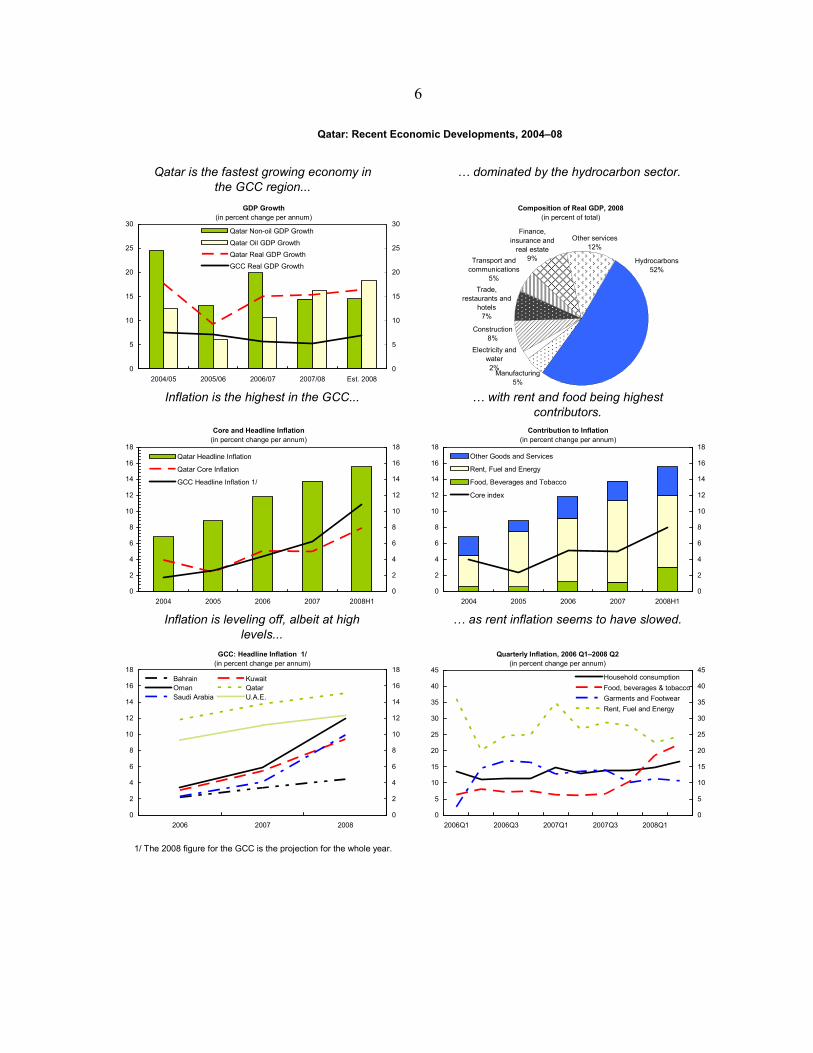
1. Qatar’s macroeconomic performance remains strong in 2008, supported by an outward-oriented strategy aimed at developing the country’s vast gas reserves.1 Falling oil prices have not influenced ongoing hydrocarbon investments because of committed contracts for liquefied natural gas (LNG). Non-oil GDP growth has also remained buoyant because of ongoing projects for which financing has already been secured.
• Overall real GDP growth is estimated at 16 percent in 2008, driven by expansions in the production of oil, LNG, and condensates, and a strong performance in manufacturing, construction, and financial services. At 15 percent in 2008, Qatar’s inflation rate is the highest among GCC countries, with rent and food prices being major contributors.
• Broad money is projected to increase by almost 40 percent in 2008, fueled by large foreign exchange inflows, large public outlays, and a rapid expansion in private sector credit. Credit growth has ballooned despite the implementation of a lower loan-deposit ratio and increases in reserve requirements.
• The overall fiscal surplus (12 percent of GDP in FY2007–08) reflects a strong increase in revenue and a slowdown in expenditure relative to FY2006–07, partly owing to improvements in cash management.2
• The external current account surplus (about 37 percent of GDP) mirrors a strong export performance that more than compensated for buoyant growth (47 percent) in imports (mainly capital goods) and in net services and transfers.
2. The global financial crisis does not seem to have affected liquidity in Qatar, as deposits and credit continued to grow at a rapid pace through October 2008. Interbank liquidity remains broadly comfortable, although the weighted-average interbank rates in one-month maturities rose (by about 350 basis points) between August and October. The central bank has responded by introducing an overnight liquidity facility for banks, but use of this facility has been negligible.3
1 With the world’s 3rd largest proven reserves of natural gas, Qatar is the largest exporter of liquefied natural gas.
2 The Ministry of Economy and Finance now transfers funds to spending departments only after expenditures have actually been incurred, reducing the difference between actual expenditures and disbursed funds.
3 Currently, commercial banks have $6 billion parked with the central bank in the form of reserve requirements, deposits, and Certificates of Deposit (CDs).

5
3. Qatari banks are adequately capitalized and profitable, and recent assessments indicate that the banking system appears sound. At the same time, weak sentiment weighed on shares and the equity market declined, although the underlying fundamentals remain strong. The direct impact on the banking system of the recent decline in equity prices has been minimal, owing in part to caps on exposure to the equity market. However, to strengthen confidence in the banking system, the government authorized the Qatar Investment Authority (QIA) to purchase up to 20 percent (about $5.3 billion) of the enhanced share capital of listed banks (except the government majority-owned Qatar National Bank) on the Doha Securities Market (DSM).
2005 2006 2007 2008 (Sept)1/Capital adequacy 24.8 14.3 13.5 17.0Return on assets 4.3 3.7 3.6 2.4Gross NPLs to total loans 4.3 2.2 1.5 1.0Provision for NPLs 84.3 94.0 90.7 91.0Return on equity 28.5 27.2 30.4 21.7 1/ Pertains to national conventional banks.Sources: Global Financial Stability Report (GFSR); Qatari Authorities.
(in percent)Banking Sector Performance and Soundness (2003–08)
6
Qatar is the fastest growing economy in the GCC region...
1/ The 2008 figure for the GCC is the projection for the whole year.
GDP Growth(in percent change per annum)
0
5
10
15
20
25
30
2004/05 2005/06 2006/07 2007/08 Est. 20080
5
10
15
20
25
30Qatar Non-oil GDP Growth
Qatar Oil GDP GrowthQatar Real GDP GrowthGCC Real GDP Growth
Composition of Real GDP, 2008(in percent of total)
Electricity and water2%
Manufacturing5%
Construction8%
Trade, restaurants and
hotels7%
Hydrocarbons52%
Transport and communications
5%
Finance, insurance and
real estate9%
Other services12%
Core and Headline Inflation(in percent change per annum)
0
2
4
6
8
10
12
14
16
18
2004 2005 2006 2007 2008H10
2
4
6
8
10
12
14
16
18Qatar Headline Inflation
Qatar Core Inflation
GCC Headline Inflation 1/
Contribution to Inflation(in percent change per annum)
0
2
4
6
8
10
12
14
16
18
2004 2005 2006 2007 2008H10
2
4
6
8
10
12
14
16
18Other Goods and Services
Rent, Fuel and Energy
Food, Beverages and Tobacco
Core index
GCC: Headline Inflation 1/(in percent change per annum)
0
2
4
6
8
10
12
14
16
18
2006 2007 20080
2
4
6
8
10
12
14
16
18Bahrain KuwaitOman QatarSaudi Arabia U.A.E.
Quarterly Inflation, 2006 Q1–2008 Q2(in percent change per annum)
0
5
10
15
20
25
30
35
40
45
2006Q1 2006Q3 2007Q1 2007Q3 2008Q10
5
10
15
20
25
30
35
40
45Household consumptionFood, beverages & tobaccoGarments and FootwearRent, Fuel and Energy
… dominated by the hydrocarbon sector.
Inflation is the highest in the GCC... … with rent and food being highest contributors.
Inflation is leveling off, albeit at high levels...
… as rent inflation seems to have slowed.
Qatar: Recent Economic Developments, 2004–08

7
Fiscal surpluses continued owing to high oil and gas production...
Fiscal Balance(in percent of GDP)
-30
-20
-10
0
10
20
30
40
50
60
70
2003/04 2004/05 2005/06 2006/07 2007/08-30
-20
-10
0
10
20
30
40
50
60
70Fiscal Balance to GDPNonhydrocarbon Balance to GDPTotal Revenue to GDPTotal Expenditure to GDP
External Current Account Balance(in percent of GDP)
0
5
10
15
20
25
30
35
40
45
50
2003 2004 2005 2006 2007 200825
35
45
55
65
75
85
95
105
115Current Account Balance
Imports
Crude Oil (U.S. dollars per barrel, RHS)
Total Government Expenditure(in percent of Non-oil GDP)
0
10
20
30
40
50
60
70
80
90
2003/04 2004/05 2005/06 2006/07 2007/080
10
20
30
40
50
60
70
80
90Qatar
GCC
Current Government Expenditure(in percent of Non-oil GDP)
0
10
20
30
40
50
60
70
2003/04 2004/05 2005/06 2006/07 2007/080
10
20
30
40
50
60
70
Qatar
GCC
Total government expenditure has declined... … as current expenditure fell, reflecting containment of wages.
… and the current account surplus has increased to record levels.
Qatar: Recent Economic Developments, 2004–08 (continued)

8
Broad money grew strongly... … and growth in credit to the public sector and for housing and real estate accelerated.
Interest rates remained broadly aligned to the Federal Funds rate... … and real deposit and lending rates
remained negative.
Equity prices declined sharply... … and one-month interbank rates increased.
Broad Money and Credit Growth(in percent change per annum)
0
10
20
30
40
50
60
70
80
2003/04 2004/05 2005/06 2006/07 2007/08 Est. 20080
10
20
30
40
50
60
70
80Qatar Broad MoneyQatar Credit to the Private SectorGCC Broad MoneyGCC Credit to the Private Sector
Distribution of Credit(in million Qatari riyals)
0
20
40
60
80
100
120
Jan-05 Jul-05 Jan-06 Jul-06 Jan-07 Jul-07 Jan-08 Jul-080
20
40
60
80
100
120Public Sector Trade and IndustryHousing & Construction Personal ConsumptionServices and others Outside Qatar
Interest Rates(average per annum)
0
1
2
3
4
5
6
7
2000 2001 2002 2003 2004 2005 2006 2007 20080
1
2
3
4
5
6
7
Fed Funds RateDeposit RateLending RateRepo Rate
GCC: Real Interest Rate (Latest Available)(in percent per annum)
-15 -10 -5 0 5
Bahrain
Kuwait
Oman
Qatar
Saudi Arabia
U.A.E.
Real Deposit Rate
Real Lending Rate
40
50
60
70
80
90
100
9/11/08 9/26/08 10/11/08 10/26/08 11/10/08 11/25/0840
50
60
70
80
90
100
Bahrain Kuwait Oman QatarSaudi Arabia Dubai
GCC Stock Market Developments(Index, September 11, 2008=100)
Interbank Rates(in percent per annum)
0
1
2
3
4
5
6
7
8
Jan-08 Feb-08 Mar-08 Apr-08 May-08 Jun-08 Jul-08 Aug-08 Sep-08 Oct-080
1
2
3
4
5
6
7
8Overnight1 week1 month3 months
Qatar: Recent Economic Developments, 2004–08 (continued)
Sources: Country authorities; and IMF staff estimates.
9
II. MEDIUM-TERM ECONOMIC OUTLOOK AND RISKS4
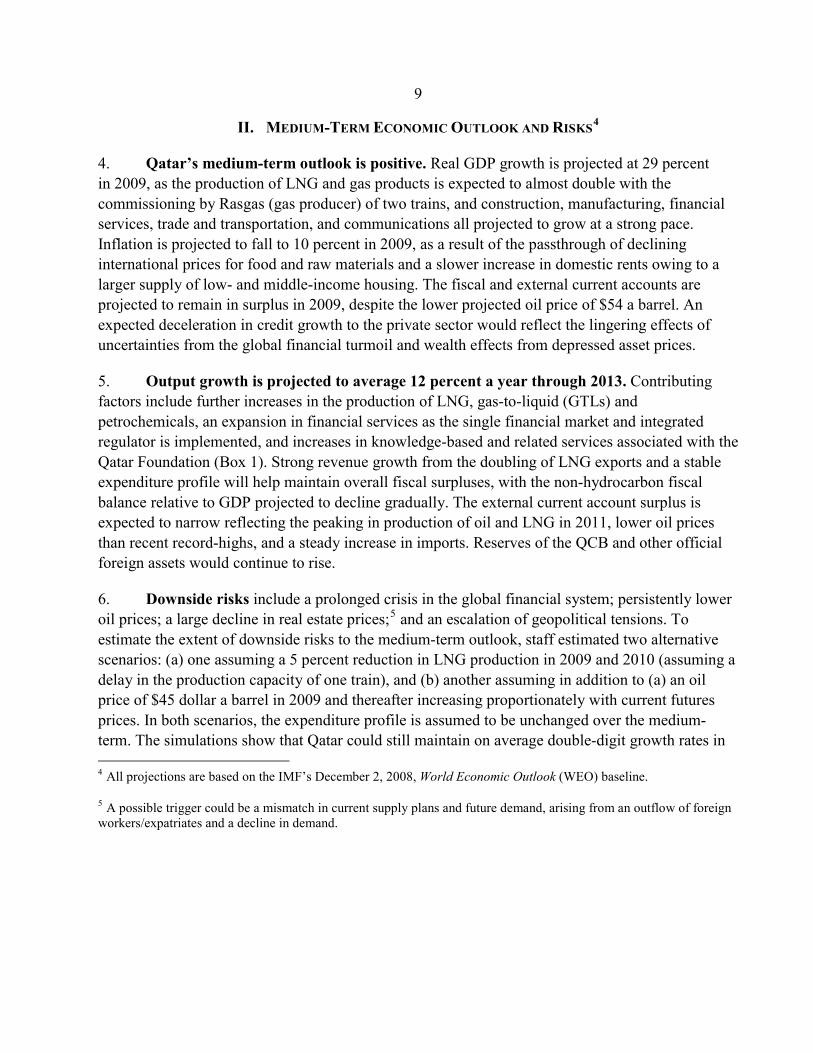
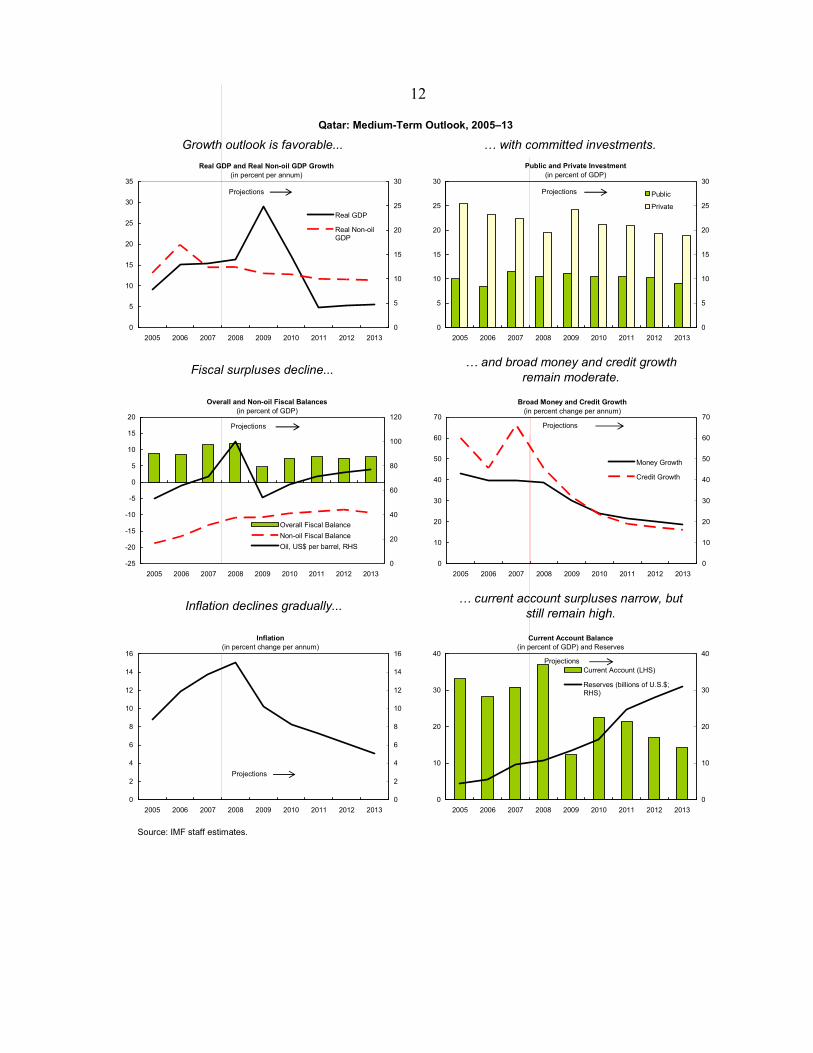
4. Qatar’s medium-term outlook is positive. Real GDP growth is projected at 29 percent in 2009, as the production of LNG and gas products is expected to almost double with the commissioning by Rasgas (gas producer) of two trains, and construction, manufacturing, financial services, trade and transportation, and communications all projected to grow at a strong pace. Inflation is projected to fall to 10 percent in 2009, as a result of the passthrough of declining international prices for food and raw materials and a slower increase in domestic rents owing to a larger supply of low- and middle-income housing. The fiscal and external current accounts are projected to remain in surplus in 2009, despite the lower projected oil price of $54 a barrel. An expected deceleration in credit growth to the private sector would reflect the lingering effects of uncertainties from the global financial turmoil and wealth effects from depressed asset prices.
5. Output growth is projected to average 12 percent a year through 2013. Contributing factors include further increases in the production of LNG, gas-to-liquid (GTLs) and petrochemicals, an expansion in financial services as the single financial market and integrated regulator is implemented, and increases in knowledge-based and related services associated with the Qatar Foundation (Box 1). Strong revenue growth from the doubling of LNG exports and a stable expenditure profile will help maintain overall fiscal surpluses, with the non-hydrocarbon fiscal balance relative to GDP projected to decline gradually. The external current account surplus is expected to narrow reflecting the peaking in production of oil and LNG in 2011, lower oil prices than recent record-highs, and a steady increase in imports. Reserves of the QCB and other official foreign assets would continue to rise.
6. Downside risks include a prolonged crisis in the global financial system; persistently lower oil prices; a large decline in real estate prices;5 and an escalation of geopolitical tensions. To estimate the extent of downside risks to the medium-term outlook, staff estimated two alternative scenarios: (a) one assuming a 5 percent reduction in LNG production in 2009 and 2010 (assuming a delay in the production capacity of one train), and (b) another assuming in addition to (a) an oil price of $45 dollar a barrel in 2009 and thereafter increasing proportionately with current futures prices. In both scenarios, the expenditure profile is assumed to be unchanged over the medium-term. The simulations show that Qatar could still maintain on average double-digit growth rates in
4 All projections are based on the IMF’s December 2, 2008, World Economic Outlook (WEO) baseline. 5 A possible trigger could be a mismatch in current supply plans and future demand, arising from an outflow of foreign workers/expatriates and a decline in demand.

10
non-oil real GDP and continue to record fiscal and current account surpluses over the medium term, although at lower levels.
7. The price of oil would continue to determine the pace at which investment plans can be implemented, as well as the rate of accumulating external assets through the QIA. A further worsening of the global crisis could dampen external demand for hydrocarbon and related products, pose liquidity and financing risks, delay the implementation of future investment projects, and adversely affect growth in the nonhydrocarbon sector. However, potential stresses appear manageable, because the banking sector is well capitalized, and the QIA can diversify its portfolio by investing in local projects.
11
Box 1. GCC and Qatar Projects: A Medium-Term Outlook
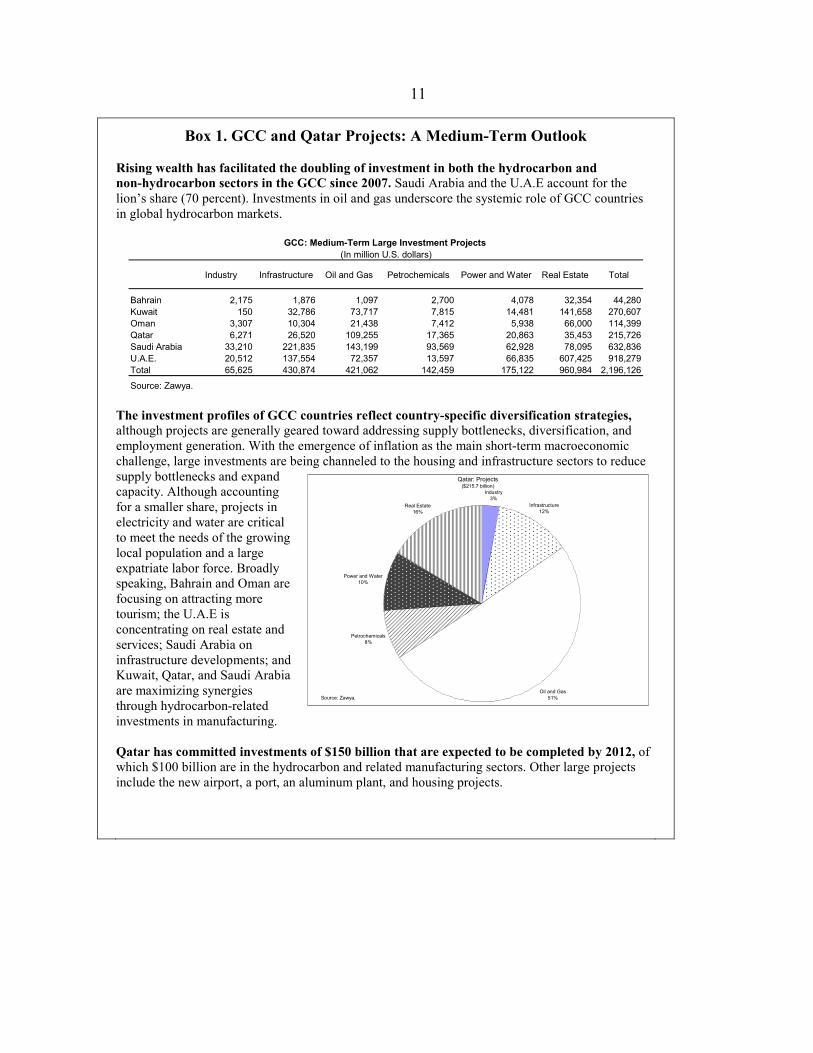
Rising wealth has facilitated the doubling of investment in both the hydrocarbon and non-hydrocarbon sectors in the GCC since 2007. Saudi Arabia and the U.A.E account for the lion’s share (70 percent). Investments in oil and gas underscore the systemic role of GCC countries in global hydrocarbon markets.
Industry Infrastructure Oil and Gas Petrochemicals Power and Water Real Estate Total
Bahrain 2,175 1,876 1,097 2,700 4,078 32,354 44,280Kuwait 150 32,786 73,717 7,815 14,481 141,658 270,607Oman 3,307 10,304 21,438 7,412 5,938 66,000 114,399Qatar 6,271 26,520 109,255 17,365 20,863 35,453 215,726Saudi Arabia 33,210 221,835 143,199 93,569 62,928 78,095 632,836U.A.E. 20,512 137,554 72,357 13,597 66,835 607,425 918,279Total 65,625 430,874 421,062 142,459 175,122 960,984 2,196,126
Source: Zawya.
GCC: Medium-Term Large Investment Projects (In million U.S. dollars)
The investment profiles of GCC countries reflect country-specific diversification strategies, although projects are generally geared toward addressing supply bottlenecks, diversification, and employment generation. With the emergence of inflation as the main short-term macroeconomic challenge, large investments are being channeled to the housing and infrastructure sectors to reduce supply bottlenecks and expand capacity. Although accounting for a smaller share, projects in electricity and water are critical to meet the needs of the growing local population and a large expatriate labor force. Broadly speaking, Bahrain and Oman are focusing on attracting more tourism; the U.A.E is concentrating on real estate and services; Saudi Arabia on infrastructure developments; and Kuwait, Qatar, and Saudi Arabia are maximizing synergies through hydrocarbon-related investments in manufacturing. Qatar has committed investments of $150 billion that are expected to be completed by 2012, of which $100 billion are in the hydrocarbon and related manufacturing sectors. Other large projects include the new airport, a port, an aluminum plant, and housing projects.
Qatar: Projects($215.7 billion)
Industry3%
Oil and Gas51%
Petrochemicals8%
Power and Water10%
Real Estate16%
Infrastructure12%
Source: Zawya.
12
Qatar: Medium-Term Outlook, 2005–13
Real GDP and Real Non-oil GDP Growth(in percent per annum)
0
5
10
15
20
25
30
35
2005 2006 2007 2008 2009 2010 2011 2012 20130
5
10
15
20
25
30
Real GDP
Real Non-oilGDP
Public and Private Investment(in percent of GDP)
0
5
10
15
20
25
30
2005 2006 2007 2008 2009 2010 2011 2012 20130
5
10
15
20
25
30
Public
Private
Projections
Overall and Non-oil Fiscal Balances(in percent of GDP)
-25
-20
-15
-10
-5
0
5
10
15
20
2005 2006 2007 2008 2009 2010 2011 2012 20130
20
40
60
80
100
120
Overall Fiscal BalanceNon-oil Fiscal BalanceOil, US$ per barrel, RHS
Projections
Broad Money and Credit Growth(in percent change per annum)
0
10
20
30
40
50
60
70
2005 2006 2007 2008 2009 2010 2011 2012 20130
10
20
30
40
50
60
70
Money Growth
Credit Growth
Projections
Inflation(in percent change per annum)
0
2
4
6
8
10
12
14
16
2005 2006 2007 2008 2009 2010 2011 2012 20130
2
4
6
8
10
12
14
16
Projections
Current Account Balance (in percent of GDP) and Reserves
0
10
20
30
40
2005 2006 2007 2008 2009 2010 2011 2012 20130
10
20
30
40
Current Account (LHS)
Reserves (billions of U.S.$;RHS)
Projections
Projections
Growth outlook is favorable... … with committed investments.
Fiscal surpluses decline... … and broad money and credit growth remain moderate.
Inflation declines gradually... … current account surpluses narrow, but still remain high.
Source: IMF staff estimates.
13
III. POLICY DISCUSSIONS
8. The policy discussions focused on (a) the impact of the global financial crisis on growth and financial stability; (b) domestic inflation management; (c) progress in establishing a unified financial services regulator in Qatar; (d) exchange rate issues; and (e) the GCC monetary union.
A. Impact of the Global Financial Crisis
9. The authorities do not anticipate a strong impact of the global financial crisis on Qatar. Although equity prices have fallen, credit default swap spreads have widened (150 basis points), and interbank rates have increased moderately, domestic and foreign investor sentiment about the economy remain strong. The global economic slowdown and the sharp decline in oil prices could weaken somewhat overall economic activity in Qatar, but the authorities pointed out that most of the hydrocarbon investments are firm and at various stages of implementation, and are unlikely to be affected because the LNG has been committed under long-term contracts. Also, investments in the non-hydrocarbon sector—manufacturing (aluminum, steel, power, water, petrochemicals), transportation (airways), building and construction (Lusail, Pearl, Barwa), and other infrastructure (ports and airport)—for which financing has already been secured would continue. In FY 2009/10, the cost of maintaining public spending would be about 3 percent of GDP, assuming an additional OPEC cut (10 percent) and a $45 a barrel price of oil in 2009. The authorities also indicated their intention to increase government capital spending beyond ongoing projects, if needed, to sustain economic activity.
10. The authorities remain vigilant on financial sector developments. The central bank is conducting monthly stress testing of banks, which so far shows that the measured risks are manageable (Box 2). The authorities plan to publish the results through an annual financial stability report. Notwithstanding their assessment that the banking system remains sound and the liquidity position comfortable, financial developments are being closely monitored by a central bank Financial Crisis Committee that meets daily; a coordination committee (including the central bank governor and the Minister of Economy and Finance) that meets weekly; and a high level committee involving the prime minister. The central bank stands ready to provide liquidity in case there is a run on any bank and to implement appropriate crisis resolution measures, if the need arises, including through bank mergers. At the regional level, GCC countries are in agreement that they should support their respective financial systems.
11. The authorities have been proactive in managing market expectations. In addition to the introduction of an overnight liquidity window at 3 percent, the central bank is currently preparing a list of acceptable instruments to facilitate collateralized lending to banks. The authorities are also closely monitoring conditions in the money market and have used moral suasion to urge public entities to increase deposits in commercial banks without demanding higher interest rates.

14
Box 2. Qatar’s Banking System
Qatar’s banking system is dominated by national banks. The system comprises 16 banks—6 conventional, 3 Islamic, and 7 foreign. Conventional banks assets constitute 80 percent of total bank assets; Islamic and foreign banks account for 10 percent each. The regulatory capital adequacy requirement is 10 percent. National banks are under Basel II guidelines for capital adequacy requirements, but the risk-weighted capital requirements of foreign banks are based on home-country provisions.
Competition is creating pressures on banks’ return on assets (RoA). Bank profitability is still high owing to strong private sector demand, but increasing competition and rising costs have eroded the RoA as well as the return on equity (ROE). Consistent with lower profitability, risk taking by banks, as measured by the Z-index, was low during 2003–07.1
Higher interest rates on customer deposits and lower interest rates on credit facilities have reduced net interest margins since 2005.2 Higher cost-to-income ratios and lower operating income as a proportion of assets also added to the pressures on banks’ profitability. Although non-interest expenditure as a proportion of assets declined, this reflected the rapid increase in assets rather than efficiency gains.
The continued above-trend growth rate of assets in 2008 and the preponderance of customer deposits (which represented 64 percent of non-equity funding in 2007) can pose some vulnerabilities to the banking system in the future. However, so far the rapid credit growth does not seem to have affected credit quality. Although the high Funding Volatility Ratio (FVR) of banks points to potential liquidity problems in difficult times, this does not seem to be an issue now.3 However, the central bank needs to continue monitoring proactively the performance of banks through periodic stress tests.

15
Qatar’s Banking System (continued) g
Source: Bank Scope.
Non-interest Expenditure/Assets
Qatar
GCC
1
1.5
2
2.5
3
2003 2004 2005 2006 20071
1.5
2
2.5
3
Net Interest Margin/Assets
Qatar
GCC
1.0
2.0
3.0
4.0
5.0
2003 2004 2005 2006 20071.0
2.0
3.0
4.0
5.0
Operating Income/Assets
Qatar
GCC
0.0
0.5
1.0
1.5
2.0
2.5
3.0
3.5
2003 2004 2005 2006 20070.0
0.5
1.0
1.5
2.0
2.5
3.0
3.5
Cost-to-Income
Qatar
GCC
20
25
30
35
40
45
50
2003 2004 2005 2006 200720
25
30
35
40
45
50
____________________________________ 1 A proxy measure of bank’s risk taking can be observed by an estimate of a bank’s probability of failure, called the Z-index. The index is calculated using (a) profitability, measured by the average return on assets (RoA); (b) leverage, measured by the period average equity-to-asset ratio (K); and (c) return volatility VR, measured by the period standard deviation of RoA. Thus Z = (R +K) / VR. Z increases with profitability and equity capital as percent of assets, and decreases with return volatility. Thus, a larger value of the Z-index indicates a lower risk profile for a bank (De Nicolo, G., P. Bartholomew, J. Zaman, and M. Zephirin, 2003, “Bank Consolidation, Internationalization, and Conglomeration: Trends and Implications for Financial Risk,” IMF Working Paper 03/158 (Washington: International Monetary Fund); Loukoianova, E., 2008, “Analysis of the Efficiency and Profitability of the Japanese Banking System,” IMF Working Paper 08/63 (Washington: International Monetary Fund). In the case of Qatar, the Z-index increased marginally between 2002 and 2007, from 2.6 to 3.8.
2 The average one-year weighted deposit rates of banks rose from 3.2 percent to 4.8 percent during 2004–07, while the average 1 to 3 year-weighted lending rate declined from 9.8 percent to 8.9 percent over the same period.
3 The FVR is calculated as (volatile liabilities–liquid assets) / (total assets–liquid assets). The lower the ratio, the better the banks’ liquidity profile.

16
B. Inflation
12. The authorities agreed with the staff that inflationary pressures are likely to ease in 2009, with international food and raw material prices projected to decline and domestic rents to stabilize. As investments come on stream, supply bottlenecks will also ease and inflation, which is expected to remain elevated in the near term, would decline gradually.
13. Monetary policy will be managed to achieve a gradual reduction in inflation (Box 3). The central bank intends to carefully calibrate its interest rate and liquidity instruments to ensure that inflation is reduced and that the growth of assets, credit, and deposits of the banking system is not choked off. To balance this trade-off, the QCB did not reduce its policy rates on the last two occasions (since September 2008) when the Federal Reserve cut its rates. At the same time, however, reserve requirements have been increased by 2 percentage points in 2008, and the QCB is issuing CDs for maturities of one-, three-, six-, and nine-months, and is also planning to issue 14-day fixed rate CDs. Also, central bank regulation has progressively reduced the proportion of consumer credit. Although the central bank does not see a need to modify its monetary policy stance at this time, it intends to maintain the current prudential norms, such as the limits to real estate lending, the loan-deposit ratio, and the liquidity ratio, which have served the system well by discouraging excessive risk exposure. The authorities are in consultation with the government on the issuance of government bonds to improve debt management and gain greater flexibility in money market operations.

17
Box 3. Economic Growth and Inflation Trade-off
A surge in inflation can have a negative impact on investment and growth. In general, inflation is not costly at low levels, but when it reaches some threshold level further increases are likely to be harmful to growth.1
Qatar is at about the threshold where if inflation persists, it could begin to have an adverse impact on growth. Consequently, efforts should continue to both monitor and contain inflationary pressures.
Our analysis identifies a threshold inflation level of 12 percent for a sample of 165 countries, above which a doubling of inflation would decrease real GDP by 1.5 percent per year.2 The results are very similar when applied to both developing and emerging economies groups (column a), although the estimated threshold is much lower for advanced economies (about 1% - not shown in the table). For oil exporters, the threshold inflation level is estimated at 10 percent (column b). Above that threshold, a doubling of inflation would reduce real GDP growth by about 1.5 percent per year. Similar results are obtained if non-oil GDP data is used (column c): a doubling of inflation from above the estimated threshold (also 12 percent) decreases non-oil real GDP by about 1.5 percent per year.
Emerging and
developing economies
(a)
Oil Producers (effect on real GDP)
(b)
Effect on non-oil
real GDP(c)
No obs. 1068 204 322
No. countries 136 26 65
threshold 12% 10% 12%
βlow 0.000 0.007 0.000
βhigh -0.022*** -0.022*** -0.023***
-.3-.2
-.10
.1.2
grow
th (a
fter c
ontro
l)
-2 0 2 4 6 8f(inflation)
Note: The coefficient β high , (significant at the 1 percent level in all estimations), corresponds to the effect of ln(1+inflation) on growth for levels of inflation higher than the estimated threshold.
Note: Threshold estimate for the whole sample (165 countries). A threshold of 12 percent corresponds to f(inflation)= ln(1+inflation)=2.6
_____________________________ 1 Fischer, S., 1993, “The Role of Macroeconomic Factors in Economic Growth,” Journal of Monetary Economics, Vol. 32, pp. 485–512, shows that high inflation reduces investment and productivity; and Khan, M.S. and A. S. Senhadji, 2001, “Threshold Effects in the Relationship Between Inflation and Growth,” IMF Staff Papers, Vol. 48, pp. 1–21, found that the threshold for advanced economies was much lower than that for developing countries. 2 The model, based on Khan and Senhadji (2001), is estimated on 5-year averages and controlled for individual country effects, the business cycle, the ratio of investment to GDP, population growth, initial GDP, the rate of change in the terms of trade, and the variability of the terms of trade.
18
C. Financial Sector Development
14. The authorities remain fully committed to having a unified financial regulator for Qatar. In 2007, the government took a strategic decision to establish a single financial services regulator that would bring together the functions of Qatar’s three regulators—the QCB, which supervises banks; the Qatar Financial Markets Authority, which oversees the Doha Securities Market; and the Qatar Financial Center Regulatory Authority (QFCRA), which regulates the activities of institutions licensed by the QFC. When the new regulatory authority—the Financial Regulatory Authority (FRA)—is created, Qatar will be the second country in the GCC region (the other is Bahrain) with a single regulator model. Although steady progress is being made, including on the proposed policy and legal framework,6 information sharing among the three regulators, and the convergence of rulebooks into a unified set of standards, full implementation is likely to be more gradual than initially envisaged.7 The Fund’s Anti-Money Laundering (AML)/Combating the Financing of Terrorism (CFT) assessment was adopted by both Financial Action Task Force (FATF) and MENAFATF in 2008 as an AML/CFT mutual evaluation. The authorities are determined to make improvements in their legal framework, in line with the recommendations of the report.
D. Exchange Rate Issues
15. The authorities reiterated their commitment to maintaining the peg to the U.S. dollar in the period leading up to the GCC Monetary Union. They argued that the peg remains appropriate under the current circumstances, given that 90 percent of Qatar’s exports are invoiced in U.S. dollars. Further, changing the peg from the U.S. dollar to (preferably) a basket of currencies would require choosing the appropriate composition and weights of the currencies—a challenging task, particularly in light of the uncertainties arising from the global economic turmoil. Also, the authorities do not believe that the depreciation of the U.S. dollar was a major contributor to inflation in Qatar, and they are not convinced that a revaluation would solve the inflation problem. In any event, the authorities argued that the recent appreciation of the dollar against major reserve currencies has weakened the argument for a regime change. The authorities noted the staff’s assessment that the exchange rate may be somewhat undervalued (Box 4).
6 The parliamentary legislation proposing the creation of a Financial Regulatory Authority (FRA) in Qatar has already been submitted to parliament.
7 The authorities had planned on completing the transition to the single financial regulator by 2010.

19
during ion
f the ollar
Box 4. Qatar—Real Exchange Rate Assessment
Qatar’s real effective exchange rate (REER) has appreciated by 15 percent since 2004, reversing the 8 percent depreciation experienced during 2001–03. The depreciation until 2003 reflected relatively low domestic inflation, together with the depreciation of the U.S. dollar against the Euro. Since then, the appreciation of the REER has been mainly due to rising domestic inflation. Oil prices spiked between 2003 and mid-2008, with the sharp improvement in Qatar’s terms-of-trade (TOT) suggesting that the underlying equilibrium real effective exchange rate should be more appreciated than before the oil price increase. The equilibrium exchange rate approach suggests that the level of the Qatari riyal is broadly in line with the fundamentals. Low domestic inflation coupled with U.S. dollar depreciation2000–04 led to undervaluat(averaging 5½ percent) oriyal. However, continued dappreciation and high domestic inflation during 2003–07, which coincided with high oil prices, saw a gradual real appreciation.
The macroeconomic balance approach1 based on panel data for the GCC countries, suggest some undervaluation. Qatar’s average external current account norm for 2013 is estimated at 28 percent of GDP, which is lower than the observed current account surplus of 31 percent of GDP in 2007. Given the current futures market trajectory for oil prices over the medium term,2 the surplus is projected to decline by 2013 to below the level of the norm for 2013.
Under the external sustainability approach (ESA), Qatar will have to run sizeable but declining budget and current account surpluses over the medium-to-long term to transform a sufficient amount of oil wealth into financial assets, suggesting some overvaluation.3 The ESA provides an intergenerational approach to the use of expected resources, based on the net present value of future wealth. Annuities are calculated under three different policy objectives: (a) a constant share-of-GDP annuity; (b) a constant real per capita annuity; and (c) constant real annuity.
Qatar—Equilibrium Real Exchange Rate Assessment, 1980–2007
40.0
50.0
60.0
70.0
80.0
90.0
100.0
110.0
120.0
130.0
1980
1982
1984
1986
1988
1990
1992
1994
1996
1998
2000
2002
2004
2006
Indi
ces
(200
0=10
0)
-20.00
-10.00
0.00
10.00
20.00
30.00
40.00
Per
cent
Actual REER
Estimated REER
Estimated REER over-valuation (+) (rhs)
Qatar–Current Account Norms(In percent of GDP)
0
10
20
30
40
50
60
2007 2008 2009 2010 2011 2012 2013
CA Norm (fiscal spending plans)
Projected CA
Projection

20
Qatar—Real Exchange Rate Assessment (continued)
Qatar : Current Account Norms vs. Projected Estimates, 2008–13(In percent of GDP)
0
10
20
30
40
50
60
2008 2009 2010 2011 2012 2013
Projected current Account
Current account norm (constant annuity to GDP)
Current account norm (constant real per capita annuity)
Current account norm (constant real annuity)
__________________________ 1 The variables used include the fiscal balance, the initial level of net foreign assets, gross foreign direct investment, oil prices, income relative to trading partners, real per capita GDP growth, population growth, and age dependency.
2 Oil prices rose from about $70 a barrel in August 2007 to $147 a barrel in July 2008, before falling to $90 a barrel in mid-September 2008 and further to under $60 a barrel in mid-November 2008.
3 The preliminary calculations assume (a) 27 billion barrels of oil reserves and 18.7 billion tons of gas reserves; (b) 1.5 percent decrease in oil production each year, and no growth in gas production each year after 2013; (c) annual average growth in real GDP of 3.5 percent; (d) an increase in the non-oil GDP deflator of 3.5 percent; and (e) a rate of return on external assets at 8 percent.
21
E. GCC Monetary Union
16. Qatar remains committed to moving toward a monetary union with the rest of the GCC countries, but implementation may take longer than initially planned.8 The member countries are aware of the need to step up progress in the various areas necessary for the monetary union, including on the coordination of monetary, exchange rate, and reserves policy; the integration of clearing and settlement systems and common supervisory and regulatory standards; issues relating to the transition to a new currency; and the harmonization and compilation of regional economic statistics. However, a number of challenges need to be addressed, including the use of common fiscal criteria, given differing oil and gas reserves. Progress has been made, in operationalizing the common market, an important milestone in the process toward economic integration. The authorities are of the view that the global financial crisis would not have an adverse impact on the decision to establish a GCC Monetary Union.
IV. STRUCTURAL REFORMS AND STATISTICS
17. The authorities believe that an expansion of the non-oil revenue base is important to reduce the economy’s dependence on the hydrocarbon sector. In this regard, they are considering amending the current tax law in order to lower the corporate tax rate for foreign companies from 35 percent to 10 percent while implementing an initial low rate for national companies, with a view to unifying the tax rates in the future. The authorities are also studying the introduction of a value-added tax (VAT) as part of a GCC-wide initiative, and a revision of the existing tax holiday policy to significantly reduce benefits.
18. Data provision is broadly adequate for surveillance purposes. The authorities are considering several measures aimed at improving the quality of economic data provided to the Fund and the general public. They are now compiling and publishing quarterly nominal GDP data, plan to publish a monthly consumer price index (CPI), are in the process of updating the weights and items in the CPI basket, and introducing an international transactions reporting system (ITRS) that will provide more comprehensive data on external positions of reporting financial corporations. However, the central bank’s plans to improve the coverage and compilation of balance of payments statistics are not progressing as quickly as envisaged and the central bank is currently assessing its technical assistance needs in this area. The QIA does not disclose financial information on its activities. The authorities have indicated that their investment strategy is long-term and driven by risk-return considerations, with a distinct bias toward foreign opportunities. Staff’s estimate based on balance of payments and fiscal accounts data suggest that Qatar’s net public International
8 Following the establishment of the Common External Tariff in 2003, the GCC governments agreed to form a common market by 2007 and a monetary union by 2010.

22
Investment Position (IIP),9 excluding unknown foreign financial claims and liabilities of the private sector, is of the order of $70 billion. The authorities have indicated that they will provide an oral statement on QIA foreign assets to the Board, a similar approach to that followed under the 2007 Article IV consultation.
V. STAFF APPRAISAL
19. Qatar is the fastest growing economy in the GCC region and has so far managed well the impact of the global financial crisis. The economy is expected to continue growing at a rapid pace in the near future, driven by a rapid expansion in LNG production (and related industries) and in investments aimed at economic diversification. The fiscal and external current accounts are projected to remain in surplus; however, the extent of the global financial crisis and the trend in oil prices will determine the medium-term policy mix and the accumulation of reserves in the QIA. Looking forward, the main risks relate to the financial sector if the fall in equity prices continues, and to the construction sector if some of the projects cannot be completed because of reduced availability of financing. In this regard, the authorities should continue to proactively manage expectations and vulnerabilities arising from the global crisis.
20. Staff supports the authorities’ strategy to build capacity and ease supply bottlenecks to contain inflation, but underscores the need to continue containing government current expenditure and to phase the implementation of new investment projects, if needed, to slow the growth in aggregate demand. Although the freeze on rent increases and the price controls introduced recently on some commodities and raw materials could help contain short-term inflationary pressures, they are likely to generate costly distortions and should be applied as temporary measures.
21. Fiscal expansion is projected to moderate over the medium term, particularly through a decline in current expenditures relative to non-hydrocarbon GDP. This decline reflects the containment of wage increases and spending on other goods and services. However, the authorities are committed to completing committed investments in both hydrocarbon and non-hydrocarbon sectors, which could sustain fiscal expansion. Staff agrees that if the global crisis persists, government may need to resort to fiscal stimulus by increasing spending further on infrastructure projects to support demand and reduce negative feedback between the real and financial sectors.
22. Regarding the financial sector, recent global events have demonstrated that market sentiment can change—even if banks are sound and profitable. In this context, safeguarding the soundness of the banking system is crucial. Staff welcomes the monthly stress testing of the banking system by the central bank, and encourages the authorities to consider publishing them on a
9 Items comprising the IIP position at the end of a reference period typically include financial claims on and liabilities to nonresidents, equity assets and liabilities, financial derivative instruments, monetary gold, and SDRs.
23
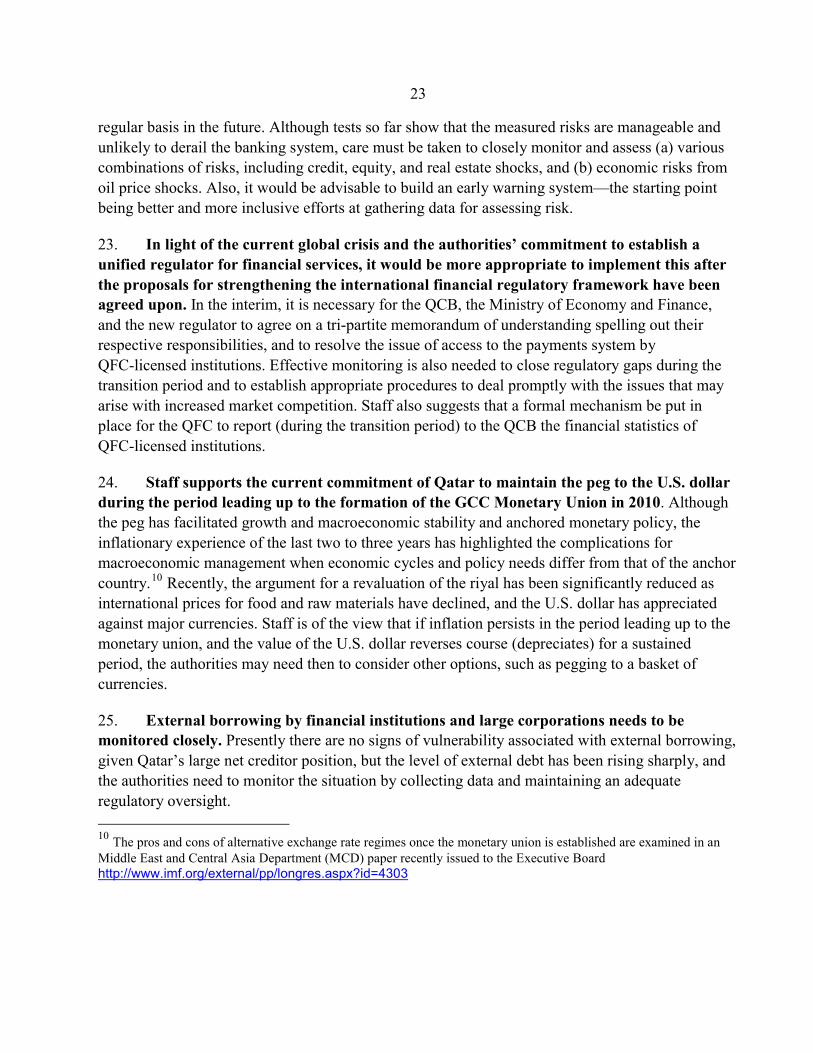
regular basis in the future. Although tests so far show that the measured risks are manageable and unlikely to derail the banking system, care must be taken to closely monitor and assess (a) various combinations of risks, including credit, equity, and real estate shocks, and (b) economic risks from oil price shocks. Also, it would be advisable to build an early warning system—the starting point being better and more inclusive efforts at gathering data for assessing risk.
23. In light of the current global crisis and the authorities’ commitment to establish a unified regulator for financial services, it would be more appropriate to implement this after the proposals for strengthening the international financial regulatory framework have been agreed upon. In the interim, it is necessary for the QCB, the Ministry of Economy and Finance, and the new regulator to agree on a tri-partite memorandum of understanding spelling out their respective responsibilities, and to resolve the issue of access to the payments system by QFC-licensed institutions. Effective monitoring is also needed to close regulatory gaps during the transition period and to establish appropriate procedures to deal promptly with the issues that may arise with increased market competition. Staff also suggests that a formal mechanism be put in place for the QFC to report (during the transition period) to the QCB the financial statistics of QFC-licensed institutions.
24. Staff supports the current commitment of Qatar to maintain the peg to the U.S. dollar during the period leading up to the formation of the GCC Monetary Union in 2010. Although the peg has facilitated growth and macroeconomic stability and anchored monetary policy, the inflationary experience of the last two to three years has highlighted the complications for macroeconomic management when economic cycles and policy needs differ from that of the anchor country.10 Recently, the argument for a revaluation of the riyal has been significantly reduced as international prices for food and raw materials have declined, and the U.S. dollar has appreciated against major currencies. Staff is of the view that if inflation persists in the period leading up to the monetary union, and the value of the U.S. dollar reverses course (depreciates) for a sustained period, the authorities may need then to consider other options, such as pegging to a basket of currencies.
25. External borrowing by financial institutions and large corporations needs to be monitored closely. Presently there are no signs of vulnerability associated with external borrowing, given Qatar’s large net creditor position, but the level of external debt has been rising sharply, and the authorities need to monitor the situation by collecting data and maintaining an adequate regulatory oversight.
10 The pros and cons of alternative exchange rate regimes once the monetary union is established are examined in an Middle East and Central Asia Department (MCD) paper recently issued to the Executive Board http://www.imf.org/external/pp/longres.aspx?id=4303
24
26. The authorities should move ahead with their plans to develop a government bond market. The availability of government bonds would add depth to the financial market, permit the development of a benchmark yield curve, allow banks to better manage their liquidity, and eventually pave the way for the establishment of a corporate bond market.
27. Given the increasing integration with the global economy and the proposed GCC Monetary Union, the authorities should continue to improve the quality of macroeconomic statistics. Building on progress made through participation in the GDDS, priority should be given to improving the balance of payments financial account data, enhancing the timeliness and availability of data on public sector operations, and improving coordination across government agencies. Staff also urges the authorities to improve the provision of IIP data to the Fund. In particular, high priority should be given to expanding the reporting requirements for financial and other corporations, as well as government agencies in order to facilitate the compilation of IIP statistics.
28. It is proposed that Qatar remains on the standard 12-month Article IV consultation cycle.
25
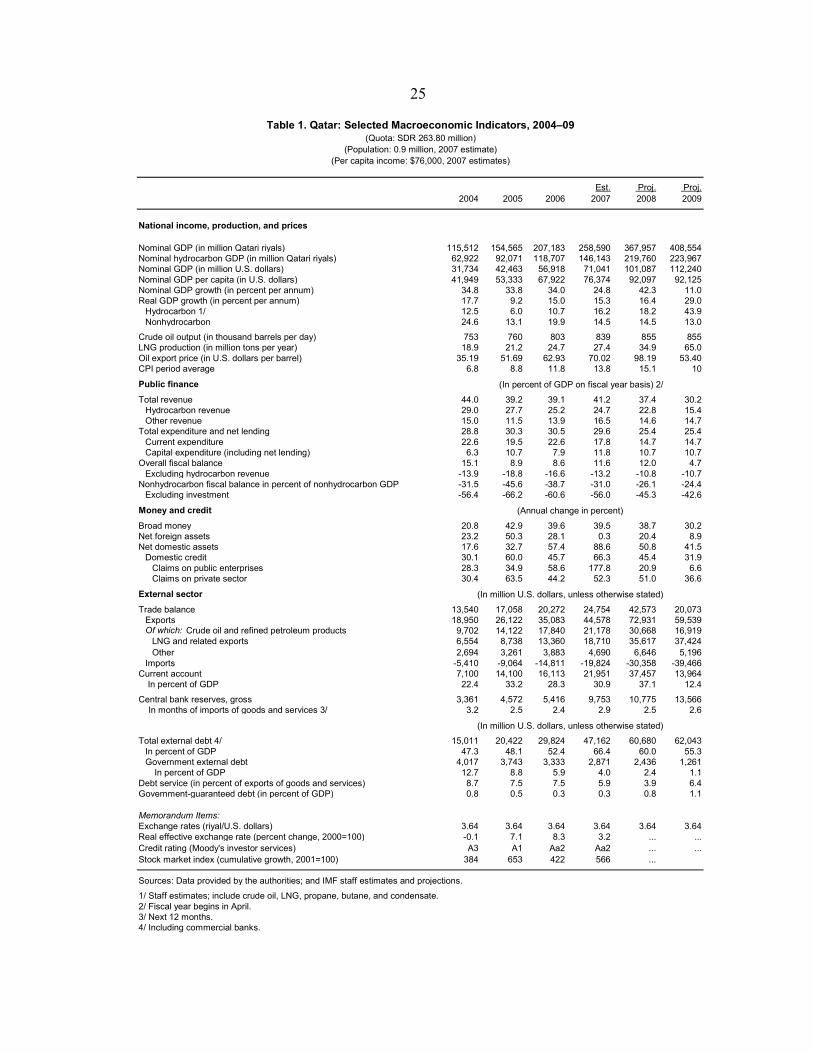
Est. Proj. Proj.2004 2005 2006 2007 2008 2009
National income, production, and prices
Nominal GDP (in million Qatari riyals) 115,512 154,565 207,183 258,590 367,957 408,554Nominal hydrocarbon GDP (in million Qatari riyals) 62,922 92,071 118,707 146,143 219,760 223,967Nominal GDP (in million U.S. dollars) 31,734 42,463 56,918 71,041 101,087 112,240Nominal GDP per capita (in U.S. dollars) 41,949 53,333 67,922 76,374 92,097 92,125Nominal GDP growth (in percent per annum) 34.8 33.8 34.0 24.8 42.3 11.0Real GDP growth (in percent per annum) 17.7 9.2 15.0 15.3 16.4 29.0
Hydrocarbon 1/ 12.5 6.0 10.7 16.2 18.2 43.9Nonhydrocarbon 24.6 13.1 19.9 14.5 14.5 13.0
Crude oil output (in thousand barrels per day) 753 760 803 839 855 855LNG production (in million tons per year) 18.9 21.2 24.7 27.4 34.9 65.0Oil export price (in U.S. dollars per barrel) 35.19 51.69 62.93 70.02 98.19 53.40CPI period average 6.8 8.8 11.8 13.8 15.1 10
Public finance
Total revenue 44.0 39.2 39.1 41.2 37.4 30.2Hydrocarbon revenue 29.0 27.7 25.2 24.7 22.8 15.4Other revenue 15.0 11.5 13.9 16.5 14.6 14.7
Total expenditure and net lending 28.8 30.3 30.5 29.6 25.4 25.4Current expenditure 22.6 19.5 22.6 17.8 14.7 14.7Capital expenditure (including net lending) 6.3 10.7 7.9 11.8 10.7 10.7
Overall fiscal balance 15.1 8.9 8.6 11.6 12.0 4.7Excluding hydrocarbon revenue -13.9 -18.8 -16.6 -13.2 -10.8 -10.7
Nonhydrocarbon fiscal balance in percent of nonhydrocarbon GDP -31.5 -45.6 -38.7 -31.0 -26.1 -24.4Excluding investment -56.4 -66.2 -60.6 -56.0 -45.3 -42.6
Money and credit
Broad money 20.8 42.9 39.6 39.5 38.7 30.2Net foreign assets 23.2 50.3 28.1 0.3 20.4 8.9Net domestic assets 17.6 32.7 57.4 88.6 50.8 41.5
Domestic credit 30.1 60.0 45.7 66.3 45.4 31.9Claims on public enterprises 28.3 34.9 58.6 177.8 20.9 6.6Claims on private sector 30.4 63.5 44.2 52.3 51.0 36.6
External sector
Trade balance 13,540 17,058 20,272 24,754 42,573 20,073Exports 18,950 26,122 35,083 44,578 72,931 59,539Of which: Crude oil and refined petroleum products 9,702 14,122 17,840 21,178 30,668 16,919
LNG and related exports 6,554 8,738 13,360 18,710 35,617 37,424Other 2,694 3,261 3,883 4,690 6,646 5,196
Imports -5,410 -9,064 -14,811 -19,824 -30,358 -39,466Current account 7,100 14,100 16,113 21,951 37,457 13,964
In percent of GDP 22.4 33.2 28.3 30.9 37.1 12.4
Central bank reserves, gross 3,361 4,572 5,416 9,753 10,775 13,566 In months of imports of goods and services 3/ 3.2 2.5 2.4 2.9 2.5 2.6
Total external debt 4/ 15,011 20,422 29,824 47,162 60,680 62,043In percent of GDP 47.3 48.1 52.4 66.4 60.0 55.3Government external debt 4,017 3,743 3,333 2,871 2,436 1,261
In percent of GDP 12.7 8.8 5.9 4.0 2.4 1.1Debt service (in percent of exports of goods and services) 8.7 7.5 7.5 5.9 3.9 6.4Government-guaranteed debt (in percent of GDP) 0.8 0.5 0.3 0.3 0.8 1.1
Memorandum Items:Exchange rates (riyal/U.S. dollars) 3.64 3.64 3.64 3.64 3.64 3.64Real effective exchange rate (percent change, 2000=100) -0.1 7.1 8.3 3.2 ... ...Credit rating (Moody's investor services) A3 A1 Aa2 Aa2 ... ...Stock market index (cumulative growth, 2001=100) 384 653 422 566 ...
Sources: Data provided by the authorities; and IMF staff estimates and projections.
1/ Staff estimates; include crude oil, LNG, propane, butane, and condensate.2/ Fiscal year begins in April.3/ Next 12 months.4/ Including commercial banks.
(Annual change in percent)
(In million U.S. dollars, unless otherwise stated)
(In million U.S. dollars, unless otherwise stated)
(In percent of GDP on fiscal year basis) 2/
Table 1. Qatar: Selected Macroeconomic Indicators, 2004–09(Quota: SDR 263.80 million)
(Population: 0.9 million, 2007 estimate)(Per capita income: $76,000, 2007 estimates)

26
Budget Est. Proj. 2004/05 2005/06 2006/07 2007/08 2007/08 2008/09
Total revenue 55,065 65,685 86,062 72,457 117,790 141,352Hydrocarbon revenue 36,319 46,381 55,429 42,095 70,748 86,257
Oil related 33,192 40,235 48,181 31,313 60,050 69,434LNG related revenue 3,127 6,146 7,248 10,782 10,698 16,823
LNG (royalties) 3,127 6,146 7,248 10,782 10,698 16,823Contingency 0 0 0 0 0 0
Other revenue 18,745 19,304 30,634 30,361 47,042 55,095Investment income from public enterprises 2/ 13,711 14,234 20,702 17,867 30,343 30,343Corporate tax revenue 1,554 434 4,562 7,431 8,939 14,322Other nontax revenue 3,480 4,636 5,370 5,063 7,760 10,430
Total expenditure 36,103 50,768 67,147 65,713 84,727 96,083Current 28,270 32,755 49,751 44,733 50,923 55,609
Wages and salaries 7,940 6,657 12,993 15,627 14,875 18,779Total interest payments 1,880 1,898 2,006 2,099 1,850 1,579
Interest on domestic debt 814 835 865 585 765 455Interest on foreign debt 1,065 1,063 1,141 1,514 1,085 1,124
Foreign grants 324 449 1,978 364 1,448 354Goods and services /3 16,555 22,738 31,661 21,971 26,368 29,626Other current expenditures 4/ 1,572 1,013 1,113 4,672 6,382 5,271
Development expenditure 7,833 18,013 17,396 20,980 33,804 40,474
Net lending 0 0 0 0 0 0
Overall balance 18,962 14,917 18,915 6,744 33,063 45,269Nonhydrocarbon fiscal balance -17,358 -31,464 -36,514 -46,134 -37,685 -40,988
Financing -18,962 -14,917 -18,915 -6,744 -33,063 -45,269Domestic financing (net) 5/ -1,622 -4,420 -5,143 ... -4,303 -1,791
Central bank (net) -179 137 -376 ... 0 0Transfer to QCB 0 -1,820 0 ... -1,000 -1,000Commercial banks (net) 5/ -1,443 -2,736 -4,767 ... -3,303 -791
Claims on government -1,695 -2,438 -2,501 ... 1,037 2,488Government deposits -252 299 2,265 ... 4,340 3,279
Domestic non-banks 0 0 0 ... 0 0Foreign financing (net) -17,340 -10,497 -13,772 ... -28,760 -43,477
Government foreign assets (increase -) 6/ -16,101 -9,582 -12,087 ... -27,075 -41,930External borrowing (net) -1,239 -915 -1,685 ... -1,685 -1,547
Drawing 0 0 0 ... 0 0Repayment 1,239 915 1,685 ... 1,685 1,547
Memorandum items:Current balance 7/ 26,795 32,930 36,311 27,724 66,867 85,743Current nonhydrocarbon balance 8/ -9,525 -13,451 -19,118 -14,372 -3,881 -514Total government debt 32,120 29,850 27,398 ... 23,843 24,783
Government external debt 13,614 12,699 11,014 ... 9,330 7,782Government gross domestic debt 18,506 17,151 16,384 ... 14,513 17,001Government net domestic debt 10,184 8,902 7,973 ... 3,460 1,608
(net of deposits)External debt service/total 4.2 3.0 3.3 ... 2.4 1.9
revenue (in percent)Nominal GDP (on a fiscal year basis) 125,275 167,719 220,035 285,932 285,932 378,106
Table 2a. Qatar: Summary of Government Finance, 2004/05–2008/09 1/(In million Qatari riyals)
27
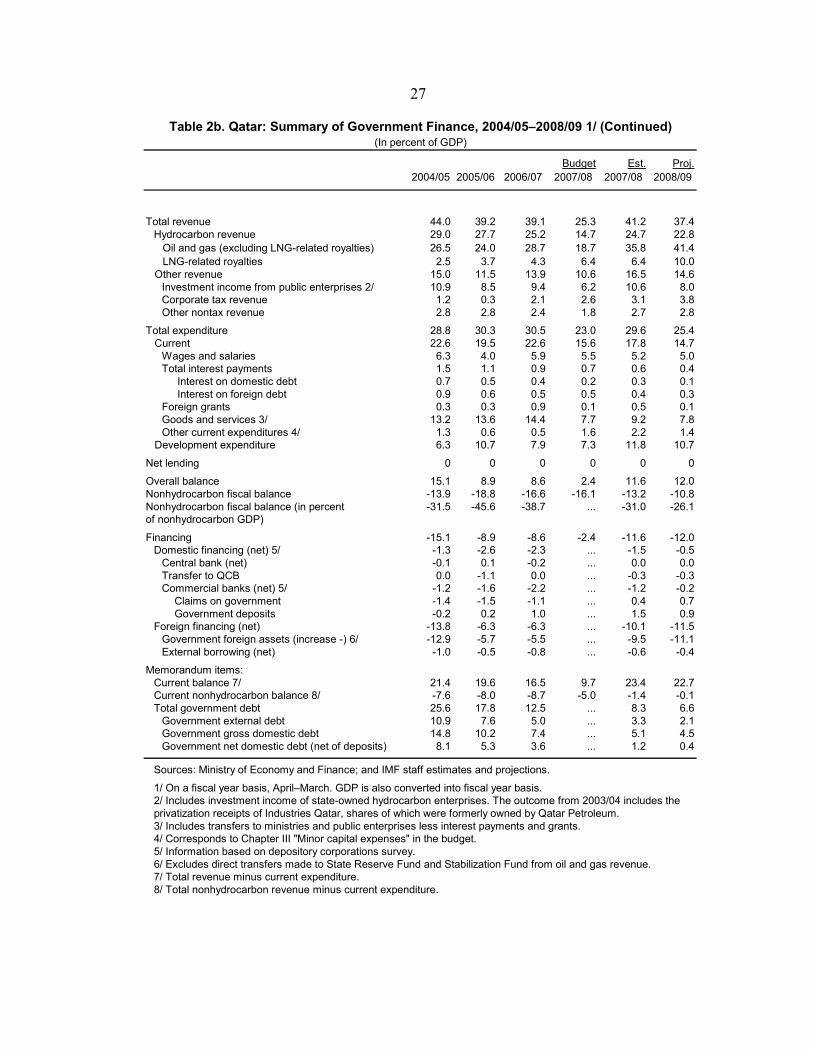
Budget Est. Proj.2004/05 2005/06 2006/07 2007/08 2007/08 2008/09
Total revenue 44.0 39.2 39.1 25.3 41.2 37.4Hydrocarbon revenue 29.0 27.7 25.2 14.7 24.7 22.8 Oil and gas (excluding LNG-related royalties) 26.5 24.0 28.7 18.7 35.8 41.4 LNG-related royalties 2.5 3.7 4.3 6.4 6.4 10.0
Other revenue 15.0 11.5 13.9 10.6 16.5 14.6Investment income from public enterprises 2/ 10.9 8.5 9.4 6.2 10.6 8.0Corporate tax revenue 1.2 0.3 2.1 2.6 3.1 3.8Other nontax revenue 2.8 2.8 2.4 1.8 2.7 2.8
Total expenditure 28.8 30.3 30.5 23.0 29.6 25.4 Current 22.6 19.5 22.6 15.6 17.8 14.7
Wages and salaries 6.3 4.0 5.9 5.5 5.2 5.0Total interest payments 1.5 1.1 0.9 0.7 0.6 0.4
Interest on domestic debt 0.7 0.5 0.4 0.2 0.3 0.1 Interest on foreign debt 0.9 0.6 0.5 0.5 0.4 0.3
Foreign grants 0.3 0.3 0.9 0.1 0.5 0.1Goods and services 3/ 13.2 13.6 14.4 7.7 9.2 7.8Other current expenditures 4/ 1.3 0.6 0.5 1.6 2.2 1.4
Development expenditure 6.3 10.7 7.9 7.3 11.8 10.7
Net lending 0 0 0 0 0 0
Overall balance 15.1 8.9 8.6 2.4 11.6 12.0Nonhydrocarbon fiscal balance -13.9 -18.8 -16.6 -16.1 -13.2 -10.8Nonhydrocarbon fiscal balance (in percent -31.5 -45.6 -38.7 ... -31.0 -26.1of nonhydrocarbon GDP)
Financing -15.1 -8.9 -8.6 -2.4 -11.6 -12.0Domestic financing (net) 5/ -1.3 -2.6 -2.3 ... -1.5 -0.5
Central bank (net) -0.1 0.1 -0.2 ... 0.0 0.0Transfer to QCB 0.0 -1.1 0.0 ... -0.3 -0.3Commercial banks (net) 5/ -1.2 -1.6 -2.2 ... -1.2 -0.2
Claims on government -1.4 -1.5 -1.1 ... 0.4 0.7 Government deposits -0.2 0.2 1.0 ... 1.5 0.9Foreign financing (net) -13.8 -6.3 -6.3 ... -10.1 -11.5
Government foreign assets (increase -) 6/ -12.9 -5.7 -5.5 ... -9.5 -11.1External borrowing (net) -1.0 -0.5 -0.8 ... -0.6 -0.4
Memorandum items:Current balance 7/ 21.4 19.6 16.5 9.7 23.4 22.7Current nonhydrocarbon balance 8/ -7.6 -8.0 -8.7 -5.0 -1.4 -0.1Total government debt 25.6 17.8 12.5 ... 8.3 6.6
Government external debt 10.9 7.6 5.0 ... 3.3 2.1Government gross domestic debt 14.8 10.2 7.4 ... 5.1 4.5Government net domestic debt (net of deposits) 8.1 5.3 3.6 ... 1.2 0.4
Sources: Ministry of Economy and Finance; and IMF staff estimates and projections.
1/ On a fiscal year basis, April–March. GDP is also converted into fiscal year basis.2/ Includes investment income of state-owned hydrocarbon enterprises. The outcome from 2003/04 includes the privatization receipts of Industries Qatar, shares of which were formerly owned by Qatar Petroleum.3/ Includes transfers to ministries and public enterprises less interest payments and grants.4/ Corresponds to Chapter III "Minor capital expenses" in the budget.5/ Information based on depository corporations survey.6/ Excludes direct transfers made to State Reserve Fund and Stabilization Fund from oil and gas revenue. 7/ Total revenue minus current expenditure.8/ Total nonhydrocarbon revenue minus current expenditure.
(In percent of GDP)Table 2b. Qatar: Summary of Government Finance, 2004/05–2008/09 1/ (Continued)

28
Proj. Proj.2004 2005 2006 Sep-07 2007 Sep-08 2008 2009
Net foreign assets 31,812 47,820 61,250 53,856 61,444 79,696 73,964 80,538 QCB 12,225 16,580 19,694 22,592 34,747 39,154 39,154 49,315 Assets 1/ 12,233 16,643 19,715 22,787 35,500 39,221 39,221 49,382 Liabilities 8 63 21 195 753 67 67 67 Commercial banks 19,587 31,240 41,557 31,264 26,696 40,542 34,810 31,223 Assets 27,756 41,648 66,311 78,389 88,961 109,847 97,587 104,047 Liabilities 8,169 10,407 24,754 47,125 62,265 69,305 62,776 72,823
Net domestic assets 23,419 31,081 48,923 83,779 92,292 115,977 139,200 196,943Claims on government (net) 11,172 8,265 3,728 2,714 -207 2,644 -2,527 2,575
Claims 2/ 18,967 17,122 17,238 14,905 13,822 19,135 16,586 18,245Deposits 3/ 7,796 8,857 13,510 12,192 14,029 16,490 19,113 15,670
Domestic credit 38,170 61,079 88,986 135,647 147,944 199,686 215,136 283,840 Claims on public sector (net) 15,791 14,496 13,612 30,517 27,253 35,849 30,678 37,978
Claims on public enterprises 4/ 4,619 6,231 9,884 27,804 27,460 33,205 33,205 35,403Claims on private sector 33,551 54,847 79,102 107,843 120,485 166,482 181,932 248,437
Other items (net) -25,923 -38,262 -43,791 -54,581 -55,446 -86,354 -73,410 -89,472
Broad money 55,231 78,901 110,173 137,635 153,735 195,672 213,164 277,480 Money 16,373 25,657 33,492 38,947 43,499 61,265 67,881 96,523 Currency in circulation 2,594 2,866 3,959 4,251 4,487 5,755 6,177 7,979 Demand deposits 13,779 22,791 29,533 34,696 39,012 55,510 61,704 88,544 Quasi-money 38,858 53,244 76,681 98,688 110,237 134,408 145,283 180,958 Savings and time deposits 22,822 28,409 39,622 53,345 69,508 84,010 100,767 131,202 Foreign currency deposits 16,036 24,836 37,059 45,344 40,729 50,398 44,517 49,756
Net foreign assets 23.2 50.3 28.1 ... 0.3 48.0 20.4 8.9Net domestic assets 17.6 32.7 57.4 ... 88.6 38.4 50.8 41.5
Domestic credit 30.1 60.0 45.7 ... 66.3 47.2 45.4 31.9Claims on public enterprises 28.3 34.9 58.6 ... 177.8 19.4 20.9 6.6Claims on private sector 30.4 63.5 44.2 ... 52.3 54.4 51.0 36.6
Broad money 20.8 42.9 39.6 ... 39.5 42.2 38.7 30.2Savings and time deposits 4.2 24.5 39.5 ... 75.4 57.5 45.0 30.2
Memorandum items:Net claims on public enterprises -5,747 -8,399 -11,630 ... -8,642 -10,195 -13,659 -14,563Velocity of broad money (to total GDP) 2.09 1.96 1.88 ... 1.68 1.88 1.73 1.47Velocity of broad money (to nonhydrocarbon GDP) 0.95 0.79 0.80 ... 0.80 0.76 0.70 0.67
Sources: Qatar Central Bank (QCB); and IMF staff estimates and projections.
1/ Excludes QCB's foreign currency deposits with local commercial banks.2/ Includes government borrowing on behalf of public enterprises in 2001.3/ Includes foreign and local currency deposits. 4/ Nonfinancial enterprises with government share.
Table 3. Qatar: Depository Corporations Survey, 2005–09(In million Qatari riyals)

29
Est. Proj. Proj. 2005 2006 2007 2008 2009
Current account 14,100 16,113 21,951 37,457 13,964 In percent of GDP 33.2 28.3 30.9 37.1 12.4
Trade balance 17,058 20,272 24,754 42,573 20,073Exports 26,122 35,083 44,578 72,931 59,539
Hydrocarbon 22,861 31,200 39,888 66,285 54,342Crude oil 12,843 16,299 19,181 27,412 14,908LNG 5,200 8,471 10,524 14,719 22,968Propane, butane 781 1,156 1,617 4,951 3,804Condensates 2,757 3,733 6,569 15,946 10,651Refined petroleum products 1,279 1,541 1,997 3,256 2,011
Non-hydrocarbon 3,261 3,883 4,690 6,646 5,196Petrochemicals 1,958 2,265 2,632 4,399 2,739Others 1,303 1,618 2,058 2,247 2,457
Imports -9,064 -14,811 -19,824 -30,358 -39,466Non-LNG/QP goods -7,349 -5,773 -12,912 -21,560 -28,901LNG related -880 -2,956 -3,577 -4,364 -5,280QP project-related imports -835 -2,635 -3,335 -4,435 -5,285
Services (net) -924 -2,763 -542 -1,314 -541Income (net) 542 2,341 1,524 1,856 2,171
Receipts 1/ 1,302 3,402 3,740 4,072 4,537Payments 2/ -760 -1,061 -2,216 -2,216 -2,366
Transfers (net) -2,576 -3,736 -3,785 -5,658 -7,738Of which: workers remittances -3,006 -3,914 -3,165 -4,548 -5,954
Capital account -753 -991 -1,131 -1,491 -1,857Financial account -6,325 -8,598 -14,670 -34,756 -9,316
Direct Investment, net 3/ 2,500 3,500 4,700 6,700 7,200
Portfolio borrowing, net 3/ 1,225 234 794 -137 254Assets -769 -784 -780 -1,248 -1,248Liabilities 1,994 1,018 1,574 1,111 1,502
Government bonds -157 -297 -219 -283 -1,283Public enterprise bonds 2,151 1,315 1,792 1,394 -219
Other investment (net) -4,925 -7,286 -10,883 -18,227 -18,865Assets -9,721 -12,747 -17,915 -25,903 -23,170
Trade credits 382 428 606 2,029 -1,648Government external assets 4/ -10,102 -13,175 -18,521 -27,932 -21,522
Liabilities 5/ 4,795 5,461 7,032 7,675 4,305
Commercial banks, net -3,201 -2,834 4,083 -2,229 985Other capital, net -1,924 -2,212 -13,363 -20,863 1,110
Errors and omissions -5,825 -5,668 -2,015 0 0
Overall balance 1,196 855 4,136 1,211 2,791Change in QCB net foreign assets -1,196 -855 -4,136 -1,211 -2,791
Sources: Qatar Central Bank; and IMF staff estimates and projections.
1/ Includes staff estimates for QIA.2/ Includes staff estimates for commercial banks.3/ Added to the national presentation for alignment with accepted BOP norms.4/ Estimates.5/ Primarily bank borrowing by Qatar Petroleum and affiliates.
Table 4. Qatar: Balance of Payments, 2005–09(In million U.S. dollars)

30
Est.2003 2004 2005 2006 2007
External solvency indicatorsREER (CPI based - end of period) -5.7 -0.1 7.1 8.3 3.2Total debt (in billion U.S. dollars, including commercial banks) 13.4 15.0 20.4 29.8 47.2
Of which: LNG-related 2.6 2.4 6.7 10.9 15.8Total debt (in percent of GDP) 56.7 47.3 48.1 52.4 66.4Debt service/exports of goods and services 23.8 8.7 7.5 7.5 5.9
Public sector solvency indicatorsGovernment gross domestic debt/GDP 22.3 14.8 10.2 7.4 5.1Government net domestic debt/GDP 1/ 32.9 20.6 14.0 9.2 4.9Government external debt/GDP 2/ 15.9 10.9 7.6 5.0 3.3Total debt service/total revenue 11.9 8.7 8.0 7.2 3.0Interest payments/total revenue 6.3 3.4 2.9 2.3 1.6Hydrocarbon revenue/total revenue 64.3 66.0 70.6 64.4 60.1
External liquidity indicators (in million U.S. dollars)Central bank net reserves 2,873 3,358 4,555 5,410 9,546
In months of imports 4.1 3.2 2.5 2.4 2.9Commercial banks net foreign assets (in million U.S. dollars) 4,220 5,381 8,583 11,417 7,334
Foreign assets 5,348 7,625 11,442 18,217 24,440Foreign liabilities 1,127 2,244 2,859 6,801 17,106
Crude oil exports/total exports 55.4 51.2 54.1 50.9 47.5Financial sector indicators
Foreign currency deposits/total deposits 26.8 30.5 32.7 34.9 27.3Net domestic credit (percent change) 5.3 18.5 40.5 33.7 59.3Private sector credit (percent change) 27.3 30.4 63.5 44.2 52.3Net domestic credit/GDP 48.6 42.7 44.9 44.7 57.1Private credit/total assets of banks 33.8 36.5 42.1 41.7 40.9
Market assessment/financial market indicators Stock market index (end of period) 3,947 6,494 11,053 7,133 9,580
Moody's investor services A3 A3 A1 Aa2 Aa2Standard and Poor's 3/ A+ A+ A+ AA- AA-
Sources: Qatari authorities; Bloomberg; and IMF staff estimates and projections.
1/ Net of government deposits with resident banks.2/ Fiscal year basis.3/ Long-term foreign currency rating.
Table 5. Qatar: Vulnerability Indicators, 2003–07(In percent; unless otherwise indicated)
31
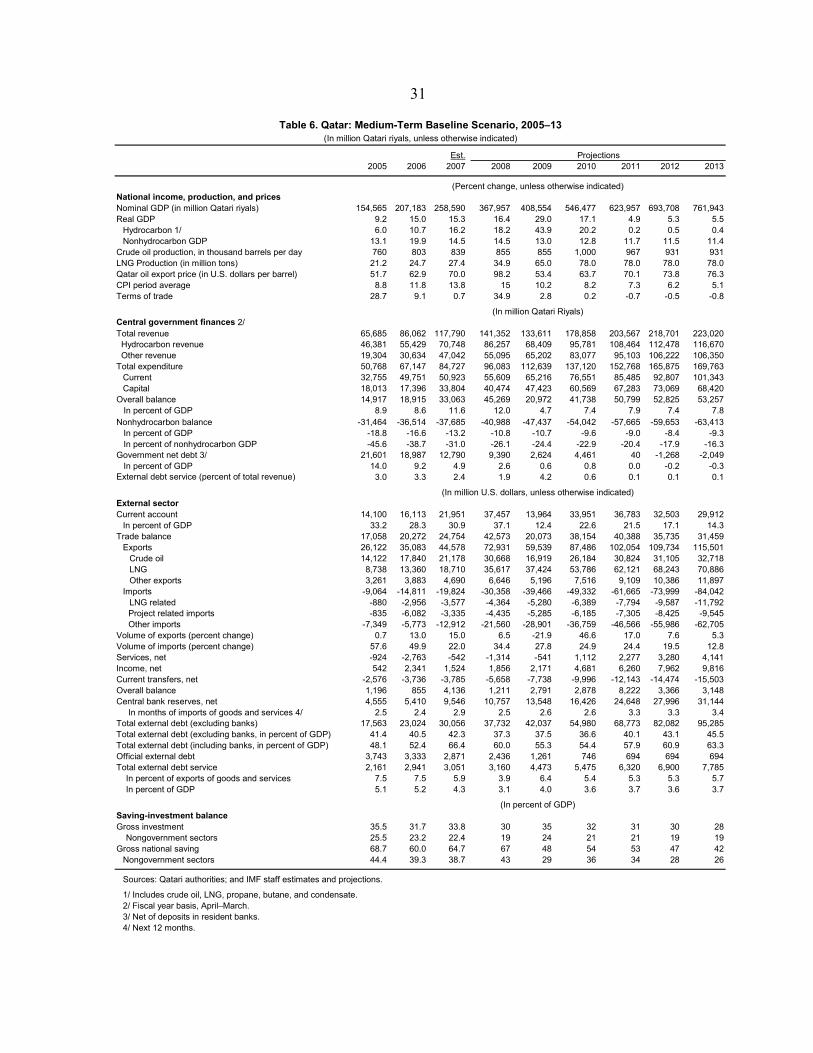
Est.2005 2006 2007 2008 2009 2010 2011 2012 2013
National income, production, and pricesNominal GDP (in million Qatari riyals) 154,565 207,183 258,590 367,957 408,554 546,477 623,957 693,708 761,943Real GDP 9.2 15.0 15.3 16.4 29.0 17.1 4.9 5.3 5.5
Hydrocarbon 1/ 6.0 10.7 16.2 18.2 43.9 20.2 0.2 0.5 0.4Nonhydrocarbon GDP 13.1 19.9 14.5 14.5 13.0 12.8 11.7 11.5 11.4
Crude oil production, in thousand barrels per day 760 803 839 855 855 1,000 967 931 931LNG Production (in million tons) 21.2 24.7 27.4 34.9 65.0 78.0 78.0 78.0 78.0Qatar oil export price (in U.S. dollars per barrel) 51.7 62.9 70.0 98.2 53.4 63.7 70.1 73.8 76.3CPI period average 8.8 11.8 13.8 15 10.2 8.2 7.3 6.2 5.1Terms of trade 28.7 9.1 0.7 34.9 2.8 0.2 -0.7 -0.5 -0.8
Central government finances 2/Total revenue 65,685 86,062 117,790 141,352 133,611 178,858 203,567 218,701 223,020 Hydrocarbon revenue 46,381 55,429 70,748 86,257 68,409 95,781 108,464 112,478 116,670 Other revenue 19,304 30,634 47,042 55,095 65,202 83,077 95,103 106,222 106,350Total expenditure 50,768 67,147 84,727 96,083 112,639 137,120 152,768 165,875 169,763
Current 32,755 49,751 50,923 55,609 65,216 76,551 85,485 92,807 101,343Capital 18,013 17,396 33,804 40,474 47,423 60,569 67,283 73,069 68,420
Overall balance 14,917 18,915 33,063 45,269 20,972 41,738 50,799 52,825 53,257 In percent of GDP 8.9 8.6 11.6 12.0 4.7 7.4 7.9 7.4 7.8Nonhydrocarbon balance -31,464 -36,514 -37,685 -40,988 -47,437 -54,042 -57,665 -59,653 -63,413 In percent of GDP -18.8 -16.6 -13.2 -10.8 -10.7 -9.6 -9.0 -8.4 -9.3 In percent of nonhydrocarbon GDP -45.6 -38.7 -31.0 -26.1 -24.4 -22.9 -20.4 -17.9 -16.3Government net debt 3/ 21,601 18,987 12,790 9,390 2,624 4,461 40 -1,268 -2,049 In percent of GDP 14.0 9.2 4.9 2.6 0.6 0.8 0.0 -0.2 -0.3External debt service (percent of total revenue) 3.0 3.3 2.4 1.9 4.2 0.6 0.1 0.1 0.1
External sectorCurrent account 14,100 16,113 21,951 37,457 13,964 33,951 36,783 32,503 29,912
In percent of GDP 33.2 28.3 30.9 37.1 12.4 22.6 21.5 17.1 14.3Trade balance 17,058 20,272 24,754 42,573 20,073 38,154 40,388 35,735 31,459
Exports 26,122 35,083 44,578 72,931 59,539 87,486 102,054 109,734 115,501Crude oil 14,122 17,840 21,178 30,668 16,919 26,184 30,824 31,105 32,718LNG 8,738 13,360 18,710 35,617 37,424 53,786 62,121 68,243 70,886Other exports 3,261 3,883 4,690 6,646 5,196 7,516 9,109 10,386 11,897
Imports -9,064 -14,811 -19,824 -30,358 -39,466 -49,332 -61,665 -73,999 -84,042LNG related -880 -2,956 -3,577 -4,364 -5,280 -6,389 -7,794 -9,587 -11,792
Project related imports -835 -6,082 -3,335 -4,435 -5,285 -6,185 -7,305 -8,425 -9,545 Other imports -7,349 -5,773 -12,912 -21,560 -28,901 -36,759 -46,566 -55,986 -62,705Volume of exports (percent change) 0.7 13.0 15.0 6.5 -21.9 46.6 17.0 7.6 5.3Volume of imports (percent change) 57.6 49.9 22.0 34.4 27.8 24.9 24.4 19.5 12.8Services, net -924 -2,763 -542 -1,314 -541 1,112 2,277 3,280 4,141Income, net 542 2,341 1,524 1,856 2,171 4,681 6,260 7,962 9,816Current transfers, net -2,576 -3,736 -3,785 -5,658 -7,738 -9,996 -12,143 -14,474 -15,503Overall balance 1,196 855 4,136 1,211 2,791 2,878 8,222 3,366 3,148Central bank reserves, net 4,555 5,410 9,546 10,757 13,548 16,426 24,648 27,996 31,144 In months of imports of goods and services 4/ 2.5 2.4 2.9 2.5 2.6 2.6 3.3 3.3 3.4Total external debt (excluding banks) 17,563 23,024 30,056 37,732 42,037 54,980 68,773 82,082 95,285Total external debt (excluding banks, in percent of GDP) 41.4 40.5 42.3 37.3 37.5 36.6 40.1 43.1 45.5Total external debt (including banks, in percent of GDP) 48.1 52.4 66.4 60.0 55.3 54.4 57.9 60.9 63.3Official external debt 3,743 3,333 2,871 2,436 1,261 746 694 694 694Total external debt service 2,161 2,941 3,051 3,160 4,473 5,475 6,320 6,900 7,785 In percent of exports of goods and services 7.5 7.5 5.9 3.9 6.4 5.4 5.3 5.3 5.7 In percent of GDP 5.1 5.2 4.3 3.1 4.0 3.6 3.7 3.6 3.7
Saving-investment balanceGross investment 35.5 31.7 33.8 30 35 32 31 30 28 Nongovernment sectors 25.5 23.2 22.4 19 24 21 21 19 19Gross national saving 68.7 60.0 64.7 67 48 54 53 47 42
Nongovernment sectors 44.4 39.3 38.7 43 29 36 34 28 26
Sources: Qatari authorities; and IMF staff estimates and projections.
1/ Includes crude oil, LNG, propane, butane, and condensate.2/ Fiscal year basis, April–March.3/ Net of deposits in resident banks.4/ Next 12 months.
Table 6. Qatar: Medium-Term Baseline Scenario, 2005–13
(In million U.S. dollars, unless otherwise indicated)
(In percent of GDP)
(In million Qatari riyals, unless otherwise indicated)
Projections
(Percent change, unless otherwise indicated)
(In million Qatari Riyals)
INTERNATIONAL MONETARY FUND
QATAR
2008 Article IV Consultation
Informational Annex
Prepared by the Middle East and Central Asia Department
December 30, 2008
Contents Page
I. Fund Relations........................................................................................................................2 II. Relations with the World Bank Group..................................................................................4 III. Statistical Issues ...................................................................................................................5

2
ANNEX I. QATAR: FUND RELATIONS
(As of November 30, 2008)
I. Membership Status: Joined 09/08/72; Article VIII, 06/04/73 II. General Resources Account: SDR million Percent Quota Quota 263.80 100.00 Fund holdings of currency 230.48 87.37 Reserve position in Fund 33.32 12.63 III. SDR Department: SDR million Percent Allocation Net cumulative allocation 12.82 100.00 Holdings 29.33 228.76 IV. Outstanding Purchases and Loans: None V. Projected Obligations to the Fund: None VI. Implementation of HIPC Initiative: Not applicable
VII. Safeguards Assessments: Not applicable
VIII. Exchange Arrangements:
The Qatari riyal has been pegged to the U.S. dollar at QR 3.64 = $1.00 since July 2002, following an unofficial peg that was in effect since June 1980. Qatar has accepted the obligations under Article VIII, Sections 2, 3, and 4(a) and maintains an exchange system that is free of restrictions on the making of payments and transfers for current international transactions. Qatar maintains exchange restrictions for security reasons, based on UN Security Council Resolutions, that have been notified to the Fund for approval under the procedures set forth in Executive Board Decision No. 144-(52/51).
IX. Article IV Consultation:
The discussions for the previous Article IV consultation took place in Doha in June 2007 and August 2007 and in Washington DC at the time of the Annual Meetings in October 2007. The Staff Report and its supplement were discussed by the Executive Board on November 6, 2007. Qatar moved to a 12-month Article IV consultation cycle in 2007. Subsequently, a staff visit was conducted in May 2008.
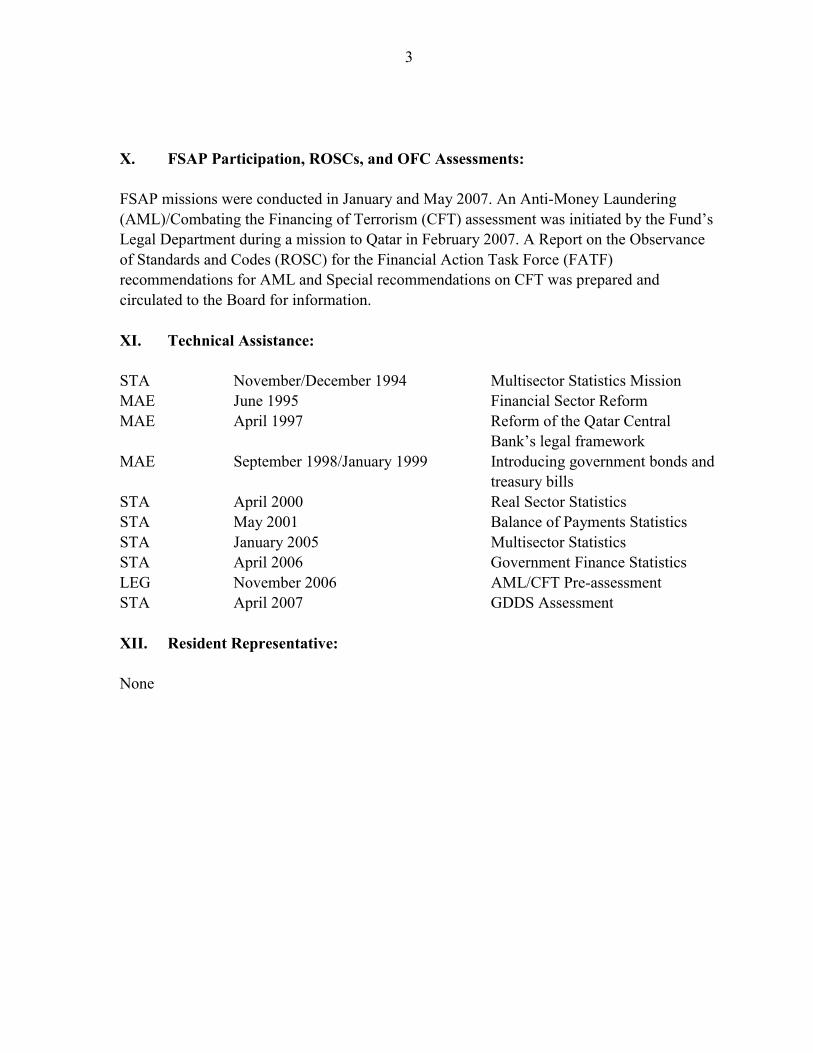
3
X. FSAP Participation, ROSCs, and OFC Assessments: FSAP missions were conducted in January and May 2007. An Anti-Money Laundering (AML)/Combating the Financing of Terrorism (CFT) assessment was initiated by the Fund’s Legal Department during a mission to Qatar in February 2007. A Report on the Observance of Standards and Codes (ROSC) for the Financial Action Task Force (FATF) recommendations for AML and Special recommendations on CFT was prepared and circulated to the Board for information. XI. Technical Assistance: STA November/December 1994 Multisector Statistics Mission MAE June 1995 Financial Sector Reform MAE April 1997 Reform of the Qatar Central Bank’s legal framework MAE September 1998/January 1999 Introducing government bonds and treasury bills STA April 2000 Real Sector Statistics STA May 2001 Balance of Payments Statistics STA January 2005 Multisector Statistics STA April 2006 Government Finance Statistics LEG November 2006 AML/CFT Pre-assessment STA April 2007 GDDS Assessment XII. Resident Representative: None

4
ANNEX II. QATAR: RELATIONS WITH THE WORLD BANK GROUP
(As of December 15, 2008)
Strategic Cooperation Program (SCP)
The program of strategic cooperation with Qatar is recent and is based on ad hoc requests from the government. Currently, the Bank is holding a series of consultations with the Government of Qatar on developing a long-term program in the areas of strategic planning, pension system review, small- and medium-enterprise support, and capital markets development. The Bank’s main counterpart is the General Secretariat for Development Planning (GSDP), but there is an ongoing dialog with other entities including the Qatar Central Bank and the Qatar Foundation. Ongoing Projects
• Labor Market Strategy (LMS) Implementation
The World Bank conducted a labor market survey to help identify the main characteristics of the labor market in Qatar, and prepared an LMS that included an assessment and analysis of the labor force and a review of labor laws, regulations, and other institutional factors affecting labor allocation and utilization. The results of the LMS study were presented at a national symposium in April 9, 2006. Currently, the Bank is assisting the government in the implementation of the study’s action plan. • Moving Qatar Toward a Knowledge-Based Economy
In 2007, the World Bank Institute (WBI) conducted a study on Knowledge Economy (KE) Development in Qatar; the results of the study were discussed at several high-level workshops and were well received by the government. Currently, the Bank is supporting implementation of the KE strategy, in the form of the proposed Knowledge-Based Economy Campaign (KBEC). Completed Projects
• Public Transport Sector Study (FY03)
• Evaluation of Qatar’s Payments System (FY05)
• A macroeconomic modeling workshop (November 16–17, 2005)
• Workshop on “Partnering for Value, Innovation and Job Creation: PPPs in the GCC” (May 16–17, 2006)
• Investment Climate Workshop (February 2004)

5
ANNEX III. QATAR: STATISTICAL ISSUES
Data reporting
Data provision has some shortcomings, but is broadly adequate for surveillance. There remains substantial scope for improving the frequency, timeliness, and coverage of economic data. Recently, the Qatar Statistics Authority (QSA) was formed, to spearhead the development of statistics in Qatar.
Following technical assistance from the Fund, the timeliness and quality of monetary statistics have improved. The improvements include a better classification of the government sector and regular publication of analytical accounts of banks. Some steps have been taken to strengthen the external current account data, particularly data on trade and services, and there has been an improvement in the estimation of workers’ remittances. On national accounts, steps have been taken to publish a wider range of aggregates, including private consumption expenditure and national saving. In addition, detailed data on oil, gas, and medium- and long-term external debt have been provided to staff missions.
While monetary data are reported to the Fund’s Statistics Department (STA) on a regular basis, there are long lags in the reporting of price indices and other real sector statistics for publication in the International Financial Statistics (IFS). Furthermore, international trade details are reported only sporadically for publication in the Direction of Trade Statistics. Public finance data were reported for publication in the 2008 GFS Yearbook, but are not reported for publication in IFS. The April/May 2007 General Data Dissemination System (GDDS) assessment mission was provided with 2005 balance of payments data; however the data was not sufficiently detailed to present in the format of the Balance of Payments Manual, 5/e (BPM5) for inclusion in IFS and the Balance of Payments Statistics Yearbook. Data dissemination Qatar has been a participant of the GDDS since December 2005. A 2007 GDDS mission assessed dissemination practices relative to the requirements of the Special Data Dissemination Standard (SDDS) for coverage, periodicity, and timeliness, and identified major milestones that Qatar would have to reach in order to graduate to the SDDS. To enhance data dissemination practices, the mission assisted the authorities in developing a National Summary Data Page (NSDP) and an Advance Release Calendar (ARC). Overall, the mission found that significant progress had been made since 2005. Nevertheless, significant gaps in certain datasets still remain to be addressed.

6
Sectoral data issues
Real sector statistics
National accounts statistics are compiled broadly in line with the concepts and definitions of the System of National Accounts 1993 (1993 SNA). However, key aggregates are limited to annual GDP estimates by economic activity and by expenditure at current and constant prices, and quarterly estimates of GDP at current prices. The base year for constant price data is 2001. The accuracy of the GDP estimates in current prices is undermined by the lack of comprehensive source data. The constant price estimates do not follow sound deflation techniques, mostly due to the lack of reliable price indices and volume indicators. Informal activities in the construction sector are estimated and included in the GDP estimates. Apart from this, no adjustments are made for non-observed and/or illegal activities.
Since 2002, the Department of Statistics (now QSA) has compiled a quarterly consumer price index (CPI), which broadly follows international methodological standards. The index measures price changes for goods and services consumed by all households in the country. The CPI list of representative goods and services covers about 1100 items for which prices are collected; the frequency of price collection depends on the item. Prices for vegetables, fruit, and fish are collected at least once a week, but most prices are collected quarterly. The eights have been derived from a household budget survey (HBS) that was undertaken during October 2000–September 2001. Prices are collected from about 400 outlets, with the selection of outlets based on purposive sampling. The CPI is usually completed about one month after the end of the reference quarter. No explicit adjustments are made for quality changes; however, when a new product replaces an old one, the method of overlapping is applied. Missing prices are replaced with prices for the preceding quarter. The elementary indices are calculated using geometric means, in accordance with current international recommendations. Employment statistics are compiled and disseminated annually and whenever a census is conducted. The last two censuses were conducted in 1997 and in 2004, and the next census is expected to be conducted in 2010. The annual data are disseminated within six months after the end of the reference year. Preliminary census-based employment data are first published within 9 months after the census. Hydrocarbon sector
Detailed oil and gas sector data are provided to staff by the Ministry of Energy and Petroleum and Qatar Petroleum (QP)1 at the time of the Article IV consultation discussions. In addition, the authorities also present information about medium-term plans for oil and gas, liquefied natural gas (LNG), financing, and other QP-related industrial activities.
1 Formerly Qatar General Petroleum Corporation.

7
Government finance statistics
Government budget data should be presented according to Government Finance Statistics Manual 2001 (GFSM) guidelines, including greater detail on major expenditure and non-oil revenue categories. In addition, the data on financing items should be consistent with the data on the public sector in the depository corporations survey and the balance of payments. The country has a number of—largely commercial—public sector entities that should not be mixed with the central government accounts. The authorities have reported annual data for 2004–07 for publication in the Government Finance Statistics Yearbook. Monthly and quarterly data are not reported for publication in IFS. The 2007 GDDS mission found that the Ministry of Finance (now Ministry of Economy and Finance) was giving priority to the implementation of the recommendations of the GFSM, with the objective of starting the dissemination of complete annual government finance tables. A preliminary set of fiscal data in GFSM format was provided to the 2008 Article IV mission. Monetary and financial statistics
Data for the Qatar Central Bank (QCB) and commercial banks are generally timely and of high quality. The QCB uses the Standardized Reporting Forms to report monthly monetary data to STA for publication in IFS and the IFS Supplement. Monthly and quarterly data are also published in the Quarterly Statistics Bulletin. External sector statistics
The 2007 GDDS assessment mission found that the QCB had made some progress in the compilation of balance of payments statistics. International Transactions Reporting System collection forms have been expanded and reporting forms introduced to collect data on current account and financial account transactions for the major oil and gas companies and affiliates. The results from these new report forms are being reviewed to assess the quality of the data collected. However, serious omissions remain in the balance of payments (BOP) statistics, owing to the absence of timely and reliable source data. There is no compilation for inward or outward direct investment, there are no portfolio investment data compiled for the nonbank sector, and errors and omissions remain large. Moreover, official statistics seem to underestimate total imports. Source data for government external assets are not provided to the QCB. Although an estimate for flows of government external assets, based on the budget data, is included in the balance of payments, no information is provided on the government’s stock of external assets, which makes it difficult to estimate the level of investment income with any degree of confidence. In addition, there is an inconsistency in coverage in flows and stocks of official reserves. In the BOP, flows of official reserves include changes in the stock of QCB reserves and an
8
estimate for the change in stock of the external assets of the government. However, the stock of official reserves published in IFS includes only the stock of QCB reserves. Progress in implementing recommendations of technical assistance missions has been steady but slow. The authorities have been working with STA to report their BOP data in BPM5 format, but there has been insufficient detailed information available to complete this process. No official information is published on the amount or breakdown of external debt. However, detailed data on the country’s medium- and long-term external debt are provided to missions during the Article IV consultation discussions. In recent years, Qatar has issued several international bonds and some of the proceeds were used to retire other external debt. It is, therefore, important to improve the flow of information on external debt and its maturity profile.
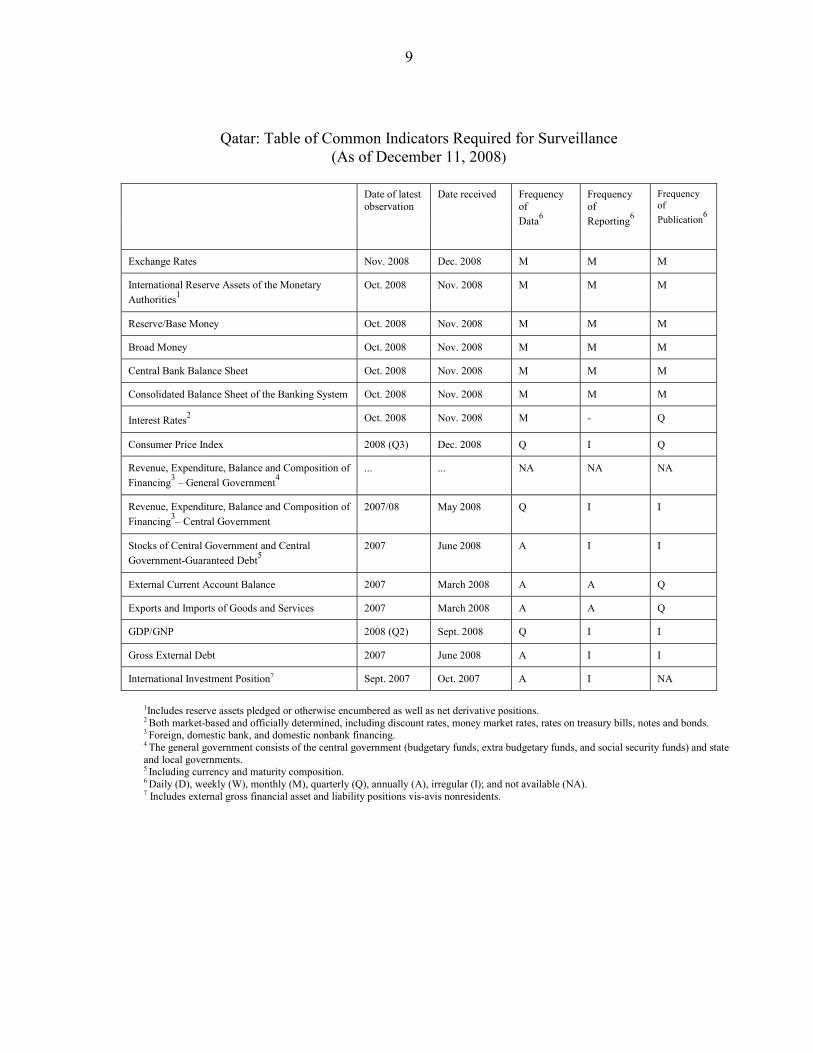
9
Qatar: Table of Common Indicators Required for Surveillance (As of December 11, 2008)
Date of latest observation
Date received Frequency of Data6
Frequency of Reporting6
Frequency of Publication6
Exchange Rates Nov. 2008 Dec. 2008 M M M
International Reserve Assets of the Monetary Authorities1
Oct. 2008 Nov. 2008 M M M
Reserve/Base Money Oct. 2008 Nov. 2008 M M M
Broad Money Oct. 2008 Nov. 2008 M M M
Central Bank Balance Sheet Oct. 2008 Nov. 2008 M M M
Consolidated Balance Sheet of the Banking System Oct. 2008 Nov. 2008 M M M
Interest Rates2 Oct. 2008 Nov. 2008 M - Q
Consumer Price Index 2008 (Q3) Dec. 2008 Q I Q
Revenue, Expenditure, Balance and Composition of Financing3 – General Government4
... ... NA NA NA
Revenue, Expenditure, Balance and Composition of Financing3– Central Government
2007/08 May 2008 Q I I
Stocks of Central Government and Central Government-Guaranteed Debt5
2007 June 2008 A I I
External Current Account Balance 2007 March 2008 A A Q
Exports and Imports of Goods and Services 2007 March 2008 A A Q
GDP/GNP 2008 (Q2) Sept. 2008 Q I I
Gross External Debt 2007 June 2008 A I I
International Investment Position7 Sept. 2007 Oct. 2007 A I NA
1Includes reserve assets pledged or otherwise encumbered as well as net derivative positions. 2 Both market-based and officially determined, including discount rates, money market rates, rates on treasury bills, notes and bonds. 3 Foreign, domestic bank, and domestic nonbank financing. 4 The general government consists of the central government (budgetary funds, extra budgetary funds, and social security funds) and state and local governments. 5 Including currency and maturity composition. 6 Daily (D), weekly (W), monthly (M), quarterly (Q), annually (A), irregular (I); and not available (NA). 7 Includes external gross financial asset and liability positions vis-avis nonresidents.
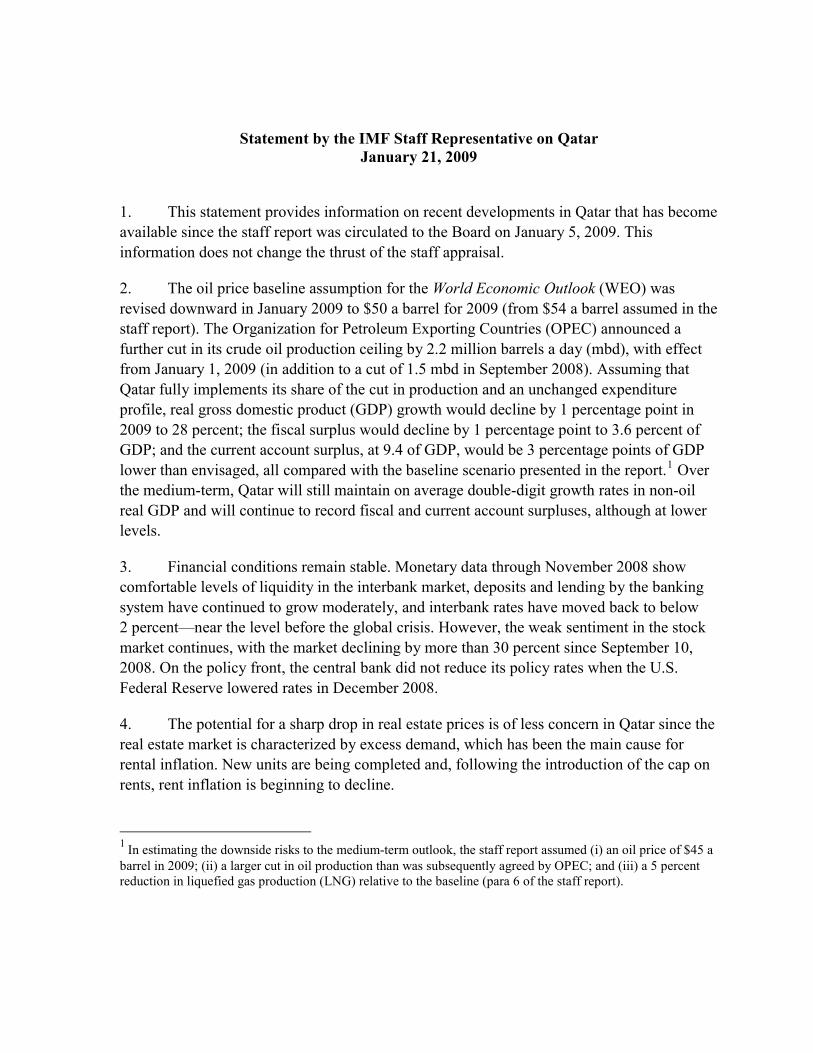
Statement by the IMF Staff Representative on Qatar January 21, 2009
1. This statement provides information on recent developments in Qatar that has become available since the staff report was circulated to the Board on January 5, 2009. This information does not change the thrust of the staff appraisal.
2. The oil price baseline assumption for the World Economic Outlook (WEO) was revised downward in January 2009 to $50 a barrel for 2009 (from $54 a barrel assumed in the staff report). The Organization for Petroleum Exporting Countries (OPEC) announced a further cut in its crude oil production ceiling by 2.2 million barrels a day (mbd), with effect from January 1, 2009 (in addition to a cut of 1.5 mbd in September 2008). Assuming that Qatar fully implements its share of the cut in production and an unchanged expenditure profile, real gross domestic product (GDP) growth would decline by 1 percentage point in 2009 to 28 percent; the fiscal surplus would decline by 1 percentage point to 3.6 percent of GDP; and the current account surplus, at 9.4 of GDP, would be 3 percentage points of GDP lower than envisaged, all compared with the baseline scenario presented in the report.1 Over the medium-term, Qatar will still maintain on average double-digit growth rates in non-oil real GDP and will continue to record fiscal and current account surpluses, although at lower levels.
3. Financial conditions remain stable. Monetary data through November 2008 show comfortable levels of liquidity in the interbank market, deposits and lending by the banking system have continued to grow moderately, and interbank rates have moved back to below 2 percent—near the level before the global crisis. However, the weak sentiment in the stock market continues, with the market declining by more than 30 percent since September 10, 2008. On the policy front, the central bank did not reduce its policy rates when the U.S. Federal Reserve lowered rates in December 2008.
4. The potential for a sharp drop in real estate prices is of less concern in Qatar since the real estate market is characterized by excess demand, which has been the main cause for rental inflation. New units are being completed and, following the introduction of the cap on rents, rent inflation is beginning to decline.
1 In estimating the downside risks to the medium-term outlook, the staff report assumed (i) an oil price of $45 a barrel in 2009; (ii) a larger cut in oil production than was subsequently agreed by OPEC; and (iii) a 5 percent reduction in liquefied gas production (LNG) relative to the baseline (para 6 of the staff report).

2
5. On December 30, 2008, the Heads of the Gulf Cooperation Council (GCC) approved a draft accord for the monetary union and a system governing the monetary council. The agreement must now be signed by the countries' heads of state for final approval, and is expected to come into force by the end of 2009. The GCC countries continue to meet all the convergence criteria, except for Qatar where the inflation rate is higher than the benchmark.2,3
2 Fiscal deficits not to exceed 3 percent of GDP; public debt to GDP ratios not to exceed 60 percent; inflation rates not to exceed the GCC weighted average of inflation rates plus two percentage points; short-term interest rates not to exceed the average of the lowest three interest rates amongst the member countries plus two percentage points; and foreign exchange reserves to cover at least 4 months of imports.
3 Data for September 2008 show that the average inflation rate for the first three quarters of 2008 was about 15.5 percent.

Public Information Notice (PIN) No. 09/09 International Monetary Fund
700 19th Street, NW Washington, D. C. 20431 USA
FOR IMMEDIATE RELEASE January 28, 2009 IMF Executive Board Concludes 2008 Article IV Consultation with Qatar
On January 21, 2009, the Executive Board of the International Monetary Fund (IMF) concluded the Article IV consultation with Qatar.1 Background Qatar’s macroeconomic performance was strong in 2008, notwithstanding the global financial crisis. Overall real gross domestic product (GDP) growth is estimated at 16 percent in 2008, driven by expansions in the production of oil, liquefied natural gas (LNG), and condensates, and a strong performance in manufacturing, construction, and financial services. However, inflation remained high at 15 percent, reflecting high rent and food prices, as well as large public outlays and a rapid expansion in private sector credit. The overall fiscal surplus (12 percent of GDP in FY2007–08, April-March) reflected a large increase in oil revenue and a slowdown in expenditure relative to FY2006–07. The external current account recorded a large surplus (about 37 percent of GDP) despite the almost 50 percent growth in imports (mainly capital goods). The global turmoil has had a limited impact so far on the banking system. Recent assessments indicate that potential stresses are manageable. At the same time, weak sentiment has weighed on shares and the equity market declined (30 percent), although the underlying fundamentals remain strong. Qatar is expected to perform at least as strong in 2009, driven by a rapid expansion in LNG production (and related industries) and in investments aimed at economic diversification.
1 Under Article IV of the IMF's Articles of Agreement, the IMF holds bilateral discussions with members, usually every year. A staff team visits the country, collects economic and financial information, and discusses with officials the country's economic developments and policies. On return to headquarters, the staff prepares a report, which forms the basis for discussion by the Executive Board. At the conclusion of the discussion, the Managing Director, as Chairman of the Board, summarizes the views of Executive Directors, and this summary is transmitted to the country's authorities.
Inflation is projected to fall in 2009, as a result of the passthrough of declining international prices for food and raw materials and a slower increase in domestic rents owing to a larger supply of low- and middle-income housing. The fiscal and external current accounts are projected to remain in surplus in 2009, despite the lower oil prices. Qatar’s medium-term outlook is positive, with continuing strong growth, gradually declining inflation, and fiscal and external current account surpluses. The main risks to this outlook include a prolonged global financial crisis, persistently low oil prices, a large decline in real estate prices, reduced availability of financing for projects, and an escalation in geopolitical tensions. Executive Board Assessment Executive Directors agreed with the thrust of the staff appraisal. They commended the Qatari authorities for the impressive macroeconomic performance in recent years, which has strengthened the economy’s resilience to the current global financial crisis and economic downturn. They noted that prudent macroeconomic policies have contributed to booming investment and exports, resulting in double-digit growth in both the hydrocarbon and non-hydrocarbon sectors and in sizeable external and fiscal surpluses, which leave Qatar’s economy well placed to withstand shocks. Directors considered the medium-term outlook favorable, and noted that the key challenges facing the authorities are to lower Qatar’s high rate of inflation, continue to shield the economy from the global financial crisis, ensure that rapid credit growth does not undermine bank soundness, and diversify the economy to reduce the dependence on hydrocarbon production and exports. They welcomed the authorities’ continued commitment to sound macroeconomic management to achieve these objectives. Directors agreed with the assessment that inflationary pressures should ease gradually because of lower food and raw material prices and an increase in the supply of residential and commercial properties. They encouraged the authorities to avoid the distortionary effects of price and rent controls, noting that these measures should at best be temporary. Directors welcomed the authorities’ intention to moderate fiscal expansion and broaden the non-oil revenue base over the medium term. They supported the emphasis on building capacity in infrastructure and, easing supply bottlenecks, while containing government current expenditure to reduce inflation. Directors agreed that, should the global crisis persist or external financing difficulties arise, a temporary increase in government investment spending would be warranted to support demand without undermining the effort to contain inflation. Directors noted that Qatar’s banking system is well-capitalized, liquid, and profitable. They welcomed the central bank’s proactive stance to maintain confidence in the financial system and encouraged the authorities to continue to monitor closely financial sector developments, implement international standards against money laundering and terrorism financing, and upgrade financial sector surveillance capabilities. Directors supported the central bank’s use of stress testing of financial institutions and endorsed the development of an early warning system to identify financial sector vulnerabilities. They also welcomed the consultation between the

central bank and the government on the issuance of government bonds to improve liquidity forecasting and debt management. Executive Directors welcomed the progress made so far in establishing a unified regulator for financial services. They agreed on implementing the unified regulator gradually, preferably after proposals for improving the international financial regulatory framework have been agreed upon. In the interim, coordination should be enhanced among existing regulators and further improvements to the regulatory framework should be continued. Directors agreed that the peg to the U.S. dollar continues to provide a credible anchor for monetary policy and maintain external stability. They noted the staff’s finding that the level of the Qatari riyal appears to be in line with economic fundamentals. They welcomed the authorities’ commitment to the GCC Monetary Union, and the decision to launch the Monetary Council by the end of 2009. Directors commended the establishment of the Qatar Statistics Authority. They urged the authorities to continue improving the quality of economic statistics, particularly data on national income, the balance of payments, and the international investment position.
Public Information Notices (PINs) form part of the IMF's efforts to promote transparency of the IMF's views and analysis of economic developments and policies. With the consent of the country (or countries) concerned, PINs are issued after Executive Board discussions of Article IV consultations with member countries, of its surveillance of developments at the regional level, of post-program monitoring, and of ex post assessments of member countries with longer-term program engagements. PINs are also issued after Executive Board discussions of general policy matters, unless otherwise decided by the Executive Board in a particular case.

Qatar: Selected Economic and Financial Indicators, 2004–08
2004 2005 2006 2007 2008
Production and Prices
Real GDP (in percent per annum) 17.7 9.2 15.0 15.3 16.4 Hydrocarbon 1/ 12.5 6.0 10.7 16.2 18.2 Nonhydrocarbon GDP 24.6 13.1 19.9 25.7 30.6Nominal GDP (in billion U.S. dollars 31.7 42.5 56.9 71.0 101.1Consumer price index (period average) 6.8 8.8 11.8 13.8 15.1 (In percent of GDP on fiscal year basis) 2/ Public Finance Total revenue 44.0 39.2 39.1 41.2 37.4 Hydrocarbon revenue 29.0 27.7 25.2 24.7 22.8 Other revenue 15.0 11.5 13.9 16.5 14.6Total expenditure and net landing 28.8 30.3 30.5 29.6 25.4 Current expenditure, of which: 22.6 19.5 22.6 17.8 14.7 Wages and salaries 6.3 4.0 5.9 5.2 5.0 Capital expenditure 6.3 10.7 7.9 11.8 10.7Overall fiscal balance (deficit -) 15.1 8.9 8.6 11.6 12.0 (Annual change in percent) Money Broad money 20.8 42.9 39.6 39.5 38.7Claims on private sector 30.4 63.5 44.2 52.3 51.0 (In million U.S. dollars, unless otherwise stated) External Sector Exports of goods and services, of which: 20,658 28,709 39,276 51,340 81,117 Crude oil and refined petroleum products 9,702 14,122 17,840 21,178 30,668 LNG and related exports 6,554 8,738 13,360 18,710 35,617Imports of goods and services -8,316 -12,575 -21,767 -27,128 -39,858Current account 7,100 14,100 16,113 21,951 37,457 In percent of GDP 22.4 33.2 28.3 30.9 37.1Central Bank reserves, net 3,358 4,555 5,410 9,546 10,757 In months of imports of goods and services 3/ 3.2 2.5 2.4 2.9 2.5Exchange rates (riyals/U.S. dollars 3.64 3.64 3.64 3.64 3.64Real effective exchange rate (percent change) -01 7.1 8.3 3.2 …
Sources: Data provided by the authorities; and IMF staff estimates and projections.
1/ Staff estimates; include crude oil, LNG, propane, butane, and condensate. 2/ Fiscal year begins in April. 3/ Next 12 months.