Embed Size (px)
Citation preview
Construction Material Testing/Inspection Environmental Geotechnical Engineering Services
Orange County 17782 Georgetown Lane Huntington Beach, California 92647 Tele: (714) 375-3830 Fax: (714) 375-3831
San Bernardino County 14163 Arrow Boulevard Fontana, California 92335 Tele: (909) 284-9200 Fax: (909) 284-9201
GEOTECHNICAL REPORT ALAMITOS BEACH CONCESSIONS BUILDINGS
780 EAST SHORELINE DRIVE LONG BEACH, CALIFORNIA
AESCO PROJECT NO. 20171705-E5129
Prepared for:
RA-DA 7523 Norton Avenue
West Hollywood, CA 90046
Attention: Mr. Rania Alomar, AIA
Prepared By:
AESCO 17782 Georgetown Lane
Huntington Beach, California 92647 Adam Chamaa, MSCE, P.E., Manager
May 30, 2017

TABLE OF CONTENTS Project No. 20171705-E5129
AESCO i
Section 1 Introduction ..................................................................................................................... 1-1
Section 2 Field Investigation and Laboratory Testing ................................................................. 2-1
2.1 Field Investigation ................................................................................... 2-1 2.2 Laboratory Testing ................................................................................... 2-1
Section 3 Site Conditions ............................................................................................................... 3-1
3.1 Regional Geologic Setting ....................................................................... 3-1 3.2 Site and Subsurface Conditions ............................................................... 3-1
Section 4 Conclusions and Recommendations ............................................................................ 4-1
4.1 Seismic Design......................................................................................... 4-1 4.2 Liquefaction Potential .............................................................................. 4-1 4.3 Foundation Recommendations................................................................. 4-2
4.3.1 Shallow Foundations .................................................................... 4-2 4.4 Concrete Slab on Grade ........................................................................... 4-3 4.5 Concrete Pavement .................................................................................. 4-4 4.6 Site Preparation and Earthwork ................................................................ 4-4 4.7 Soil Corrosivity ........................................................................................ 4-5 4.8 Utility Trenches ....................................................................................... 4-7 4.9 Construction Observations and Field Testing .......................................... 4-8
Section 5 General Conditions ........................................................................................................ 5-1
5.1 Limitations ............................................................................................... 5-1
Appendix
Site Plan
Logs of Borings B-1 through B-5
Laboratory Test Data
Seismic Design Data
Liquefaction Analysis

Project No. 20171705-E5129
SECTION ONE Introduction
AESCO 1-1
1. Section 1 ONE Introduction
Geotechnical Report Alamitos Beach Concessions Buildings
780 East Shoreline Drive Long Beach, CA
This report authorized by RA-DA, based on our proposal dated February 8, 2016 presents the
results of a geotechnical investigation performed by AESCO for the proposed replacement of the
existing beach concessions building with a new approximately 3,000 square foot, single-story
structure. The new structure will have a full service commercial kitchen, a dining area,
restrooms, storage, and a rooftop dining deck. Two additional structures; public restrooms and a
storage building will also be constructed about 1,500 feet west of the proposed new concession
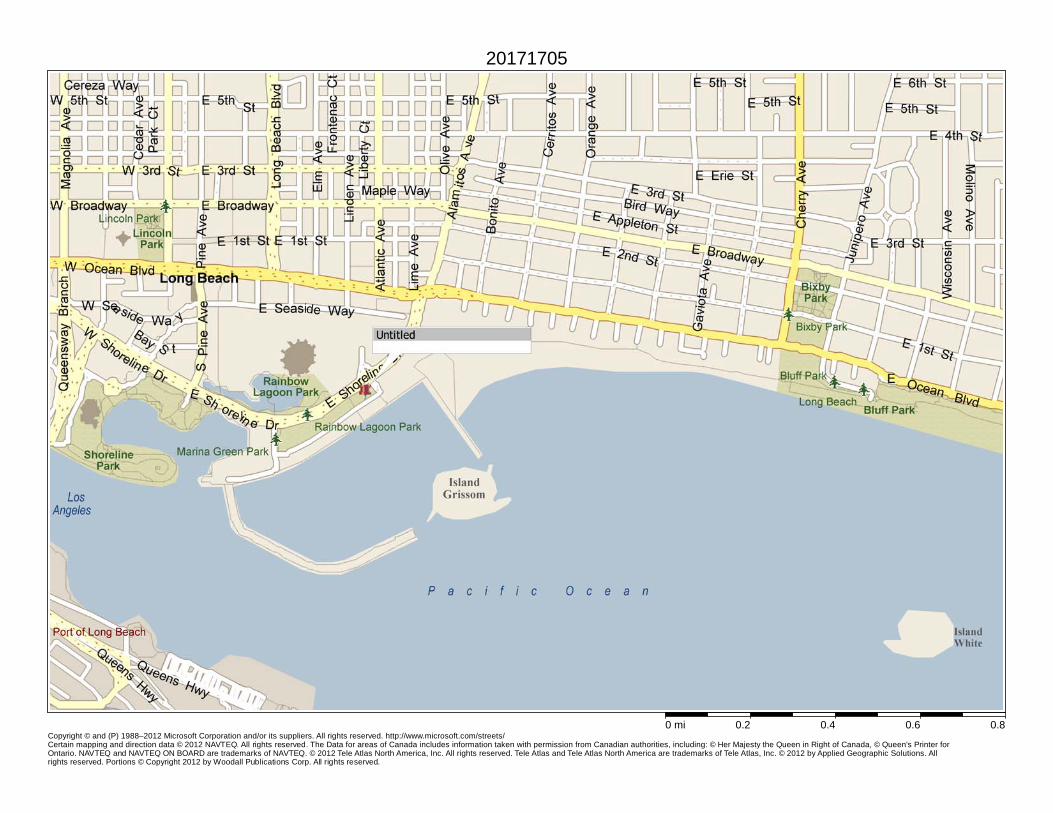
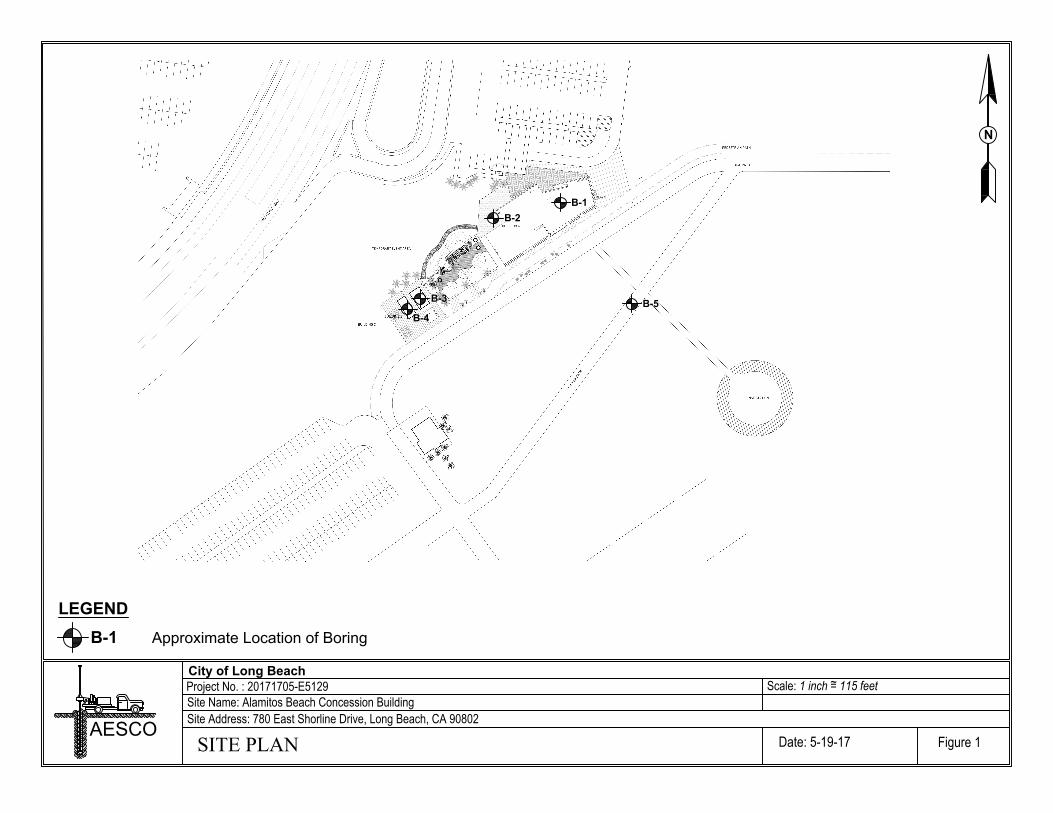
structure. A layout of the proposed structures are shown on the Site Plan, Figure 1.
The purpose of this study was to provide geotechnical recommendations for design of the new
structures. The scope of our services included the following:
Coordinating site access for the field investigation;
Mark the site for underground utilities with USA;
Performing geotechnical drilling and sampling at the site;
Performing laboratory testing of representative samples;
Conducting a seismic hazards screening;
Performing engineering analyses; and
Preparing this report.
This report summarizes our findings and presents geotechnical recommendations for design of
the new structures.
Project No. 20171705-E5129
SECTION TWO Field Investigation and Laboratory Testing
AESCO 2-1
2. Section 2 TWO Field Investigation and Laboratory Testing
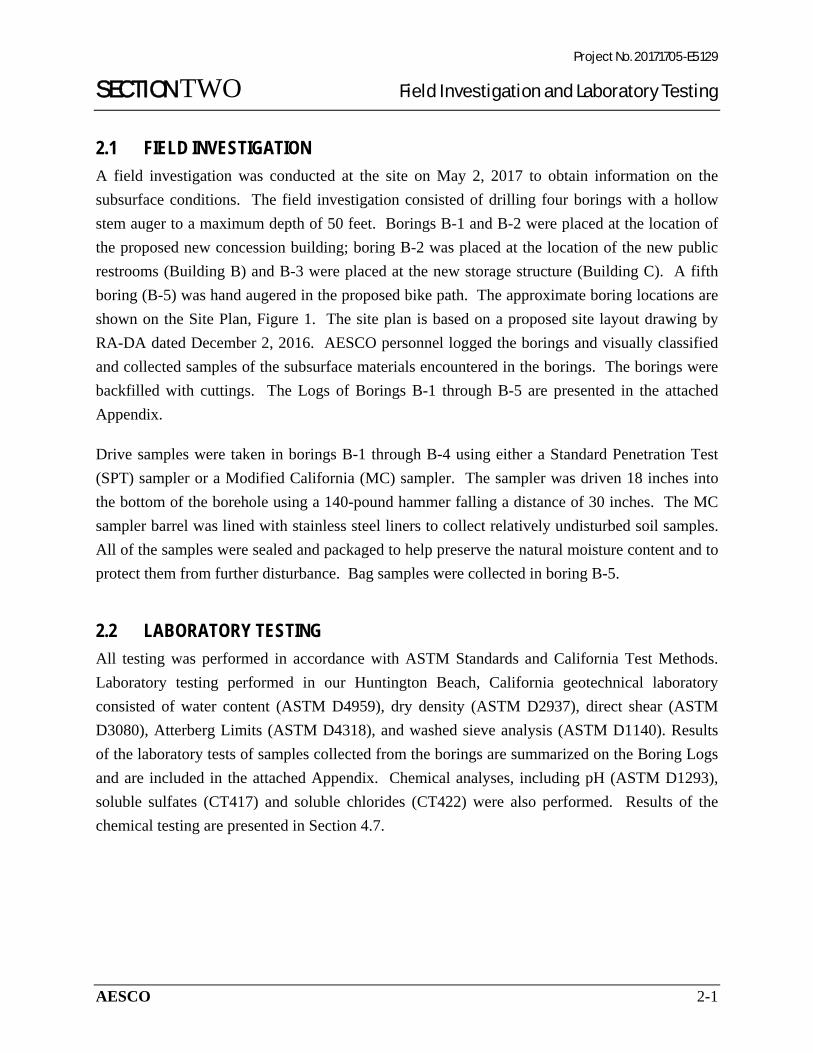
2.1 FIELD INVESTIGATION
A field investigation was conducted at the site on May 2, 2017 to obtain information on the
subsurface conditions. The field investigation consisted of drilling four borings with a hollow
stem auger to a maximum depth of 50 feet. Borings B-1 and B-2 were placed at the location of
the proposed new concession building; boring B-2 was placed at the location of the new public
restrooms (Building B) and B-3 were placed at the new storage structure (Building C). A fifth
boring (B-5) was hand augered in the proposed bike path. The approximate boring locations are
shown on the Site Plan, Figure 1. The site plan is based on a proposed site layout drawing by
RA-DA dated December 2, 2016. AESCO personnel logged the borings and visually classified
and collected samples of the subsurface materials encountered in the borings. The borings were
backfilled with cuttings. The Logs of Borings B-1 through B-5 are presented in the attached
Appendix.
Drive samples were taken in borings B-1 through B-4 using either a Standard Penetration Test
(SPT) sampler or a Modified California (MC) sampler. The sampler was driven 18 inches into
the bottom of the borehole using a 140-pound hammer falling a distance of 30 inches. The MC
sampler barrel was lined with stainless steel liners to collect relatively undisturbed soil samples.
All of the samples were sealed and packaged to help preserve the natural moisture content and to
protect them from further disturbance. Bag samples were collected in boring B-5.
2.2 LABORATORY TESTING
All testing was performed in accordance with ASTM Standards and California Test Methods.
Laboratory testing performed in our Huntington Beach, California geotechnical laboratory
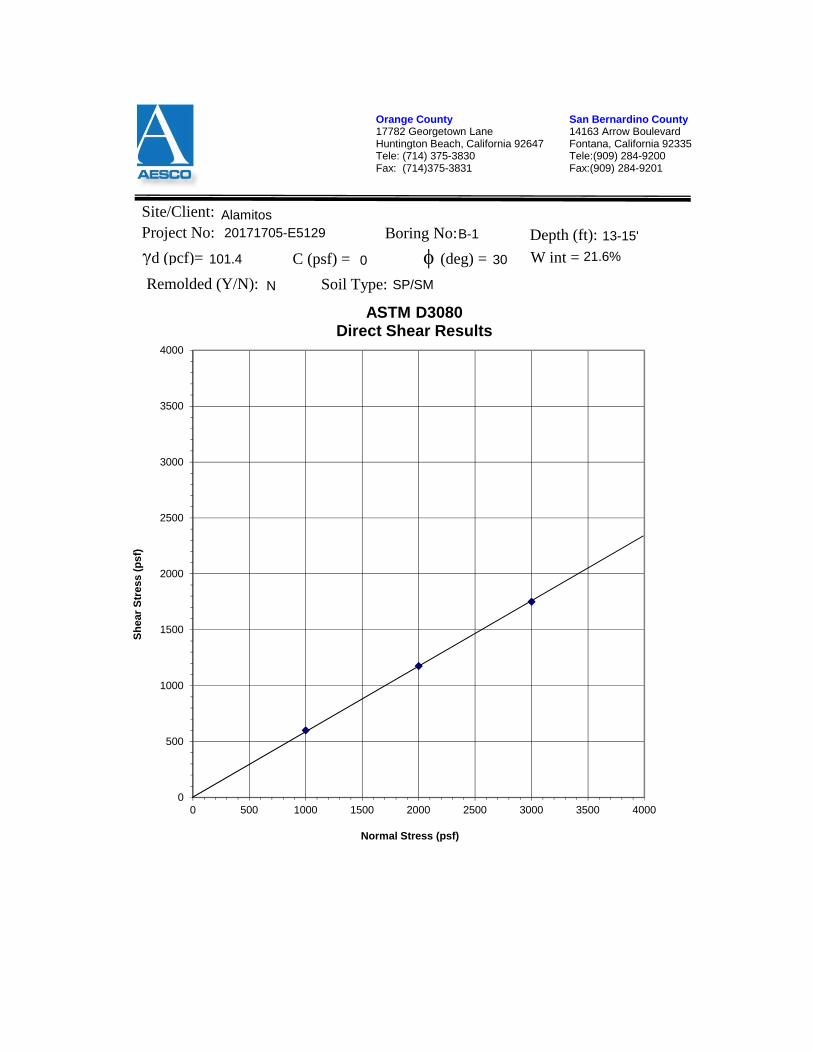
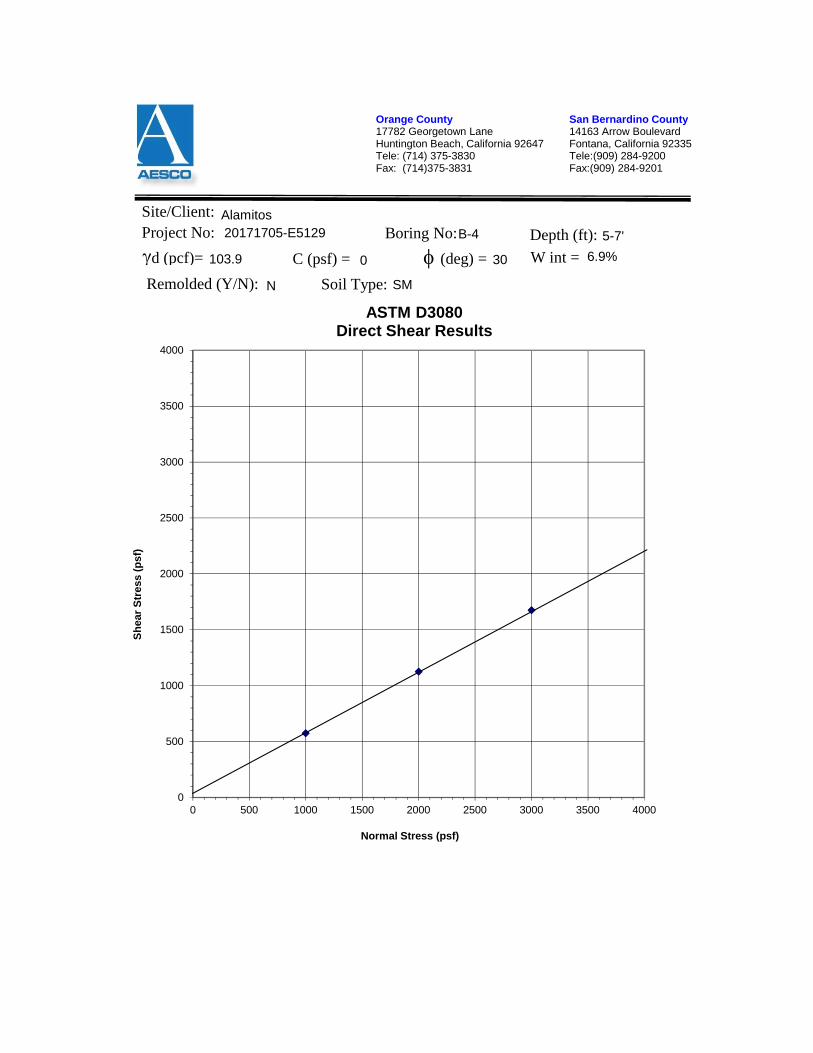
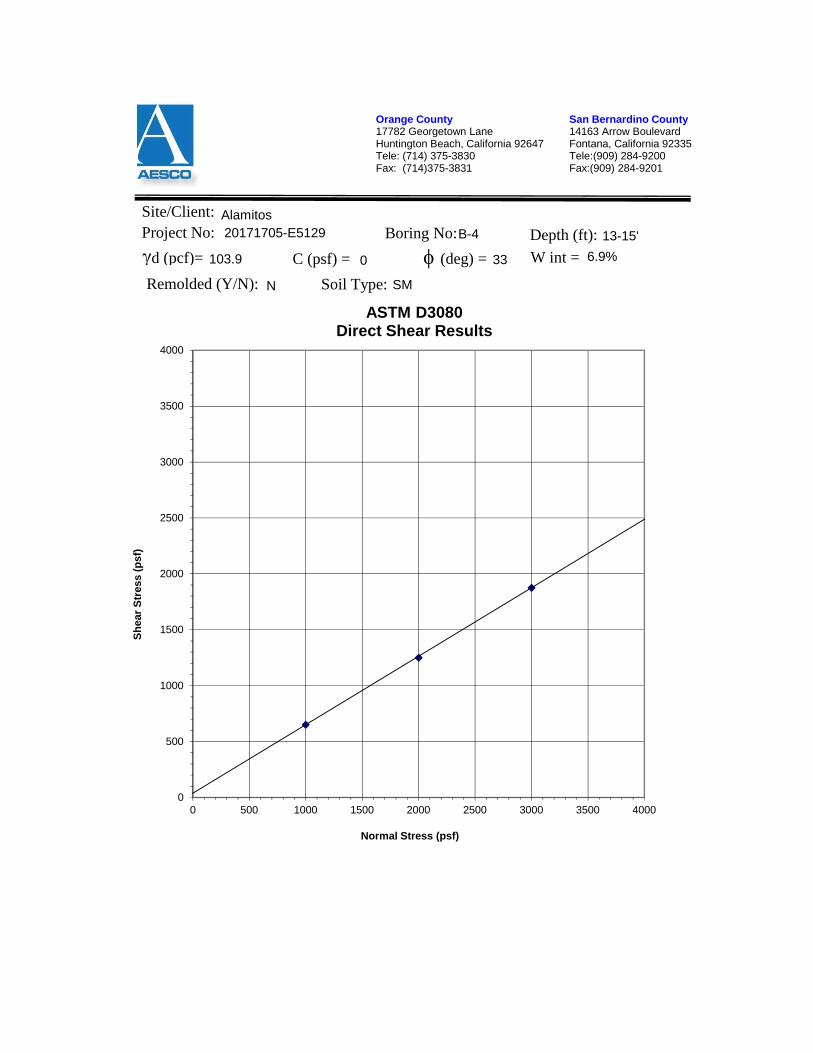
consisted of water content (ASTM D4959), dry density (ASTM D2937), direct shear (ASTM
D3080), Atterberg Limits (ASTM D4318), and washed sieve analysis (ASTM D1140). Results
of the laboratory tests of samples collected from the borings are summarized on the Boring Logs
and are included in the attached Appendix. Chemical analyses, including pH (ASTM D1293),
soluble sulfates (CT417) and soluble chlorides (CT422) were also performed. Results of the
chemical testing are presented in Section 4.7.
Project No. 20171705-E5129
SECTION THREE Site Conditions
AESCO 3-1
3. Section 3 THREE Site Conditions
3.1 REGIONAL GEOLOGIC SETTING
The site is located within the Los Angeles Basin, near the northern boundary of the Peninsular
Ranges Physiographic Province. The Peninsular Ranges Physiographic Province is characterized
by northwest-trending topographic structures, including the Newport Inglewood Fault Zone and
the axis of the Los Angeles Basin. The Santa Monica Mountains, located north of the site, are the
southernmost of the east-west trending mountain ranges that comprise the Transverse Ranges
Physiographic Province.
The Los Angeles basin is a northwest-trending alluviated lowland plain that is about 50 miles
long and 20 miles wide. The Los Angeles basin has been subdivided into four structural blocks
based on contrasting or partly contrasting rocks, separated by major zones of faulting or flexure
in the basement rocks (Yerkes, et. al., 1965). These structural blocks are designated the
southwestern, northwestern, central, and northeastern blocks.
3.2 SITE AND SUBSURFACE CONDITIONS Currently the site is occupied by the existing concession stand and a grass area. The site is
relatively flat. Existing underground utilities may be present within the site boundary.
The material encountered in boring B-1 consisted of medium dense silty sand to a depth of 7
feet, loose to medium dense sand/silty sand to a depth of 18 feet, stiff to very stiff sandy silt to a
depth of 28 feet, medium dense silty sand to a depth of 38 feet, and medium stiff to stiff silty
clay with sand to the total depth drilled of 50 feet below the existing ground surface. The
material encountered in boring B-2 consisted of medium dense silty sand to a depth of 7 feet,
medium dense sand to a depth of 18 feet and medium dense silty sand with interbedded sandy
silt layers to the total depth drilled of 35 feet. Medium dense silty sand was encountered to a
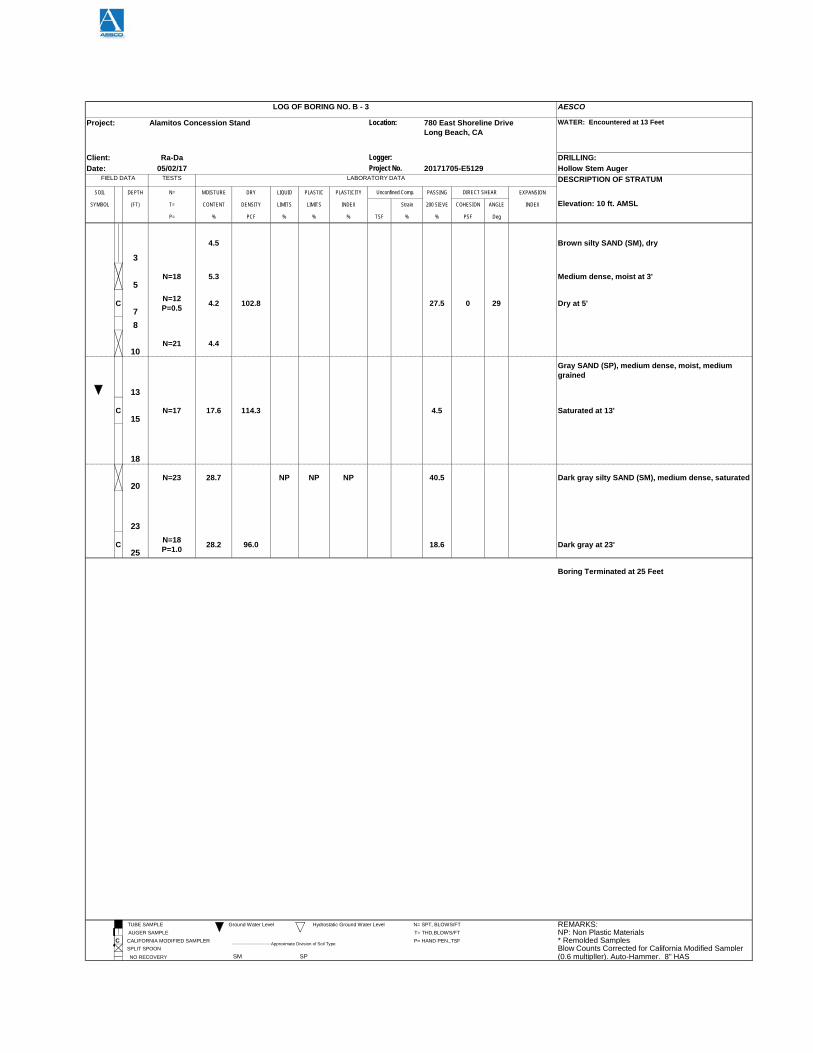
depth of 10 feet in boring B-3 which was underlain by medium dense sand to a depth of 18 feet
and medium dense silty sand to the total depth drilled of 25 feet. Medium dense silty sand was
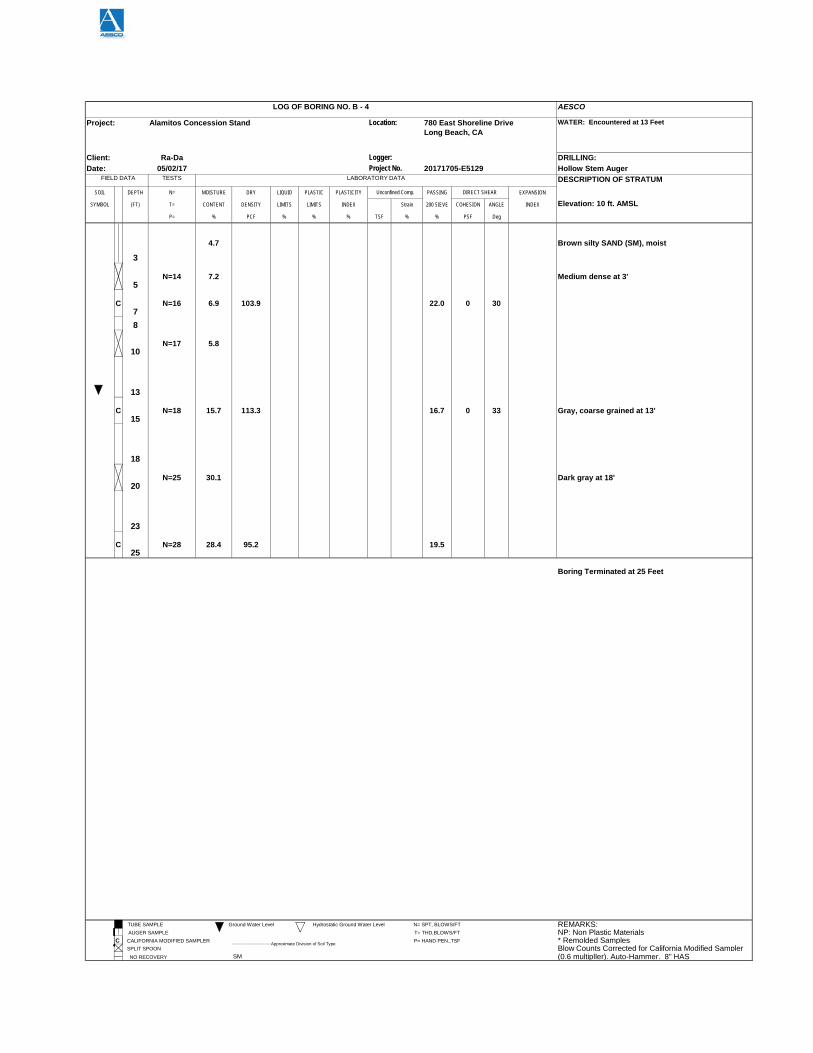
encountered in boring B-4 to the total depth drilled of 25 feet. Silty sand was encountered in
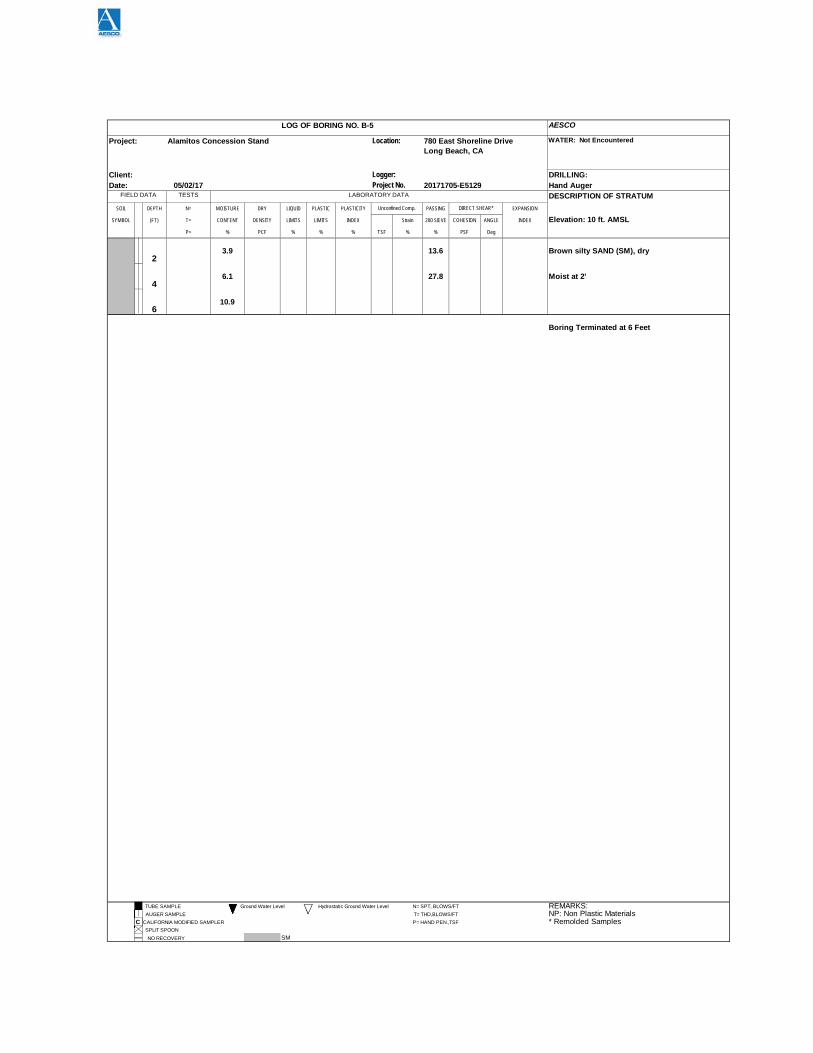
boring B-5 to the total depth drilled of 6 feet.
Groundwater was encountered within boring B-1 at a depth of 8 feet and within boring B-2, B-3
and B-4 at a depth of 13 feet below the existing ground surface. Groundwater was not
encountered within boring B-5. Based on regional data, groundwater is anticipated to occur at a
depth less than 10 feet (CGS, 1998). The depth to groundwater may fluctuate, depending on
rainfall and possible groundwater recharge or pumping activity in the site vicinity.
Project No. 20171705-E5129
SECTION FOUR Conclusions and Recommendations
AESCO 4-1
4. Groundwater was not encountered within the boring. Based on regional data, groundwater is anticipated to occur at a depth of approximately 10 feet (CGS, 1998). The depth to groundwater may fluctuate, depending on rainfall and possible groundwater recharge or pumping activity in the site vicinity. ions and Recommendations
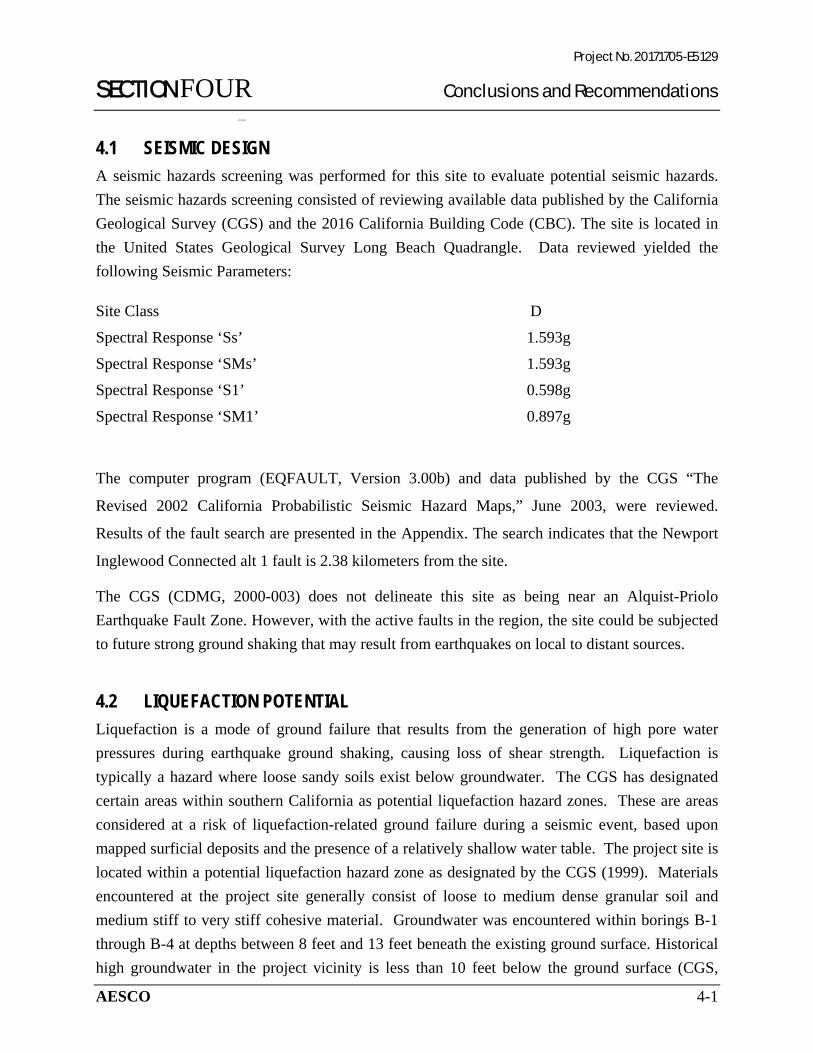
4.1 SEISMIC DESIGN
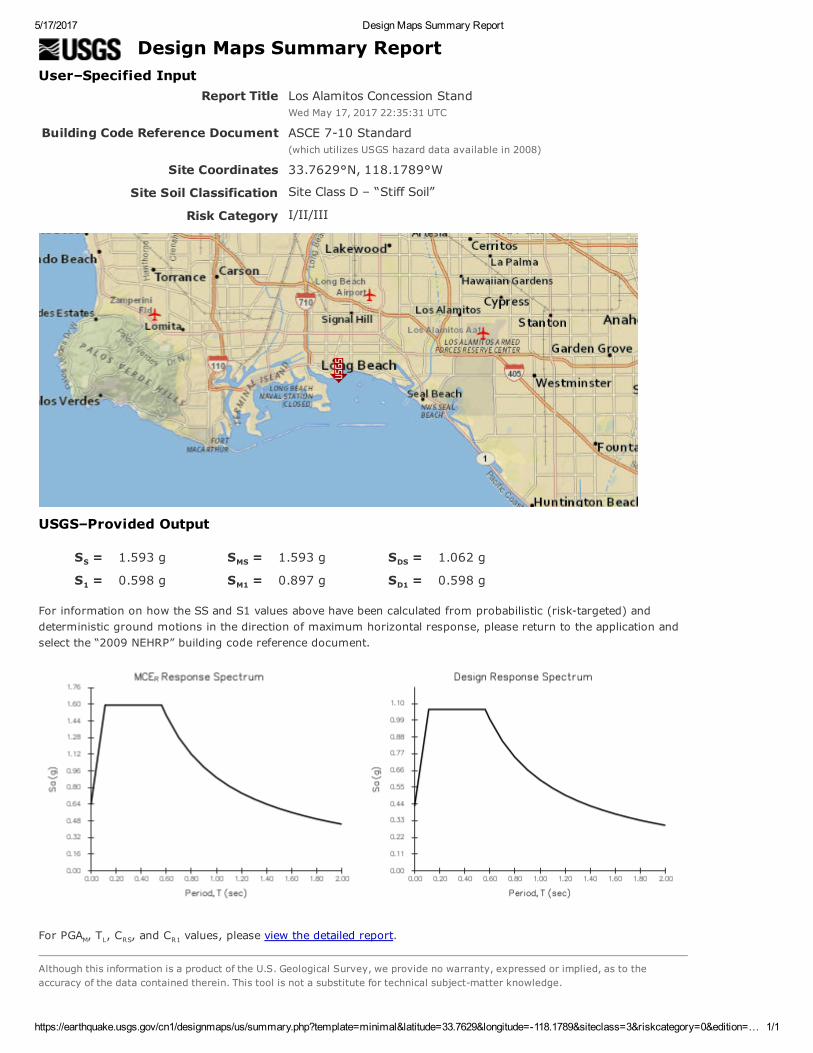
A seismic hazards screening was performed for this site to evaluate potential seismic hazards.
The seismic hazards screening consisted of reviewing available data published by the California
Geological Survey (CGS) and the 2016 California Building Code (CBC). The site is located in
the United States Geological Survey Long Beach Quadrangle. Data reviewed yielded the
following Seismic Parameters:
Site Class D
Spectral Response ‘Ss’ 1.593g
Spectral Response ‘SMs’ 1.593g
Spectral Response ‘S1’ 0.598g
Spectral Response ‘SM1’ 0.897g
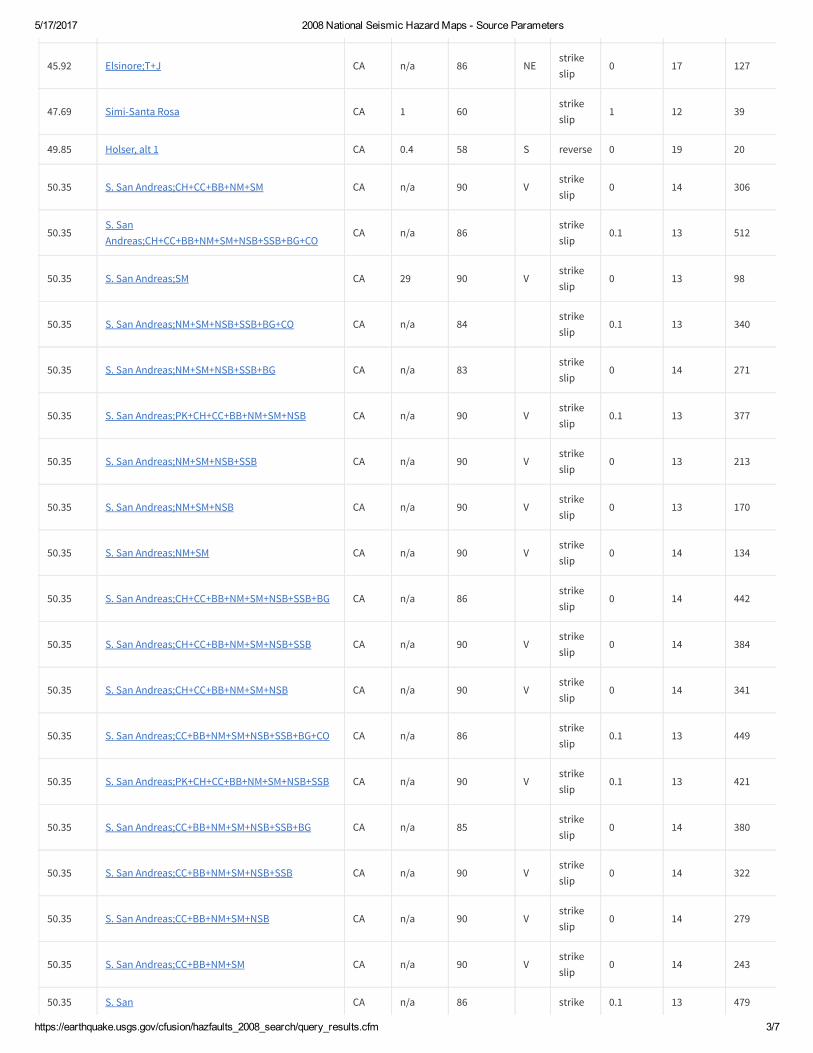
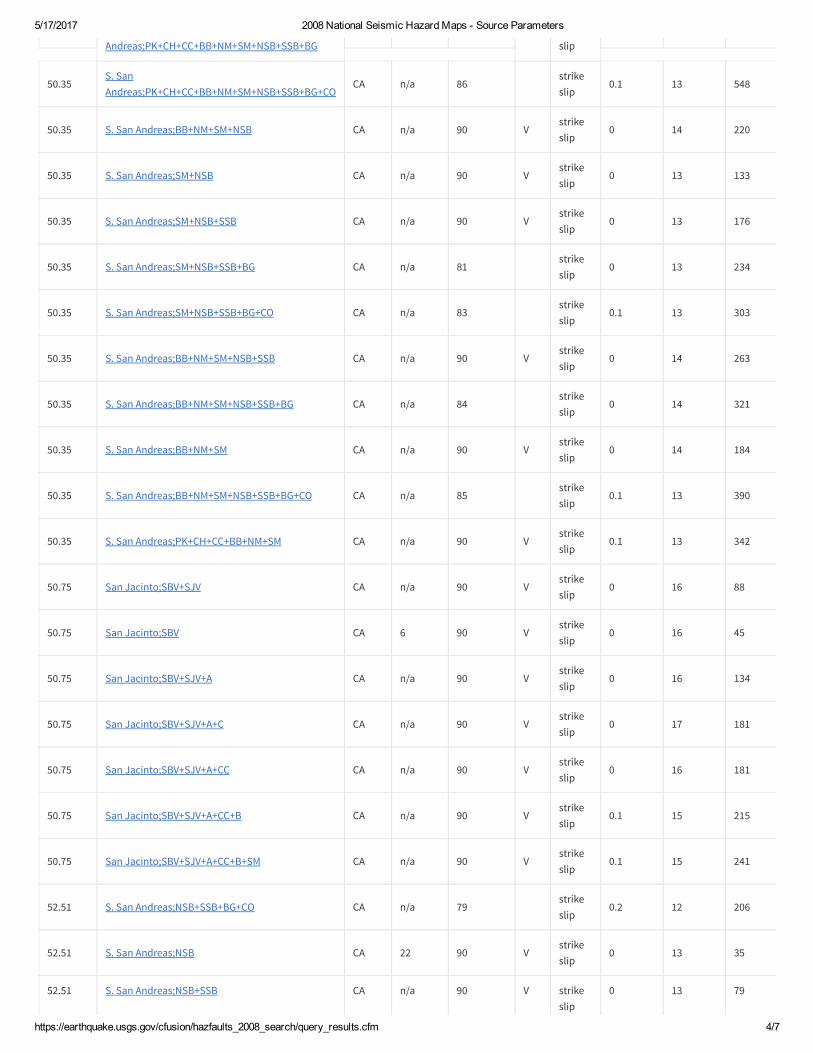
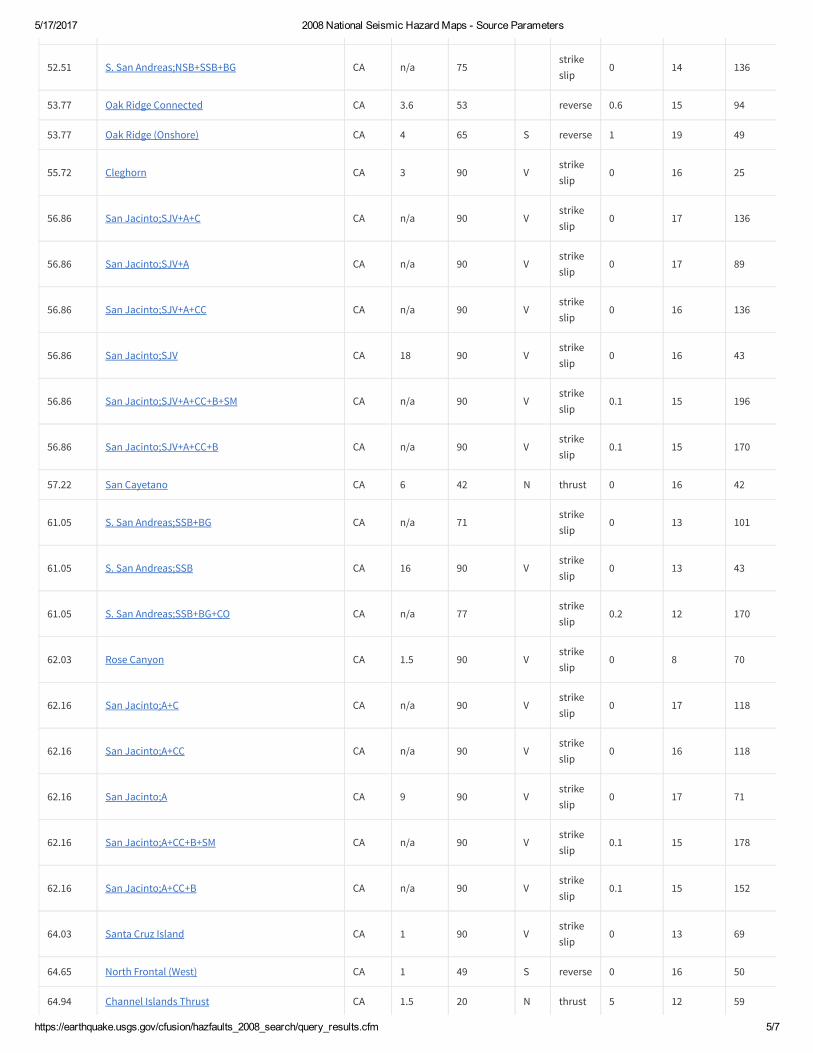
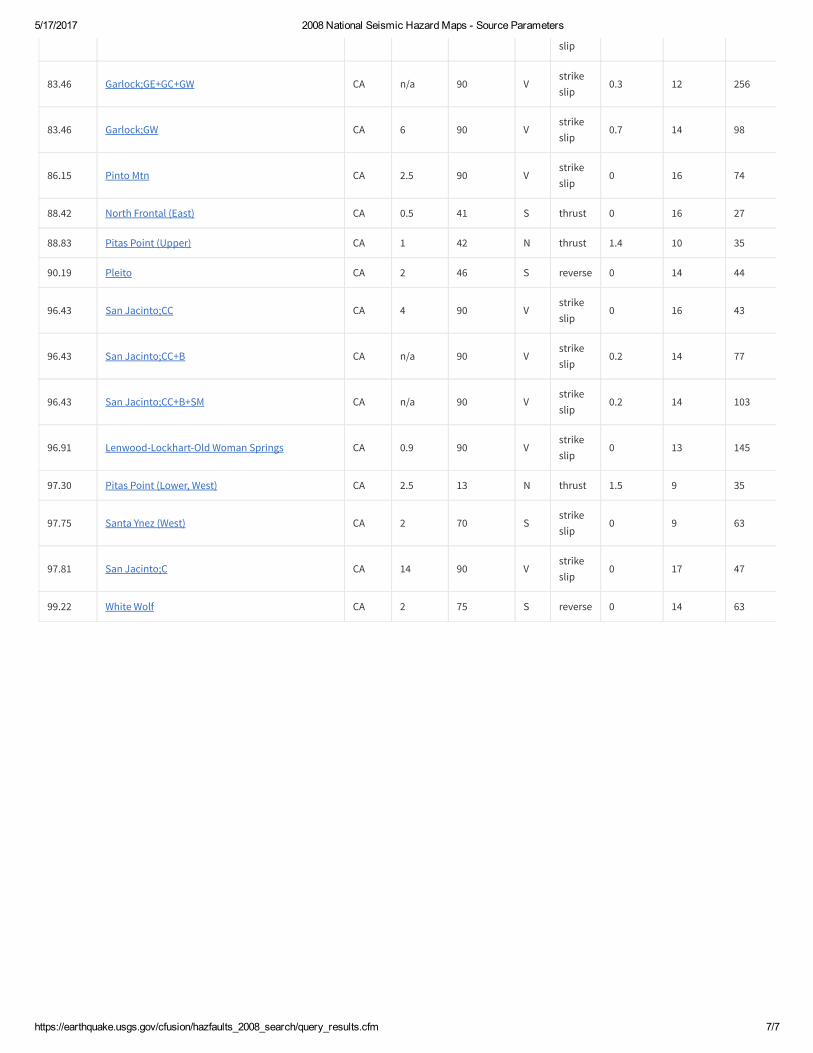
The computer program (EQFAULT, Version 3.00b) and data published by the CGS “The
Revised 2002 California Probabilistic Seismic Hazard Maps,” June 2003, were reviewed.
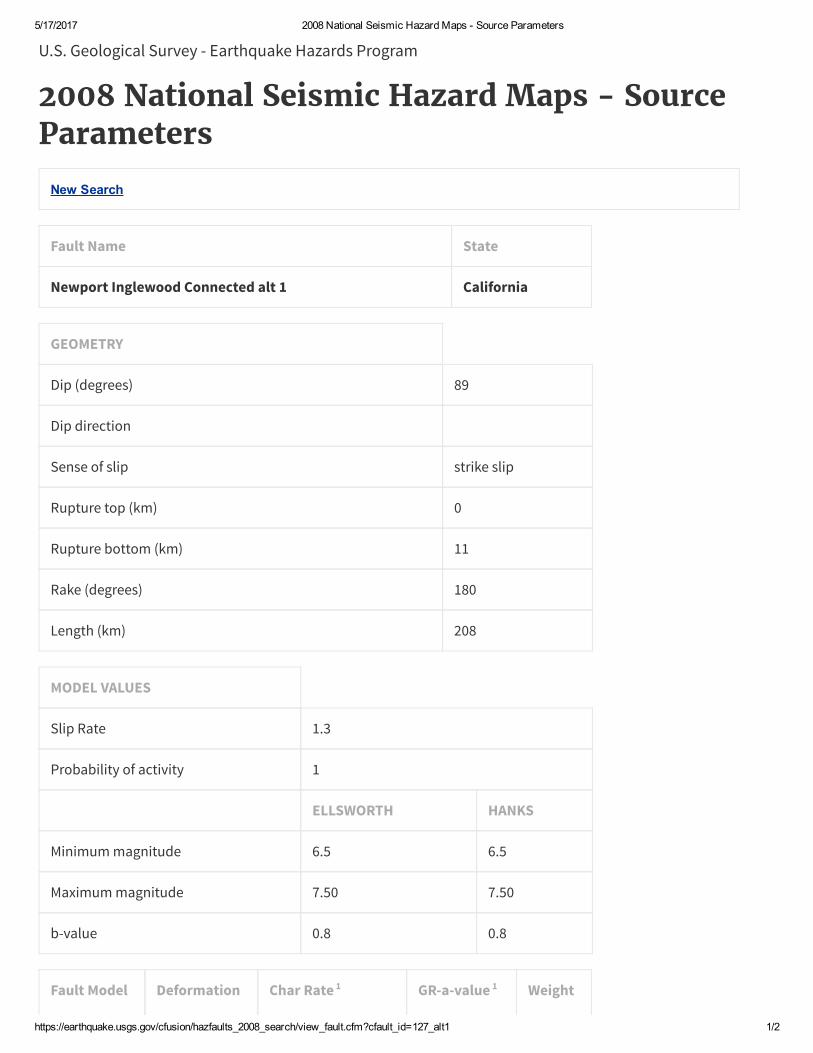
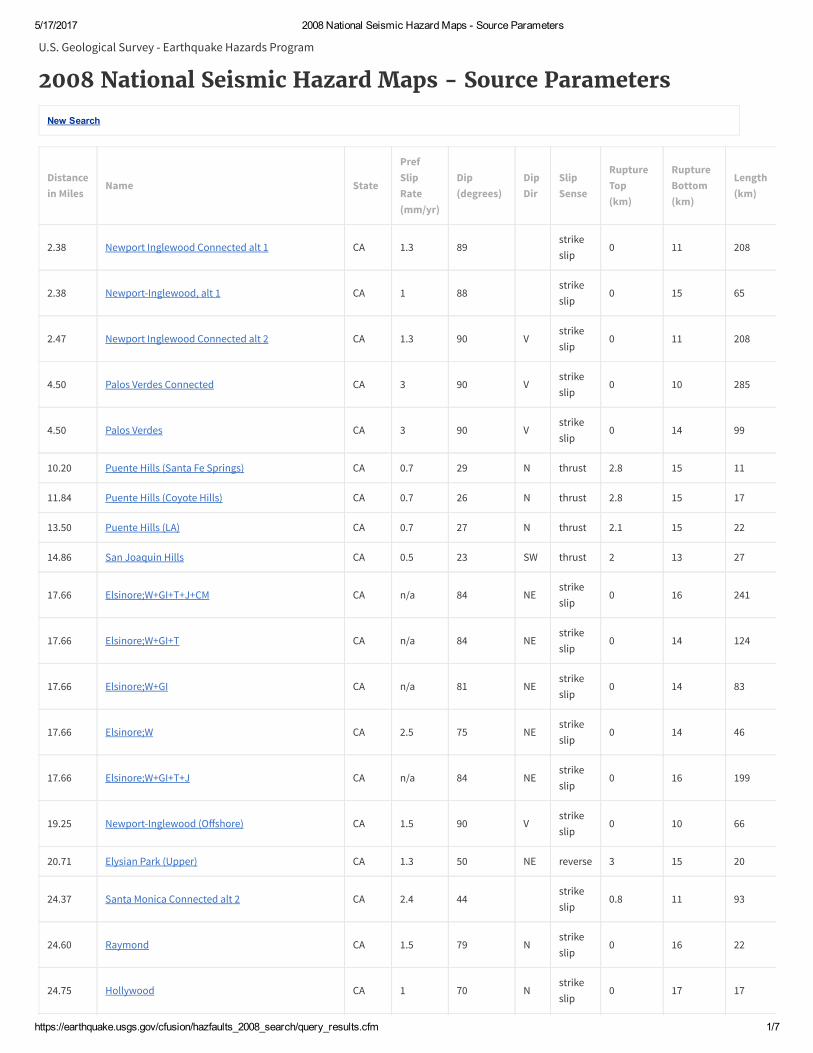
Results of the fault search are presented in the Appendix. The search indicates that the Newport
Inglewood Connected alt 1 fault is 2.38 kilometers from the site.
The CGS (CDMG, 2000-003) does not delineate this site as being near an Alquist-Priolo
Earthquake Fault Zone. However, with the active faults in the region, the site could be subjected
to future strong ground shaking that may result from earthquakes on local to distant sources.
4.2 LIQUEFACTION POTENTIAL
Liquefaction is a mode of ground failure that results from the generation of high pore water
pressures during earthquake ground shaking, causing loss of shear strength. Liquefaction is
typically a hazard where loose sandy soils exist below groundwater. The CGS has designated
certain areas within southern California as potential liquefaction hazard zones. These are areas
considered at a risk of liquefaction-related ground failure during a seismic event, based upon
mapped surficial deposits and the presence of a relatively shallow water table. The project site is
located within a potential liquefaction hazard zone as designated by the CGS (1999). Materials
encountered at the project site generally consist of loose to medium dense granular soil and
medium stiff to very stiff cohesive material. Groundwater was encountered within borings B-1
through B-4 at depths between 8 feet and 13 feet beneath the existing ground surface. Historical
high groundwater in the project vicinity is less than 10 feet below the ground surface (CGS,
Project No. 20171705-E5129
SECTION FOUR Conclusions and Recommendations
AESCO 4-2
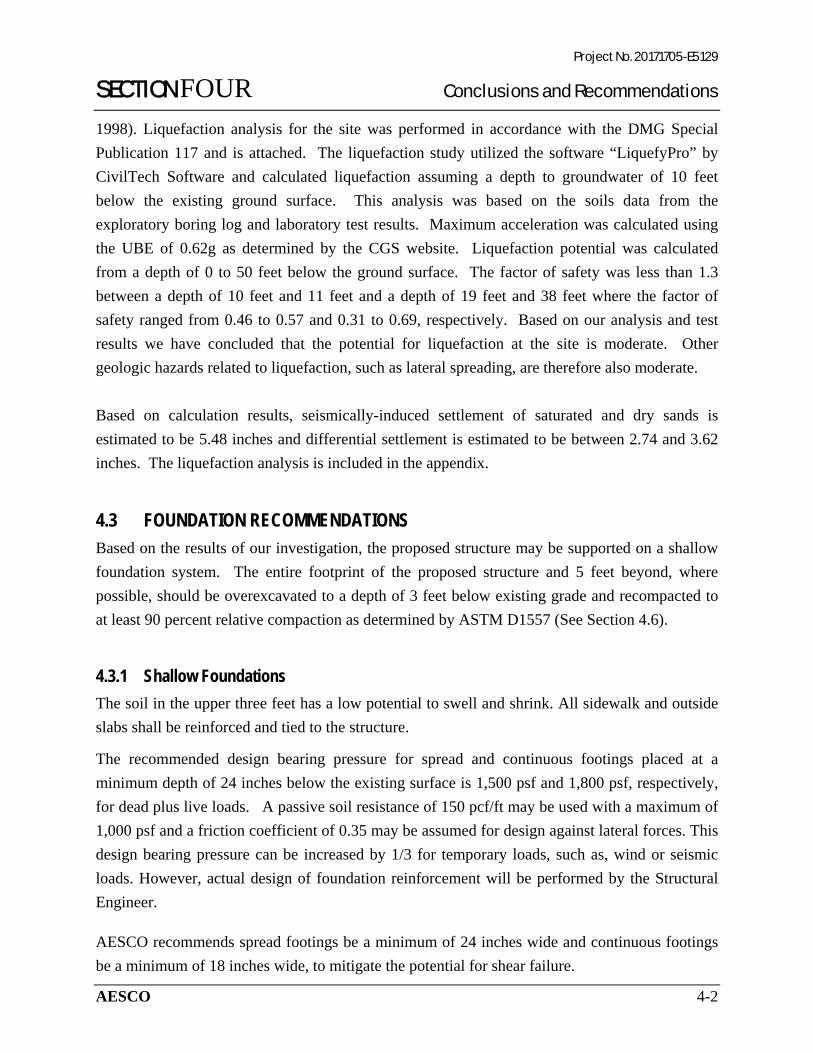
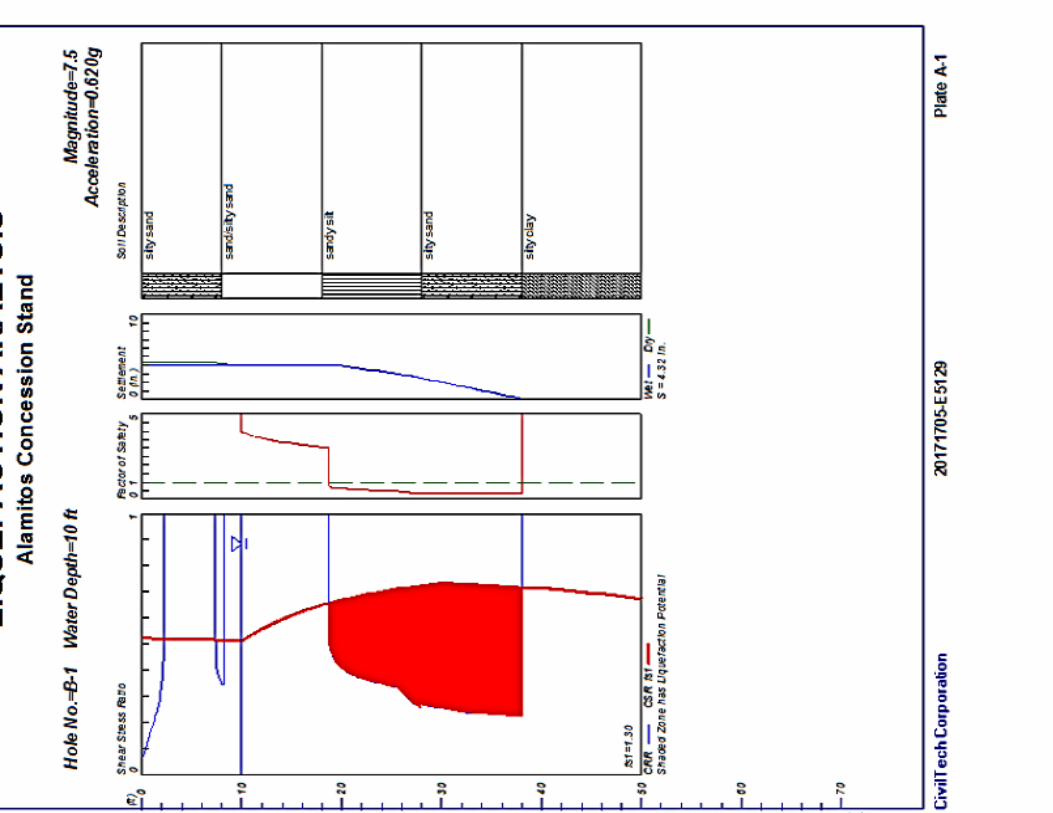
1998). Liquefaction analysis for the site was performed in accordance with the DMG Special
Publication 117 and is attached. The liquefaction study utilized the software “LiquefyPro” by
CivilTech Software and calculated liquefaction assuming a depth to groundwater of 10 feet
below the existing ground surface. This analysis was based on the soils data from the
exploratory boring log and laboratory test results. Maximum acceleration was calculated using
the UBE of 0.62g as determined by the CGS website. Liquefaction potential was calculated
from a depth of 0 to 50 feet below the ground surface. The factor of safety was less than 1.3
between a depth of 10 feet and 11 feet and a depth of 19 feet and 38 feet where the factor of
safety ranged from 0.46 to 0.57 and 0.31 to 0.69, respectively. Based on our analysis and test
results we have concluded that the potential for liquefaction at the site is moderate. Other
geologic hazards related to liquefaction, such as lateral spreading, are therefore also moderate.
Based on calculation results, seismically-induced settlement of saturated and dry sands is
estimated to be 5.48 inches and differential settlement is estimated to be between 2.74 and 3.62
inches. The liquefaction analysis is included in the appendix.
4.3 FOUNDATION RECOMMENDATIONS Based on the results of our investigation, the proposed structure may be supported on a shallow
foundation system. The entire footprint of the proposed structure and 5 feet beyond, where
possible, should be overexcavated to a depth of 3 feet below existing grade and recompacted to
at least 90 percent relative compaction as determined by ASTM D1557 (See Section 4.6).
4.3.1 Shallow Foundations
The soil in the upper three feet has a low potential to swell and shrink. All sidewalk and outside
slabs shall be reinforced and tied to the structure.
The recommended design bearing pressure for spread and continuous footings placed at a
minimum depth of 24 inches below the existing surface is 1,500 psf and 1,800 psf, respectively,
for dead plus live loads. A passive soil resistance of 150 pcf/ft may be used with a maximum of
1,000 psf and a friction coefficient of 0.35 may be assumed for design against lateral forces. This
design bearing pressure can be increased by 1/3 for temporary loads, such as, wind or seismic
loads. However, actual design of foundation reinforcement will be performed by the Structural
Engineer.
AESCO recommends spread footings be a minimum of 24 inches wide and continuous footings
be a minimum of 18 inches wide, to mitigate the potential for shear failure.
Project No. 20171705-E5129
SECTION FOUR Conclusions and Recommendations
AESCO 4-3
In accordance with Section 4.6, “Site Preparation and Earthwork,” any undocumented fill should
be removed and replaced with compacted engineered fill. A representative of AESCO should
confirm the depth of fill at the time of construction.
All walkways, new slabs, and separately poured structures should be tied to any existing slabs
and foundation with #4 rebar, 30 inches in length, on 18-inch centers, embedded a minimum of 8
inches into the building slab, or adjacent slabs, to reduce the potential for separation and
differential settlement.
Under static loading, settlement of the footings designed according to our recommendations is
estimated to be less than 1 inch. Differential settlement between similarly loaded footings is
expected to be about one-half the total settlement.
4.4 CONCRETE SLAB ON GRADE
We anticipate that any concrete slab on grade for the new structures will extend about 4 inches
above the final adjacent grade. We recommend that the slab sections be properly reinforced with
a minimum of #5 bars, at 16 inches, on center, positioned mid-height placed on approved
subgrade and have thickened edges with a minimum embedment (depth to bottom of edge) of 18
inches below finished grade on the free sides. The actual reinforcement should be designed by
the Structural Engineer. To mitigate the potential for differential liquefaction induced settlement
for the slab, the upper 5 feet below the existing surface should be over-excavated and
recompacted. The excavation should extend 5 feet beyond the footprint of the slab (where
possible). The fill material should be compacted to at least 95 percent relative compaction as
determined by ASTM D 1557 to the ground surface. The fill material should be tested and
monitored during placement by the Geotechnical Engineer or his representative. The actual
concrete reinforcement should be designed by the Structural Engineer. Slabs on grade should be
underlain by firm native soils or engineered fill. Additional subgrade requirements are presented
in Section 4.6, “Site Preparation and Earthwork.” Selective grading will be required to choose
the most granular material to place beneath the slabs. A ten mil PVC or polyethylene membrane
with a four-inch gravel blanket should be provided below all interior slabs to prevent moisture
migration. The gravel blanket should be a clean 3/8-inch diameter gravel placed to prevent
migration of moisture to the slab through capillary action. Outside slabs (side walks, drives, etc.)
should be constructed with expansion joints placed at minimum 12 foot spacing each way to
minimize cracking due to shrinkage and expansion of the concrete.
Project No. 20171705-E5129
SECTION FOUR Conclusions and Recommendations
AESCO 4-4
4.5 CONCRETE PAVEMENT
The concrete pavement path should consist of a 5-inch thick reinforced Portland cement concrete
pavement overlying compacted subgrade. Only light weight trucks or automobiles are
occasionally allowed to use the bike pavement path. If heavy trucks are anticipated to use the
concrete, then the pavement should be thickened to 8 inches over 10 inches of base material. The
base should be crushed aggregate compacted to 95 percent of maximum dry density per ASTM
D-1557. The top 6 inches of the prepared subgrade soils should be scarified, moisture-
conditioned and re-compacted to 95 percent of maximum dry density per ASTM D-1557.
All concrete paving shall be placed in lanes a maximum of 12 feet wide with
contraction/expansion joints. Such measures will control the majority of cracking and still allow
transfer of load across joints. Temperature/shrinkage cracks can be minimized by limiting the
pours to a maximum of 10 feet by 12 feet, or smaller. Expansion/construction joints shall be
placed every 18 feet of lane length. Pavement shall be reinforced with No. 5 reinforcing steel at
mid-height on 18-inch centers in each direction. The concrete should have a minimum strength
of 4,500 psi at 28 days. The pavement should not be used until a minimum compressive strength
of 3,600 psi is achieved.
The crushed aggregate base shall be free from organic matter and other deleterious substances,
and shall be of such nature that it can be compacted readily under watering and rolling to form a
firm, stable base. Aggregate shall conform to the requirements of Section 200-2.2 Crushed
Aggregate Base, of the latest version of Standard Specifications for Public Works Construction
(Greenbook).
4.6 SITE PREPARATION AND EARTHWORK
All grading and site preparation should be observed by experienced personnel reporting to the
project Geotechnical Engineer. Our field monitoring services are an essential continuation of our
prior studies to confirm and correlate the findings and our prior recommendations with the actual
subsurface conditions exposed during construction, and to confirm that suitable fill soils are
placed and properly compacted.
The site should be cleared of vegetation, debris, concrete, organic matter, abandoned utility lines,
contaminated soils (if any), topsoil, and other unsuitable material. Any existing fill encountered
during site preparation should be excavated to the depth of the fill and to a horizontal distance
equial to the depth of excavation. The entire footprint of the proposed structures should be
overexcavated to a depth of a minimum of 5 feet below existing grade and re-compacted to at
Project No. 20171705-E5129
SECTION FOUR Conclusions and Recommendations
AESCO 4-5
least 95 percent relative compaction as determined by ASTM D1557 at moisture contents 1 to 4
percent above optimum moisture. The bottom of the excavation shall be inspected by the
Geotechnical Engineer to confirm competent soil is reached. The side slopes of shallow
excavations should be cut at a gradient no steeper than 1:1 (horizontal to vertical), while
excavations greater than 5 feet high should be cut to a gradient no steeper than 1½:1.
Excavation should not extend below an imaginary 1½:1 inclined plane projecting below the
bottom edge of adjacent existing foundations and/or utilities unless properly shored or
specifically analyzed further. All excavations should be observed by AESCO to confirm that all
unsuitable material is removed from beneath the planned construction prior to placing fill.
The bottom of all excavations should be scarified to a depth of 6 inches, moisture conditioned to
at least optimum water content, and compacted as described above. Excavations below the final
grade level should be properly backfilled using approved fill material. The backfill and any
additional fill should be placed in loose lifts less than 8 inches thick, moisture conditioned to 1 to
4 percent above optimum water content, and compacted as directed above. Engineered fill
should consist of soils with a maximum particle size of 3 inches, at least 80 percent passing the
¾-inch sieve and with an expansion index not greater than 20. Fill materials should be free of
construction debris, roots, organic matter, rubble, contaminated soils, and any other unsuitable or
deleterious material as determined by the Geotechnical Engineer. The on-site soils appear to be
suitable for use as compacted fill. We recommend that if imported fill material is used, it be
reviewed for acceptability by the Geotechnical Engineer prior to importing it to the site for use as
engineered fill.
A representative of the Geotechnical Engineer should observe all footing and slab subgrade
surfaces and confirm that the exposed materials are firm. If loose, spongy, soft or other
unacceptable materials, including undocumented fill, are encountered in the subgrade they
should be removed to firm materials as determined by the Soil Engineer’s representative and
replaced with either concrete or compacted engineered fill.
4.7 SOIL CORROSIVITY
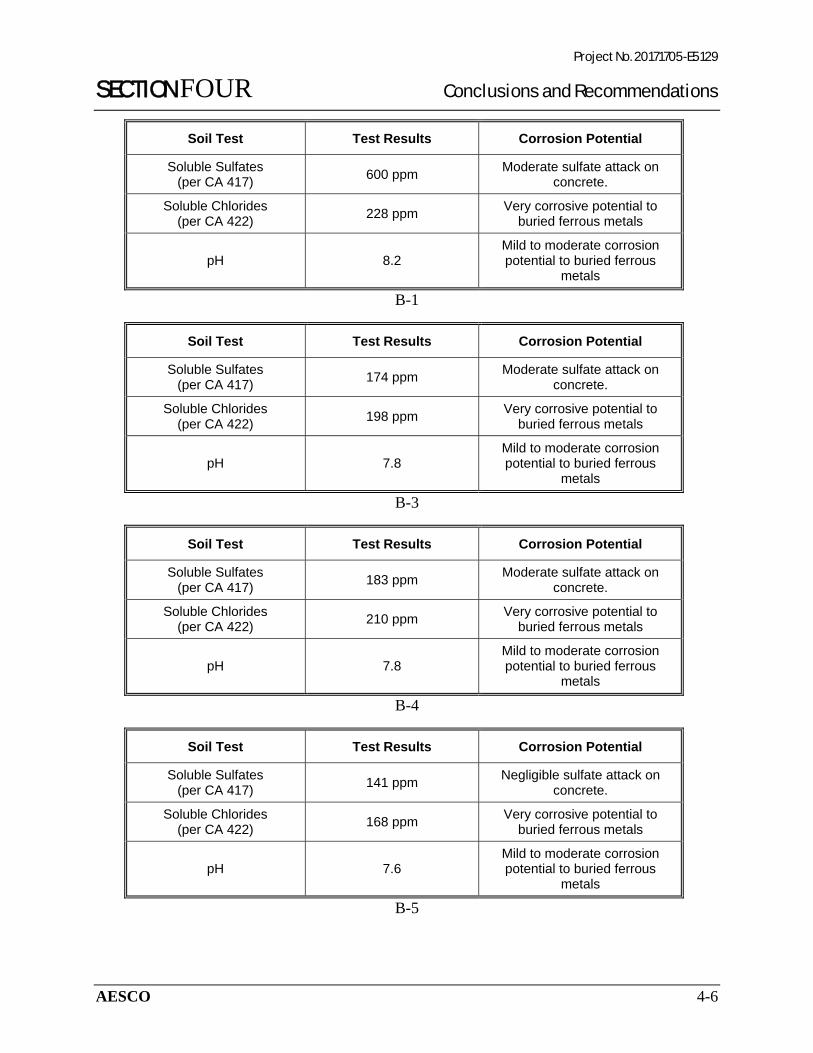
The results of pH, soluble chloride, and soluble sulfate laboratory tests on a sample of the near
surface soils are summarized in the following table:
Project No. 20171705-E5129
SECTION FOUR Conclusions and Recommendations
AESCO 4-6
Soil Test Test Results Corrosion Potential
Soluble Sulfates (per CA 417)
600 ppm Moderate sulfate attack on
concrete.
Soluble Chlorides (per CA 422)
228 ppm Very corrosive potential to
buried ferrous metals
pH 8.2 Mild to moderate corrosion potential to buried ferrous
metals
B-1
Soil Test Test Results Corrosion Potential
Soluble Sulfates (per CA 417)
174 ppm Moderate sulfate attack on
concrete.
Soluble Chlorides (per CA 422)
198 ppm Very corrosive potential to
buried ferrous metals
pH 7.8 Mild to moderate corrosion potential to buried ferrous
metals
B-3
Soil Test Test Results Corrosion Potential
Soluble Sulfates (per CA 417)
183 ppm Moderate sulfate attack on
concrete.
Soluble Chlorides (per CA 422)
210 ppm Very corrosive potential to
buried ferrous metals
pH 7.8 Mild to moderate corrosion potential to buried ferrous
metals
B-4
Soil Test Test Results Corrosion Potential
Soluble Sulfates (per CA 417)
141 ppm Negligible sulfate attack on
concrete.
Soluble Chlorides (per CA 422)
168 ppm Very corrosive potential to
buried ferrous metals
pH 7.6 Mild to moderate corrosion potential to buried ferrous
metals
B-5
Project No. 20171705-E5129
SECTION FOUR Conclusions and Recommendations
AESCO 4-7
Concrete should be designed in accordance with the 2016 CBC, ACI 318 Section 4.3, Table
4.3.1 (2014). As the potential for sulfate attack on concrete appears moderate Type II Portland
cement may be used with a 0.5 maximum water to cement ratio for the purpose of sulfate attack
abatement. The minimum compressive strength of concrete shall be 4,500 psi at 28 days and
maximum slump during placement shall be five inches. All subgrade soils should be moistened
to 125% of optimum moisture prior to the concrete pour. A qualified inspector, under the
supervision of a professional engineer, shall inspect the concrete placement.
The test results indicate that the on site soils can be classified as mild to very corrosive potential
to buried metallic structures (e.g. pipes). As a minimum, buried metal piping should be
protected with suitable coatings, wrappings, or seals. As an alternative, utility piping may be
buried in PVC lined trenches and backfilled with clean sand. The width of the trenches should
be a minimum of three times the diameter of the pipes. A corrosion consultant should be
retained if a more detailed evaluation or a protection system is desired. AESCO recommends
that additional corrosivity evaluation shall be performed during grading operations and for any
imported fill to ensure that corrosivity characteristics have not changed.
4.8 UTILITY TRENCHES It is anticipated that the on-site soils will provide suitable support for underground utilities and
piping that may be installed. Any soft and/or unsuitable material encountered at the bottom of
excavations should be removed and be replaced with an adequate bedding material. A non-
expansive granular material with a sand equivalent greater than 30 should be used for bedding
and shading of utilities.
On-site soils should be suitable for backfill of utility and pipe trenches from one foot above the
top of the pipe to the final ground surface, provided the material is free of organic matter and
deleterious substances; therefore, imported material may be needed for backfill. Trench backfill
should be mechanically placed and compacted in 8-inch lifts to at least 90 percent of the
maximum dry density as determined by ASTM Test Method D 1557 (i.e. 90 percent relative
compaction). Where trenches are placed beneath slabs or footings the backfill shall satisfy the
gradation and expansion index requirements of engineered fill (see Section 4.6). Flooding or
jetting for placement and compaction of backfill is not recommended.
Project No. 20171705-E5129
SECTION FOUR Conclusions and Recommendations
AESCO 4-8
4.9 CONSTRUCTION OBSERVATIONS AND FIELD TESTING
As geotechnical engineer of record, construction observation and field testing services are an
essential continuation of this geotechnical study to confirm and correlate our findings and
recommendations with the actual subsurface conditions exposed during construction. As such, to
maintain the status of geotechnical engineer of record, AESCO should be present to observe and
provide testing during the following construction activities:
Excavation and backfill for footings and subgrade for slabs on grade
Placement of all fill and backfill (site preparation)
Backfilling of utility trenches
Concrete placement of slab, foundation and pavement
Installation of foundation and slab reinforcement
Project No. 20171705-E5129
SECTION FIVE General Conditions
AESCO 5-1
5. Section 4 FOUR General Conditions
5.1 LIMITATIONS
It must be recognized that conclusions reached in this report are based on conditions, which exist
at the boring location. In any subsoil investigation, it is necessary to assume that the subsoil
conditions between boring(s) do not change significantly. The number of the borings, locations,
and spacing are chosen as per the client’s direction and available budget. Note that the boring(s)
were placed as close to the location of the proposed structure(s) as possible. The boring
locations are approximate and surveying is beyond the scope of our work. Consequently, careful
observations must be made during construction to detect significant deviations of actual
conditions throughout the construction area from those inferred from the exploratory borings.
In the event that significant changes in design loads or structural characteristics are made,
AESCO should be retained to review our original design recommendations and their
applicability to the revised design plans. In this way, any required supplemental
recommendations can be made in a timely manner.
Should any unusual conditions be encountered during construction, this office should be notified
immediately so that further investigations and supplemental recommendations can be made.
Geotechnical observations and testing should be provided on a continuous basis during grading,
excavation, and installation of the foundations. If parties other than AESCO are engaged to
provide geotechnical services during construction they will be required to assume the full
responsibility for the geotechnical phase of the project by adhering to the recommendations of
this report.
AESCO
APPENDIX
SITE PLAN
Copyright © and (P) 1988–2012 Microsoft Corporation and/or its suppliers. All rights reserved. http://www.microsoft.com/streets/Certain mapping and direction data © 2012 NAVTEQ. All rights reserved. The Data for areas of Canada includes information taken with permission from Canadian authorities, including: © Her Majesty the Queen in Right of Canada, © Queen's Printer for Ontario. NAVTEQ and NAVTEQ ON BOARD are trademarks of NAVTEQ. © 2012 Tele Atlas North America, Inc. All rights reserved. Tele Atlas and Tele Atlas North America are trademarks of Tele Atlas, Inc. © 2012 by Applied Geographic Solutions. All rights reserved. Portions © Copyright 2012 by Woodall Publications Corp. All rights reserved.
20171705
0 mi 0.2 0.4 0.6 0.8
AESCO
City of Long Beach
SITE PLAN Figure 1Date: 5-19-17
Site Name: Alamitos Beach Concession BuildingProject No. : 20171705-E5129
Site Address: 780 East Shorline Drive, Long Beach, CA 90802
B-1 Approximate Location of Boring
N
Scale: 1 inch = 115 feet~
LEGEND
B-1
B-2
B-4
B-3
B-5
AESCO
APPENDIX
LOGS OF BORINGS B-1 through B-5
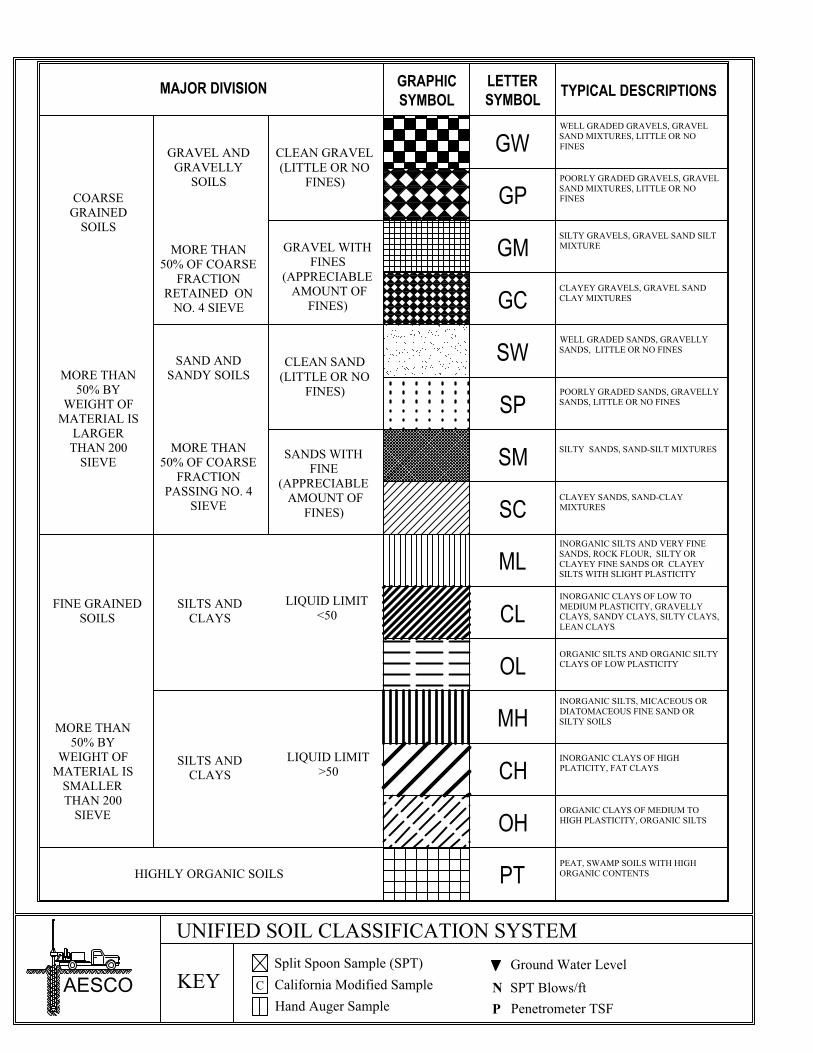
MAJOR DIVISION GRAPHICSYMBOL
LETTERSYMBOL TYPICAL DESCRIPTIONS
GW
GP
GM
GC
SW
SP
SM
SC
ML
CL
OL
MH
CH
OH
PT
COARSEGRAINED
SOILS
MORE THAN50% BY
WEIGHT OFMATERIAL IS
LARGERTHAN 200
SIEVE
GRAVEL ANDGRAVELLY
SOILS
MORE THAN50% OF COARSE
FRACTIONRETAINED ON
NO. 4 SIEVE
SAND ANDSANDY SOILS
CLEAN GRAVEL(LITTLE OR NO
FINES)
GRAVEL WITHFINES
(APPRECIABLE AMOUNT OF
FINES)
FINE GRAINEDSOILS
SILTS ANDCLAYS
LIQUID LIMIT<50
LIQUID LIMIT>50
MORE THAN50% BY
WEIGHT OFMATERIAL IS
SMALLERTHAN 200
SIEVE
HIGHLY ORGANIC SOILS
MORE THAN50% OF COARSE
FRACTIONPASSING NO. 4
SIEVE
SILTS ANDCLAYS
CLEAN SAND(LITTLE OR NO
FINES)
SANDS WITHFINE
(APPRECIABLE AMOUNT OF
FINES)
WELL GRADED GRAVELS, GRAVELSAND MIXTURES, LITTLE OR NOFINES
POORLY GRADED GRAVELS, GRAVELSAND MIXTURES, LITTLE OR NOFINES
SILTY GRAVELS, GRAVEL SAND SILTMIXTURE
CLAYEY GRAVELS, GRAVEL SANDCLAY MIXTURES
WELL GRADED SANDS, GRAVELLYSANDS, LITTLE OR NO FINES
POORLY GRADED SANDS, GRAVELLYSANDS, LITTLE OR NO FINES
SILTY SANDS, SAND-SILT MIXTURES
CLAYEY SANDS, SAND-CLAYMIXTURES
INORGANIC SILTS AND VERY FINESANDS, ROCK FLOUR, SILTY ORCLAYEY FINE SANDS OR CLAYEYSILTS WITH SLIGHT PLASTICITY
INORGANIC CLAYS OF LOW TOMEDIUM PLASTICITY, GRAVELLYCLAYS, SANDY CLAYS, SILTY CLAYS,LEAN CLAYS
ORGANIC SILTS AND ORGANIC SILTYCLAYS OF LOW PLASTICITY
INORGANIC SILTS, MICACEOUS ORDIATOMACEOUS FINE SAND ORSILTY SOILS
INORGANIC CLAYS OF HIGHPLATICITY, FAT CLAYS
ORGANIC CLAYS OF MEDIUM TOHIGH PLASTICITY, ORGANIC SILTS
PEAT, SWAMP SOILS WITH HIGHORGANIC CONTENTS
AESCO
UNIFIED SOIL CLASSIFICATION SYSTEM
C California Modified SampleSplit Spoon Sample (SPT) Ground Water Level
Hand Auger SampleN SPT Blows/ftP Penetrometer TSF
KEY

AESCO
Project: Location: WATER: Encountered at 8 Feet
Client: Ra-Da DRILLING:
Date: 05/02/17 Project No. Hollow Stem AugerTESTS DESCRIPTION OF STRATUM
SOIL DEPTH N= MOISTURE DRY LIQUID PLASTIC PLASTICITY PASSING EXPANSION
SYMBOL (FT) T= CONTENT DENSITY LIMITS LIMITS INDEX Strain 200 SIEVE COHESION ANGLE INDEX Elevation: 10 ft. AMSL
P= % PCF % % % TSF % % PSF Deg
3
5
7
8
10
13
15
18
20
23
25
28
30
33
35
38
40
43
45
48
50
Boring Terminated at 50 Feet
TUBE SAMPLE Ground Water Level Hydrostatic Ground Water Level N= SPT, BLOWS/FT REMARKS: AUGER SAMPLE T= THD,BLOWS/FT NP: Non Plastic Materials
C CALIFORNIA MODIFIED SAMPLER P= HAND PEN.,TSF * Remolded Samples SPLIT SPOON Blow Counts Corrected for California Modified Sampler
NO RECOVERY SM SP/SM ML CL (0.6 multiplIer). Auto-Hammer. 8" HAS
Approximate Division of Soil Type
30
37
18.4
96.7
CN=18P=1.0
21.1
23.8
25.4
102.8
C
101.4
N=15 19.9
18
N=8
89.6
N=17P=1.0
N=5P=0.5
107.2
C
28.9
33.9
Gray sandy SILT (ML), stiff, saturated, w/seashells
Very stiff at 23'
Continues same at 33'
19
Medium stiff to stiff, w/sand at 48'34.5 85.138
Dark gray silty CLAY (CL), stiff, saturated, w/minor black peat
Medium stiff at 43'
19 19
Gray silty SAND (SM), medium dense, saturated, w/seashells
Logger:
8.9
LOG OF BORING NO. B - 1
FIELD DATA
Unconfined Comp. DIRECT SHEAR
LABORATORY DATA
20171705-E5129
Alamitos Concession Stand 780 East Shoreline DriveLong Beach, CA
Gray, medium dense at 13'
51.7
15.4
C
7.1N=18
N=17
N=18P=3.0
5.6
C 21.6N=26
N=15
Brown silty SAND (SM), dry
Medium dense at 3'
0
4.1
Gray-brown SAND/silty SAND (SP/SM), loose, saturated
N=14
0 27114.1 25.2

AESCO
Project: Location: WATER: Encountered at 13 Feet
Client: Ra-Da DRILLING:
Date: 05/02/17 Project No. Hollow Stem AugerTESTS DESCRIPTION OF STRATUM
SOIL DEPTH N= MOISTURE DRY LIQUID PLASTIC PLASTICITY PASSING EXPANSION
SYMBOL (FT) T= CONTENT DENSITY LIMITS LIMITS INDEX Strain 200 SIEVE COHESION ANGLE INDEX Elevation: 10 ft. AMSL
P= % PCF % % % TSF % % PSF Deg
3
5
7
8
10
13
15
18
20
23
25
28
30
33
35
TUBE SAMPLE Ground Water Level Hydrostatic Ground Water Level N= SPT, BLOWS/FT REMARKS: AUGER SAMPLE T= THD,BLOWS/FT NP: Non Plastic Materials
C CALIFORNIA MODIFIED SAMPLER P= HAND PEN.,TSF * Remolded Samples SPLIT SPOON Blow Counts Corrected for California Modified Sampler
NO RECOVERY SM SP (0.6 multiplIer). Auto-Hammer. 8" HAS
LOG OF BORING NO. B - 2
Alamitos Concession Stand 780 East Shoreline DriveLong Beach, CA
Logger:
20171705-E5129 FIELD DATA LABORATORY DATA
Unconfined Comp. DIRECT SHEAR
9.8 Dark brown silty SAND (SM), moist
N=17 4.9 Light brown, medium dense at 3'
CN=12P=0.5
8.3 101.6 12.6 0 29 Brown at 5'
Brown SAND (SP), medium dense, dry
N=25 3.9
C N=22 24.2 99.9 Gray, saturated at 13'
N=25 30.4 14.1 Gray silty SAND (SM), medium dense, saturated
C N=26 23.5 103.6W/minor interbedded dark gray sandy silt layers at 23'
N=14 28.1 Brown at 28'
C N=15 25.7 101.6 40.4 Continues same at 33'
Boring Terminated at 35 Feet
Approximate Division of Soil Type
AESCO
Project: Location: WATER: Encountered at 13 Feet
Client: Ra-Da DRILLING:
Date: 05/02/17 Project No. Hollow Stem AugerTESTS DESCRIPTION OF STRATUM
SOIL DEPTH N= MOISTURE DRY LIQUID PLASTIC PLASTICITY PASSING EXPANSION
SYMBOL (FT) T= CONTENT DENSITY LIMITS LIMITS INDEX Strain 200 SIEVE COHESION ANGLE INDEX Elevation: 10 ft. AMSL
P= % PCF % % % TSF % % PSF Deg
3
5
7
8
10
13
15
18
20
23
25
TUBE SAMPLE Ground Water Level Hydrostatic Ground Water Level N= SPT, BLOWS/FT REMARKS: AUGER SAMPLE T= THD,BLOWS/FT NP: Non Plastic Materials
C CALIFORNIA MODIFIED SAMPLER P= HAND PEN.,TSF * Remolded Samples SPLIT SPOON Blow Counts Corrected for California Modified Sampler
NO RECOVERY SM SP (0.6 multiplIer). Auto-Hammer. 8" HAS
LOG OF BORING NO. B - 3
Alamitos Concession Stand 780 East Shoreline DriveLong Beach, CA
Logger:
20171705-E5129 FIELD DATA LABORATORY DATA
Unconfined Comp. DIRECT SHEAR
4.5 Brown silty SAND (SM), dry
N=18 5.3 Medium dense, moist at 3'
CN=12P=0.5
4.2 102.8 27.5 0 29 Dry at 5'
N=21 4.4
Gray SAND (SP), medium dense, moist, medium grained
C N=17 17.6 114.3 4.5 Saturated at 13'
N=23 28.7 NP NP NP 40.5 Dark gray silty SAND (SM), medium dense, saturated
CN=18P=1.0
28.2 96.0 18.6 Dark gray at 23'
Boring Terminated at 25 Feet
Approximate Division of Soil Type
AESCO
Project: Location: WATER: Encountered at 13 Feet
Client: Ra-Da DRILLING:
Date: 05/02/17 Project No. Hollow Stem AugerTESTS DESCRIPTION OF STRATUM
SOIL DEPTH N= MOISTURE DRY LIQUID PLASTIC PLASTICITY PASSING EXPANSION
SYMBOL (FT) T= CONTENT DENSITY LIMITS LIMITS INDEX Strain 200 SIEVE COHESION ANGLE INDEX Elevation: 10 ft. AMSL
P= % PCF % % % TSF % % PSF Deg
3
5
7
8
10
13
15
18
20
23
25
TUBE SAMPLE Ground Water Level Hydrostatic Ground Water Level N= SPT, BLOWS/FT REMARKS: AUGER SAMPLE T= THD,BLOWS/FT NP: Non Plastic Materials
C CALIFORNIA MODIFIED SAMPLER P= HAND PEN.,TSF * Remolded Samples SPLIT SPOON Blow Counts Corrected for California Modified Sampler
NO RECOVERY SM (0.6 multiplIer). Auto-Hammer. 8" HAS
LOG OF BORING NO. B - 4
Alamitos Concession Stand 780 East Shoreline DriveLong Beach, CA
Logger:
20171705-E5129 FIELD DATA LABORATORY DATA
Unconfined Comp. DIRECT SHEAR
4.7 Brown silty SAND (SM), moist
N=14 7.2 Medium dense at 3'
C N=16 6.9 103.9 22.0 0 30
N=17 5.8
C N=18 15.7 113.3 16.7 0 33 Gray, coarse grained at 13'
N=25 30.1 Dark gray at 18'
C N=28 28.4 95.2 19.5
Boring Terminated at 25 Feet
Approximate Division of Soil Type
AESCO
Project: Location: WATER: Not Encountered
Client: DRILLING: Date: 05/02/17 Project No. Hand Auger
TESTS DESCRIPTION OF STRATUM
SOIL DEPTH N= MOISTURE DRY LIQUID PLASTIC PLASTICITY PASSING EXPANSION
SYMBOL (FT) T= CONTENT DENSITY LIMITS LIMITS INDEX Strain 200 SIEVE COHESION ANGLE INDEX Elevation: 10 ft. AMSL
P= % PCF % % % TSF % % PSF Deg
2
4
6
TUBE SAMPLE Ground Water Level Hydrostatic Ground Water Level N= SPT, BLOWS/FT REMARKS: AUGER SAMPLE T= THD,BLOWS/FT NP: Non Plastic Materials
C CALIFORNIA MODIFIED SAMPLER P= HAND PEN.,TSF * Remolded Samples SPLIT SPOON
NO RECOVERY SM
Brown silty SAND (SM), dry
6.1 Moist at 2'
3.9 13.6
780 East Shoreline DriveLong Beach, CA
Logger:
27.8
LOG OF BORING NO. B-5
FIELD DATA
Unconfined Comp. DIRECT SHEAR*
LABORATORY DATA
20171705-E5129
Alamitos Concession Stand
Boring Terminated at 6 Feet
10.9

AESCO
APPENDIX
LABORATORY TEST DATA

0
500
1000
1500
2000
2500
3000
3500
4000
0 500 1000 1500 2000 2500 3000 3500 4000
Sh
ear
Str
ess
(psf
)
Normal Stress (psf)
Project No: Boring No: Depth (ft): 5-7'
W int = d (pcf)= C (psf) = (deg) =
Remolded (Y/N):
20171705-E5129
N
B-1
5.6%
Site/Client: Alamitos
114.1 0 27
Soil Type: SM
Orange County17782 Georgetown LaneHuntington Beach, California 92647Tele: (714) 375-3830Fax: (714)375-3831
San Bernardino County14163 Arrow BoulevardFontana, California 92335Tele:(909) 284-9200Fax:(909) 284-9201
ASTM D3080Direct Shear Results
0
500
1000
1500
2000
2500
3000
3500
4000
0 500 1000 1500 2000 2500 3000 3500 4000
Sh
ear
Str
ess
(psf
)
Normal Stress (psf)
Project No: Boring No: Depth (ft): 13-15'
W int = d (pcf)= C (psf) = (deg) =
Remolded (Y/N):
20171705-E5129
N
B-1
21.6%
Site/Client: Alamitos
101.4 0 30
Soil Type: SP/SM
Orange County17782 Georgetown LaneHuntington Beach, California 92647Tele: (714) 375-3830Fax: (714)375-3831
San Bernardino County14163 Arrow BoulevardFontana, California 92335Tele:(909) 284-9200Fax:(909) 284-9201
ASTM D3080Direct Shear Results

0
500
1000
1500
2000
2500
3000
3500
4000
0 500 1000 1500 2000 2500 3000 3500 4000
Sh
ear
Str
ess
(psf
)
Normal Stress (psf)
Project No: Boring No: Depth (ft): 5-7'
W int = d (pcf)= C (psf) = (deg) =
Remolded (Y/N):
20171705-E5129
N
B-2
8.3%
Site/Client: Alamitos
101.6 0 29
Soil Type: SM
Orange County17782 Georgetown LaneHuntington Beach, California 92647Tele: (714) 375-3830Fax: (714)375-3831
San Bernardino County14163 Arrow BoulevardFontana, California 92335Tele:(909) 284-9200Fax:(909) 284-9201
ASTM D3080Direct Shear Results

0
500
1000
1500
2000
2500
3000
3500
4000
0 500 1000 1500 2000 2500 3000 3500 4000
Sh
ear
Str
ess
(psf
)
Normal Stress (psf)
Project No: Boring No: Depth (ft): 5-7'
W int = d (pcf)= C (psf) = (deg) =
Remolded (Y/N):
20171705-E5129
N
B-3
4.2%
Site/Client: Alamitos
102.8 0 29
Soil Type: SM
Orange County17782 Georgetown LaneHuntington Beach, California 92647Tele: (714) 375-3830Fax: (714)375-3831
San Bernardino County14163 Arrow BoulevardFontana, California 92335Tele:(909) 284-9200Fax:(909) 284-9201
ASTM D3080Direct Shear Results
0
500
1000
1500
2000
2500
3000
3500
4000
0 500 1000 1500 2000 2500 3000 3500 4000
Sh
ear
Str
ess
(psf
)
Normal Stress (psf)
Project No: Boring No: Depth (ft): 5-7'
W int = d (pcf)= C (psf) = (deg) =
Remolded (Y/N):
20171705-E5129
N
B-4
6.9%
Site/Client: Alamitos
103.9 0 30
Soil Type: SM
Orange County17782 Georgetown LaneHuntington Beach, California 92647Tele: (714) 375-3830Fax: (714)375-3831
San Bernardino County14163 Arrow BoulevardFontana, California 92335Tele:(909) 284-9200Fax:(909) 284-9201
ASTM D3080Direct Shear Results
0
500
1000
1500
2000
2500
3000
3500
4000
0 500 1000 1500 2000 2500 3000 3500 4000
Sh
ear
Str
ess
(psf
)
Normal Stress (psf)
Project No: Boring No: Depth (ft): 13-15'
W int = d (pcf)= C (psf) = (deg) =
Remolded (Y/N):
20171705-E5129
N
B-4
6.9%
Site/Client: Alamitos
103.9 0 33
Soil Type: SM
Orange County17782 Georgetown LaneHuntington Beach, California 92647Tele: (714) 375-3830Fax: (714)375-3831
San Bernardino County14163 Arrow BoulevardFontana, California 92335Tele:(909) 284-9200Fax:(909) 284-9201
ASTM D3080Direct Shear Results
AESCO
APPENDIX
SEISMIC DESIGN DATA
5/17/2017 Design Maps Summary Report
https://earthquake.usgs.gov/cn1/designmaps/us/summary.php?template=minimal&latitude=33.7629&longitude=118.1789&siteclass=3&riskcategory=0&edition=… 1/1
Report Title
Building Code Reference Document
Site Coordinates
Site Soil Classification
Risk Category
Design Maps Summary ReportUser–Specified Input
Los Alamitos Concession StandWed May 17, 2017 22:35:31 UTC
ASCE 710 Standard(which utilizes USGS hazard data available in 2008)
33.7629°N, 118.1789°W
Site Class D – “Stiff Soil”
I/II/III
USGS–Provided Output
SS = 1.593 g SMS = 1.593 g SDS = 1.062 g
S1 = 0.598 g SM1 = 0.897 g SD1 = 0.598 g
For information on how the SS and S1 values above have been calculated from probabilistic (risktargeted) anddeterministic ground motions in the direction of maximum horizontal response, please return to the application andselect the “2009 NEHRP” building code reference document.
For PGAM, TL, CRS, and CR1 values, please view the detailed report.
Although this information is a product of the U.S. Geological Survey, we provide no warranty, expressed or implied, as to theaccuracy of the data contained therein. This tool is not a substitute for technical subjectmatter knowledge.
5/17/2017 Design Maps Detailed Report
https://earthquake.usgs.gov/cn1/designmaps/us/report.php?template=minimal&latitude=33.7629&longitude=118.1789&siteclass=3&riskcategory=0&edition=asc… 1/6
From Figure 221 [1]
From Figure 222 [2]
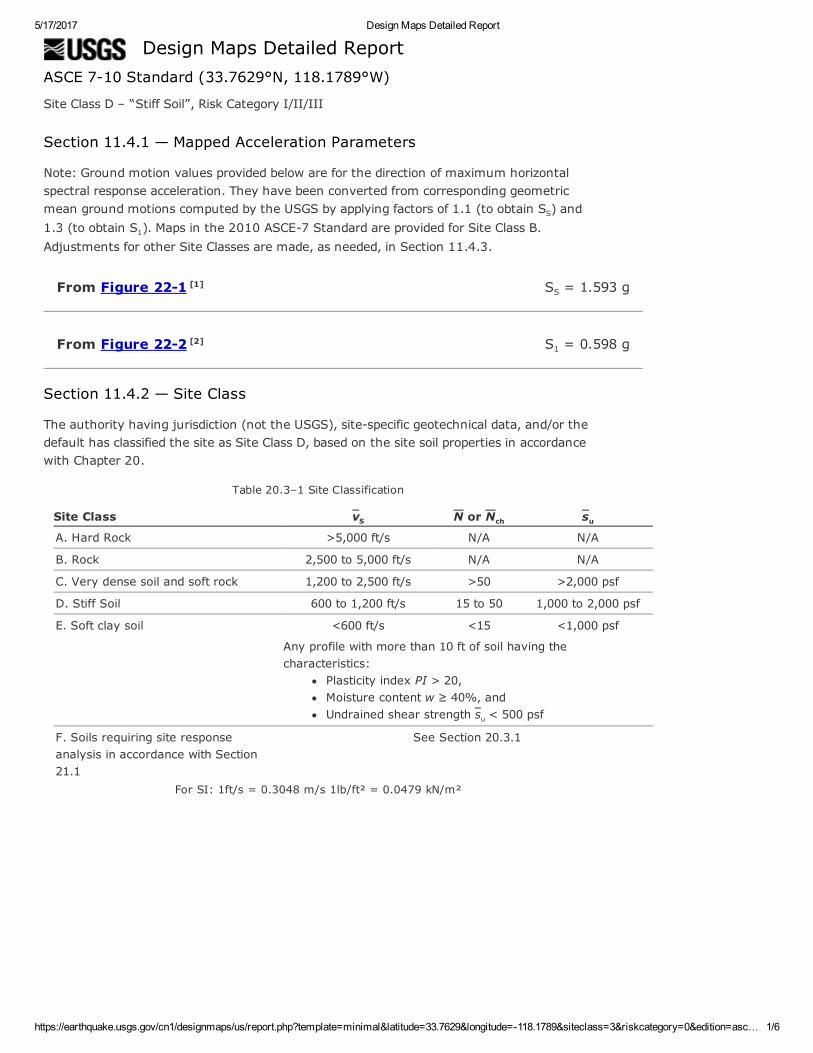
Design Maps Detailed ReportASCE 710 Standard (33.7629°N, 118.1789°W)
Site Class D – “Stiff Soil”, Risk Category I/II/III
Section 11.4.1 — Mapped Acceleration Parameters
Note: Ground motion values provided below are for the direction of maximum horizontalspectral response acceleration. They have been converted from corresponding geometricmean ground motions computed by the USGS by applying factors of 1.1 (to obtain SS) and1.3 (to obtain S1). Maps in the 2010 ASCE7 Standard are provided for Site Class B.Adjustments for other Site Classes are made, as needed, in Section 11.4.3.
SS = 1.593 g
S1 = 0.598 g
Section 11.4.2 — Site Class
The authority having jurisdiction (not the USGS), sitespecific geotechnical data, and/or thedefault has classified the site as Site Class D, based on the site soil properties in accordancewith Chapter 20.
Table 20.3–1 Site Classification
Site Class vS N or Nch suA. Hard Rock >5,000 ft/s N/A N/A
B. Rock 2,500 to 5,000 ft/s N/A N/A
C. Very dense soil and soft rock 1,200 to 2,500 ft/s >50 >2,000 psf
D. Stiff Soil 600 to 1,200 ft/s 15 to 50 1,000 to 2,000 psf
E. Soft clay soil <600 ft/s <15 <1,000 psf
Any profile with more than 10 ft of soil having thecharacteristics:
Plasticity index PI > 20,Moisture content w ≥ 40%, andUndrained shear strength su < 500 psf
F. Soils requiring site responseanalysis in accordance with Section21.1
See Section 20.3.1
For SI: 1ft/s = 0.3048 m/s 1lb/ft² = 0.0479 kN/m²
5/17/2017 Design Maps Detailed Report
https://earthquake.usgs.gov/cn1/designmaps/us/report.php?template=minimal&latitude=33.7629&longitude=118.1789&siteclass=3&riskcategory=0&edition=asc… 2/6
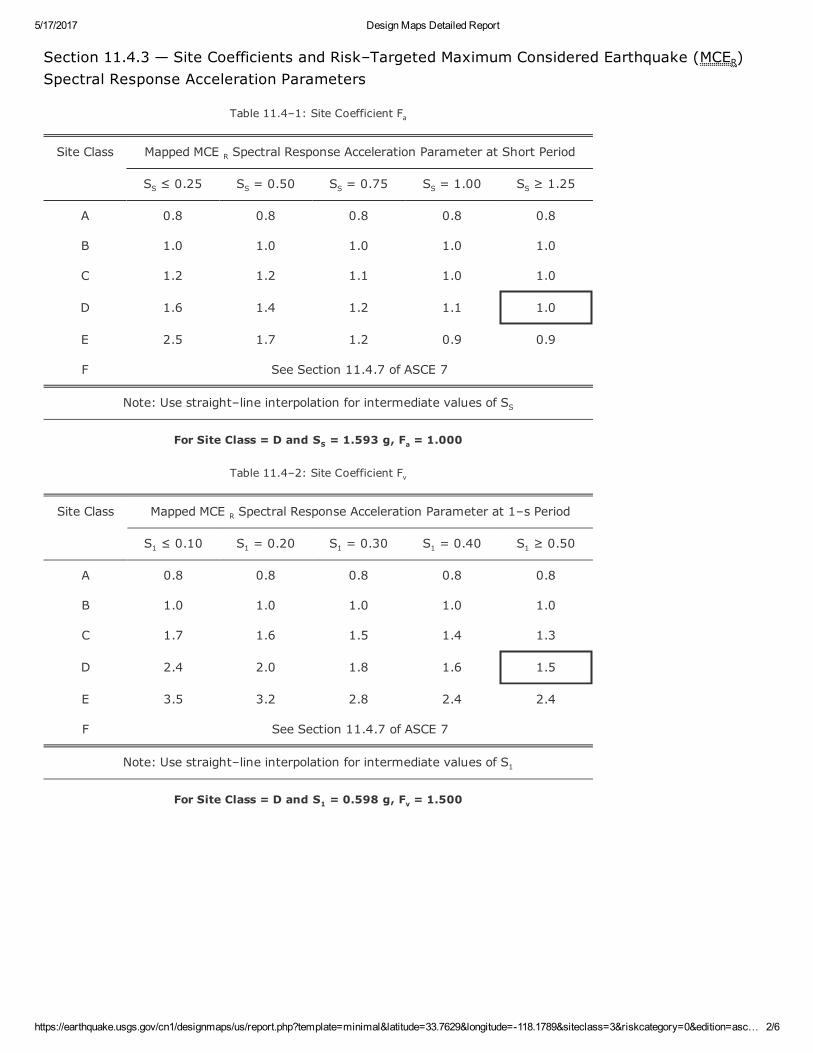
Section 11.4.3 — Site Coefficients and Risk–Targeted Maximum Considered Earthquake (MCER)Spectral Response Acceleration Parameters
Table 11.4–1: Site Coefficient Fa
Site Class Mapped MCE R Spectral Response Acceleration Parameter at Short Period
SS ≤ 0.25 SS = 0.50 SS = 0.75 SS = 1.00 SS ≥ 1.25
A 0.8 0.8 0.8 0.8 0.8
B 1.0 1.0 1.0 1.0 1.0
C 1.2 1.2 1.1 1.0 1.0
D 1.6 1.4 1.2 1.1 1.0
E 2.5 1.7 1.2 0.9 0.9
F See Section 11.4.7 of ASCE 7
Note: Use straight–line interpolation for intermediate values of SS
For Site Class = D and SS = 1.593 g, Fa = 1.000
Table 11.4–2: Site Coefficient Fv
Site Class Mapped MCE R Spectral Response Acceleration Parameter at 1–s Period
S1 ≤ 0.10 S1 = 0.20 S1 = 0.30 S1 = 0.40 S1 ≥ 0.50
A 0.8 0.8 0.8 0.8 0.8
B 1.0 1.0 1.0 1.0 1.0
C 1.7 1.6 1.5 1.4 1.3
D 2.4 2.0 1.8 1.6 1.5
E 3.5 3.2 2.8 2.4 2.4
F See Section 11.4.7 of ASCE 7
Note: Use straight–line interpolation for intermediate values of S1
For Site Class = D and S1 = 0.598 g, Fv = 1.500
5/17/2017 Design Maps Detailed Report
https://earthquake.usgs.gov/cn1/designmaps/us/report.php?template=minimal&latitude=33.7629&longitude=118.1789&siteclass=3&riskcategory=0&edition=asc… 3/6
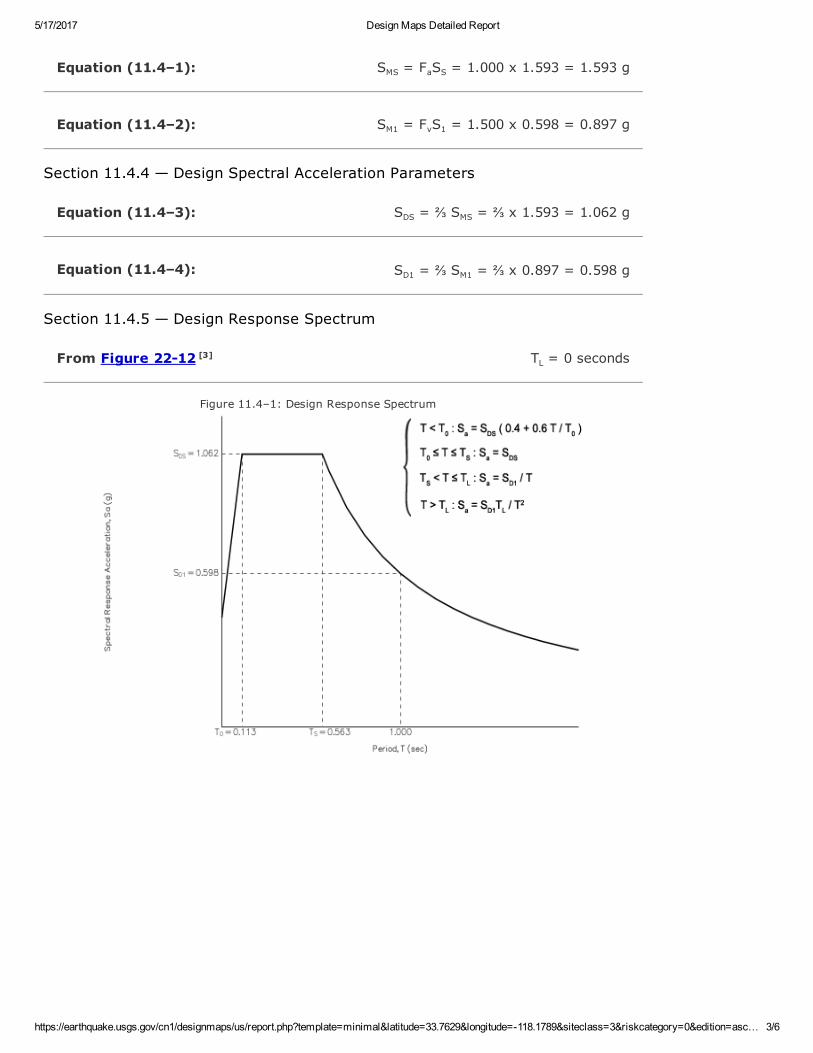
Equation (11.4–1):
Equation (11.4–2):
Equation (11.4–3):
Equation (11.4–4):
From Figure 2212 [3]
SMS = FaSS = 1.000 x 1.593 = 1.593 g
SM1 = FvS1 = 1.500 x 0.598 = 0.897 g
Section 11.4.4 — Design Spectral Acceleration Parameters
SDS = ⅔ SMS = ⅔ x 1.593 = 1.062 g
SD1 = ⅔ SM1 = ⅔ x 0.897 = 0.598 g
Section 11.4.5 — Design Response Spectrum
TL = 0 seconds
Figure 11.4–1: Design Response Spectrum
5/17/2017 Design Maps Detailed Report
https://earthquake.usgs.gov/cn1/designmaps/us/report.php?template=minimal&latitude=33.7629&longitude=118.1789&siteclass=3&riskcategory=0&edition=asc… 4/6
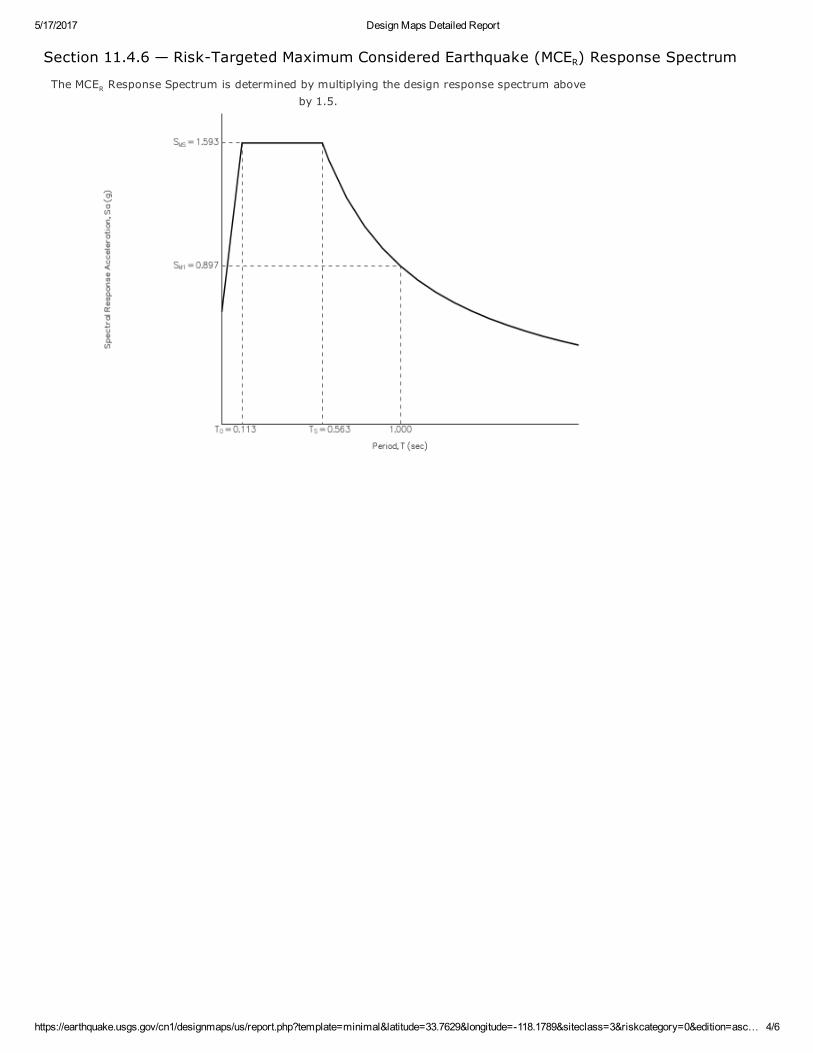
Section 11.4.6 — RiskTargeted Maximum Considered Earthquake (MCER) Response Spectrum
The MCER Response Spectrum is determined by multiplying the design response spectrum aboveby 1.5.
5/17/2017 Design Maps Detailed Report
https://earthquake.usgs.gov/cn1/designmaps/us/report.php?template=minimal&latitude=33.7629&longitude=118.1789&siteclass=3&riskcategory=0&edition=asc… 5/6
From Figure 227 [4]
Equation (11.8–1):
From Figure 2217 [5]
From Figure 2218 [6]
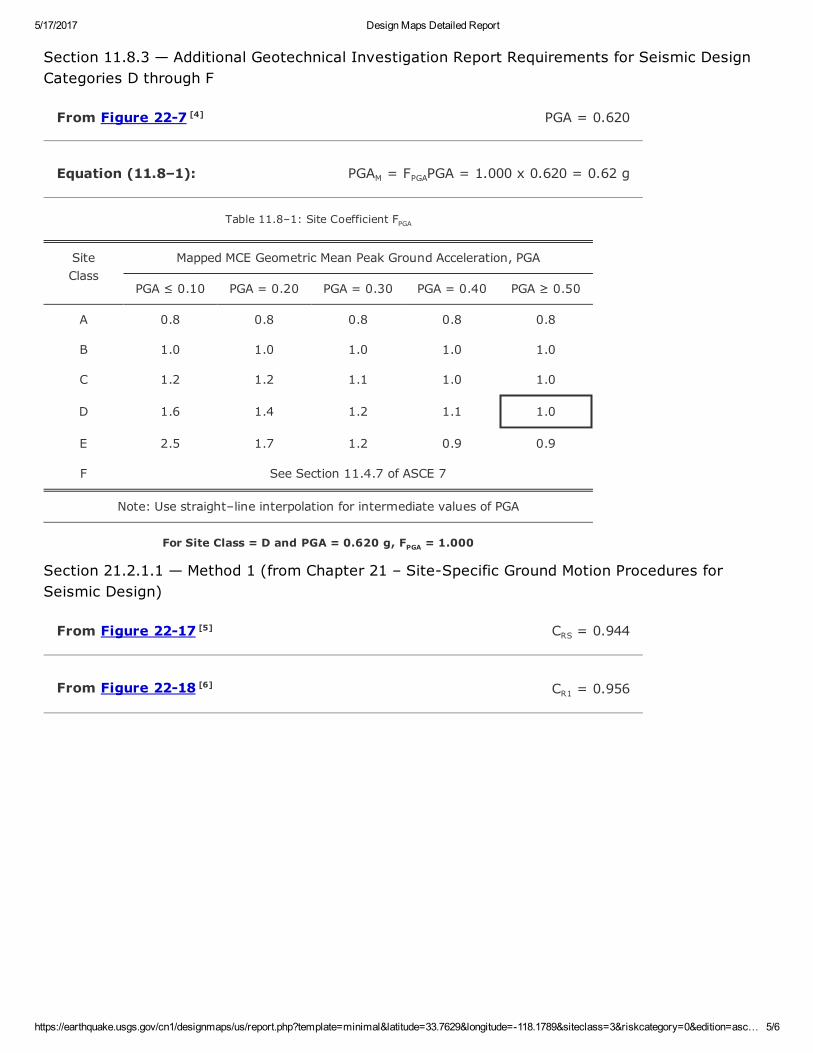
Section 11.8.3 — Additional Geotechnical Investigation Report Requirements for Seismic DesignCategories D through F
PGA = 0.620
PGAM = FPGAPGA = 1.000 x 0.620 = 0.62 g
Table 11.8–1: Site Coefficient FPGA
SiteClass
Mapped MCE Geometric Mean Peak Ground Acceleration, PGA
PGA ≤ 0.10 PGA = 0.20 PGA = 0.30 PGA = 0.40 PGA ≥ 0.50
A 0.8 0.8 0.8 0.8 0.8
B 1.0 1.0 1.0 1.0 1.0
C 1.2 1.2 1.1 1.0 1.0
D 1.6 1.4 1.2 1.1 1.0
E 2.5 1.7 1.2 0.9 0.9
F See Section 11.4.7 of ASCE 7
Note: Use straight–line interpolation for intermediate values of PGA
For Site Class = D and PGA = 0.620 g, FPGA = 1.000
Section 21.2.1.1 — Method 1 (from Chapter 21 – SiteSpecific Ground Motion Procedures forSeismic Design)
CRS = 0.944
CR1 = 0.956
5/17/2017 Design Maps Detailed Report
https://earthquake.usgs.gov/cn1/designmaps/us/report.php?template=minimal&latitude=33.7629&longitude=118.1789&siteclass=3&riskcategory=0&edition=asc… 6/6
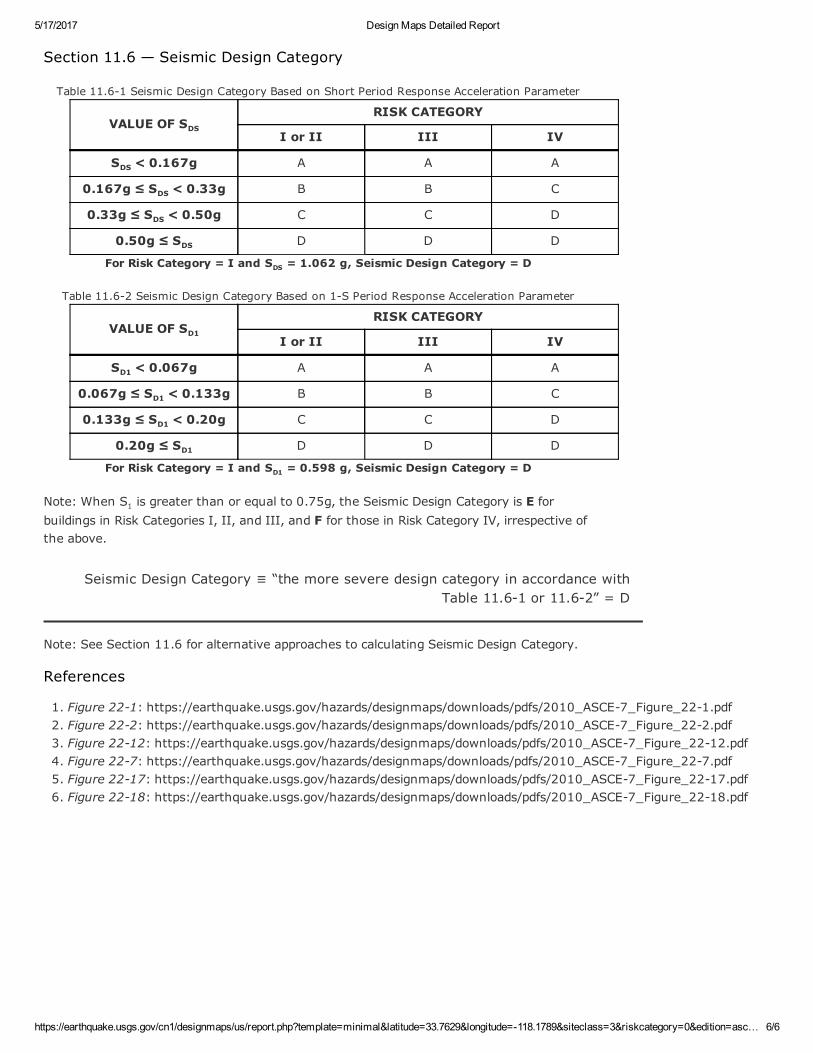
Section 11.6 — Seismic Design Category
Table 11.61 Seismic Design Category Based on Short Period Response Acceleration Parameter
VALUE OF SDSRISK CATEGORY
I or II III IV
SDS < 0.167g A A A
0.167g ≤ SDS < 0.33g B B C
0.33g ≤ SDS < 0.50g C C D
0.50g ≤ SDS D D D
For Risk Category = I and SDS = 1.062 g, Seismic Design Category = D
Table 11.62 Seismic Design Category Based on 1S Period Response Acceleration Parameter
VALUE OF SD1RISK CATEGORY
I or II III IV
SD1 < 0.067g A A A
0.067g ≤ SD1 < 0.133g B B C
0.133g ≤ SD1 < 0.20g C C D
0.20g ≤ SD1 D D D
For Risk Category = I and SD1 = 0.598 g, Seismic Design Category = D
Note: When S1 is greater than or equal to 0.75g, the Seismic Design Category is E forbuildings in Risk Categories I, II, and III, and F for those in Risk Category IV, irrespective ofthe above.
Seismic Design Category ≡ “the more severe design category in accordance withTable 11.61 or 11.62” = D
Note: See Section 11.6 for alternative approaches to calculating Seismic Design Category.
References
1. Figure 221: https://earthquake.usgs.gov/hazards/designmaps/downloads/pdfs/2010_ASCE7_Figure_221.pdf2. Figure 222: https://earthquake.usgs.gov/hazards/designmaps/downloads/pdfs/2010_ASCE7_Figure_222.pdf3. Figure 2212: https://earthquake.usgs.gov/hazards/designmaps/downloads/pdfs/2010_ASCE7_Figure_2212.pdf4. Figure 227: https://earthquake.usgs.gov/hazards/designmaps/downloads/pdfs/2010_ASCE7_Figure_227.pdf5. Figure 2217: https://earthquake.usgs.gov/hazards/designmaps/downloads/pdfs/2010_ASCE7_Figure_2217.pdf6. Figure 2218: https://earthquake.usgs.gov/hazards/designmaps/downloads/pdfs/2010_ASCE7_Figure_2218.pdf
5/17/2017 2008 National Seismic Hazard Maps Source Parameters
https://earthquake.usgs.gov/cfusion/hazfaults_2008_search/view_fault.cfm?cfault_id=127_alt1 1/2
2008 National Seismic Hazard Maps - SourceParameters
New Search
Fault Name State
Newport Inglewood Connected alt 1 California
GEOMETRY
Dip (degrees) 89
Dip direction
Sense of slip strike slip
Rupture top (km) 0
Rupture bottom (km) 11
Rake (degrees) 180
Length (km) 208
MODEL VALUES
Slip Rate 1.3
Probability of activity 1
ELLSWORTH HANKS
Minimum magnitude 6.5 6.5
Maximum magnitude 7.50 7.50
b-value 0.8 0.8
Fault Model Deformation Char Rate 1 GR-a-value 1 Weight
U.S. Geological Survey - Earthquake Hazards Program

5/17/2017 2008 National Seismic Hazard Maps Source Parameters
https://earthquake.usgs.gov/cfusion/hazfaults_2008_search/view_fault.cfm?cfault_id=127_alt1 2/2
Model
Stitched 2.1 3.79e-04 / 3.79e-04 1.884 / 1.884 0.50
1 1 st Value is based on Ellsworth relation and 2 nd value is based on Hanks and Bakunrelation
Comments
Rose Canyon; Newport-Inglewood (O�shore); Newport-Inglewood, alt 1
Selected References
Working Group on California Earthquake Probabilities, 1995, Seismic hazards insouthern California—Probable earthquakes, 1994 to 2024: Bulletin of theSeismological Society of America, v. 85, no. 2, p. 379-439.
5/17/2017 2008 National Seismic Hazard Maps Source Parameters
https://earthquake.usgs.gov/cfusion/hazfaults_2008_search/query_results.cfm 1/7
2008 National Seismic Hazard Maps - Source Parameters
New Search
Distancein Miles
Name State
PrefSlipRate(mm/yr)
Dip(degrees)
DipDir
SlipSense
RuptureTop(km)
RuptureBottom(km)
Length(km)
2.38 Newport Inglewood Connected alt 1 CA 1.3 89strikeslip
0 11 208
2.38 Newport-Inglewood, alt 1 CA 1 88strikeslip
0 15 65
2.47 Newport Inglewood Connected alt 2 CA 1.3 90 Vstrikeslip
0 11 208
4.50 Palos Verdes Connected CA 3 90 Vstrikeslip
0 10 285
4.50 Palos Verdes CA 3 90 Vstrikeslip
0 14 99
10.20 Puente Hills (Santa Fe Springs) CA 0.7 29 N thrust 2.8 15 11
11.84 Puente Hills (Coyote Hills) CA 0.7 26 N thrust 2.8 15 17
13.50 Puente Hills (LA) CA 0.7 27 N thrust 2.1 15 22
14.86 San Joaquin Hills CA 0.5 23 SW thrust 2 13 27
17.66 Elsinore;W+GI+T+J+CM CA n/a 84 NEstrikeslip
0 16 241
17.66 Elsinore;W+GI+T CA n/a 84 NEstrikeslip
0 14 124
17.66 Elsinore;W+GI CA n/a 81 NEstrikeslip
0 14 83
17.66 Elsinore;W CA 2.5 75 NEstrikeslip
0 14 46
17.66 Elsinore;W+GI+T+J CA n/a 84 NEstrikeslip
0 16 199
19.25 Newport-Inglewood (O넜�shore) CA 1.5 90 Vstrikeslip
0 10 66
20.71 Elysian Park (Upper) CA 1.3 50 NE reverse 3 15 20
24.37 Santa Monica Connected alt 2 CA 2.4 44strikeslip
0.8 11 93
24.60 Raymond CA 1.5 79 Nstrikeslip
0 16 22
24.75 Hollywood CA 1 70 Nstrikeslip
0 17 17
U.S. Geological Survey - Earthquake Hazards Program
5/17/2017 2008 National Seismic Hazard Maps Source Parameters
https://earthquake.usgs.gov/cfusion/hazfaults_2008_search/query_results.cfm 2/7
24.96 Santa Monica, alt 1 CA 1 75 N strikeslip
0 18 14
24.96 Santa Monica Connected alt 1 CA 2.6 51strikeslip
0 16 79
25.43 Verdugo CA 0.5 55 NE reverse 0 15 29
25.66 San Jose CA 0.5 74 NWstrikeslip
0 15 20
27.08 Malibu Coast, alt 2 CA 0.3 74 Nstrikeslip
0 16 38
27.08 Malibu Coast, alt 1 CA 0.3 75 Nstrikeslip
0 8 38
27.87 Anacapa-Dume, alt 2 CA 3 41 N thrust 1.2 12 65
29.16 Sierra Madre CA 2 53 N reverse 0 14 57
29.16 Sierra Madre Connected CA 2 51 reverse 0 14 76
30.38 Clamshell-Sawpit CA 0.5 50 NW reverse 0 14 16
30.42 Chino, alt 1 CA 1 50 SWstrikeslip
0 9 24
30.53 Chino, alt 2 CA 1 65 SWstrikeslip
0 14 29
33.38 Anacapa-Dume, alt 1 CA 3 45 N thrust 0 16 51
34.14 Elsinore;GI+T+J CA n/a 86 NEstrikeslip
0 17 153
34.14 Elsinore;GI+T+J+CM CA n/a 86 NEstrikeslip
0 16 195
34.14 Elsinore;GI CA 5 90 Vstrikeslip
0 13 37
34.14 Elsinore;GI+T CA 5 90 Vstrikeslip
0 14 78
35.91 Cucamonga CA 5 45 N thrust 0 8 28
36.16 Sierra Madre (San Fernando) CA 2 45 N thrust 0 13 18
36.54 Coronado Bank CA 3 90 Vstrikeslip
0 9 186
38.70 San Gabriel CA 1 61 Nstrikeslip
0 15 71
39.40 Northridge CA 1.5 35 S thrust 7.4 17 33
42.31 Santa Susana, alt 1 CA 5 55 N reverse 0 16 27
45.92 Elsinore;T CA 5 90 Vstrikeslip
0 14 52
45.92 Elsinore;T+J+CM CA n/a 85 NE strikeslip
0 16 169
5/17/2017 2008 National Seismic Hazard Maps Source Parameters
https://earthquake.usgs.gov/cfusion/hazfaults_2008_search/query_results.cfm 3/7
45.92 Elsinore;T+J CA n/a 86 NEstrikeslip
0 17 127
47.69 Simi-Santa Rosa CA 1 60strikeslip
1 12 39
49.85 Holser, alt 1 CA 0.4 58 S reverse 0 19 20
50.35 S. San Andreas;CH+CC+BB+NM+SM CA n/a 90 Vstrikeslip
0 14 306
50.35S. SanAndreas;CH+CC+BB+NM+SM+NSB+SSB+BG+CO
CA n/a 86strikeslip
0.1 13 512
50.35 S. San Andreas;SM CA 29 90 Vstrikeslip
0 13 98
50.35 S. San Andreas;NM+SM+NSB+SSB+BG+CO CA n/a 84strikeslip
0.1 13 340
50.35 S. San Andreas;NM+SM+NSB+SSB+BG CA n/a 83strikeslip
0 14 271
50.35 S. San Andreas;PK+CH+CC+BB+NM+SM+NSB CA n/a 90 Vstrikeslip
0.1 13 377
50.35 S. San Andreas;NM+SM+NSB+SSB CA n/a 90 Vstrikeslip
0 13 213
50.35 S. San Andreas;NM+SM+NSB CA n/a 90 Vstrikeslip
0 13 170
50.35 S. San Andreas;NM+SM CA n/a 90 Vstrikeslip
0 14 134
50.35 S. San Andreas;CH+CC+BB+NM+SM+NSB+SSB+BG CA n/a 86strikeslip
0 14 442
50.35 S. San Andreas;CH+CC+BB+NM+SM+NSB+SSB CA n/a 90 Vstrikeslip
0 14 384
50.35 S. San Andreas;CH+CC+BB+NM+SM+NSB CA n/a 90 Vstrikeslip
0 14 341
50.35 S. San Andreas;CC+BB+NM+SM+NSB+SSB+BG+CO CA n/a 86strikeslip
0.1 13 449
50.35 S. San Andreas;PK+CH+CC+BB+NM+SM+NSB+SSB CA n/a 90 Vstrikeslip
0.1 13 421
50.35 S. San Andreas;CC+BB+NM+SM+NSB+SSB+BG CA n/a 85strikeslip
0 14 380
50.35 S. San Andreas;CC+BB+NM+SM+NSB+SSB CA n/a 90 Vstrikeslip
0 14 322
50.35 S. San Andreas;CC+BB+NM+SM+NSB CA n/a 90 Vstrikeslip
0 14 279
50.35 S. San Andreas;CC+BB+NM+SM CA n/a 90 Vstrikeslip
0 14 243
50.35 S. San CA n/a 86 strike 0.1 13 479
5/17/2017 2008 National Seismic Hazard Maps Source Parameters
https://earthquake.usgs.gov/cfusion/hazfaults_2008_search/query_results.cfm 4/7
Andreas;PK+CH+CC+BB+NM+SM+NSB+SSB+BG slip
50.35S. SanAndreas;PK+CH+CC+BB+NM+SM+NSB+SSB+BG+CO
CA n/a 86strikeslip
0.1 13 548
50.35 S. San Andreas;BB+NM+SM+NSB CA n/a 90 Vstrikeslip
0 14 220
50.35 S. San Andreas;SM+NSB CA n/a 90 Vstrikeslip
0 13 133
50.35 S. San Andreas;SM+NSB+SSB CA n/a 90 Vstrikeslip
0 13 176
50.35 S. San Andreas;SM+NSB+SSB+BG CA n/a 81strikeslip
0 13 234
50.35 S. San Andreas;SM+NSB+SSB+BG+CO CA n/a 83strikeslip
0.1 13 303
50.35 S. San Andreas;BB+NM+SM+NSB+SSB CA n/a 90 Vstrikeslip
0 14 263
50.35 S. San Andreas;BB+NM+SM+NSB+SSB+BG CA n/a 84strikeslip
0 14 321
50.35 S. San Andreas;BB+NM+SM CA n/a 90 Vstrikeslip
0 14 184
50.35 S. San Andreas;BB+NM+SM+NSB+SSB+BG+CO CA n/a 85strikeslip
0.1 13 390
50.35 S. San Andreas;PK+CH+CC+BB+NM+SM CA n/a 90 Vstrikeslip
0.1 13 342
50.75 San Jacinto;SBV+SJV CA n/a 90 Vstrikeslip
0 16 88
50.75 San Jacinto;SBV CA 6 90 Vstrikeslip
0 16 45
50.75 San Jacinto;SBV+SJV+A CA n/a 90 Vstrikeslip
0 16 134
50.75 San Jacinto;SBV+SJV+A+C CA n/a 90 Vstrikeslip
0 17 181
50.75 San Jacinto;SBV+SJV+A+CC CA n/a 90 Vstrikeslip
0 16 181
50.75 San Jacinto;SBV+SJV+A+CC+B CA n/a 90 Vstrikeslip
0.1 15 215
50.75 San Jacinto;SBV+SJV+A+CC+B+SM CA n/a 90 Vstrikeslip
0.1 15 241
52.51 S. San Andreas;NSB+SSB+BG+CO CA n/a 79strikeslip
0.2 12 206
52.51 S. San Andreas;NSB CA 22 90 Vstrikeslip
0 13 35
52.51 S. San Andreas;NSB+SSB CA n/a 90 V strikeslip
0 13 79
5/17/2017 2008 National Seismic Hazard Maps Source Parameters
https://earthquake.usgs.gov/cfusion/hazfaults_2008_search/query_results.cfm 5/7
52.51 S. San Andreas;NSB+SSB+BG CA n/a 75strikeslip
0 14 136
53.77 Oak Ridge Connected CA 3.6 53 reverse 0.6 15 94
53.77 Oak Ridge (Onshore) CA 4 65 S reverse 1 19 49
55.72 Cleghorn CA 3 90 Vstrikeslip
0 16 25
56.86 San Jacinto;SJV+A+C CA n/a 90 Vstrikeslip
0 17 136
56.86 San Jacinto;SJV+A CA n/a 90 Vstrikeslip
0 17 89
56.86 San Jacinto;SJV+A+CC CA n/a 90 Vstrikeslip
0 16 136
56.86 San Jacinto;SJV CA 18 90 Vstrikeslip
0 16 43
56.86 San Jacinto;SJV+A+CC+B+SM CA n/a 90 Vstrikeslip
0.1 15 196
56.86 San Jacinto;SJV+A+CC+B CA n/a 90 Vstrikeslip
0.1 15 170
57.22 San Cayetano CA 6 42 N thrust 0 16 42
61.05 S. San Andreas;SSB+BG CA n/a 71strikeslip
0 13 101
61.05 S. San Andreas;SSB CA 16 90 Vstrikeslip
0 13 43
61.05 S. San Andreas;SSB+BG+CO CA n/a 77strikeslip
0.2 12 170
62.03 Rose Canyon CA 1.5 90 Vstrikeslip
0 8 70
62.16 San Jacinto;A+C CA n/a 90 Vstrikeslip
0 17 118
62.16 San Jacinto;A+CC CA n/a 90 Vstrikeslip
0 16 118
62.16 San Jacinto;A CA 9 90 Vstrikeslip
0 17 71
62.16 San Jacinto;A+CC+B+SM CA n/a 90 Vstrikeslip
0.1 15 178
62.16 San Jacinto;A+CC+B CA n/a 90 Vstrikeslip
0.1 15 152
64.03 Santa Cruz Island CA 1 90 Vstrikeslip
0 13 69
64.65 North Frontal (West) CA 1 49 S reverse 0 16 50
64.94 Channel Islands Thrust CA 1.5 20 N thrust 5 12 59

5/17/2017 2008 National Seismic Hazard Maps Source Parameters
https://earthquake.usgs.gov/cfusion/hazfaults_2008_search/query_results.cfm 6/7
67.21 S. San Andreas;BB+NM CA n/a 90 Vstrikeslip
0 15 87
67.21 S. San Andreas;CC+BB+NM CA n/a 90 Vstrikeslip
0 15 146
67.21 S. San Andreas;CH+CC+BB+NM CA n/a 90 Vstrikeslip
0 14 208
67.21 S. San Andreas;NM CA 27 90 Vstrikeslip
0 15 37
67.21 S. San Andreas;PK+CH+CC+BB+NM CA n/a 90 Vstrikeslip
0.1 12 245
68.22 Pitas Point Connected CA 1 55 reverse 1.2 13 78
68.22 Ventura-Pitas Point CA 1 64 N reverse 1 15 44
70.23 Santa Ynez (East) CA 2 70 Sstrikeslip
0 13 68
70.23 Santa Ynez Connected CA 2 70strikeslip
0 11 132
71.31 Oak Ridge (O넜�shore) CA 3 32 S thrust 0 8 38
73.50 Elsinore;J+CM CA 3 84 NEstrikeslip
0 17 118
73.50 Elsinore;J CA 3 84 NEstrikeslip
0 19 75
74.71 Mission Ridge-Arroyo Parida-Santa Ana CA 0.4 70 S reverse 0 8 69
75.82 Red Mountain CA 2 56 N reverse 0 14 101
79.77 Pitas Point (Lower)-Montalvo CA 2.5 16 N thrust 0.4 13 30
80.24 S. San Andreas;BG CA n/a 58strikeslip
0 13 56
80.24 S. San Andreas;BG+CO CA n/a 72strikeslip
0.3 12 125
81.17 North Channel CA 1 26 N thrust 1.1 5 51
82.74 S. San Andreas;BB CA 34 90 Vstrikeslip
0 15 50
82.74 S. San Andreas;CC+BB CA n/a 90 Vstrikeslip
0 15 109
82.74 S. San Andreas;PK+CH+CC+BB CA n/a 90 Vstrikeslip
0.1 12 208
82.74 S. San Andreas;CH+CC+BB CA n/a 90 Vstrikeslip
0 14 171
83.31 Helendale-So Lockhart CA 0.6 90 Vstrikeslip
0 13 114
83.46 Garlock;GC+GW CA n/a 90 V strike 0.4 12 210
5/17/2017 2008 National Seismic Hazard Maps Source Parameters
https://earthquake.usgs.gov/cfusion/hazfaults_2008_search/query_results.cfm 7/7
slip
83.46 Garlock;GE+GC+GW CA n/a 90 Vstrikeslip
0.3 12 256
83.46 Garlock;GW CA 6 90 Vstrikeslip
0.7 14 98
86.15 Pinto Mtn CA 2.5 90 Vstrikeslip
0 16 74
88.42 North Frontal (East) CA 0.5 41 S thrust 0 16 27
88.83 Pitas Point (Upper) CA 1 42 N thrust 1.4 10 35
90.19 Pleito CA 2 46 S reverse 0 14 44
96.43 San Jacinto;CC CA 4 90 Vstrikeslip
0 16 43
96.43 San Jacinto;CC+B CA n/a 90 Vstrikeslip
0.2 14 77
96.43 San Jacinto;CC+B+SM CA n/a 90 Vstrikeslip
0.2 14 103
96.91 Lenwood-Lockhart-Old Woman Springs CA 0.9 90 Vstrikeslip
0 13 145
97.30 Pitas Point (Lower, West) CA 2.5 13 N thrust 1.5 9 35
97.75 Santa Ynez (West) CA 2 70 Sstrikeslip
0 9 63
97.81 San Jacinto;C CA 14 90 Vstrikeslip
0 17 47
99.22 White Wolf CA 2 75 S reverse 0 14 63
AESCO
APPENDIX
LIQUEFACTION ANALYSIS
liquefaction.sum ******************************************************************************************************* LIQUEFACTION ANALYSIS CALCULATION SHEET Copyright by CivilTech Software www.civiltech.com (425) 453-6488 Fax (425) 453-5848 ******************************************************************************************************* Licensed to , 5/31/2017 8:31:57 AM
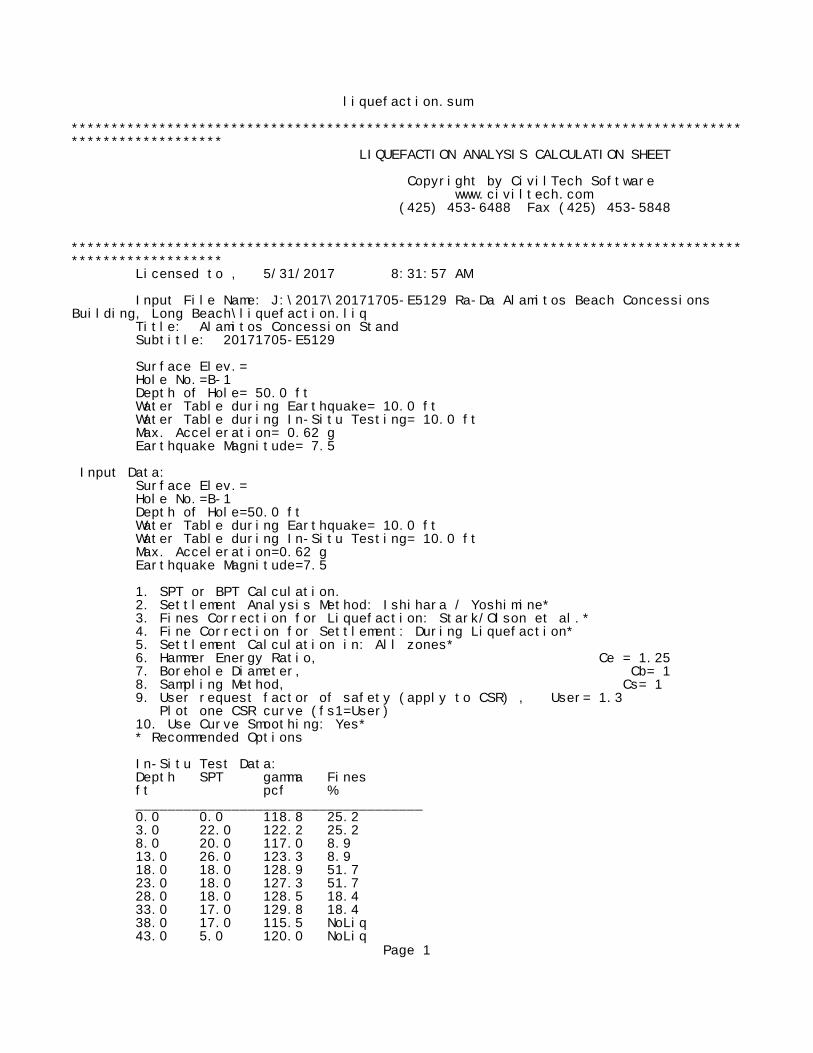
Input File Name: J:\2017\20171705-E5129 Ra-Da Alamitos Beach Concessions Building, Long Beach\liquefaction.liq Title: Alamitos Concession Stand Subtitle: 20171705-E5129
Surface Elev.= Hole No.=B-1 Depth of Hole= 50.0 ft Water Table during Earthquake= 10.0 ft Water Table during In-Situ Testing= 10.0 ft Max. Acceleration= 0.62 g Earthquake Magnitude= 7.5
Input Data: Surface Elev.= Hole No.=B-1 Depth of Hole=50.0 ft Water Table during Earthquake= 10.0 ft Water Table during In-Situ Testing= 10.0 ft Max. Acceleration=0.62 g Earthquake Magnitude=7.5
1. SPT or BPT Calculation. 2. Settlement Analysis Method: Ishihara / Yoshimine* 3. Fines Correction for Liquefaction: Stark/Olson et al.* 4. Fine Correction for Settlement: During Liquefaction* 5. Settlement Calculation in: All zones* 6. Hammer Energy Ratio, Ce = 1.25 7. Borehole Diameter, Cb= 1 8. Sampling Method, Cs= 1 9. User request factor of safety (apply to CSR) , User= 1.3 Plot one CSR curve (fs1=User) 10. Use Curve Smoothing: Yes* * Recommended Options
In-Situ Test Data: Depth SPT gamma Fines ft pcf % ____________________________________ 0.0 0.0 118.8 25.2 3.0 22.0 122.2 25.2 8.0 20.0 117.0 8.9 13.0 26.0 123.3 8.9 18.0 18.0 128.9 51.7 23.0 18.0 127.3 51.7 28.0 18.0 128.5 18.4 33.0 17.0 129.8 18.4 38.0 17.0 115.5 NoLiq 43.0 5.0 120.0 NoLiq
Page 1
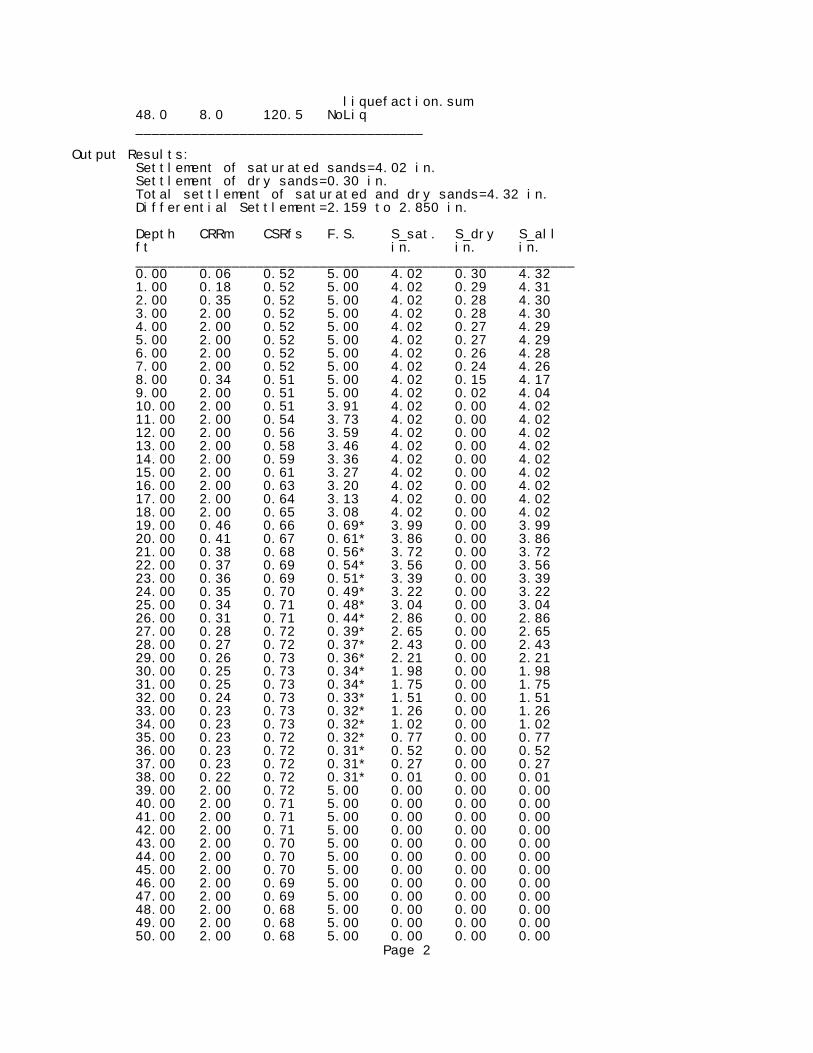
liquefaction.sum 48.0 8.0 120.5 NoLiq ____________________________________
Output Results: Settlement of saturated sands=4.02 in. Settlement of dry sands=0.30 in. Total settlement of saturated and dry sands=4.32 in. Differential Settlement=2.159 to 2.850 in.
Depth CRRm CSRfs F.S. S_sat. S_dry S_all ft in. in. in. _______________________________________________________ 0.00 0.06 0.52 5.00 4.02 0.30 4.32 1.00 0.18 0.52 5.00 4.02 0.29 4.31 2.00 0.35 0.52 5.00 4.02 0.28 4.30 3.00 2.00 0.52 5.00 4.02 0.28 4.30 4.00 2.00 0.52 5.00 4.02 0.27 4.29 5.00 2.00 0.52 5.00 4.02 0.27 4.29 6.00 2.00 0.52 5.00 4.02 0.26 4.28 7.00 2.00 0.52 5.00 4.02 0.24 4.26 8.00 0.34 0.51 5.00 4.02 0.15 4.17 9.00 2.00 0.51 5.00 4.02 0.02 4.04 10.00 2.00 0.51 3.91 4.02 0.00 4.02 11.00 2.00 0.54 3.73 4.02 0.00 4.02 12.00 2.00 0.56 3.59 4.02 0.00 4.02 13.00 2.00 0.58 3.46 4.02 0.00 4.02 14.00 2.00 0.59 3.36 4.02 0.00 4.02 15.00 2.00 0.61 3.27 4.02 0.00 4.02 16.00 2.00 0.63 3.20 4.02 0.00 4.02 17.00 2.00 0.64 3.13 4.02 0.00 4.02 18.00 2.00 0.65 3.08 4.02 0.00 4.02 19.00 0.46 0.66 0.69* 3.99 0.00 3.99 20.00 0.41 0.67 0.61* 3.86 0.00 3.86 21.00 0.38 0.68 0.56* 3.72 0.00 3.72 22.00 0.37 0.69 0.54* 3.56 0.00 3.56 23.00 0.36 0.69 0.51* 3.39 0.00 3.39 24.00 0.35 0.70 0.49* 3.22 0.00 3.22 25.00 0.34 0.71 0.48* 3.04 0.00 3.04 26.00 0.31 0.71 0.44* 2.86 0.00 2.86 27.00 0.28 0.72 0.39* 2.65 0.00 2.65 28.00 0.27 0.72 0.37* 2.43 0.00 2.43 29.00 0.26 0.73 0.36* 2.21 0.00 2.21 30.00 0.25 0.73 0.34* 1.98 0.00 1.98 31.00 0.25 0.73 0.34* 1.75 0.00 1.75 32.00 0.24 0.73 0.33* 1.51 0.00 1.51 33.00 0.23 0.73 0.32* 1.26 0.00 1.26 34.00 0.23 0.73 0.32* 1.02 0.00 1.02 35.00 0.23 0.72 0.32* 0.77 0.00 0.77 36.00 0.23 0.72 0.31* 0.52 0.00 0.52 37.00 0.23 0.72 0.31* 0.27 0.00 0.27 38.00 0.22 0.72 0.31* 0.01 0.00 0.01 39.00 2.00 0.72 5.00 0.00 0.00 0.00 40.00 2.00 0.71 5.00 0.00 0.00 0.00 41.00 2.00 0.71 5.00 0.00 0.00 0.00 42.00 2.00 0.71 5.00 0.00 0.00 0.00 43.00 2.00 0.70 5.00 0.00 0.00 0.00 44.00 2.00 0.70 5.00 0.00 0.00 0.00 45.00 2.00 0.70 5.00 0.00 0.00 0.00 46.00 2.00 0.69 5.00 0.00 0.00 0.00 47.00 2.00 0.69 5.00 0.00 0.00 0.00 48.00 2.00 0.68 5.00 0.00 0.00 0.00 49.00 2.00 0.68 5.00 0.00 0.00 0.00 50.00 2.00 0.68 5.00 0.00 0.00 0.00
Page 2
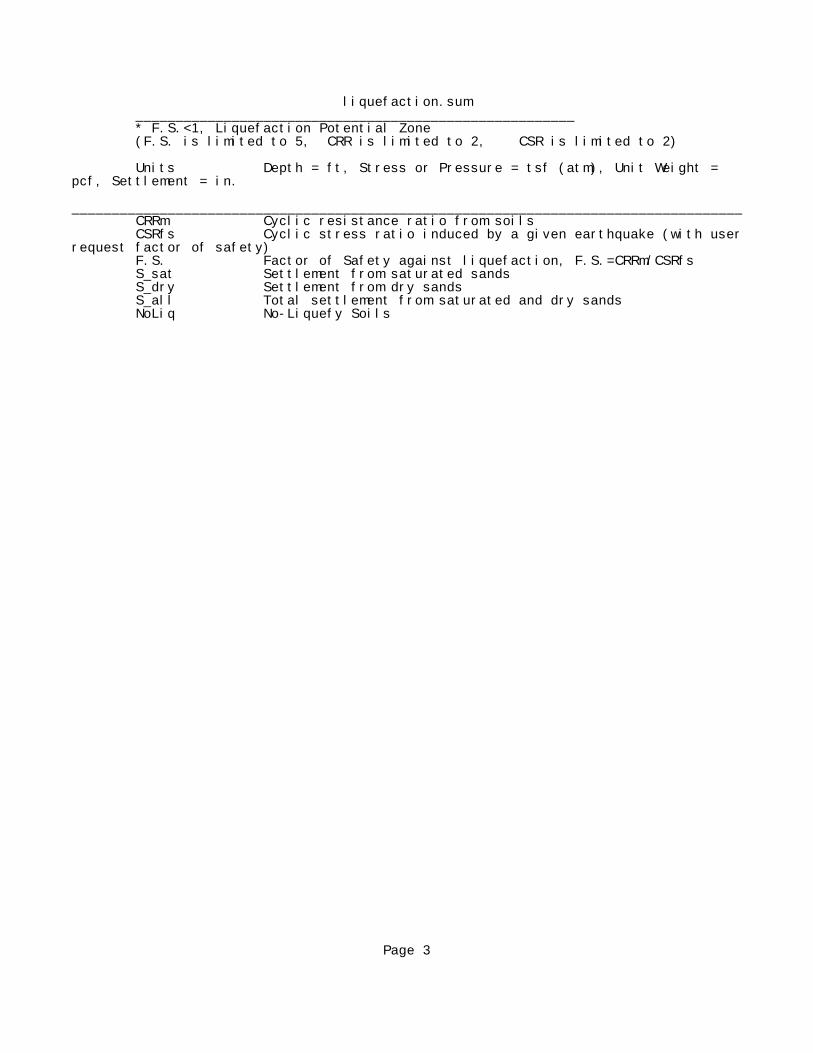
liquefaction.sum _______________________________________________________ * F.S.<1, Liquefaction Potential Zone (F.S. is limited to 5, CRR is limited to 2, CSR is limited to 2)
Units Depth = ft, Stress or Pressure = tsf (atm), Unit Weight = pcf, Settlement = in. ____________________________________________________________________________________ CRRm Cyclic resistance ratio from soils CSRfs Cyclic stress ratio induced by a given earthquake (with userrequest factor of safety) F.S. Factor of Safety against liquefaction, F.S.=CRRm/CSRfs S_sat Settlement from saturated sands S_dry Settlement from dry sands S_all Total settlement from saturated and dry sands NoLiq No-Liquefy Soils
Page 3

liquefaction.sum ******************************************************************************************************* LIQUEFACTION ANALYSIS CALCULATION SHEET Copyright by CivilTech Software www.civiltech.com (425) 453-6488 Fax (425) 453-5848 ******************************************************************************************************* Licensed to , 5/31/2017 8:31:57 AM
Input File Name: J:\2017\20171705-E5129 Ra-Da Alamitos Beach Concessions Building, Long Beach\liquefaction.liq Title: Alamitos Concession Stand Subtitle: 20171705-E5129
Surface Elev.= Hole No.=B-1 Depth of Hole= 50.0 ft Water Table during Earthquake= 10.0 ft Water Table during In-Situ Testing= 10.0 ft Max. Acceleration= 0.62 g Earthquake Magnitude= 7.5
Input Data: Surface Elev.= Hole No.=B-1 Depth of Hole=50.0 ft Water Table during Earthquake= 10.0 ft Water Table during In-Situ Testing= 10.0 ft Max. Acceleration=0.62 g Earthquake Magnitude=7.5
1. SPT or BPT Calculation. 2. Settlement Analysis Method: Ishihara / Yoshimine* 3. Fines Correction for Liquefaction: Stark/Olson et al.* 4. Fine Correction for Settlement: During Liquefaction* 5. Settlement Calculation in: All zones* 6. Hammer Energy Ratio, Ce = 1.25 7. Borehole Diameter, Cb= 1 8. Sampling Method, Cs= 1 9. User request factor of safety (apply to CSR) , User= 1.3 Plot one CSR curve (fs1=User) 10. Use Curve Smoothing: Yes* * Recommended Options
In-Situ Test Data: Depth SPT gamma Fines ft pcf % ____________________________________ 0.0 0.0 118.8 25.2 3.0 22.0 122.2 25.2 8.0 20.0 117.0 8.9 13.0 26.0 123.3 8.9 18.0 18.0 128.9 51.7 23.0 18.0 127.3 51.7 28.0 18.0 128.5 18.4 33.0 17.0 129.8 18.4 38.0 17.0 115.5 NoLiq 43.0 5.0 120.0 NoLiq
Page 1

liquefaction.sum 48.0 8.0 120.5 NoLiq ____________________________________
Output Results: Settlement of saturated sands=4.02 in. Settlement of dry sands=0.30 in. Total settlement of saturated and dry sands=4.32 in. Differential Settlement=2.159 to 2.850 in.
Depth CRRm CSRfs F.S. S_sat. S_dry S_all ft in. in. in. _______________________________________________________ 0.00 0.06 0.52 5.00 4.02 0.30 4.32 1.00 0.18 0.52 5.00 4.02 0.29 4.31 2.00 0.35 0.52 5.00 4.02 0.28 4.30 3.00 2.00 0.52 5.00 4.02 0.28 4.30 4.00 2.00 0.52 5.00 4.02 0.27 4.29 5.00 2.00 0.52 5.00 4.02 0.27 4.29 6.00 2.00 0.52 5.00 4.02 0.26 4.28 7.00 2.00 0.52 5.00 4.02 0.24 4.26 8.00 0.34 0.51 5.00 4.02 0.15 4.17 9.00 2.00 0.51 5.00 4.02 0.02 4.04 10.00 2.00 0.51 3.91 4.02 0.00 4.02 11.00 2.00 0.54 3.73 4.02 0.00 4.02 12.00 2.00 0.56 3.59 4.02 0.00 4.02 13.00 2.00 0.58 3.46 4.02 0.00 4.02 14.00 2.00 0.59 3.36 4.02 0.00 4.02 15.00 2.00 0.61 3.27 4.02 0.00 4.02 16.00 2.00 0.63 3.20 4.02 0.00 4.02 17.00 2.00 0.64 3.13 4.02 0.00 4.02 18.00 2.00 0.65 3.08 4.02 0.00 4.02 19.00 0.46 0.66 0.69* 3.99 0.00 3.99 20.00 0.41 0.67 0.61* 3.86 0.00 3.86 21.00 0.38 0.68 0.56* 3.72 0.00 3.72 22.00 0.37 0.69 0.54* 3.56 0.00 3.56 23.00 0.36 0.69 0.51* 3.39 0.00 3.39 24.00 0.35 0.70 0.49* 3.22 0.00 3.22 25.00 0.34 0.71 0.48* 3.04 0.00 3.04 26.00 0.31 0.71 0.44* 2.86 0.00 2.86 27.00 0.28 0.72 0.39* 2.65 0.00 2.65 28.00 0.27 0.72 0.37* 2.43 0.00 2.43 29.00 0.26 0.73 0.36* 2.21 0.00 2.21 30.00 0.25 0.73 0.34* 1.98 0.00 1.98 31.00 0.25 0.73 0.34* 1.75 0.00 1.75 32.00 0.24 0.73 0.33* 1.51 0.00 1.51 33.00 0.23 0.73 0.32* 1.26 0.00 1.26 34.00 0.23 0.73 0.32* 1.02 0.00 1.02 35.00 0.23 0.72 0.32* 0.77 0.00 0.77 36.00 0.23 0.72 0.31* 0.52 0.00 0.52 37.00 0.23 0.72 0.31* 0.27 0.00 0.27 38.00 0.22 0.72 0.31* 0.01 0.00 0.01 39.00 2.00 0.72 5.00 0.00 0.00 0.00 40.00 2.00 0.71 5.00 0.00 0.00 0.00 41.00 2.00 0.71 5.00 0.00 0.00 0.00 42.00 2.00 0.71 5.00 0.00 0.00 0.00 43.00 2.00 0.70 5.00 0.00 0.00 0.00 44.00 2.00 0.70 5.00 0.00 0.00 0.00 45.00 2.00 0.70 5.00 0.00 0.00 0.00 46.00 2.00 0.69 5.00 0.00 0.00 0.00 47.00 2.00 0.69 5.00 0.00 0.00 0.00 48.00 2.00 0.68 5.00 0.00 0.00 0.00 49.00 2.00 0.68 5.00 0.00 0.00 0.00 50.00 2.00 0.68 5.00 0.00 0.00 0.00
Page 2

liquefaction.sum _______________________________________________________ * F.S.<1, Liquefaction Potential Zone (F.S. is limited to 5, CRR is limited to 2, CSR is limited to 2)
Units Depth = ft, Stress or Pressure = tsf (atm), Unit Weight = pcf, Settlement = in. ____________________________________________________________________________________ CRRm Cyclic resistance ratio from soils CSRfs Cyclic stress ratio induced by a given earthquake (with userrequest factor of safety) F.S. Factor of Safety against liquefaction, F.S.=CRRm/CSRfs S_sat Settlement from saturated sands S_dry Settlement from dry sands S_all Total settlement from saturated and dry sands NoLiq No-Liquefy Soils
Page 3