Embed Size (px)
Citation preview

GEOTECHNICAL INVESTIGATION I-15 SIGN BRIDGES
LAS VEGAS EA 73171
JANUARY 2006
MATERIALS DIVISION

STATE OF NEVADA
DEPARTMENT OF TRANSPORTATION
MATERIALS DIVISION
GEOTECHNICAL SECTION
GEOTECHNICAL REPORT I-15 SIGN BRIDGES
JANUARY 2006
EA 73171 Fund 1 LAS VEGAS, NEVADA
Prepared by: ______________________________
Dana Boomhower, P.E. Senior Materials Engineer - Geotechnical
Reviewed by: ______________________________
Jeff Palmer, Ph.D., P.E. Principal Geotechnical Engineer
Approved by: ______________________________
Dean Weitzel, P.E. Chief Materials Engineer

This report has been prepared for the proposed sign bridge structures located on I-15 between
Russell Road and Flamingo Road in Las Vegas. I-15 runs approximately north-south at this
location, and is currently five lanes wide in each direction. The proposed plan calls for
construction of two new sign bridge structures. For a more detailed description, see the contract
plans for this project.
The Nevada Department of Transportation (NDOT) Geotechnical Section conducted a subsurface
investigation at the proposed project site in December of 2005. Subsurface soil conditions were
explored by drilling three boreholes (SB-1, SB-2 and SB-3) to a maximum depth of 35.0 feet.
The approximate locations of the boreholes are shown on the Borehole Locations sheet in
Appendix A. Surface elevations were obtained for the borehole locations by extrapolating from
plan sheets. Drilling was accomplished utilizing a Diedrich D-120 drill rig equipped for soil
sampling, using six-inch (6") hollow stem auger. One run of rock core was obtained from
borehole SB-3. An automatic hammer was used to drive all driven samples. All soil samples
were classified, both visually and using laboratory data, using the Unified Soil Classification
System (USCS) as set forth in ASTM test number D2487.
The sites are founded primarily in quaternary alluvial deposits (Qa and Qoa). These deposits
range from unconsolidated to locally cemented. Caliche (cemented soil deposits) was
encountered in two of the three boreholes (SB-1 and SB-3). The area lies at an elevation of
approximately 2135 feet at the northern sign and approximately 2175 feet at the southern sign,
and slopes gently downward to the east. Groundwater was encountered in borehole SB-1 at an
approximate depth of 22 feet.
The results of the testing program show that the soils consist primarily of silty and clayey sands
with gravel. Plasticity Indexes (PI) ranged from NP (Non-Plastic) to 80, with liquid limits
between 22 and 118, indicating a wide variety of soil types.
1

KEY TO BORING LOGS
PARTICLE SIZE LIMITS CLAY SILT SAND GRAVEL COBBLES BOULDERS
FINE MEDIUM COARSE FINE COARSE
.002 mm #200 #40 #10 #4 3/4 inch 3 inch 12 inch
USCS GROUP TYPICAL SOIL DESCRIPTION
GW Well graded gravels, gravel-sand mixtures, little or no fines GP Poorly graded gravels, gravel-sand mixtures, little or no fines GM Silty gravels, poorly graded gravel-sand-silt mixtures GC Clayey gravels, poorly graded gravel-sand-clay mixtures SW Well graded sands, gravelly sands, little or no fines SP Poorly graded sands, gravelly sands, little or no fines SM Silty sands, poorly graded sand-silt mixtures SC Clayey sands, poorly graded sand-clay mixtures ML Inorganic silts and very fine sands, rock flour, silty or clayey fine sands with slight plasticity CL Inorganic clays of low to medium plasticity, gravelly clays, sandy clays, silty clays, lean clays OL Organic silts and organic silt-clays of low plasticity MH Inorganic silts, micaceous or diatomaceous fine sandy or silty soils, elastic silts CH Inorganic clays of high plasticity, fat clays OH Organic clays of medium to high plasticity CS Claystone/Siltstone PT Peat and other highly organic soils MOISTURE CONDITION CRITERIA SOIL CEMENTATION CRITERIADescription Criteria Description CriteriaDry Absence of moisture, dusty, Weak Crumbles or breaks with handling or little dry to touch. finger pressure. Moist Damp, no visible free water. Moderate Crumbles or breaks with considerable Wet Visible free water, usually below finger pressure. groundwater table. Strong Won’t break or crumble w/finger pressure. Groundwater Elevation Symbols
STANDARD PENETRATION CLASSIFICATION* Blow counts on Calif. Modified
GRANULAR SOIL CLAYEY SOIL Sampler (NCMS) can be converted BLOWS/FT DENSITY BLOWS/FT CONSISTENCY to NSPT by: 0 - 4 VERY LOOSE 0 – 1 VERY SOFT (NCMS)(0.62) = NSPT 5 - 10 LOOSE 2 - 4 SOFT 11 - 30 MEDIUM DENSE 5 - 8 MEDIUM STIFF Blow counts from Automatic or 31 - 50 DENSE 9 - 15 STIFF Safety Hammer can be converted OVER 50 VERY DENSE 16 - 30 VERY STIFF to Standard SPT N60 by:
*Standard Penetration Test (N) 140 lb hammer 31 - 60 HARD (NAUTOMATIC)(1.30) =N60 30 inch free-fall on 2 inch O.D. x 1.4 inch I.D. sampler OVER 60 VERY HARD (NSAFETY)(1.17) =N60
TEST ABBREVIATIONS SAMPLER NOTATIONCD CONSOLIDATED DRAINED O ORGANIC CONTENT CMS CALIF. MODIFIED SAMPLERCH CHEMICAL (CORROSIVENESS) OC CONSOLIDATION CPT CONE PENETRATION
CM COMPACTION PI PLASTICITY INDEX CS CONTINUOUS SAMPLERCU CONSOLIDATED UNDRAINED RQD ROCK QUALITY DESIGNATION CSS CALIFORNIA SPLIT SPOON D DISPERSIVE SOILS RV R-VALUE P PUSHED (NOT DRIVEN) DS DIRECT SHEAR S SIEVE ANALYSIS PB PITCHER BARREL
E EXPANSIVE SOIL SL SHRINKAGE LIMIT RC ROCK COREG SPECIFIC GRAVITY U UNCONFINED COMPRESSION SH SHELBY TUBE
H HYDROMETER UU UNCONSOLIDATED UNDRAINED SPT STANDARD PENETRATION TEST HC HYDRO-COLLAPSE UW UNIT WEIGHT TP TEST PIT K PERMEABILITY W MOISTURE CONTENT
- I.D.= 2.421 inch SOIL COLOR DESIGNATIONS ARE FROM THE MUNSELL SOIL COLOR CHART. - I.D.=3.228 inch with tube; 3.50 inch w/o tube
EXAMPLE: (7.5 YR 5/3) BROWN - NXB I.D.= 1.875 inch - I.D.= 2.875 inch
LAST MODIFIED: October 11, 2006

B.O.H.
1.00
4.70
GRAVELLY FAT CLAY with SAND Mediumstiff to stiff, damp, brown (7.5YR 5/3)
SANDY FAT CLAY with GRAVEL Soft tomedium stiff, moist, brown (7.5YR 4/4)
SILTY SAND Damp, medium dense, brown,(7.5YR 5/4)
CLAYEY SAND with GRAVEL Medium stiff tostiff, damp, pink (7.5YR 7/3)
CLAYEY SAND Soft to medium stiff, moist, palebrown (10YR 6/3)
FAT CLAY with SAND Soft to medium stiff,moist, light gray (10YR 7/2) to pale brown (10YR6/3)
SANDY LEAN CLAY Soft to medium stiff, moist,light gray (10YR 7/2)
SILTY SAND with GRAVEL Damp, dense, lightgray, (10YR 7/2)
CALICHE Hard, light gray, (10YR 7/2)
SILTY SAND with GRAVEL Damp, lightyellowish brown (10YR 6/4)
CE
SPT
SPT
SPT
SPT
CH
CH
SM
SC
CH
Free waterbetween 21' and23.5'.
SM
F
SM
35.00
31.75
29.20
26.75
19.70
16.8016.00
11.00
7.00
CL
FILL Sandy gravel, dry
5.00
SPT
E
D
C
B
A
35.00
30.00
25.00
20.10
8.50
33.50
28.50
23.50
18.50
13.50
7.00
3.50
G
15.10
ELEV. ft
Between Russel Road and Flamingo Road
DRILLINGMETHOD
SB-1
DATE
DEPTH ft
Automatic2110.5
SAMPLETYPE 6 inch
Increments
GROUNDWATER LEVEL
12/6/05
BACKFILLED
I-15 SIGN BRIDGES
MATERIAL DESCRIPTION
SHEET 1 OF 1
12/6/2005
STATIONOFFSETENGINEEREQUIPMENTOPERATOR
NO.
22.00
SPT
12/6/05
BLOW COUNT
"Le"587+56108' LeftBoomhowerDiedrich D-120Marshall
HAMMER DROP SYSTEM
GROUND ELEV.
E.A. #
BORING
LOCATION
JOB DESCRIPTION
END DATE
START DATE
2132.50 (ft)
PercentRecov'd
12/6/05
73171
REMARKS
DATE
ELEV.(ft)
DEPTH(ft)
Last1 foot
USCSGroup
Yes6" H.S.A.
EXPLORATION LOG
LAB TESTS
5
10
15
20
25
30
35
2127.5
2122.5
2117.5
2112.5
2107.5
2102.5
2097.5100
75
100
100
100
75
70
NV
_DO
T G
INT.
GP
J N
V_D
OT.
GD
T 1
1/19
/08
5
10
15
20
25
30
35
SPT

F
11.75
6.50
1.00
21.75
26.75
B.O.H.
SANDY FAT CLAY Medium stiff, moist, white(2.5Y 8/1)
CLAYEY SAND with GRAVEL Medium stiff tostiff, damp, light brown, (7.5YR 6/3)
SANDY SILTY CLAY Damp, dense, pink(7.5YR 7/3)
SANDY LEAN CLAY Medium stiff, moist, pink(7.5YR 7/3)
POORLY GRADED SAND with SILT andGRAVEL Damp, dense, light brown, (7.5YR6/4)
SILTY SAND with GRAVEL Damp, dense, lightgray (10YR 7/2)
SPT
50
100
90
85
90
80
SPT
SPT
16.75
SPT
E
SPT
CH
SC
CLML
CL
SPSM
SM
28.90
SPT
FILL Sandy gravel, dry
28.50
D
C
B
A
28.90
25.00
20.00
15.00
4.50
23.50
18.50
13.50
8.50
3.00
10.00
TYPE
2169.5
2164.5
2159.5
2154.5
2149.5
2144.5
2139.5
73171
PercentRecov'd
Between Russel Road and Flamingo Road
DRILLINGMETHOD
SB-2
DATE
DEPTH ft
EXPLORATION LOG
SAMPLE
6" H.S.A.
12/7/05
6 inchIncrements
ELEV. ft
12/7/05
BACKFILLED
I-15 SIGN BRIDGES
MATERIAL DESCRIPTION
SHEET 1 OF 1
Automatic
LAB TESTS
"Le"537+707' RightBoomhowerDiedrich D-120Marshall
HAMMER DROP SYSTEM
GROUND ELEV.
E.A. #
BORING
LOCATION
JOB DESCRIPTION
END DATE
GROUNDWATER LEVEL
2174.50 (ft)
NO.BLOW COUNT
REMARKS
DATE
ELEV.(ft)
DEPTH(ft)
Last1 foot
USCSGroup
Yes
START DATE
5
10
15
20
25
30
35
12/7/2005
NV
_DO
T G
INT.
GP
J N
V_D
OT.
GD
T 1
1/19
/08
5
10
15
20
25
30
35
STATIONOFFSETENGINEEREQUIPMENTOPERATOR

11.50
6.25
1.00 FILL Sandy gravel, dry
21.25
CLAYEY SAND with GRAVEL Stiff to hard,moist, light gray (10YR 7/2), with cementedlenses
B.O.H.
SANDY LEAN CLAY Soft to medium stiff, moist,light gray (10YR 7/2)
CLAYEY SAND with GRAVEL Soft to mediumstiff, moist, light gray (10YR 7/2)
CLAYEY GRAVEL with SAND Stiff to hard,moist, pinkish gray (7.5YR 6/2), with cementedlenses
CALICHE Hard, light gray (10YR 7/2)
SANDY LEAN CLAY Damp, medium stiff to stiff,moist, very pale brown (10YR 8/2)
SC
100
35
80
95
SPT
SPT
SPT
RC
11.80
SPT
13.30
CL
SC
GC
CE
CL
SM
28.50
26.25
F
SPT
SILTY SAND with GRAVEL Dry, medium dense,brown (10YR 5/3)
4.50
E
D
C
B
A
28.50
24.50
19.50
9.40
28.00
23.00
18.00
13.50
8.00
3.00
2130.5
2125.5
2120.5
2115.5
2110.5
2105.5
2100.5
17.60
12/7/05
73171
PercentRecov'd
Between Russel Road and Flamingo Road
DRILLINGMETHOD
SB-3
DATE
DEPTH ft
Automatic
100
TYPE
6" H.S.A. w/ rock core
6 inchIncrements
ELEV. ft
12/7/05
BACKFILLED
I-15 SIGN BRIDGES
MATERIAL DESCRIPTION
SHEET 1 OF 1
12/7/2005
SAMPLELAB TESTS
"Le"587+626' LeftBoomhowerDiedrich D-120Marshall
HAMMER DROP SYSTEM
GROUND ELEV.
E.A. #
BORING
LOCATION
JOB DESCRIPTION
END DATE
GROUNDWATER LEVEL
2135.50 (ft)
EXPLORATION LOG
BLOW COUNTREMARKS
DATE
ELEV.(ft)
DEPTH(ft)
Last1 foot
USCSGroup
Yes
START DATE
STATIONOFFSETENGINEEREQUIPMENTOPERATOR
5
10
15
20
25
30
35
NV
_DO
T G
INT.
GP
J N
V_D
OT.
GD
T 1
1/19
/08 100
5
10
15
20
25
30
35
NO.

NEVADA DEPARTMENT OF
TRANSPORTATION
Silty sand with gravel
Silty sand with gravel
Sandy lean clay
inches numbersize size
50.3 32.8 SM
30.8 43.8 SM
0.0 0.0 34.4 43.3 22.3 CL A-6(7) 12 27
3/41/23/8
94.593.591.7
93.690.086.1
#4#10#16#40#50
#100#200
83.171.265.257.053.940.032.8
74.665.362.158.356.650.143.8
100.0100.0
99.2
79.665.6
0.6527 0.6896 0.0297
0.0029
Source of Sample: SB-1 Depth: 3.5 to 4.7 Sample Number: A
Source of Sample: SB-1 Depth: 7.0 to 8.5 Sample Number: B
Source of Sample: SB-1 Depth: 13.5 to 15.1 Sample Number: C
Boomhower
I-15 Sign Bridges
73171 fund 9
+3" % GRAVEL % SAND % SILT % CLAY USCS AASHTO PL LL
SIEVE PERCENT FINER SIEVE PERCENT FINER Material Description
GRAIN SIZE REMARKS:
D60
D30
D10
COEFFICIENTS
Cc
Cu
Client:
Project:
Project No.: Figure
PE
RC
EN
T F
INE
R
0
10
20
30
40
50
60
70
80
90
100
GRAIN SIZE - mm.
0.0010.010.1110100
6 in
.
3 in
.
2 in
.
1½
in.
1 in
.
¾ in
.
½ in
.
3/8
in.
#4
#1
0
#2
0
#3
0
#4
0
#6
0
#1
00
#1
40
#2
00
Particle Size Distribution Report

NEVADA DEPARTMENT OF
TRANSPORTATION
Fat clay with sand
Clayey sand
Clayey sand with gravel
inches numbersize size
0.0 0.0 21.9 53.1 25.0 CH A-7-6(28) 21 56
0.0 0.0 64.7 35.3 SC A-2-6(1) 22 39
41.4 39.0 SC A-4(0) 15 25
1/23/8 100.0
96.389.6
#4#10#16#40#50
#100#200
100.0100.0
99.7
91.478.1
100.099.999.899.398.170.035.3
80.472.669.867.065.752.939.0
0.0338 0.1234 0.2077
0.0036
Source of Sample: SB-1 Depth: 18.5 to 19.7 Sample Number: D1
Source of Sample: SB-1 Depth: 19.7 to 20.1 Sample Number: D2
Source of Sample: SB-1 Depth: 23.5 to 27 Sample Number: E
Boomhower
I-15 Sign Bridges
73171 fund 9
+3" % GRAVEL % SAND % SILT % CLAY USCS AASHTO PL LL
SIEVE PERCENT FINER SIEVE PERCENT FINER Material Description
GRAIN SIZE REMARKS:
D60
D30
D10
COEFFICIENTS
Cc
Cu
Client:
Project:
Project No.: Figure
PE
RC
EN
T F
INE
R
0
10
20
30
40
50
60
70
80
90
100
GRAIN SIZE - mm.
0.0010.010.1110100
6 in
.
3 in
.
2 in
.
1½
in.
1 in
.
¾ in
.
½ in
.
3/8
in.
#4
#1
0
#2
0
#3
0
#4
0
#6
0
#1
00
#1
40
#2
00
Particle Size Distribution Report
NEVADA DEPARTMENT OF
TRANSPORTATION
Silty sand
Sandy fat clay with gravel
Gravelly fat clay with sand
inches numbersize size
69.5 18.6 SM A-2-4(0) 22 24
28.9 34.5 20.3 CH A-7-5(30) 33 95
19.0 58.7 CH A-7-6(23) 24 68
3/41/23/8
90.590.590.5 98.6
95.687.983.2
#4#10#16#40#50
#100#200
88.187.287.086.786.055.518.6
83.781.1
80.4
72.554.8
77.775.074.273.172.668.758.7
0.1626 0.0940 0.0810
0.0934 0.0079
Source of Sample: SB-1 Depth: 28.5 to 29.2 Sample Number: F1
Source of Sample: SB-1 Depth: 29.2 to 30 Sample Number: F2
Source of Sample: SB-1 Depth: 33.5 to 35.0 Sample Number: G
Boomhower
I-15 Sign Bridges
73171 fund 9
+3" % GRAVEL % SAND % SILT % CLAY USCS AASHTO PL LL
SIEVE PERCENT FINER SIEVE PERCENT FINER Material Description
GRAIN SIZE REMARKS:
D60
D30
D10
COEFFICIENTS
Cc
Cu
Client:
Project:
Project No.: Figure
PE
RC
EN
T F
INE
R
0
10
20
30
40
50
60
70
80
90
100
GRAIN SIZE - mm.
0.0010.010.1110100
6 in
.
3 in
.
2 in
.
1½
in.
1 in
.
¾ in
.
½ in
.
3/8
in.
#4
#1
0
#2
0
#3
0
#4
0
#6
0
#1
00
#1
40
#2
00
Particle Size Distribution Report

NEVADA DEPARTMENT OF
TRANSPORTATION
Silty sand with gravel
Poorly graded sand with silt and gravel
Sandy lean clay
inches numbersize size
33.0 35.6 SM A-4(0) 23 26
49.8 11.1 SP-SM
20.3 65.5 CL A-6(9) 4 25
3/41/23/8
91.282.7
96.585.578.4 97.0
#4#10#16#40#50
#100#200
68.657.853.348.044.740.135.6
60.944.437.128.825.816.011.1
85.879.176.573.571.668.265.5
2.4630 4.5657
0.5091
Source of Sample: SB-2 Depth: 3.5 TO 5.0 Sample Number: A
Source of Sample: SB-2 Depth: 8.5 TO 10.0 Sample Number: B
Source of Sample: SB-2 Depth: 13.5 TO 15.0 Sample Number: C
Boomhower
I-15 Sign Bridges
73171 fund 9
+3" % GRAVEL % SAND % SILT % CLAY USCS AASHTO PL LL
SIEVE PERCENT FINER SIEVE PERCENT FINER Material Description
GRAIN SIZE REMARKS:
D60
D30
D10
COEFFICIENTS
Cc
Cu
Client:
Project:
Project No.: Figure
PE
RC
EN
T F
INE
R
0
10
20
30
40
50
60
70
80
90
100
GRAIN SIZE - mm.
0.0010.010.1110100
6 in
.
3 in
.
2 in
.
1½
in.
1 in
.
¾ in
.
½ in
.
3/8
in.
#4
#1
0
#2
0
#3
0
#4
0
#6
0
#1
00
#1
40
#2
00
Particle Size Distribution Report

NEVADA DEPARTMENT OF
TRANSPORTATION
Sandy silty clay
Sandy lean clay
inches numbersize size
32.5 54.6 CL-ML A-4(1) 16 22
44.6 54.9 CL A-6(5) 14 29
3/8 97.6 #4#10#16#40#50
#100#200
87.176.371.565.062.659.254.6
99.598.197.595.993.873.854.9
0.1759 0.0920
Source of Sample: SB-2 Depth: 18.5 TO 20.0 Sample Number: D
Source of Sample: SB-2 Depth: 23.5 TO 25 Sample Number: E
Boomhower
I-15 Sign Bridges
73171 fund 9
+3" % GRAVEL % SAND % SILT % CLAY USCS AASHTO PL LL
SIEVE PERCENT FINER SIEVE PERCENT FINER Material Description
GRAIN SIZE REMARKS:
D60
D30
D10
COEFFICIENTS
Cc
Cu
Client:
Project:
Project No.: Figure
PE
RC
EN
T F
INE
R
0
10
20
30
40
50
60
70
80
90
100
GRAIN SIZE - mm.
0.0010.010.1110100
6 in
.
3 in
.
2 in
.
1½
in.
1 in
.
¾ in
.
½ in
.
3/8
in.
#4
#1
0
#2
0
#3
0
#4
0
#6
0
#1
00
#1
40
#2
00
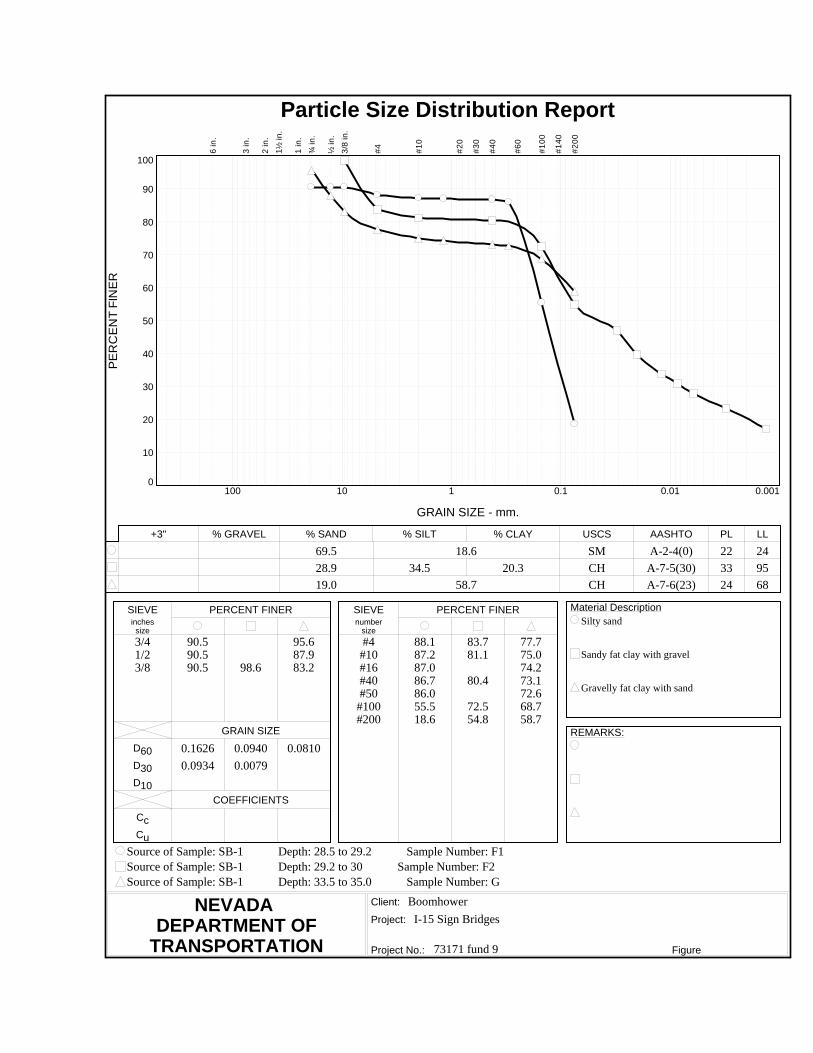
Particle Size Distribution Report
NEVADA DEPARTMENT OF
TRANSPORTATION
Sandy silt
Clayey gravel with sand
inches numbersize size
39.2 56.7 ML
25.7 47.1 GC A-6(5) 15 35
3/41/23/8
97.597.596.7
95.085.680.4
#4#10#16#40#50
#100#200
95.993.991.586.083.368.156.7
72.869.068.167.466.960.047.1
0.0951 0.1504
Source of Sample: SB-3 Depth: 8.0 TO 9.4 Sample Number: B
Source of Sample: SB-3 Depth: 11.8 TO 13.3 Sample Number: C
Boomhower
I-15 Sign Bridges
73171 fund 9
+3" % GRAVEL % SAND % SILT % CLAY USCS AASHTO PL LL
SIEVE PERCENT FINER SIEVE PERCENT FINER Material Description
GRAIN SIZE REMARKS:
D60
D30
D10
COEFFICIENTS
Cc
Cu
Client:
Project:
Project No.: Figure
PE
RC
EN
T F
INE
R
0
10
20
30
40
50
60
70
80
90
100
GRAIN SIZE - mm.
0.0010.010.1110100
6 in
.
3 in
.
2 in
.
1½
in.
1 in
.
¾ in
.
½ in
.
3/8
in.
#4
#1
0
#2
0
#3
0
#4
0
#6
0
#1
00
#1
40
#2
00
Particle Size Distribution Report

NEVADA DEPARTMENT OF
TRANSPORTATION
Clayey sand with gravel
Sandy lean clay
Clayey sand with gravel
inches numbersize size
35.4 46.2 SC A-4(1) 14 23
44.6 54.9 CL A-7-6(12) 18 47
45.5 38.0 SC A-4(0) 14 24
1/23/8
91.487.8
95.191.6
#4#10#16#40#50
#100#200
81.677.876.574.473.364.146.2
99.598.197.595.993.873.854.9
83.574.170.363.360.549.538.0
0.1250 0.0920 0.2868
Source of Sample: SB-3 Depth: 18.0 TO 19.5 Sample Number: D
Source of Sample: SB-3 Sample Number: E
Source of Sample: SB-3 Sample Number: F
Boomhower
I-15 Sign Bridges
73171 fund 9
+3" % GRAVEL % SAND % SILT % CLAY USCS AASHTO PL LL
SIEVE PERCENT FINER SIEVE PERCENT FINER Material Description
GRAIN SIZE REMARKS:
D60
D30
D10
COEFFICIENTS
Cc
Cu
Client:
Project:
Project No.: Figure
PE
RC
EN
T F
INE
R
0
10
20
30
40
50
60
70
80
90
100
GRAIN SIZE - mm.
0.0010.010.1110100
6 in
.
3 in
.
2 in
.
1½
in.
1 in
.
¾ in
.
½ in
.
3/8
in.
#4
#1
0
#2
0
#3
0
#4
0
#6
0
#1
00
#1
40
#2
00
Particle Size Distribution Report
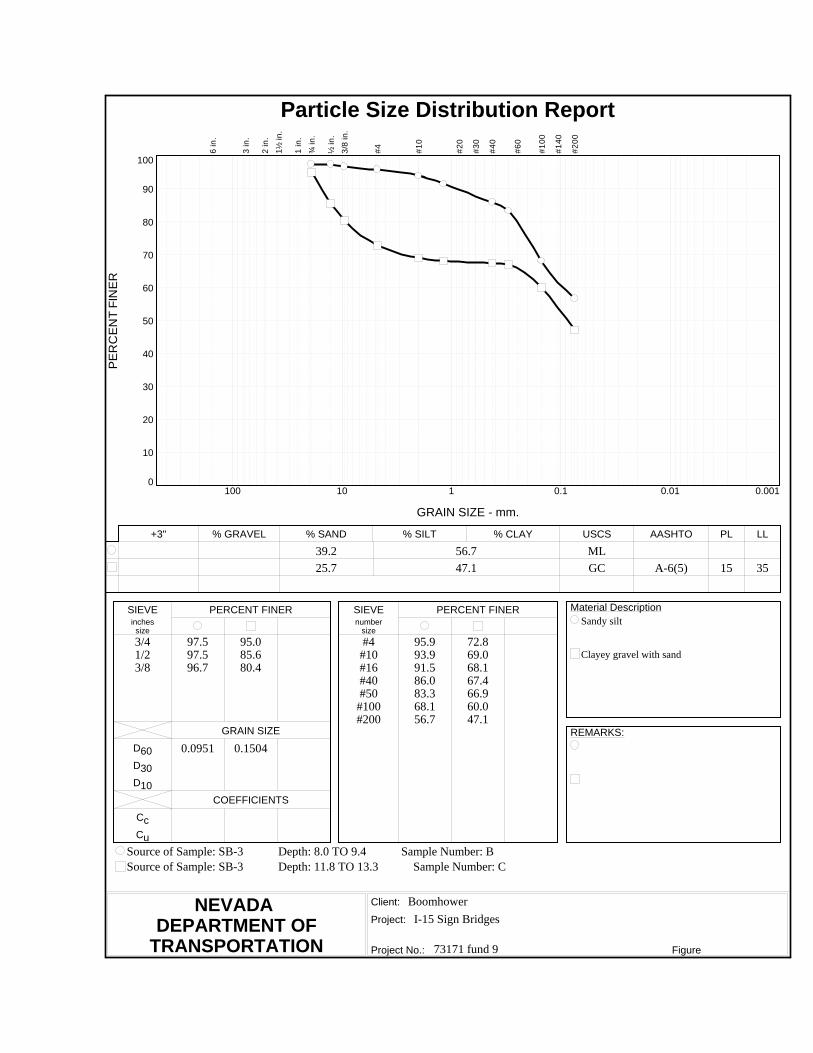
SUMMARY OF RESULTSN.D.O.T. GEOTECHNICAL SECTION
EA/Cont # 73171-9 Job Description I-15 Sign Bridges
Boring No. SB-1 Elevation (ft) Station
SAMPLE SAMP- N DRY % STRENGTH TEST SAMPLE DEPTH LER BLOWS SOIL W% UW PASS LL PL PI TEST Φ C Φ C COMMENTS
NO. (ft) TYPE per ft. GROUP pcf #200 % % % TYPE deg. psi deg. psi Peak Residual
A 3.5 - 4.7 SPT SM 16.5 32.8
B 7.0 - 8.5 SPT SM 5.2 43.8
C 13.5 - 15.1 SPT CL 21.1 65.6 27 12 15
D1 18.5 - 19.7 SPT CH 39.6 78.1 56 21 35
D2 19.7 - 20.1 SPT SC 31.4 35.3 39 22 17
E 23.5 - 27.0 SPT SC 16.7 39.0 25 15 10
F1 28.5 - 29.2 SPT SM 24.3 18.6 24 22 2
F2 29.2 - 30.0 SPT CH 40.4 54.8 95 33 62
G 33.5 - 35.2 SPT CH 39.7 58.7 68 24 44
CMS = California Modified Sampler 2.42" ID U = Unconfined Compressive H = Hydrometer CM = CompactionSPT = Standard Penetration 1.38" ID UU = Unconsolidated Undrained S = Sieve E = Swell/Pressure on Expansive SoilsCS = Continuous Sample 3.23" ID CD = Consolidated Drained G = Specific Gravity SL = Shrinkage LimitRC = Rock Core CU = Consolidated Undrained PI = Plasticity Index UW= Unit WeightPB = Pitcher Barrel DS = Direct Shear LL = Liquid Limit W = Moisture ContentCSS = Calif. Split Spoon 2.42" ID Φ = Friction PL = Plastic Limit K = PermeabilityCPT = Cone Penetration Test C = Cohesion NP = Non-Plastic O = Organic ContentTP = Test Pit N = No. of blows per ft., sampler OC = Consolidation D = DispersiveP = Pushed, not driven Ch = Chemical RQD = Rock Quality DesignationR = Refusal N = Field SPT N = (Ncss)(0.62) RV = R - Value X = X-Ray DefractionSh = Shelby Tube 2.87" ID MD = Moisture Density HCpot = Hydro-Collapse Potential
* = Average of subsamples

SUMMARY OF RESULTSN.D.O.T. GEOTECHNICAL SECTION
EA/Cont # 73171-9 Job Description I-15 Sign Bridges
Boring No. SB-2 Elevation (ft) Station
SAMPLE SAMP- N DRY % STRENGTH TEST SAMPLE DEPTH LER BLOWS SOIL W% UW PASS LL PL PI TEST Φ C Φ C COMMENTS
NO. (ft) TYPE per ft. GROUP pcf #200 % % % TYPE deg. psi deg. psi Peak Residual
A 3.5 - 5.0 SPT SM 18.1 35.6 26 23 3
B 8.5 - 10.0 SPT SP-SM 3.4 11.1
C 13.5 - 15.0 SPT CL 12.0 65.5 25 4 21
D 18.5 - 20.0 SPT CL-ML 10.3 54.6 22 16 6
E 23.5 - 25.0 SPT SC 14.8 54.9 29 14 15
F 28.5 - 28.9 SPT CH 31.0 118 38 80
CMS = California Modified Sampler 2.42" ID U = Unconfined Compressive H = Hydrometer CM = CompactionSPT = Standard Penetration 1.38" ID UU = Unconsolidated Undrained S = Sieve E = Swell/Pressure on Expansive SoilsCS = Continuous Sample 3.23" ID CD = Consolidated Drained G = Specific Gravity SL = Shrinkage LimitRC = Rock Core CU = Consolidated Undrained PI = Plasticity Index UW= Unit WeightPB = Pitcher Barrel DS = Direct Shear LL = Liquid Limit W = Moisture ContentCSS = Calif. Split Spoon 2.42" ID Φ = Friction PL = Plastic Limit K = PermeabilityCPT = Cone Penetration Test C = Cohesion NP = Non-Plastic O = Organic ContentTP = Test Pit N = No. of blows per ft., sampler OC = Consolidation D = DispersiveP = Pushed, not driven Ch = Chemical RQD = Rock Quality DesignationR = Refusal N = Field SPT N = (Ncss)(0.62) RV = R - Value X = X-Ray DefractionSh = Shelby Tube 2.87" ID MD = Moisture Density HCpot = Hydro-Collapse Potential
* = Average of subsamples

SUMMARY OF RESULTSN.D.O.T. GEOTECHNICAL SECTION
EA/Cont # 73171-9 Job Description I-15 Sign Bridges
Boring No. SB-3 Elevation (ft) Station
SAMPLE SAMP- N DRY % STRENGTH TEST SAMPLE DEPTH LER BLOWS SOIL W% UW PASS LL PL PI TEST Φ C Φ C COMMENTS
NO. (ft) TYPE per ft. GROUP pcf #200 % % % TYPE deg. psi deg. psi Peak Residual
A 3.0 - 4.5 SPT SM 4.6 19.9
B 8.0 - 9.4 SPT CL 14.0 56.7
C 11.8 - 13.3 RC GC 16.7 47.1 35 15 20
D 18.0 - 19.5 SPT SC 19.0 46.2 23 14 9
E 23.0 - 24.5 SPT CL 35.7 54.9 47 18 29
F 28.0 - 28.5 SPT SC 16.4 38.0 24 14 10
CMS = California Modified Sampler 2.42" ID U = Unconfined Compressive H = Hydrometer CM = CompactionSPT = Standard Penetration 1.38" ID UU = Unconsolidated Undrained S = Sieve E = Swell/Pressure on Expansive SoilsCS = Continuous Sample 3.23" ID CD = Consolidated Drained G = Specific Gravity SL = Shrinkage LimitRC = Rock Core CU = Consolidated Undrained PI = Plasticity Index UW= Unit WeightPB = Pitcher Barrel DS = Direct Shear LL = Liquid Limit W = Moisture ContentCSS = Calif. Split Spoon 2.42" ID Φ = Friction PL = Plastic Limit K = PermeabilityCPT = Cone Penetration Test C = Cohesion NP = Non-Plastic O = Organic ContentTP = Test Pit N = No. of blows per ft., sampler OC = Consolidation D = DispersiveP = Pushed, not driven Ch = Chemical RQD = Rock Quality DesignationR = Refusal N = Field SPT N = (Ncss)(0.62) RV = R - Value X = X-Ray DefractionSh = Shelby Tube 2.87" ID MD = Moisture Density HCpot = Hydro-Collapse Potential
* = Average of subsamples