Embed Size (px)
Citation preview

M A D R O N E E N V I R O N M E N T A L S E R V I C E S L T D .
# 2 0 2 - 2 7 9 0 G L A D W I N R O A D • A B B O T S F O R D • B C • V 2 T 4 S 7
T E L 6 0 4 . 5 0 4 . 1 9 7 2 • F A X 6 0 4 . 5 0 4 . 1 9 1 2 • W W W . M A D R O N E . C A
D O S S I E R : 1 7 . 0 3 5 7
DISTRICT OF KITIMAT LAND CONSTRAINT AND SUITABILITY STUDY
Geotechnical and Hydrotechnical
Overview Assessment
FOR:
Westland Resources Limited, and District of Kitimat BY:
Roberta Adams, M.Sc., G.I.T. Gordon Butt, M.Sc., P.Geo. Madrone Environmental Services Ltd. February 16, 2018 (updated August 24, 2018)

D O S S I E R : 1 7 . 0 3 5 7 M A D R O N E E N V I R O N M E N T A L S E R V I C E S L T D .
F I L E : \ \ F S 4 \ A C T I V E D O S S \ P R O J E C T S \ 1 7 . 0 3 5 7 \ F I N A L R E P O R T \ 1 7 . 0 3 5 7 T E R R A I N A S S E S S M E N T
D O K L C S S _ F I N A L T O C L I E N T . D O C X
L A S T S A V E D : 9 / 4 / 2 0 1 8 1 0 : 1 6 : 0 0 A M
TABLE OF CONTENTS
1 INTRODUCTION ................................................................................ 1
1.1 BACKGROUND INFORMATION ......................................................................................... 4
2 METHODOLOGY ............................................................................... 5
2.1 LIDAR ANALYSIS ............................................................................................................... 5
2.2 AIR PHOTO ANALYSIS ...................................................................................................... 5
2.3 TERRAIN CLASSIFICATION SYSTEM ................................................................................. 8
2.3.1 SURFICIAL MATERIAL ................................................................................................. 9
2.3.2 GEOMORPHOLOGICAL PROCESSES ........................................................................11
2.4 TERRAIN STABILITY CLASSIFICATION ............................................................................ 12
2.5 HYDROTECHNICAL ANALYSIS .........................................................................................13
3 GEOMORPHIC SETTING ................................................................... 14
3.1 BEDROCK GEOLOGY ....................................................................................................... 14
3.2 SURFICIAL GEOLOGY AND QUATERNARY HISTORY ..................................................... 14
3.3 CLIMATE .......................................................................................................................... 18
3.4 HYDROLOGY ................................................................................................................... 18
3.5 RESOURCES .................................................................................................................... 20
3.5.1 MINERAL POTENTIAL............................................................................................... 21
4 GEOTECHNICAL IMPLICATIONS ...................................................... 23
4.1 NATURAL HAZARDS ....................................................................................................... 23

D I S T R I C T O F K I T I M A T P A G E T O C - I I
G E O T E C H N I C A L A N D H Y D R O T E C H N I C A L O V E R V I E W A S S E S S M E N T F E B R U A R Y 1 4 , 2 0 1 8
D O S S I E R : 1 7 . 0 3 5 7 M A D R O N E E N V I R O N M E N T A L S E R V I C E S L T D .
4.1.1 FLOODING ................................................................................................................ 23
4.1.2 STREAM EROSION AND AVULSION ......................................................................... 26
4.1.3 LANDSLIDES ............................................................................................................. 30
4.1.4 SNOW AVALANCHES ............................................................................................... 36
4.2 SEISMIC CONSIDERATIONS ............................................................................................ 36
4.3 SENSITIVE CLAYS ............................................................................................................. 37
5 CONCLUSION AND RECOMMENDATIONS ....................................... 40
5.1 HAZARD ACCEPTABILITY THRESHOLDS ........................................................................ 40
5.2 DEVELOPMENT PERMIT AREAS ..................................................................................... 41
5.2.1 FLOOD HAZARD ....................................................................................................... 44
5.2.2 STREAM EROSION HAZARD .................................................................................... 44
5.2.3 HILLSLOPES AND UPLANDS HAZARD ..................................................................... 47
6 CLOSURE ........................................................................................ 49
7 REFERENCES .................................................................................. 50
8 LIMITATIONS .................................................................................. 52
8.1 LIMITATIONS ON LIABILITY ............................................................................................ 53
8.2 INTELLECTUAL PROPERTY ............................................................................................. 53

D I S T R I C T O F K I T I M A T P A G E T O C - I I I
G E O T E C H N I C A L A N D H Y D R O T E C H N I C A L O V E R V I E W A S S E S S M E N T F E B R U A R Y 1 4 , 2 0 1 8
D O S S I E R : 1 7 . 0 3 5 7 M A D R O N E E N V I R O N M E N T A L S E R V I C E S L T D .
LIST OF FIGURES
FIGURE 1: LAND CONSTRAINT AND SUITABILITY STUDY PROJECT AREA MAP. .......................... 3
FIGURE 2: DIGITAL ELEVATION MODEL OF THE STUDY AREA FROM LIDAR DATASET OF 1 M RESOLUTION PROVIDED BY DOK. ..................................................................................... 6
FIGURE 3: AIR PHOTO COVERAGE FROM DOK (BLUE) AND GEOBC (RED LINES, 2003). ............... 8
FIGURE 4: DOMINANT SURFICIAL MATERIAL OF THE STUDY AREA, AS DETERMINED BY DESKTOP ANALYSIS OF LIDAR AND AIR PHOTO ANALYSIS. ....................................................... 17
FIGURE 5: MINERAL POTENTIAL IN THE DOK REGION. ............................................................... 22
FIGURE 6: FLUVIAL FANS (ORANGE) AND FLUVIAL PLAINS (YELLOW) WITHIN THE STUDY AREA. .................................................................................................................................... 28
FIGURE 7: WATERCOURSE DISTRIBUTION AS MAPPED BY FRESHWATER ATLAS WITHIN THE STUDY AREA. ........................................................................................................... 29
FIGURE 8: OBSERVED LANDSLIDES AND OTHER EVIDENCE OF INSTABILITY IN THE STUDY AREA, AS DISCOVERED THROUGH DESKTOP ANALYSIS OF LIDAR DATA. .....................31
FIGURE 9: DOMINANT GEOMORPHOLOGICAL PROCESSES WITHIN THE STUDY AREA. ........... 34
FIGURE 10: RECONNAISSANCE TERRAIN STABILITY MAPPING (RTSM). ..................................... 35
FIGURE 11: MAPPED GLACIOMARINE SEDIMENTS (PURPLE) AND FIELD CONFIRMED LOCATIONS OF SENSITIVE CLAYS FROM LITERATURE (PINK DOTS). ......................................... 39
FIGURE 12: HAZARD ACCEPTABILITY DEVELOPMENT, FROM CAVE (1993). ............................... 40
FIGURE 13: GENERAL GEO-HAZARD DPA MAP FOR THE STUDY AREA. ...................................... 42
FIGURE 14: AREAS POTENTIALLY SUSCEPTIBLE TO FLOODING. ................................................ 46
FIGURE 15: POTENTIAL EXTENT OF HILLSLOPE AND UPLANDS HAZARD AREA WITHIN THE STUDY AREA. ........................................................................................................................ 48

D I S T R I C T O F K I T I M A T P A G E T O C - I V
G E O T E C H N I C A L A N D H Y D R O T E C H N I C A L O V E R V I E W A S S E S S M E N T F E B R U A R Y 1 4 , 2 0 1 8
D O S S I E R : 1 7 . 0 3 5 7 M A D R O N E E N V I R O N M E N T A L S E R V I C E S L T D .
LIST OF TABLES
TABLE 1: DESCRIPTION OF TERRAIN MAPPING PROJECT DATA, ADAPTED FROM STANDARDS FOR DIGITAL TERRAIN DATA CAPTURE ................................................................... 8
TABLE 2: DOMINANT SURFICIAL MATERIAL WITHIN THE STUDY AREA WITH APPROXIMATE AREA COVERAGE. ............................................................................................... 16
TABLE 3: CLIMATIC CONDITIONS OF THE STUDY AREA DURING THE PERIOD 1981 TO 2010. ......................................................................................................................................... 18
TABLE 4. WATERSHED CHARACTERISTICS .................................................................................. 20
TABLE 5. ESTIMATED 200-YEAR MAXIMUM DAILY MEAN DISCHARGE ...................................... 24
TABLE 6: GEOLOGICAL PROCESSES THAT OCCUR IN THE STUDY AS OBSERVED THROUGH DESKTOP ANALYSIS OF LIDAR .................................................................................. 32
TABLE 7: SLOPE STABILITY CLASS OF THE STUDY AREA, AS DETERMINED FROM DESKTOP ANALYSIS OF LIDAR. ................................................................................................... 33
TABLE 8. PEAK GROUND ACCELERATION AND SPECTRAL ACCELERATIONS AT ........................ 37
TABLE 9: HAZARD ACCEPTABILITY THRESHOLDS FOR A NEW BUILDING, AS PER CAVE (1993). ......................................................................................................................................... 41

D O S S I E R : 1 7 . 0 3 5 7 M A D R O N E E N V I R O N M E N T A L S E R V I C E S L T D .
DISTRICT OF KITIMAT LAND CONSTRAINT AND SUITABILITY STUDY
Geotechnical and Hydrotechnical
Overview Assessment
1 Introduction
Madrone Environmental Services Ltd has been contracted by Westland
Resources Limited to provide a geotechnical and hydrotechnical overview as part of a Land Constraint and Suitability Study for the District of
Kitimat.
The Land Constraint and Suitability Study Project Area (LCSS Project Area or Study Area) focuses on an undeveloped portion of the District of
Kitimat located on the west side of the Douglas Channel. The boundary
extends from the old Eurocan facility in the north to Miskatla Inlet in the
south.
The Study Area is divided into two areas:
The West Douglas Channel Corridor Analysis Study Area
(WDCCA Study Area): The Ministry of Transportation commissioned the West Douglas Channel Corridor Analysis to
assess existing infrastructure and future infrastructure needs of
potential industrial developments within the District of Kitimat
(WSP Canada Inc. 2016). The WDCCA study area is a corridor running from the old Eurocan facility in the north to Bish Cove in
the south. It includes the industrial lands along Haisla Boulevard
and Alcan Road and forested lands close to the shoreline around
the Bish Creek Forest Service Road (FSR).

D I S T R I C T O F K I T I M A T P A G E 2
G E O T E C H N I C A L A N D H Y D R O T E C H N I C A L O V E R V I E W A S S E S S M E N T F E B R U A R Y 1 4 , 2 0 1 8
D O S S I E R : 1 7 . 0 3 5 7 M A D R O N E E N V I R O N M E N T A L S E R V I C E S L T D .
The Land Constraint and Suitability Study Area (LCSS
Study Area): The LCSS Study Area encompasses the portion of the Project Area that falls outside of the WDCCA Study area.
The LCSS Study Area will be the focus of the land constraints and
suitability analysis carried out in Phase 3 of the LCSS Project. Generally, the LCSS Study Area is the focus of overview assessments carried out in
Phase 2 of the Project; however, in some cases overview assessments
address the LCSS Study Area and/or other portions of the District of
Kitimat.
This report is an overview assessment of the geotechnical and
hydrotechnical hazards within the study area. This overview is intended to
identify and report hazard features and constraints through high level desktop analysis, and provide a comprehensive list of indicators for
assessing suitability of various land use through GIS analysis in
consultation with Westland Resources and the District of Kitimat’s GIS
technician.

D I S T R I C T O F K I T I M A T P A G E 3
G E O T E C H N I C A L A N D H Y D R O T E C H N I C A L O V E R V I E W A S S E S S M E N T F E B R U A R Y 1 4 , 2 0 1 8
D O S S I E R : 1 7 . 0 3 5 7 M A D R O N E E N V I R O N M E N T A L S E R V I C E S L T D .
FIGURE 1: LAND CONSTRAINT AND SUITABILITY STUDY PROJECT AREA MAP.
D I S T R I C T O F K I T I M A T P A G E 4
G E O T E C H N I C A L A N D H Y D R O T E C H N I C A L O V E R V I E W A S S E S S M E N T F E B R U A R Y 1 4 , 2 0 1 8
D O S S I E R : 1 7 . 0 3 5 7 M A D R O N E E N V I R O N M E N T A L S E R V I C E S L T D .
1.1 Background Information
For this assessment, we reviewed:
West Douglas Channel Corridor Analysis: Overview Geotechnical,
Terrain and Terrain Hazards Analysis. Report Number 1314470529-
013-R-Rev2 by Golder Associates, submitted to WSP Canada Inc., 17 June 2016.
Surficial geology and terrain maps
Surficial Geology, north Kitimat Arm, Douglas Channel Area1
Surficial Geology, south Kitimat Arm, Douglas Channel Area2
Climate data3
Seismic data4
In addition to the West Douglas Channel Corridor Analysis, Madrone was
provided with a PDF copy of the Terrain Stability Mapping of Jesse-Miskatla, Wathlsto-Clio Bay and Kowesas River Planning Units, TFL 41 by
Skeena Sawmills. These maps were not used to supplement our terrain
mapping, nor was our terrain mapping edge mapped. These two sets of
maps were used for comparison purposes only, as they differed in their mapping extent, the information available and general mapping criteria.
1 Maynard, D.E., Weiland, I.C., Blais-Stevens, A., and Geertsema , M., 2017. Surficial
geology, north Kitimat Arm , Douglas Channel area, British Columbia, parts of NTS 103-H/15 and 103-I/2; Geological Survey of Canada, Canadian Geoscience Map 300 (preliminary), scale 1:25 000. doi:10.4095/300850
2 Maynard, D.E., Weiland, I.C., Blais-Stevens, A., and Geertsema , M., 2017. Surficial geology, south Kitimat Arm , Douglas Channel area ,British Columbia , part of NTS 103-H/15; Geological Survey of Canada , Canadian Geoscience Map 301 (preliminary),scale 1:25 000. doi:10.4095/300851
3 Environment Canada. (modified January 25, 2017). 1981 – 2010 Climate Normals and Averages – Normals. Retrieved January 2018 from http://climate.weather.gc.ca/climate_normals/index_e.html
4 Natural Resources Canada. (modified 2016, February 10). 2015 National Building Code of Canada seismic hazard calculator. Retrieved March 2017 from http://www.earthquakescanada.nrcan.gc.ca/hazard-alea/interpolat/index_2015-en.php

D I S T R I C T O F K I T I M A T P A G E 5
G E O T E C H N I C A L A N D H Y D R O T E C H N I C A L O V E R V I E W A S S E S S M E N T F E B R U A R Y 1 4 , 2 0 1 8
D O S S I E R : 1 7 . 0 3 5 7 M A D R O N E E N V I R O N M E N T A L S E R V I C E S L T D .
2 Methodology
2.1 LiDAR Analysis
Light Detecting and Ranging (LiDAR) analysis is a remote sensing technique that uses laser light to create mass point datasets of the earth’s
surface with highly accurate x-y-z measurements. These datasets are
processed to create digital elevation models (DEM) that can be analyzed
in geographical information systems (GIS). The LiDAR dataset analyzed for this study was provided by the DOK at a scale of 1 m resolution (Figure
2). The DEM has been processed to remove all buildings and trees from
the model, allowing the bare earth to be realized.
Madrone’s geoscientists used ArcGIS to create terrain polygons from the
DEM, delineating distinct features throughout the study area. These
features were categorized based on the Terrain Classification System (see
section 2.3).
2.2 Air Photo Analysis
Air photo (also known as aerial photography) analysis is the
interpretation of landforms and geography through visual identification from an overhead perspective. Before the digital recording of remote
sensing data, air photos were used to provide a large scale perspective on
geological processes as well as a record of change over time. For the
purposes of this study, we used air photo interpretation in conjunction with LiDAR to map surficial geology and terrain components, geological
processes, and slope stability. Using both datasets together provided a
broader understanding of the recent conditions within the study area.
Small scale air photos were provided by the District of Kitimat (10-20 cm
scale) for a limited area of the study area (Figure 3). Large scale air photos
as well as aerial imagery from Google Earth Pro, was used to supplement
the remaining study area. These data sets were also used to gain an extended understanding of geological processes that initiate outside of the
study area but affect the study area.

D I S T R I C T O F K I T I M A T P A G E 6
G E O T E C H N I C A L A N D H Y D R O T E C H N I C A L O V E R V I E W A S S E S S M E N T F E B R U A R Y 1 4 , 2 0 1 8
D O S S I E R : 1 7 . 0 3 5 7 M A D R O N E E N V I R O N M E N T A L S E R V I C E S L T D .
FIGURE 2: DIGITAL ELEVATION MODEL OF THE STUDY AREA FROM LIDAR DATASET OF 1 M RESOLUTION PROVIDED BY DOK.

D I S T R I C T O F K I T I M A T P A G E 7
G E O T E C H N I C A L A N D H Y D R O T E C H N I C A L O V E R V I E W A S S E S S M E N T F E B R U A R Y 1 4 , 2 0 1 8
D O S S I E R : 1 7 . 0 3 5 7 M A D R O N E E N V I R O N M E N T A L S E R V I C E S L T D .

D I S T R I C T O F K I T I M A T P A G E 8
G E O T E C H N I C A L A N D H Y D R O T E C H N I C A L O V E R V I E W A S S E S S M E N T F E B R U A R Y 1 4 , 2 0 1 8
D O S S I E R : 1 7 . 0 3 5 7 M A D R O N E E N V I R O N M E N T A L S E R V I C E S L T D .
FIGURE 3: AIR PHOTO COVERAGE FROM DOK (BLUE) AND GEOBC (RED LINES, 2003).
2.3 Terrain Classification System
The Terrain Classification System for British Columbia (Howes and Kenk,
1998) is a standardized mapping system produced by the Ministry of
Environment and has been adopted by professionals in BC for over 20 years. The system assigns a unique terrain tag based on a series of
attributes and is meant to be used in conjunction with the Guidelines and
Standards for Terrain Mapping in British Columbia (1996), and the
Standard for Digital Terrain Data Capture in British Columbia (1998). For the purposes of this study, we captured the following attributes (when
applicable) for each terrain polygon: Surficial and subsurface materials,
surface expression, geomorphological processes, and drainage. We
followed the digital standards for attribute allocation and within the digital dataset, which accompanies this report. The attributes listed in
Table 1 are the minimum attributes applied (where applicable). Due to the
high-level desktop analysis, detailed attributes like surficial texture,
qualifiers, and subtypes were not applied. Table 1: Description of Terrain Mapping Project Data, Adapted from Standards
for Digital Terrain Data Capture5
Attribute Name Terrain Data Field Name Description
TDEC_1 Decile of terrain component 1
Describes proportion of polygon covered by component 1.
SURFM_1 Surficial material of component 1
Formative geomorphological process of first stratum of surficial material of component 1 of current terrain polygon.
SURF_E1 (A-C) Surface expression of component 1
Used in combination to describe three-dimensional shape of upper surface and thickness of first stratum in the component of terrain polygon. Up to 3 lower case codes, with first code as most dominant surface expression.
SSURFM_1 Subsurface material of component 1
Formative geomorphological process of first subsurface stratum of first component.
SSURF_E1 (A-C) Subsurface expression of component 1
A series of 1-3 lower case letter codes used in combination to describe three-dimensional shape of upper surface and thickness of second stratum in component 1 of the current terrain polygon. First code is the most dominant surface expression.
TDEC_2 Decile of terrain Describes proportion of polygon covered by component 2.
5 Resources Inventory Committee. 1998. Standard for digital terrain data capture in
British Columbia. Government of British Columbia, Victoria, B.C.

D I S T R I C T O F K I T I M A T P A G E 9
G E O T E C H N I C A L A N D H Y D R O T E C H N I C A L O V E R V I E W A S S E S S M E N T F E B R U A R Y 1 4 , 2 0 1 8
D O S S I E R : 1 7 . 0 3 5 7 M A D R O N E E N V I R O N M E N T A L S E R V I C E S L T D .
Attribute Name Terrain Data Field Name Description
component 2
SURFM_2 Surficial material of component 2
Formative geomorphological process of first stratum of surficial material of component 2 of current terrain polygon.
SURF_E2 (A-C) Surface expression of component 2
Used in combination to describe three-dimensional shape of upper surface and thickness of first stratum in the component of terrain polygon. Up to 3 lower case codes, with first code as the most dominant surface expression.
SSURFM_2 Subsurface material of component 2
Formative geomorphological process of first subsurface stratum of first component.
SSURF_E2 (A-C) Subsurface expression of component 2
A series of 1-3 lower case letter codes used in combination to describe three-dimensional shape of upper surface and thickness of second stratum in component 2 of current terrain polygon. First code is the most dominant surface expression.
GEOP_1 1st Geomorphological process class
Represents sole or most significant geomorphological process to affect terrain.
GEOP_Q1 1st Process qualifier A code used to specify whether first geomorphological process is active or inactive.
GEOP_SCM1 (A-C) 1st Process subclass 1-3 standard lower case letters attached to second geomorphological process within current terrain polygon. Subclass modifiers are used to further describe the process and are usually mapped at a more detailed level.
GEOP_2 2nd Geomorphological process class
Represents second most significant geomorphological process to affect the terrain.
GEOP_Q2 2nd Process qualifier A code used to specify whether second geomorphological process is active or inactive.
GEOP_ST2 2nd Process subclass 1-3 standard lower case letters attached to second geomorphological process within current terrain polygon. Subclass modifiers are used to further describe the process and are usually mapped at a more detailed level.
DRAIN_1 1st Soil drainage class of the polygon
Soil drainage class for all or most of the terrain polygon. Refers to the rapidity and extent of water removal from the soil in relation to additions.
DRAIN_SEP Soil drainage separator of polygon
Used where terrain polygon includes two areas of relative uniform drainage, indicating proportion of polygon occupied by each class.
DRAIN_2 2nd Soil drainage class of the polygon
Drainage class for less than half the current terrain polygon.
SLPSTB_CLS Slope stability class A code representing a class of slope stability. For this project area, it is reconnaissance terrain stability system (see section 2.4).
POLY_COM Comments Any potential comments related to the polygon.
2.3.1 Surficial Material
Surficial materials, also known as quaternary sediments or unconsolidated materials, are geologically relatively young. In the study

D I S T R I C T O F K I T I M A T P A G E 1 0
G E O T E C H N I C A L A N D H Y D R O T E C H N I C A L O V E R V I E W A S S E S S M E N T F E B R U A R Y 1 4 , 2 0 1 8
D O S S I E R : 1 7 . 0 3 5 7 M A D R O N E E N V I R O N M E N T A L S E R V I C E S L T D .
area, the thickness of these materials varies depending on elevation and
overall topography. Within the Howes and Kenk (1998) surficial material classification, there is an assumed status of activity. For the majority of
the study area these assumed statuses are unchanged, however, fluvial
material, which is normally assumed to be inactive, may be active in some
areas. The extent of modern fluvial activity cannot be discerned through a desktop study. Colluvium has an assumed status of active, and through
the desktop analysis, these assumptions are consistent with our
observations.
Anthropogenic material is material modified by human activities where
the original physical properties have been drastically altered.
Colluvium occurs when a parent material has reached its present position as a result of gravity induced movement, and is altered to a point where it
no longer has the properties of its parent material. Colluvium can consist
of slide and slump deposits.
Fluvial materials, also known as alluvial, are materials that are
transported by water, traditionally streams and rivers. Fluvial deposits
tend to consist of gravels and sands.
Glaciofluvial deposits are materials that have been deposited by glacial
meltwater streams or have been in direct contact with glacial ice.
Glaciofluvial deposits can have a slightly higher elevation than modern
fluvial deposits and can be shown as terraces on a map. Glaciofluvial deposits generally tend to have a courser, yet similar, texture when
compared to modern fluvial materials.
Morainal material, also known as till, is deposited directly by glacial ice and is not modified by any other transportation method6. The texture,
structure, and topographic characteristics of till are highly variable and
depend on source material incorporated by a glacier and mode of deposition. In general, tills contain a heterogeneous mixture of particle
sizes and are relatively dense. The thickness of till is highly variable,
6 Howes, D.E. and E. Kenk. 1997. Terrain classification system for British Columbia.
Version 2. B.C. Min. Env., Lands and Parks, MOE Manual 10, Victoria, B.C.

D I S T R I C T O F K I T I M A T P A G E 1 1
G E O T E C H N I C A L A N D H Y D R O T E C H N I C A L O V E R V I E W A S S E S S M E N T F E B R U A R Y 1 4 , 2 0 1 8
D O S S I E R : 1 7 . 0 3 5 7 M A D R O N E E N V I R O N M E N T A L S E R V I C E S L T D .
depending on the mode of deposition and its location; within the study
area there are areas of thin veneer of till and in other areas where till is thick enough to obscure underlying bedrock topography.
Glaciomarine materials were laid down within a marine environment
during the last glaciation when land was depressed due to the weight of ice. In the study area, these glaciomarine sediments tend to consist of silt,
sand, or clay with some boulders that have melted out of ice-bergs in the
near-shore environment. Glaciomarine materials are prevalent in the
study area up to an elevation of approximately 200 m. In some cases, these deposits can be sensitive, in that a disturbance (such as an
earthquake or construction) could destabilize soil fabric resulting in a
catastrophic loss of strength and liquefaction leading to flows. The Mink
Creek landslide near Lakelse Lake, north of the study area, is one local example of glaciomarine flow.
Bedrock outcrops, and bedrock covered by a thin mantle of the
unconsolidated materials mentioned above, are present throughout the study area. We did not discern between types of bedrock during our
mapping, and for the purposes of this study the bedrock appears to be
massive and generally controls landscape topography.
2.3.2 Geomorphological Processes
Geomorphological processes are natural mechanisms of weathering, erosion, and deposition that result in modification of surficial materials
and landforms at the earth's surface. Like surficial materials,
geomorphological processes have an assumed active or inactive status.
Three main geomorphological processes occur within the study area: gully erosion, slow mass movement, and rapid mass movement. Incidents of
snow avalanches, braiding channels, meandering channels, and
inundation also occur, but represent less than 3% of the study area.
The process of modification of surfaces by running water, mass
movement, and snow avalanches resulting in the formation of parallel and
sub-parallel long narrow ravines, is called gully erosion7. The gullies that
7 Howes, D.E. and E. Kenk. 1997. Terrain classification system for British Columbia.
Version 2. B.C. Min. Env., Lands and Parks, MOE Manual 10, Victoria, B.C.

D I S T R I C T O F K I T I M A T P A G E 1 2
G E O T E C H N I C A L A N D H Y D R O T E C H N I C A L O V E R V I E W A S S E S S M E N T F E B R U A R Y 1 4 , 2 0 1 8
D O S S I E R : 1 7 . 0 3 5 7 M A D R O N E E N V I R O N M E N T A L S E R V I C E S L T D .
are created can have either steep or gently sloping slides and can occur on
steep to gently sloping surfaces. This type of gully tends to be smaller than most valleys but are larger and more distinct than surficial rills.
Slow mass movement is defined as the slow downslope movement of
masses of cohesive or non-cohesive surficial material and/or bedrock by creeping, flowing, or sliding8. This can occur in various types of trade, and
can include the initiation, transportation, and depositional zones of a
moving mass. Some examples of slow mass movement include earthflows,
rotational slumps, and lateral spreads. In the study area, we find that slow mass movement has occurred in the forms of earth flows and rotational
slumps, however that does not mean that the area is not subject to other
forms of slow mass movement.
Rapid mass movement is defined as rapid downslope movement by
falling, rolling, sliding, or flowing of dry, moist, or saturated debris
derived from surficial material and or bedrock9. Just as in slow mass
movement, this term is applied to all terrain that includes initiation, transportation, and depositional zones of the movement. Examples
include rock and earth falls, rock slides, debris slides, debris flows and
torrents.
2.4 Terrain Stability Classification
Following the Mapping and Assessing Terrain Stability Guidebook
produced in 1999 by the Forest Practices Code of British Columbia, we
performed a Reconnaissance Terrain Stability Mapping (RTSM). RTSM is used to identify all unstable or potentially unstable land areas. This type of
mapping is useful for identifying land areas when completing a desktop
analysis of an area where scale of mapping is limited for a wide area. This
classification was originally used in the forest industry to assess areas that would be affected by timber harvesting or road construction. Due to the
scale of mapping done, RTSM mapping is known to be applicable for large
regional studies when no field analysis has been undertaken. Additional
detailed mapping for those areas considered potentially unstable or
8 Howes, D.E. and E. Kenk. 1997. Terrain classification system for British Columbia.
Version 2. B.C. Min. Env., Lands and Parks, MOE Manual 10, Victoria, B.C.
9 Howes, D.E. and E. Kenk. 1997. Terrain classification system for British Columbia. Version 2. B.C. Min. Env., Lands and Parks, MOE Manual 10, Victoria, B.C.

D I S T R I C T O F K I T I M A T P A G E 1 3
G E O T E C H N I C A L A N D H Y D R O T E C H N I C A L O V E R V I E W A S S E S S M E N T F E B R U A R Y 1 4 , 2 0 1 8
D O S S I E R : 1 7 . 0 3 5 7 M A D R O N E E N V I R O N M E N T A L S E R V I C E S L T D .
unstable is warranted. In general, a terrain polygon that is interpreted to
be unstable typically shows evidence of natural instability and is expected to have a high likelihood of landslides following land modification such as
timber harvesting or road construction. Potentially unstable terrain
polygons may show no obvious signs of instability under natural
conditions, but have characteristics similar to nearby unstable areas. An area delineated as stable tends to have negligible or low likelihood of
landslides. All RTSM should be done at a scale of 1:15,000 to 1:40,000.
The terrain map produced for this study area is 1:20,000.
Detailed Terrain Stability Mapping (DTSM) occurs at a more refined
resolution than RTSM. Specific areas undergo terrain stability field
assessments in DTSM and field verification of terrain mapping in 20 to
50% of the polygons is required. Mapping of this kind usually employs a five-class stability system (Class I through Class V). We did not believe
this classification system was appropriate for the broad scale and desktop
nature of this assessment.
Other aspects of terrain stability and hazard risk include the potential for
landslide debris to enter streams, soil erosion, and sediment delivery
potential. This will be discussed at a high level in the following sections.
2.5 Hydrotechnical Analysis
We conducted a desktop hydrotechnical analysis of the four watercourses
(Anderson Creek, Bish Creek, Emsley Creek, and Jesse Creek) that pass
through the study area and drain watersheds larger than 20 km2. It is impractical to perform a desktop study on the hundreds of smaller
streams in the study area because of their very number and the lack of
sufficient resolution in available data. For example, Moore Creek is just
south of Anderson Creek, but since Moore Creek’s watershed is less than 20 km2 it is not discussed in this report. Due to proximity and shape,
Moore Creek watershed will likely be similar to that of Anderson Creek.
Our assessment included a GIS analysis of channel gradients and hypsometry of the four watersheds using TRIM mapping, and a review of
imagery for channels within the study area to identify reaches that may be
subject to overbank flooding and bank erosion. We also reviewed
hydrometric data from the two nearby Water Survey of Canada gauged

D I S T R I C T O F K I T I M A T P A G E 1 4
G E O T E C H N I C A L A N D H Y D R O T E C H N I C A L O V E R V I E W A S S E S S M E N T F E B R U A R Y 1 4 , 2 0 1 8
D O S S I E R : 1 7 . 0 3 5 7 M A D R O N E E N V I R O N M E N T A L S E R V I C E S L T D .
streams (Little Wedeene River and Renegade Creek) and estimated peak
discharges using a modified regional correlation method developed by Coulson and Obedkoff10.
3 Geomorphic Setting
The District of Kitimat is within the Coast Mountains physiographic region of BC, specifically the Kitimat Mountain Range. Kitimat lies at the
head of Douglas Channel which extends south-southwest towards Hecate
Straight 121 km away. To the north is the Kitsumkalum-Kitimat Trough, a
3 to 10 km wide valley, extending towards the Hazelton Mountains 55 km to the north-northwest. The study area is composed of a small portion of
the Kitsumkalum-Kitimat Trough near the marine shoreline, and a large
portion of the Coast Mountains that run along the northwestern shores of Douglas Channel. The current physiology of the Kitimat area is a direct
result of geological events that occurred in the quaternary and tertiary
periods, as well as the bedrock structures formed between the Jurassic
and Paleogene periods.
3.1 Bedrock Geology
Bedrock geology within the District of Kitimat is composed of eight
different igneous and metamorphic units, ranging in age from Early
Jurassic to Late Paleogene. The dominate bedrock types are quartz diorites, gneissic and intrusive volcanics11. While bedrock topography
controls most of the landscape, Quaternary deposits can be thick
(exceeding 20 m) over bedrock in lower elevations12.
3.2 Surficial Geology and Quaternary History
Due to the proximity of the District of Kitimat to the coast, advance and
retreat of ice sheets during the Quaternary period drastically modified the
10 Coulson and Obedkoff.1998. Inventory of BC Streamflow Parameters, BC Minstry of
Environment
11 Bellefontaine, K., Alldrick, D. and Desjardins, P.J., 1994: Mid Coast (all or parts of 92F, G, J, K, L, M, N; 93D; 102P; 103A), Ministry of Energy, Mines and Petroleum Resources, Open File 1994-17.
12 Clague, J.J. (1984) “Quaternary Geology and Geomorphology, Smithers-Terrace-Prince Rupert Area, British Columbia”, Geological Survey of Canada Memoir 413.

D I S T R I C T O F K I T I M A T P A G E 1 5
G E O T E C H N I C A L A N D H Y D R O T E C H N I C A L O V E R V I E W A S S E S S M E N T F E B R U A R Y 1 4 , 2 0 1 8
D O S S I E R : 1 7 . 0 3 5 7 M A D R O N E E N V I R O N M E N T A L S E R V I C E S L T D .
valleys and drainage patterns within this mountainous area. In BC,
alternating glacial and interglacial periods were both responsible for shaping the current landscape.
The Olympia Interglacial preceded the last major glaciation, the Fraser
Glaciation. During the Olympia, valleys and coastal lowlands were free of ice, and subject to depositional environments similar to those that exist
today; fluvial and organic sediments were deposited, floodplains were
formed at different levels and deltas pro-graded into lakes and the sea.
Today it is uncommon to find these Olympia age deposits undisturbed, as they were later reworked and eroded during the Fraser glaciation.
The Fraser Glaciation was the last major glaciation in BC and was most
likely due to climatic cooling, which triggered the growth of alpine glaciers. As these glaciers grew, they ultimately travelled down the
mountains into the lower elevations and coalesced into sheets of ice.
Within the study area, the existing drainage system that began during the
non-glacial period was disrupted, resulting in deposition of new deposits. During the last glacial period, glaciers advanced and receded, leading to
meltwater deposits that were subsequently re-buried during later
advances. Recession created temporary lakes as masses of stagnant ice
blocked drainage. In general, glaciofluvial and glaciolacustrine sediments accumulated within the valleys and till was deposited along the mountain
slopes.
As ice continued to expand, its weight resulted in depression of the lowlands, changing the marine shoreline dynamics. These lowlands
remained depressed after the retreat of ice, resulting in the advance of
marine water inland to elevations of up to 200 m above the modern sea
level.
Within the Kitsumkalum-Kitimat Trough, a wide variety of sediments
were deposited and this provides a more refined record of late glacial events. For the purposes of this study, it is important to note that changes
in the depositional environment during glaciation have resulted in a
complex stratigraphy of Quaternary deposits. In general, the study area is
composed of morainal mantles (till) over bedrock, with glaciomarine deposits found along the shore lines and into the valleys up to an elevation
of 200 m above sea level. Glaciofluvial sediments deposited by meltwater
D I S T R I C T O F K I T I M A T P A G E 1 6
G E O T E C H N I C A L A N D H Y D R O T E C H N I C A L O V E R V I E W A S S E S S M E N T F E B R U A R Y 1 4 , 2 0 1 8
D O S S I E R : 1 7 . 0 3 5 7 M A D R O N E E N V I R O N M E N T A L S E R V I C E S L T D .
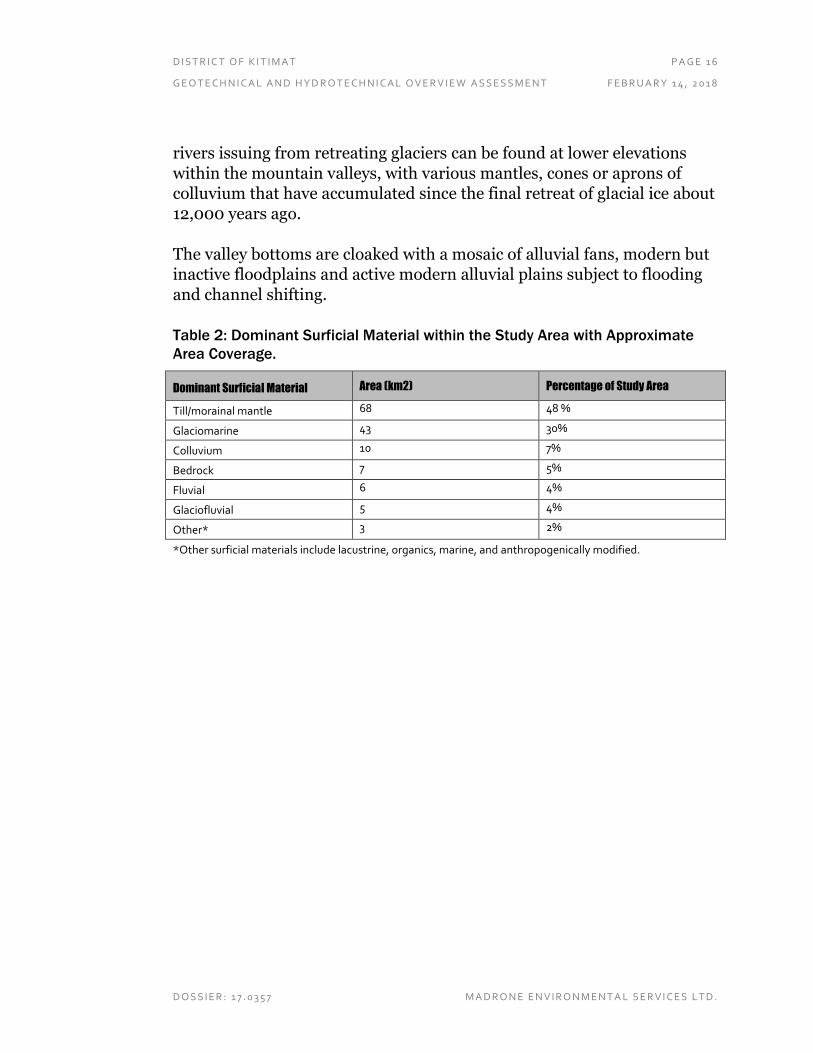
rivers issuing from retreating glaciers can be found at lower elevations
within the mountain valleys, with various mantles, cones or aprons of colluvium that have accumulated since the final retreat of glacial ice about
12,000 years ago.
The valley bottoms are cloaked with a mosaic of alluvial fans, modern but inactive floodplains and active modern alluvial plains subject to flooding
and channel shifting.
Table 2: Dominant Surficial Material within the Study Area with Approximate
Area Coverage.
Dominant Surficial Material Area (km2) Percentage of Study Area
Till/morainal mantle 68 48 %
Glaciomarine 43 30%
Colluvium 10 7%
Bedrock 7 5%
Fluvial 6 4%
Glaciofluvial 5 4%
Other* 3 2%
*Other surficial materials include lacustrine, organics, marine, and anthropogenically modified.

D I S T R I C T O F K I T I M A T P A G E 1 7
G E O T E C H N I C A L A N D H Y D R O T E C H N I C A L O V E R V I E W A S S E S S M E N T F E B R U A R Y 1 4 , 2 0 1 8
D O S S I E R : 1 7 . 0 3 5 7 M A D R O N E E N V I R O N M E N T A L S E R V I C E S L T D .
FIGURE 4: DOMINANT SURFICIAL MATERIAL OF THE STUDY AREA, AS DETERMINED BY DESKTOP ANALYSIS OF LIDAR AND
AIR PHOTO ANALYSIS.
Green polygons represent till, blue is glaciomarine, colluvium is brown, and red is bedrock. Glaciofluvial material is dark orange, with fluvial material as yellow.

D I S T R I C T O F K I T I M A T P A G E 1 8
G E O T E C H N I C A L A N D H Y D R O T E C H N I C A L O V E R V I E W A S S E S S M E N T F E B R U A R Y 1 4 , 2 0 1 8
D O S S I E R : 1 7 . 0 3 5 7 M A D R O N E E N V I R O N M E N T A L S E R V I C E S L T D .
3.3 Climate
Climatic conditions of the study area are likely very similar to those
recorded at the nearest Environment Canada weather stations (Table 3).
Snow accumulation will be higher due to the elevation difference between the stations and the study area extent. In general, the study area sees a
significant amount of precipitation and extreme daily precipitation events
tend to occur in the fall. Table 3: Climatic Conditions of the Study Area during the Period 1981 to 2010.
Station Mean Annual
Precipitation (mm)
Mean Annual Snowfall
(cm)
Extreme Daily
Precipitation (mm)
Kitimat 2 2775 302 179; Oct 31, 1978
Kitimat 3 2332 424 159; Oct 9, 1991
Kitimat Townsite 2211 325 145; Oct 26, 1976
3.4 Hydrology
The District of Kitimat contains five significant rivers (Kitimat River, Anderson Creek, Bish Creek, Emsley Creek, and Jesse Creek) and one
large lake (Jesse Lake), in addition to Douglas Channel. The study area
does not include any portion of the Kitimat River. Approximately 1.6 km
of Anderson Creek, 7.0 km of Bish Creek, 7.5 km of Emsley Creek, and 2.5 km of Jesse Creek are contained within the study area.
The largest watersheds in the study area are Bish Creek and Jesse Creek
(126 km2 and 150 km2 respectively). The headwater area of Jesse Creek is occupied by a small glacier, but glaciers are absent in the Bish Creek
watershed. The middle reaches of the mainstems of these creeks exhibit
low channel gradients (>1%) in long, U-shaped valleys with flat bottoms.
The lower reaches flow through broader valleys with gentler sidewalls and wide, flat bottoms. Bish Creek debouches directly into Douglas Channel
and Jesse Creek debouches into Jesse Lake, which in turn flows over a
waterfall into Douglas Channel. Only the lower 2.5 km of Jesse Creek and
the lower 7 km of Bish Creek, both segments contained in the broader valleys, are within the study area. The lower portions of Bish Creek
watershed have been extensively logged from 1997 to the present. The

D I S T R I C T O F K I T I M A T P A G E 1 9
G E O T E C H N I C A L A N D H Y D R O T E C H N I C A L O V E R V I E W A S S E S S M E N T F E B R U A R Y 1 4 , 2 0 1 8
D O S S I E R : 1 7 . 0 3 5 7 M A D R O N E E N V I R O N M E N T A L S E R V I C E S L T D .
Jesse Creek watershed appears to be unlogged. Some logging near the
eastern height of land above Jesse Lake has occurred since 2015. An LNG facility has been under construction near the mouth of Bish Creek since
2013.
Emsley Creek drains the smallest of the assessed watersheds at 20 km2, much of which is in the study area. In the middle reaches, the channel has
steep gradients (>8%) and flows through a narrow, V-shaped valley,
before emerging onto a broad plain and flowing to Douglas Channel. All 5
km of the channel on the plain and 2.5 km upstream in the valley are within the study area. The lower portions of Emsley Creek watershed
experienced some logging in 2002 to 2008, and a considerable amount of
logging since 2015.
Anderson Creek drains an intermediate-size watershed of 38 km2. The
lower reaches cross the study area, west to east, before flowing onto the
Kitimat River estuary. Of the 1.5 km of the channel within the study area,
only the lower-most 200 m, immediately upstream of Highway 37, is not contained within a narrow V-shaped valley. The channel upstream of the
study area is also contained in the narrow valley. The channel gradient in
the valley is moderately steep (2%-5%). Some logging occurred in the
1970s near the front of the watershed, but the watershed appears to be mostly unlogged.

D I S T R I C T O F K I T I M A T P A G E 2 0
G E O T E C H N I C A L A N D H Y D R O T E C H N I C A L O V E R V I E W A S S E S S M E N T F E B R U A R Y 1 4 , 2 0 1 8
D O S S I E R : 1 7 . 0 3 5 7 M A D R O N E E N V I R O N M E N T A L S E R V I C E S L T D .
Table 4. Watershed Characteristics
Anderson Creek
at Kitimat River
Bish Creek
at Bish Cove
Emsley Creek
at Emsley Cove
Jesse Creek
at Jesse Lake
Watershed Area 38 km2 126 km2 20 km2 150 km2
Watershed fraction
below 300 m
16% 27% 33% 15%
Watershed fraction,
300 – 800 m
52% 44% 47% 35%
Watershed fraction
above 800 m
32% 29% 20% 50%
Fraction of watershed
above Study Area**
89% 75% 20% 97%
Maximum elevation in
watershed
1320 m 1560 m 1180 m 1900 m
Length of mainstem
channel in Study area
1.6 km* 7.0 km* 7.5 km 2.5 km
Mainstem channel
type in Study Area*
Confined, mainly non-alluvial
Unconfined alluvial Unconfined alluvial for lower 5 km; Confined, non-alluvial for upper 2.5 km
Unconfined alluvial
Channel width in
Study Area*
~15 m 40 – 60 m Alluvial reaches: 10-15 m non-alluvial: ~10 m
40 – 60 m
* - includes WDCCA study area
** - watershed area above the point where the mainstem enters the Study Area
3.5 Resources
Within the last hundred years, this region has experienced economic
growth and development based on fishing, tourism, forestry and resource processing. The economy has continued to grow along with its population
in the demand for natural resources, aluminum, kraft paper, methanol,
and ammonia both at home and abroad. While a description of the extent
of resource development is beyond the scope of this project, it should be noted that historical alterations to the landscape are visible decades after
completion. In some cases, the utilization of existing infrastructure can be
used to expand the viability of an area for new land uses such as
recreational or residential.
D I S T R I C T O F K I T I M A T P A G E 2 1
G E O T E C H N I C A L A N D H Y D R O T E C H N I C A L O V E R V I E W A S S E S S M E N T F E B R U A R Y 1 4 , 2 0 1 8
D O S S I E R : 1 7 . 0 3 5 7 M A D R O N E E N V I R O N M E N T A L S E R V I C E S L T D .
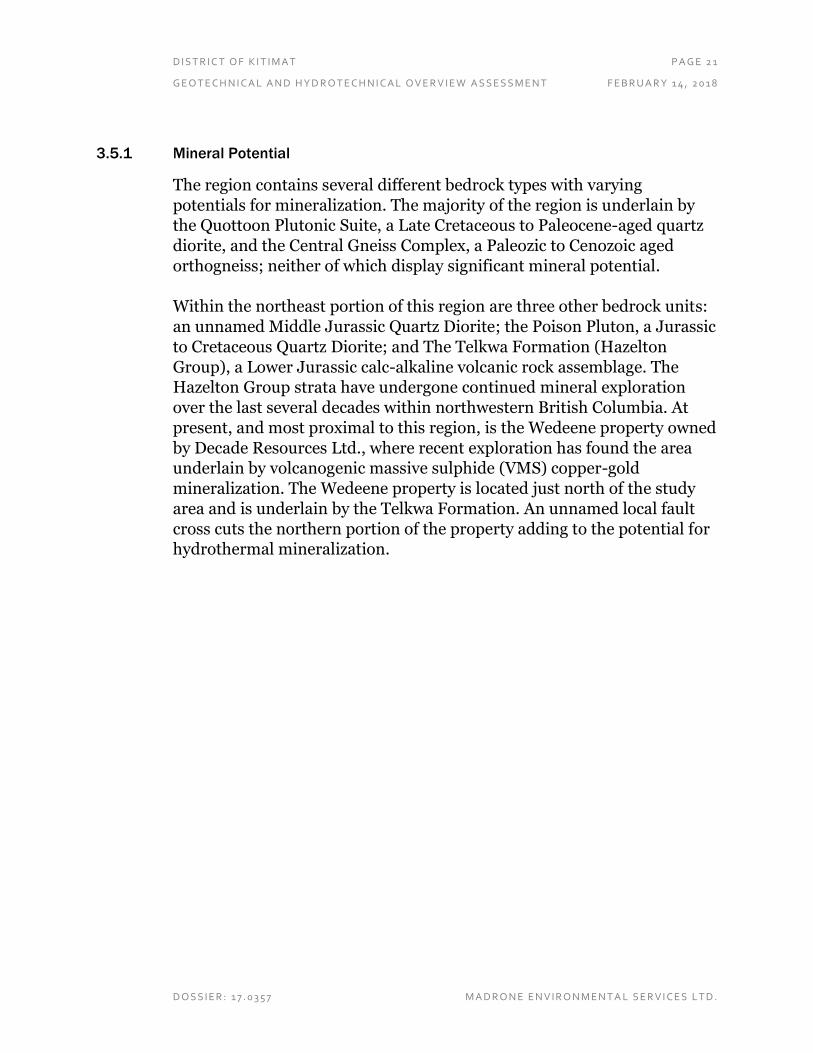
3.5.1 Mineral Potential
The region contains several different bedrock types with varying
potentials for mineralization. The majority of the region is underlain by the Quottoon Plutonic Suite, a Late Cretaceous to Paleocene-aged quartz
diorite, and the Central Gneiss Complex, a Paleozic to Cenozoic aged
orthogneiss; neither of which display significant mineral potential.
Within the northeast portion of this region are three other bedrock units:
an unnamed Middle Jurassic Quartz Diorite; the Poison Pluton, a Jurassic
to Cretaceous Quartz Diorite; and The Telkwa Formation (Hazelton
Group), a Lower Jurassic calc-alkaline volcanic rock assemblage. The Hazelton Group strata have undergone continued mineral exploration
over the last several decades within northwestern British Columbia. At
present, and most proximal to this region, is the Wedeene property owned
by Decade Resources Ltd., where recent exploration has found the area underlain by volcanogenic massive sulphide (VMS) copper-gold
mineralization. The Wedeene property is located just north of the study
area and is underlain by the Telkwa Formation. An unnamed local fault
cross cuts the northern portion of the property adding to the potential for hydrothermal mineralization.

D I S T R I C T O F K I T I M A T P A G E 2 2
G E O T E C H N I C A L A N D H Y D R O T E C H N I C A L O V E R V I E W A S S E S S M E N T F E B R U A R Y 1 4 , 2 0 1 8
D O S S I E R : 1 7 . 0 3 5 7 M A D R O N E E N V I R O N M E N T A L S E R V I C E S L T D .
FIGURE 5: MINERAL POTENTIAL IN THE DOK REGION.
Yellow stars represent two small historic mines, the black triangle is approximate location of Wedeene Project Property, and the yellow dashed line is potential mineral extraction within the study area.
No recorded historic mining sites were discovered during this
investigation. The only potential mineral extraction site is indicated in
Figure 5, and underlain by the same bedrock and local fault as the Wedeene property. Figure 5 is an overview of the study area showing the
regional bedrock geology, two small historic mine sites which extracted
less than 10,000 tonnes of an unknown ore13, and the Dacade Resources
13 http://webmap.em.gov.bc.ca/mapplace/HistoricMines/main.asp

D I S T R I C T O F K I T I M A T P A G E 2 3
G E O T E C H N I C A L A N D H Y D R O T E C H N I C A L O V E R V I E W A S S E S S M E N T F E B R U A R Y 1 4 , 2 0 1 8
D O S S I E R : 1 7 . 0 3 5 7 M A D R O N E E N V I R O N M E N T A L S E R V I C E S L T D .
Ltd. Wedeene Project Property location14. The yellow dashed line
highlights the only potential mineral extraction site.
4 Geotechnical Implications
4.1 Natural Hazards
Natural hazards can pose a risk to life and property. It is important to
assess the probability and capability of natural hazards to cause damage.
Through this assessment, appropriate land use designs and mitigation measures can be put in place.
4.1.1 Flooding
Floodplains, as their name suggests, are prone to flooding. In the study
area there is a mosaic of active and inactive floodplains, as well as
glaciofluvial terraces deposited early in post-glacial history (and now well above any modern flood elevation). In general, we cannot distinguish
active from inactive floodplains in an overview assessment. More detailed
field assessment is required to accurately map the extent of potential
flooding.
With the exception of the Kitimat River floodplain, floodplains of the
systems assessed in this report (Anderson, Bish, Emsley, and Jesse
Creeks) are uninhabited; however, Bish Cove has been subject to industrial use and active forest service and industrial roads are located
within the floodplain.
Water Survey of Canada records for Little Wedeene River below Bowbyes
Creek (Station 08FF003) show bimodal annual peak flows with the
highest annual discharge usually occurring in the period from September
through November and lesser peak discharges occurring during the freshet in May or June. The Little Wedeene River watershed is similar in
size and elevation distribution to the Jesse Creek and Bish Creek
watersheds with maximum elevation of approximately 1800 m and a
substantial fraction of the watershed in the nival zone above about 800 m.
14http://www.decaderesources.ca/s/QwikReport.asp?IsPopup=Y&printVersion=now&X
B0B=381449,408237

D I S T R I C T O F K I T I M A T P A G E 2 4
G E O T E C H N I C A L A N D H Y D R O T E C H N I C A L O V E R V I E W A S S E S S M E N T F E B R U A R Y 1 4 , 2 0 1 8
D O S S I E R : 1 7 . 0 3 5 7 M A D R O N E E N V I R O N M E N T A L S E R V I C E S L T D .
Like the Jesse Creek watershed, but unlike Bish Creek, Little Wedeene
watershed hosts a small glacier in its headwater area. The Little Wedeene watershed is somewhat larger than the Anderson Creek and Emsley Creek
watersheds, but all have a similar distribution of elevation.
Records for the Renegade Creek gauge (WSC Station 08FF006) show a pattern that is somewhat similar to the Little Wedeene River, but with a
proportionately smaller freshet occuring in April. This watershed is
different from the assessed watersheds in that it is significantly smaller
(3.2 km2) and, with a maximum elevation of 700 m, has little area in the nival (permanent snow) zone.
While larger rivers such as the Kitimat River will experience peak flows
due to snowmelt which therefore occur in summer, the smaller systems assessed in this report are more strongly influenced by rainfall or rain-on-
snow events due to the significant portions of their watersheds that are in
the rain-dominated zone (below about 300 m elevation) and the transient
snow zone between 300 m and 800 m elevation. Like the Little Wedeene, larger rivers are likely to experience the largest floods during rain-on-
snow storms in the period between September and November inclusive.
Smaller floods may occur during the freshet which is likely to occur in
May and/or June.
We have estimated the 200-year maximum daily mean discharge (i.e., the
daily mean discharge with an annual probability of being exceeded of
1/200) for each of the assessed creeks at the point where they enter the study area and at the point where they debouche into Douglas Channel (or
into the Kitimat River estuary in the case of Anderson Creek). Discharges
will differ between the two points primarily due to tributaries that join the
mainstem downstream of where it enters the study area. The estimates, shown in Table 5, were derived using a modification of a regional
correlation method developed by Coulson and Obedkoff10, and should be
considered to be approximations only. More accurate estimates would require a level of effort beyond the scope of this report.
Table 5. Estimated 200-Year Maximum Daily Mean Discharge
At Upstream Study Area Boundary At Mouth

D I S T R I C T O F K I T I M A T P A G E 2 5
G E O T E C H N I C A L A N D H Y D R O T E C H N I C A L O V E R V I E W A S S E S S M E N T F E B R U A R Y 1 4 , 2 0 1 8
D O S S I E R : 1 7 . 0 3 5 7 M A D R O N E E N V I R O N M E N T A L S E R V I C E S L T D .
Anderson Creek 140 m3/s 160 m3/s
Bish Creek 320 m3/s 400 m3/s
Emsley Creek 25 m3/s 90 m3/s
Jesse Creek 440 m3/s 450 m3/s
Note: 200-year maximum instantaneous discharge will be approximately twice the 200-year maximum daily mean discharges
While the largest floods are likely to occur during rain-on-snow events in
the fall, smaller floods may occur at other times of year, especially during spring freshet. Flooding can be triggered by seasonal changes related to
snowpack melt or increased precipitation over short periods. Flooding
may be influenced by changes in climate, however, changes in peak
discharges due to climate change over the next 100 years will not likely exceed uncertainty in the peak flow estimates contained in Table 5.
Determination of the areal extent of flooding requires detailed modeling,
which is also beyond the scope of this report. As a first approximation, areas along assessed creeks that have been mapped as having fluvial
deposits (but not including glaciofluvial deposits) may be considered as
potentially flood-prone. Additional areas along smaller creeks, including areas alongside tributaries to the assessed streams, may also be flood-
prone.
Another potential type of flooding may arise due to landslides that dam a channel in the middle reaches of a watershed, impound large volumes of
water, then breach catastrophically. Landside-dam-breach floods are
potentially much larger that “normal” extreme floods. For a landslide-
dam-breach flood to occur, three conditions must exist:
1 There must be landslide-prone slopes (usually steep) above the
channel
2 The valley bottom must be narrow enough to be blocked by a landslide
3 The creek channel gradient immediately upstream of a landslide must be sufficiently low that large volumes of water can be impounded.
Middle reaches of Anderson and Emsley creeks exhibit channel gradients
that are too steep for significant volumes of water to be impounded. Consequently, there is little potential for landslide-dam-breach floods in
the lower reaches of these creeks.

D I S T R I C T O F K I T I M A T P A G E 2 6
G E O T E C H N I C A L A N D H Y D R O T E C H N I C A L O V E R V I E W A S S E S S M E N T F E B R U A R Y 1 4 , 2 0 1 8
D O S S I E R : 1 7 . 0 3 5 7 M A D R O N E E N V I R O N M E N T A L S E R V I C E S L T D .
For Bish and Jesse creeks, channel gradients in the middle reaches are low, and there are potentially landslide-prone slopes above the channel.
However, for most reaches, the valley bottoms are quite wide (up to 500
m), so only very large (and consequently less probable) landslides could
impound these creeks. Consequently, while landslide-dam-burst events are possible, our preliminary estimate is that the probability of one
occurring is very low. However, it must be emphasized that accurate
estimation of the likelihood of such events requires detailed topographic
maps of the valley bottoms, terrain stability mapping of the slopes above the channel, and modeling of the downstream attenuation of the flood
resulting from the dam burst. Data required were either unavailable or
outside the scope of this study.
4.1.2 Stream Erosion and Avulsion
Significant erosion of stream banks generally occurs where bank material is unconsolidated, particularly in alluvial material. With the exception of
the lowermost 200 m, the part of Anderson Creek that is within the study
area appears to be largely contained in non-alluvial material. All portions
of Bish Creek and Jesse Creek within the study area and the portion of Emsley downstream of 53o 55’ 18” N, 128o 50’ 19” W are contained in
alluvial material.
Bish Creek and Jesse Creek could experience bank erosion amounting to several tens of metres over the typical design life of residential or
commercial structures or roads. Because of its lower flow rates, Emsley
Creek may experience lesser, though not inconsequential, amounts of
erosion. Erosion could also reactivate old channels or create new ones. More precise estimates of the potential extent of erosion should be
determined by on-site investigations.
It is important to maintain existing forest cover in broad riparian strips along Bish Creek, Jesse Creek, and Emsley Creek. Bank support from
roots retards erosion. Removing trees creates a self-reinforcing process
whereby erosion of banks introduce sediment into the channel; that sediment is deposited in mid-channel bars which divert flow against the
banks, thus increasing erosion. The result is that creeks in alluvial
material tend to widen substantially when forest cover along the banks is
removed.

D I S T R I C T O F K I T I M A T P A G E 2 7
G E O T E C H N I C A L A N D H Y D R O T E C H N I C A L O V E R V I E W A S S E S S M E N T F E B R U A R Y 1 4 , 2 0 1 8
D O S S I E R : 1 7 . 0 3 5 7 M A D R O N E E N V I R O N M E N T A L S E R V I C E S L T D .
Velocity of water has a powerful effect on erosion and scour that occurs along banks. In steep channels, bank erosion during high flow events can
result in large volumes of unconsolidated sediments slumping into the
river resulting in debris floods and debris flows. Depending on where
slumping occurs along the course of the river, the amount of debris within the stream channel, in addition to the high velocity and high water
content, can exacerbate the erosion resulting in further damage to the
banks and avulsion i.e., a stream flows downslope from a higher elevation
to the lower elevation, gaining velocity as it decreases in altitude.
The rate of erosion within a river is subject to gradient, water velocity, and the nature of unconsolidated sediments. The process described above for
larger streams also operate in smaller streams, though at a smaller scale
and with the added potential for avulsion near fan apex.

D I S T R I C T O F K I T I M A T P A G E 2 8
G E O T E C H N I C A L A N D H Y D R O T E C H N I C A L O V E R V I E W A S S E S S M E N T F E B R U A R Y 1 4 , 2 0 1 8
D O S S I E R : 1 7 . 0 3 5 7 M A D R O N E E N V I R O N M E N T A L S E R V I C E S L T D .
FIGURE 6: FLUVIAL FANS (ORANGE) AND FLUVIAL PLAINS (YELLOW) WITHIN THE STUDY AREA.
The activity of the fluvial plain is assumed inactive, although that is not representative of potential flood scenarios.

D I S T R I C T O F K I T I M A T P A G E 2 9
G E O T E C H N I C A L A N D H Y D R O T E C H N I C A L O V E R V I E W A S S E S S M E N T F E B R U A R Y 1 4 , 2 0 1 8
D O S S I E R : 1 7 . 0 3 5 7 M A D R O N E E N V I R O N M E N T A L S E R V I C E S L T D .
FIGURE 7: WATERCOURSE DISTRIBUTION AS MAPPED BY FRESHWATER ATLAS WITHIN THE STUDY AREA.
Thick blue line outlines the Douglas Channel and the smaller dendritic lines are streams that mostly feed into the four major rivers within the study area.

D I S T R I C T O F K I T I M A T P A G E 3 0
G E O T E C H N I C A L A N D H Y D R O T E C H N I C A L O V E R V I E W A S S E S S M E N T F E B R U A R Y 1 4 , 2 0 1 8
D O S S I E R : 1 7 . 0 3 5 7 M A D R O N E E N V I R O N M E N T A L S E R V I C E S L T D .
4.1.3 Landslides
There are many areas in the study area where risk of landslides is high.
There are numerous factors related to the probability of failure, such as relative relief and elevation, duration and abundance of precipitation,
nature of the unconsolidated sediments, and presence of sensitive clays.
In the study area there is evidence of slow mass movement in
glaciomarine sediments, debris slides and flows from steeper slopes and high elevations, snow avalanches, and rockfalls.
Post-glacial settling of materials resulted in some instability within the
study area, specifically along steeper sloping terrain, resulting in colluvial deposition. The colluvium is a mixture of parent material that has been
affected by instability and therefore is not one particular type of sediment
but rather an amalgamation of local sediments, i.e., till and glaciofluvial,
bedrock and glaciomarine, etc. The combinations are numerous and therefore predictability of the strength and potential reactivation of these
materials needs to be evaluated on a case-by-case basis.
Figure 8 is a general representation of landslide-related geotechnical hazards found in the study area. These hazards include debris flows,
debris slides, debris avalanches, and rockfalls. These are point
representations of a geotechnical hazard, as they can be related to the
head scarp of a failure (because the resulting material or fan was either eroded by fluvial or marine actions), or a debris flow fan with a large
catchment area.

D I S T R I C T O F K I T I M A T P A G E 3 1
G E O T E C H N I C A L A N D H Y D R O T E C H N I C A L O V E R V I E W A S S E S S M E N T F E B R U A R Y 1 4 , 2 0 1 8
D O S S I E R : 1 7 . 0 3 5 7 M A D R O N E E N V I R O N M E N T A L S E R V I C E S L T D .
FIGURE 8: OBSERVED LANDSLIDES AND OTHER EVIDENCE OF INSTABILITY IN THE STUDY AREA, AS DISCOVERED THROUGH
DESKTOP ANALYSIS OF LIDAR DATA.
Points may represent failure headscarps, debris flow tracks, slump blocks, or a fan apex, and other distinct evidence of failure.

D I S T R I C T O F K I T I M A T P A G E 3 2
G E O T E C H N I C A L A N D H Y D R O T E C H N I C A L O V E R V I E W A S S E S S M E N T F E B R U A R Y 1 4 , 2 0 1 8
D O S S I E R : 1 7 . 0 3 5 7 M A D R O N E E N V I R O N M E N T A L S E R V I C E S L T D .
Geological or geomorphological processes affect almost 50% of the study
area; these include rapid mass movement, slow mass movement, and gully erosion. Rapid and slow mass movement can affect a large
geographical area, whereas gully erosion is more of a linear event.
Secondary processes may occur in the same area: for example where gully
erosion occurs, there is a probability of rapid mass movement if gully sidewalls collapse when there is water flowing through the gully, resulting
in a debris flow within the gully. Table 6: Geological Processes that Occur in the Study as Observed through
Desktop Analysis of LiDAR
More than one process can occur within an area, therefore processes may be primary or secondary.
Geological Process
Primary Secondary
Area (km2) Percentage of Study
Area Area (km2)
Percentage of
Study Area
Rapid Mass Movement 52 36% 5 4%
Slow Mass Movement 4. 3% 5 4%
Gully Erosion 13 9% 10 7%
Other** 1 <1% 2 1%
** Other geological processes include braiding and meandering streams, avalanche, and inundation.
The reconnaissance terrain stability analysis approximated 49% of the
study area as either potentially unstable or unstable; more site-specific
field analysis would refine these values. Given the rugged terrain of the
study area, this assessment is not surprising, however, future development within DOK will likely be limited to areas where access is
possible, and therefore changing the ratio of stable to
potentially/unstable. Rougher terrain such as bedrock ridges and mountain peaks tend to be less stable due to their slope and active
geological processes, whereas flat lying and gentle slope terrain is more
stable and easily accessible through ports and inlets.

D I S T R I C T O F K I T I M A T P A G E 3 3
G E O T E C H N I C A L A N D H Y D R O T E C H N I C A L O V E R V I E W A S S E S S M E N T F E B R U A R Y 1 4 , 2 0 1 8
D O S S I E R : 1 7 . 0 3 5 7 M A D R O N E E N V I R O N M E N T A L S E R V I C E S L T D .
Table 7: Slope stability class of the study area, as determined from desktop
analysis of LiDAR.
Stability Class Area (km2) Percent of Study Area
Stable 73 51%
Potentially unstable 47 33%
Unstable 22 16%

D I S T R I C T O F K I T I M A T P A G E 3 4
G E O T E C H N I C A L A N D H Y D R O T E C H N I C A L O V E R V I E W A S S E S S M E N T F E B R U A R Y 1 4 , 2 0 1 8
D O S S I E R : 1 7 . 0 3 5 7 M A D R O N E E N V I R O N M E N T A L S E R V I C E S L T D .
FIGURE 9: DOMINANT GEOMORPHOLOGICAL PROCESSES WITHIN THE STUDY AREA.
Red represents rapid mass movement, orange is slow mass movement, and gully erosion is blue.

D I S T R I C T O F K I T I M A T P A G E 3 5
G E O T E C H N I C A L A N D H Y D R O T E C H N I C A L O V E R V I E W A S S E S S M E N T F E B R U A R Y 1 4 , 2 0 1 8
D O S S I E R : 1 7 . 0 3 5 7 M A D R O N E E N V I R O N M E N T A L S E R V I C E S L T D .
FIGURE 10: RECONNAISSANCE TERRAIN STABILITY MAPPING (RTSM).
Slope stability classes stable (S, green)-potential unstable (P, yellow)- unstable (U, red), in study area.
D I S T R I C T O F K I T I M A T P A G E 3 6
G E O T E C H N I C A L A N D H Y D R O T E C H N I C A L O V E R V I E W A S S E S S M E N T F E B R U A R Y 1 4 , 2 0 1 8
D O S S I E R : 1 7 . 0 3 5 7 M A D R O N E E N V I R O N M E N T A L S E R V I C E S L T D .
4.1.4 Snow Avalanches
Snow avalanches are a significant hazard; large and recent events are
obvious in air photos and some LiDAR imaging, and therefore noted during the terrain mapping, The overview scale of this project, however,
cannot guarantee that avalanches cannot and do not occur in other areas.
4.2 Seismic Considerations
There are two unnamed faults that run through the District of Kitimat. Within the study area, one fault runs parallel to the western bank of the
Douglas Channel, terminating approximately 12 km southwest of
Kitamaat Village, BC15. We were unable to find a record of activity directly
attributed to the faults that run through the District; however, given the seismic history of western BC, it is reasonable to assume that there is
some seismic risk associated with the area.
Most of the seismic energy released along western BC occurs along the Fairweather-Queen Charlotte fault system. When an earthquake occurs
along this fault system, it may have a reverberating effect along other
smaller local fault systems, however, this transfer of energy is hard to
quantify. The study area has a history of intermediate size earthquakes at a low frequency. November 5th 1973 a magnitude 4.7 earthquake occurred
20 km southwest of Terrace along the Kitsumkalum-Kitimat Trough.
Damage was limited but the earthquake was felt to distances of 120 km from its epicenter. The earthquake did not occur along any known fault
line at the time.
PGA, or peak ground acceleration, is what is experienced by a particle on
the ground. SA (spectral acceleration) is approximately what is
experienced by a building, as modeled for the natural period(s) of vibration as the building16. Estimated seismic accelerations for a Class C
site (i.e. underlain by very dense soil or soft rock) having a probability of
2% in 50 years are shown in Table 8 below.
15 Bellefontaine, K., Alldrick, D. and Desjardins, P.J., 1994: Mid Coast (all or parts of
92F, G, J, K, L, M, N; 93D; 102P; 103A), Ministry of Energy, Mines and Petroleum Resources, Open File 1994-17.
14https://earthquake.usgs.gov/hazards/learn/technical.php. Accessed February 15, 2018

D I S T R I C T O F K I T I M A T P A G E 3 7
G E O T E C H N I C A L A N D H Y D R O T E C H N I C A L O V E R V I E W A S S E S S M E N T F E B R U A R Y 1 4 , 2 0 1 8
D O S S I E R : 1 7 . 0 3 5 7 M A D R O N E E N V I R O N M E N T A L S E R V I C E S L T D .
Table 8. Peak Ground Acceleration and Spectral Accelerations at
53o 54’ N, 128o 48’ W (G’s)16
PGA Sa[0.05] Sa[0.1] Sa[0.2] Sa[0.3] Sa[0.5] Sa[1] Sa[2] Sa[5] Sa[10]
0.09 0.09 0.14 0.17 0.18 0.18 0.15 0.10 0.04 0.01
4.3 Sensitive Clays
Glaciomarine sediments consist primarily of silt and clay. They were deposited in the lower elevations early in post-glacial time when the land
was submerged (and had not yet rebounded) due to the weight of the ice.
As the land rebounded after glacial retreat, these glaciomarine sediments were raised and exposed to stream and river erosion.
Because of this glacial history, the Kitimat Ranges host sensitive
glaciomarine sediments in lower elevations. Certain glaciomarine sediments may be ‘sensitive’ meaning that due to special conditions
during their formation they may be subject to catastrophic loss of strength
upon disturbance. When this happens, sensitive clays may liquefy and
flow downslope.17. The exact distribution of these clays is still unknown due to extensive fluvial erosion and deposition involving the rapid
development and evolution of floodplains, fans, and deltas throughout the
region.
Past research has found that glaciomarine sediments are visible in the
sidewalls of most streams in the Kitsumkalum-Kitimat Trough, which
explains the presence of certain large landslides or displacements that are
still occurring in that region18. The most common trigger for these large low-gradient landslides is fluvial bank erosion of glaciomarine sediments.
Figure 11 shows the regional distribution of glaciomarine clays as mapped
by the Geological Survey of Canada19. It is likely the clays extend up some 16 Halchuk, S C; Adams, J E; Allen, T I. 2015. Fifth generation seismic hazard model for
Canada: grid values of mean hazard to be used with the 2015 National Building Code of Canada. Geological Survey of Canada, Open File 7893
17 The Landslide-Modified Glacimarine Landscape of the Terrace-Kitimat Area, BC (Geertsema, Cruden, & Clague, 2017)
18 The Landslide-Modified Glacimarine Landscape of the Terrace-Kitimat Area, BC (Geertsema, Cruden, & Clague, 2017)
19 CGS-South Kitimat Arm, Douglas Channel Area maps 300 and 301.

D I S T R I C T O F K I T I M A T P A G E 3 8
G E O T E C H N I C A L A N D H Y D R O T E C H N I C A L O V E R V I E W A S S E S S M E N T F E B R U A R Y 1 4 , 2 0 1 8
D O S S I E R : 1 7 . 0 3 5 7 M A D R O N E E N V I R O N M E N T A L S E R V I C E S L T D .
of the valleys extending north off the Kitimat Arm. However, due to the
steeper slopes and narrow valley bottoms associated with these valleys most of the clays were likely removed by either alluvial or fluvial processes
following regression as a result of post glacial rebound.

D I S T R I C T O F K I T I M A T P A G E 3 9
G E O T E C H N I C A L A N D H Y D R O T E C H N I C A L O V E R V I E W A S S E S S M E N T F E B R U A R Y 1 4 , 2 0 1 8
D O S S I E R : 1 7 . 0 3 5 7 M A D R O N E E N V I R O N M E N T A L S E R V I C E S L T D .
FIGURE 11: MAPPED GLACIOMARINE SEDIMENTS (PURPLE) AND FIELD CONFIRMED LOCATIONS OF SENSITIVE CLAYS FROM
LITERATURE (PINK DOTS).

D I S T R I C T O F K I T I M A T P A G E 4 0
G E O T E C H N I C A L A N D H Y D R O T E C H N I C A L O V E R V I E W A S S E S S M E N T F E B R U A R Y 1 4 , 2 0 1 8
D O S S I E R : 1 7 . 0 3 5 7 M A D R O N E E N V I R O N M E N T A L S E R V I C E S L T D .
5 Conclusion and Recommendations
5.1 Hazard Acceptability Thresholds
The Local Government Act of BC empowers local governments to address geotechnical hazards in their development policies, bylaws and permits.
Generally, the procedure involves the characterization and mapping of a
hazard for all areas within the jurisdiction of a local government. Any development proposals, subdivisions, building permits or other activities
may trigger the need for a geotechnical hazard assessment, or a flood
hazard assessment, depending on the nature of the hazard.
A qualified person, as defined in the local bylaw, would evaluate the type
of risk, the type of proposed development, and the potential remedial or
protective measure for said development. Figure 12 is an example of
hazard acceptability for development prepared by Dr. Peter Cave (1993). In his report, he outlines the geotechnical hazards, the types of
development, and the acceptability of risk within the Fraser-Cheam
District (now referred to as the Fraser Valley Regional District). For
example, Table 9 demonstrates the level of hazard acceptability for a new single family dwelling, relative to the possible geohazards.
FIGURE 12: HAZARD ACCEPTABILITY DEVELOPMENT, FROM CAVE (1993).

D I S T R I C T O F K I T I M A T P A G E 4 1
G E O T E C H N I C A L A N D H Y D R O T E C H N I C A L O V E R V I E W A S S E S S M E N T F E B R U A R Y 1 4 , 2 0 1 8
D O S S I E R : 1 7 . 0 3 5 7 M A D R O N E E N V I R O N M E N T A L S E R V I C E S L T D .
Table 9: Hazard Acceptability Thresholds for a New Building, as per Cave
(1993).
Hazard-Related Responses to Building Approval Applications
Not approvable
Approval, but
with a
covenant
including
“save
harmless”
conditions as
well as siting
conditions,
protective
works or both
Approval, but
with siting
requirements
to avoid the
hazard, or with
requirements
for protective
works to
mitigate the
hazard
Approval
without siting
conditions or
protective
works, but with
a covenant
including
“save
harmless”
conditions
Approval
without
conditions
relating to
hazards
Ne
w B
uil
din
g
TYPE OF HAZARD Annual Return Frequencies
Inundation by
Flood Waters N/A >1:40 1:40 – 1:200 N/A < 1:200
Mountain
Stream Erosion
or Avulsion
>1:100 1:100 – 1:200 N/A 1:200 – 1:500 < 1:500
Debris Flood N/A >1:50 1:200 - 1:500 N/A
1:500 – 1:10,000
Debris Flow /
Debris Torrent > 1:200 1:200 – 1:500
1:500 – 1:10,000
N/A <1:10,000
Localized
Landslip > 1:50 1:50 – 1:500
1:500 – 1:10,000
N/A < 1:10,000
Snow
Avalanche > 1:30 1:30 – 1:10,000 N/A N/A < 1:10,000
Rock Fall > 1:100 1:100 – 1:1,000 N/A N/A < 1:1,000
Catastrophic
Landslide > 1:1,000 N/A N/A N/A < 1:1,000
There are other examples of hazard acceptability thresholds that have
been created for local government. We recommend that the DOK either creates their own hazard acceptability threshold or adopts an existing one
from another local government.
5.2 Development Permit Areas
Development permit areas (DPA) allow a local government to delineate
location-specific bylaws related to areas susceptible to geological hazards.
Official Community Plans (OCP) refer to these areas when addressing
zoning and building code bylaws, making site-specific assessments a requirement when permits are requested within a geohazard DPA. We
have created a general geohazard DPA map that approximates the two
major geohazards in the study area: flooding and hillslopes and uplands.

D I S T R I C T O F K I T I M A T P A G E 4 2
G E O T E C H N I C A L A N D H Y D R O T E C H N I C A L O V E R V I E W A S S E S S M E N T F E B R U A R Y 1 4 , 2 0 1 8
D O S S I E R : 1 7 . 0 3 5 7 M A D R O N E E N V I R O N M E N T A L S E R V I C E S L T D .
FIGURE 13: GENERAL GEO-HAZARD DPA MAP FOR THE STUDY AREA.
Red demarks potential hillslope and upland hazards, and blue is potential flood hazards. This is for illustration only; a DPA map should be constructed after detailed field survey and more investigation.

D I S T R I C T O F K I T I M A T P A G E 4 3
G E O T E C H N I C A L A N D H Y D R O T E C H N I C A L O V E R V I E W A S S E S S M E N T F E B R U A R Y 1 4 , 2 0 1 8
D O S S I E R : 1 7 . 0 3 5 7 M A D R O N E E N V I R O N M E N T A L S E R V I C E S L T D .

D I S T R I C T O F K I T I M A T P A G E 4 4
G E O T E C H N I C A L A N D H Y D R O T E C H N I C A L O V E R V I E W A S S E S S M E N T F E B R U A R Y 1 4 , 2 0 1 8
D O S S I E R : 1 7 . 0 3 5 7 M A D R O N E E N V I R O N M E N T A L S E R V I C E S L T D .
5.2.1 Flood Hazard
Flooding within the study area is a significant concern. The study area
includes four large streams, Jesse Lake, and numerous smaller and unnamed streams. The Kitimat River, while not in the immediate study
area, is within the District of Kitimat and also poses a flood hazard. Flood
Hazard Area Land Use Management Guidelines (2004) were meant to
aid local governments in developing and implementing land use management plans and approval decisions for flood hazard areas. The
guidelines outline minimum provincial requirements, and lay out a
template for local governments to expand upon. In general, these
minimums are used in the absence of site-specific studies and information for land use management in flood hazard areas. From a geohazard
standpoint, the guidelines prescribe flood construction levels (the vertical
setback from watercourse) and a floodplain setback (horizontal setback
from watercourse) as determined by size of the watercourse.
Through our terrain mapping of DOK, we have outlined the possible
extent of flooding (susceptible units) from main channels and tributaries
within the study area (Figure 14); this is a high-level analysis and should be used in a general context only. This area is not representative of a
particular size of event, such as the 200-year flood, nor does it take into
account sea level raise. “Over time, the frequency of floods on some rivers
may also increase due to factors that include riverbed aggradation, river channel alterations, land use change, insect infestation, wild fire, and
climate change.”20
5.2.2 Stream Erosion Hazard
There is potential for substantial stream bank erosion (up to tens of
metres over typical design lives of structures and infrastructure) in the alluvial reaches of Bish Creek, Jesse Creek, and Emsley Creek in the study
area. Site-specific assessment of potential erosion should be undertaken
before areas along these creeks are developed. As well, existing forest
20 Association of Professional Engineers and Geoscientists of British Columbia
(APEGBC) (2012) Professional Practice Guidelines - Legislated flood assessments in a changing climate in BC. Association of Professional Engineers and Geoscientists of British Columbia, Burnaby, B.C.

D I S T R I C T O F K I T I M A T P A G E 4 5
G E O T E C H N I C A L A N D H Y D R O T E C H N I C A L O V E R V I E W A S S E S S M E N T F E B R U A R Y 1 4 , 2 0 1 8
D O S S I E R : 1 7 . 0 3 5 7 M A D R O N E E N V I R O N M E N T A L S E R V I C E S L T D .
cover should be maintained in broad riparian strips along these reaches to
prevent widening of the channels.

D I S T R I C T O F K I T I M A T P A G E 4 6
G E O T E C H N I C A L A N D H Y D R O T E C H N I C A L O V E R V I E W A S S E S S M E N T F E B R U A R Y 1 4 , 2 0 1 8
D O S S I E R : 1 7 . 0 3 5 7 M A D R O N E E N V I R O N M E N T A L S E R V I C E S L T D .
FIGURE 14: AREAS POTENTIALLY SUSCEPTIBLE TO FLOODING.
This does not take into account raises in sea level or areas outside of the study area.
D I S T R I C T O F K I T I M A T P A G E 4 7
G E O T E C H N I C A L A N D H Y D R O T E C H N I C A L O V E R V I E W A S S E S S M E N T F E B R U A R Y 1 4 , 2 0 1 8
D O S S I E R : 1 7 . 0 3 5 7 M A D R O N E E N V I R O N M E N T A L S E R V I C E S L T D .
5.2.3 Hillslopes and Uplands Hazard
A development permit area consisting of hillside and uplands may be
subject to natural hazards such as instability, erosion, and debris floods and flows. Unlike flooding hazards, there are no provincial guidelines
relating to setbacks from hazards; a Qualified Professional (QP) on a site-
specific basis would undertake this type of assessment. The governing
body that regulates professional practice of geoscientists and engineers in British Columbia (EGBC) has produced a series of professional practice
guidelines, which outline the required analysis by a QP when geohazards
are encountered. These standards are applicable to all QP within BC and
are regarded as a minimum requirement. Local government can require a QP provided additional information in their assessments, in conjunction
with a hazard acceptability threshold.
Figure 15 is a generalized map of areas of hillslopes and uplands within the study area, and as with the flood hazards map, it is a high-level
depiction and should be used in a general context only. We recommend
that DOK determine a set of criteria that would define the extent of this
DPA. Some local governments define the hillslope and upland area as those with slopes greater than 20% or 60%, whereas others focus on
existing hazards, delineating an area that encompasses similar topography
with or without known geohazards. The hazard acceptability threshold
can also be incorporated to reflect more strict or lenient requirements depending on the zoning.
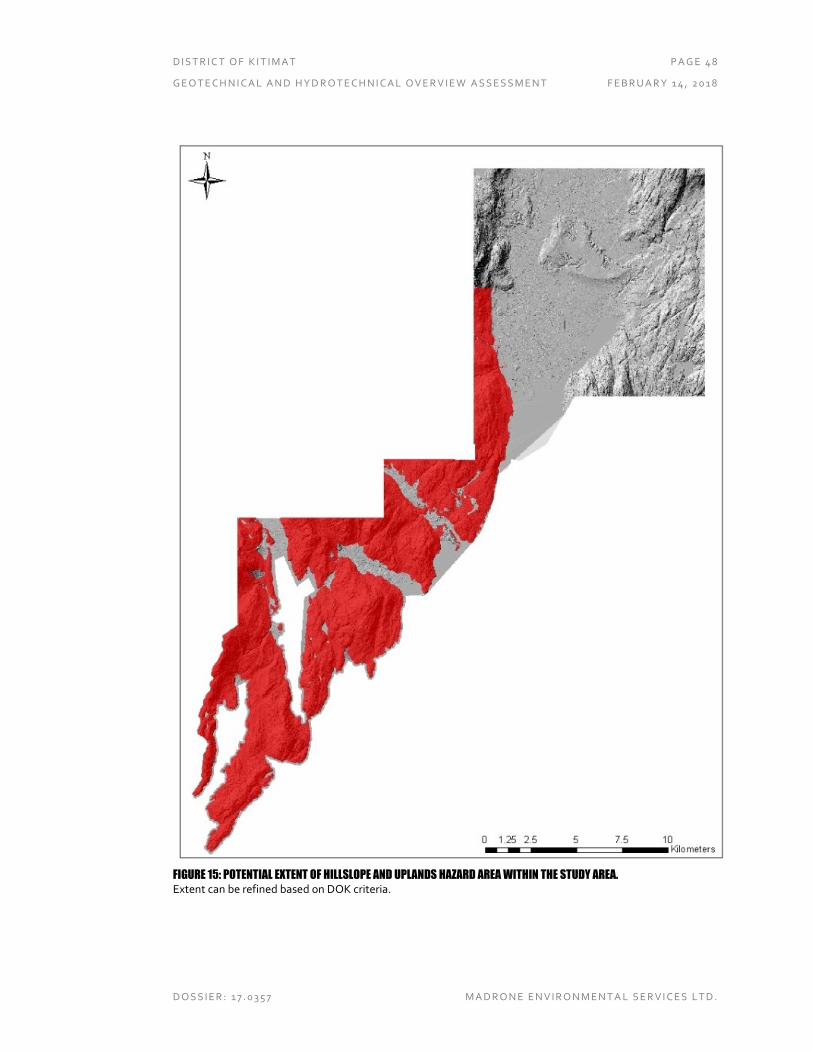
D I S T R I C T O F K I T I M A T P A G E 4 8
G E O T E C H N I C A L A N D H Y D R O T E C H N I C A L O V E R V I E W A S S E S S M E N T F E B R U A R Y 1 4 , 2 0 1 8
D O S S I E R : 1 7 . 0 3 5 7 M A D R O N E E N V I R O N M E N T A L S E R V I C E S L T D .
FIGURE 15: POTENTIAL EXTENT OF HILLSLOPE AND UPLANDS HAZARD AREA WITHIN THE STUDY AREA.
Extent can be refined based on DOK criteria.

D I S T R I C T O F K I T I M A T P A G E 4 9
G E O T E C H N I C A L A N D H Y D R O T E C H N I C A L O V E R V I E W A S S E S S M E N T F E B R U A R Y 1 4 , 2 0 1 8
D O S S I E R : 1 7 . 0 3 5 7 M A D R O N E E N V I R O N M E N T A L S E R V I C E S L T D .
6 Closure
Prepared by: Prepared and Reviewed by:
Roberta Adams, M.Sc., G.I.T.
Geoscientist
Gordon Butt, M.Sc., P.Geo.
Senior Geoscientist

D I S T R I C T O F K I T I M A T P A G E 5 0
G E O T E C H N I C A L A N D H Y D R O T E C H N I C A L O V E R V I E W A S S E S S M E N T F E B R U A R Y 1 4 , 2 0 1 8
D O S S I E R : 1 7 . 0 3 5 7 M A D R O N E E N V I R O N M E N T A L S E R V I C E S L T D .
7 References
Association of Professional Engineers and Geoscientists of British Columbia (APEGBC) (2010) Guidelines for legislated landslide assessments for proposed residential development in British Columbia. Association of Professional Engineers and Geoscientists of British Columbia, Burnaby, B.C. Association of Professional Engineers and Geoscientists of British Columbia (APEGBC) (2012) Professional Practice Guidelines - Legislated flood assessments in a changing climate in BC. Association of Professional Engineers and Geoscientists of British Columbia, Burnaby, B.C. B.C. Ministry of Forests and B.C. Ministry of Environment (1999) Mapping and assessing terrain stability guidebook, 2nd edn. Forest Practices Code of British Columbia, Victoria, B.C. Clague, J.J. (1984) “Quaternary Geology and Geomorphology, Smithers-Terrace-Prince Rupert Area, British Columbia”, Geological Survey of Canada Memoir 413. Geological Survey of Canada (1983), Surficial Geology, Skeen a River – Bulkley River Area, Map 1557A Sheet 2, Scale 1:100,000. Golder Associates (2016) “Overview Geotechnical, Terrain and Terrain Hazards Analysis”, West Douglas Channel Corridor Analysis, Report Number 1314470529-013-R-Rev2. Howes, D.E. and E. Kenk. 1997. Terrain classification system for British Columbia. Version 2. B.C. Min. Env., Lands and Parks, MOE Manual 10, Victoria, B.C. Resources Inventory Committee. 1996. Guidelines and standards for terrain mapping in British Columbia. Government of British Columbia, Victoria, B.C. Resources Inventory Committee. 1998. Standard for digital terrain data capture in British Columbia. Government of British Columbia, Victoria, B.C. Maynard, D.E., Weiland, I.C., Blais-Stevens, A., and Geertsema , M., 2017. Surficial geology, north Kitimat Arm , Douglas Channel area, British Columbia, parts of NTS 103-H/15 and 103-I/2; Geological Survey of Canada, Canadian Geoscience Map 300 (preliminary), scale 1:25 000. doi:10.4095/300850

D I S T R I C T O F K I T I M A T P A G E 5 1
G E O T E C H N I C A L A N D H Y D R O T E C H N I C A L O V E R V I E W A S S E S S M E N T F E B R U A R Y 1 4 , 2 0 1 8
D O S S I E R : 1 7 . 0 3 5 7 M A D R O N E E N V I R O N M E N T A L S E R V I C E S L T D .
Maynard, D.E., Weiland, I.C., Blais-Stevens, A., and Geertsema , M., 2017. Surficial geology, south Kitimat Arm , Douglas Channel area ,British Columbia , part of NTS 103-H/15; Geological Survey of Canada , Canadian Geoscience Map 301 (preliminary),scale 1:25 000. doi:10.4095/300851

D I S T R I C T O F K I T I M A T P A G E 5 2
G E O T E C H N I C A L A N D H Y D R O T E C H N I C A L O V E R V I E W A S S E S S M E N T F E B R U A R Y 1 4 , 2 0 1 8
D O S S I E R : 1 7 . 0 3 5 7 M A D R O N E E N V I R O N M E N T A L S E R V I C E S L T D .
8 Limitations
To properly understand the recommendations and opinions contained in
this report, its limitations, and Madrone’s rights and responsibilities,
reference must be made to the entire report, including, without limitation,
all appendices, drawings, and figures.
A geotechnical hazard site investigation can reduce, but not wholly
eliminate uncertainty regarding the natural hazards at a site, given
reasonable limits of time and cost. Madrone Environmental Services Ltd. (Madrone) has conducted this investigation and prepared this report in a
manner consistent with the level of care normally exercised by qualified
professionals currently practicing in the area under similar conditions and budgetary constraints. No other warranties, either expressed or implied,
are made. If unexpected environmental conditions are encountered on the
site, Madrone must be notified in order that we may determine if
modifications to our findings are necessary.
Madrone has made reasonable efforts to investigate the study area
through a desktop analysis; the extent and properties of soil, rock and
water are intended to be are representative of conditions in the relevant portions of the project site. However, due to the nature of geology, there is
an inherent risk that some conditions were not detected, and that actual
subsurface conditions may vary substantially from our assumptions. In
addition, conditions may change with the passage of time. You are responsible for ensuring that any other party making use of any
documents prepared by Madrone regarding the project also acknowledges
and accepts this risk.
Madrone has prepared this report for the exclusive use of its client. This
report is intended to assist the client in a land use assessment and official
community planning. This report was prepared considering circumstances
applying specifically to the client and applies only to the specific property identified in the report. It is intended only for internal use by the client for
the purposes for which it was commissioned and for use by government
agencies regulating the specific activities to which it pertains. It is not
reasonable for other parties to rely on the observations or conclusions contained herein.

D I S T R I C T O F K I T I M A T P A G E 5 3
G E O T E C H N I C A L A N D H Y D R O T E C H N I C A L O V E R V I E W A S S E S S M E N T F E B R U A R Y 1 4 , 2 0 1 8
D O S S I E R : 1 7 . 0 3 5 7 M A D R O N E E N V I R O N M E N T A L S E R V I C E S L T D .
Where practical, Madrone has attempted to verify the information provided to us by you or other individuals or organizations. However,
Madrone does not accept any responsibility for any inaccuracies,
deficiencies, or omissions resulting from receipt of incorrect or fraudulent
information.
Madrone’s investigation and findings specifically does not address
regulatory compliance of your subject property per requirements of the
B.C. Environmental Management Act and its subordinate regulations including, but not limited to, the Contaminated Sites Regulation.
Any verbal advice provided by Madrone, though given in good faith, may
be subject to misinterpretation. Consequently Madrone does not accept
responsibility for any verbal advice unless the advice is confirmed in writing. Madrone will not be responsible for any project decisions you,
your agents or contractors make if the decisions were made without
Madrone’s advice or are inconsistent with Madrone’s advice.
8.1 Limitations on Liability
The total amount of all claims you may have against Madrone or any
present or former partner; executive officer, director, stockholder,
employee or agent thereof under this engagement, including but not limited to claims for negligence, negligent misrepresentation and breach
of contract, are strictly limited to the amount of any professional liability
insurance that Madrone may have available for such claims.
Madrone is not liable for any consequential loss, injury or damages you
suffer, including but not limited to loss of use, earnings and business
interruption.
No claim may be brought against Madrone in contract or tort more than
two (2) years after Madrone’s involvement in the project.
8.2 Intellectual Property
Copyright in this report and associated documents prepared by Madrone, including those prepared at your request or direction, remain the property
of Madrone. We hereby grant you alone a non-transferable license to use
documents in connection with the particular project for which the

D I S T R I C T O F K I T I M A T P A G E 5 4
G E O T E C H N I C A L A N D H Y D R O T E C H N I C A L O V E R V I E W A S S E S S M E N T F E B R U A R Y 1 4 , 2 0 1 8
D O S S I E R : 1 7 . 0 3 5 7 M A D R O N E E N V I R O N M E N T A L S E R V I C E S L T D .
documents were prepared. This license does not apply to any draft version
of any document. You will not use the documents in connection with any other work, or project without the prior written approval by Madrone. If
you are in breach of any obligation to make payment to Madrone,
Madrone may revoke the license referred to above and you will cause to be
returned to Madrone all the documents and all copies thereof and you will remove from your computer systems any electronic copies of any of the
documents. Field notes and technical documents used by and/or
produced by Madrone are not subject to distribution.