Embed Size (px)
Citation preview

Geo-reCAPTCHA:
Crowdsourcing Large Amounts of Geographic Information from Earth
Observation Data
Florian Hillena*, Bernhard Höfleb
a) Institute for Geoinformatics and Remote Sensing (IGF), University of Osnabrueck,
Barbarastr. 22b, 49076 Osnabrueck, Germany
b) Institute of Geography, Heidelberg University, Berliner Str. 48, 69120 Heidelberg,
Germany
*) Corresponding author. Tel.: +49 541 969-3927
Florian Hillen, [email protected]
Bernhard Höfle, [email protected]
Keywords: user-generated geographic information; volunteered geographic information;
crowdsourcing; reCAPTCHA; Geo-reCAPTCHA
Abstract:
The reCAPTCHA concept provides a large amount of valuable information for various
applications. First, it provides security, e.g. for a form on a website, by means of a test that
only a human could solve. Second, the effort of the user for this test is used to generate
additional information, e.g. digitisation of books or identification of house numbers. In this
work, we present a concept for adapting the reCAPTCHA idea to create user-generated
geographic information from earth observation data, and the requirements during the
conception and implementation are depicted in detail. Furthermore, the essential parts of a
Geo-reCAPTCHA system are described, and afterwards transferred, to a prototype
implementation. An empirical user study is conducted to investigate the Geo-reCAPTCHA
approach, assessing time and quality of the resulting geographic information. Our results
show that a Geo-reCAPTCHA can be solved by the users of our study on building digitisation
in a short amount of time (19.2 s on average) with an overall average accuracy of the
digitisations of 82.2%. In conclusion, Geo-reCAPTCHA has the potential to be a reasonable
alternative to the typical reCAPTCHA, and to become a new data-rich channel of
crowdsourced geographic information.
!! Post-print version !!
Final version is published in the International Journal of Applied Earth Observation
and Geoinformation (Elsevier) and can be found here:
http://dx.doi.org/10.1016/j.jag.2015.03.012

1. Introduction
Almost every internet user has used it so far - unconsciously providing valuable information
for the digitisation of books: a reCAPTCHA (figure 1). The basic idea of a CAPTCHA (von
Ahn et al. 2003) is to provide a test that only a human can solve, and that is simultaneously
almost unsolvable for a machine. Thus, CAPTCHAs are commonly used to protect login forms
from hacking attempts or to prevent users from email spam as a part of contact forms. The most
common type of CAPTCHA presents distorted text that has to be identified. However, other
CAPTCHA types, e.g. image-based or audio-based, do exist as well.
Figure 1. A typical reCAPTCHA presenting two words to be identified by the user. (Google 2014a)
A reCAPTCHA (von Ahn et al. 2008) extends this idea and uses the effort of the user
to solve this test for a greater good. It presents two words to the user (figure 1), with one of the
two words already known, which serves as a control word to identify an actual human user. The
second word is unknown to the reCAPTCHA system itself, meaning that it cannot be
automatically recognized with Optical Character Recognition (OCR) software. As the user
cannot differentiate between the control word and the unknown word, both words have to be
identified. With this crowdsourcing method, thousands of books have been digitised in the past
years, with an accuracy of 96.1% over 1 billion responses (von Ahn et al. 2008). Nowadays,
reCAPTCHAs are found on 328,117 websites at the time of writing (builtWith 2014).
Geographic information is defined by Goodchild (1997) as the knowledge about where
something is located and what is to be found at a given location. This paper presents a novel
enhancement of the reCAPTCHA idea, and adapts it to the geographic information domain. We
term this system "Geo-reCAPTCHA". Certainly, the system has to fulfil the same requirements
as a typical reCAPTCHA, i.e. to provide a test that only humans can solve. Furthermore, Geo-
reCAPTCHA is designed to create geographic information from earth observation data for
subsequent applications. Such user-generated geographic information (UGGI) is already a
crucial part of many recent applications in the field of Geography and Geographic Information
Science (GIScience). In addition, several different concepts are ubiquitous in GIScience like
Volunteered Geographic Information (VGI), or Citizens as Sensors (Goodchild 2007),
describing information captured from people. However, all these terms are united under the
generic term UGGI, meaning all information captured directly (e.g. capturing of geometries by
users) as well as indirectly (e.g. extracted from location-based social media data; cf. Roick and
Heuser 2013). Prominent examples of applications depending on UGGI are OpenStreetMap
(OSM) (OpenStreetMap 2014a) or Wikimapia (Wikimapia 2014). Two properties regarding
UGGI have to be addressed in this context: i) the users’ heterogeneity and ii) the reliability and
quality of the information. The users’ heterogeneity (i) for OSM is illustrated by Neis and Zipf
(2012), showing that only 5% of the users are mapping frequently, whereas 19% are non

recurring members. However, frequent users are more trained and are therefore supposed to
generate more reliable information. Data errors, and abuse or vandalism, represent the major
problems regarding the reliability and quality (ii) of UGGI (Neis et al. 2012). Geo-reCAPTCHA
addresses both issues with redundancy of geographic information analogous to the idea of
reCAPTCHA.
The main objective of this article is to present a generic conceptual design for a Geo-
reCAPTCHA system. Based on this, a Geo-reCAPTCHA infrastructure architecture is
proposed, leading to a prototype implementation that allows capturing UGGI. Using this
prototype, we conduct a proof-of-concept by means of an empirical user study in which
capturing time and quality of the geographic information are investigated.
2. Background and Related Works
This section will provide background information and requirements of CAPTCHA as well as
the idea behind reCAPTCHA. Furthermore, the ongoing research regarding UGGI is analysed.
2.1. CAPTCHA and the reCAPTCHA idea
The term CAPTCHA was introduced by von Ahn et al. (2003), and is an acronym for
"Completely Automated Public Turing test to tell Computers and Humans Apart". However,
CAPTCHA is a special form of a Reverse Turing Test, also known as Human Interactive Proof.
It provides a test that can easily be solved by humans, in contrast to machines. CAPTCHAs can
be classified based on the medium used for the testing, such as texts, images or audio files. An
overview of algorithms and methods for all classes of CAPTCHAs is given by Hidalgo and
Alvarez (2011), and more recently by Roshanbin and Miller (2013). The most common
CAPTCHA is the text-based CAPTCHA (e.g. "BaffleText" by Chew and Baird 2003). This
method presents a text fragment that is modified by distortions and disruptions. Those
modifications make an automatic analysis by Optical Character Recognition (OCR) software
more difficult. On the other hand, a human user can still read the text and easily pass the test.
Another class of CAPTCHAs are the image-based CAPTCHAs. A recent approach is
introduced by Kim et al. (2010) using rotated cut-outs of an image. The user has to find the
correct orientation of the sub-images by rotating them in order to pass the test.
A rethinking of the CAPTCHA technology is made by von Ahn et al. (2008) by
introducing the text-based reCAPTCHA. Instead of using one word for the test, reCAPTCHA
presents two words to the user: one unknown word that cannot be identified with OCR software,
and a control word for which the answer is known. By typing the control word correctly, the
system identifies the user as a human and considers the unknown word as correct as well.
Therefore, it is essential that the user cannot differentiate between the control word and the
unknown word. The accuracy of the word identification increases depending on the amount of
user results for a specific unknown word. The idea of reCAPTCHA is used to digitize words
from old printings, for which automatic software has failed. With this approach over 440 million
words were correctly deciphered in one year with an accuracy of 96.1% over 1.2 billion
responses (von Ahn et al. 2008). However, these numbers are from the year 2008, in which
reCAPTCHA was not as well known or commonplace as today. In comparison with 2008, when

reCAPTCHA was deployed in ca. 40,000 Web sites (von Ahn et al. 2008), the number of Web
sites with reCAPTCHA has risen to 328,117 (builtWith2014) as of the day of writing.
Concerning security, the hardest reCAPTCHA has recently been defeated with 99.8% accuracy
by Google's own development team using neural networks (Goodfellow et al. 2014). Thus, they
concluded that the security of using distorted text for a CAPTCHA test is "significantly
diminished".
The geographic or spatial aspect regarding CAPTCHA systems has not played an
important role. So far, localized CAPTCHAs are one basic approach. Fiads and Voyiatzis
(2013) state that English words or the Latin alphabet are not suitable for a majority of internet
users today. As a result, CAPTCHA systems with different languages or alphabets have been
presented, like the system introduced by Banday and Shah (2011) for India in the Urdu
language, using the IP address to geo-locate the user. Another example for this is the text-based
CAPTCHA using Chinese characters proposed by Gustafson and Li (2013). GeoCAPTCHA
described by Wei et al. (2012) is an actual image-based CAPTCHA that considers the
geographical surrounding. This CAPTCHA scheme uses personalized contents in the form of
rotated 3D street-view images. However, no current CAPTCHA approach with a spatial
component uses the idea of reCAPTCHA to produce user generated geographic information.
2.2. User-Generated Geographic Information (UGGI)
The well-known OpenStreetMap (OSM) is one of the most popular projects of VGI acquisition
and usage. OSM is a free map of the world created by over 1.7 million volunteers interested in
mapping (OpenStreetMap 2014b). For many regions of the world, the data density of the map
is remarkably high (Raifer 2014), with many different geographic features that can be tagged,
like aerial ways, shop types, or tourist destinations (OpenStreetMap 2014c). However, the map
is certainly not complete for all parts of the world, and is prone to errors and vandalism (Haklay
et al. 2010, Neis et al. 2012). A different idea is pursued by Wikimapia: describe any place on
Earth. Therefore, it offers the possibility to add information to a specific location in the form of
rectangles or polygons with attached information (in the form of a Wiki). A related approach is
adapted by Tomnod (2014), which uses satellite images to solve current problems in specific
campaigns, like the mapping of damage caused by the Oklahoma Tornado from 2013
(DigitalGlobe 2014), or finding missing Malaysian Airlines flight 370 (CNN 2014). For each
campaign, a small set of tags is available to the user, who can freely navigate through the
satellite imagery searching for relevant objects to tag. A similar concept is used by the Geo-
Wiki project (Geo-Wiki 2014) to improve global land cover maps. For this purpose, volunteers
classify land cover using high resolution imagery in Google Earth through different
crowdsourcing campaigns run by the Geo-Wiki team (Fritz et al. 2009, Fritz et al. 2012).
However, all those platforms and projects are dependant on volunteers and their commitment
and ambition to contribute.
For this reason, Geo-Wiki additionally uses simple user interfaces in the form of a game
called Cropland Capture to attract more people (See et al. 2014). Using games as a possibility
to generate geographic information has recently become very popular in science and economics
(Matyas et al. 2012, Jordan et al 2013), as it makes it easier to attract volunteers. The company
Pallas Ludens (Pallas Ludens 2014), for example, offers the possibility to integrate annotation
tasks in games to address millions of gamers.
A comprehensive overview of VGI developments and research is presented by Neis and
Zielstra (2014). The reliability and credibility of VGI, with a focus on OSM, is in particular
addressed in their work, as this has often been questioned in the past (e.g. Flanagin and Metzger
2008, Comber et al. 2013, Foody et al. 2013). Despite these issues, UGGI is integrated in many
different applications. This can be in the form of background data for location-based apps on
mobile devices like games (e.g. BucketMan (Google 2014b)), or navigation (e.g. Locus Map
Free (Google 2014c)), as well as applications, in the context of Smart Cities and Digital Earth,
like CITI-SENSE (CITI-SENSE (2014)) or WeSenseIt (WeSenseIt (2014)). The possibility of
generating a large amount of geographic information in a short period of time makes UGGI
systems especially relevant and important, particularly for time-critical applications such as
disaster response (Middleton et al. 2014), e.g. the rapid mapping activity presented by Reimer
et al. (2014) for the crisis in the Philippines following typhoon Haiyan. Over 200 participants
mapped valuable information for relief workers in two mapathons. Relevant user-generated
information in the form of geolocated photos from the platforms Flickr and Instagram were
provided as well.
2.3. Implications for a Geo-reCAPTCHA concept
To the knowledge of the authors there is currently no approach among the geo-related
CAPTCHA approaches that extends the reCAPTCHA idea and actually produces geographic
information. In fact, only a few approaches take the user’s geographic location into account at
all. This gap between the need for complete and updated geographic information and the need
for platforms to generate them should be filled with this work. Therefore, a conceptual design
for such a UGGI generating system is developed. Based on our review of the aforementioned
related works concerning CAPTCHA and reCAPTCHA as well as UGGI, we conclude with
the technical requirements listed in table 1, which have to, or should be, addressed during the
Geo-reCAPTCHA system design.
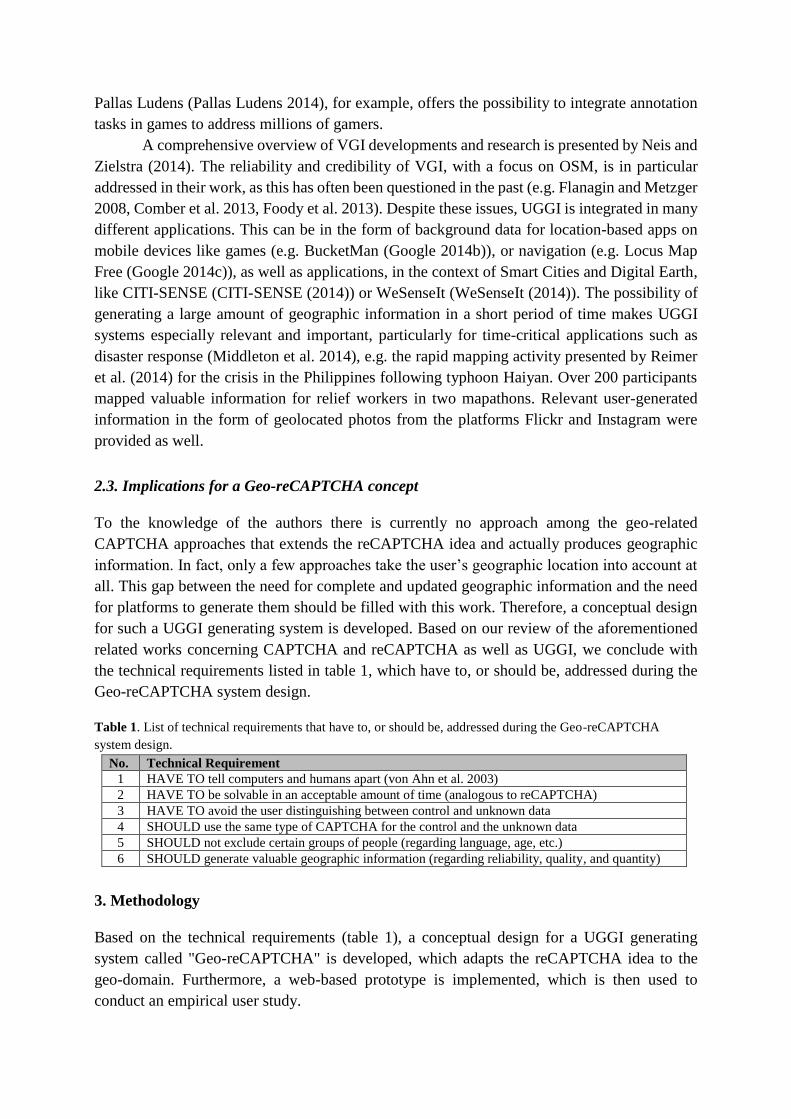
Table 1. List of technical requirements that have to, or should be, addressed during the Geo-reCAPTCHA
system design.
No. Technical Requirement
1 HAVE TO tell computers and humans apart (von Ahn et al. 2003)
2 HAVE TO be solvable in an acceptable amount of time (analogous to reCAPTCHA)
3 HAVE TO avoid the user distinguishing between control and unknown data
4 SHOULD use the same type of CAPTCHA for the control and the unknown data
5 SHOULD not exclude certain groups of people (regarding language, age, etc.)
6 SHOULD generate valuable geographic information (regarding reliability, quality, and quantity)
3. Methodology
Based on the technical requirements (table 1), a conceptual design for a UGGI generating
system called "Geo-reCAPTCHA" is developed, which adapts the reCAPTCHA idea to the
geo-domain. Furthermore, a web-based prototype is implemented, which is then used to
conduct an empirical user study.

3.1. Conceptual Design
The main idea of Geo-reCAPTCHA is to use human knowledge to solve the CAPTCHA, and
to collect valuable geographic information at the same time. Such geographic information
comprises the geometric representation of spatial features (e.g. the floor plan of a house, point
location of a tree) and non-geometric, thematic, and semantic information (e.g. type of land use,
damage or no-damage). The type of geometry, however, is use case specific and is not relevant
for the generic concept.
Figure 2. Geo-reCAPTCHA activity diagram consisting of the four main steps.
An overview of the essential steps for a Geo-reCAPTCHA is provided by the basic
activity diagram in figure 2. These four generic steps displayed in figure 2 have to be addressed
in every implementation of such a system. Subsequently, each step and the corresponding
mandatory parameters are presented in detail.
Selection
Each use case requires different basic data for the Geo-reCAPTCHA system (e.g. cadastre data,
or remote sensing data for a specific geographic region). In the selection step, the system has to
pick parts of the data (e.g. a small subset of the remote sensing data) that is used for the user
input in the next step. Therefore, two main preliminary parameters have to be set. First, the
known and the unknown data have to be defined. In this case, both parameters describe a data
source (or a link to a data source) from which data are gathered or stored. This definition implies
the spatial extent for the data capturing which can be different for the known and unknown data.
The known data are used as the control data for the CAPTCHA whereas the unknown data are
newly captured from the user. After the setting of both essential parameters, the selection step
chooses a feature or a geographic extent from the two data sources and delivers the information
to a client. In this process, it should be possible to define favoured regions (e.g. a specific city
or a disaster region) from which features are selected more often in order to emphasise specific
areas. Furthermore, additional information can be used to ensure that certain features are
included in the data selection (e.g. compare with OSM data to make sure that a building is
visible in an aerial image).
Input
A Geo-reCAPTCHA has to provide an input interface for the user. This interface can differ
depending on the type of geographic information being captured. This information can be
geometric (e.g. point, line, polygon, or point cloud) as well as non-geometric (e.g. context,
topology, semantics). In the geometric case, the geometry class has to be defined. The classes
can be derived from the Open Geospatial Consortium (OGC) simple feature specification (OGC
2011). Although Geometry class is capable of being integrated in the concept, it is
recommended that the class GeometryCollection be excluded to keep the system simple for the
user. This means that only one feature at a time should be captured from the user. Thus, the
system has a higher chance of achieving the technical requirement to be solvable in an
acceptable amount of time (table 1).
In the non-geometric case, it has to be defined whether i) a collection of given values is
presented to the user or ii) the user can type free text. In the first case, the expected user input
is known (e.g. taken from existing feature attributes of projects like OSM or GeoWiki) and thus
the interpretational efforts during the postprocessing are much less complex. The possibility to
type free text in the second case has pros and cons. On the one hand, the results might be much
more accurate due to the freedom of the user input and the fact that the user is not limited to
pre-defined options. On the other hand, it may require significantly more effort to interpret the
user input since the actual meaning has to be extracted and analyzed. Furthermore, the
interpretation of free text (automatic, semi-automatic, or manual) may result in a
misinterpretation of the information.
Afterwards, corresponding capturing tools have to be provided for the user input. For
this purpose, it is important that the user cannot distinguish between the input for the control
data and for the unknown data, as defined in the technical requirements (table 1). If this was
not the case, the user could simply enter the control data to pass the CAPTCHA, but the
unknown data would not be reliable. This is also the reason why one cannot simply mix up
different types of CAPTCHA (according to the technical requirements) in a reCAPTCHA
system (e.g. text-based CAPTCHA and a map input for unknown data) as the user is expected
to avoid the input of the unknown data to save time.
Verification
The most important part of the system is the actual verification of whether the CAPTCHA is
passed or not, i.e. whether the input was made by a human user or a machine. The verification
has to be adapted to the type of information captured from the user, and has to compare the
captured information with the control data. This testing is completely use case specific and can
vary in its complexity. For example, it can be a rather complex comparison of two geometries
(e.g. a floor plan of a house) to determine equality, or a simple word check between the input
of the user and a pre-defined set of correct values.
Postprocessing
During the postprocessing step the verified information of the user is analysed or combined

with other data to generate an additional value or to solve a specific problem (for example,
deriving one building outline out of all user digitisations for one object). This step should be an
integral part of a Geo-reCAPTCHA. Analogous to the verification step, the postprocessing is
use case specific as well. It can vary from simply storing every user input (e.g. for visualisation
purposes), to complex heuristics and analysis (e.g. comparing digitised building geometries
with building data derived from remote sensing imagery for change detection approaches).
Furthermore, additional external data sources can be included in the postprocessing step (e.g.
land cover classifications from remote sensing data).
3.2. Prototype Implementation
The four essential steps from the conceptual design are transferred into a Web infrastructure
design. As a proof-of-concept, a Geo-reCAPTCHA prototype is implemented in which the user
has to digitise the boundary of buildings from airborne imagery as illustrated in figure 3. A
generic overview of the infrastructure design for this prototype is illustrated in figure 4. The
essential parts are subsequently described in detail.
Figure 3. Prototype implementation of a Geo-reCAPTCHA client. Two map representations offer the possibility
to digitise building boundaries in the form of polygons. The digitisation in the left map is already completed
(yellow polygon) whereas the digitisation in the right map is currently in progress (blue sketch).
Figure 4. Infrastructure design for a web-based Geo-reCAPTCHA prototype consisting of a cloud component, a
web server, and a client.
Web Server
The web server builds the centrepiece of the infrastructure design by managing all incoming
requests of the client, building the bridge to the geodata sources and holding the logic of the

Geo-reCAPTCHA system in the form of selection, verification, and postprocessing
functionality. The initial point is the selection step in which the essential parameters "type",
"unknown data" and "control data" have to be defined.
The information type defines whether the user has to digitise geometries or has to
capture non-geometric information. The prototype implemented in this work will capture
geometric information in the form of polygons. According to the information type, the control
data and the unknown data have to be defined, e.g. by defining a region and a base layer from
which the data are extracted. The selection process can now randomly fetch data from the given
data sources or with emphasis on one or more defined favoured regions within the data. For our
prototype, aerial images are provided by an OGC Web Map Service (WMS) for both control
and unknown data.
The second part of the web server consists of the verification and the postprocessing
steps as outlined in the generic concept. The verification process is called by the client after the
user inputs data. As it is defined in the conceptual design, it has to be decided whether the user
input matches the control data or not. The presented Geo-reCAPTCHA prototype verifies the
input using a simple algorithm that builds a buffer around the boundary of the control geometry
and checks whether the boundary of the polygon digitised by the user lies completely within
this buffer area.
If the user input for the control data is evaluated as correct, a message will be sent to the
client to confirm the (successful) passing of the CAPTCHA. Simultaneously, the input of the
unknown data is considered to be correct as well and can therefore be integrated into the
postprocessing procedure. The prototype currently has no automatic postprocessing
implemented as the interpretation is done manually in the course of the empirical user study.
Client
The client is the interface for the user with which input can be captured and transferred to the
web server. In the prototype, the client is a typical website displayed within a standard browser.
The website requests the relevant data for the Geo-reCAPTCHA from the web server and
visualises it for the user in two map representations (figure 3). One map shows the selected data
of the unknown data whereas the other map shows the control data. If a specific feature is pre-
selected for capturing, it has to be marked somehow in the map to make sure that it can be
correctly identified by the user. However, it has to be assured that the user cannot identify the
map representation that displays the control data (technical requirements in table 1).
Each of the two map representations has to provide a digitisation tool (as implemented
in the prototype in figure 3) with which the user can capture the selected geometry type (e.g. a
polygon or a linestring). The tool has to follow certain specifications: First, only the geometry
type defined for the CAPTCHA is allowed in the digitisation process. Switching between
geometry types is not recommended. After the user finishes the digitisation of the first
geometry, the tool has to be disabled so that no further geometry can be captured from the user.
No edit or delete functionality is provided to keep the system as simple as possible. However,
the user can reload the map representation to receive new data from the server, and restart the
digitisation. For a non-geometric Geo-reCAPTCHA, additional input tools are needed like a
selection box with pre-defined labels or a text field for free user input.

After both inputs of the user, the client automatically submits the result to the web
server. Subsequently, the web server returns the result of the verification process. If the test is
passed, the user can proceed. If the test is failed, the website will reload the test and request
new data from the server.
Cloud
The cloud in this case describes any place, server, service, or resource in general, from the Web.
This also includes local geodatabases as well as geospatial functions from a programming
library installed on the Geo-reCAPTCHA web server itself. The cloud component of the
infrastructure design specifies these resources to geodata sources and the optional geospatial
functionality.
3.3. Empirical User Study
An empirical user study has been conducted to investigate how long our CAPTCHA approach
within the Geo-reCAPTCHA prototype takes to be solved, and to derive the accuracy of the
derived UGGI. In general, everyone aware of the user study was able to participate. However,
specific advertisement was made among students and staff members of the Institute of
Geoinformatics and Remote Sensing in Osnabrueck (Germany) and the Institute of Geography
in Heidelberg (Germany). Additionally, many participants are geography students consulted
during a basic geography lecture at the University of Vienna (Austria). Thus, the following user
groups are assumed to participate: Student of natural science, student of non-natural science,
student of geography, student of geoinformatics or similar, geoinformatics expert, none of the
listed groups.
In the experimental setup, the user is challenged to digitise the outlines of 15
consecutive arbitrary buildings from the map representation in a fast but convenient way. Our
study area contains simple building footprint shapes (e.g. rectangular) and also difficult cases
where the building is composed of several parts (e.g. attached garage) and also cases where
trees are adjacent to the building. This selection of different building situations will allow us
identifying the limitations of building digitization in Geo-reCAPTCHA, such as best and worst-
case buildings. Each digitisation is recorded with a randomly generated user identifier to
estimate the overall number of participants as it is not allowed to simply store the users' IP
address. This identifier changes when the same user opens the site again which is why users are
able to redo the study. Due to this fact, we cannot provide an exact number of participants but
a number of digitisation rounds with the same user identifier.
Table 2. List of data that are gathered in the empirical user study.
Name Description
GEOMETRY The geometry of the digitised building outline
TIME The time for finishing the digitisation (in s)
USER GROUP The user group in the categories as mentioned above
AGE The user’s age in the categories:
18 – 24, 25 – 34, 35 – 44, 45 – 60, > 60, no age selected
TIMESTAMP The timestamp of the digitisation (date and time)
POINTID The identification number of the different centres of the map view
USERID The identification number which is created randomly for each user to identify
digitisations from the same user
COUNTER The counter that represents the number of digitisations done by the user
The description of the test for the user was generically formulated to avoid influencing
the user’s behaviour during digitisation. It was not mentioned in the task description that the
user should be as fast or as accurate as possible. Before starting with the actual digitisation, the
user is requested to give basic information about age and user group (or rather experience level).
Afterwards, a reduced version of the prototype with only one map representation is presented
to the user. In this case, 25 pre-defined centre points for the map view are available to make
sure that a building is visible for each digitisation run. This leads to an extensive overlap of the
UGGI and allows for substantial statistical analysis of the accuracy of the captured geometries.
The time from the first click in the map to the moment when the user finishes the digitisation
with a double-click is recorded and stored. The prototype implementation of the experiment
does not permit editing or deleting of digitised features. However, the user has the option to
withdraw the capture by reloading the map representation with new data and thus a new test.
This function should be used if the user is not able to identify a building within the dataset.
Each reloading process is recorded and stored in the database in order to investigate the reasons
for reloading and withdrawing tests. The empirical experiment is finished for the users as soon
as 15 buildings have been digitised. The structure of the gathered dataset is described in table
2.
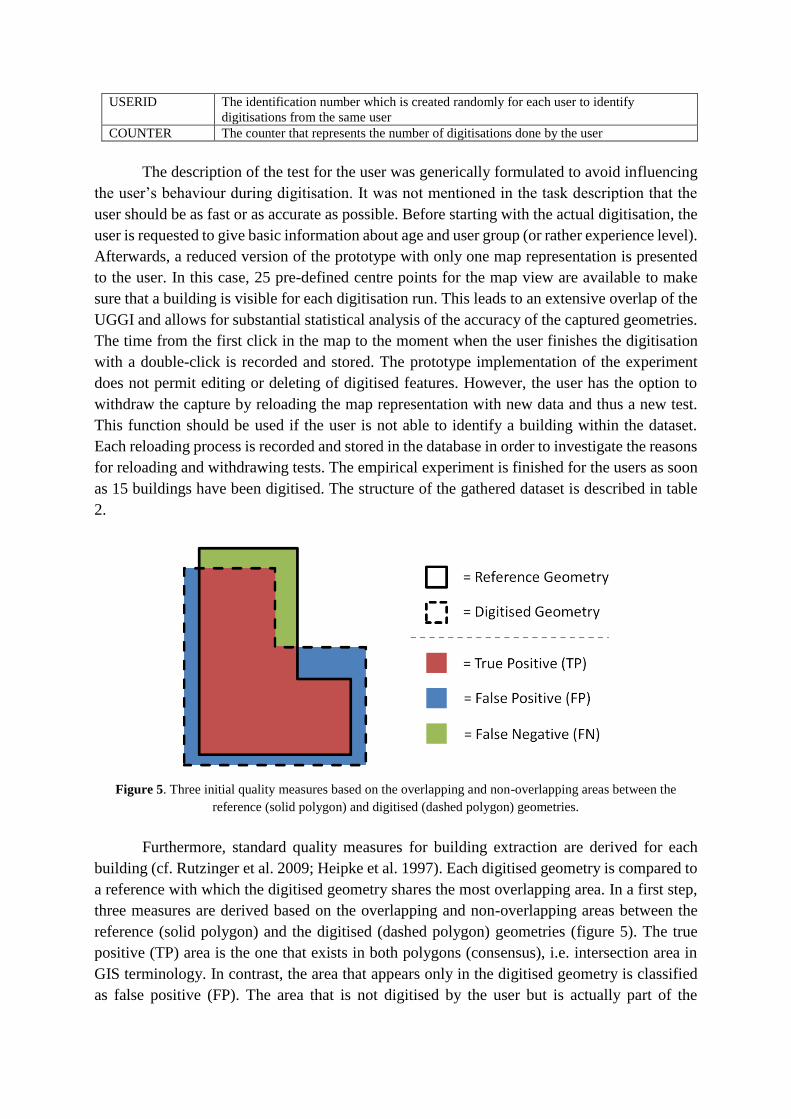
Figure 5. Three initial quality measures based on the overlapping and non-overlapping areas between the
reference (solid polygon) and digitised (dashed polygon) geometries.
Furthermore, standard quality measures for building extraction are derived for each
building (cf. Rutzinger et al. 2009; Heipke et al. 1997). Each digitised geometry is compared to
a reference with which the digitised geometry shares the most overlapping area. In a first step,
three measures are derived based on the overlapping and non-overlapping areas between the
reference (solid polygon) and the digitised (dashed polygon) geometries (figure 5). The true
positive (TP) area is the one that exists in both polygons (consensus), i.e. intersection area in
GIS terminology. In contrast, the area that appears only in the digitised geometry is classified
as false positive (FP). The area that is not digitised by the user but is actually part of the

reference geometry is the false negative (FN) area. Consequently, the TP-rate (completeness),
the precision (correctness), and the overall quality of the digitised geometry can be calculated
with the following equations (cf. Rutzinger et al. 2009):
𝑇𝑃-𝑟𝑎𝑡𝑒 (𝑐𝑜𝑚𝑝𝑙𝑒𝑡𝑒𝑛𝑒𝑠𝑠) = 𝑇𝑃
𝑇𝑃+𝐹𝑁 (1)
𝑝𝑟𝑒𝑐𝑖𝑠𝑖𝑜𝑛 (𝑐𝑜𝑟𝑟𝑒𝑐𝑡𝑛𝑒𝑠𝑠) = 𝑇𝑃
𝑇𝑃+𝐹𝑃 (2)
𝑞𝑢𝑎𝑙𝑖𝑡𝑦 = 𝑇𝑃
𝑇𝑃+𝐹𝑃+𝐹𝑁 (3)
Furthermore, it is analysed how many digitised geometries are needed to receive
appropriate results that almost match the corresponding reference geometry. For this purpose,
the idea of a raster-based quantitative analysis by Klonner et al. (2014) is adapted. The idea is
to build a raster with a specific cell size and sum up the number of polygons within each cell.
An estimation for an appropriate number of digitised geometries can be derived by comparing
the boundary of the reference geometry with the raster grid (figure 6). Thus, for a Geo-
reCAPTCHA implementation a threshold for the transition from unknown to known data has
to be set.
Figure 6. Reference polygon (grey) with overlaying raster grid. The raster is filled with the respective number of
digitised polygons for each raster cell. Values above 1 are coloured red and are used for estimating the reference
geometry.
4. Results
The conceptual design was implemented in a prototype, which was used for a proof-of-concept
in the form of an empirical user study. Within the two weeks of the empirical user study, 2260
geometries were digitised in 189 total digitisation rounds. As users could also digitize multiple
times, the number of unique users might be lower than the number of digitisations. The
distribution of the digitisations among user groups and age groups of the users is presented in

table 3. According to the user selection, most geometries are digitised by students of geography
with 950 (42.0%) followed by geoinformatics experts (531 geometries (23.5%)) and students
of geoinformatics or similar (428 geometries (18.9%)). As the study was promoted in a basic
lecture in geography, it can be assumed that most of the students of geography do not have
much expertise regarding geoinformatics. Furthermore, most geometries are digitised from
users with an age from 25 to 34 years with 1285 geometries (56.9%) as well as 18 to 24 years
with 700 geometries (31.0%). People with an age of 45 and above are not well represented in
this user study (60 geometries, 2.6%). The options "None of the listed groups" for the user
group and "No age selected" for the age were the default values for the selection boxes in the
user study.
Table 3. Distribution of digitisations among the categories user group and age of the participants of the
empirical user study.
Age
User group 18 -24 25 - 34 35 - 44 > 45
No age
selected Total
Student of natural science 1 90 0 0 0 91
(4.03%)
Student of non-natural science 30 30 0 0 0 60
(2.65%)
Student of geography 499 451 0 0 0 950
(42.03%)
Student of geoinformatics or similar 142 259 27 0 0 428
(18.94%)
Geoinformatics expert 13 363 125 30 0 531
(23.49%)
None of the listed groups 15 92 15 30 48 200
(8.85%)
Total 700
(30.97%)
1285
(56.86%)
167
(7.39%)
60
(2.65%)
48
(2.12%)
2260
(100.00%)
4.1. Digitisation Process
In a first step, the time for digitising an arbitrary building in comparison with the derived quality
is analysed. The recorded time is almost normally distributed with an average of 11.3 s and a
standard deviation of 74.5 s over all 2260 digitised geometries for 68 different building objects.
The high standard deviation is caused by three very long digitisation times (way above 60 s)
with a maximum of 3527 s (almost 59 min). Removing those three datasets, the average
digitisation time changes to 9.6 s with a standard deviation of 6.9 s. The following analysis will
be based on the cleaned datasets.
Table 4. Descriptive statistics of all digitisations regarding the digitisation time (in s) and quality (in %) of one
building divided by user groups.
Digitisation time for one building [s] Quality of one building [%]
User group N Min Max Mean Std. dev. Min Max Mean Std. dev.
Student of natural science 91 2.8 39.0 11.4 6.7 0 97.0 79.6 24.2
Student of non-natural science 60 3.2 49.4 12.1 9.6 0 95.5 79.5 22.4
Student of geography 949 2.1 44.2 8.6 5.8 0 97.6 82.4 20.5
Student of geoinformatics or similar 426 2.2 57.0 10.4 8.0 0 98.3 83.3 18.3
Geoinformatics expert 531 2.3 59.9 9.5 6.9 0 97.9 83.9 18.2
None of the listed groups 200 1.4 56.1 11.5 7.4 0 96.9 76.8 28.1
Table 5. Descriptive statistics of all digitisations regarding the digitisation time (in s) and quality (in %) of one
building divided by age groups.

Digitisation time for one building [s] Quality of one building [%]
Age group N Min Max Mean Std. dev. Min Max Mean Std. dev.
No age selected 48 1.4 35.5 11.3 7.3 0 94.1 59.9 33.5
18 - 24 699 2.3 56.1 9.6 6.6 0 97.7 83.5 19.1
25 - 34 1283 2.1 57.0 9.2 6.9 0 98.3 82.6 20.2
35 - 44 167 3.8 59.9 11.1 7.6 0 97.2 81.5 20.2
> 45 60 5.1 32.7 12.7 6.9 0 97.2 78.9 27.6
Furthermore, time and quality are analysed in detail to determine differences between
user groups and groups of age. Table 4 shows the results for the corresponding user groups.
Students of geography are digitising one second faster in the mean (8.6 s) than the
geoinformatics experts (9.5 s), which are the second fastest group. The quality of the experts,
however, is slightly higher in the mean (83.9% compared to 82.4%) with a lower standard
deviation (18.2% to 20.5%). It can be seen that the groups with geography or geoinformatics
background (students of geography, students of geoinformatics or similar and geoinformatics
experts) do record the lowest values regarding digitisation time and the highest average qualities
of building polygons.
The results for the different age groups can be seen in table 5. Participants with an age
between 18 and 34 are generally slightly faster (9.2 s to 9.6 s in the mean) than older participants
(10.2 s to 13.5 s in the mean). Regarding the quality of the digitisation, the differences are much
smaller between these age groups. The highest quality is recorded for the 18-year to 24-year
old users with 83.5%. The 35-year to 44-year old users, however, record only a slightly lower
quality of 81.5%. Overall, performing an analysis of variance (ANOVA) and a t-test, the user
and age groups do show significant differences regarding digitisation time and quality.
The presented results provide insights into the fulfilling of the two main Geo-
reCAPTCHA requirements (table 1). First, it is shown that a map-based CAPTCHA can be
solved in an overall mean of 9.6 s. Thus, a total time for a Geo-reCAPTCHA of 19.2 s can be
expected as the Geo-reCAPTCHA approach requires two digitisations (for the control and the
unknown data). Von Ahn et al. (2008) proved that, on average, the time required to solve a
conventional CAPTCHA is 13.51 s and 13.06 s for a reCAPTCHA. Therefore, a Geo-
reCAPTCHA does need more time to be solved than a reCAPTCHA. Nevertheless, regarding
the effort of other CAPTCHAs like image-based CAPTCHAs, the expected time can be
considered acceptable from our point of view as it is less than 50% slower than traditional
reCAPTCHA. Furthermore, the results of this user study show that Geo-reCAPTCHA can be
solved successfully by any of our user groups.
Moreover, the main Geo-reCAPTCHA requirements ask for the creation of reusable
information. An overall quality for a single building of 82.2% on average suggests that this
requirement is fulfilled in the specific use case of building digitisation. However, a detailed
analysis of the digitisation quality is needed. Additionally, quantitative statements regarding
the amount of digitisations that are required for a successful derivation of a valid geometry from
Geo-reCAPTCHA have to be determined.
4.2. Quality and redundancy of multiple object digitisations
Using the calculated accuracy parameters, the building objects can be described based on a
single user digitisation and also the full track of all digitisations available for each object.

Table 6. Descriptive statistics of the three accuracy parameters TP-rate, precision, and quality (equations 1-3)
for all digitised geometries (all values in %).
Accuracy parameter Min Max Mean Median Std. dev.
TP-rate (completeness) 20.4 100.0 88.8 95.06 8.7
Precision (correctness) 22.1 100.0 88.1 95.10 9.2
Quality 20.4 98.3 82.2 88.84 10.7
The three accuracy parameters (equations 1-3) are calculated for each single building
digitisation individually. The accuracy statistics of all building digitisations is summarised in
table 6. Overall, an average quality of 82.2% with a standard deviation of 10.7% is measured.
The mean values for the completeness and the correctness are quite similar with 88.8% and
88.1%, respectively. The maximum values of those two parameters are recorded with 100%.
However, this is not surprising as digitisations that are fitting the building footprint or are larger
will result in a completeness of 100%, whereas digitisations that are completely inside of the
reference geometry (and thus smaller) will deliver a correctness of 100% and completeness
values lower than 100%. The mean quality of digitisations is 88.1% for all digitisations with
completeness above the median value (95.06%). This indicates that those buildings are digitised
very well but presumably slightly larger than the actual building footprint. Likewise, the mean
quality of digitisations reaches 89.9% for all digitisations with correctness above the median
value (95.10%). Thus, the majority of buildings was captured very well. Here, the quality value
of 89.9% indicates that those buildings were digitized slightly smaller than the reference
building footprint.
Figure 7 shows the distribution of reloads according to the respective centre points of
the map view. It can be seen that some map views (i.e. centred on a certain building) are skipped
more often than others. One of the lowest mean qualities for a building (53.6%) is found in the
map view with the PointID 12 (figure 8). The structure of the main building is basically
rectangular and thus not complex at all. However, it is not obvious which part of the image
actually is part of the building or belongs to another object like a garage. Most digitisations in
this case are focused on the main building, which results in a poor digitisation quality. The
building object with one of the highest average qualities (92.7%) is shown in figure 8. The
building has a simple structure that can easily be distinguished from its surroundings.

Figure 7. Distribution of reload frequencies for each map centre point.
Figure 8. Aerial images and corresponding geometries (reference: red / digitisations: blue) of the building with
the lowest overall average quality (53.56%) within the map view of PointID 12 (A) and the building with the
highest overall average quality (92.73%) within the map view of PointID 6 (B).
The raster-based analysis of the cumulated geometries (Figure 9 and 10) supports these
observations. Both images are classified according to the number of polygons within each raster
cell. It is shown that even a low number of digitised geometries deliver an appropriate
estimation for the actual building. Figure 9 emphasizes the problem of neighbouring buildings
that can or cannot be recognized as a part of the main building by the user. However, the main
building itself can be derived from the digitised geometries despite the low overall quality
(compared to the reference geometry) of the digitisations for this building. Thus, it can be stated
that if all digitisations are combined in to one geometry, the quality of this geometry will be
better than the single polygons individually. However, at a certain point, the gain of quality is
not significant as the overall quality is already high. Therefore, a threshold for the number of
digitised geometries for one building can be defined, at which point the building is
approximated accurately. This threshold has to be adapted depending on i) the geometries that
are captured from the Geo-reCAPTCHA (e.g. point or polygon) and ii) the method that is used
to combine the geometries (e.g. centre point of a point collection, intersection of a polygon
collection).

Figure 9. Number of overlapping geometries on an 18.0 m x 27.6 m raster with a cell size of 0.2 m for the
building with the lowest overall quality (53.56%).
Figure 10. Number of overlapping geometries on a 21.4 m x 24.2 m raster with a cell size of 0.2 m for the
building with the highest overall quality (92.73%).

5. Conclusions
In this work, a concept for adapting the reCAPTCHA idea to gather user-generated geographic
information from earth observation data is presented. Therefore, the reCAPTCHA concept was
extended to provide geographic information instead of text to the user. Digitisation tools allow
for capturing new geometries or semantic information about a geographical feature.
The performed Geo-reCAPTCHA user study on building geometry mapping revealed a
digitisation time per building object of 9.6 s (average over 2257 geometries) which results in
an average total solving time for a Geo-reCAPTCHA of 19.2 s. Furthermore, an average quality
of single digitised building polygons of 82.2% was achieved. A detailed analysis shows that the
differentiation between the main building and additional buildings is one of the main reasons
for poor digitisations. However, the combination of all the single building digitisations allows
for an appropriate estimation of the actual building despite the poor quality of some
digitisations.
The results of the empirical user study show that a Geo-reCAPTCHA is capable of
producing geographic data with high accuracy in a small amount of time for the digitisation of
one building. Above that, there are further geographic applications and potential use cases in
which data from Geo-reCAPTCHA could be integrated. One use case could be to contribute to
the digitisation of base maps in crisis-prone parts of the worlds where maps are missing (MSF
UK 2014). Moreover, Geo-reCAPTCHA could be used to classify remote sensing data. For
example, Geo-Wiki could utilize Geo-reCAPTCHA to update the global land cover
classification by presenting random parts of satellite images in which the predominant land
cover class (e.g. forests, agricultural, or urban areas) should be digitised. Beyond that, even 3D
earth observation data in the form of laser scanning point cloud data can be classified by
identifying objects within the point cloud (e.g. a house or a tree) using Geo-reCAPTCHA.
These LiDAR datasets are particularly relevant for establishing reference object libraries, such
as for vegetation objects (Koenig et al. 2013) where the large amount of reference object
features improves automatic 3D tree characterization.
In conclusion, all technical requirements, which are extracted from our review of the
related works (table 1), are addressed in the Geo-reCAPTCHA system design. Thus, Geo-
reCAPTCHA offers an appropriate alternative to reCAPTCHA regarding CAPTCHA security
as well as the resulting data quality.
References
Banday, M. T., Shah, N. A (2011): Challenges of CAPTCHA in the accessibility of Indian
regional websites. Proceedings of COMPUTE '11, Bangalore, India.
doi:10.1145/1980422.1980453
builtWith (2014): reCAPTCHA Usage Statistics. Available from http://trends.builtwith.com
/widgets/reCAPTCHA [Accessed 6 August 2014].
Chew, M., Baird, H. S. (2003): BaffeText: a Human Interactive Proof. In Proceedings of 10th
IS&T/SPIE Document Recognition & Retrieval Conf, 2003. pp. 305-316.
CITI-SENSE (2014): Available from http://www.citi-sense.eu/ [Accessed 6 August 2014].

CNN (2014): Crowdsourcing volunteers comb satellite photos for Malaysia Airlines jet.
Available from http://edition.cnn.com/2014/03/11/us/malaysia-airlines-plane-
crowdsourcing-search/ [Accessed 6 August 2014].
Comber, A., See, L., Fritz, S., Van der Velde, M., Perger, C., Foody, G. (2013): Using control
data to determine the reliability of volunteered geographic information about land cover.
International Journal of Applied Earth Observation and Geoinformation, Vol. 23, pp.
37-48. doi:10.1016/j.jag.2012.11.002
DigitalGlobe (2014): Lending Eyes for Moore Oklahoma. Available from
http://www.digitalglobeblog.com/2013/06/14/moore/ [Accessed 6 August 2014].
Flanagin, A. J., Metzger, M. J. (2008): The credibility of volunteered geographic information.
GeoJournal, Vol. 72, pp. 137-148. doi:10.1007/s10708-008-9188-y
Foody, G. M., See, L., Fritz, S., Van der Velde, M., Perger, C., Schill, G., Boyd, D. S. (2013):
Assessing the Accuracy of Volunteered Geographic Information arising from Multiple
Contributors to an Internet Based Collaborative Project. Transactions in GIS, Vol. 17,
No. 6, pp. 847-860.
Fritz, S., McCallum, I., Schill, C., Perger, C., Grillmayer, R. (2009): Geo-Wiki.Org: The Use
of Crowdsourcing to Improve Global Land Cover. Remote Sensing, Vol. 1, No. 3, pp.
345-354. doi:10.3390/rs1030345
Fritz, S., McCallum, I., Schill, C., Perger, C., See, L., Schepaschenko, D., van der Velde, M.,
Kraxner, F., Obersteiner, M. (2012): Geo-Wiki: An online platform for land cover
validation and the improvement of global land cover. Environmental Modelling and
Software, Vol. 31, pp. 110-123.
Geo-Wiki (2014): Available from http://geo-wiki.org/ [Accessed 6 August 2014].
Goodchild, M. F. (1997): Unit 002 - What is Geographic Information Science? NCGIA Core
Curriculum in Geographic Information Science. Available from
http://www.ncgia.ucsb.edu/giscc/units/u002/u002.html [Accessed 6 August 2014].
Goodchild, M. F. (2007): Citizens as sensors: the world of volunteered geography. GeoJournal,
Vol. 69, No. 4, pp. 211-221. doi:10.1007/s10708-007-9111-y
Goodfellow, I. J., Bulatov, Y., Ibarz, J., Arnoud, S., Shet, V. (2014): Multi-digit Number
Recognition from Street View Imagery using Deep Convolutional Neural Networks.
CoRR. arXiv:1312.6082v4
Google (2014a): Customizing the Look and Feel of reCAPTCHA. Available from
https://developers.google.com/recaptcha/docs/customization [Accessed 6 August
2014].
Google (2014b): BucketMan - coloring your city. Available from:
https://play.google.com/store/apps/details?id=de.web.butzbach.felix.bucketman
[Accessed 6 August 2014].
Google (2014c): Locus Map Free - Outdoor GPS. Available from:
https://play.google.com/store/apps/details?id=menion.android.locus [Accessed 6
August 2014].
Gustafson, J., Li, J. (2013): Leveraging the Crowds to Disrupt Phishing. Proceedings of IEEE
Conference on Communications and Network Security (CNS), pp. 82-90.
doi:10.1109/CNS.2013.6682695

Haklay M. M., Basiouka S., Antoniou V., & Ather A. (2010): How many volunteers does it
take to map an area well? The validity of Linus’ law to volunteered geographic
information. The Cartographic Journal, Vol. 47, No. 4, pp. 315-322.
doi:10.1179/000870410X12911304958827
Heipke, C., Mayer, H., Wiedemann, C. (1997): Evaluation of Automatic Road Extraction.
IAPRS, Vol. 32, Part 3-4W2, pp. 151-160.
Hidalgo, J. M. G., Alvarez, G. (2011): CAPTCHAs: An Artificial Intelligence Application to
Web Security. Advances in Computers, Vol. 83, pp. 109-181. doi:10.1016/B978-0-12-
385510-7.00003-5
Jordan, K. O., Sheptykin, I., Grüter, B., Vatterrott, H.-R. (2013): Identification of structural
landmarks in a park using movement data collected in a location-based game.
Proceedings of ACM SIGSPATIAL COMP'13, Orlando FL, USA. pp. 1-8.
doi:10.1145/2534848.2534853
Kim, J.-W., Chung, W.-K., Cho, H.-G. (2010): A new image-based CAPTCHA using the
orientation of the polygonally cropped sub-images. The Visual Computer, Vol. 26, No.
6-8, pp. 1135–1143. doi:10.1007/s00371-010-0469-3
Klonner, C., Barron, C., Neis, P., Höfle, B. (2014): Updating digital elevation models via
change detection and fusion of human and remote sensor data in urban environments.
International Journal of Digital Earth. doi:10.1080/17538947.2014.881427
Koenig, K., Kiefer, A., Höfle, B. (2013): Web-based visualization and object-based analysis of
3D geoinformation from laser scanning point clouds. gis.SCIENCE, Vol. 26, No. 2, pp.
70-76.
Matyas, S., Kiefer, P., Schlieder, C. (2012): Changing the Rules: Acquiring Quality Assured
Geospatial Data With Location-based Games. Proceedings of GAME-ON ASIA'2012,
Kyoto, Japan. pp. 44-50.
Middleton, S. E., Middleton, L., Modafferi, S. (2014): Real-Time Crisis Mapping of Natural
Disasters Using Social Media. IEEE Intelligent Systems, Vol. 29, No. 2, pp. 9-17.
doi:10.1109/MIS.2013.126
MSF UK (2014): Missing Maps Project | MSF UK. Available from
http://www.msf.org.uk/missing-maps-project [Accessed 10 November 2014].
Neis P., Goetz, M., and Zipf, A. (2012): Towards Automatic Vandalism Detection in
OpenStreetMap. ISPRS International Journal of Geo-Information, Vol. 1, pp. 315-332.
doi:10.3390/ijgi1030315
Neis, P. and Zipf, A. (2012): Analyzing the Contributor Activity of a Volunteered Geographic
Information Project – The Case of OpenStreetMap. ISPRS International Journal of Geo-
Information, Vol. 1, pp. 146-165. doi:10.3390/ijgi1020146
Neis, P. and Zielstra, D. (2014): Generation of a tailored routing network for disabled people
based on collaboratively collected geodata. Applied Geography, Vol. 47, pp. 70-77.
doi:10.1016/j.apgeog.2013.12.004
OGC (2011). OpenGIS® Implementation Standard for Geographic information - Simple
feature access - Part 1: Common architecture. Available from
http://portal.opengeospatial.org/files/?artifact_id=25355 [Accessed 6 August 2014].
OpenStreetMap (2014a): Available from http://www.openstreetmap.org/ [Accessed 6 August
2014].

OpenStreetMap (2014b): OpenStreetMap Statistics. Available from
http://www.openstreetmap.org/stats/data_stats.html [Accessed 6 August 2014].
OpenStreetMap (2014c): Map Features - OpenStreetMap Wiki. Available from
http://wiki.openstreetmap.org/wiki/Map_Features [Accessed 6 August 2014].
Pallas Ludens (2014): Available from http://pallas-ludens.com [Accessed 6 August 2014].
Raifer, M. (2014): OpenStreetMap node density map 2014. Available from
http://tyrasd.github.io/osm-node-density [Accessed 6 August 2014].
Reimer, A., Neis, P., Rylov, M., Schellhorn, S., Sagl, G., Resch, B., Porto, J., Zipf, A. (2014):
Erfahrungsbericht: Crisis Mapping zum Taifun Hayan. DGPF Tagungsband 23.
Roick, O., Heuser, S. (2013): Location Based Social Networks - Definition, Current State of
the Art and Research Agenda. Transactions in GIS, Vol. 17, No. 5, pp. 763-784.
doi:10.1111/tgis.12032
Roshanbin, N., Miller, J. (2013): A Survey and Analysis of current CAPTCHA Approaches.
Journal of Web Engineering, Vol. 12, No.1-2, pp. 1-40.
Rutzinger, M., Rottensteiner, F., Pfeifer, N. (2009): A Comparison of Evaluation Techniques
for Building Extraction From Airborne Laser Scanning. IEEE Journal of Selected
Topics in Applied Earth Observations and Remote Sensing, Vol. 2, No. 1, pp. 11-20.
See, L., Sturn, T., Perger, C., Fritz, S., McCallum, I., Salk, C. (2014): Cropland Capture: A
gaming approach to improve global land cover. Proc. AGILE'2014, Castellon Spain, 3-
6 June 2014.
Tomnod (2014): Available from http://www.tomnod.com [Accessed 6 August 2014].
von Ahn, L., Blum, M., Hoppe, N. J., Langford, J. (2003): CAPTCHA: Using Hard AI Problems
For Security. Advances in Cryptology - EUROCRYPT 2003. Lecture Notes in
Computer Science, Vol. 2656, pp. 294-311. doi:10.1007/3-540-39200-9_18
von Ahn, L., Maurer, B., McMillen, C., Abraham, D., Blum, M. (2008): reCAPTCHA: Human-
Based Character Recognition via Web Security Measures. Science, Vol. 321, no. 5895,
pp. 1465-1468. doi:10.1126/science.1160379
Wei, T.-E., Jeng, A. B., Lee, H.-M. (2012): GeoCAPTCHA - A Novel Personalized CAPTCHA
Using Geographic Concept to Defend Against 3rd Party Human Attack. Proceedings of
IEEE IPCCC, pp. 392-299. doi: 10.1109/PCCC.2012.6407782
WeSenseIt (2014): Available from http://www.wesenseit.com/ [Accessed 6 August 2014].
Wikimapia (2014): Available from http://wikimapia.org/ [Accessed 6 August 2014].