Embed Size (px)
Citation preview

Generation Performance in Sri Lanka 2011
0
P r e p a r e d B y : P u b l i c U t i l i t i e s C o m m i s s i o n o f S r i L a n k a
2011
Generation Performance
in Sri Lanka

Generation Performance in Sri Lanka 2011
1
Content
Chapter 1 – Introduction 1
Chapter 2 – Energy Generation 2
Chapter 3 – Plant Factor 3
Chapter 4 – Running Plant Factor 7
Chapter 5 – Load Factor 8
Chapter 6 – Energy Unit Cost 9
Chapter 7 – Comparison of Scheduled Dispatch and Actual Dispatch 10
Chapter 8 – Auxiliary Consumption 11
Chapter 9 – Availability Factor 11
Chapter 10 – Reservoir Storages 12
Chapter 11 – Conclusion 15

Generation Performance in Sri Lanka 2011
1
1. Introduction
In 2011 the maximum recorded electricity demand in Sri Lanka was 2163.1MW. In order to achieve that
demand and to cater the electricity requirement in Sri Lanka, 139 Grid connected power plants with
total installed capacity of 3140MW have been operated in 2011. Out of those power plants 23 were
owned and operated by Ceylon Electricity Board including 16 hydro plants, 6 thermal plants and 1 wind
power plant. And there were 11 thermal power plants operated by Independent Power Producers (IPPs)
and 104 small power plants owned and operated by Small Power Producers (SPPs) including mini hydro
plants, solar power plants, wind power plants and biomass power plants.
The chart below shows the existed installed capacity in MW of each type of power plants by the end of
2011.
This Generation Performance Report contains a summary of information and performance statistics of
the generation units in Sri Lanka for the year 2011.
All the index and other calculations in this report have been done based on the data received through
Licensee Information Submission System (LISS) and details obtained from CEB Monthly Review Reports.
1206.2
548 300
841.5
240.7
Existed Installed Capacities
CEB Hydro
CEB Thermal-Oil
CEB Thermal-Coal
IPP Thermal
SPP

Generation Performance in Sri Lanka 2011
2
2. Energy Generation
All grid connected generation plants sell the power to the only transmission licensee in Sri Lanka to
deliver the power to the consumers through distribution licensees.
The chart below shows the annual generation figures in 2011 in MWh.
CEB Hydro
CEB Thermal
CEB Wind IPP Thermal SPPs Total
Jan 591,558 66,309 127 176,187 60,100 894,281
Feb 555,485 84,539 71 136,297 59,614 836,006
Mar 477,030 147,401 82 322,163 45,537 992,212
Apr 420,862 176,034 107 242,525 57,695 897,223
May 477,852 187,022 379 268,019 68,943 1,002,216
Jun 381,858 152,172 461 357,796 70,379 962,667
Jul 228,069 266,841 412 448,681 56,753 1,000,756
Aug 163,620 356,989 333 429,149 63,572 1,013,663
Sep 174,278 289,292 326 450,856 71,495 986,247
Oct 206,568 224,886 184 506,194 52,397 990,229
Nov 185,205 246,115 87 467,952 58,721 958,081
Dec 155,263 334,150 92 449,863 52,167 991,535
Total 4,017,648 2,531,751 2,661 4,255,684 717,374 11,525,118
The charts below show the generation mix in Sri Lanka in 2011.
34.86%
21.97%
0.02%
36.93%
6.22%
Energy Generation Mix
CEB Hydro
CEB Thermal
CEB Wind
IPP Thermal
SPP

Generation Performance in Sri Lanka 2011
3
Monthly Variation of Energy Generation Mix
3. Plant Factor
The plant factor of a power plant is the ratio of the actual energy output of a power plant over a period
of time to its potential output if it had operated at full nameplate capacity the entire time.
Plant Factors vary greatly depending on the type of power plants and it is calculated according to the
following formula.
0
200,000
400,000
600,000
800,000
1,000,000
Jan Feb Mar Apr May Jun Jul Aug Sep Oct Nov Dec
CEB Wind
SPP
IPP Thermal
CEB Thermal
CEB Hydro
MWh

Generation Performance in Sri Lanka 2011
4
Calculated plant factors for all grid connected power plants in Sri Lanka in 2011 are listed below.
CEB Hydro
Old Laxapana 58.99%
Polpitiya 58.53%
New Laxapana 54.96%
Kukule 51.87%
Inginiyagala 50.60%
CEB & IPP Thermal
Plant Factors of thermal power plants are listed below according to the calculated merit order in 2011.
Power Plants in Jaffna Peninsula have been shown in a different colour.
1 Puttalam Coal 43.17%
2 Sapugaskanda 2 71.21%
3 Heladanavi 81.09%
4 Sapugaskanda 1 58.77%
5 Colombo Power - Barge 88.89%
6 Nothern Power 50.16%
7 ACE - Embilipitiya 50.47%
8 Lakdhanavi 58.29%
9 ACE - Horana 91.56%
Rantambe 47.85%
Ukuwela 44.95%
Victoria 40.61%
Randenigala 38.72%
Nilambe 35.39%
Samanalawewa 27.94%
Canyon 26.32%
Wimalasurendra 23.34%
Bowatenna 22.48%
Udawalawe 21.80%
Kotmale 21.17%
10 ACE - Matara 86.08%
11 Asia Power 71.11%
12 Westcoast 48.70%
13 AES - Kelanitissa 40.67%
14 Aggreko Chunnakam 54.51%
15 Chunnakam 9.45%
16 KPS GT7 24.19%
17 KPS CCY 17.69%
18 KPS(Small) GT 8.74%
CEB Wind – 10.13%

Generation Performance in Sri Lanka 2011
5
SPP
Rathganga MHP 67.56%
Hapugastenna - 2 MHP 66.70%
Somerset MHP 61.90%
Kotanakanda MHP 61.85%
Batatota MHP 58.47%
Wee Oya MHP 57.30%
Palmerston MHP 54.82%
Carolina MHP 53.28%
Delgoda MHP 52.78%
Badulu Oya MHP 51.85%
Lower Neluwa MHP 51.42%
Hapugastenna - 1 MHP 51.04%
Guruluwana MHP 50.54%
Halathura Ganga MHP 49.00%
Gampola Walakada MHP
48.06%
Sheen MHP 47.65%
Amanawala Oya MHP 47.32%
Erathna (Waranagala) MHP
47.06%
Asupiniella MHP 46.56%
Denawak Ganga MHP 46.15%
Gangaweraliya MHP 46.03%
Kotapola (Kiruwana) MHP
45.60%
Manelwala MHP 44.69%
Giddawa MHP 44.28%
Bogandana MHP 42.31%
Dunsinane MHP 41.51%
Gomala Oya MHP 41.36%
Watakelle MHP 41.36%
Kabaragala MHP 41.31%
Belihul Oya MHP 40.98%
Watawala (Carolina ii) MHP
40.45%
Alupola MHP 39.50%
Soranathota MHP 39.42%
Glassaugh MHP 39.34%
Ellapita Ella MHP 39.24%
Bambarabatu Oya MHP 39.12%
Delta MHP 38.53%
Ritigaha Oya II MHP 38.19%
Magal Ganga MHP 37.33%
Coolbawn MHP 36.85%
Barecaple MHP 36.22%
Loggal Oya MHP 36.22%
Miyanawita Oya MHP
35.80%
Atabage Oya MHP 35.72%
Kadawala II MHP 35.38%
Labuwewa MHP 34.90%
Sithagala MHP 34.42%
Kandureliya (Karawila Ganga) MHP
34.37%
Henfold (Agra Oya) MHP
34.13%
Kehelgamu Oya MHP
33.84%
Upper Korawaka MHP
33.69%
Kalupahana Oya (Lower) MHP
33.15%
Niriella MHP 32.90%
Kolonna MHP 32.63%
Aggra Oya MHP 32.05%
Radella MHP 32.01%
Black Water MHP 32.00%
Battalgala MHP 31.91%
Mandagal Oya MHP 31.88%
Pathaha MHP 31.76%
Koswatta Ganga MHP
31.18%
Adavikanda MHP 30.98%
Minuwanella MHP 30.22%
Kalupahana MHP 29.53%
Way Ganga MHP 29.48%
Kumburuteniwela MHP
29.03%
Kudah Oya MHP 28.99%
Rakwana Ganga MHP
28.83%
Ganthuna Udagama MHP
28.46%
Huluganga MHP 27.16%
Galatha Oya MHP 25.79%
Nugedola MHP 25.70%
Sanquahar MHP 25.51%
Lower Atabage MHP
24.46%
Gurugoda Oya MHP
23.12%
Kadawala I MHP 22.44%
Kirkoswald MHP 22.37%
Forest Hill MHP 21.87%
Hemingford MHP 21.20%
Deiyanwala MHP 20.67%
Nilambe Oya MHP 20.63%
Dick Oya MHP 20.62%
Nakkawita MHP 19.77%
Kolapathana MHP 18.68%
Maduruoya MHP 14.65%
Bowhill (Kadiyanlena) MHP
12.66%
Kiriwan Eliya MHP 7.12%
Weddemulle MHP 6.91%
Brunswic MHP 4.31%
Seetha Eliya MHP 3.61%
Lemastota MHP 0.00%
Nirmalapura WPP 49.36%
Vidatamunai WPP 35.93%
Seguwantivu WPP 31.69%
Mampuri WPP 31.12%
Willpita WPP 13.92%
Solar PV SPP 69.56%
Gonnoruwa I SPP 13.81%
Gonnoruwa II SPP 10.68%
Tirappane SPP 0.00%
Badalgama BMP 42.93%
Tokyo BMP 26.03%
Kottamurichchana BMP
15.11%
Walapone Dendro BMP
0.00%

Generation Performance in Sri Lanka 2011
6
Note: Plant Factors for the CEB power plants were calculated using gross generation figures
Gross generation data for IPPs and SPPs were not available for Plant Factor calculation. Therefore the Net generation data were used to calculate the plant factors of these plants.
Annual Overall Plant Factors for the major types of generation plants in 2011 are given below.
The chart below shows the monthly variation of plant factors of different types of generation plants
operated in 2011.
38.02% 34.08%
10.13%
57.73%
36.55%
0
10
20
30
40
50
60
70
80
90
100
CEB Hydro CEB Thermal CEB Wind IPP Thermal SPP
Plant Factors %
0.00%
10.00%
20.00%
30.00%
40.00%
50.00%
60.00%
70.00%
80.00%
90.00%
100.00%
Jan Feb Mar Apr May Jun Jul Aug Sep Oct Nov Dec
CEB Hydro
CEB Thermal
Hambantota Wind
IPP Thermal
SPP

Generation Performance in Sri Lanka 2011
7
4. Running Plant Factor
The running plant factor of a generation unit is the ratio of the actual energy output of a generation unit
over a period of time to its potential output if it had operated at full nameplate capacity during the
period in which it has been operated.
Running Plant Factor shows the extent to which the generation units have been operated when they are
running out of their nominal capacities.
Calculated running plant factors for CEB owned generation units in 2011 are listed below.
CEB Hydro
CEB Thermal
Ukuwela Unit 1 90.45%
Unit 2 93.69%
Kukule Unit 1 106.68%
Unit 2 89.65%
Rantambe Unit 1 89.17%
Unit 2 89.51%
Randenigala Unit 1 86.92%
Unit 2 85.10%
Victoria
Unit 1 87.52%
Unit 2 73.27%
Unit 3 77.22%
Old Laxapana
Unit 1 77.50%
Unit 2 73.56%
Unit 3 77.43%
Unit 4 77.38%
Unit 5 75.32%
Wimalasurendra Unit 1 71.50%
Unit 2 66.52%
Polpitiya Unit 1 63.23%
Unit 2 68.39%
New Laxapana Unit 1 64.51%
Unit 2 62.94%
Samanalawewa Unit 1 64.56%
Unit 2 57.90%
Canyon Unit 1 58.31%
Unit 2 57.63%
Bowatenna Unit 1 48.10%
Kotmale
Unit 1 45.81%
Unit 2 52.40%
Unit 3 46.41%
Puttalam Coal Unit 1 69.99%
Sapugaskanda 2
Unit 5 86.21%
Unit 6 86.23%
Unit 7 85.12%
Unit 8 86.49%
Unit 9 86.24%
Unit 10 86.76%
Unit 11 84.58%
Unit 12 87.88%
Sapugaskanda 1
Unit 1 72.00%
Unit 2 72.37%
Unit 3 70.50%
Unit 4 73.12%
KPS GT7 Unit 7 74.42%
KPS CCY Unit 8 (GT) 75.32%
Unit 8 (ST) 84.22%
KPS(Small) GT
Unit 1 67.84%
Unit 2 71.63%
Unit 3 72.95%
Unit 4 81.32%
Unit 5 86.66%

Generation Performance in Sri Lanka 2011
8
Note: Running Plant Factors for IPPs and SPPs were not calculated since the operation durations of those
plants were not available.
5. Load Factor
Load Factor is an indicator of how steady an electrical load is over time. It is simply the average load
divided by the peak load in a system over a period of time. But normally load factor is calculated
subjected to the produced energy according to the following formula.
Calculated Load Factor for the total system in 2011 = 60.82%
Load factor of any system must be tried to keep in its maximum by pulling down the concentrated
maximum demand and shifting the loads to periods of otherwise low usage. Load factor maximization is
essential in maintaining the security of supply of the countries in which meeting the concentrated
maximum demand is critical. Countries which have a flat load curve own a higher load factor.
Sri Lanka has a load curve with a steep peak in the night, where starting from about 6.00 pm the load
grows to about 2,000 MW by 7.30 pm and starts falling off after about 08.30 pm. Therefore the system
must be comprised a substantial additional generation capacity only to meet that abrupt sharp night
peak; hence the load factor in Sri Lanka is comparatively low. As a solution for that, CEB has introduced a
three tier tariff plan for the industrial electricity consumers with low off peak rates and penal peak rates
to smoothen the daily peak load and push some industrial activities to low demand hours, and this time-
of-day tariff scheme is expected to be facilitated for the domestic consumers as well in near future.
59.00%
61.00%
63.00%
65.00%
67.00%
69.00%
Jan Feb Mar Apr May Jun Jul Aug Sep Oct Nov Dec
Monthly Variation in Load Factor

Generation Performance in Sri Lanka 2011
9
6. Energy Unit Cost
Thermal power stations use fossil fuel for power generation. Therefore cost of producing a unit (kWh)
differs with the type of fuel used and with efficiency of the generation process. This unit cost is crucial
when performing economical dispatch.
Calculated average generation costs per unit in Rs/kWh for each thermal power plant operated in Sri
Lanka in 2011 are listed below.
CEB Thermal
Puttalam Coal Rs.6.39
Sapugaskanda 2 Rs.8.70
Sapugaskanda 1 Rs.9.56
Chunnakam Rs.28.66
KPS GT 7 Rs.29.76
KPS CCY Rs.30.18
KPS (Small) GTs Rs.44.85
IPPs
Heladanavi Rs.8.99
Colombo Power - Barge Rs.9.92
Nothern Power Rs.9.99
ACE - Embilipitiya Rs.10.08
Lakdhanavi Rs.10.16
ACE - Horana Rs.10.19
ACE - Matara Rs.10.30
Asia Power Rs.10.41
Westcoast Rs.12.92
AES - Kelanitissa Rs.21.46
Aggreko Chunnakam Rs.25.28
Note: Average unit costs for CEB plants were calculated based only on fuel consumption.
Average unit costs for IPPs were calculated based only on their energy charges.
Fuel costs and energy charges data in December were not available for the calculation

Generation Performance in Sri Lanka 2011
10
7. Comparison of Scheduled Dispatch and Actual Dispatch
CEB implements a generation dispatch schedule every 6 months before operation. It contains the
amount of energy to be produced by each power plant for the coming year. Due to various reasons the
actual dispatch could be deviated from this schedule and the comparison for the 2011 is given below.
Capacity MW
Annual Scheduled GWh
Annual Actual GWh
Variation GWh
Scheduled PF Actual PF
Puttalam Coal 300 1606.43 1038.2 -568.23 61.13% 39.51%
Sapugaskanda 2 80 496.64 499.05 +2.41 70.87% 71.21%
Heladhanavi 100 708.9 710.39 +1.49 80.92% 81.09%
Sapugaskanda 1 80 392.85 411.88 +19.03 56.06% 58.77% Colombo Power
Barge 60 424.71 467.2 +42.49 80.80% 88.89%
ACE Embilipitiya 100 693.66 442.16 -251.5 79.18% 50.47%
Lakdhanavi 22.5 156.09 114.89 -41.2 79.19% 58.29%
ACE Horana 20 166.97 160.41 -6.56 95.30% 91.56%
ACE Matara 20 164.03 150.81 -13.22 93.62% 86.08%
ASIA Power 51 328.88 317.68 -11.2 73.61% 71.11%
Kerawalapitiya 270 1118.58 1151.9 +33.32 47.29% 48.70%
AES Kelanitissa 163 47.87 580.73 +532.86 3.35% 40.67%
KPS GT 7 115 30 243.73 +213.73 2.98% 24.19%
KPS CCY 165 531.6 255.67 -275.93 36.78% 17.69%
KPS Small GT 100 3.61 76.6 +72.99 0.41% 8.74% Total Grid Con.
Thermal 1646.5 6870.82 6621.3 -249.52 47.64% 45.91%
Northern Power 20 157.5 87.88 -69.62 89.90% 50.16%
Aggreko 15 53.51 71.63 +18.12 40.72% 54.51%
Chunnakam 8 3.05 6.62 +3.57 4.35% 9.45%
Total Northern 43 214.05 166.13 -47.92 56.83% 44.10%
Renewable
energy 243.717 630.2 719.93 +89.73 29.52% 33.72%
CEB Hydro 1206.2 3494.34 4017.65 +523.31 33.07% 38.02%
Total Generation 3139.417 11209.46 11525.01 +315.55
Note: All Thermal Plants have been listed according to the calculated Merit order

Generation Performance in Sri Lanka 2011
11
8. Auxiliary Consumption
Auxiliary system is a major part of a power generation facility and the auxiliary consumption depends on
configuration, age and related technical parameters of the plant. Purpose of an auxiliary system is to
supply power for its own electricity requirements.
Normally 0.5% - 2% of power generated is consumed for the auxiliary system in hydro plants while the
auxiliary consumption in fossil fuel power plants is 7% - 15% since there are different equipment like
feed pumps, cooling water pumps, air fans, coal grinding mills, ash handling equipment etc. utilized in
thermal plants.
Calculated percentages of auxiliary consumption out of annual gross generation of CEB power plants are
as follows
CEB Hydro 0.45%
CEB Thermal 6.17%
CEB Wind 0.51%
Note: Auxiliary power consumption data are available only for CEB power plants and consumption for
each plant separately are not available.
9. Availability Factor
The evaluation of availability of a power plant is one of the most important works at any power station.
To analyze plant availability performance, outages should be scrutinized to identify the causes of
unplanned or forced energy losses and to reduce the planned energy losses. Reducing outages increases
the number of operating hours, therefore increases the energy availability factor.
Availability Factor of a generation plant can be calculated using the formula given below.
Total Availability Factor for all CEB generation Units in 2011 = 82.14%
Availability Factor for CEB hydro generation units in 2011 = 81.93%
Availability Factor for CEB thermal generation units in 2011 = 78.62%
Availability Factor for CEB wind generation units in 2011 = 97.82%

Generation Performance in Sri Lanka 2011
12
The chart below shows the monthly variation of availability of all CEB generation units in 2011
Note: Interruption data is available only for CEB owned power plants.
Interruption data of Norochcholai and Chunnakam power plants were not available for the above
calculations.
10. Reservoir Storages
Hydro power is one of the major sources of generation in the Sri Lankan power system and most of the
comparatively large scale hydro projects have been developed by CEB. In 2011 approximately 39% of the
total existed capacity was installed in 16 CEB hydro stations and a contribution of 34.86% has been given
to the national generation.
0.00%
10.00%
20.00%
30.00%
40.00%
50.00%
60.00%
70.00%
80.00%
90.00%
100.00%
Jan Feb Mar Apr May Jun Jul Aug Sep Oct Nov Dec
Hydro
Thermal
Wind
Generation Performance in Sri Lanka 2011
13
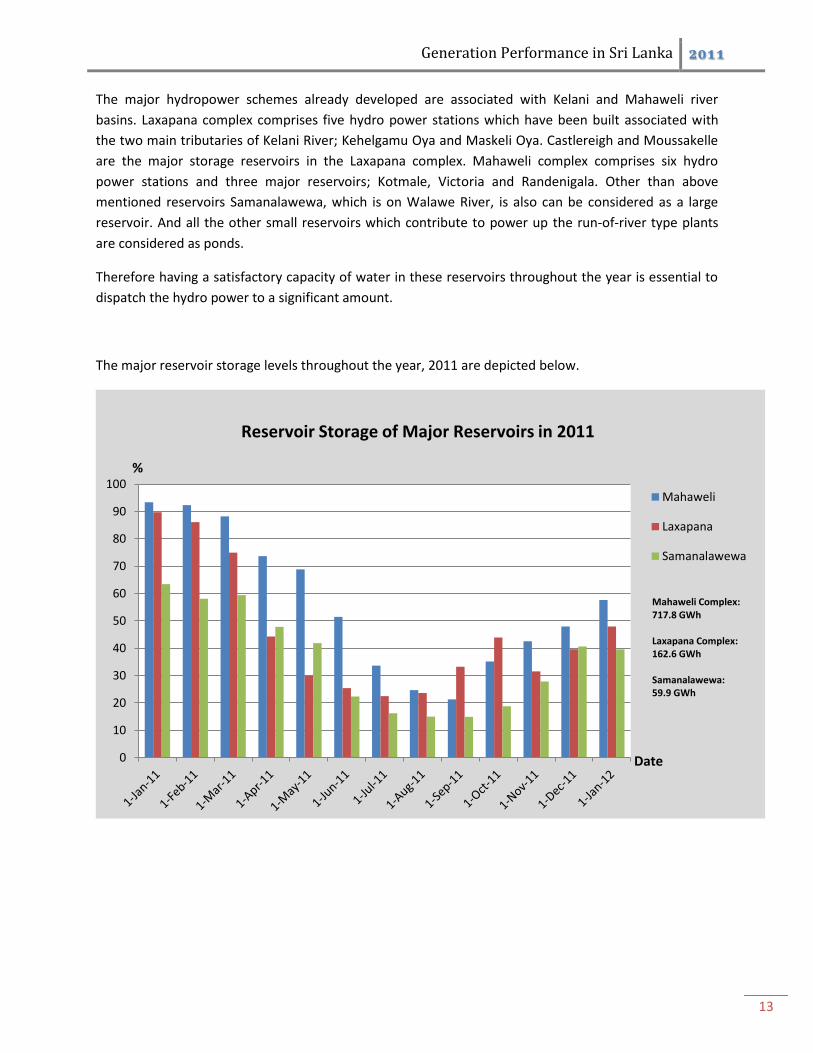
The major hydropower schemes already developed are associated with Kelani and Mahaweli river
basins. Laxapana complex comprises five hydro power stations which have been built associated with
the two main tributaries of Kelani River; Kehelgamu Oya and Maskeli Oya. Castlereigh and Moussakelle
are the major storage reservoirs in the Laxapana complex. Mahaweli complex comprises six hydro
power stations and three major reservoirs; Kotmale, Victoria and Randenigala. Other than above
mentioned reservoirs Samanalawewa, which is on Walawe River, is also can be considered as a large
reservoir. And all the other small reservoirs which contribute to power up the run-of-river type plants
are considered as ponds.
Therefore having a satisfactory capacity of water in these reservoirs throughout the year is essential to
dispatch the hydro power to a significant amount.
The major reservoir storage levels throughout the year, 2011 are depicted below.
0
10
20
30
40
50
60
70
80
90
100Mahaweli
Laxapana
Samanalawewa
Reservoir Storage of Major Reservoirs in 2011
%
Date
Mahaweli Complex: 717.8 GWh Laxapana Complex: 162.6 GWh Samanalawewa: 59.9 GWh

Generation Performance in Sri Lanka 2011
14
Note: Only Mahaweli, Laxapana and Samanalawewa Complexes’ reservoirs are considered in total
reservoir storage profile.
0
10
20
30
40
50
60
70
80
90
100
Total Reservoir Storage Profile - 2011 %
Date
0%
10%
20%
30%
40%
50%
60%
70%
80%
90%
100%
1-Jan 1-Feb 1-Mar 1-Apr 1-May 1-Jun 1-Jul
Reservoir Storage upto end of July 2012
Generation Performance in Sri Lanka 2011
15
11. Conclusion
The Report has described and calculated a number of key performance indicators for total generation
system and individual generation plants operated in Sri Lanka. These indices can be used to measure the
plant’s performance compared with benchmarks and to illustrate the historical trends. The indicators for
the present technical performance of the generation system are useful when planning the future
developments and taking the corrective actions if necessary to improve the efficiency of generation.
Improving the performance of existing power plants is the most cost effective way to increase the
energy producing capabilities of them. Performance indicators are very useful in identifying the areas for
performance improvement. Among generation plants’ performance measures plant factor, availability
and auxiliary consumption are critical performance indicators, both in technical and commercial terms.
Nevertheless, generator outages’ details and auxiliary consumption data of IPPs are not available to
assess the availability and percentage of auxiliary consumption of them. And individual auxiliary
consumption data of CEB owned power plants are also not available to measure their individual
performances. Therefore the availability details and auxiliary consumption data of all CEB and Private
power are intended to be received through LISS in order to measure their performance.
Additionally, in environmental context the amount of Carbon dioxide per annum in thermal power
generation for individual thermal power plants could be measured in future in order to take the
necessary actions to help in reducing the annual global GHG emissions. And in safety context industrial
safety performance could be monitored by the number of accidents that result during working period.
0
10
20
30
40
50
60
70
80
90
100
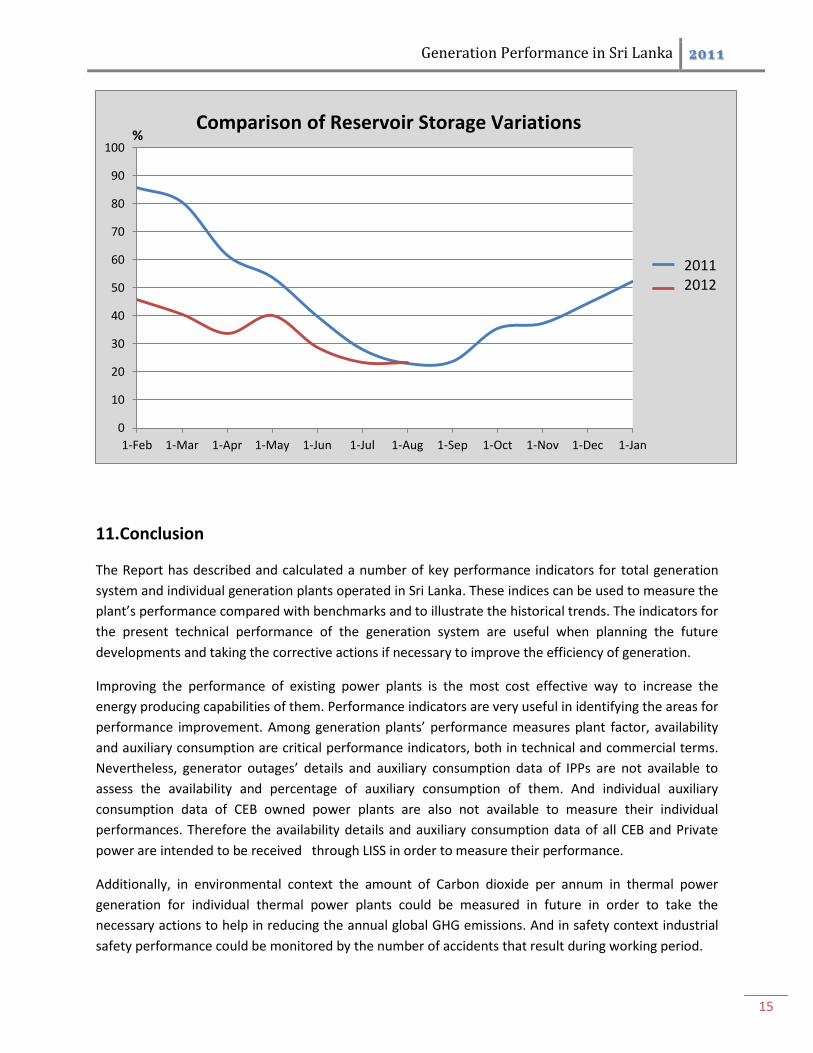
1-Feb 1-Mar 1-Apr 1-May 1-Jun 1-Jul 1-Aug 1-Sep 1-Oct 1-Nov 1-Dec 1-Jan
Series1
series 2
2011 2012
Comparison of Reservoir Storage Variations %