Embed Size (px)
Citation preview
Instructions! Use black ink or black ball-point pen. Draw diagrams in pencil.! Answer all questions.! You must answer the questions in the spaces provided. Do not write outside the box
around each page or on blank pages.! Do all rough work in this book. Cross through any work that you do not want to be
marked.! If your calculator does not have a π button, take the value of π to be 3.14 unless another
value is given in the question.
Information! The marks for questions are shown in brackets.! The quality of your written communication is specifically assessed in questions that are
indicated with an asterisk (*).
Advice! Read each question carefully before you start to answer it.! In all calculations, show clearly how you work out your answer.! Use the number of marks for the question as a guide to the amount of time you need to
spend.! Look at previous parts of the question, e.g. a), b), c) i) as there may be information there
you need to answer later parts.! Check your answer is realistic and appropriate.! For calculator decimal numbers always write your full calculator display in the working
out area and then, if you need to, round the answer on the answer line.
GCSE MATHEMATICS
Venn Diagrams 1
These questions are taken from AQA Linked Pair Pilot Papers between January 2011 - June 2016
x
Available from thecalculatorguide.com
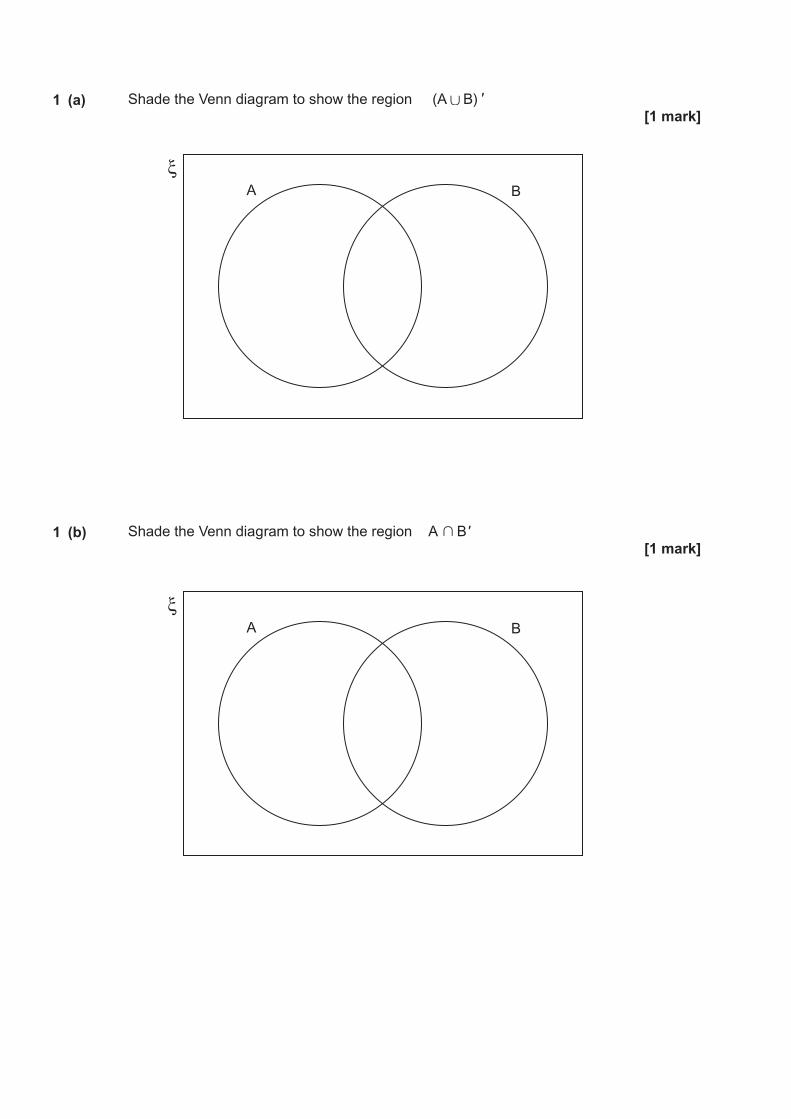
1 (a) Shade the Venn diagram to show the region (A B)[1 mark]
1 (b) Shade the Venn diagram to show the region A B[1 mark]
A B
ξ
A B
ξ
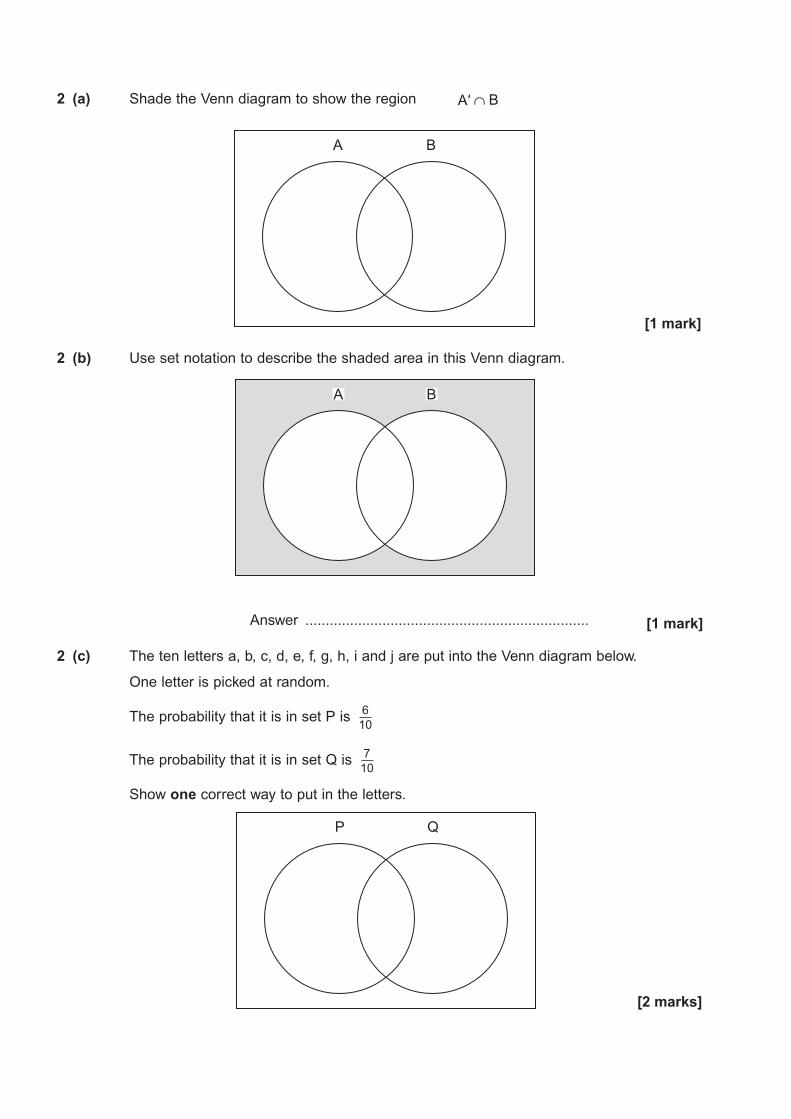
2 (a) Shade the Venn diagram to show the region
[1 mark]
2 (b) Use set notation to describe the shaded area in this Venn diagram.
Answer ...................................................................... [1 mark]
2 (c) The ten letters a, b, c, d, e, f, g, h, i and j are put into the Venn diagram below.
One letter is picked at random.
The probability that it is in set P is
The probability that it is in set Q is
Show one correct way to put in the letters.
[2 marks]
A B
A B
P Q
∩ BA
610
710
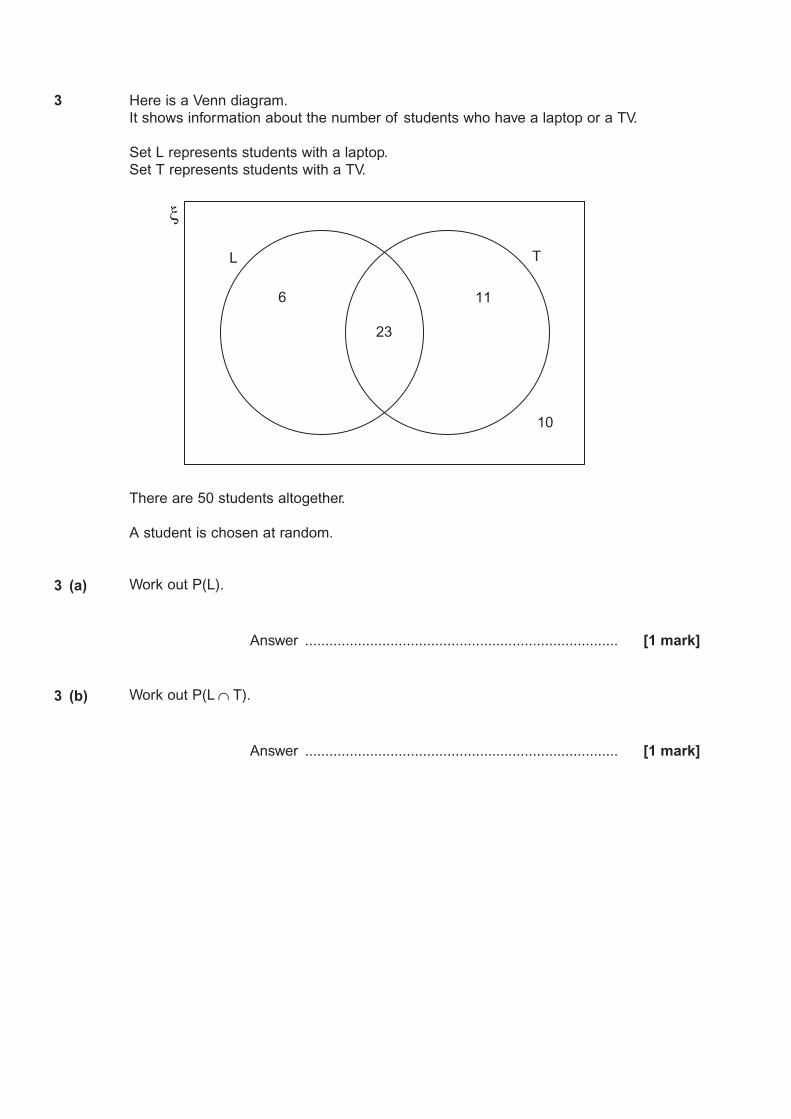
3 Here is a Venn diagram.It shows information about the number of students who have a laptop or a TV.
Set L represents students with a laptop.Set T represents students with a TV.
There are 50 students altogether.
A student is chosen at random.
3 (a) Work out P(L).
Answer ............................................................................. [1 mark]
3 (b) Work out P(L T).
Answer ............................................................................. [1 mark]
11
10
6
L T
23
ξ
∩
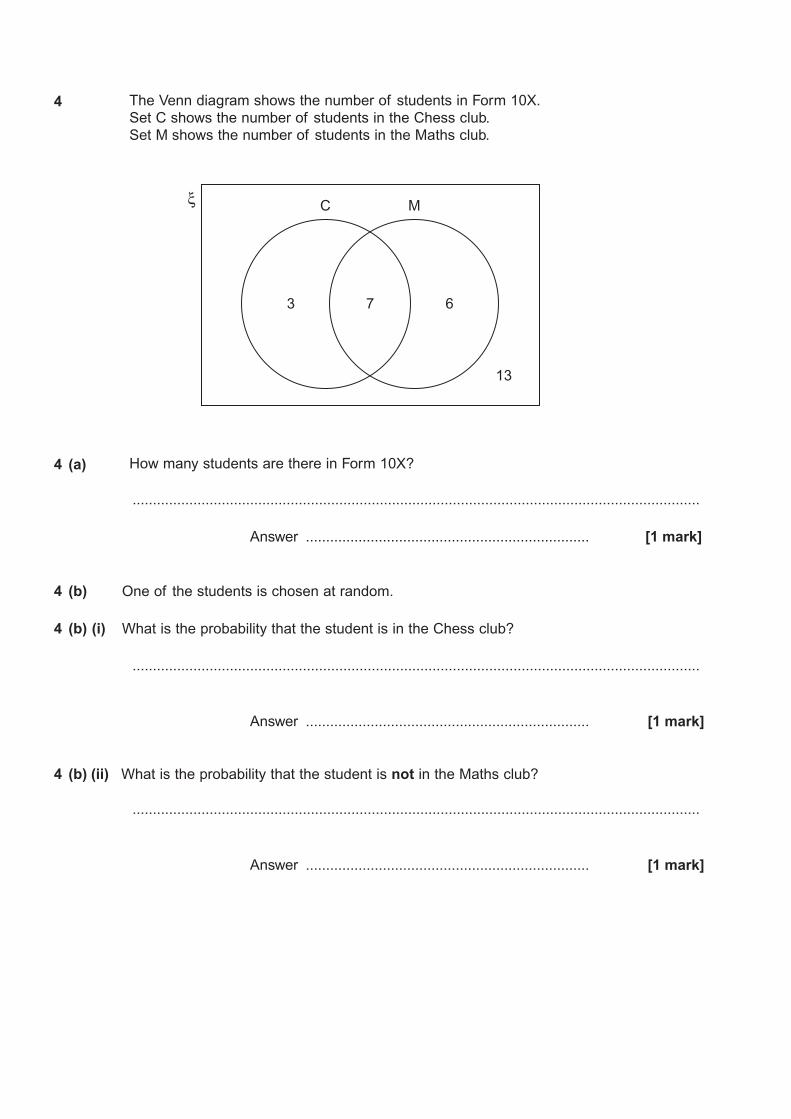
4 The Venn diagram shows the number of students in Form 10X.Set C shows the number of students in the Chess club.Set M shows the number of students in the Maths club.
4 (a) How many students are there in Form 10X?
............................................................................................................................................
Answer ...................................................................... [1 mark]
4 (b) One of the students is chosen at random.
4 (b) (i) What is the probability that the student is in the Chess club?
............................................................................................................................................
Answer ...................................................................... [1 mark]
4 (b) (ii) What is the probability that the student is not in the Maths club?
............................................................................................................................................
Answer ...................................................................... [1 mark]
67
C M
13
3
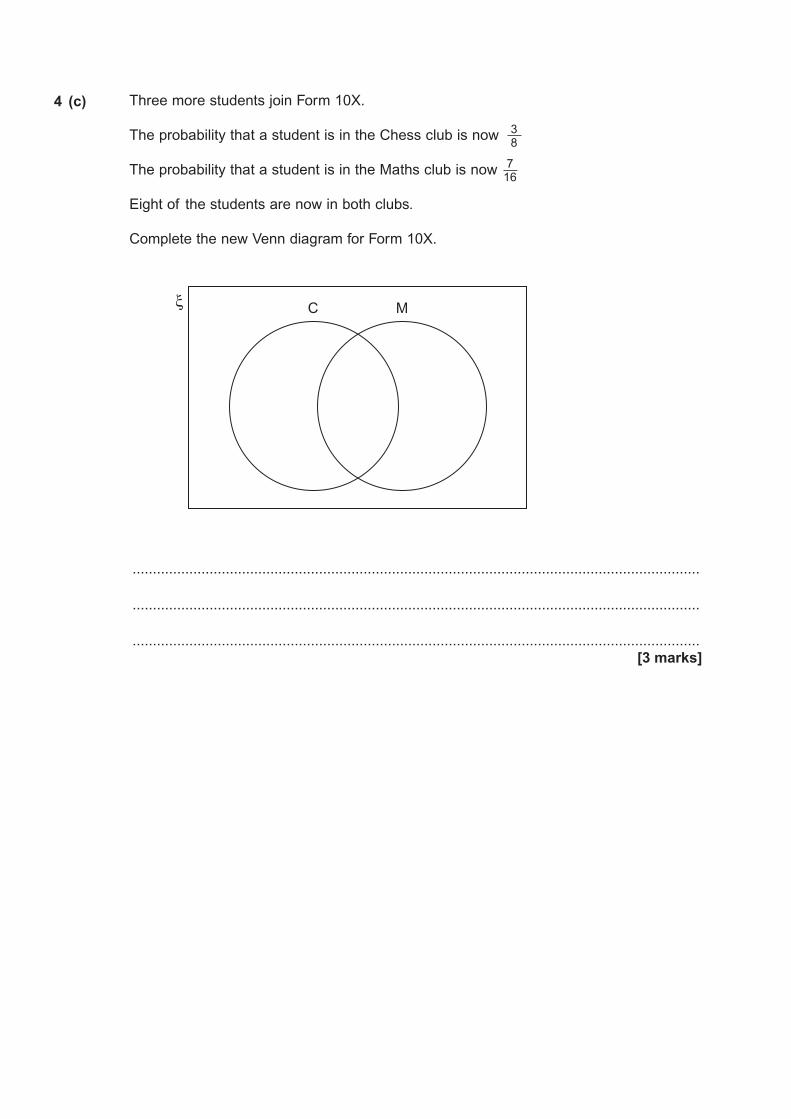
4 (c) Three more students join Form 10X.
The probability that a student is in the Chess club is now
The probability that a student is in the Maths club is now
Eight of the students are now in both clubs.
Complete the new Venn diagram for Form 10X.
............................................................................................................................................
............................................................................................................................................
............................................................................................................................................[3 marks]
C M
38
716
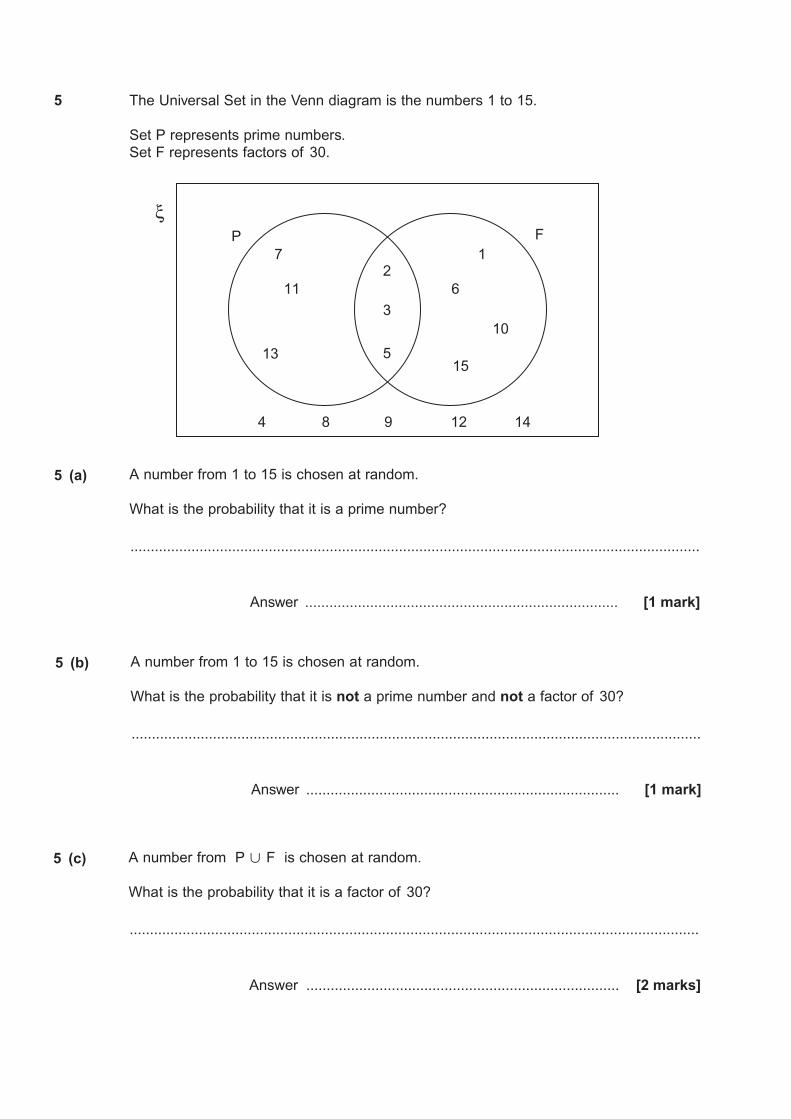
5 The Universal Set in the Venn diagram is the numbers 1 to 15.
Set P represents prime numbers.Set F represents factors of 30.
5 (a) A number from 1 to 15 is chosen at random.
What is the probability that it is a prime number?
............................................................................................................................................
Answer ............................................................................. [1 mark]
5 (b) A number from 1 to 15 is chosen at random.
What is the probability that it is not a prime number and not a factor of 30?
............................................................................................................................................
Answer ............................................................................. [1 mark]
7 1
6
10
15
11
P F
13
4 8 9 12 14
2
5
3
ξ
5 (c) A number from P F is chosen at random.
What is the probability that it is a factor of 30?
............................................................................................................................................
Answer ............................................................................. [2 marks]
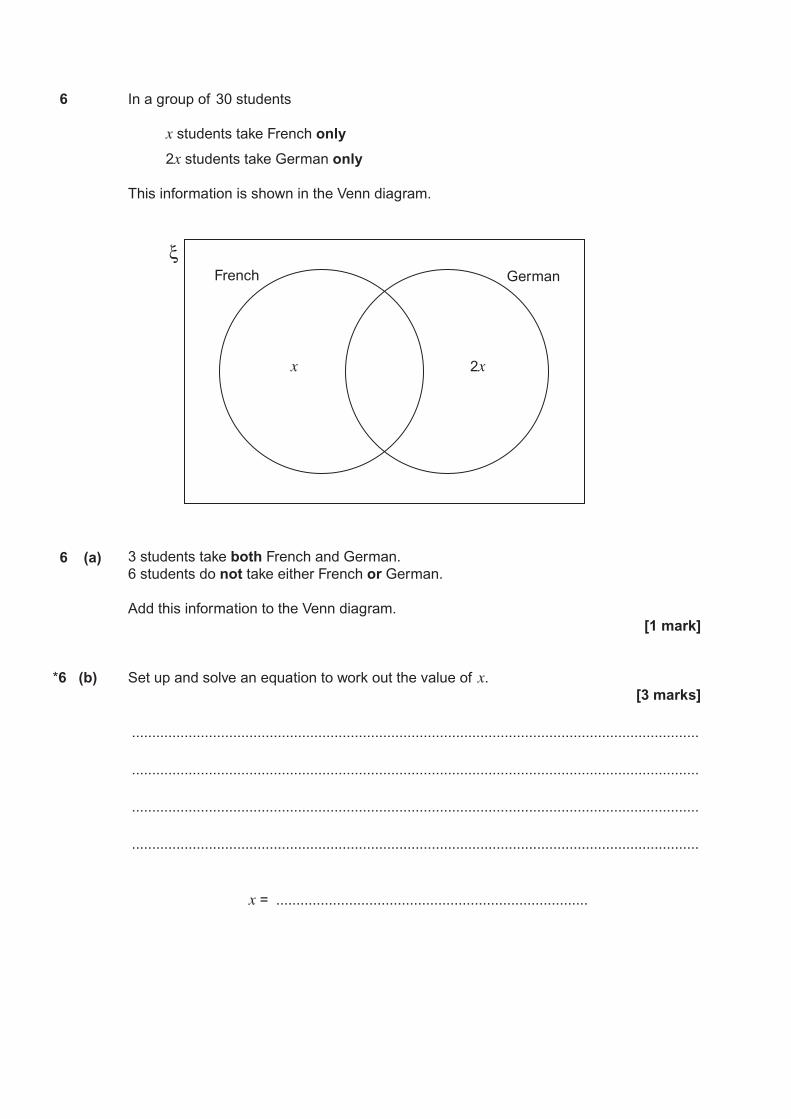
6 In a group of 30 students
x students take French only
2x students take German only
This information is shown in the Venn diagram.
6 (a) 3 students take both French and German.6 students do not take either French or German.
Add this information to the Venn diagram.[1 mark]
*6 (b) Set up and solve an equation to work out the value of x.[3 marks]
............................................................................................................................................
............................................................................................................................................
............................................................................................................................................
............................................................................................................................................
x = .............................................................................
French
x 2x
German
ξ
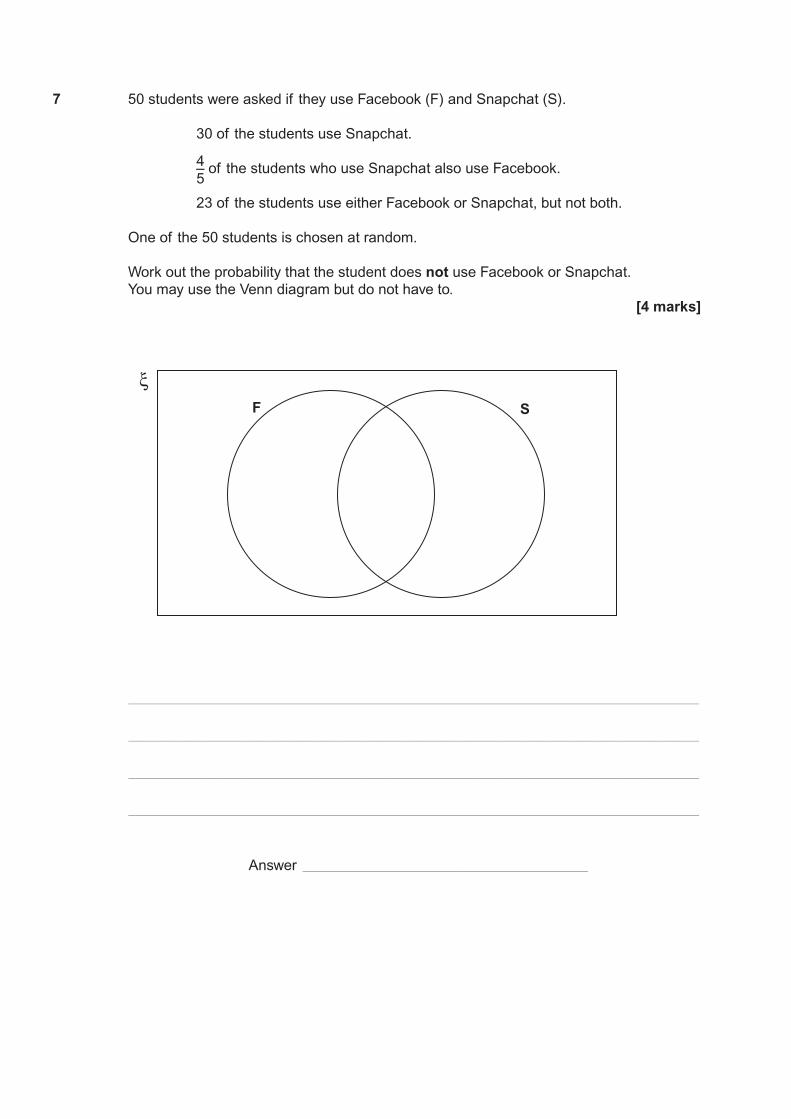
7 50 students were asked if they use Facebook (F) and Snapchat (S).
30 of the students use Snapchat.
– of the students who use Snapchat also use Facebook.
23 of the students use either Facebook or Snapchat, but not both.
One of the 50 students is chosen at random.
Work out the probability that the student does not use Facebook or Snapchat.You may use the Venn diagram but do not have to.
[4 marks]
______________________________________________________________________________
______________________________________________________________________________
______________________________________________________________________________
______________________________________________________________________________
Answer _______________________________________
45
SF
ξ
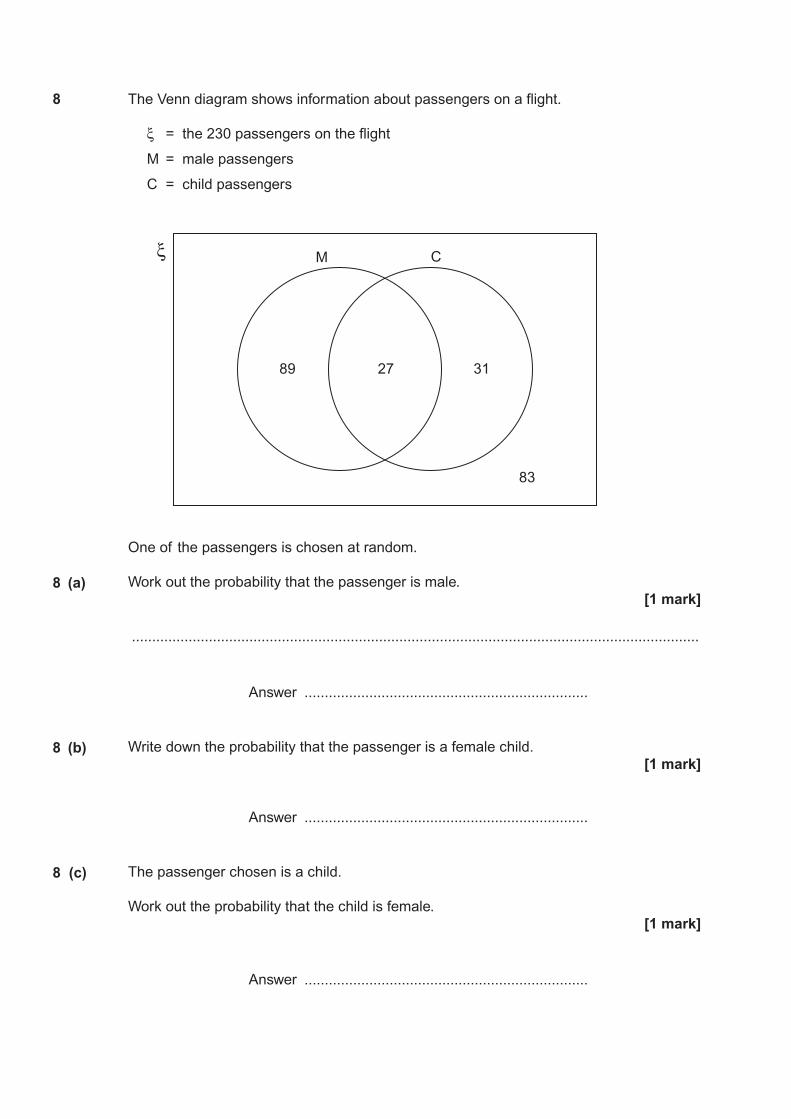
8 The Venn diagram shows information about passengers on a flight.
ξ = the 230 passengers on the flight
M = male passengers
C = child passengers
One of the passengers is chosen at random.
8 (a) Work out the probability that the passenger is male.[1 mark]
............................................................................................................................................
Answer ......................................................................
8 (b) Write down the probability that the passenger is a female child.[1 mark]
Answer ......................................................................
8 (c) The passenger chosen is a child.
Work out the probability that the child is female.[1 mark]
Answer ......................................................................
M
89 27 31
83
Cξ
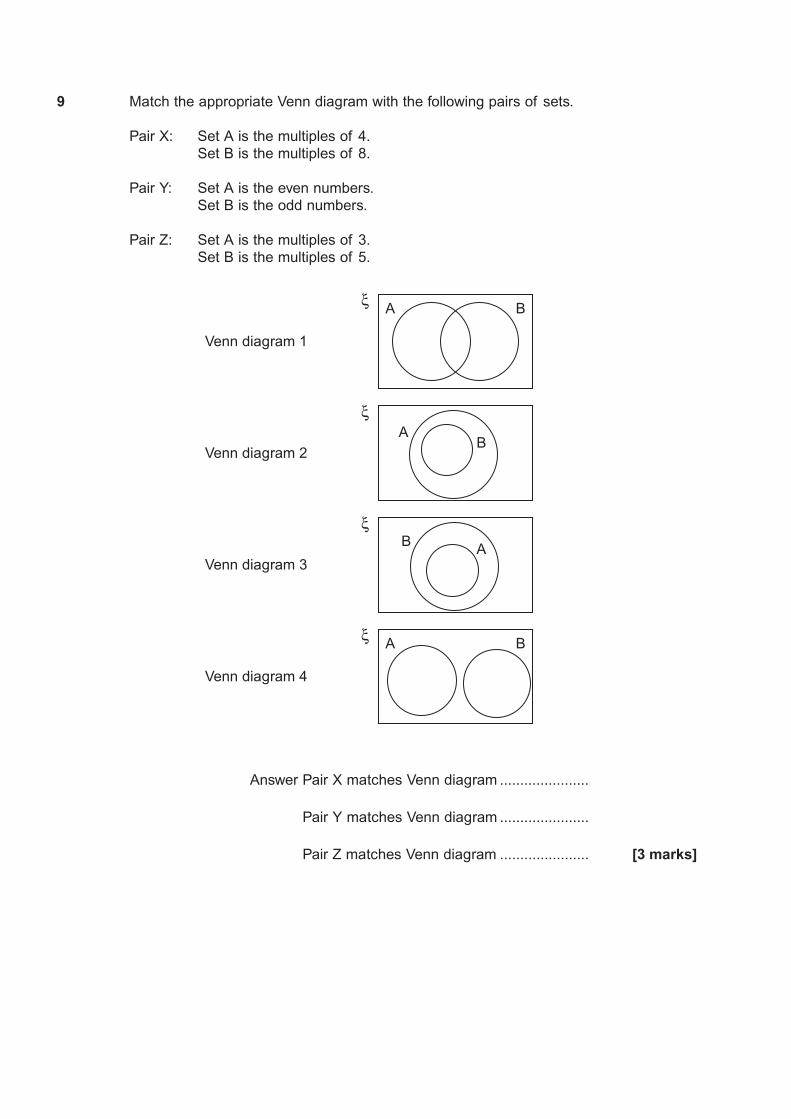
9 Match the appropriate Venn diagram with the following pairs of sets.
Pair X: Set A is the multiples of 4.Set B is the multiples of 8.
Pair Y: Set A is the even numbers.Set B is the odd numbers.
Pair Z: Set A is the multiples of 3.Set B is the multiples of 5.
Answer Pair X matches Venn diagram ......................
Answer Pair Y matches Venn diagram ......................
Answer Pair Z matches Venn diagram ...................... [3 marks]
A B
Venn diagram 1
ξ
AB
Venn diagram 2
ξ
AB
Venn diagram 3
ξ
A B
Venn diagram 4
ξ
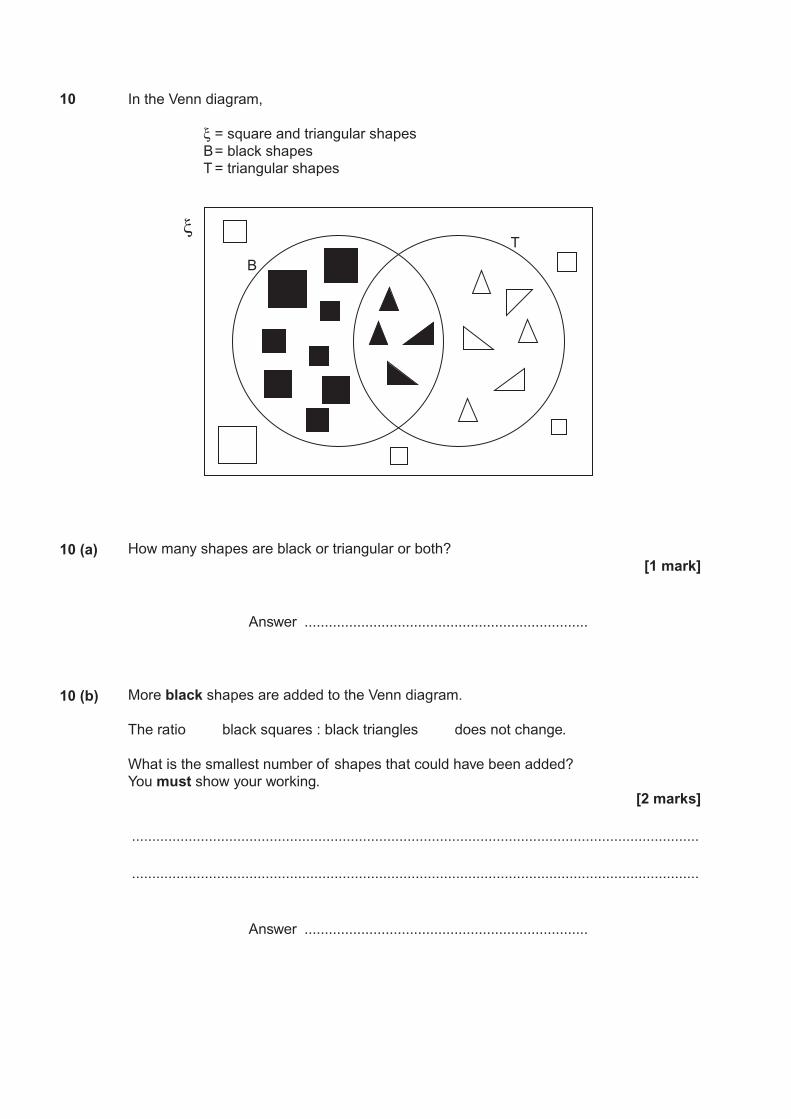
10 In the Venn diagram,
ξ = square and triangular shapesB= black shapesT = triangular shapes
10 (a) How many shapes are black or triangular or both?[1 mark]
Answer ......................................................................
10 (b) More black shapes are added to the Venn diagram.
The ratio black squares : black triangles does not change.
What is the smallest number of shapes that could have been added?You must show your working.
[2 marks]
............................................................................................................................................
............................................................................................................................................
Answer ......................................................................
B
Tξ
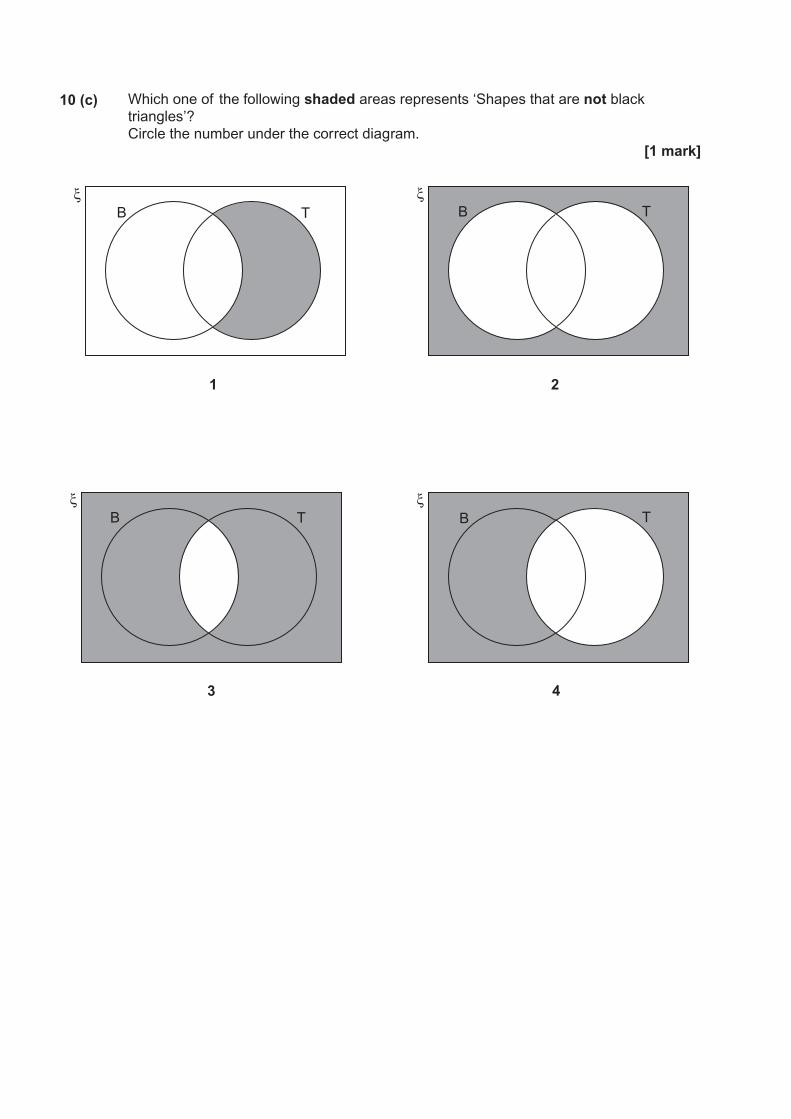
10 (c) Which one of the following shaded areas represents ‘Shapes that are not black triangles’?Circle the number under the correct diagram.
[1 mark]
B T
1
ξB T
2
ξ
B T
3
ξB T
4
ξ


![MATH-G Exam [E-24EKGT] Polygons and Circles Packet · This Venn diagram represents students who play instruments in the orchestra. Identify each region of the Venn diagram that represents](https://img.dokumen.tips/doc/110x75/5f5ba6102f46196f607ab8c4/math-g-exam-e-24ekgt-polygons-and-circles-packet-this-venn-diagram-represents.jpg)