Embed Size (px)
Citation preview

This dra� qualifi cation has not yet been accredited by Ofqual. It is published to enable teachers to have early sight of our proposed approach to Pearson Edexcel Level 1/Level 2 GCSE (9 - 1) in Music (1MU0). Further changes may be required and no assurance can be given at this time that the proposed qualifi cation will be made available in its current form, or that it will be accredited in time for fi rst teaching in September 2016 and fi rst award in 2018.
Specifi cationPearson Edexcel Level 1/Level 2 GCSE (9 - 1) in Statistics (1ST0)First teaching from September 2017First certifi cation from June 2019
GCSE (9-1)Statistics
Issue 2
GCSE (9-1)

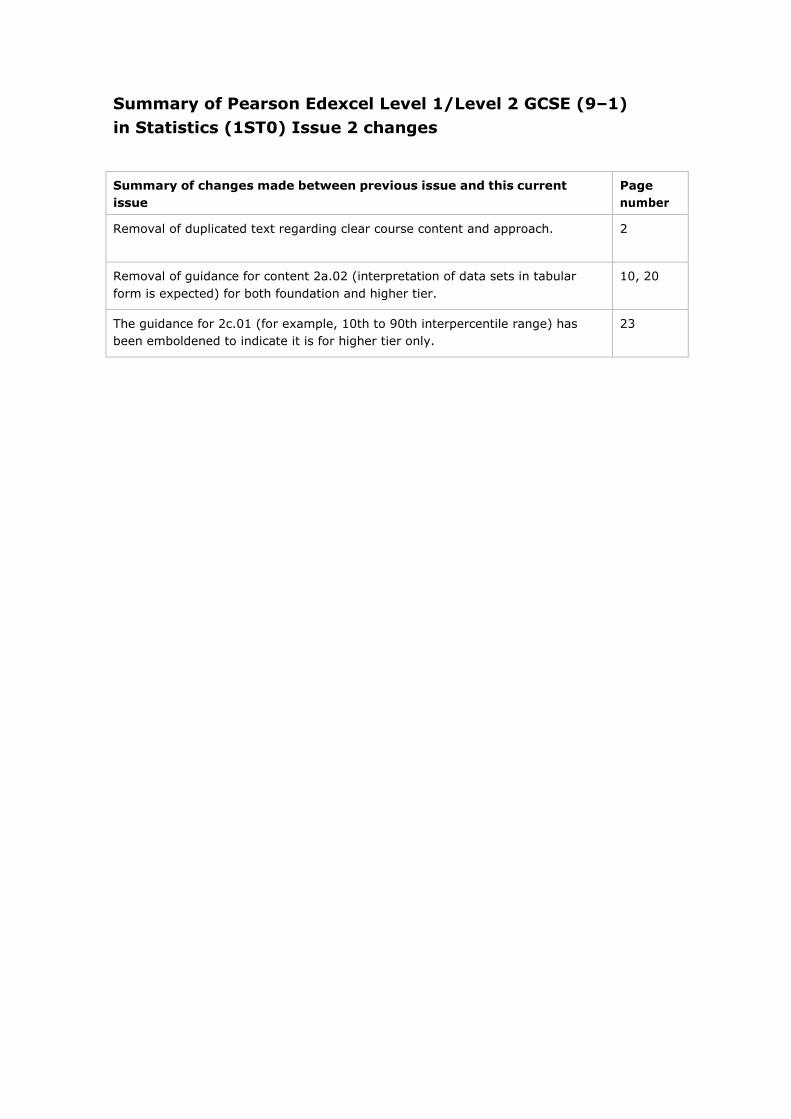
Summary of Pearson Edexcel Level 1/Level 2 GCSE (9–1) in Statistics (1ST0) Issue 2 changes
Summary of changes made between previous issue and this current issue
Page number
Removal of duplicated text regarding clear course content and approach. 2
Removal of guidance for content 2a.02 (interpretation of data sets in tabular form is expected) for both foundation and higher tier.
10, 20
The guidance for 2c.01 (for example, 10th to 90th interpercentile range) has been emboldened to indicate it is for higher tier only.
23


Contents
1 Introduction 2
Why choose Edexcel GCSE Statistics? 2
Supporting you in planning and implementing this qualification 3
Qualification at a glance 4
2 Subject content 5
Statistical enquiry cycle 6
Foundation tier content 7
Higher tier content 17
3 Assessment information 31
Assessment Objectives 32
4 Administration and general information 34
Entries 34
Access arrangements, reasonable adjustments, special consideration and malpractice 34
Student recruitment and progression 36
Appendix 1: Formulae sheets 41
Appendix 2: Formulae included in subject content 43
Appendix 3: Prior knowledge 48
Appendix 4: Calculators 50
Appendix 5: The context for the development of this qualification 51
Appendix 6: Transferable skills 53
Appendix 7: Codes 54

Pearson Edexcel Level 1/Level 2 GCSE (9–1) in Statistics – Specification – Issue 2 – December 2017 © Pearson Education Limited 2017
2
1 Introduction
Why choose Edexcel GCSE Statistics?
We have listened to feedback from all parts of the mathematics and statistics subject community, including users of statistics within higher education and students of GCSE Statistics. We have used this opportunity of curriculum change to redesign a qualification which will enable your students to acquire transferable skills to support them in progressing beyond GCSE in a range of subjects. At the same time, this qualification retains many familiar features which have contributed to the popularity of our GCSE Statistics.
Straightforward assessment structure – we have designed our qualification with two papers of equal size and weighting. This assessment structure supports a wide range of delivery models so you can continue to teach GCSE Statistics in the way that suits you. With the assessment objectives targeted equally in both papers, the statistical enquiry cycle assessment is integrated with the statistical methods supporting an integrated approach to statistics teaching, learning and exam preparation.
Development of transferable skills – students are introduced to the skills of statistical enquiry, and practise the underpinning statistical calculations and interpretation using real world data and authentic contexts. Our approach supports skills development for progression to a range of subjects and develops an awareness of statistics beyond the classroom.
Clear course content and approach – we have organised the content in a way that will be familiar, making it easy for you to find what you need in the specification, while the inclusion of guidance alongside the content statements gives clarity of coverage and unambiguous meaning.
Clear, accessible question papers – our questions use the clear approach and design that you are familiar with. Careful ramping – within questions, across papers and between the tiers – together with the use of engaging real-life statistical material, support students of a range of abilities to achieve their potential, including enabling the strongest to demonstrate what they can do.
Comprehensive support – change is easier with the right support, so we will be on hand to listen and give advice on the changes. We offer extensive help to plan your programme, teach the new content, track your students’ progress and assess their readiness for the final exam. We will provide the best support for flexible delivery so you have what you need to implement the new GCSE Statistics in a way that works for you.

Pearson Edexcel Level 1/Level 2 GCSE (9–1) in Statistics – Specification – Issue 2 – December 2017 © Pearson Education Limited 2017
3
Supporting you in planning and implementing this qualification
Planning ● Our Getting Started guide gives you an overview of the new GCSE Statistics qualification
to help you to get to grips with the changes to content and assessment and to help you understand what these changes mean for you and your students.
● We will give you editable course planner and scheme of work which you can adapt to suit your department.
● Our mapping documents highlight key differences between the new qualification and the previous qualification, and highlight touch points between the GCSE (9–1) Statistics and GCSE (9–1) Mathematics specifications.
Teaching and learning There will be free teaching and learning support to help you deliver the new qualification, including:
● teaching points and common misconceptions on the content topics
● support for the statistical enquiry cycle.
Preparing for exams We will also provide a range of resources to help you prepare your students for the assessments, including:
● plenty of specimen papers written by our senior examiner team to support you with formative assessments and mock exams
● marked exemplars of student work with examiner commentaries.
ResultsPlus and ExamWizard ResultsPlus provides the most detailed analysis available of your students’ exam performance. It can help you identify the topics and skills where further learning would benefit your students.
ExamWizard is a data bank of past exam questions (and sample and specimen paper questions) allowing you to create bespoke test papers.
Get help and support Mathematics Emporium - support whenever you need it
The renowned Mathematics Emporium helps you keep up to date with all areas of mathematics and statistics throughout the year, as well as offering a rich source of past questions, and of course access to our in-house experts Graham Cumming and his team.
Sign up to get Emporium emails
Get updates on the latest news, support resources, training and alerts for entry deadlines and key dates direct to your inbox. Just email [email protected] to sign up.
Emporium website
Over 15 000 documents relating to past and present Pearson/Edexcel Mathematics qualifications available free. Visit www.edexcelmaths.com/ to register for an account.
Learn more at quals.pearson.com/stats17

Pearson Edexcel Level 1/Level 2 GCSE (9–1) in Statistics – Specification – Issue 2 – December 2017 © Pearson Education Limited 2017
4
Qualification at a glance
Content and assessment overview
The Pearson Edexcel Level 1/Level 2 GCSE (9–1) in Statistics consists of two externally-examined papers.
Students must complete all assessment in May/June in any single year, and students can only be entered for either Foundation tier or Higher tier.
Paper 1 (*Paper code: 1ST0/1F and 1ST0/1H)
Written examination: 1 hour and 30 minutes
50% of the qualification
80 marks
Content overview
1. The collection of data
2. Processing, representing and analysing data
3. Probability
Assessment overview
● Students must answer all questions
● The papers assess all content
● Questions on statistical methods, familiar and unfamiliar contexts and the component parts of the statistical enquiry cycle
● The papers contains short response, medium response and extended response questions
Paper 2 (*Paper code: 1ST0/2F and 1ST0/2H)
Written examination: 1 hour 30 minutes
50% of the qualification
80 marks
Content overview
1. The collection of data
2. Processing, representing and analysing data
3. Probability
Assessment overview
● Students must answer all questions
● The papers assess all content
● Questions on statistical methods, familiar and unfamiliar contexts and the component parts of the statistical enquiry cycle
● The papers contains short response, medium response and extended response questions
*See Appendix 7: Codes for a description of this code and all other codes relevant to this qualification.

Pearson Edexcel Level 1/Level 2 GCSE (9–1) in Statistics – Specification – Issue 2 – December 2017 © Pearson Education Limited 2017
5
2 Subject content
The Pearson Edexcel Level 1/Level 2 GCSE (9–1) in Statistics ensures that students develop the confidence and competence with statistical techniques to enable them to apply those techniques flexibly to solve statistical problems through a practical programme of study, with the expectation that:
● all students (both tiers) will develop confidence and competence with the content identified by the standard type
● all students will be assessed on the content identified by the standard type and the underlined type, and this content will be in both foundation tier and higher tier papers. The more highly-attaining students will develop confidence and competence with all this content
● only the more highly-attaining students (Higher tier only) will be assessed on the content identified by bold type; the highest-attaining students will develop confidence and competence with this content
● the distinction between standard, underlined and bold type applies to the content statements only, and not to assessment objectives or to the mathematical formulae in Appendix 1
● all students will develop an appreciation that different approaches, including the use of technology, may be appropriate at each stage of the statistical enquiry cycle, and that statistical conclusions are developed through an iterative process of retesting and refinement
● all students have the opportunity to apply statistical techniques within the framework of the statistical enquiry cycle using real data from authentic contexts.
Please see Appendix 3 for details of formulae in both GCSE Mathematics and Statistics which will not be given in the assessments, and Appendix 2 for details of prior knowledge.
Qualification aims and objectives
The aims and objectives of this qualification are to enable students to develop statistical fluency and understanding through:
● the use of statistical techniques in a variety of authentic investigations, using real-world data in contexts such as, but not limited to, populations, climate, sales etc.
● identifying trends through carrying out appropriate calculations and data visualisation techniques
● the application of statistical techniques across the curriculum, in subjects such as the sciences, social sciences, computing, geography, business and economics, and outside the classroom in the world in general
● critically evaluating data, calculations and evaluations that would be commonly encountered in their studies and in everyday life
● understanding how technology has enabled the collection, visualisation and analysis of large quantities of data to inform decision-making processes in public, commercial and academic sectors, including how technology can be used to generate diagrams and visualisations to represent data
● understand ways that data can be organised, processed and presented, including statistical measures to compare data, understanding the advantages of using technology to automate processing
● applying appropriate mathematical and statistical formulae, and building on prior knowledge.

Pearson Edexcel Level 1/Level 2 GCSE (9–1) in Statistics – Specification – Issue 2 – December 2017 © Pearson Education Limited 2017
6
Statistical enquiry cycle
The order of the content, for each tier, follows the order of the statistical enquiry cycle. It is important that practical investigations are part of a programme of study so that students have the opportunity to understand that different approaches, including the use of technology, may be appropriate at each stage of the statistical enquiry cycle, and that statistical conclusions are developed through an iterative process of testing and refinement.
1. Through using the statistical enquiry cycle students need to understand the importance of initial planning when designing a line of enquiry or investigation, including:
● defining a question or hypothesis (or hypotheses) to investigate
● deciding what data to collect and how to collect and record it giving reasons
● developing a strategy for how to process and represent data giving reasons.
2. Through using the statistical enquiry cycle students need to be able to recognise the constraints involved in sourcing appropriate data, including:
● when designing collection methods for primary data
● when researching sources for secondary data, including from reference publications, the internet and the media
● through appreciating the importance of acknowledging sources
● by recognising where issues of sensitivity may influence data availability.
3. Through using the statistical enquiry cycle students need to understand ways that data can be processed and presented, including:
● organising and processing data, including an understanding of how technology can be used
● generating diagrams and visualisations to represent the data, including an understanding of outputs generated by appropriate technology
● generating statistical measures to compare data, understanding the advantages of using technology to automate processing.
4. Through using the statistical enquiry cycle students need to understand that results must be interpreted with reference to the context of the problem, including:
● analysing/interpreting the diagrams and calculations/measures
● reaching conclusions that relate to the questions and hypotheses addressed
● making inferences and/or predictions
● discussing the reliability of findings.
5. Through using the statistical enquiry cycle students should show an understanding of the importance of clear and concise communication of findings and key ideas, and an awareness of target audience. They should also understand the importance of evaluating statistical work, including:
● identifying weaknesses in approach or representation
● suggesting improvements to processes or the presentation
● refining the processes to elicit further clarification of the initial hypothesis.
Any given question may assess one stage of the statistical enquiry cycle or more than one stage of the statistical enquiry cycle. For example, please see the Pearson Edexcel Level 1/Level 2 GCSE (9–1) in Statistics Sample Assessment Materials (SAMs) document – Foundation Paper 1 Question 11 and Higher Paper 1 Question 2.

Foundation tier content
Pearson Edexcel Level 1/Level 2 GCSE (9–1) in Statistics – Specification – Issue 2 – December 2017 © Pearson Education Limited 2017
7
Foundation tier content
A variety of contexts, including real-life data, will be used. (No detailed knowledge of those contexts will be expected.) Each item of content has a code, for example 1a.01, where 1 is ‘The collection of data’, a is ‘Planning’ and 01 is the numerical order of the content item.
What students need to learn: Guidance
1. The collection of data
(a) Planning
1a.01 Know that a hypothesis can be tested only through the appropriate collection and analysis of data.
Formal use of null hypothesis will not be required.
Specifying a hypothesis is expected, e.g. a hypothesis such as ‘as motor cycles get older their value is likely to go down’.
1a.02 Know the constraints that may be faced in designing an investigation to test a hypothesis including factors such as time, costs, ethical issues, confidentiality, convenience.
Give examples of these factors, e.g. salaries or difficulties in finding data.
1a.03 Determine proactive strategies to mitigate issues that might arise during the statistical enquiry process.
For example, dealing with difficulties in identifying the population, non-response issues or unexpected outcomes.
(b) Types of data
1b.01 Know and apply terms used to describe different types of data that can be collected for statistical analysis: raw data, quantitative, qualitative, categorical, ordinal, discrete, continuous, ungrouped, grouped, bivariate.
Use of correct statistical terminology to describe given data is expected. Know that more than one term may be appropriate.
Identification of variables relevant to an investigation or hypothesis is expected.
1b.02 Know the advantages and implications of merging data into more general categories, and of grouping numerical data into class intervals.
Expected to know class width, and implications of grouping data, e.g. loss of accuracy in both calculations and presentations.
1b.03 Know and apply the terms explanatory (independent) variables and response (dependent) variables.
Know that on a scatter diagram the explanatory (independent) variable should be on the ‘x’ axis.
1b.04 Know the difference between primary and secondary data. Including advantages and disadvantages of each.
Consideration of the reliability and accuracy of the data (including issues of rounding) and the recognition of possible constraints in accessing the data is expected.

Foundation tier content
Pearson Edexcel Level 1/Level 2 GCSE (9–1) in Statistics – Specification – Issue 2 – December 2017 © Pearson Education Limited 2017
8
What students need to learn: Guidance
(c) Population and sampling
1c.01 Know the difference between population, sample frame and sample. Identify a population, and suggest a suitable sampling frame.
1c.02 Know that ‘population’ can have different meanings within a stated context.
For example, all employees in an office; all females in the UK; all items produced in a factory.
1c.03 Know reasons for employing judgement sampling or opportunity (convenience) sampling, and the associated risks of bias when these techniques are used.
Including use of cluster sampling and quota sampling. Reasons, including factors such as convenience, cost and time.
1c.04 Know appropriate sampling techniques in the context of the problem to avoid bias.
Understand random, systematic, and quota sampling.
Including advantages and disadvantages of each technique. e.g. Know that systematic and quota sampling techniques are generally non-random. Know that the period of systematic sampling may coincide with a period occurring in the data.
1c.05 Know the key features of a simple random sample and demonstrate understanding of how different techniques, both physical and electronic, are used to select random members from a population: including, but not limited to, dice, cards, random number lists, and calculator functions.
Be aware that all items in the population should have the same likelihood of inclusion in a simple random sample.
Selection of items for a sample may be required, including dealing with issues such as repeated random numbers and random numbers out of range.
1c.06 Use stratification and know when this is appropriate before sampling takes place.
Identify suitable strata, e.g. gender or age group.
Including the calculation of appropriate strata sizes. Stratifying by one category.
(d) Collecting data
1d.01 a. Know that data can be collected from different sources: experimental (laboratory, field and natural), simulation, questionnaires, observation, reference, census, population and sampling.
b. Know that sources of secondary data should be acknowledged.
The design of data collection sheets is expected.
Simulations may include use of random numbers.
1d.02 Know the importance of reliability and validity with regard to collected data.
Reliability is the extent to which repeated measurements yield similar results.
Validity is the extent to which a test measures what was intended.

Foundation tier content
Pearson Edexcel Level 1/Level 2 GCSE (9–1) in Statistics – Specification – Issue 2 – December 2017 © Pearson Education Limited 2017
9
What students need to learn: Guidance
(d) Collecting data continued
1d.03 Determine factors that may lead to bias, including issues of sensitivity of the content matter, and know how to minimise data distortion.
1d.04 Know the key features to be considered when planning data collection: leading questions, avoiding biased sources, time factors, open/closed questions, different types of interview technique.
The design of suitable questions and data collection sheets is expected.
Awareness of the advantages and disadvantages of data collection techniques.
The rationale behind pilots for questionnaires and pre-tests for experiments should be known.
1d.05 Know and demonstrate understanding of techniques used to deal with problems that may arise with collected data.
For example missing data, incorrect formats, non-responses, incomplete responses, etc.
1d.06 Know why data may need to be ‘cleaned’ before further processing, including issues that arise on spreadsheets and apply techniques to clean data in context.
In the pre-processing stage: consideration of genuine and other outliers and anomalies, or removal of extraneous symbols or notation when using technology (e.g. spreadsheets or statistical software). See also 2c.03.
1d.07 Know the importance of identifying and controlling extraneous variables.
2. Processing, representing and analysing data
(a) Tabulation, diagrams and representation
2a.01 Represent data sets pictorially using calculated key values as necessary, and interpret and compare data sets displayed pictorially: tabulation, tally, pictogram, pie chart, stem and leaf diagram, Venn diagram.
Use of two-way tables is expected.
Diagrams should have a key where appropriate.
Stem and leaf diagrams need to be ordered to allow identification of key values.

Foundation tier content
Pearson Edexcel Level 1/Level 2 GCSE (9–1) in Statistics – Specification – Issue 2 – December 2017 © Pearson Education Limited 2017
10
What students need to learn: Guidance
(a) Tabulation, diagrams and representation continued
2a.02 Interpret and compare data sets displayed pictorially: population pyramid, choropleth map.
2a.03 Represent data sets graphically using calculated key values as necessary, and interpret and compare data sets displayed graphically: bar charts, line graphs, time series, scatter diagrams, bar line (vertical line) charts, frequency polygons, cumulative frequency (discrete and grouped) charts, histograms (equal class width), and box plots.
Use of multiple and composite (including percentage composite) bar charts is expected.
No distinction will be made between cumulative frequency polygons (other than step polygons) and curves, while frequency polygons could be open or closed.
Note: the ‘y’ axis of histograms may be labelled ‘frequency’ where equal class widths are used. (Frequency density is Higher tier only.)
2a.04 (Higher tier topic only; not assessed at Foundation tier)
2a.05 Justify the appropriate format and produce accurate visualisation of data.
Be familiar with the capabilities and advantages of using statistical software and spreadsheets to produce suitable diagrams and graphs, and know to avoid the inappropriate use of such technology.
Appropriate format could take account of target audience. e.g. realising when a simple visualisation of data is appropriate, and when a more technical visualisation is appropriate.
2a.06 Recognise where errors in construction lead to graphical misrepresentation, including but not limited to incorrect scales, truncated axis, distorted sizing.
Correct use of class boundaries is required.
Understand the possible distortion when interpreting 3D representations.
2a.07 Extract and calculate corresponding values in order to compare data sets that have been presented in different formats and be able to present the same information in multiple formats.
Including extracting information from spreadsheets, lists of statistics or graphs produced by statistical software.
2a.08 Select and justify appropriate form of representation with regard to the nature of data.
e.g. scatter diagrams for bivariate data, histograms for grouped data, etc

Foundation tier content
Pearson Edexcel Level 1/Level 2 GCSE (9–1) in Statistics – Specification – Issue 2 – December 2017 © Pearson Education Limited 2017
11
What students need to learn: Guidance
(a) Tabulation, diagrams and representation continued
2a.09 Determine skewness from data by inspection. For example, know that positive skew could be indicated by:
● mean > median > mode
● median − LQ < UQ − median
2a.10 Interpret a distribution of data in terms of skewness identified from inspection.
For example, with positive skew know that values above the median have a greater spread than values below the median.
(b) Measures of central tendency
2b.01 Calculate averages for discrete and grouped data: mode, median, arithmetic mean.
The term ‘mean’ should be understood to be ‘arithmetic mean’.
Calculations of mean and median for grouped data will include equal class widths. Linear interpolation for median is expected.
Use of class midpoints (mid-interval values) to find an estimate of the mean of grouped data is expected.
Understand the effect on the mean, mode and median of changes in the data, including the addition or withdrawal of a population or sample member.
Understand the effect of transformations of the data on the mean, mode and median. (Transformations will be restricted to simple scaling and translations.)
2b.02 Justify the rationale for selecting appropriate types of average in context.
e.g. mode is appropriate when considering demand for items of clothing in different sizes, or when data is non-numeric;
e.g. median is more appropriate than mean if data is skewed; etc
e.g. mean is appropriate to take account of all data
2b.03 Compare different data sets using appropriate calculated or given measure of central tendency: mode, modal class, median and mean.
An awareness of which measure is more appropriate to use is expected, e.g. selecting the appropriate values from those produced by statistical software.

Foundation tier content
Pearson Edexcel Level 1/Level 2 GCSE (9–1) in Statistics – Specification – Issue 2 – December 2017 © Pearson Education Limited 2017
12
What students need to learn: Guidance
(c) Measures of dispersion
2c.01 Calculate different measures of spread: range, quartiles, interquartile range (IQR), percentiles.
Any value of n may be expected, so that required bounds (e.g. quartiles) may or may not be values in the data set. Alternative methods will be acceptable provided that the method used is clear from the working. (e.g. if the median lies between two data values the arithmetic mean of these two values may be used.)
2c.02 Identify outliers by inspection.
2c.03 Comment on outliers with reference to the original data. Know that outliers may be genuine unusual values or may be the result of errors in recording data.
2c.04 Compare different data sets using appropriate calculated or given measure of spread: range, interquartile range (IQR), percentiles.
An awareness of which measure is more appropriate to use is expected, e.g. selecting the appropriate values from those produced by statistical software.
2c.05 Use calculated or given median and interquartile range (IQR) to compare data samples and to compare sample data with population data.
The appropriate pairing of a measure of central tendency and a measure of dispersion is expected. (e.g. use of mean with IQR is not appropriate.)
2c.06 (Higher tier topic only; not assessed at Foundation tier)
(d) Further summary statistics
2d.01 Use different types of index numbers in context, including but not limited to retail price index (RPI), consumer price index (CPI) and gross domestic product (GDP).
Calculation and interpretation of simple index numbers is expected.
2d.02 Interpret data related to rates of change over time (including, but not limited to, percentage change, births, deaths, house prices, and unemployment) when given in graphical form. Calculate and interpret rates of change over time from tables using context specific formula.
Making predictions using rates of change formulae is expected,
e.g.
crude birth rate = number of births 1000
total population×
Formula will be given.

Foundation tier content
Pearson Edexcel Level 1/Level 2 GCSE (9–1) in Statistics – Specification – Issue 2 – December 2017 © Pearson Education Limited 2017
13
What students need to learn: Guidance
(e) Scatter diagrams and correlation
2e.01 Know and apply vocabulary of correlation: positive, negative, zero, causation, association, interpolation and extrapolation.
Know that a dependent variable should be plotted on the ‘y’ axis.
2e.02 Describe and make comparisons of correlation by inspection: strong or weak.
e.g. Informal interpretation using scatter diagrams.
2e.03 Know that correlation does not necessarily imply causation. Be aware of spurious correlation. e.g. car ownership and birth rate in a number of cities may show correlation as both variables are likely to be affected by population size of the cities.
2e.04 Determine line of best fit by eye, by drawing through a calculated
double mean point ),( yx
Awareness of issues relating to interpolation and extrapolation, and the interpretation of gradient and intercept are expected.
Non-linear models will not be tested.
2e.05 (Higher tier topic only; not assessed at Foundation tier)
2e.06 Interpret given Spearman’s rank correlation coefficient in the context of the problem.
Be aware that values range on a scale from -1 to +1. Know that values closer to these limits indicate ‘stronger’ correlation, but no formal interpretation of strength of correlation is expected.
e.g. in comparing ranks given by two judges in a competition know that +1 means perfect agreement, -1 means complete opposite ranks, and 0 means no agreement between ranks given.
2e.07 (Higher tier topic only; not assessed at Foundation tier)
2e.08 (Higher tier topic only; not assessed at Foundation tier)

Foundation tier content
Pearson Edexcel Level 1/Level 2 GCSE (9–1) in Statistics – Specification – Issue 2 – December 2017 © Pearson Education Limited 2017
14
What students need to learn: Guidance
(f) Time series
2f.01 Identify trends in data through inspection and by calculation of 4 point moving averages.
Drawing a trend line either by eye or by using averages.
Interpretation of the gradient of trend lines is expected.
2f.02 Interpret seasonal and cyclic trends in context.
(g) Quality assurance
2g.01 (Higher tier topic only; not assessed at Foundation tier)
2g.02 (Higher tier topic only; not assessed at Foundation tier)
(h) Estimation
2h.01 Use calculated or given summary statistical data to make estimates of population characteristics. Use samples to estimate population mean. Use sample data to predict population proportions.
e.g. predict that approximately half the population will be above the sample median.
2h.02 (Higher tier topic only; not assessed at Foundation tier)
2h.03 Know that sample size has an impact on reliability and replication.
e.g. know that results/conclusions are likely to be more reliable if based on larger samples.

Foundation tier content
Pearson Edexcel Level 1/Level 2 GCSE (9–1) in Statistics – Specification – Issue 2 – December 2017 © Pearson Education Limited 2017
15
What students need to learn: Guidance
3. Probability
3p.01 Use collected data to calculate estimates of probabilities. Use of relative frequency.
3p.02 Compare the probability of different possible outcomes using the 0–1 or 0–100% scale and statements of likelihood.
Locate events on a probability scale and use the language of likelihood (e.g. certain, impossible, evens, likely, very unlikely, etc.)
3p.03 Use probability values to calculate expected frequency of a specified characteristic within a sample or population.
Given total frequency, use probability as a proportion to find expected frequency.
3p.04 Use collected data and calculated probabilities to determine and interpret relative risks and absolute risks, and express in terms of expected frequencies in groups.
e.g. use driving test pass rate data with Instructor A and Instructor B to determine the probability (absolute risk) of passing with A, or determine the relative probability (relative risk) of passing with A compared with B.
=risk of passing with A
Relative risk risk of passing with B
3p.05 Compare experimental data with theoretical predictions to identify possible bias within the experimental design.
e.g. consider whether a set of dice rolls suggest that the dice is fair
3p.06 Recognise that experimental probability will tend towards theoretical probability as the number of trials increases when all variables are random.
Understand that increasing sample size generally leads to better estimates of probability and population parameters.
Students may be expected to estimate probabilities from relative frequency diagrams and frequency tables.
3p.07 Use two-way tables, sample space diagrams, tree diagrams and Venn diagrams to represent all the different outcomes possible for at most three events.
Use of these for conditional probability is expected. (See 3p.09.)
Sample space diagrams may include listing or tabulating all outcomes of single events, or successive events, in a systematic way.
Understand the terms mutually exclusive and exhaustive.
Know the addition law for two mutually exclusive events:
P(A or B) = P(A) + P(B)

Foundation tier content
Pearson Edexcel Level 1/Level 2 GCSE (9–1) in Statistics – Specification – Issue 2 – December 2017 © Pearson Education Limited 2017
16
What students need to learn: Guidance
3. Probability continued
3p.08 Know and apply the formal notation for independent events. Understand the difference between independent and conditional events.
The multiplication law for independent events must be known:
P(A and B) = P(A) × P(B)
Know that for independent events:
P( ) P( )A B A= and P( ) P( )B A B=
3p.09 Know and apply the formal notation for conditional probability. The formula for conditional probability must be known:
P( and )P( ) P( )
A BB A A=
3p.10 to 3p.13
(Higher tier topics only; not assessed at Foundation tier)
Higher tier content
Pearson Edexcel Level 1/Level 2 GCSE (9–1) in Statistics – Specification – Issue 2 – December 2017 © Pearson Education Limited 2017
17
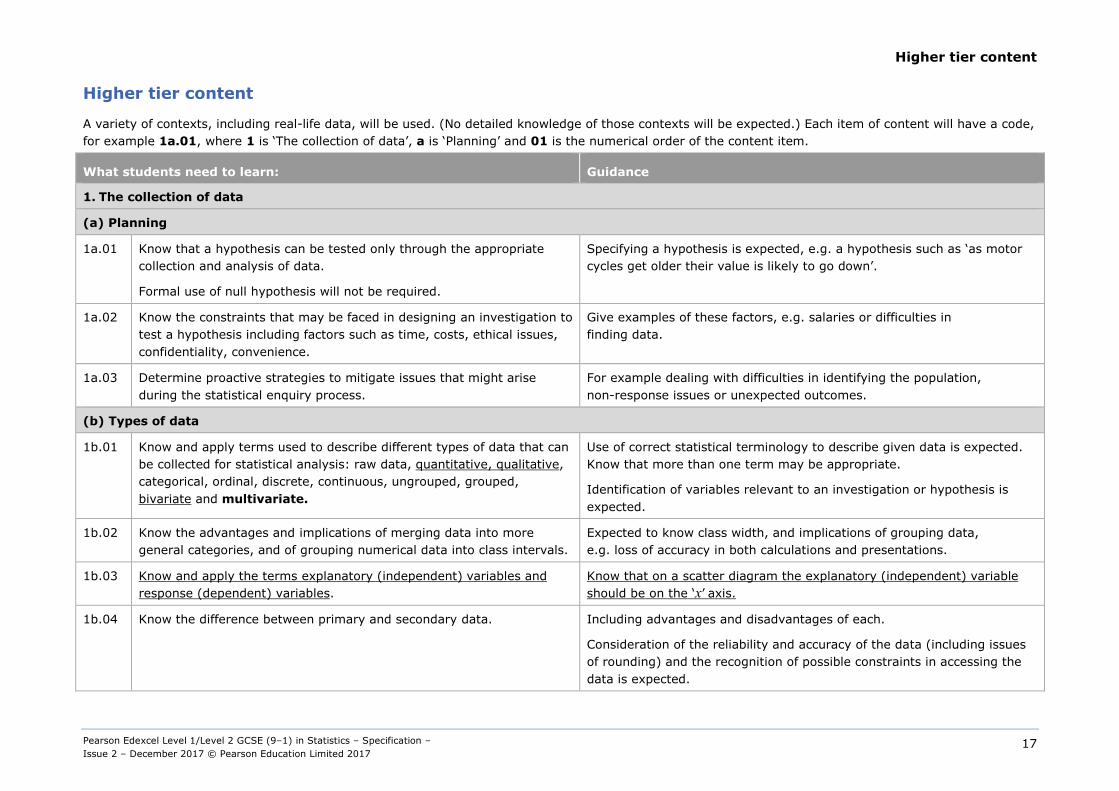
Higher tier content
A variety of contexts, including real-life data, will be used. (No detailed knowledge of those contexts will be expected.) Each item of content will have a code, for example 1a.01, where 1 is ‘The collection of data’, a is ‘Planning’ and 01 is the numerical order of the content item.
What students need to learn: Guidance
1. The collection of data
(a) Planning
1a.01 Know that a hypothesis can be tested only through the appropriate collection and analysis of data.
Formal use of null hypothesis will not be required.
Specifying a hypothesis is expected, e.g. a hypothesis such as ‘as motor cycles get older their value is likely to go down’.
1a.02 Know the constraints that may be faced in designing an investigation to test a hypothesis including factors such as time, costs, ethical issues, confidentiality, convenience.
Give examples of these factors, e.g. salaries or difficulties in finding data.
1a.03 Determine proactive strategies to mitigate issues that might arise during the statistical enquiry process.
For example dealing with difficulties in identifying the population, non-response issues or unexpected outcomes.
(b) Types of data
1b.01 Know and apply terms used to describe different types of data that can be collected for statistical analysis: raw data, quantitative, qualitative, categorical, ordinal, discrete, continuous, ungrouped, grouped, bivariate and multivariate.
Use of correct statistical terminology to describe given data is expected. Know that more than one term may be appropriate.
Identification of variables relevant to an investigation or hypothesis is expected.
1b.02 Know the advantages and implications of merging data into more general categories, and of grouping numerical data into class intervals.
Expected to know class width, and implications of grouping data, e.g. loss of accuracy in both calculations and presentations.
1b.03 Know and apply the terms explanatory (independent) variables and response (dependent) variables.
Know that on a scatter diagram the explanatory (independent) variable should be on the ‘x’ axis.
1b.04 Know the difference between primary and secondary data. Including advantages and disadvantages of each.
Consideration of the reliability and accuracy of the data (including issues of rounding) and the recognition of possible constraints in accessing the data is expected.
Higher tier content
Pearson Edexcel Level 1/Level 2 GCSE (9–1) in Statistics – Specification – Issue 2 – December 2017 © Pearson Education Limited 2017
18
What students need to learn: Guidance
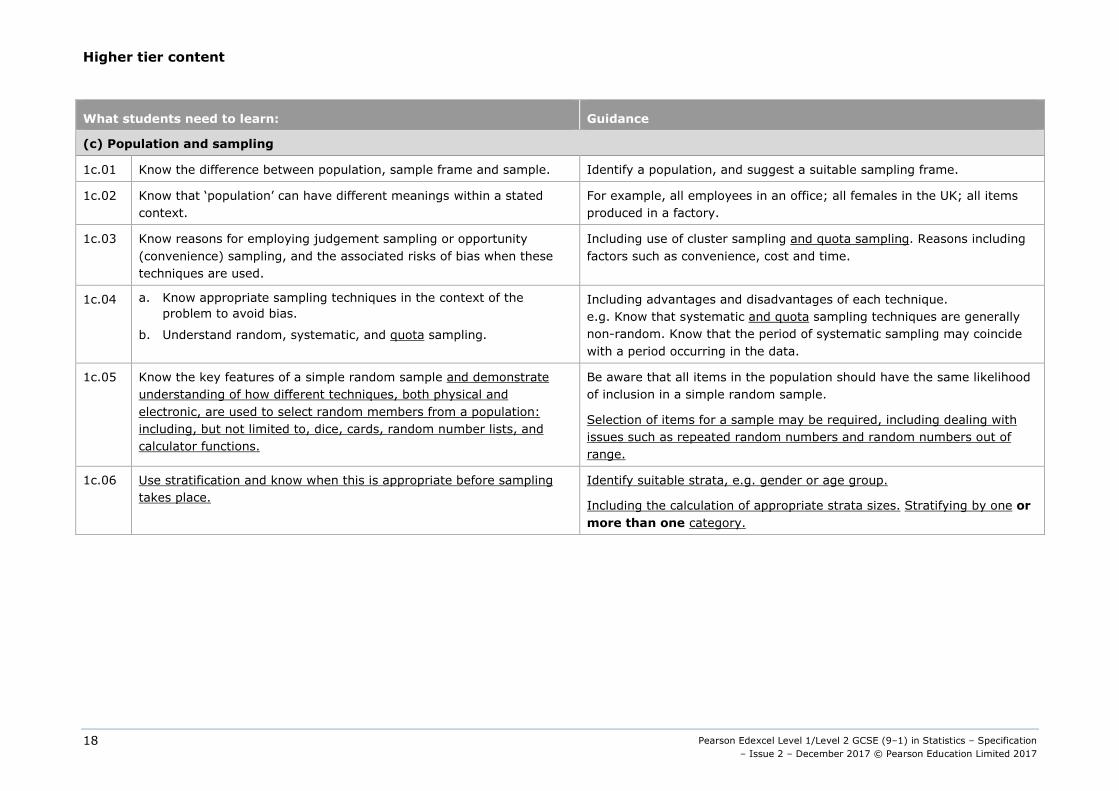
(c) Population and sampling
1c.01 Know the difference between population, sample frame and sample. Identify a population, and suggest a suitable sampling frame.
1c.02 Know that ‘population’ can have different meanings within a stated context.
For example, all employees in an office; all females in the UK; all items produced in a factory.
1c.03 Know reasons for employing judgement sampling or opportunity (convenience) sampling, and the associated risks of bias when these techniques are used.
Including use of cluster sampling and quota sampling. Reasons including factors such as convenience, cost and time.
1c.04 a. Know appropriate sampling techniques in the context of the problem to avoid bias.
b. Understand random, systematic, and quota sampling.
Including advantages and disadvantages of each technique. e.g. Know that systematic and quota sampling techniques are generally non-random. Know that the period of systematic sampling may coincide with a period occurring in the data.
1c.05 Know the key features of a simple random sample and demonstrate understanding of how different techniques, both physical and electronic, are used to select random members from a population: including, but not limited to, dice, cards, random number lists, and calculator functions.
Be aware that all items in the population should have the same likelihood of inclusion in a simple random sample.
Selection of items for a sample may be required, including dealing with issues such as repeated random numbers and random numbers out of range.
1c.06 Use stratification and know when this is appropriate before sampling takes place.
Identify suitable strata, e.g. gender or age group.
Including the calculation of appropriate strata sizes. Stratifying by one or more than one category.

Higher tier content
Pearson Edexcel Level 1/Level 2 GCSE (9–1) in Statistics – Specification – Issue 2 – December 2017 © Pearson Education Limited 2017
19
What students need to learn: Guidance
(d) Collecting data
1d.01 a. Know that data can be collected from different sources: experimental (laboratory, field and natural), simulation, questionnaires, observation, reference, census, population and sampling.
b. Know that sources of secondary data should be acknowledged.
The design of data collection sheets is expected.
Simulations may include use of random numbers.
1d.02 Know the importance of reliability and validity with regards to collected data.
Reliability is the extent to which repeated measurements yield similar results.
Validity is the extent to which a test measures what was intended.
1d.03 Determine factors that may lead to bias, including issues of sensitivity of the content matter, level of control and know how to minimise data distortion.
Know the ‘random response’ technique for sensitive questions.
1d.04 Know the key features to be considered when planning data collection: leading questions, avoiding biased sources, time factors, open/closed questions, different types of interview technique.
The design of suitable questions and data collection sheets is expected.
Awareness of the advantages and disadvantages of data collection techniques.
The rationale behind pilots for questionnaires and pre-tests for experiments should be known.
1d.05 Know and demonstrate understanding of techniques used to deal with problems that may arise with collected data.
For example, missing data, incorrect formats, non-responses, incomplete responses, etc.
1d.06 Know why data may need to be ‘cleaned’ before further processing, including issues that arise on spreadsheets and apply techniques to clean data in context.
In the pre-processing stage: consideration of genuine and other outliers and anomalies, or removal of extraneous symbols or notation when using technology (e.g. spreadsheets, statistical software). See also 2c.03.
1d.07 Know the importance of identifying and controlling extraneous variables and the use of control groups.
Understand the advantage of using matched pairs when using control groups.

Higher tier content
Pearson Edexcel Level 1/Level 2 GCSE (9–1) in Statistics – Specification – Issue 2 – December 2017 © Pearson Education Limited 2017
20
What students need to learn: Guidance
2. Processing, representing and analysing data
(a) Tabulation, diagrams and representation
2a.01 Represent data sets pictorially using calculated key values as necessary, and interpret and compare data sets displayed pictorially: tabulation, tally, pictogram, pie chart, stem and leaf diagram, Venn diagram.
Use of two-way tables is expected.
Diagrams should have a key where appropriate.
Stem and leaf diagrams need to be ordered to allow identification of key values.
2a.02 Interpret and compare data sets displayed pictorially: population pyramid, choropleth map, comparative pie chart, comparative 2D representations, comparative 3D representations.
The relationship between area and frequency, and calculations of radius, for comparative pie charts is expected.
2a.03 Represent data sets graphically using calculated key values as necessary, and interpret and compare data sets displayed graphically: bar charts, line graphs, time series, scatter diagrams, bar line (vertical line) charts, frequency polygons, cumulative frequency (discrete and grouped) charts, histograms (equal class width), and box plots.
Use of multiple and composite (including percentage composite) bar charts is expected.
No distinction will be made between cumulative frequency polygons (other than step polygons) and curves, while frequency polygons could be open or closed.
Note: the ‘y’ axis of histograms may be labelled ‘frequency’ where equal class widths are used.
2a.04 Calculate and use frequency density to draw histograms (unequal class width), and interpret and compare data sets displayed in histograms (unequal class width).
Students are required to know the formula for frequency density (see Appendix 2).
Correct labelling of frequency density axis or use of an appropriate key) will be expected. (But see note in 2a.03)
Use of a standard class width with appropriate units will be acceptable.

Higher tier content
Pearson Edexcel Level 1/Level 2 GCSE (9–1) in Statistics – Specification – Issue 2 – December 2017 © Pearson Education Limited 2017
21
What students need to learn: Guidance
(a) Tabulation, diagrams and representation continued
2a.05 Justify the appropriate format and produce accurate visualisation of data.
Be familiar with the capabilities and advantages of using statistical software and spreadsheets to produce suitable diagrams and graphs, and know to avoid the inappropriate use of such technology. Appropriate format could take account of target audience. e.g. realising when a simple visualisation of data is appropriate, and when a more technical visualisation is appropriate.
2a.06 Recognise where errors in construction lead to graphical misrepresentation, including but not limited to incorrect scales, truncated axis, distorted sizing or the misuse of formula when calculating the frequency densities of histograms.
Correct use of class boundaries is required, including in the calculation of frequency densities.
Understand the possible distortion when interpreting 3D representations.
2a.07 Extract and calculate corresponding values in order to compare data sets that have been presented in different formats and be able to present the same information in multiple formats.
Including extracting information from spreadsheets, lists of statistics or graphs produced by statistical software.
2a.08 Select and justify appropriate form of representation with regard to the nature of data.
e.g. scatter diagrams for bivariate data, histograms for grouped data, etc.
2a.09 Determine skewness from data by inspection and by calculation.
Use of: deviation standard
median)3(meanSkew
−=
Formula will be given in the formulae sheet.
For example, know that, for positive skew could be indicated by:
● mean > median > mode
● median − LQ < UQ − median
2a.10 Interpret a distribution of data in terms of skewness identified from inspection or calculation.
For example, with positive skew know that values above the median have a greater spread than values below the median.

Higher tier content
Pearson Edexcel Level 1/Level 2 GCSE (9–1) in Statistics – Specification – Issue 2 – December 2017 © Pearson Education Limited 2017
22
What students need to learn: Guidance
(b) Measures of central tendency
2b.01 Calculate averages for discrete and grouped data: mode, median, arithmetic mean, weighted mean, geometric mean, mean seasonal variation.
The term ‘mean’ should be understood to be ‘arithmetic mean’ unless ‘geometric mean’ is stated.
Calculations of mean and median for grouped data will include equal or unequal class widths. Linear interpolation for median is expected.
Use of class midpoints (mid-interval values) to estimate mean of grouped data is expected.
Understand the effect on the mean, mode and median of changes in the data, including the addition or withdrawal of a population or sample member.
Understand the effect of transformations of the data on the mean, mode and median. (Transformations will be restricted to simple scaling and translations.)
2b.02 Justify the rationale for selecting appropriate types of average in context.
e.g. mode is appropriate when considering demand for items of clothing in different sizes, or when data is non-numeric;
e.g. median more appropriate than mean if data is skewed; etc
e.g. mean is appropriate to take account of all data and allows calculation of standard deviation

Higher tier content
Pearson Edexcel Level 1/Level 2 GCSE (9–1) in Statistics – Specification – Issue 2 – December 2017 © Pearson Education Limited 2017
23
What students need to learn: Guidance
(b) Measures of central tendency continued
2b.03 Compare different data sets using appropriate calculated or given measure of central tendency: mode, modal class, median and mean.
An awareness of which measure is more appropriate to use is expected, e.g. selecting the appropriate values from those produced by statistical software.
(c) Measures of dispersion
2c.01 Calculate different measures of spread: range, quartiles, interquartile range (IQR), percentiles, interpercentile range, interdecile range and standard deviation.
For example, 10th to 90th interpercentile range.
Any value of n may be expected, so that required bounds (e.g. quartiles) may or may not be values in the data set. Alternative methods will be acceptable provided that the method used is clear from the working. (e.g. if the median lies between two data values the arithmetic mean of these two values may be used.)
For standard deviation only the formulae for a set of values are given. Students will need to know how to apply these to grouped data, i.e.
Standard deviation = ∑
∑ −
fxxf 2)(
or
22
−∑∑
∑∑
ffx
ffx
2c.02 Identify outliers by inspection and using appropriate calculations. Calculations are expected to be known:
Small outlier is
< LQ – 1.5 × IQR
Large outlier is
> UQ + 1.5 × IQR
Or outlier is outside
µ ± 3σ

Higher tier content
Pearson Edexcel Level 1/Level 2 GCSE (9–1) in Statistics – Specification – Issue 2 – December 2017 © Pearson Education Limited 2017
24
What students need to learn: Guidance
(c) Measures of dispersion continued
2c.03 Comment on outliers with reference to the original data. Know that outliers may be genuine unusual values or may be the result of errors in recording data.
Outlier boundaries may need to be calculated.
2c.04 Compare different data sets using appropriate calculated or given measure of spread: range, interquartile range (IQR), percentiles and standard deviation.
An awareness of which measure is more appropriate to use is expected, e.g. selecting the appropriate values from those produced by statistical software.
2c.05 Use calculated or given median and interquartile range (IQR) or interpercentile range or interdecile range or mean and standard deviation to compare data samples and to compare sample data with population data.
The appropriate pairing of a measure of central tendency and a measure of dispersion is expected. (e.g. use of mean with IQR is not appropriate.)
2c.06 Use calculated or given means and standard deviation to standardise and interpret data collected in two comparable samples.
Formulae for standard deviation will be given in the formulae sheet.
Know how to standardise using these values:
standardised score = −x µσ (Formula will not be given.)
(d) Further summary statistics
2d.01 Use different types of index and weighted index numbers in context, including but not limited to retail price index (RPI), consumer price index (CPI) and gross domestic product (GDP).
Calculation and interpretation of simple and chain based index numbers is expected.

Higher tier content
Pearson Edexcel Level 1/Level 2 GCSE (9–1) in Statistics – Specification – Issue 2 – December 2017 © Pearson Education Limited 2017
25
What students need to learn: Guidance
(d) Further summary statistics continued
2d.02 Interpret data related to rates of change over time (including, but not limited to, percentage change, births, deaths, house prices, and unemployment) when given in graphical form. Calculate and interpret rates of change over time from tables using context specific formula.
Making predictions using rates of change formulae is expected,
e.g.
crude birth rate = number of births 1000
total population×
standardised birth rate = crude ratestandard population
1000 ×
Formulae will be given.
(e) Scatter diagrams and correlation
2e.01 Know and apply vocabulary of correlation: positive, negative, zero, causation, association, interpolation and extrapolation.
Know that a dependent variable should be plotted on the ‘y’ axis.
2e.02 Describe and make comparisons of correlation by inspection: strong or weak.
e.g. Informal interpretation using scatter diagrams.
2e.03 Know that correlation does not necessarily imply causation and multiple factors may interact.
Be aware of spurious correlation. e.g. car ownership and birth rate in a number of cities may show correlation as both variables are likely to be affected by population size of the cities.
2e.04 Determine line of best fit by eye, by drawing through a calculated
double mean point ),( yx and by using the equation of the regression line.
The linear regression line of the form y = a + bx
Awareness of issues relating to interpolation and extrapolation, and the interpretation of gradient and intercept are expected.
Non-linear models will not be tested.

Higher tier content
Pearson Edexcel Level 1/Level 2 GCSE (9–1) in Statistics – Specification – Issue 2 – December 2017 © Pearson Education Limited 2017
26
What students need to learn: Guidance
(e) Scatter diagrams and correlation continued
2e.05 Apply formula to determine Spearman’s rank correlation coefficient. Values found using calculator functions will be permissible
Formula will be given in the formulae sheet.
Tied ranks will not be tested. (Scientific calculator functions are sufficient).
2e.06 Interpret calculated or given Spearman’s rank correlation coefficient in the context of the problem.
Be aware that values range on a scale from -1 to +1. Know that values closer to these limits indicate ‘stronger’ correlation, but no formal interpretation of strength of correlation is expected.
e.g. in comparing ranks given by two judges in a competition know that +1 means perfect agreement, -1 means complete opposite ranks, and 0 means no agreement between ranks given.
2e.07 Interpret given Pearson’s product moment correlation coefficient (PMCC) in the context of the problem.
Be aware that values range on a scale from -1 to +1. Know that values closer to these limits indicate ‘stronger’ linear correlation, but no formal interpretation of strength of correlation is expected.
Know that +1 means perfect linear positive correlation, -1 means perfect linear negative correlation, and 0 means no linear correlation.
The calculation of PMCC will not be required.
2e.08 Understand the distinction between Spearman’s rank correlation coefficient and Pearson’s product moment correlation coefficient (PMCC).
e.g. recognise the relative strengths of rank correlation and product moment correlation on a scatter graph.
The PMCC measures the strength of linear correlation.
The calculation of PMCC will not be required.
e.g. if there is positive non-linear correlation both coefficients will be positive but Spearman’s coefficient will be greater than PMCC.

Higher tier content
Pearson Edexcel Level 1/Level 2 GCSE (9–1) in Statistics – Specification – Issue 2 – December 2017 © Pearson Education Limited 2017
27
What students need to learn: Guidance
(f) Time series
2f.01 Identify trends in data through inspection and by calculation of 4 or other determined appropriate point moving averages.
Drawing a trend line either by eye or by using averages.
Interpretation of the gradient of trend lines is expected.
2f.02 Interpret seasonal and cyclic trends in context.
Use such trends to make predictions.
Demonstrating the calculation of predictions, using average seasonal effect, is expected. Awareness of the dangers of extrapolation when making predictions is expected.
(g) Quality assurance
2g.01 Know that a set of sample means are more closely distributed than individual values from the same population.
e.g. the set of mean heights from each class in a school will show less variation than the set of heights of all students in the school.
2g.02 Use action and warning lines in quality assurance sampling applications.
Control charts used for sample mean, median or range is expected.
For example, in a manufacturing process to test that certain measurements are within allowable limits.
Understand that almost all means, medians or ranges fall inside the action lines (action limits), and only 1 in 20 fall outside the warning lines (warning limits).
Know that warning lines are set at ±2 standard deviations of the sample mean from the expected value, and action lines are set at ±3 standard deviations of the sample mean from the expected value.
Know the action to be taken if a sample value falls outside each type of limit.

Higher tier content
Pearson Edexcel Level 1/Level 2 GCSE (9–1) in Statistics – Specification – Issue 2 – December 2017 © Pearson Education Limited 2017
28
What students need to learn: Guidance
(h) Estimation
2h.01 Use calculated or given summary statistical data to make estimates of population characteristics. Use samples to estimate population mean. Use sample data to predict population proportions.
e.g. predict that approximately half the population will be above the sample median.
2h.02 Apply Petersen capture recapture formula to calculate an estimate of the size of a population.
Know the assumptions needed and be familiar with their appropriateness in practice.
2h.03 Know that sample size has an impact on reliability and replication. e.g. know that results/conclusions are likely to be more reliable if based on larger samples.
3. Probability
3p.01 Use collected data to calculate estimates of probabilities. Use of relative frequency.
3p.02 Compare the probability of different possible outcomes using the 0–1 or 0–100% scale and statements of likelihood.
Locate events on a probability scale and use the language of likelihood (e.g. certain, impossible, evens, likely, very unlikely, etc.).
3p.03 Use probability values to calculate expected frequency of a specified characteristic within a sample or population.
Given total frequency, use probability as a proportion to find expected frequency.
3p.04 Use collected data and calculated probabilities to determine and interpret relative risks and absolute risks, and express in terms of expected frequencies in groups.
e.g. use driving test pass rate data with Instructor A and Instructor B to determine the probability (absolute risk) of passing with A, or determine the relative probability (relative risk) of passing with A compared with B.
risk of passing with ARelative risk
risk of passing with B =
3p.05 Compare experimental data with theoretical predictions to identify possible bias within the experimental design.
e.g. consider whether a set of dice rolls suggests that the dice is fair.

Higher tier content
Pearson Edexcel Level 1/Level 2 GCSE (9–1) in Statistics – Specification – Issue 2 – December 2017 © Pearson Education Limited 2017
29
What students need to learn: Guidance
3. Probability continued
3p.06 Recognise that experimental probability will tend towards theoretical probability as the number of trials increases when all variables are random.
Understand that increasing sample size generally leads to better estimates of probability and population parameters.
Students may be expected to estimate probabilities from relative frequency diagrams and frequency tables.
3p.07 Use two-way tables, sample space diagrams, tree diagrams and Venn diagrams to represent all the different outcomes possible for at most three events.
Use of these for conditional probability is expected. (See 3p.09.)
Sample space diagrams may include listing or tabulating all outcomes of single events, or successive events, in a systematic way.
Understand the terms mutually exclusive and exhaustive.
Know the addition law for two mutually exclusive events:
P(A or B) = P(A) + P(B)
Know the general addition law:
P(A or B) = P(A) + P(B) − P(A and B)
3p.08 Know and apply the formal notation for independent events. Understand the difference between independent and conditional events.
The multiplication law for independent events must be known:
P(A and B) = P(A) × P(B)
Know that for independent events:
P( ) P( )A B A= and P( ) P( )B A B=
3p.09 Know and apply the formal notation for conditional probability. The formula for conditional probability must be known:
P( and )P( )
P( ) A BB A
A=

Higher tier content
Pearson Edexcel Level 1/Level 2 GCSE (9–1) in Statistics – Specification – Issue 2 – December 2017 © Pearson Education Limited 2017
30
What students need to learn: Guidance
3. Probability continued
3p.10 Comment on the differences between experimental and theoretical values in terms of possible bias. Formal tests of significance will not be required.
e.g. compare observed outcomes with expected frequencies from a binomial model.
3p.11 Know and interpret the characteristics of a binomial distribution.
The notation B(n, p) may be used.
Be familiar with mean of a binomial distribution (np) and with the conditions which make a binomial model suitable.
Calculate probabilities or use given probabilities, which may be found using any standard method, e.g. use of functions on a calculator, spreadsheets, Pascal’s triangle. Questions will not be set with n larger than 10.
3p.12 Know and interpret the characteristics of a normal distribution.
The notation N(μ, σ2) may be used.
Use of normal distribution tables will not be expected.
Know the distribution is symmetrical with a ‘bell’ shape, and that median, mean and mode are equal.
3p.13 Know that, for a normal distribution, values more than three standard deviations from the mean are very unusual; know that approximately 95% of the data lie within two standard deviations of the mean and that 68% (just over two thirds) lie within one standard deviation of the mean
Be familiar with the conditions which make a normal model suitable.
e.g. that data are continuous, the distribution is symmetrical and bell-shaped, and that mean, median and mode are approximately equal.

Pearson Edexcel Level 1/Level 2 GCSE (9–1) in Statistics – Specification – Issue 2 – December 2017 © Pearson Education Limited 2017
31
3 Assessment information
Students must complete all assessment in May/June in any single year, and students can only be entered for either Foundation tier or Higher tier.
Paper 1 (Paper code: 1ST0/1F and 1ST0/1H)
● First assessment: May/June 2019
● The assessment is 1 hour and 30 minutes
● The assessment is out of 80 marks
● Students must answer all questions
● The papers assess all content
● Questions on statistical methods, familiar and unfamiliar contexts and the component parts of the statistical enquiry cycle
● The papers contains short response, medium response and extended response questions
● Calculators may be used in the examination – please see Appendix 4
Content assessed
1. The collection of data
2. Processing, representing and analysing data
3. Probability
Paper 2 (Paper code: 1ST0/2F and 1ST0/2H)
● First assessment: May/June 2019
● The assessment is 1 hour and 30 minutes
● The assessment is out of 80 marks
● Students must answer all questions
● The papers assess all content
● Questions on statistical methods, familiar and unfamiliar contexts and the component parts of the statistical enquiry cycle
● The papers contains short response, medium response and extended response questions
● Calculators may be used in the examination – please see Appendix 4
Content assessed
1. The collection of data
2. Processing, representing and analysing data
3. Probability

Pearson Edexcel Level 1/Level 2 GCSE (9–1) in Statistics – Specification – Issue 2 – December 2017 © Pearson Education Limited 2017
32
Assessment Objectives
Students must: % in GCSE
AO1 Demonstrate knowledge and understanding, using appropriate terminology and notation, of standard statistical techniques used to:
● collect and represent information
● calculate summary statistics and probabilities
55
AO2 Interpret statistical information and results in context and reason statistically to draw conclusions
Where questions/tasks targeting this Assessment Objective will also credit students for their ability to ‘demonstrate knowledge and understanding of standard statistical techniques (AO1) and/or to ‘assess the appropriateness of statistical methodologies and the conclusions drawn through the application of the statistical enquiry cycle’ (AO3), an appropriate proportion of the marks for the question/task must be attributed to the corresponding Assessment Objective(s).
25
AO3 Assess the appropriateness of statistical methodologies and the conclusions drawn through the application of the statistical enquiry cycle
Where questions/tasks targeting this Assessment Objective will also credit students for their ability to ‘demonstrate knowledge and understanding of standard statistical techniques’ (AO1) and/or to ‘interpret statistical information and results in context and reason statistically to draw conclusions’ (AO2), an appropriate proportion of the marks for the question/task must be attributed to the corresponding Assessment Objective(s).
20
Total 100%
Breakdown of Assessment Objectives
Paper
Assessment Objectives Total for all Assessment Objectives AO1 % AO2 % AO3 %
Paper 1 (1F/1H) 27.5 12.5 10 50%
Paper 2 (2F/2H) 27.5 12.5 10 50%
Total for GCSE 55% ±3 25% ±3 20% ±3 100%

Pearson Edexcel Level 1/Level 2 GCSE (9–1) in Statistics – Specification – Issue 2 – December 2017 © Pearson Education Limited 2017
33
Sample assessment materials
Sample papers and mark schemes can be found in the Pearson Edexcel Level 1/Level 2 GCSE (9–1) in Statistics Sample Assessment Materials (SAMs) document.
Synoptic assessment
Synoptic assessment requires students to work across different parts of a qualification and to show their accumulated knowledge and understanding of a topic or subject area.
Synoptic assessment enables students to show their ability to combine their skills, knowledge and understanding with breadth and depth of the subject.
Synopticity will be assessed through the use of extended response questions.

Pearson Edexcel Level 1/Level 2 GCSE (9–1) in Statistics – Specification – Issue 2 – December 2017 © Pearson Education Limited 2017
34
4 Administration and general information
Entries
Details of how to enter students for the examinations for this qualification can be found in our UK Information Manual. A copy is made available to all examinations officers and is available on our website: qualifications.pearson.com
Discount code and performance tables
Centres should be aware that students who enter for more than one GCSE, or other Level 2 qualifications with the same discount code, will have only the grade for their 'first entry' counted for the purpose of the school and college performance tables (please see Appendix 7: Codes). For further information about what constitutes 'first entry' and full details of how this policy is applied, please refer to the DfE website: www.gov.uk/government/organisations/department-for-education
Students should be advised that if they take two GCSEs with the same discount code, schools and colleges to which they wish to progress are likely to take the view that this achievement is equivalent to only one GCSE. The same view may be taken if students take two GCSEs or other Level 2 qualifications that have different discount codes but have significant overlap of content. Students or their advisers who have any doubts about their subject combinations should check with the institution to which they wish to progress before embarking on their programmes.
Access arrangements, reasonable adjustments, special consideration and malpractice
Equality and fairness are central to our work. Our equality policy requires all students to have equal opportunity to access our qualifications and assessments, and our qualifications to be awarded in a way that is fair to every student.
We are committed to making sure that:
● students with a protected characteristic (as defined by the Equality Act 2010) are not, when they are undertaking one of our qualifications, disadvantaged in comparison to students who do not share that characteristic
● all students achieve the recognition they deserve for undertaking a qualification and that this achievement can be compared fairly to the achievement of their peers.
Language of assessment
Assessment of this qualification will be available in English. All student work must be in English.
Access arrangements
Access arrangements are agreed before an assessment. They allow students with special educational needs, disabilities or temporary injuries to:
● access the assessment
● show what they know and can do without changing the demands of the assessment.

Pearson Edexcel Level 1/Level 2 GCSE (9–1) in Statistics – Specification – Issue 2 – December 2017 © Pearson Education Limited 2017
35
The intention behind an access arrangement is to meet the particular needs of an individual student with a disability, without affecting the integrity of the assessment. Access arrangements are the principal way in which awarding bodies comply with the duty under the Equality Act 2010 to make ‘reasonable adjustments’.
Access arrangements should always be processed at the start of the course. Students will then know what is available and have the access arrangement(s) in place for assessment.
Reasonable adjustments
The Equality Act 2010 requires an awarding organisation to make reasonable adjustments where a person with a disability would be at a substantial disadvantage in undertaking an assessment. The awarding organisation is required to take reasonable steps to overcome that disadvantage.
A reasonable adjustment for a particular person may be unique to that individual and therefore might not be in the list of available access arrangements.
Whether an adjustment will be considered reasonable will depend on a number of factors, including:
● the needs of the student with the disability
● the effectiveness of the adjustment
● the cost of the adjustment; and
● the likely impact of the adjustment on the student with the disability and other students.
An adjustment will not be approved if it involves unreasonable costs to the awarding organisation, or affects timeframes or the security or integrity of the assessment. This is because the adjustment is not ‘reasonable’.
Special consideration
Special consideration is a post-examination adjustment to a student's mark or grade to reflect temporary injury, illness or other indisposition at the time of the examination/ assessment, which has had, or is reasonably likely to have had, a material effect on a candidate’s ability to take an assessment or demonstrate their level of attainment in an assessment.
Further information
Please see our website for further information about how to apply for access arrangements and special consideration.
For further information about access arrangements, reasonable adjustments and special consideration, please refer to the JCQ website: www.jcq.org.uk.
Malpractice
Candidate malpractice Candidate malpractice refers to any act by a candidate that compromises or seeks to compromise the process of assessment or which undermines the integrity of the qualifications or the validity of results/certificates.

Pearson Edexcel Level 1/Level 2 GCSE (9–1) in Statistics – Specification – Issue 2 – December 2017 © Pearson Education Limited 2017
36
Candidate malpractice in examinations must be reported to Pearson using a JCQ Form M1 (available at www.jcq.org.uk/exams-office/malpractice). The form can be emailed to [email protected] or posted to Investigations Team, Pearson, 190 High Holborn, London, WC1V 7BH. Please provide as much information and supporting documentation as possible. Note that the final decision regarding appropriate sanctions lies with Pearson.
Failure to report malpractice constitutes staff or centre malpractice.
Staff/centre malpractice Staff and centre malpractice includes both deliberate malpractice and maladministration of our qualifications. As with candidate malpractice, staff and centre malpractice is any act that compromises or seeks to compromise the process of assessment or which undermines the integrity of the qualifications or the validity of results/certificates.
All cases of suspected staff malpractice and maladministration must be reported immediately, before any investigation is undertaken by the centre, to Pearson on a JCQ Form M2(a) (available at www.jcq.org.uk/exams-office/malpractice). The form, supporting documentation and as much information as possible can be emailed to [email protected] or posted to Investigations Team, Pearson, 190 High Holborn, London, WC1V 7BH. Note that the final decision regarding appropriate sanctions lies with Pearson.
Failure to report malpractice itself constitutes malpractice.
More detailed guidance on malpractice can be found in the latest version of the document General and Vocational Qualifications Suspected Malpractice in Examinations and Assessments Policies and Procedures, available at www.jcq.org.uk/exams-office/malpractice.
Awarding and reporting
This qualification will be graded, awarded and certificated to comply with the requirements of Ofqual's General Conditions of Recognition.
This GCSE qualification will be graded and certificated on a nine-grade scale from 9 to 1 using the total subject mark where 9 is the highest grade. Individual components/papers are not graded. For Foundation tier, grades 1–5 are available and for Higher tier, grades 4–9 are available, however if the mark achieved is a smaller number of marks below the 4/3 grade boundary, then a grade 3 may be awarded.
Students whose level of achievement is below the minimum judged by Pearson to be of sufficient standard to be recorded on a certificate will receive an unclassified U result.
The first certification opportunity for this qualification will be 2019.
Student recruitment and progression
Pearson follows the JCQ policy concerning recruitment to our qualifications in that:
● they must be available to anyone who is capable of reaching the required standard
● they must be free from barriers that restrict access and progression
● equal opportunities exist for all students.
Pearson Edexcel Level 1/Level 2 GCSE (9–1) in Statistics – Specification – Issue 2 – December 2017 © Pearson Education Limited 2017
37
Prior learning and other requirements
This qualification provides a basis in statistics for students who wish to progress to further study of the subject at Level 3 or within related disciplines.
Please see Appendix 2 for details of prior knowledge.
Progression
Students can progress from this qualification to:
● GCE AS or A Level Mathematics and GCE AS or A Level Further Mathematics
● Level 3 qualifications, such as GCE in Biology, Economics, Geography, Psychology and Sociology, and vocational qualifications such as a BTEC in Business
● training and employment where quantitative methods are used.

Pearson Edexcel Level 1/Level 2 GCSE (9–1) in Statistics – Specification – Issue 2 – December 2017 © Pearson Education Limited 2017
38

Pearson Edexcel Level 1/Level 2 GCSE (9–1) in Statistics – Specification – Issue 2 – December 2017 © Pearson Education Limited 2017
39
Appendices
Appendix 1: Formulae sheets 41
Appendix 2: Formulae included in subject content 43
Appendix 3: Prior knowledge 48
Appendix 4: Calculators 50
Appendix 5: The context for the development of this qualification 51
Appendix 6: Transferable skills 53
Appendix 7: Codes 54

Pearson Edexcel Level 1/Level 2 GCSE (9–1) in Statistics – Specification – Issue 2 – December 2017 © Pearson Education Limited 2017
40

Pearson Edexcel Level 1/Level 2 GCSE (9–1) in Statistics – Specification – Issue 2 – December 2017 © Pearson Education Limited 2017
41
Appendix 1: Formulae sheets
Foundation tier There is no formulae sheet for Foundation tier. The formula that students should be able to use but need not memorise will be given in the assessments. It is also given below.
Rates of change (e.g. number of births × 1000Birth rate =total population
)

Pearson Edexcel Level 1/Level 2 GCSE (9–1) in Statistics – Specification – Issue 2 – December 2017 © Pearson Education Limited 2017
42
Higher tier The formulae sheet shown below lists the formulae that students should to be able to use but need not memorise. This formulae sheet will be on page 2 in Higher tier assessments.
Higher Tier Formulae
You must not write on this page.
Anything you write on this page will gain NO credit.
3(mean median)Skewstandard deviation
−=
Standard deviation = ( )21 x xn
−∑
An alternative formula for standard deviation is
standard deviation = 22x x
n n −
∑ ∑
Spearman’s rank correlation coefficient
( )2
s 2
6r 11
dn n
= −−
∑
Rates of change (e.g. Birth rate = number of births 1000total population
× )

Pearson Edexcel Level 1/Level 2 GCSE (9–1) in Statistics – Specification – Issue 2 – December 2017 © Pearson Education Limited 2017
43
Appendix 2: Formulae included in subject content
Formulae required for Foundation tier The formulae listed below are included in the GCSE (9-1) Mathematics subject content. Students are expected to know these formulae; they will not be given in the assessments.
Specification reference
Formula required
1c.06 In order to carry out stratification, calculating the percentage or proportion of an amount:
100x
× amount
2a.01 Calculating the angle for a sector in a pie chart:
360total
x×
2b.01 Calculation of arithmetic mean:
fxx
f= ∑∑
2c.01 Range = highest value – lowest value
2c.01 Interquartile range (IQR) = upper quartile – lower quartile
3p.01
Probability = number of favourable outcomes
total number of outcomes

Pearson Edexcel Level 1/Level 2 GCSE (9–1) in Statistics – Specification – Issue 2 – December 2017 © Pearson Education Limited 2017
44
The formulae given below is included in the GCSE (9-1) Statistics content. Students will be expected to know these formulae; they will not be given in the assessments.
Specification reference
Formula required
2f.01
4 point moving average = 1 2 3 4
4x x x x+ + +
2e.04 Calculate double mean point ( ),x y :
fxx
f= ∑∑
, fy
yf
= ∑∑
3p.08 Formulae for independent events:
P( and ) P( ) P( )
P( | ) P( )
P( | ) P( )
A B A B
A B A
B A B
= ×
=
=
3p.07 Formula for conditional probability
P( and )P( | )
P( )
A BB A
A=
Formula for the addition law for two mutually exclusive events
P(A or B) = P(A) + P(B)
2d.01
current value of itemIndex number 100
value in base year= ×
Please see Appendix 1 for details of the formula which will be given in the Foundation tier assessments.

Pearson Edexcel Level 1/Level 2 GCSE (9–1) in Statistics – Specification – Issue 2 – December 2017 © Pearson Education Limited 2017
45
Formulae required for Higher tier The formulae listed below are included in the GCSE (9-1) Mathematics subject content. Students are expected to know these formulae; they will not be given in the assessments.
Specification reference
Formula required
1c.06 In order to carry out stratification, calculating the percentage or proportion of an amount:
100x
× amount
2a.01 Calculating the angle for a sector in a pie chart:
360total
x×
2a.04 Frequency density for a histogram:
Frequency density = frequency
class width
2b.01 Calculation of arithmetic mean:
fxx
f= ∑∑
2c.01 Range = highest value – lowest value
2c.01 Interquartile range (IQR) = upper quartile – lower quartile
3p.01
Probability = number of favourable outcomes
total number of outcomes
The formulae given below is included in the GCSE (9–1) Statistics content. Students will be expected to know these formulae; they will not be given in the assessments.
Specification reference
Formula required
2a.01 Calculating the radius of a circle for a proportional pie chart:
2new total old radius
old totalr
×=
2b.01 Calculation of weighted mean:
weighted mean = (value weight)
weights×∑
∑
2b.01 Geometric mean = 1 2value value ... valuenn × × ×

Pearson Edexcel Level 1/Level 2 GCSE (9–1) in Statistics – Specification – Issue 2 – December 2017 © Pearson Education Limited 2017
46
Specification reference
Formula required
2c.01 Interpercentile range and interdecile range as appropriate:
percentile 1 – percentile 2 (calculation of a percentage needed as in 1c.06 above)
2c.02 Identification of an outlier:
Small outlier is < LQ – 1.5IQR
Large outlier is > UQ + 1.5IQR
Outlier is also outside 3µ σ±
2c.06 Know how to standardise using these values:
standardised score = −x µσ
2f.01 Moving averages (m.a.) n point moving average:
m.a. = 1 2 ... n
n
x x x+ + +
2e.04 Calculate double mean point ( ),x y :
fxx
f= ∑∑
, fyy
f= ∑∑
3p.07 Know the addition law for two mutually exclusive events:
P(A or B) = P(A) + P(B)
Know the general addition law:
P(A or B) = P(A) + P(B) − P(A and B)
3p.08 Formulae for independent events:
P( and ) P( ) P( )
P( | ) P( )
P( | ) P( )
A B A B
A B A
B A B
= ×
=
=
3p.09 Formula for conditional probability
P( and )P( | )
P( )
A BB A
A=
2d.01 Index number =
current value of item
value in base year × 100

Pearson Edexcel Level 1/Level 2 GCSE (9–1) in Statistics – Specification – Issue 2 – December 2017 © Pearson Education Limited 2017
47
Specification reference
Formula required
2d.02 Weighted index number =
(index weight)weights×∑
∑
2h.02 Petersen capture recapture formula:
Number in population =sample size 1 × sample size number marked in sa
2mple 2
Please see Appendix 1 for details of the formulae sheet which will be given on page 2 in the Higher tier assessments.
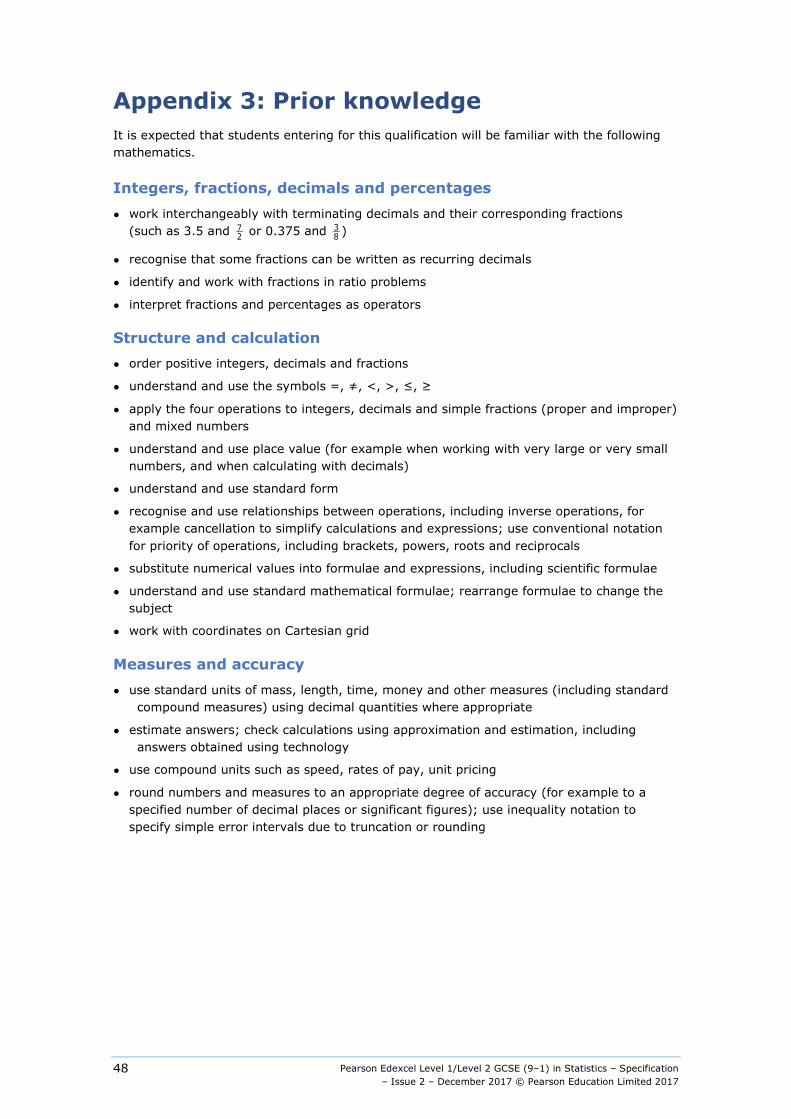
Pearson Edexcel Level 1/Level 2 GCSE (9–1) in Statistics – Specification – Issue 2 – December 2017 © Pearson Education Limited 2017
48
Appendix 3: Prior knowledge It is expected that students entering for this qualification will be familiar with the following mathematics.
Integers, fractions, decimals and percentages ● work interchangeably with terminating decimals and their corresponding fractions
(such as 3.5 and 72 or 0.375 and 3
8 )
● recognise that some fractions can be written as recurring decimals
● identify and work with fractions in ratio problems
● interpret fractions and percentages as operators
Structure and calculation ● order positive integers, decimals and fractions
● understand and use the symbols =, ≠, <, >, ≤, ≥
● apply the four operations to integers, decimals and simple fractions (proper and improper) and mixed numbers
● understand and use place value (for example when working with very large or very small numbers, and when calculating with decimals)
● understand and use standard form
● recognise and use relationships between operations, including inverse operations, for example cancellation to simplify calculations and expressions; use conventional notation for priority of operations, including brackets, powers, roots and reciprocals
● substitute numerical values into formulae and expressions, including scientific formulae
● understand and use standard mathematical formulae; rearrange formulae to change the subject
● work with coordinates on Cartesian grid
Measures and accuracy ● use standard units of mass, length, time, money and other measures (including standard
compound measures) using decimal quantities where appropriate
● estimate answers; check calculations using approximation and estimation, including answers obtained using technology
● use compound units such as speed, rates of pay, unit pricing
● round numbers and measures to an appropriate degree of accuracy (for example to a specified number of decimal places or significant figures); use inequality notation to specify simple error intervals due to truncation or rounding

Pearson Edexcel Level 1/Level 2 GCSE (9–1) in Statistics – Specification – Issue 2 – December 2017 © Pearson Education Limited 2017
49
Ratio, proportion and rates of change ● express one quantity as a fraction of another, where the fraction is less than 1 or
greater than 1
● use ratio notation, including reduction to simplest form
● divide a given quantity into two parts in a given part : part or part : whole ratio; express the division of a quantity into two parts as a ratio; apply ratio to real contexts and problems (such as those involving probability)
● relate ratios to fractions and vice versa
● define percentage as ‘number of parts per hundred’; interpret percentages and percentage changes as a fraction or a decimal, and interpret these multiplicatively; express one quantity as a percentage of another; compare two quantities using percentages
• understand and use the general equation of a straight line y = mx + c, where c is the intercept with the
y-axis and ( )( )
1 2
1 2
y ym
x x−
=−

Pearson Edexcel Level 1/Level 2 GCSE (9–1) in Statistics – Specification – Issue 2 – December 2017 © Pearson Education Limited 2017
50
Appendix 4: Calculators Students may use a scientific calculator in assessments for this qualification, and centres are responsible for making sure that calculators used by their students meet the requirements highlighted in the table below.
Students must be told these regulations beforehand and they must be familiar with them before their assessments for this qualification.
Students must have a scientific calculator with them for their examinations which they may use. They are expected to be familiar with the statistical function keys on their scientific calculators.
Calculators must be:
● of a size suitable for use on a desk
● either battery or solar powered
● free of lids, cases and covers that have printed instructions or formulae.
Calculators must not:
● be designed or adapted to offer any of these facilities:
o language translators
o symbolic algebraic manipulation
o symbolic differentiation or integration
o communication with other machines or the internet
● be borrowed from another candidate during an examination for any reason*
● have retrievable information stored in them, and this includes:
o databanks
o dictionaries
o mathematical formulae
o text.
The candidate is responsible for the following:
● the calculator’s power supply
● the calculator’s working condition
● clearing anything stored in the calculator.
*An invigilator may give a student a replacement scientific calculator

Pearson Edexcel Level 1/Level 2 GCSE (9–1) in Statistics – Specification – Issue 2 – December 2017 © Pearson Education Limited 2017
51
Appendix 5: The context for the development of this qualification All our qualifications are designed to meet our World Class Qualification Principles[1] and our ambition to put the student at the heart of everything we do.
We have developed and designed this qualification by:
● reviewing other curricula and qualifications to ensure that it is comparable with those taken in high-performing jurisdictions overseas
● consulting with key stakeholders on content and assessment, including learned bodies, subject associations, higher-education academics, teachers and employers to ensure this qualification is suitable for a UK context
● reviewing the legacy qualification and building on its positive attributes.
This qualification has also been developed to meet criteria stipulated by Ofqual in their documents GCSE (9 to 1) Qualification Level Conditions and Requirements and GCSE Subject Level Conditions and Requirements for Pearson Edexcel Level 1/Level 2 GCSE (9–1) in Statistics published in April 2014.
[1] Pearson’s World Class Qualification Principles ensure that our qualifications are:
● demanding, through internationally benchmarked standards, encouraging deep learning and measuring higher-order skills
● rigorous, through setting and maintaining standards over time, developing reliable and valid assessment tasks and processes, and generating confidence in end users of the knowledge, skills and competencies of certified students
● inclusive, through conceptualising learning as continuous, recognising that students develop at different rates and have different learning needs, and focusing on progression
● empowering, through promoting the development of transferable skills, see Appendix 6.

Pearson Edexcel Level 1/Level 2 GCSE (9–1) in Statistics – Specification – Issue 2 – December 2017 © Pearson Education Limited 2017
52
From Pearson’s Expert Panel for World Class Qualifications
May 2014
“The reform of the qualifications system in England is a profoundly important change to the education system. Teachers need to know that the new qualifications will assist them in helping their learners make progress in their lives.
When these changes were first proposed we were approached by Pearson to join an ‘Expert Panel’ that would advise them on the development of the new qualifications.
We were chosen, either because of our expertise in the UK education system, or because of our experience in reforming qualifications in other systems around the world as diverse as Singapore, Hong Kong, Australia and a number of countries across Europe.
We have guided Pearson through what we judge to be a rigorous qualification development process that has included:
● establishing External Subject Advisory Groups, drawing on independent subject-specific expertise to challenge and validate our qualifications
● subjecting the final qualifications to scrutiny against the DfE content and Ofqual accreditation criteria in advance of submission.
Importantly, we have worked to ensure that the content and learning is future oriented. The design has been guided by what is called an ‘Efficacy Framework’, meaning learner outcomes have been at the heart of this development throughout.
We understand that ultimately it is excellent teaching that is the key factor to a learner’s success in education. As a result of our work as a panel we are confident that we have supported the development of qualifications that are outstanding for their coherence, thoroughness and attention to detail and can be regarded as representing world-class best practice.”
Sir Michael Barber (Chair)
Chief Education Advisor, Pearson plc
Professor Lee Sing Kong
Director, National Institute of Education, Singapore
Bahram Bekhradnia
President, Higher Education Policy Institute
Professor Jonathan Osborne
Stanford University
Dame Sally Coates
Principal, Burlington Danes Academy
Professor Dr Ursula Renold
Federal Institute of Technology, Switzerland
Professor Robin Coningham
Pro-Vice Chancellor, University of Durham
Professor Bob Schwartz
Harvard Graduate School of Education
Dr Peter Hill
Former Chief Executive ACARA
All titles correct as at May 2014

Pearson Edexcel Level 1/Level 2 GCSE (9–1) in Statistics – Specification – Issue 2 – December 2017 © Pearson Education Limited 2017
53
Appendix 6: Transferable skills The need for transferable skills In recent years, higher education institutions and employers have consistently flagged the need for students to develop a range of transferable skills to enable them to respond with confidence to the demands of undergraduate study and the world of work.
The Organisation for Economic Co-operation and Development (OECD) defines skills, or competencies, as ‘the bundle of knowledge, attributes and capacities that can be learned and that enable individuals to successfully and consistently perform an activity or task and can be built upon and extended through learning.’ [1]
To support the design of our qualifications, the Pearson Research Team selected and evaluated seven global 21st-century skills frameworks. Following on from this process, we identified the National Research Council’s (NRC) framework as the most evidence-based and robust skills framework. We adapted the framework slightly to include the Program for International Student Assessment (PISA) ICT Literacy and Collaborative Problem Solving (CPS) Skills.
The adapted National Research Council’s framework of skills involves: [2]
Cognitive skills ● Non-routine problem solving – expert thinking, metacognition, creativity.
● Systems thinking – decision making and reasoning.
● Critical thinking – definitions of critical thinking are broad and usually involve general cognitive skills such as analysing, synthesising and reasoning skills.
● ICT literacy – access, manage, integrate, evaluate, construct and communicate. [3]
Interpersonal skills ● Communication – active listening, oral communication, written communication, assertive
communication and non-verbal communication.
● Relationship-building skills – teamwork, trust, intercultural sensitivity, service orientation, self-presentation, social influence, conflict resolution and negotiation.
● Collaborative problem solving – establishing and maintaining shared understanding, taking appropriate action, establishing and maintaining team organisation.
Intrapersonal skills ● Adaptability – ability and willingness to cope with the uncertain, handling work stress,
adapting to different personalities, communication styles and cultures, and physical adaptability to various indoor and outdoor work environments.
● Self-management and self-development – ability to work remotely in virtual teams, work autonomously, be self-motivating and self-monitoring, willing and able to acquire new information and skills related to work.
Transferable skills enable young people to face the demands of further and higher education, as well as the demands of the workplace, and are important in the teaching and learning of this qualification. We will provide teaching and learning materials, developed with stakeholders, to support our qualifications.
[1] OECD – Better Skills, Better Jobs, Better Lives (OECD Publishing, 2012) [2] Koenig J A, National Research Council – Assessing 21st Century Skills: Summary of a Workshop (National
Academies Press, 2011) [3] PISA – The PISA Framework for Assessment of ICT Literacy (2011)

Pearson Edexcel Level 1/Level 2 GCSE (9–1) in Statistics – Specification – Issue 2 – December 2017 © Pearson Education Limited 2017
54
Appendix 7: Codes Type of code Use of code Code
Discount codes Every qualification eligible for performance tables is assigned a discount code indicating the subject area to which it belongs.
Discount codes are published by the DfE.
Please see the GOV.UK website*
Regulated Qualifications Framework (RQF) codes
Each qualification title is allocated an Ofqual Regulated Qualifications Framework (RQF) code.
The RQF code is known as a Qualification Number (QN). This is the code that features in the DfE Section 96 and on the LARA as being eligible for 16–18 and 19+ funding, and is to be used for all qualification funding purposes. The QN will appear on students’ final certification documentation.
The QN for this qualification is:
603/1084/4
Subject codes The subject code is used by centres to enter students for a qualification. Centres will need to use the entry codes only when claiming students’ qualifications.
GCSE – 1ST0
Paper codes These codes are provided for reference purposes. Students do not need to be entered for individual papers.
Paper 1: 1ST0/1F or 1ST0/1H
Paper 2: 1ST0/2F or 1ST0/2H
*www.gov.uk/government/publications/2018-performance-tables-discount-code
Sb101017Z:\LT\PD\GCSE 2017 NEW ISSUES\9781446952665_GCSE2017_L12_STATISTICS.DOC.1–60/0

Edexcel, BTEC and LCCI qualifications
Edexcel, BTEC and LCCI qualifications are awarded by Pearson, the UK’s largest awarding body offering academic and vocational qualifications that are globally recognised and benchmarked. For further information, please visit our qualifications website at qualifications.pearson.com. Alternatively, you can get in touch with us using the details on our contact us page at qualifications.pearson.com/contactus
About Pearson
Pearson is the world's leading learning company, with 35,000 employees in more than 70 countries working to help people of all ages to make measurable progress in their lives through learning. We put the learner at the centre of everything we do, because wherever learning flourishes, so do people. Find out more about how we can help you and your learners at qualifications.pearson.com
References to third party material made in this specification are made in good faith. Pearson does not endorse, approve or accept responsibility for the content of materials, which may be subject to change, or any opinions expressed therein. (Material may include textbooks, journals, magazines and other publications and websites.)
All information in this specification is correct at time of publication.
Original origami artwork: Mark Bolitho Origami photography: Pearson Education Ltd/Naki Kouyioumtzis
ISBN 978 1 446 95266 5
All the material in this publication is copyright © Pearson Education Limited 2017

For information about Edexcel, BTEC or LCCI qualifications visit qualifications.pearson.com
Edexcel is a registered trademark of Pearson Education Limited
Pearson Education Limited. Registered in England and Wales No. 872828 Registered Office: 80 Strand, London WC2R 0RL VAT Reg No GB 278 537121