Embed Size (px)
Citation preview
GCSESTATISTICSFoundation Tier Unit 1 Written Paper
FMonday 27 June 2016 Time allowed: 1 hour 30 minutes
MaterialsFor this paper you must have: a calculator mathematical instruments.
Instructions Use black ink or black ball-point pen. Draw diagrams in pencil. Answer all questions. You must answer the questions in the spaces provided. Do not write outside the box around each
page or on blank pages. Do all rough work in this book. Cross through any work that you do not want to be marked.
Information The marks for questions are shown in brackets. The maximum mark for this paper is 80. You may ask for more answer paper, graph paper and tracing paper. These must be tagged securely
to this answer book. You are expected to use a calculator where appropriate.
Advice In all calculations, show clearly how you work out your answer.
(JUN1643101F01) 43101FWMP/Jun16/E4
Please write clearly in block capitals.
Centre number Candidate number
Surname ––––––––––––––––––––––––––––––––––––––––––––––––––––––––––
Forename(s) ––––––––––––––––––––––––––––––––––––––––––––––––––––––––––
Candidate signature ––––––––––––––––––––––––––––––––––––––––––––––––––––––––––
Morning
2
(02)WMP/Jun16/43101F
You may need to use the following formulae:
Mean of a frequency distribution = –––––
Mean of a grouped frequency distribution = ––––– ,
where x is the mid-interval value.
∑fx
∑f
∑fx
∑f
3 Do not writeoutside the
box
(03)Turn over �
WMP/Jun16/43101F
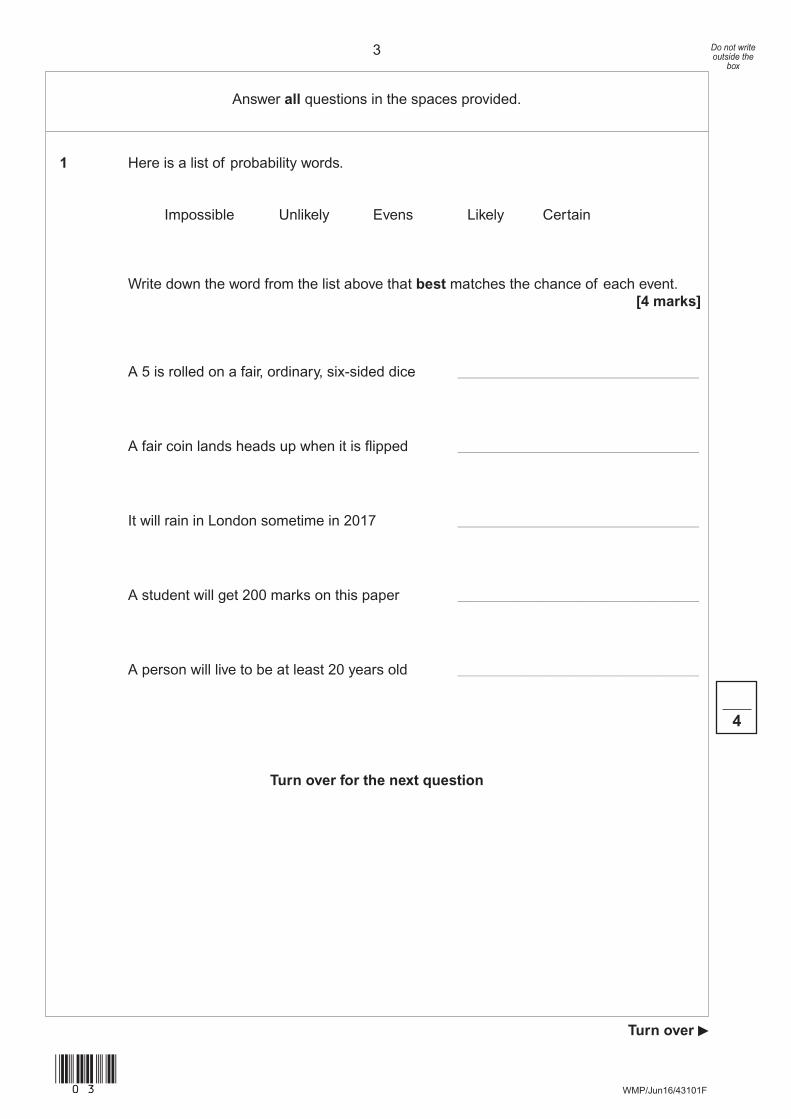
1 Here is a list of probability words.
Impossible Unlikely Evens Likely Certain
Write down the word from the list above that best matches the chance of each event.[4 marks]
A 5 is rolled on a fair, ordinary, six-sided dice _________________________________
A fair coin lands heads up when it is flipped _________________________________
It will rain in London sometime in 2017 _________________________________
A student will get 200 marks on this paper _________________________________
A person will live to be at least 20 years old _________________________________
Turn over for the next question
4
Answer all questions in the spaces provided.
4 Do not writeoutside the
box
(04)WMP/Jun16/43101F
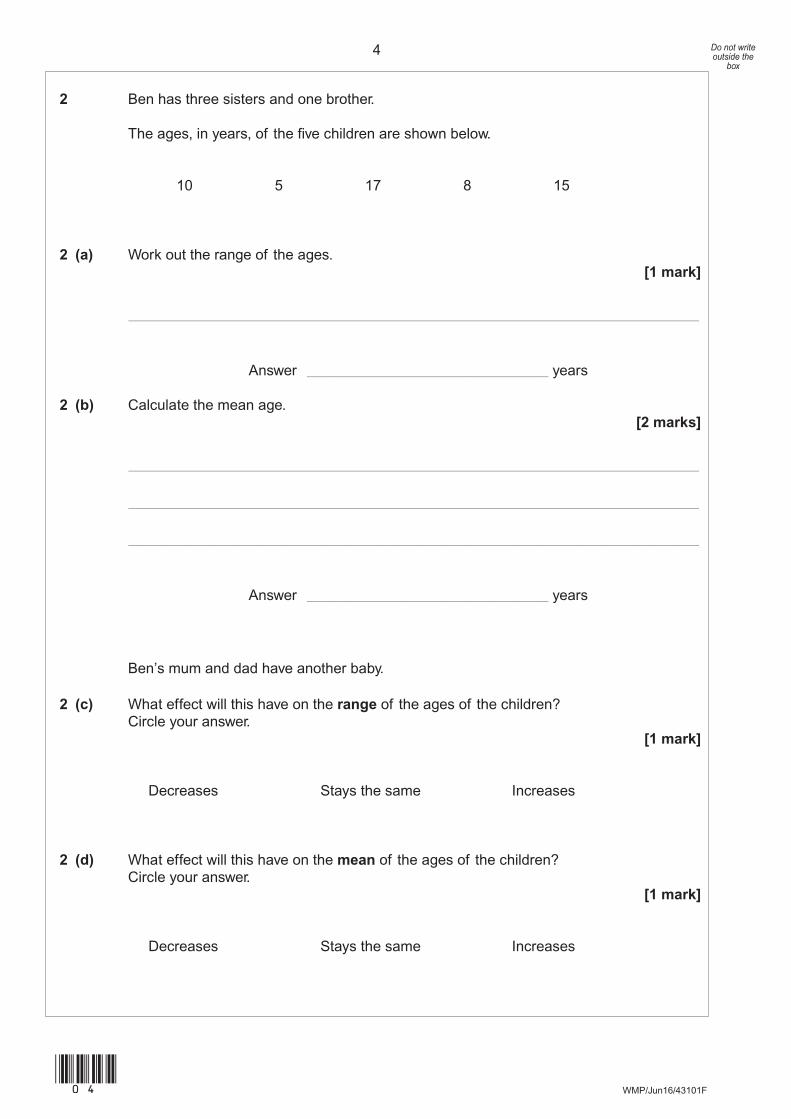
2 Ben has three sisters and one brother.
The ages, in years, of the five children are shown below.
10 5 17 8 15
2 (a) Work out the range of the ages.[1 mark]
______________________________________________________________________________
Answer _________________________________ years
2 (b) Calculate the mean age.[2 marks]
______________________________________________________________________________
______________________________________________________________________________
______________________________________________________________________________
Answer _________________________________ years
Ben’s mum and dad have another baby.
2 (c) What effect will this have on the range of the ages of the children?Circle your answer.
[1 mark]
Decreases Stays the same Increases
2 (d) What effect will this have on the mean of the ages of the children?Circle your answer.
[1 mark]
Decreases Stays the same Increases
5 Do not writeoutside the
box
(05)Turn over �
WMP/Jun16/43101F
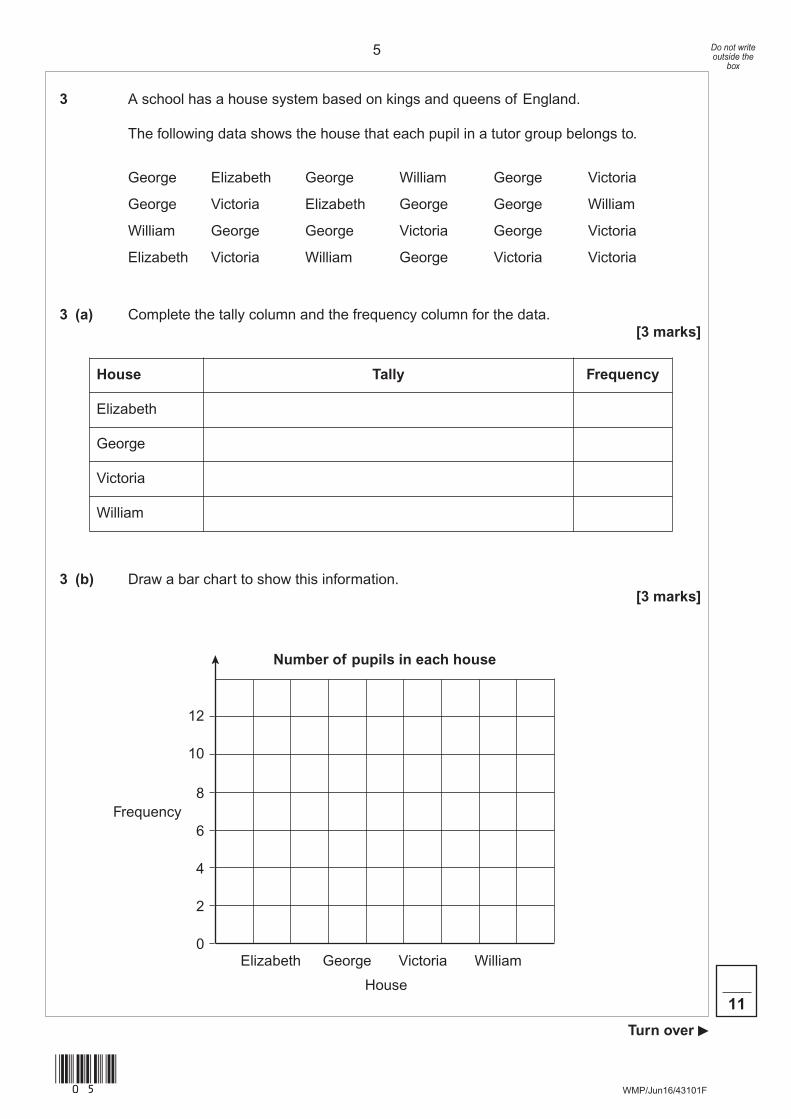
3 A school has a house system based on kings and queens of England.
The following data shows the house that each pupil in a tutor group belongs to.
George Elizabeth George William George Victoria
George Victoria Elizabeth George George William
William George George Victoria George Victoria
Elizabeth Victoria William George Victoria Victoria
3 (a) Complete the tally column and the frequency column for the data.[3 marks]
3 (b) Draw a bar chart to show this information.[3 marks]
11
House Tally Frequency
Elizabeth
George
Victoria
William
2
0Elizabeth George Victoria
House
Frequency
Number of pupils in each house
William
4
6
8
10
12
6 Do not writeoutside the
box
(06)WMP/Jun16/43101F
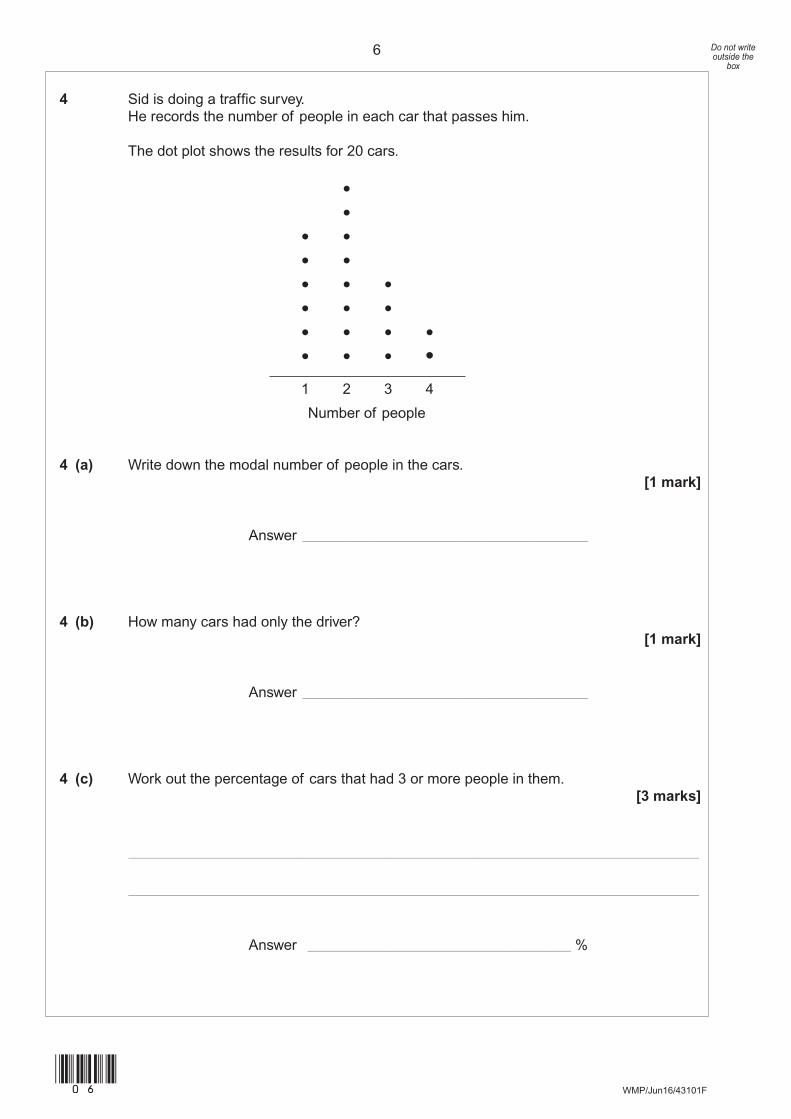
4 Sid is doing a traffic survey.He records the number of people in each car that passes him.
The dot plot shows the results for 20 cars.
••
• •• •• • •• • •• • • •• • • •1 2 3 4
Number of people
4 (a) Write down the modal number of people in the cars.[1 mark]
Answer _______________________________________
4 (b) How many cars had only the driver?[1 mark]
Answer _______________________________________
4 (c) Work out the percentage of cars that had 3 or more people in them.[3 marks]
______________________________________________________________________________
______________________________________________________________________________
Answer ____________________________________ %
7 Do not writeoutside the
box
(07)Turn over �
WMP/Jun16/43101F
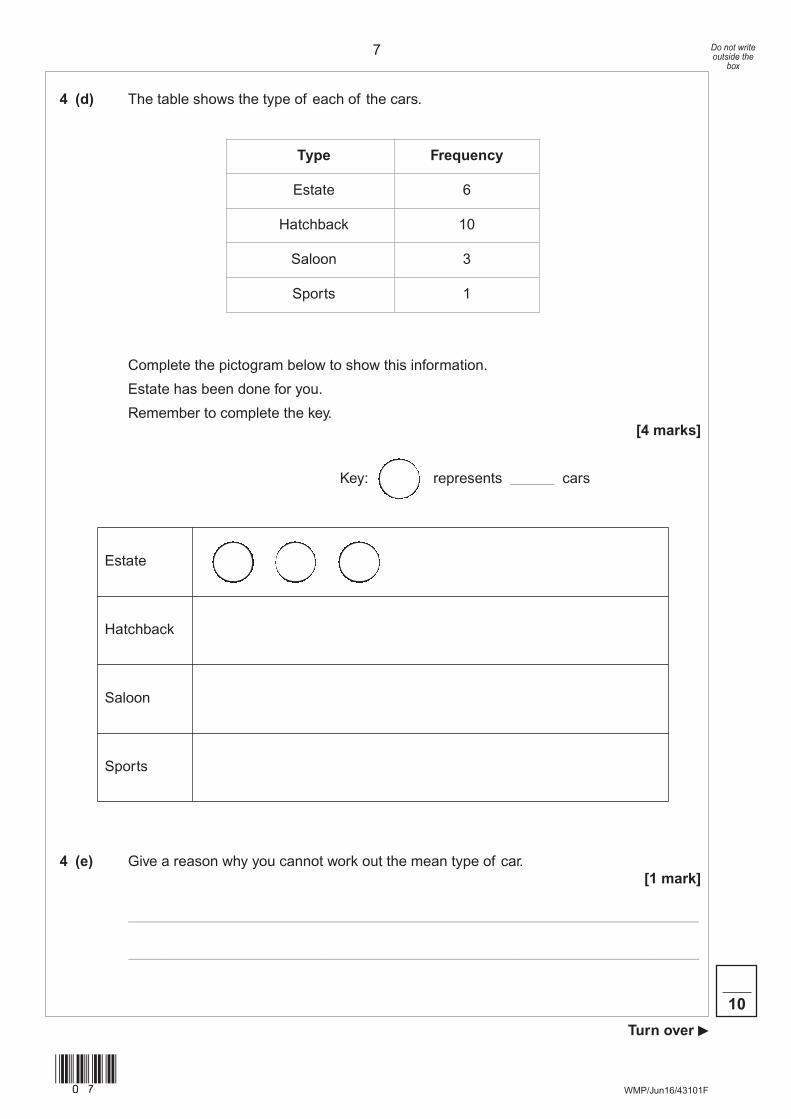
4 (d) The table shows the type of each of the cars.
Complete the pictogram below to show this information.
Estate has been done for you.
Remember to complete the key.[4 marks]
Key: represents ______ cars
4 (e) Give a reason why you cannot work out the mean type of car.[1 mark]
______________________________________________________________________________
______________________________________________________________________________
10
Type Frequency
Estate 6
Hatchback 10
Saloon 3
Sports 1
Estate
Hatchback
Saloon
Sports
8 Do not writeoutside the
box
(08)WMP/Jun16/43101F
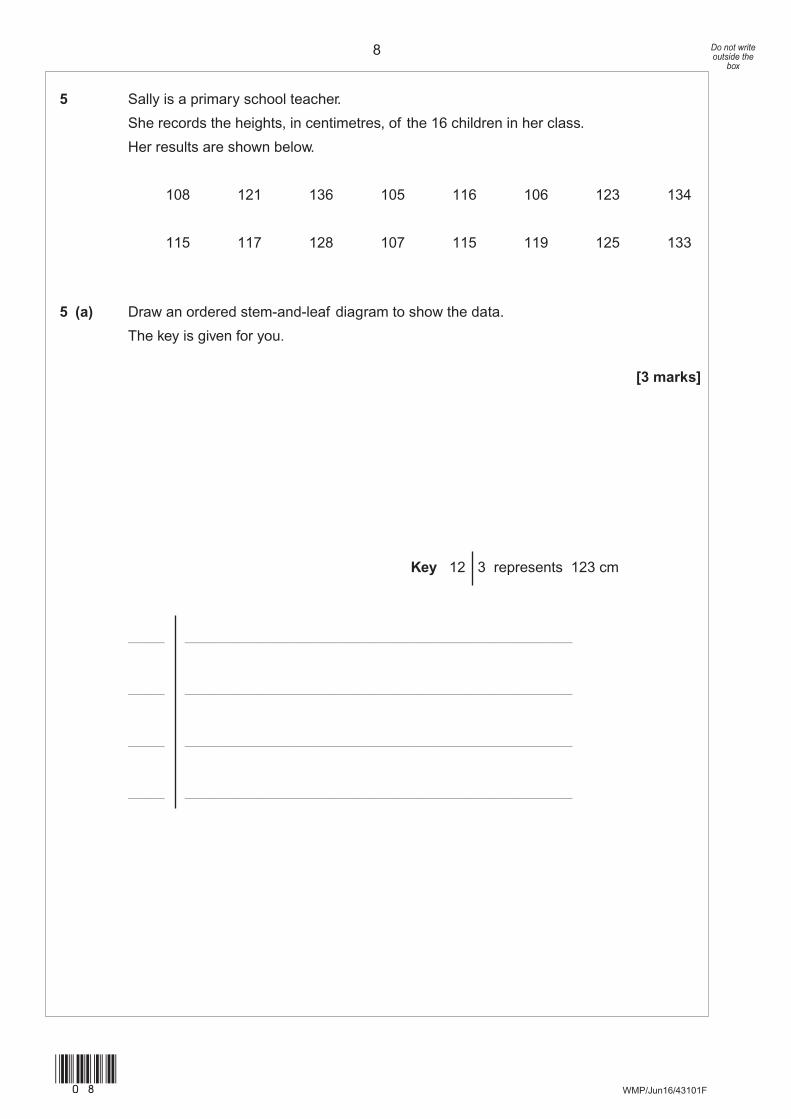
5 Sally is a primary school teacher.
She records the heights, in centimetres, of the 16 children in her class.
Her results are shown below.
108 121 136 105 116 106 123 134
115 117 128 107 115 119 125 133
5 (a) Draw an ordered stem-and-leaf diagram to show the data.
The key is given for you.
[3 marks]
Key 12 3 represents 123 cm
_____ _____________________________________________________
_____ _____________________________________________________
_____ _____________________________________________________
_____ _____________________________________________________
9 Do not writeoutside the
box
(09)Turn over �
WMP/Jun16/43101F
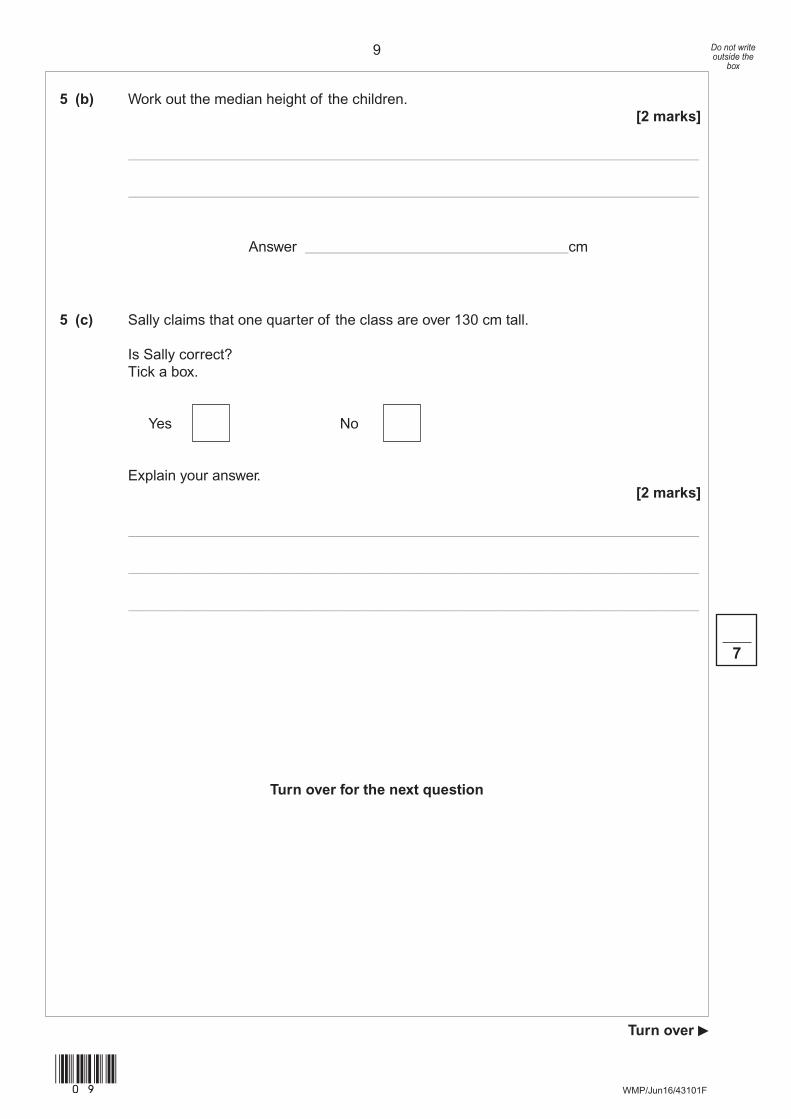
5 (b) Work out the median height of the children.[2 marks]
______________________________________________________________________________
______________________________________________________________________________
Answer ____________________________________cm
5 (c) Sally claims that one quarter of the class are over 130 cm tall.
Is Sally correct?Tick a box.
Yes No
Explain your answer.[2 marks]
______________________________________________________________________________
______________________________________________________________________________
______________________________________________________________________________
Turn over for the next question
7
10 Do not writeoutside the
box
(10)WMP/Jun16/43101F
6 Mary wants to find out how much money people spend in supermarkets.She decides to ask 20 people as they leave her local supermarket one Monday morning.
6 (a) Give two reasons why this would not give a representative sample.[2 marks]
Reason 1 _____________________________________________________________________
______________________________________________________________________________
______________________________________________________________________________
Reason 2 _____________________________________________________________________
______________________________________________________________________________
______________________________________________________________________________
6 (b) Write a suitable question that Mary can ask to find out how much money people spendin supermarkets.
You should include a response section.[3 marks]
6 (c) Write down one factor that may affect how much money a person spends insupermarkets.
[1 mark]
______________________________________________________________________________
______________________________________________________________________________
6
Turn over �
WMP/Jun16/43101F
Turn over for the next question
DO NOT WRITE ON THIS PAGEANSWER IN THE SPACES PROVIDED
11
(11)
12 Do not writeoutside the
box
(12)WMP/Jun16/43101F
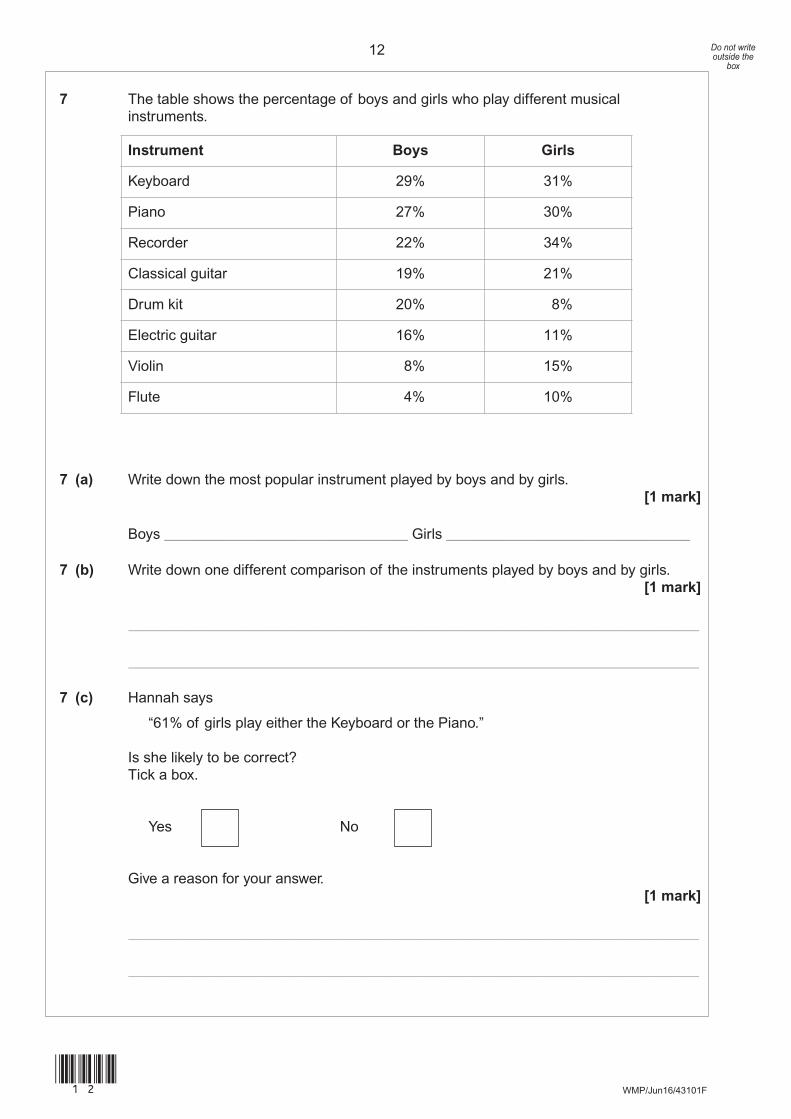
7 The table shows the percentage of boys and girls who play different musicalinstruments.
7 (a) Write down the most popular instrument played by boys and by girls.[1 mark]
Boys –––––––––––––––––––––––––––––– Girls ––––––––––––––––––––––––––––––
7 (b) Write down one different comparison of the instruments played by boys and by girls.[1 mark]
______________________________________________________________________________
______________________________________________________________________________
7 (c) Hannah says
“61% of girls play either the Keyboard or the Piano.”
Is she likely to be correct?Tick a box.
Yes No
Give a reason for your answer.[1 mark]
______________________________________________________________________________
______________________________________________________________________________
Instrument Boys Girls
Keyboard 29% 31%
Piano 27% 30%
Recorder 22% 34%
Classical guitar 19% 21%
Drum kit 20% 8%
Electric guitar 16% 11%
Violin 8% 15%
Flute 4% 10%
13 Do not writeoutside the
box
(13)Turn over �
WMP/Jun16/43101F
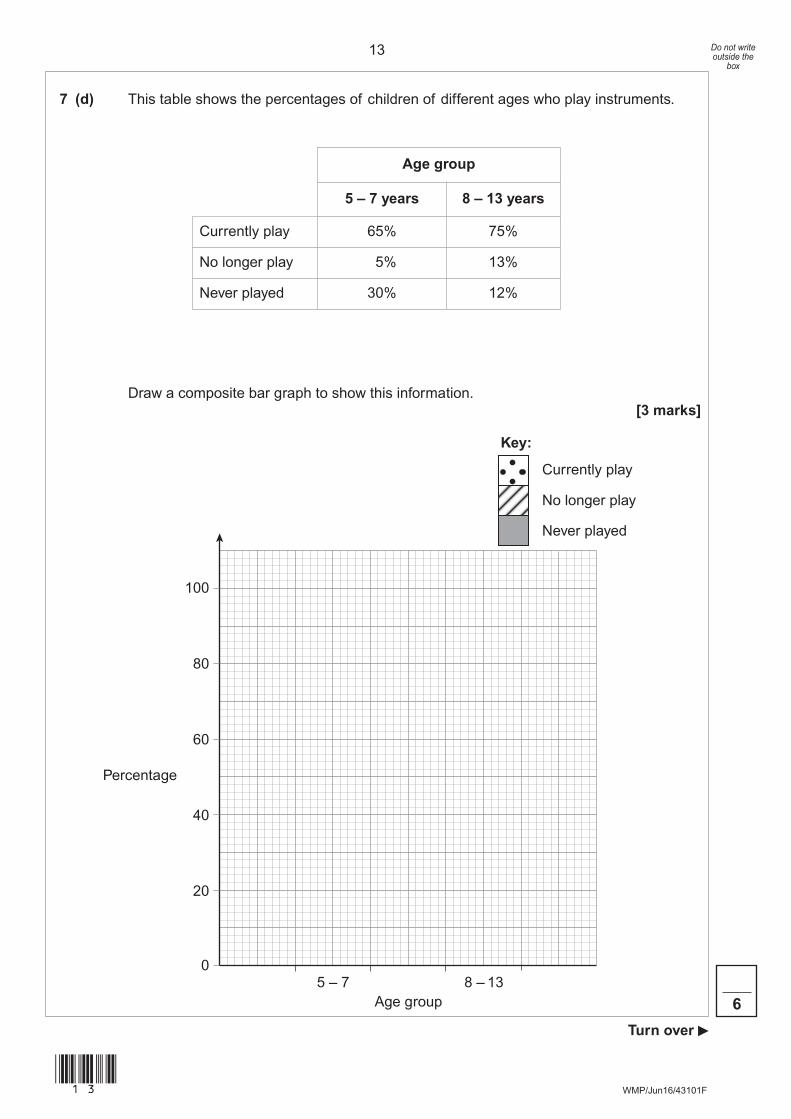
7 (d) This table shows the percentages of children of different ages who play instruments.
Draw a composite bar graph to show this information.[3 marks]
6
Age group
5 – 7 years 8 – 13 years
Currently play 65% 75%
No longer play 5% 13%
Never played 30% 12%
Age group
Key:
Currently play
No longer play
Never played
Percentage
5 – 7 8 – 13
60
80
100
40
20
0
14 Do not writeoutside the
box
(14)WMP/Jun16/43101F
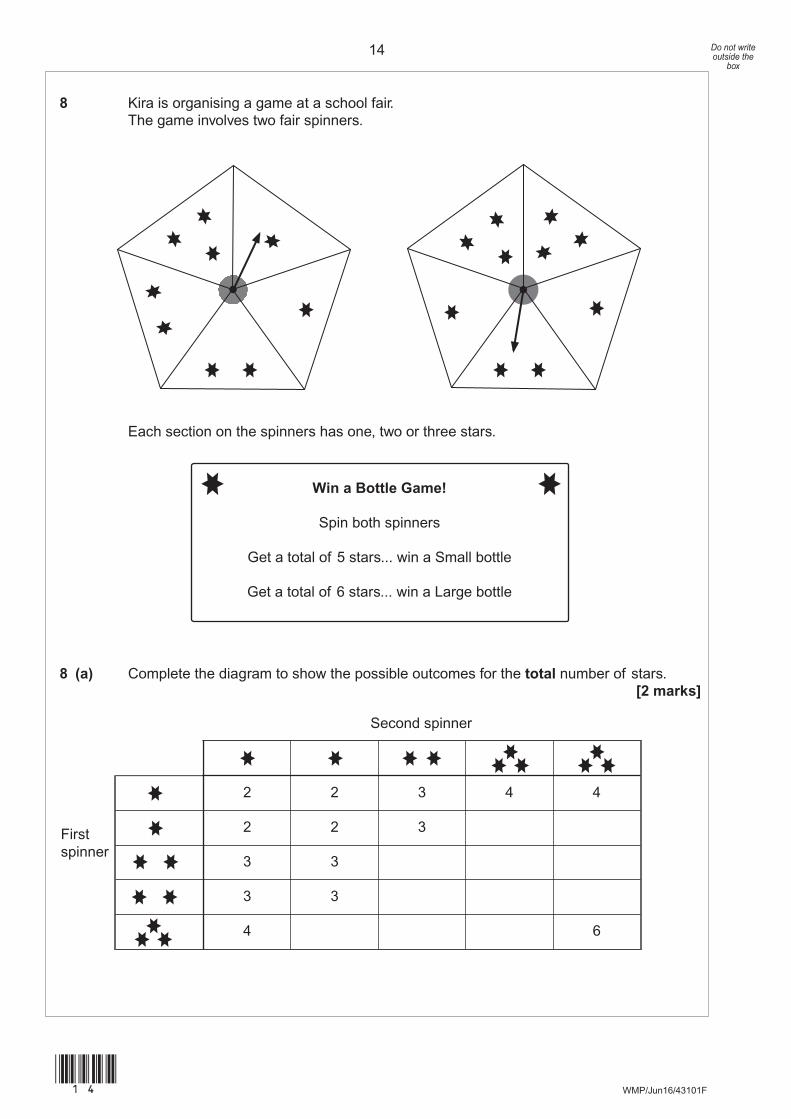
8 Kira is organising a game at a school fair.The game involves two fair spinners.
Each section on the spinners has one, two or three stars.
8 (a) Complete the diagram to show the possible outcomes for the total number of stars.[2 marks]
Win a Bottle Game!
Spin both spinners
Get a total of 5 stars... win a Small bottle
Get a total of 6 stars... win a Large bottle
2 2 3 4 4
2 2 3
3 3
3 3
4 6
Second spinner
Firstspinner
15 Do not writeoutside the
box
(15)Turn over �
WMP/Jun16/43101F
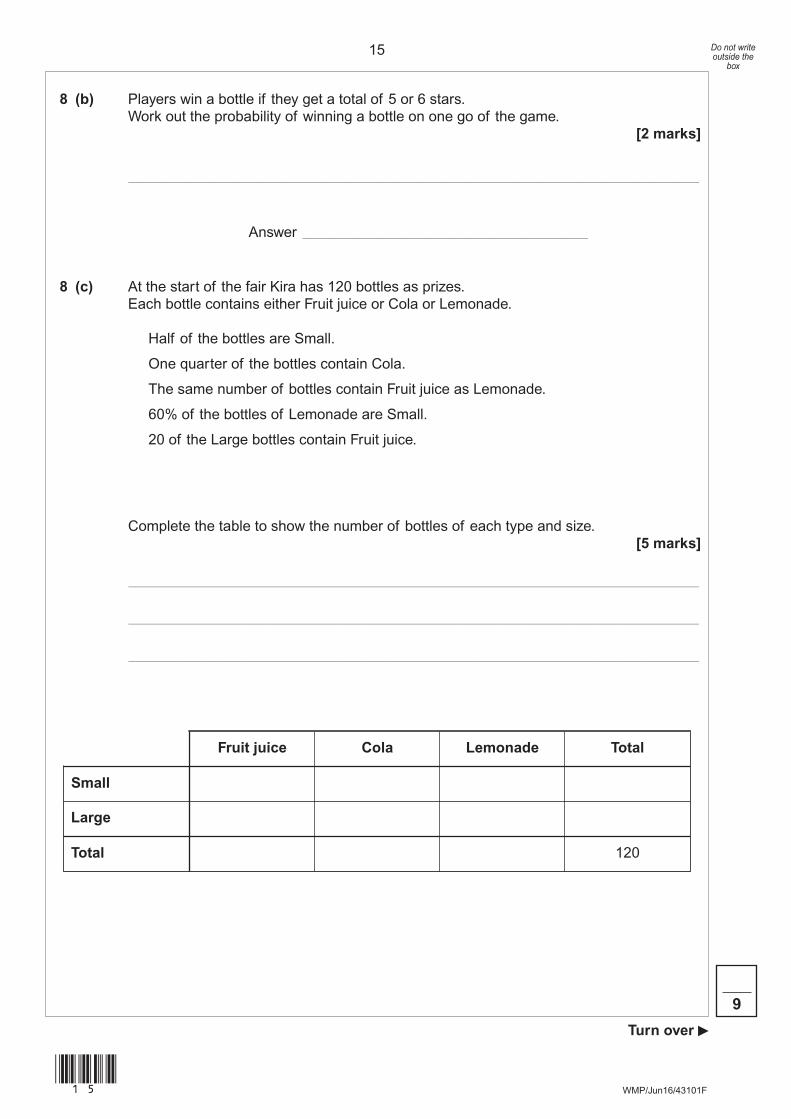
8 (b) Players win a bottle if they get a total of 5 or 6 stars.Work out the probability of winning a bottle on one go of the game.
[2 marks]
______________________________________________________________________________
Answer _______________________________________
8 (c) At the start of the fair Kira has 120 bottles as prizes.Each bottle contains either Fruit juice or Cola or Lemonade.
Half of the bottles are Small.
One quarter of the bottles contain Cola.
The same number of bottles contain Fruit juice as Lemonade.
60% of the bottles of Lemonade are Small.
20 of the Large bottles contain Fruit juice.
Complete the table to show the number of bottles of each type and size.[5 marks]
______________________________________________________________________________
______________________________________________________________________________
______________________________________________________________________________
9
Fruit juice Cola Lemonade Total
Small
Large
Total 120
16 Do not writeoutside the
box
(16)WMP/Jun16/43101F
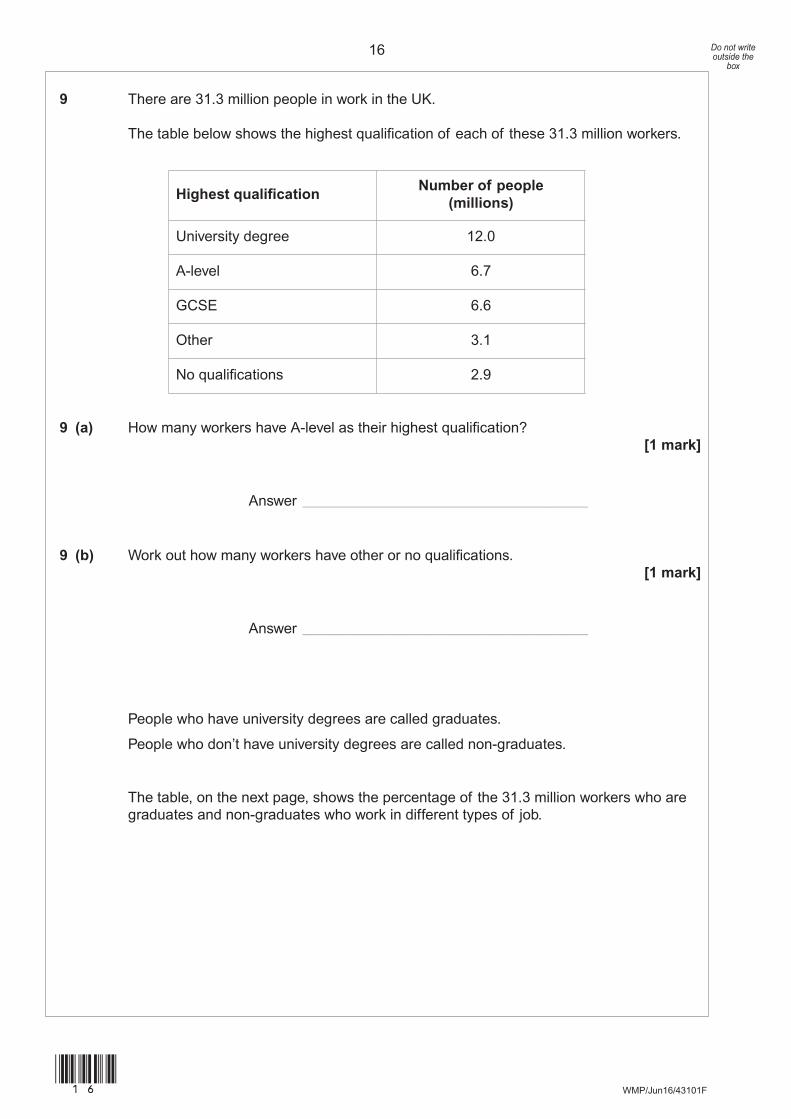
9 There are 31.3 million people in work in the UK.
The table below shows the highest qualification of each of these 31.3 million workers.
9 (a) How many workers have A-level as their highest qualification?[1 mark]
Answer _______________________________________
9 (b) Work out how many workers have other or no qualifications.[1 mark]
Answer _______________________________________
People who have university degrees are called graduates.
People who don’t have university degrees are called non-graduates.
The table, on the next page, shows the percentage of the 31.3 million workers who aregraduates and non-graduates who work in different types of job.
Highest qualificationNumber of people
(millions)
University degree 12.0
A-level 6.7
GCSE 6.6
Other 3.1
No qualifications 2.9
17 Do not writeoutside the
box
(17)Turn over �
WMP/Jun16/43101F
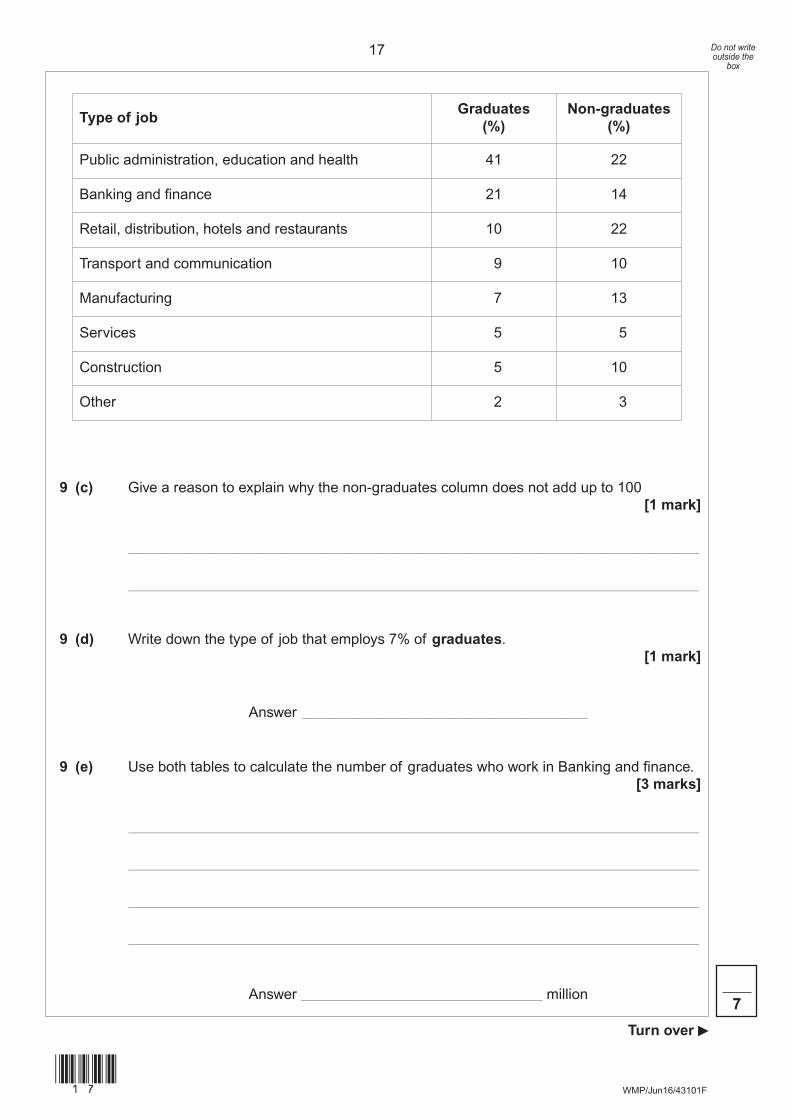
9 (c) Give a reason to explain why the non-graduates column does not add up to 100[1 mark]
______________________________________________________________________________
______________________________________________________________________________
9 (d) Write down the type of job that employs 7% of graduates.[1 mark]
Answer _______________________________________
9 (e) Use both tables to calculate the number of graduates who work in Banking and finance.[3 marks]
______________________________________________________________________________
______________________________________________________________________________
______________________________________________________________________________
______________________________________________________________________________
Answer _________________________________ million7
Type of jobGraduates
(%)Non-graduates
(%)
Public administration, education and health 41 22
Banking and finance 21 14
Retail, distribution, hotels and restaurants 10 22
Transport and communication 9 10
Manufacturing 7 13
Services 5 5
Construction 5 10
Other 2 3
18 Do not writeoutside the
box
(18)WMP/Jun16/43101F
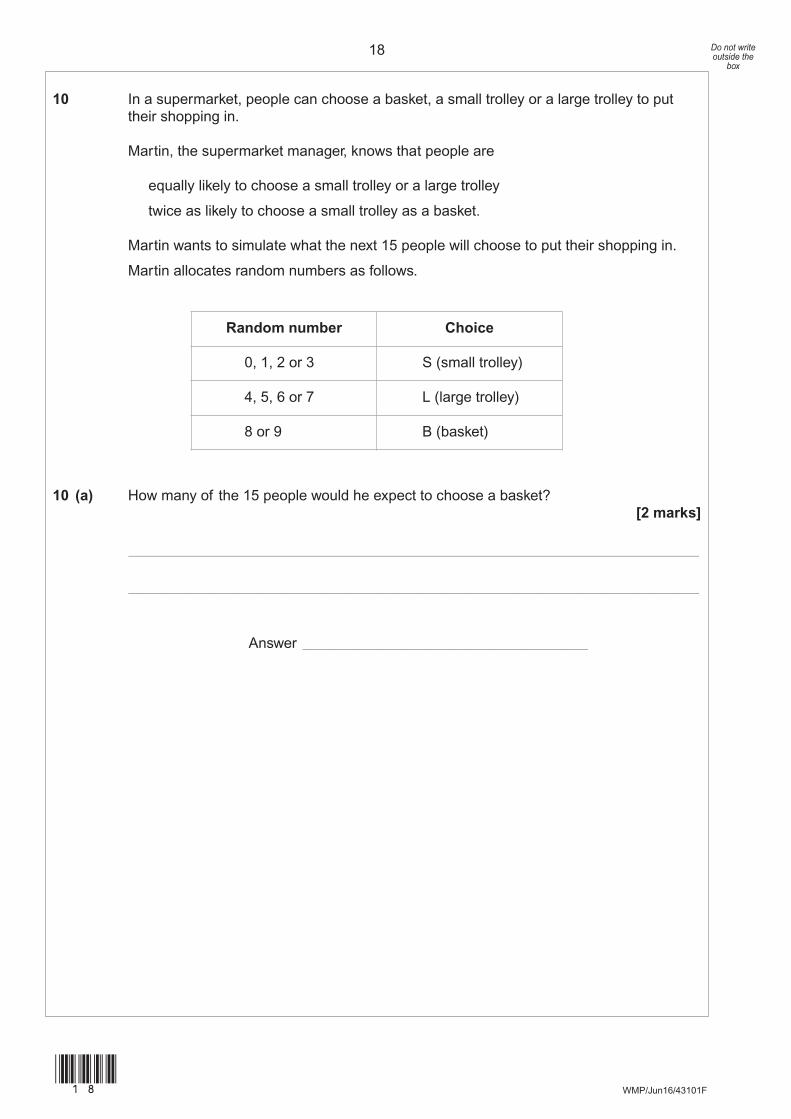
10 In a supermarket, people can choose a basket, a small trolley or a large trolley to puttheir shopping in.
Martin, the supermarket manager, knows that people are
equally likely to choose a small trolley or a large trolley
twice as likely to choose a small trolley as a basket.
Martin wants to simulate what the next 15 people will choose to put their shopping in.
Martin allocates random numbers as follows.
10 (a) How many of the 15 people would he expect to choose a basket?[2 marks]
______________________________________________________________________________
______________________________________________________________________________
Answer _______________________________________
Random number Choice
0, 1, 2 or 3 S (small trolley)
4, 5, 6 or 7 L (large trolley)
8 or 9 B (basket)
19 Do not writeoutside the
box
(19)Turn over �
WMP/Jun16/43101F
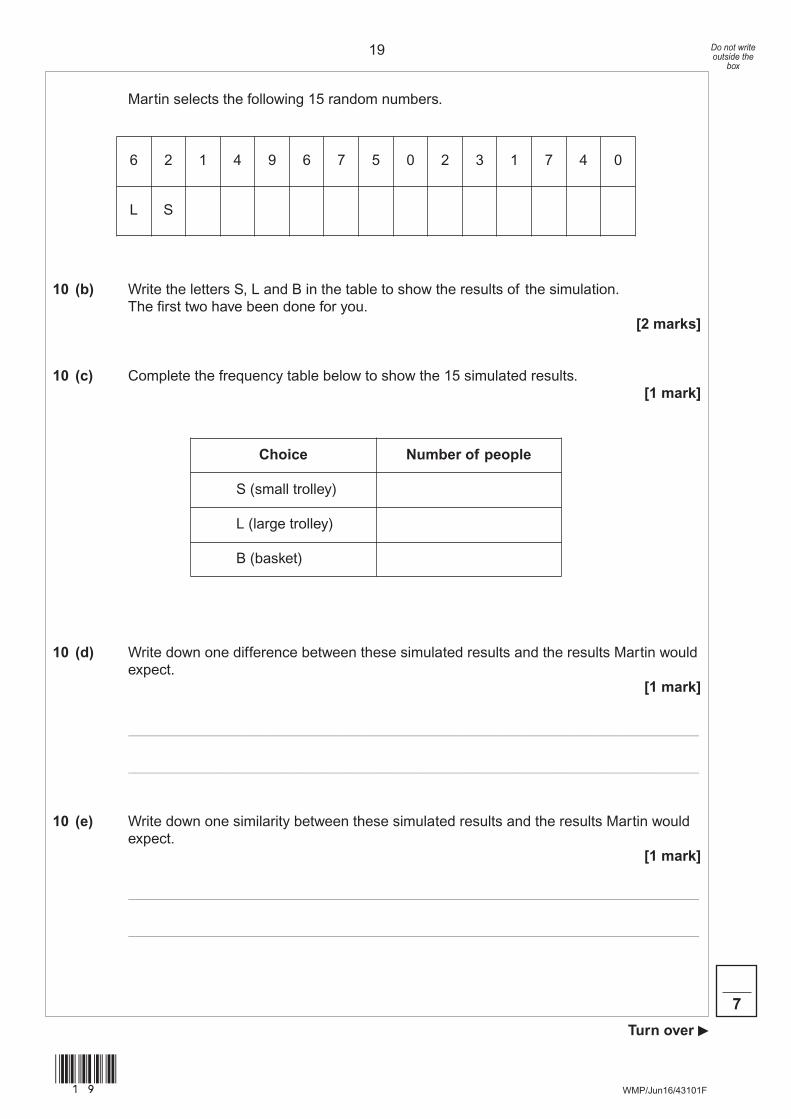
Martin selects the following 15 random numbers.
10 (b) Write the letters S, L and B in the table to show the results of the simulation.The first two have been done for you.
[2 marks]
10 (c) Complete the frequency table below to show the 15 simulated results.[1 mark]
10 (d) Write down one difference between these simulated results and the results Martin wouldexpect.
[1 mark]
______________________________________________________________________________
______________________________________________________________________________
10 (e) Write down one similarity between these simulated results and the results Martin wouldexpect.
[1 mark]
______________________________________________________________________________
______________________________________________________________________________
7
6 2 1 4 9 6 7 5 0 2 3 1 7 4 0
L S
Choice Number of people
S (small trolley)
L (large trolley)
B (basket)
20 Do not writeoutside the
box
(20)WMP/Jun16/43101F
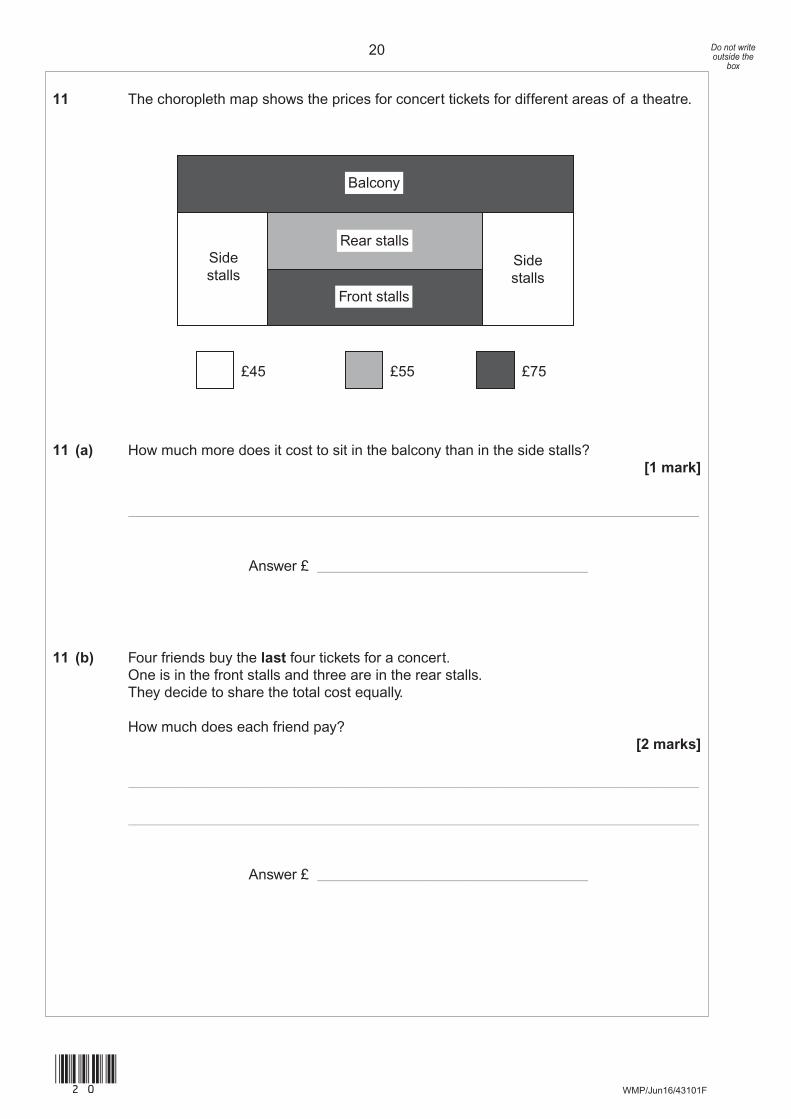
11 The choropleth map shows the prices for concert tickets for different areas of a theatre.
11 (a) How much more does it cost to sit in the balcony than in the side stalls?[1 mark]
______________________________________________________________________________
Answer £ _____________________________________
11 (b) Four friends buy the last four tickets for a concert.One is in the front stalls and three are in the rear stalls.They decide to share the total cost equally.
How much does each friend pay?[2 marks]
______________________________________________________________________________
______________________________________________________________________________
Answer £ _____________________________________
Balcony
Rear stalls
Front stalls
Sidestalls
£45
Sidestalls
£55 £75
21 Do not writeoutside the
box
(21)Turn over �
WMP/Jun16/43101F
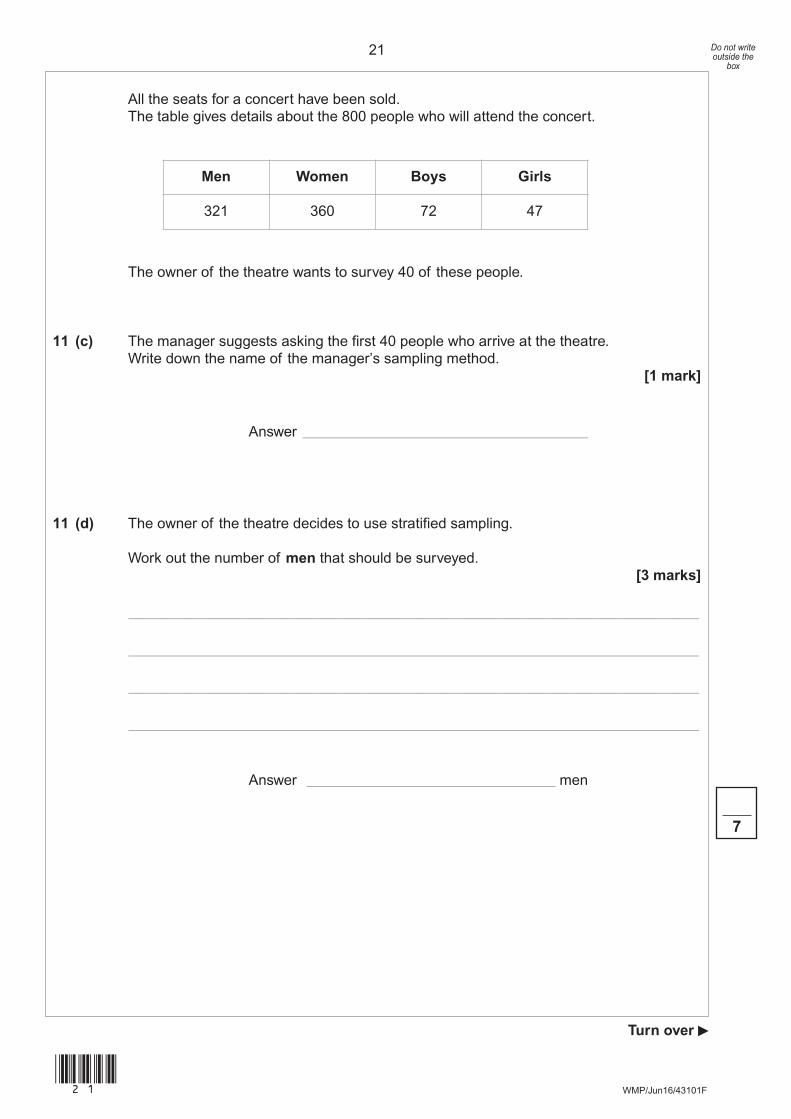
All the seats for a concert have been sold.The table gives details about the 800 people who will attend the concert.
The owner of the theatre wants to survey 40 of these people.
11 (c) The manager suggests asking the first 40 people who arrive at the theatre.Write down the name of the manager’s sampling method.
[1 mark]
Answer _______________________________________
11 (d) The owner of the theatre decides to use stratified sampling.
Work out the number of men that should be surveyed.[3 marks]
______________________________________________________________________________
______________________________________________________________________________
______________________________________________________________________________
______________________________________________________________________________
Answer __________________________________ men
7
Men Women Boys Girls
321 360 72 47
22 Do not writeoutside the
box
(22)WMP/Jun16/43101F
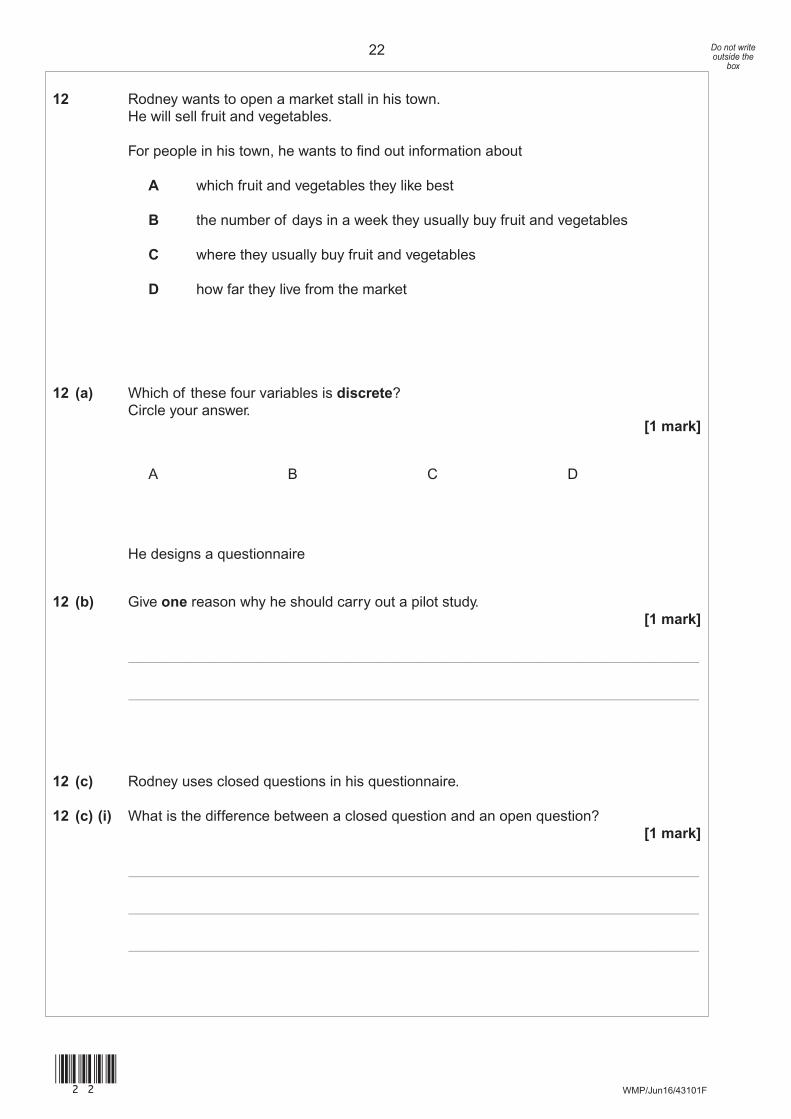
12 Rodney wants to open a market stall in his town.He will sell fruit and vegetables.
For people in his town, he wants to find out information about
A which fruit and vegetables they like best
B the number of days in a week they usually buy fruit and vegetables
C where they usually buy fruit and vegetables
D how far they live from the market
12 (a) Which of these four variables is discrete?Circle your answer.
[1 mark]
A B C D
He designs a questionnaire
12 (b) Give one reason why he should carry out a pilot study.[1 mark]
______________________________________________________________________________
______________________________________________________________________________
12 (c) Rodney uses closed questions in his questionnaire.
12 (c) (i) What is the difference between a closed question and an open question?[1 mark]
______________________________________________________________________________
______________________________________________________________________________
______________________________________________________________________________
23 Do not writeoutside the
box
(23)WMP/Jun16/43101F
12 (c) (ii) Give two different advantages of using closed questions in a questionnaire.[2 marks]
Advantage 1 __________________________________________________________________
______________________________________________________________________________
______________________________________________________________________________
Advantage 2 __________________________________________________________________
______________________________________________________________________________
______________________________________________________________________________
12 (d) Rodney delivers the questionnaire to all the houses in his town.Only 5% of the questionnaires are posted back to him.
Write down one thing that Rodney could have done to get a better response rate.[1 mark]
______________________________________________________________________________
______________________________________________________________________________
______________________________________________________________________________
END OF QUESTIONS
6
24
WMP/Jun16/43101F
There are no questions printed on this page
DO NOT WRITE ON THIS PAGEANSWER IN THE SPACES PROVIDED
(24)
Copyright information
For confidentiality purposes, from the November 2015 examination series, acknowledgements of third party copyright material will be published in a separate
booklet rather than including them on the examination paper or support materials. This booklet is published after each examination series and is available for free
download from www.aqa.org.uk after the live examination series.
Permission to reproduce all copyright material has been applied for. In some cases, efforts to contact copyright-holders may have been unsuccessful and AQA will
be happy to rectify any omissions of acknowledgements. If you have any queries please contact the Copyright Team, AQA, Stag Hill House, Guildford, GU2 7XJ.
Copyright © 2016 AQA and its licensors. All rights reserved.