Embed Size (px)
Citation preview

GAZPROM IN FIGURES 2001–2005
1

GAZPROM IN FIGURES 2001–2005
2

GAZPROM IN FIGURES 2001–2005
TABLE OF CONTENTS
Preface ......................................................................................................................................................4
World Energy Trends and Outlook ............................................................................................................5
Role of Gazprom in the World Gas Industry ..............................................................................................7
Gazprom and Russian Economy ..............................................................................................................10
Gazprom in Development, 2001–2005 ....................................................................................................13
Share Capital, Dividends, Financial and Market Indicators ................................................................13
Corporate Structure ............................................................................................................................15
Resource Base ....................................................................................................................................17
Exploration and Drilling........................................................................................................................22
Production ..........................................................................................................................................23
Refining................................................................................................................................................24
Transportation and Underground Storage ..........................................................................................26
Marketing and Sales ..........................................................................................................................28
Domestic Market ................................................................................................................................28
External Market ..................................................................................................................................30
Immovable Property Management ......................................................................................................32
Personnel ............................................................................................................................................33
3
GAZPROM IN FIGURES 2001–2005
PREFACE
Fact book «Gazprom in Figures 2001 – 2005» is a supplementary informational and statistical edition, pre-pared for OAO «Gazprom» annual General shareholders meeting 2006. It is aimed at providing detailedand firsthand figures about the company’s activities in gas business to shareholders and investors, allow-ing them prompt orientation in the large amount of information about Gazprom.
The Fact book is prepared on the basis of corporate reports and accounts of OAO «Gazprom», includingfigures of earlier annual reports, the issuer’s quarterly reports, offering circulars, as well as on the basisof Russian and foreign sources of publicly disclosed information.
The information presented in the Fact book enlarges and broadens the figures of Gazprom’s productionactivity, given in OAO «Gazprom» Annual report 2005. These figures are presented for the five-year period.The information concerns main business sectors – resource base development, hydrocarbon production,gas transportation and storage, refining, as well as gas supplies to the Russian and external markets.
All the terms, explanations, admissions and restrictions of OAO «Gazprom» Annual report 2005 are validin the present Fact book. In particular, the term OAO «Gazprom» refers to the head company of the Group,i.e. to Open Joint Stock Company «Gazprom». The Gazprom Group, the Group or Gazprom imply OAO «Gazprom», its subsidiaries and related companies taken as a whole.
4

GAZPROM IN FIGURES 2001–2005
WORLD ENERGY TRENDS AND OUTLOOK
World Primary Energy Consumption by Energy Source in 1990-2025*
Average Annual Primary Energy Consumption Growth in 2002–2025
5
1614121086420
1990 2001 2002 2010 2015 2020 2025OilNatural gasCoalNuclear powerOthers*Projected figures for 2010–2025Source: International Energy Outlook 2005.
bln
tons
of o
il eq
uiva
lent
2.521.510.50
OilNatural gasCoalNuclear powerOthers
Source: International Energy Outlook 2005.
perc
ent c
hang
e
1.8
1.9 2.3 2.0
1.0
1.9
2.2 2.22.7 3.1 3.5 3.8

GAZPROM IN FIGURES 2001–2005
World Natural Gas Consumption, 1990-2025*
Natural Gas Consumption by Region, 2004
Consumption of Gas Used for Electric Power and Thermal Energy Generation, 1978-2003
6
Region Natural Gas Consumption, bcm Percent Of World TotalRussia 436.0 15.6North America 771.4 27.6South America 118.5 4.2Europe 663.4 23.7Africa 76.7 2.7Near and Middle East 241.1 8.6Asia-Oceania 491.9 17.6Total 2 799.0 100.0
Source: Natural Gas Information, 2005; World Natural Gas Industry in 2004, 2005.
500040003000200010000
1990 2001 2002 2010 2015 2020 2025
*Projected figures for 2010-2025.
Source: International Energy Outlook 2005
bcm
2 1002 582 2 666 3 226
3 707 4 1054 539
Region Total Gas Consumption of Gas Total Gas Consumption of Gas Total Gas Consumption of GasConsumption, Used Consumption, Used Consumption, Used
bcm for Electric Power bcm for Electric Power bcm for Electric Powerand Thermal Energy and Thermal Energy and Thermal Energy
Generation Generation Generationbcm % bcm % bcm %
USSR (1978 )Russia (2000, 2003) 346.2 110.8 32.0 397.7 226.8 57.0 426.8 241.4 56.6North America 622.9 95.4 15.3 791.2 188.6 23.8 775.2 194.8 25.1South America 29.7 7.8 26.3 101.0 26.0 25.7 107.1 27.8 26.0Europe 297.5 55.8 18.8 597.1 181.5 30.4 643.9 207.2 32.2Africa 8.4 2.5 29.8 59.5 27.3 45.9 74.1 35.0 47.2Near and Middle East 25.8 7.4 28.7 189.4 73.9 39.0 225.8 97.1 43.0Asia-Oceania 57.4 17.2 30.0 395.5 165.7 41.9 466.5 202.0 43.3Total 1 387.9 296.9 21.4 2 531.4 889.8 35.2 2 719.3 1 005.3 37.0
Source: Natural Gas Information, 2005; World Natural Gas Industry in 2004, 2005.
1978 2000 2003

GAZPROM IN FIGURES 2001–2005
ROLE OF GAZPROM IN THE WORLD GAS INDUSTRY
World Natural Gas Reserves by Region as of 01.01.2005*
Regional Structure of Natural Gas Reserves as of 01.01.2005
7
Region Natural Gas Reserves, bcm
Russia 47,700
of which Gazprom 28,920
North America 7,446
South America 7,090
Europe 6,635
Africa 13,487
Near and Middle East 71,376
Asia-Oceania 17,442
Total 171,176
* Explored reserves (categories A+B+C1) for Russia, proved reserves for other regions.Source: Oil & Gas Journal, 2005; World Natural Gas Industry in 2004, 2005.
Russia* – 27.9 %
Gazprom* – 16.9 %
North America – 4.3 %
South America – 4.1 %
Europe – 3.9 %
Africa – 7.9 %
Near
and Middle East – 41.7 %
Asia and Oceania – 10.2 %
*Explored reserves
(categories А+В+С1)

GAZPROM IN FIGURES 2001–2005
Natural Gas Production by Region, 2004
Regional Structure of the World Natural Gas Production, 2004
World Natural Gas/LNG Export by Region, 2004
8
Region Export, bcm
Russia 202.3
of which Gazprom* 193.0
North America 124.9
South America 30.4
Europe 136.1
Africa 73.0
Near and Middle East 40.5
Asia-Oceania 191.8
Total 799.0
* based on management reports data
Source: Natural Gas Information, 2005; World Natural Gas Industry in 2004, 2005.
Russia – 22.5 %
Gazprom – 19.4 %
North America – 27.0 %
South America – 4.7 %
Europe – 12.9 %
Africa – 5.5 %
Near
and Middle East – 9.9 %
Asia and Oceania – 17.5 %
Region Volume of Production, bcm
Russia 632.7
of which Gazprom 545.1
North America 756.0
South America 131.0
Europe 362.8
Africa 155.0
Near and Middle East 278.6
Asia-Oceania 491.0
Total 2 807.1
Source: Natural Gas Information, 2005; World Natural Gas Industry in 2004, 2005.

GAZPROM IN FIGURES 2001–2005
Regional Structure of the World Natural Gas/LNG Export, 2004
Gas Reserves of the World’s Major Energy Companies, 2004
9
30
25
20
15
10
0
*Explored reserves (categories A+B+C1)
Source: Oil & Gas Journal, 2005; World Natural Gas Industry in 2004, 2005.
trilli
on c
ubic
met
res
28.9
26.6 25.8
6.65.6 5.0 4.6
Russia – 25.3 %
Gazprom – 24.2 %
North America – 15.6 %
South America – 3.8 %
Europe – 17.0 %
Africa – 9.2 %
Near
and Middle East – 5.1 %
Asia and Oceania – 24.0 %
Gazp
rom
(Rus
sia)
*
Nat
iona
l Ira
nian
Oil
(Iran
)
Qat
ar P
etro
leum
(Qat
ar)
Saud
i Ara
bian
Oil
(Sau
di A
rabi
a)
Abu-
Dhab
i Nat
iona
l Oil
(Abu
-Dha
bi)
Nig
eria
n N
atio
nal
Petro
leum
(Nig
eria
)
Sona
trac
(Alg
eria
)
PDV
SA(V
enez
uela
)
Iraq
Nat
iona
l Oil
(Iraq
)
Petro
nas
(Mal
aysi
a)
4.3 3.1 2.4

GAZPROM IN FIGURES 2001–2005
Gas Production of the World’s Major Energy Companies, 2004
GAZPROM AND RUSSIAN ECONOMY
Role of Gazprom in the Russian National Economic Indicators, 2005
Gas Reserves Structure in Russia as of 31.12.2005
10
600
500
400
300
200
100
0
Source: Oil & Gas Journal, 2005; World Natural Gas Industry in 2004, 2005.
bcm
545.1
90.9 88.5 86.0 84.4 73.655.1 53.6 50.6 47.3
Gazp
rom
(Rus
sia)
Roya
l Dut
ch /
Shel
l(N
ethe
rland
s) BP(U
K)
Exxo
nMob
il (U
SA)
Sona
trac
(Alg
eria
)
Nat
iona
l Ira
nian
Oil
(Iran
)
Saud
i Ara
bian
Oil
(Sau
di A
rabi
a)
Petro
nas
(Mal
aysi
a)
Tota
l(F
ranc
e)
Pem
ex
(Mex
ico)
Indicators %
GNP share More than 8.0
Russian natural gas reserves controlled More than 60
Share in national gas production 85.5
Volume, tcm Share, %
Gazprom (controlled reserves) 29.1 61.0
Independent producers 10.7 22.4
Undistributed fund 7.9 16.6
Total 47.7 100.0

GAZPROM IN FIGURES 2001–2005
Fuel and Energy Consumption Structure in Russia, 2005
11
Natural gas – 51.4 %
Gazprom’s Gas – 40.6 %
Oil
and Products – 20.9 %
Coal – 15.0 %
Hydro
and Nuclear Power – 10.0 %
Others – 2.7 %

GAZPROM IN FIGURES 2001–2005
Gazprom Group Gas Distribution Systems in Russia
12
Length of gas distribution pipelines
Russia total – about 600.0 thousand km
Gazprom Group – 463.4 km
Number of utilities plants with natural gas supply
Russia total – 175.1 thousand of utilities plants
Gazprom Group – 140.6 thousand of utilities plants
Number of industrial plants with natural gas supply
Russia total – 18.9 thousand of industrial plants
Gazprom Group – 13.7 thousand of industrial plants
Number of flats and private dwellings with natural gas supply
Russia total – about 41.0 mln of flats and dwellings
Gazprom Group – 25.1 mln of flats and dwellings
Number of boiler units with natural gas supplyRussia total – 44.3 thousand of boiler units
Gazprom Group – 32.2 thousand of boiler units

GAZPROM IN FIGURES 2001–2005
GAZPROM IN DEVELOPMENT, 2001 – 2005
Share Capital, Dividends, Financial and Market Indicators
Share Capital Structure of OAO «Gazprom», %
OAO «Gazprom» Share and ADS Price Growth
13
Shareholders 2001 2002 2003 2004 2005
Russian Federation, total 39.262 39.262 39.262 39.262 50.002
including:
Russian Federation represented by the Federal agency for federal property administration 38.373 38.373 38.373 38.373 38.373
ОАО «Rosgazifikacia» 0.889 0.889 0.889 0.889 0.889
OAO «Rosneftegaz» - - - - 10.740
Russian individuals 16.066 15.060 14.031 13.319 13.068
Russian legal entities 33.172 34.179 35.207 35.920 29.482
Non-residents 11.500 11.500 11.500 11.500 7.448
Total 100.0 100.0 100.0 100.0 100.0
at the end minimum maximum at the end minimum maximum
Year of the year of the year
2001 15.75 7.93 17.65 9.70 5.97 11.30
2002 24.02 15.64 35.45 11.70 9.70 19.65
2003 38.50 21.10 44.45 25.90 10.40 27.75
2004 76.57 40.55 84.70 35.50 26.25 39.40
2005 194.3 69.60 195.00 71.70 29.80 78.50
* 1 ADS is equivalent to 10 OAO «Gazprom» shares as of 31.12.2005..
Russian stock exchanges, rouble/share London stock exchange, US$/ADS*
Close price Close price

GAZPROM IN FIGURES 2001–2005
OAO «Gazprom» Market Capitalization Growth*
Dividend Dynamics
14
1009080706050403020100
2001 2002 2003 2004 2005
* In accordance with the OAO «Gazprom» dividend policy, market capitalization in this Report is calculated as the sum
of the arithmetic average of the daily market capitalization of the internal market and the arithmetic average
of the daily market capitalization of the external market.
US$
bln
11.35 20.4326.99
54.24
91.13
1.61.41.21.00.80.60.40.20
2001 2002 2003 2004 2005(recommended)
Roub
les
per S
hare
0.44
0.40
0.69
1.19
1.50
GAZPROM IN FIGURES 2001–2005
15
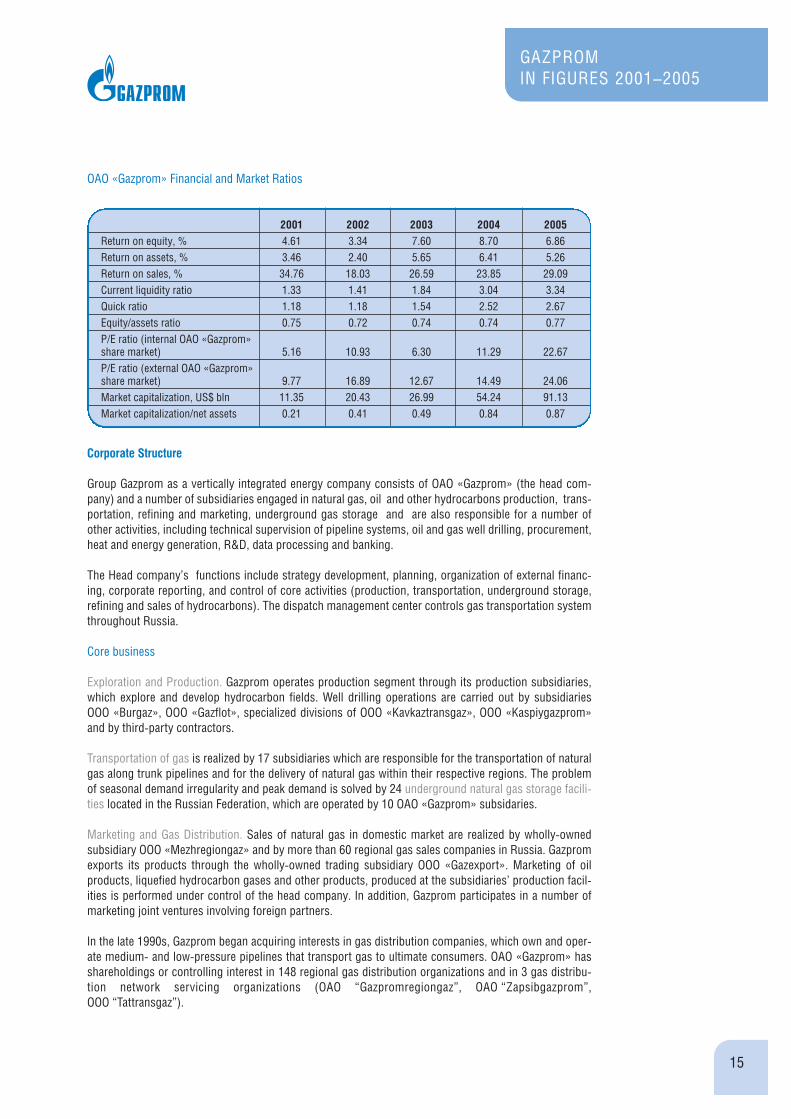
OAO «Gazprom» Financial and Market Ratios
Corporate Structure
Group Gazprom as a vertically integrated energy company consists of OAO «Gazprom» (the head com-pany) and a number of subsidiaries engaged in natural gas, oil and other hydrocarbons production, trans-portation, refining and marketing, underground gas storage and are also responsible for a number ofother activities, including technical supervision of pipeline systems, oil and gas well drilling, procurement,heat and energy generation, R&D, data processing and banking.
The Head company’s functions include strategy development, planning, organization of external financ-ing, corporate reporting, and control of core activities (production, transportation, underground storage,refining and sales of hydrocarbons). The dispatch management center controls gas transportation systemthroughout Russia.
Core business
Exploration and Production. Gazprom operates production segment through its production subsidiaries,which explore and develop hydrocarbon fields. Well drilling operations are carried out by subsidiaries OOO «Burgaz», OOO «Gazflot», specialized divisions of OOO «Kavkaztransgaz», OOO «Kaspiygazprom»and by third-party contractors.
Transportation of gas is realized by 17 subsidiaries which are responsible for the transportation of naturalgas along trunk pipelines and for the delivery of natural gas within their respective regions. The problemof seasonal demand irregularity and peak demand is solved by 24 underground natural gas storage facili-ties located in the Russian Federation, which are operated by 10 OAO «Gazprom» subsidaries.
Marketing and Gas Distribution. Sales of natural gas in domestic market are realized by wholly-ownedsubsidiary OOO «Mezhregiongaz» and by more than 60 regional gas sales companies in Russia. Gazpromexports its products through the wholly-owned trading subsidiary OOO «Gazexport». Marketing of oilproducts, liquefied hydrocarbon gases and other products, produced at the subsidiaries’ production facil-ities is performed under control of the head company. In addition, Gazprom participates in a number ofmarketing joint ventures involving foreign partners.
In the late 1990s, Gazprom began acquiring interests in gas distribution companies, which own and oper-ate medium- and low-pressure pipelines that transport gas to ultimate consumers. OAO «Gazprom» hasshareholdings or controlling interest in 148 regional gas distribution organizations and in 3 gas distribu-tion network servicing organizations (OAO “Gazpromregiongaz”, OAO “Zapsibgazprom”, OOO “Tattransgaz”).
2001 2002 2003 2004 2005
Return on equity, % 4.61 3.34 7.60 8.70 6.86Return on assets, % 3.46 2.40 5.65 6.41 5.26Return on sales, % 34.76 18.03 26.59 23.85 29.09Current liquidity ratio 1.33 1.41 1.84 3.04 3.34Quick ratio 1.18 1.18 1.54 2.52 2.67Equity/assets ratio 0.75 0.72 0.74 0.74 0.77P/E ratio (internal OAO «Gazprom» share market) 5.16 10.93 6.30 11.29 22.67P/E ratio (external OAO «Gazprom» share market) 9.77 16.89 12.67 14.49 24.06Market capitalization, US$ bln 11.35 20.43 26.99 54.24 91.13Market capitalization/net assets 0.21 0.41 0.49 0.84 0.87

Refining. Gazprom operates its gas and oil refining segment through its refining complex which includessix gas refineries, as well as refining plants of OAO «Sibur Holding» and OAO «Sibneft»
Ancillary activity. The Gazprom Group is also engaged in various activities that support the main business.These activities include construction, maintenance, refurbishment, and technical supervision of theUnified Gas Supply System, technological communication, energy generation, research and development,and banking (AB «Gazprombank» (ZAO), which meets most of Gazprom’s domestic banking needs (otherthan borrowings) is a part of the Gazprom Group)
Non-core business
The Gazprom Group also has shareholdings or controlling interest in various other businesses that are notrelated to its core operations. These include Gazprom-Media, a holding company that owns various massmedia assets; construction and telecommunication equipment production companies; trading activities;the largest non-government pension fund in Russia NPF «Gazfund», which provides pension services toemployees of Gazprom.
The Group undergoes internal reform aimed at improving management, strengthening control, and raisingthe transparency of its operations.
The first stage involved the improvement of the corporate governance structure, regulatory procedures,and the budgeting system at a head company level.
The second stage, which is currently underway, is aimed at raising the efficiency of Gazprom as a verti-cally integrated company, ensuring structural optimization of the control over the main types of activitiesat a subsidiary level, and raising the transparency.
The subsidiaries combining gas production and processing with its transportation and underground stor-age are to be split into the units specializing in separate types of activities. The structural reorganizationwill result in a split of cash flows related to the production, transportation, processing, underground stor-age, and marketing of gas and liquid hydrocarbons. Services, gas distribution networks, and social infra-structure are to be transformed into separate units. The reforms are intended to improve the transparencyof operating costs and provide for their fair statement when establishing regulated tariffs for gas trans-portation.
In 2006, the type of activities, which are not common for the subsidiaries engaged in production and pro-cessing is planned to be transferred to the new specialized companies, including such OAO «Gazprom»subsidiaries as OOO «Gazprom-PKhG» (underground gas storage) and OOO «Gazprompererabotka» (pro-cessing of gas and liquefied hydrocarbons), and specialized service companies will be singled out. It isfurther planned to complete the consolidation of communications services and establish specialized enti-ties to implement investment projects.
GAZPROM IN FIGURES 2001–2005
16

GAZPROM IN FIGURES 2001–2005
Gazprom’s Activities Structure as of 31.12.2005 *
Resource Base
Main Differences Between Russian Reserves System and International Standards
Hydrocarbon reserves of the Gazprom Group are estimated using both the Russian reserves system andmethodologies developed by the Society of Petroleum Engineers («SPE International Standards») and bythe Securities and Exchange Commission (“SEC Standards”). Since 1997, DeGolyer and MacNaughton, anindependent U.S. petroleum engineering consulting firm, has evaluated Gazprom’s reserves according tointernational standards.
The Russian reserves system differs significantly from the internationally accepted classifications in par-ticular with respect to the manner in which and the extent to which commercial factors are taken intoaccount in calculating reserves.
17
Head officeStrategy development, planning,
organization of external financing,corporate reporting,
control of principle areas of operations
UrengoigazpromYamburggazdobycha
OrenburggazpromAstrakhangazprom
NadymgazpromNoyabrskgazdobycha
GazflotBurgazSibneft
BashtransgazVolgotransgaz
VolgogradtransgazKavkaztransgazKubangazpromKaspiygazprom
LentransgazMostransgazPermtransgaz
SamaratransgazSevergazpromSurgutgazprom
TattransgazTomsktransgaz
TyumentransgazUraltransgazYugtransgaz
Gazexport ConstructionMaintenance
CommunicationPower generating
ScientificFinancial
companies
AstrakhangazpromOrenburggazpromUrengoigazpromSurgutgazpromSevergazpromSibur Holding
Regional companies in Russia
TelecommunicationcompaniesMass media
Trade companiesProduction companies
Pension fund
Explorationand Production
Transportationand Storage
RefiningMarketing and
Gas distributionAncillary activity
Core business
Non-core business
Mezhregiongaz
Gazpromregiongaz
148 Gas distribu-tion companies
––––––––––* Some of production, transportation and refining companies are also engaged in other activities.
GAZPROM IN FIGURES 2001–2005
The Russian reserves system
The Russian reserves system is based solely on an analysis of the geological attributes of reserves andtake into consideration the actual physical presence of hydrocarbons in geological formations or the prob-ability of such physical presence. Explored reserves are represented by categories A, B, and C1; prelimi-nary estimated reserves are represented by category C2; prospective resources are represented by category C3; and forecasted resources are represented by the categories D1 and D2.
Natural gas reserves in categories A, B and C1 are considered to be fully extractable. For reserves of oil andgas condensate, a predicted coefficient of extraction is calculated based on geological and technical factors.
Category A reserves are calculated on the part of a deposit drilled in accordance with an approved devel-opment project for the oil or natural gas field. They represent reserves that have been analyzed in suffi-cient detail.
Category B represents the reserves of a deposit (or portion thereof), the oil or gas content of which hasbeen determined on the basis of commercial flows of oil or gas obtained in wells at various hypsometricdepths. The main parameters and the major features of the deposit that determine the conditions of itsdevelopment have been studied in sufficient detail to draw up a project to develop the deposit.
Category C1 represents the reserves of a deposit (or of a portion thereof), the oil or gas content of whichhas been determined on the basis of commercial flows of oil or gas obtained in wells and positive resultsof geophysical exploration of non-probed wells. Category C1 reserves are computed on the basis of resultsof geophysical exploration work and production drilling and must have been studied in sufficient detail toyield data from which to draw up either a trial industrial development project in the case of a natural gasfield or a technological development scheme in the case of an oil field.
DeGolyer and MacNaughton evaluates Gazprom “proved” reserves according to SEC Standards, and“probable” and “possible” reserves according to SPE International Standards
SPE International Standards
SPE International Standards take into account not only the probability that hydrocarbons are physicallypresent in a given geological formation but also the economic viability of recovering the reserves.Exploration and drilling costs, ongoing production costs, transportation costs, taxes, prevailing prices forthe products, and other factors that influence the economic viability of a given deposit are taken into con-sideration.
Under SPE International Standards, reserves are classified as proved, probable and possible.
Proved reserves include reserves that are confirmed with a high degree of certainty through an analysis ofthe development history and/or volume method analysis of the relevant geological and engineering data.Proved reserves are those that have a better than 90 % chance of being produced.
Probable reserves are those reserves in which hydrocarbons have been located within the geologicalstructure with a lesser degree of certainty because fewer wells have been drilled and/or certain operationaltests have not been conducted. Probable reserves are those reserves that have a better than 50 % chanceof being produced.
An evaluation of proved and probable natural gas reserves naturally involves multiple uncertainties. Theaccuracy of any reserves evaluation depends on the quality of available information and engineering andgeological interpretation. Based on the results of drilling, testing and production after the audit date,reserves may be significantly restated upwards or downwards. Changes in the price of natural gas, gascondensate or oil may also affect proved and probable reserves estimates, as well as estimates of futurenet revenues and present worth, because the reserves are evaluated, and the future net revenues andpresent worth are estimated, based on prices and costs as of the audit date.
18

GAZPROM IN FIGURES 2001–2005
Differences between SPE International Standards and SEC Standards
Certainty of Existence. Under SPE International Standards, reserves in undeveloped drilling sites that arelocated more than one well location from a commercial producing well may be classified as provedreserves if there is “reasonable certainty” that they exist. Under SEC Standards, it must be “demonstratedwith certainty” that reserves exist before they may be classified as proved reserves. In their evaluation of Gazprom’s proved reserves DeGolyer and MacNaughton has applied the stricter SEC Standards withrespect to certainty of existence.
Duration of License. Under SPE International Standards, proved reserves are projected to the economicproduction life of the evaluated fields. Under SEC Standards, oil and gas deposits may not be classified asproved reserves if they will be recovered after the expiration of a current license period unless the licenseholder has the right to renew the license and there is a demonstrated history of license renewal.
The Subsoil Resources Law provides that a license holder shall be entitled to receive an extension of anexisting license where extractable reserves remain upon the expiration of the primary term of the license,provided that the license holder is in material compliance with the license agreement. In addition,Gazprom prepares and submits for government approval development plans for its fields based on theeconomic life of the field, even where this life exceeds the primary term of the associated license.Currently Gazprom is in material compliance with license agreements, and will be entitled to extend themto the full economic lives of the associated fields upon the expiration of their primary terms. Recently theterms of five Gazprom’s production licenses were extended to the end of the economic lives of the fields.
Gazprom believes that its licenses will be extended on its request as they expire, but the absence of anabsolute legal right to extension and a significant demonstrated history of extension makes it uncertainwhether extractable reserves Gazprom plans to recover after the expiration of a current license periodmay be considered proved reserves under SEC Standards. SEC experts have not provided definitive guid-ance on whether in these circumstances such extractable reserves could be considered proved under SECStandards.
19
GAZPROM IN FIGURES 2001–2005
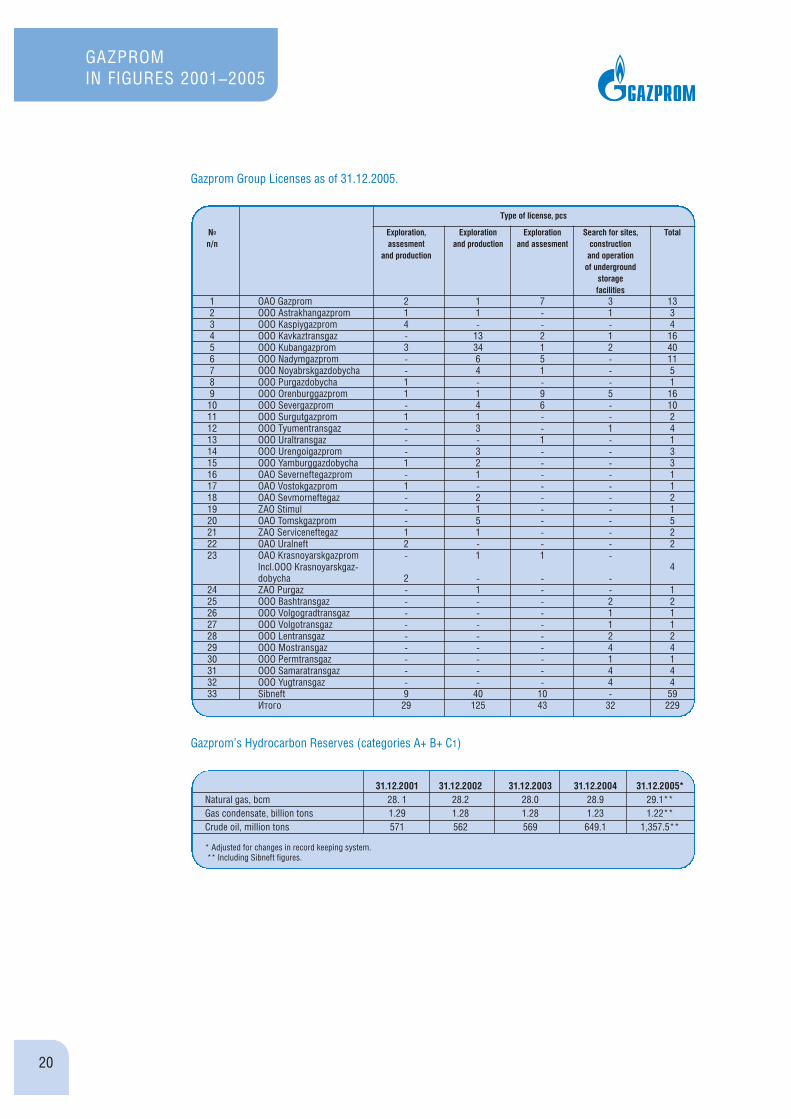
Gazprom Group Licenses as of 31.12.2005.
Gazprom’s Hydrocarbon Reserves (categories A+ B+ C1)
20
№ Exploration, Exploration Exploration Search for sites, Totalп/п assesment and production and assesment construction
and production and operationof underground
storagefacilities
1 OAO Gazprom 2 1 7 3 132 OOO Astrakhangazprom 1 1 - 1 33 OOO Kaspiygazprom 4 - - - 44 OOO Kavkaztransgaz - 13 2 1 165 OOO Kubangazprom 3 34 1 2 406 OOO Nadymgazprom - 6 5 - 117 OOO Noyabrskgazdobycha - 4 1 - 58 OOO Purgazdobycha 1 - - - 19 OOO Orenburggazprom 1 1 9 5 16
10 OOO Severgazprom - 4 6 - 1011 OOO Surgutgazprom 1 1 - - 212 OOO Tyumentransgaz - 3 - 1 413 ООО Uraltransgaz - - 1 - 114 OOO Urengoigazprom - 3 - - 315 OOO Yamburggazdobycha 1 2 - - 316 OAO Severneftegazprom - 1 - - 117 ОАО Vostokgazprom 1 - - - 118 OAO Sevmorneftegaz - 2 - - 219 ZAO Stimul - 1 - - 120 OAO Tomskgazprom - 5 - - 521 ZAO Serviceneftegaz 1 1 - - 222 OAO Uralneft 2 - - - 223 OAO Krasnoyarskgazprom - 1 1 -
4Incl.ООО Krasnoyarskgaz-dobycha 2 - - -
24 ZAO Purgaz - 1 - - 125 ООО Bashtransgaz - - - 2 226 ООО Volgogradtransgaz - - - 1 127 ООО Volgotransgaz - - - 1 128 ООО Lentransgaz - - - 2 229 ООО Mostransgaz - - - 4 430 ООО Permtransgaz - - - 1 131 ООО Samaratransgaz - - - 4 432 ООО Yugtransgaz - - - 4 433 Sibneft 9 40 10 - 59
Итого 29 125 43 32 229
Type of license, pcs
31.12.2001 31.12.2002 31.12.2003 31.12.2004 31.12.2005*Natural gas, bcm 28. 1 28.2 28.0 28.9 29.1**Gas condensate, billion tons 1.29 1.28 1.28 1.23 1.22**Crude oil, million tons 571 562 569 649.1 1,357.5**
* Adjusted for changes in record keeping system.** Including Sibneft figures.

GAZPROM IN FIGURES 2001–2005
Location of Gas Reserves (categories A+ B+C1) by Russian Regions and Gazprom’s Major Gas Fields
Gazprom’s Hydrocarbon Reserves Audited by DeGolyer and MacNaughton (in comparison with Russian reserve system)*
21
Kharasaveiskoye
Shtokmanovskoye
Yamburgskoye
Bovanenkovskoye
Yuzhno-Russkoye
ZapolyarnoyeMedvezhye
Urengoiskoye
Komsomolskoye
Orenburgskoye
AstrakhanskoyeSouthern
Urals
Siberian
Far East
Privolzhskiy
North-Western
Shelf
0,32 %
2,85 %
8,98 % 1,04 %
0,03 %
10,08 %
76,70 %
31.12.2001 31.12.2002 31.12.2003 31.12.2004 31.12.2005
Russian reserve Internaional Russian reserve Internaional Russian reserve Internaional Russian reserve Internaional Russian reserve Internaional
system standards system standards system standards system standards system standards
Natural gas, bcm 24.5 17.7 25.2 18.7 25.3 18.5 27.7 20.9 27.6 20.7
Gas condenstate, million tons 883.2 367.1 1,144.2 515.8 1,142.7 588.2 1,095.2 654.84 1,094.3 690.5
Crude oil,million tons 362.8 106.9 362.4 106.5 383.9 132.5 496.2 235.96 564.7 299.5
*Sibneft figures are not included.
**Data presented include only those elements of the fields included by DeGolyer and MacNaughton in their evaluations of 24 fields as of 31.12.2005 and 31.12.2004, 20 fields as of 31.12.2003, 19 fields as of 31.12.2002,17fields as of 31.12.2001.
***Including Shtokmanovskoye and Prirazlomnoye fields in evaluation to international standards as of 31.12.2004
Categories Proved Categories Proved Categories Proved Categories Proved Categories Proved
A, B и C1 and probable A, B и C1 and probable A, B и C1 and probable A, B и C1*** and probable*** A, B и C1 and probable
Gazpromreserves in fieldsevaluated to international standards **

Gazprom’s Natural Gas Reserves (categories A+ B+C1) by Major Fields, bcm
Exploration and Drilling
Number of Exploration Wells Drilled by Federal Districts (FD)*
Well construction, units.*
GAZPROM IN FIGURES 2001–2005
22
2001 2002 2003 2004 2005 Urals federal districtWestern SiberiaUrengoiskoye 5,599.4 5,514.6 5,695.3* 5,535.5* 5,410.5*Yamburgskoye 4,184.5 4,288.1 4,134.7 3,987.6 3,891.2Zapolyarnoye 3,524.2 3,487.0 3,419.7 3,413.8 3,315.1Medvezhye 608.1 577.3 549.0 523.5 515.0Komsomolskoye 531.0 499.9 468.0 438.3 410.3Yuzhno-Russkoe - - - 686.8 718.2Yamal PeninsulaBovanenkovskoye 4,375.0 4,374.9 4,374.9 4,374.9 4,374.9Kharasaveiskoye 1,259.0 1,258.9 1,258.9 1,258.9 1,258.9Northwestern federal district (The Barents Sea)Shtokmanovskoye** 2,536.4 1,268.2 1,268.2 2,536.4 2,935.6Southern federal districtAstrakhanskoye 2,542.9 2,531.1 2,519.7 2,506.2 2,493.3Privolzhski federal districtOrenburgskoye 847.1 825.7 805.6 787.1 768.8Total fields mentioned 26,007.6 24,625.7 24,494.0 26,049.0 26,091.8
* Including En-Yahinskoe, Pestsovoye fields (Cenoman)and North Urengoiskoe field (Cenoman). ** In accordance with Gazprom’s participation with Rosneft and other parties in a joint activity for the development of theShtokmanovskoye field included: in 2001 – 100 %, in 2002 and 2003 – 50 %., in 2004 and 2005 – 100 % of reserves of thisfield.
As of December 31
2001 2002 2003 2004 2005 Urals FD 5 24 13 16 22 Northwestern FD 22 - 2 1 4Central FD 5 14 1 12 16Southern FD 5 5 7 8 7Privolzhski FD 1 3 1 4 5Siberian FD - - - 1 6Total 38 46 24 42 60
* Wells in underground storage facilities included. Sibneft figures excluded.
Year Total Production Exploration2001 195 157 382002 288 242 462003 333 309 242004 495 453 422005 359 299 60
* Wells in underground storage facilities included. Sibneft figures excluded.

GAZPROM IN FIGURES 2001–2005
Production
Gazprom’s Production Segment Data
Regional Distribution of Gazprom’s Natural Gas Production*
23
2001 2002 2003 2004 2005Total natural gas production, bcm 512.0 522.0 540.1 545.1 547.9*Gas production wells in operation, units 5,247 5,402 5,736 6,094 6,434Comprehensive and preliminary gas treatment plants, units 154 155 158 161 169Booster compressor stations, units 37 36 40 41 44
*The Gazprom’s production volume includes 51% of the ZAO “Purgas” production and 100% of ZAO “Nortgas” production starting fromSeptember,21,2005. Sibneft figures are excluded.
Yamburgskoye
ZapolyarnoyeMedvezhyeUrengoiskoye
Komsomolskoye
Orenburgskoye
AstrakhanskoyeSouthern
Urals
Siberian
Privolzhskiy
North-Western
0,5 %
3,4 %
2,5 %
93,0 %
0,6 %
* Sibneft figures are excluded.

Gazprom’s Hydrocarbon Production Data by Russian Regions*
Refining
Processing of Raw Materials by Gazprom Group*
GAZPROM IN FIGURES 2001–2005
24
2001 2002 2003 2004 2005
Volume Percentage Volume Percentage Volume Percentage Volume Percentage Volume Percentage
of overall production of overall production of overall production of overall production of overall production
Urals federal districtNatural gas, bcm 473.5 92.5 482.8 93.0 500.1 92.6 506.6 93.0 509.3 93.0Gas condensate, thousand tons 4,971.3 52.4 5,090.5 51.4 5,207.6 51.0 6,033.4 54.5 6,545.3 56.1Crude oil, thousand tons 508.3 72.2 509.0 72.1 499.0 62.2 489.4 53.3 510.4 39.6
Northwestern federal districtNatural gas, bcm 3.2 0.6 2.9 0.6 2.9 0.5 2.8 0.5 2.8 0.5Gas condensate, thousand tons 381.7 4.0 374.6 3.8 399.0 3.3 278.2 2.5 249.8 2.1Crude oil, thousand tons - - - - - - 62.3 6.8 89.3 6.9
Southern federal districtNatural gas, bcm 12.5 2.4 12.9 2.5 13.3 2.5 13.2 2.4 13.6 2.5Gas condensate, thousand tons 3,770.6 39. 7 3,934.2 39.7 4,032.7 39.5 4,084.2 36.9 4,243.5 36.4Crude oil, thousand tons 3.5 0.5 - - 105.8 13.2 159.2 17.3 123.2 9.6
Privolzhski federal districtNatural gas, bcm 22.8 4.5 21.5 4.1 20.1 3.7 18.6 3.4 18.7 3.4Gas condensate, thousand tons 358.4 3.8 319.5 3.2 276.0 2.7 268.3 2.4 269.0 2.3Crude oil, thousand tons 192.6 27.3 192.1 27.2 191.6 23.9 208.0 22.6 556.1 43.1
Siberian federal districtNatural gas, bcm - - 1.9 0.3 3.7 0.7 3.9 0.7 3.5 0.6Gas condensate, thousand tons - - 184.0 1.9 363.9 3.5 401.5 3.6 357.6 3.1Crude oil, thousand tons - - 5.3 0.8 6.4 0.8 - - 10.3 0.8
TotalNatural gas, bcm 512.0 100 522.0 100 540.1 100 545.1 100 547.9 100Gas condensate, thousand tons 9,482.0 100 9,903.0 100 10,279.2 100 11,065.6 100 11,665.2 100Crude oil, thousand tons 704.4 100 706.4 100 802.8 100 918.9 100 1289.3 100
* Data for 2001 through 2003 includes 90 % of production from the Cenomanian layer of the West Tarkosalinsk field. Up to 2004, pursuant to an agreement with OAO «Purneftegazgeologia», the holder of the production licensefor the field, Gazprom received 90 % of the production from the Cenomanian layer of the field in exchange for development. Changes in tax legislation that took effect in early 2004 required to change the terms of the agreement,and the production and development of the field ceased in the first quarter of 2004. Within the framework of the settlement, the production license for the West Tarkosalinsk field was transferred to OOO «Purgazdobycha». InNovember 2004 Gazprom acquired this company and production activities in the field continued. Data for 2004 includes 100 % of the production from the West Tarkosalinsk field beginning from November, 2004.Data includes 51 % of the production from the Gubkinskoye field. 51% of the ZAO “Purgas” production is included starting from the second half of 2002. 100% of ZAO “Nortgas” production is included starting fromSeptember,21,2005. Sibneft figures are excluded.
2001 2002 2003 2004 2005Natural gas, bcm 38.7 39.3 39.8 39.5 41.3
of which third-party product 4.0 5.2 6.0 7.1 7.4
Unstable gas condensate and crude oil,thousand tons 14,555.0 16,905.7 17,154.6 16,052.4 15,101.0
of which third-party product 4,561.8 6,926.6 6,965.8 4,755.3 3,075.4
Stabilized gas condensate and crude oil (preliminary processing), thousand tons** 5,348.1 6,193.1 6,410.8 6,539.4 6,571.4
of which third-party product 382.3 966.7 1,108.4 522.1 582.1
* Sibur Holding and Sibneft figures are excluded.
** Stabilized gas condensate, going for the preliminary processing, is produced from unstable gas conden-sate, part of which is prerefined (de-ethanized ) at the Gazprom Group’s refineries.

GAZPROM IN FIGURES 2001–2005
Production of refining products by Gazprom Group*
Major Type of Products, Produced by Sibur Holding, thousand of tons
25
2001 2002 2003 2004 2005Dry natural gas (bcm) 31.3 31.5 31.4 31.4 33.1
of which third-party product 3.5 4.7 5.4 6.4 6.6Sulphur (thousand tons) 4,964.7 5,304.5 5,478.3 5,599.0 5,856.2
of which third-party product 270.3 328.5 366.0 415.0 494.4Stable condensate and oil (thousand tons) 10,715.7 13,105.7 13,119.2 12,778.2 11,373.3
of which third-party product 4,032.4 5,836.5 5,785.0 4,524.1 2,522.1Gasoline (thousand tons) 1,216.0 1,400.1 1,842.0 2,005.1 2,242.7
of which third-party product 0.2 - - - -Diesel fuel (thousand tons) 1,631.7 1,804.3 1,771.9 1,869.0 1,784.7
of which third-party product 14.4 235.0 229.2 136.9 143.9Furnace fuel oil (thousand tons) 384.6 374.1 390.6 392.8 380.8
of which third-party product 0.2 - - - -Wide liquid fractions(thousand tons) 44.9 87.1 263.2 1,082.2 1,467.5
of which third-party product 14.1 50.9 226.7 831.1 925.9Helium (thousand cubic meters) 5,335.7 6,291.3 6,473.7 3,452.3 1,636.4Ethane (thousand tons) 315.6 326.5 322.9 235.8 122.5
of which third-party product 29.7 36.3 39.3 33.2 14.4Odorant (tons) 3,411.3 2,750.8 3,010.0 2,661.0 3,109.0Technical carbon (thousand tons) 29.4 28.5 32.1 35.1 33.6Liquified gases (thousand tons) 2,300.6 2,416.8 2,647.9 2,132.8 2,102.3
of which third-party product 189.5 481.2 566.3 278.8 220.4Fractions of multiple componenthydrocarbons (thousand tons) 234.0 257.3 240.0 188.8 -
of which third-party product 71.9 53.4 44.4 41.5 -Methanol (thousand tons) - 333.2 753.0 723.4 614.0Pentanes-hexane fraction, thousand tons 147.1 118.2 130.2 107.4 75.1
of which third-party product 7.0 11.4 20.2 7.7 -Light distillate of gas condensate, tons 1,212.4 1,292.1 1,007.4 1,034.1 1,055.6
of which third-party product 175.9 343.4 375.3 209.4 336.8TC-1 jet engine fuel, thousand tons - - - 15.0 50.9
* Sibur Holding and Sibneft figures are excluded.
2001 2002 2003 2004 2005 Liquefied gases 2,130 1,667 2,481 2,817 2,891Monomers and monomer fractions 899 1,106 1,788 1,747 1,867Synthetic rubber 464 314 519 573 584Polymers 359 220 370 431 465Products of organic synthesis 538 332 660 762 813Fuel and components, combustive-lubricating materials 911 408 405 535 651Tires (thousands of units) 15.5 3.4 17.6 15.2 13.4

GAZPROM IN FIGURES 2001–2005
Major Type of Products, Produced by Sibneft, 4th Quarter 2005, thousand of tons
Transportation and Storage
Gazprom’s Gas Transportation and Underground Storage Segment Data
26
2001 2002 2003 2004 2005
Length of trunk pipelines and pipeline branches, thousand km 149.3 149.9 151.6 152.8 155.0Compressor stations, units 253 256 264 263 268Volume of gas received by Unified gas supply system, bcm 630.6 637.1 674.1 684.4* 699.7*
Underground gas storage facilities in Russia (UGSF), units 22 23 24 24 24Volume of gas pumpedinto UGSF in Russia,incl.gas of independent producers, bcm 44.9 42.2 49.4 42.6 46.3Volume of gas retrieval from UGSF in Russia, bcm 38.9 38.4 40.4 37.9 42.8Maximum daily gas retrieval during the heating season, mcm/day 433.6 469.0 409.8 486.8 572.3
* Data do not include volumes of gas retrieved from foreign UGSF and delivered outside the Russian Federation.
Gas Transportation
Underground Storage
Omsk oil refinery Moscow oil refinery TotalRaw materialsDesalinized oil 3,303 791 4,094ProductsGasoline - total 921 196 1,117
Super-98 9 - 9АИ-96 85 - 85АИ-95 - 35 35АИ-92 411 110 521АИ-80 191 37 228А-76 4 - 4natural gasoline 222 - 222straight-run gasoline - 14 14
Diesel fuel - total 1,091 222 1,313summer diesel fuel 885 185 1,070winter and arctic diesel fuel 206 37 243
TC-1 jet engine fuel 231 47 278Furnace fuel oil 484 213 697Oil cokes 42 - 42Lubricating oils 53 - 53
diesel libricant 19 - 19motor oils 5 - 5transmission oils 2 - 2industrial oils 22 - 22others 5 - 5
Oil bitumen 11 34 45Liquefied hydrocarbon gases 81 17 98
GAZPROM IN FIGURES 2001–2005
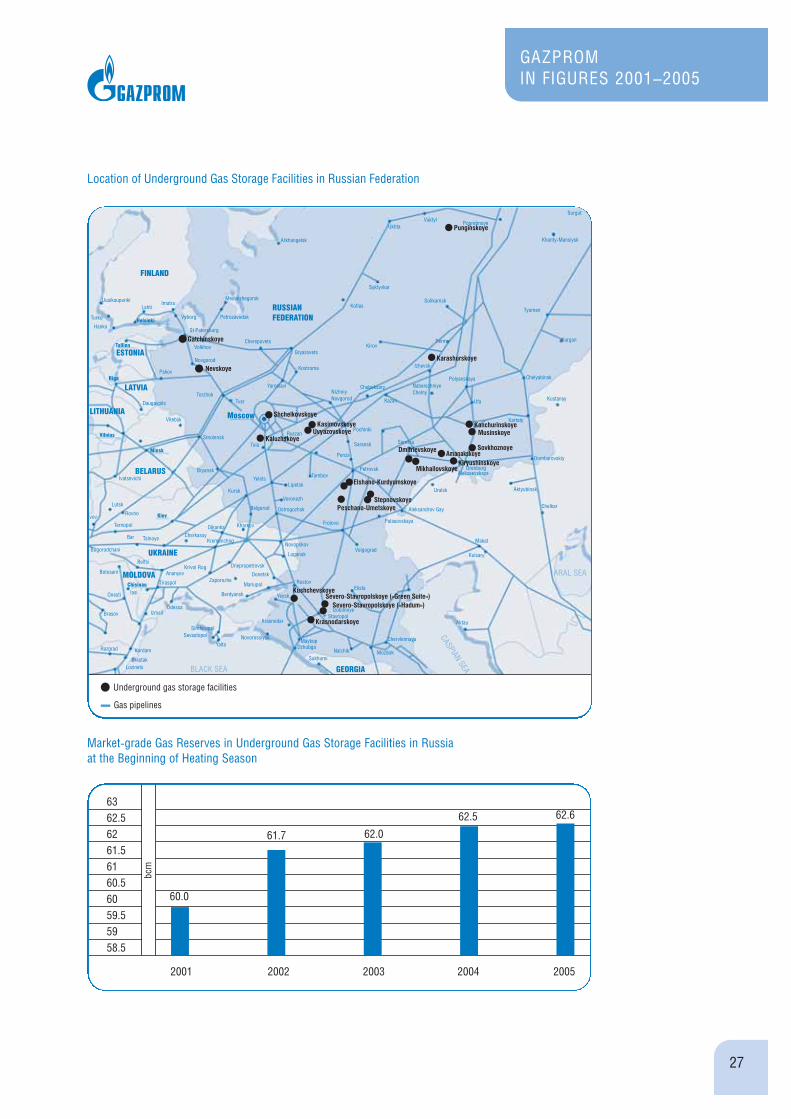
Location of Underground Gas Storage Facilities in Russian Federation
Market-grade Gas Reserves in Underground Gas Storage Facilities in Russiaat the Beginning of Heating Season
27
6362.56261.56160.56059.55958.5
2001 2002 2003 2004 2005
bcm
60.0
62.6
61.7 62.0
62.5
Gatchinskoye
Nevskoye
ShchelkovskoyeKasimovskoye
UvyazovskoyeKaluzhskoye
Karashurskoye
KanchurinskoyeMusinskoye
Sovkhoznoye
KiryushinskoyeAmanakskoye
Mikhailovskoye
Dmitrievskoye
Punginskoye
Peschano-Umetskoye
KushchevskoyeSevero-Stavropolskoye («Green Suite»)
Severo-Stavropolskoye («Hadum»)
Krasnodarskoye
Elshano-Kurdyumskoye
Stepnovskoye
Underground gas storage facilities
Gas pipelines

GAZPROM IN FIGURES 2001–2005
Marketing and Sales
Domestic market
Gazprom’s Gas Sales to Russian Consumers, bcm
Structure of Gazprom’s Gas Sales in Russia by Groups of Consumers, 2005
Regulation of domestic natural gas prices
The Russian gas market is currently represented by two sectors: regulated and non-regulated. Gazpromsupplies gas to regulated sector, where directive gas prices fixed by the Government are used.
The Government regulates internal prices only for natural gas sold by Gazprom. Prices of crude oil, coaland natural gas sold by independent producers are market-regulated.
The result of the regulation of natural gas prices at below market ones has been a shift towards increasedshare of gas in energy consumption compared with other sources of energy in Russia. The Russian econ-omy is the world’s most gas-intensive. In contrast to many other industrial economies where gas is pri-marily used for household consumption, natural gas in Russia is used principally for power generation andin the metallurgical and chemical industries. Gas supply to household consumers accounted for 16 % ofall deliveries to Russian consumers in 2005.
28
310308306304302300298296294292
2001 2002 2003 2004 2005
bcm 300.8
307
298
309.1
305.7
Power generation – 38 %
Metallurgy – 7 %
Agro-chemistry – 7 %
Household consumers – 16 %
Utility sector – 10 %
Others – 22 %

GAZPROM IN FIGURES 2001–2005
Wholesale prices fixed by the Federal Tariffs Service (FTS) are differentiated between household and otherconsumers, as well as along price bands among which prices vary based on relative distance from the gasproduction region to the consumer. Federal Tariffs Service approved Gazprom’s proposal to improve terri-torial regulated price differentiation, and the number of price bands was increased to thirteen (effectiveJanuary 1, 2006).
Regulated Wholesale Gas Prices for Consumers in the Russian Federation (Except Gas Sold to HouseholdConsumers and Gas Used at Automobile Gas-Filling Compressor Stations), roubles/1000 m3
The total price paid by consumers (except household consumers) includes the regulated wholesale price,a transportation tariff and a marketing and sales services fee. Gazprom is paid the wholesale price estab-lished by the FTS. The transportation tariff is paid to the gas distribution companies which transport gasthrough their low- and middle-pressure networks to the consumers, and the marketing and sales servicesfees are paid to the regional gas sales companies.
Regulated Wholesale Gas Prices for Household Consumers in the Russian Federation, roubles/1000 m3
The total price paid by household consumers for natural gas is established by administrations of theRussian regions and covers the regulated wholesale price for household consumers, a transportation tar-iff and a marketing and sales services fee. In some cases, the total price may also cover a utilities ormunicipal maintenance fee. Pricing structure for household consumers is complicated by such factors asprivilege categories of consumers (pensioners and war veterans pay reduced tariff), lack of metering
29
Price bands from 20.01.2001 from 15.02.2002 from 01.07.2002 from 01.01.2003 from 01.01.2004 from 01.01.2005 from 01.01.20060 264 317 365 438 526
I 319 383 440 528 634 619 677
II 372 446 513 616 739 745 815
III 417 500 575 690 828 879 960
IVа 923 1,041
IV 438 526 605 726 871 985 1,080
V 458 550 633 760 912 1,005 1,104
VI 472 566 651 781 937 1,033 1,136
VII 1,040 1,148
VIII 1,088 1,202
IX 1,119 1,241
X 1,154 1,284
Xа 1,304
XI 1,160 1,295
Price bands from 01.03.2001 from 15.02.2002 from 01.08.2002 from 01.02.2003 from 01.01.2004 from 01.01.2005 from 01.01.20060 226 271 314 387 464
I 238 286 332 410 492 579 677
II 260 312 362 447 536 616 726
III 279 335 389 480 576 671 794
IVа 678 833
IV 285 342 397 490 588 720 857
V 291 349 405 500 600 725 863
VI 296 355 412 508 610 730 870
VII 736 883
VIII 744 896
IX 752 907
X 764 920
Xа 920
XI 728.5 920

GAZPROM IN FIGURES 2001–2005
devices on individual apartments (gas fees are generally calculated in accordance with established normsand not with the volume of actually consumed gas), impossibility to cut off certain customers for non-pay-ment because of legal and technical constraints.
External market
Gazprom’s Gas Sales in Main External Markets, bcm
Gazprom’s Gas Sales, 2005
30
2001 2002 2003 2004 2005
CIS and Baltic States 39.6 42.6 44.1 65.7 76.6
Europe 127.0 128.6 140.6 153.2 156.1
Total 166.6 171.2 184.7 218.9 232.7
in European CountriesGermany – 23 %
Italy – 14 %
Turkey – 12 %
France – 8 %
Hungary – 6 %
Slovakia – 5 %
Czech Republic – 5 %
Other
european countries – 27 %
in CIS and Baltic StatesUkraine – 49 %
Belarus – 26 %
Kazakhstan – 5 %
Azerbaijan – 5 %
Other CIS and Baltic
countries – 15 %

GAZPROM IN FIGURES 2001–2005
OAO “Gazprom” and OOO “Gazexport” Major Joint Ventures to Transport and Market Natural Gas inEuropean Markets as of December 31, 2005
OAO “Gazprom” and its subsidiaries also have ownership interests in companies located in Armenia,Belarus, Slovakia, Kazakhstan, Moldova, The Netherlands, Serbia and Montenegro, Ukraine and theUnited Kingdom.
31
Country Entity Interest Joint Venture Partner(s) DescriptionAustria Gas und 50% OMV Gas marketing, gas trading
Warenhandels- and general trading activitygesellschaft m.b.H.
Bulgaria Overgas Inc. AD 50% Overgas Holding AD Gas marketing (wholesale and retail), construction and operationof gas transportation network
Czech Republic Gas-Invest S.A. 37.5% Centrex Europe Gas Gas marketing, distribution& Energy AG, other shareholders and general trading activity
Estonia AO Eesti Gaas 37% E.ON Ruhrgas AG, Marketing of natural gas,Fortum Corporation, development of Estonia'sItera-Latvia, other shareholders gas transportation networks
Finland Gasum Oy 25% Fortum Corporation, Gas transportation and marketingE.ON Ruhrgas, the Republic of Finland
France FRAGAZ 50% Gaz de France Gas distribution and generaltrading activities
Greece Prometheus Gas S.A. 50% Copelouzos Bros. Corp. Gas marketing and constructionof gas transportation network
Hungary Panrusgaz Rt. 40% MOL Gas marketing and distributionItaly Promgas SpA 50% ENI Gas marketing and distributionItaly Blue Stream 50% ENI Gas transportation
Pipeline Company B.V.Latvia AO Latvjias Gaze 34% Itera-Latvia, E.ON Ruhrgas, Marketing of natural gas
other shareholders and liquefied gas, developmentand modernization of Latvia'snatural gas and services industries
Lithuania AO Lietuvos Dujos 37.06% E.ON Ruhrgas AG, Marketing of natural gas,the Republic of Lithuania, development of Lithuania'sother shareholders gas transportation networks
Poland SGT EuRoPol GAZ S.A. 48% PGNiG S.A., Gas Trading Transportation, construction,ownership and operationof the Polish sectionof the Yamal-Europe pipeline
Poland Gas Trading S.A. 16% PGNiG, Bartimpex S.A., Gas marketing, liquefied gas tradingWIEH GmbH&Co KG, Wenglokoks
Switzerland Baltic LNG AG 80% OAO Sovkomflot Development and sale of LNGSwitzerland Gas Project Development 50% Centrex Gas & Energy Europe AG Production and development of oil
Central Asia AG (Zug) and gas fields in Central AsiaSwitzerland WIEЕ 50% Wintershall Gas marketing, gas supplyTurkey Turusgaz 45% Botas International Ltd., Gas marketing
Gama Industrial Plants Manufacturing and Erection Corp.
Turkey Bosphorus 40% Tur Enerji Transportation and distribution Gas Corporation A.S. of natural gas
Germany WIEH GmbH&Co KG 50% Wintershall Gas marketing, gas supplyGermany WINGAS GmbH 35% Wintershall Gas transportation and supply

GAZPROM IN FIGURES 2001–2005
Immovable Property Management
Immovable property of Gazprom Group exceeds 80 thousand items, of which 50 thousand are owned bythe head company – OAO «Gazprom». Immovable property is located on more than 700 thousand plots.
Immovable property management includes plots registration in State Land Cadastre, conclusion of land leasecontracts, state registration of OAO «Gazprom» title to immovable property to protect it from legal risk.
On the whole, OAO «Gazprom» title was registered to over 24,000 immovable property items. In 2005 thespecial software complex – “The Unified Register of Title to Immovable Property in OAO “Gazprom”System” – was installed in 35 subsidiaries; this will ensure the immovable property administration to bebased on the unified info-analytic platform.
State Registration of OAO «Gazprom» Title to Immovable Property (progressive total)
32
30 00025 00020 00015 00010 0005 0000
2001 2002 2003 2004 2005
num
ber o
f ite
ms
1,835
24,91047 % of the total
number
2,912
5,75511,279
GAZPROM IN FIGURES 2001–2005
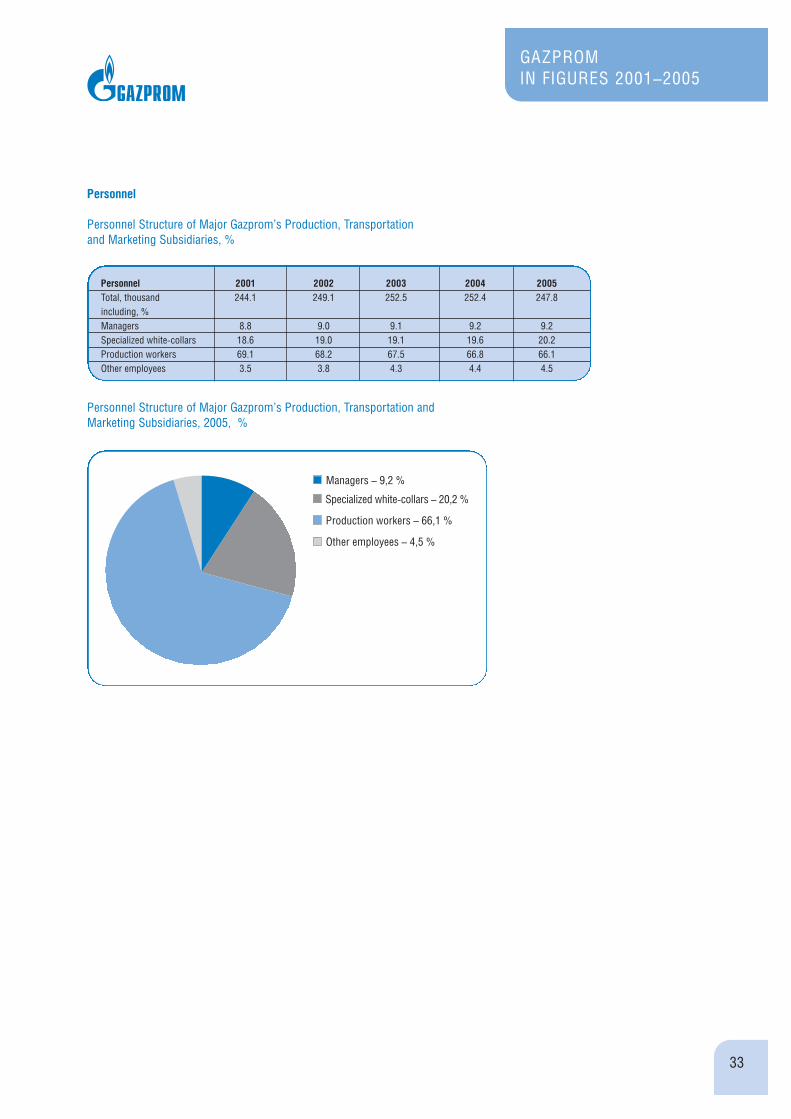
Personnel
Personnel Structure of Major Gazprom’s Production, Transportation and Marketing Subsidiaries, %
Personnel Structure of Major Gazprom’s Production, Transportation and Marketing Subsidiaries, 2005, %
33
Personnel 2001 2002 2003 2004 2005 Total, thousand 244.1 249.1 252.5 252.4 247.8including, %Managers 8.8 9.0 9.1 9.2 9.2Specialized white-collars 18.6 19.0 19.1 19.6 20.2Production workers 69.1 68.2 67.5 66.8 66.1Other employees 3.5 3.8 4.3 4.4 4.5
Managers – 9,2 %
Specialized white-collars – 20,2 %
Production workers – 66,1 %
Other employees – 4,5 %