Embed Size (px)
Citation preview

Gap between GDP and HDI: Are the Rich Country
Experiences Different from the Poor?
Surajit Deb (Aryabhatta College, University of Delhi, India)
Paper Prepared for the IARIW-OECD Special Conference: “W(h)ither the SNA?”
Paris, France, April 16-17, 2015
Session 1: Incorporating Well-Being into the SNA (I)
Thursday, April 16
9:30-10:45
Discussant: Albert Braakmann (Federal Statistics Office of Germany)

26th
March, 2015
Gap between GDP and HDI: Are the Rich Country
Experiences Different from the Poor?
Surajit Deb
Associate Professor in Economics
Aryabhatta College, (University of Delhi)
Abstract
The limitation of GDP as a measure of a country’s overall well-being and progress has been a
subject of considerable debate over the past two decades, where it is argued that well-being is a
multidimensional concept that cannot be captured by per capita GDP alone (UNDP1990, Stiglitz
et al 2008, European Commission 2009, Costanza, et al 2009, Coyle 2014, Karabell 2014).
However, the previous research has also indicated that a scatter plot of the HDI and per capita
GDP or the correlation between the two reveals that the latter can statistically be as good as an
indicator of progress as the latter. This paper examines the rank differences between the two in a
140 country sample during four points of time, viz., 1990, 2000, 2010 and 2013, and also focuses
on the sub-sample of countries with different income groups. The scatter plot, Spearman’s rank
correlation and rank ordered logit and probit regression reveal that the two measures relate
positively very strongly in the overall sample of all countries. But, the analysis for different
income group of countries suggests that the positive relationship is more prominent for the low
income countries and weakens for the middle and high income countries in all the years.
Keywords: Wellbeing, Human Development, Economic Growth, Cross-section Models.
JEL Classification: D74, H56, C23, C25, O63, O55.
Paper for the IARIW-OECD Special Conference: “Whither the SNA”
Session 1, OECD Conference Centre,
Paris, 16-17 April, 2015.

Gap between GDP and HDI: Are the Rich Country
Experiences Different from the Poor
Introduction:
Once upon a time, the overall development levels of a country used to be evaluated by its
national income; with the conventional wisdom that the more the country could produce
the better would be the progress for the country and its society. The cross-country
developing experiences, however, have subsequently led us to recognize that the overall
development or societal progress and GDP growth can be significantly different. This has
given directions to the view that development is also about reducing iinequalities in
income distribution, creation of jobs, providing access to health and education services.
The limitation of GDP as a measure of a country’s quality of life or well-being of the
society has been a subject of considerable debate over the past two decades. The
observation that the quality of lives does not show improvements for a large mass of
population despite high GDP growth has led to the belief that GDP measure needs to be
broadened to include the quality of life and human well-being. Along with the prevailing
notion that well-being is a multidimensional concept that cannot be measured by market
production or GDP alone, concepts of multi-dimensional indicators of development like
the Human Development Index (HDI) turned out to be more reasonable in comparison to
the measure of GDP growth, which is one-dimensional in income.1
This paper intends to examine whether the GDP ranking of countries are
significantly different from the HDI ranks. We explore on the gap between GDP and HDI
by considering a sample of 140 economies. While the existence of a positive relationship
between human development and per capita GDP at the aggregate group of countries is
well-known, an inquiry on the strength of the relationship between the two for different
income group of countries could be more pertinent. This paper therefore focuses on
1 It may be mentioned that the need to improve data and indicators to complement GDP has been the focus
of the Stiglitz-Sen-Fitoussi Commission Report, which identified 8 dimensions of well-being, viz., material
living standards (income, consumption and wealth), health, education, personal activities, political voice
and governance, social connections and relationships, environment and security (Stiglitz et al 2008).

examining the difference in ranks between the two for different income group of
countries, viz., high, middle and low income level of countries. The remaining portion of
the paper is structured as follows. Our analysis begins by providing a discussion on the
development of System of National Accounts (SNA) and the GDP measure, as well as
the recent deliberations on using the GDP measure as an indicator of human progress and
life-quality. Section 3 discusses the human development index (HDI) - that is commonly
used in comparative analysis of nations - as a summary indicator of development. Section
4 analyzes the appropriateness of using the GDP as a proxy indicator for wellbeing by
considering the two-way relation between economic growth and human development. In
section 5, we provide the empirical examination towards examining whether the GDP
ranking of countries are significantly different from the HDI ranks. The ranking gap is
first examined through a comparison of scatter plots for different income group of
countries over four points of time, viz., 1990, 2000, triennium ending in 2010 and 2013.
We subsequently calculate the Spearman’s rank correlation coefficients between the HDI
and current per capita GDP ranks for the full sample 140 countries as well as the sub-
samples of high, middle and low income countries. Finally, we examine the aspect of
rank differences between the GDP per capita and HDI by considering the probability of
high human development as a binary variable within the framework of ordered logit and
probit analysis. Finally, the inferences derived from the study and the policy
recommendations are presented in section 6.
2. GDP as Wealth of Nation:
The measure of GDP has remained as the most widely accepted measure of a country’s
economic progress for more than a half century (Costanza, et al 2009). The idea for GDP
first arose in the late 1930s amid the great depression years in an effort to respond to the
after-effects of the depression and determine the overall economic welfare of the nation.
The onset of World War II reinforced the development of national income and product
accounts of nations. These accounts were used to measure the total value of final goods
and services produced in the country, because countries needed to evaluate the wartime
spending and the requirement of new taxes to finance it. Subsequently, the GDP
estimates provided governments the much desired tool to estimate how much they could

spend and by how much they could increase revenues without causing inflationary
pressures in the economy.
The System of National Accounts (SNA) is the internationally agreed standard set
of recommendations on how to compile measures of economic activity in accordance
with accounting rules based on economic principles (UN 1993). The statistical
framework of macroeconomic accounts in SNA along with the set of concepts,
definitions, classifications and accounting rules are used to measure the gross domestic
product (GDP), the most frequently quoted indicator of economic performance. It may be
mentioned that since the incorporation of the SNA 2008 has remained a challenge, many
countries have not yet fully implemented the new accounting standard for the compilation
of national account statistics. The new features of the 2008 SNA include the treatment
and classification of assets, the financial sector, globalization and related issues, the
government, public and the informal sectors (UN 2008). The national accounting
framework estimates main aggregates such as gross national product (GDP) and gross
national income (GNI), which are extensively used for the purposes of economic analysis
and policy-making. According to the definitions of Organization for Economic
Cooperation and Development (OECD), GDP is an aggregate measure of production
equal to the sum of the gross values added of all resident institutional units engaged in
production plus any taxes and minus any subsidies on products not included in the value
of their outputs. The GNP is one more commonly used measure of economic progress
that evaluates production by domestic sectors including goods and services produced in
other countries. The GNI is identical to gross national product GNP as previously used in
national accounts. Thus, GNI is GDP less net taxes on production and imports, less
compensation of employees and property income payable to the rest of the world plus the
corresponding items receivable from the rest of the world.
Although, the development of national income and product accounts is sometimes
referred as the achievement of the century, the shortcomings of per capita GDP as an
indicator of overall development became apparent in the subsequent years. In particular,
it is argued that while the GDP remains as a useful measure of the output production, but
has not been able to accommodate the roles of human capital or the environment and
natural resources into the production base. In addition, it is pointed out that the original
GDP estimation did not include domestic work, and the observation that that growth in
per capita national income does not reveal anything about the distribution of income and
inequality aspects is also highlighted. As a result, development economists have
maintained that growth in per capita GDP or income by themselves are not adequate
indicators of development since the basic human needs or quality of lives are not
represented in GDP measures (Hicks and Streeten 1979). Correspondingly, Costanza, et
al [2009] have argue that use of GDP as a measure of national well-being remains
inappropriate because it was never intended to design GDP as a measure of national well-
being.
The national accounts today not only remains as the framework to measure the
economic performance of a country, but also provides the basis for fiscal and monetary
policy making required for maintain the economic growth and stability in a country. But,
the discussion on many global development frameworks and agendas today recognizes
the need for a broader view of development that focuses on the comprehensive human
and economic well-being rather than only the economic well-being. The European
Commission’s initiative of going Beyond GDP gathered strong support from
policymakers, economic, social and environmental experts and civil society for
developing indicators that complement GDP and aim to provide more comprehensive
information to support policy decisions. In the present time, many of the discussions and
debates around measuring the overall progress of the nation revolve around the concept
of GDP, what the GDP numbers measure and what roles they play in the developmental
policymaking (Coyle 2014, Karabell 2014).
3. HDI as Development Indicator:
The United Nation Development Programme (UNDP) has been providing the Human
Development Index (HDI) since 1990, which subsequently became the most well-known
aggregate measure of wellbeing. Since its inception, the HDI has been able to catch the
attention of academic as well as policy-making circles, and has actually been able to shift
the focus of development economics from economic growth to people centered policies
(Haq 1995). Many experts believe that the dissatisfaction with per capita national income

as a single measure of well-being as the main reason for this transformation. The HDI
combined 3 dimensions of development, viz., living a long and healthy life, being
educated, and having a decent standard of living in the aggregate index. Under the
previous HDI formula, health was measured by life expectancy at birth; education or
knowledge by a combination of the adult literacy rate and school enrolment rates (for
primary through university years); and income or standard of living by GDP per capita
adjusted for purchasing-power parity (PPP US$). The dimensional indices obtained from
the corresponding indicators were normalized using a fixed minima and maxima. The
final HDI was derived in the form of an arithmetic mean using equal weights of one-third
for three dimensional indices according to the previous methodology. The 2010 HDI
introduced some changes with regard to the indicators, data base, change in maximum
value used for normalization and the aggregation method. The HDI is now the geometric
mean of normalized indices for each of the three dimensions. The health dimension is
still assessed by life expectancy at birth, but the education component of the HDI is now
measured by mean of years of schooling for adults aged twenty five years and expected
years of schooling for children of school entering age. The standard of living dimension
is measured by gross national income (GNI) per capita.
The HDI introduced the dimensional and aggregate well-being indicator with the
central point that it is important to study how economic growth translates or fails to
translate into progress in various countries. The HDI ranking of countries provoked
policy-makers to examine how each country fared in this regard and to ask why some
countries and regions, such as Costa Rica, Sri Lanka, or the state of Kerala in India,
managed to achieve much higher levels of human development in comparison to
countries with similar income levels (Fukuda-Parr, 2003). However, the HDI as a
development indicator has not remained free from conceptual and methodological
criticisms (Srinivasan 1994, Noorbakhsh 1998, Decanq and Lugo 2009, Ravallion 2012).
Much of the criticism on the methodology of HDI however involved the choice of
dimensions and the method of aggregating into a multi-dimensional indicator. The need
to improve the quality of an aggregate index of societal progress like the HDI has also
been the focus of the Stiglitz-Sen-Fitoussi Commission Report, which identified at least
eight dimensions of well-being, viz., material living standards (income, consumption and
wealth), health, education, personal activities, political voice and governance, social
connections and relationships, environmental sustainability and economic/physical
security (Stiglitz et al 2008).
4. GDP or HDI as Progress Indicator:
The two measures of GDP and HDI has remained as the most commonly used standards
by which experts assessed whether a country is making progress better than in the past.
Sometimes GDP has also been regarded as a representative indicator for overall
development and progress in general. However, with the subsequent insight that GDP
does not convey information on social inclusion, environmental sustainability or social
progress in its design and purpose, the need to complement and replace GDP with some
improved development indicators has been increasingly recognized. The basic issue that
emerged from this perception raises the question whether the GDP measure evaluates
progress accurately, while progress could include not only the material progress but the
standard of life aided by health care, education and basic amenities of life. In fact, the
development of Human Development Index (HDI) in 1990 is an acknowledgment to the
fact that per capita income levels are not sufficient to denote overall development.
According to Anand and Sen [2004], income or wealth do bear importance but cannot
constitute a direct measure of the overall well-being and therefore the HDI is constituted
around a broader concept of development by combining health, education and per capita
income into a composite index. On the other hand, it is also argued that while composite
indices broaden the dimensions of development they also compromise on the fact that all
the components in a composite index are not evaluated at market prices (Santos and
Santos 2014). In fact, it has recently been claimed that GDP bears a significant advantage
over other indicators of development in the sense that it only uses data that are generated
by the market processes (Weimann et al 2015).
One may therefore be concerned about deliberating the appropriateness of using
the GDP measure as a proxy indicator for wellbeing and overall development as opposed
to the HDI. It may be mentioned that several studies have earlier indicated high
correlation between economic indicator of per capita GDP and other aggregate social
indicators of development, thereby suggesting that GDP can be used as a proxy measure

of development (Hicks and Streeten 1979). It may be noted that the values of
development index like the HDI have been shown to exhibit positive and statistically
significant correlation with the GDP or GNP per capita (McGillivray 1991, McGillivray
and White 1993, Cahill 2005). Some researchers have therefore suggested that since the
HDI is so closely correlated with GDP or GNP per capita, it is a redundant index. The
argument that is forwarded is that since other dimensional indicators like health and
education outcomes often improve with income, then the HDI measure would invariably
be closely associated with the per capita GDP and therefore no additional information can
be gained from the HDI index.
It may correspondingly be noted that the features of higher economic growth have
often been found to be linked with performance in aggregate or dimensional human
development indicators like health and education attainments. According to Sen [1999],
economic growth holds a central reference for the human capability expansion, since
improvements in per capita income provides greater opportunities for people to enjoy
long, healthy and creative lives. On the contrary, the role of human and social capital
accumulation has critically been identified in accounting for differences in growth rates
across countries. Investments in health and education have been emphasized in the
growth literature for its positive contributions. A series of papers by Boozer et al [2003],
Ranis [2004], Ranis and Stewart [2004], Ranis and Stewart [2006], Ranis, Stewart and
Samman [2007] explored the two-way relationships between economic growth and
human development, and argued that human development is not only an end product of
the development process but also a means to generating future economic growth. It is
argued that strong economic growth advances human development through the increased
household consumption expenditure as well as public expenditures, which directly
benefit the poor. Thus, while economic growth increases a country’s tax base, it becomes
possible for the government to spend more on the key public services of health, education
and other items that contribute to their capabilities and raise the standard of living. The
employment opportunities created by strong growth levels can also generate incentives
for families to spend in education and health. On the other hand, the impacts from human
development to economic growth works as people become healthier, better nourished and
educated and to contribute more to economic growth.

Although, per capita GDP growth can remain as an important instrument for
achieving a higher standard of life, the impact of economic growth on human
development level crucially depends on aspects, such as the distribution of income. Thus,
the same level of GDP can be found to deliver very different development performances
depending on the distribution of income across income classes. In fact, a key message
contained in various Human Development Reports remains that economic growth alone
does not automatically translate into human development progress. For instance, the 1996
edition of the Human Development Report identified five ways in which economic
growth can be problematic, viz., i) jobless growth, where economic growth does not
expand employment opportunities, ii) ruthless growth, where growth benefits only the
rich, iii) voiceless growth, where economic growth is not accompanied by democracy or
empowerment, iv) rootless growth, which causes minority cultures to be swamped by the
dominant culture; and v) futureless growth where resources for future growth are
exploited (UNDP 1996). The high economic growth rates may not transform into
development unless appropriate distributional policies and well-designed delivery
mechanism are accompanied to translate the benefits of growth into the lives of the
under-privileged.
5. Empirical Examination:
This section examines whether the HDI ranks countries differently from the way the
popular economic indicator of per capita GDP ranks them. To address this issue we
gather a 140 country data set at four different points of time, viz., 1990, 2000, triennium
ending in 2010 and triennium ending in 2013. The gap between per capita GDP and HDI
is examined for the full sample of 140 countries, as well as for different income group of
countries. Our analyses use the HDI scores and per capita GDP (current values in USD)
data consistently for the full sample 140 countries as well as three sub-samples of high,
middle and low income groups of countries during four points of time. We have used the
World Banks’s per capita income classification in each specific year to group economies
according to the high, middle and low income countries. Thus, 84 nations remained as
low income countries with income of $2464 or less in the year 1990, along with middle
income countries with income between $2465 and $7620 and high income countries with

per capita income level of $7621 or more. In the year 2013, 57 countries were grouped in
low income group with per capita income level of $4084 or less, middle income group
from $4085 to $12615 and high income group with $ 12616 or more. The details of the
income classification and the number of countries falling in each group during specific
years are provided in Table 1.2
Table 1: Classification of Countries in Income Groups, 1990, 2000, 2010 and 2103.
Years Income Range for Country Classification
High Income
Countries
Middle Income
Countries
Low Income
Countries
Total Countries
1990 7621 USD and above
(32 countries)
2465-7620 USD
(24 countries)
2464 USD and
below
(84 countries)
(140 countries)
2000 9266 USD and above
(37 countries)
2995-9265 USD
(26 countries)
2994 USD and
below
(77 countries)
(140 countries)
Triennium Ending 2010 12276 USD and
above
(47 countries)
3975-12275
USD
(31 countries)
3974 USD and
below
(62 countries)
(140 countries)
Triennium Ending 2013 12616 USD and
above
(50 countries)
4085-12615
USD
(33 countries)
4084 USD and
below
(57 countries)
(140 countries)
Source: World Bank [various years].
2 Considering the aspect of data availability on a comparable basis, we could find uniform data for
140 countries, which are Afghanistan, Albania, Algeria, Argentina, Armenia, Australia, Austria, Bahrain,
Bangladesh, Barbados, Belgium, Belize, Benin, Bolivia, Botswana, Brazil, Brunei Darussalam, Bulgaria,
Burundi, Cambodia, Cameroon, Canada, Central African Republic, Chile, China, China: Hong Kong SAR,
Colombia, Congo, Costa Rica, Côte d'Ivoire, Croatia, Cuba, Cyprus, Czech Republic, D.R. of the Congo,
Denmark, Dominican Republic, Ecuador, Egypt, El Salvador, Estonia, Fiji, Finland, France, Gabon,
Gambia, Germany, Ghana, Greece, Guatemala, Guyana, Haiti, Honduras, Hungary, Iceland, India,
Indonesia, Iran (Islamic Republic of), Iraq, Ireland, Israel, Italy, Jamaica, Japan, Jordan, Kazakhstan,
Kenya, Kuwait, Kyrgyzstan, Lao People's DR, Latvia, Lesotho, Libya, Lithuania, Luxembourg, Malawi,
Malaysia, Mali, Malta, Mauritania, Mauritius, Mexico, Mongolia, Morocco, Mozambique, Myanmar,
Namibia, Nepal, Netherlands, New Zealand, Nicaragua, Niger, Norway, Pakistan, Panama, Papua New
Guinea, Paraguay, Peru, Philippines, Poland, Portugal, Qatar, Republic of Korea, Republic of Moldova,
Romania, Russian Federation, Rwanda, Saudi Arabia, Senegal, Serbia, Sierra Leone, Singapore, Slovakia,
Slovenia, South Africa, Spain, Sri Lanka, Swaziland, Sweden, Switzerland, Syrian Arab Republic,
Tajikistan, Thailand, Togo, Tonga, Trinidad and Tobago, Tunisia, Turkey, U.R. of Tanzania: Mainland,
Uganda, Ukraine, United Arab Emirates, United Kingdom, United States, Uruguay, Venezuela, Viet Nam,
Yemen, Zambia and Zimbabwe.


The data on per capita GDP and HDI level for the panel of 140 countries have
been defined and sourced as follows. The per capita gross domestic product in current
U.S. dollars is defined as country’s gross value added by all resident producers in the
economy plus any product taxes and minus any subsidies not included in the value of the
products divided by the midyear population. This information has been derived from the
System of National Accounts (United Nations). The HDI scores for countries are derived
from United Nation Development Programme’s (UNDP) Human Development Report
(HDR).
The examination of the difference in the rankings between HDI and per capita
GDP is first attempted by a comparison of scatter plots for different income group of
countries during four specific points of time. Subsequently, we calculate the Spearman’s
rank correlation coefficients between the HDI values and current per capita GDP level for
the full sample 140 countries as well as the sub-samples of high, middle and low income
countries. Finally, we examine the aspect of rank differences between the GDP per capita
and HDI by considering the probability of high human development as a binary variable
within the framework of ordered logit and probit analysis.
5.1 Scatter Plots and Regressions:
The examination of the rank differences between HDI scores and per capita GDP (current
levels in USD) is performed by plotting the GDP per capita ranks in the horizontal axis
and HDI ranks in the vertical axis from our cross-sectional country data. The analysis is
performed for different income group of countries and consistently during four points of
time, viz., 1990, 2000, triennium ending in 2010 and 2013, so as to ascertain whether the
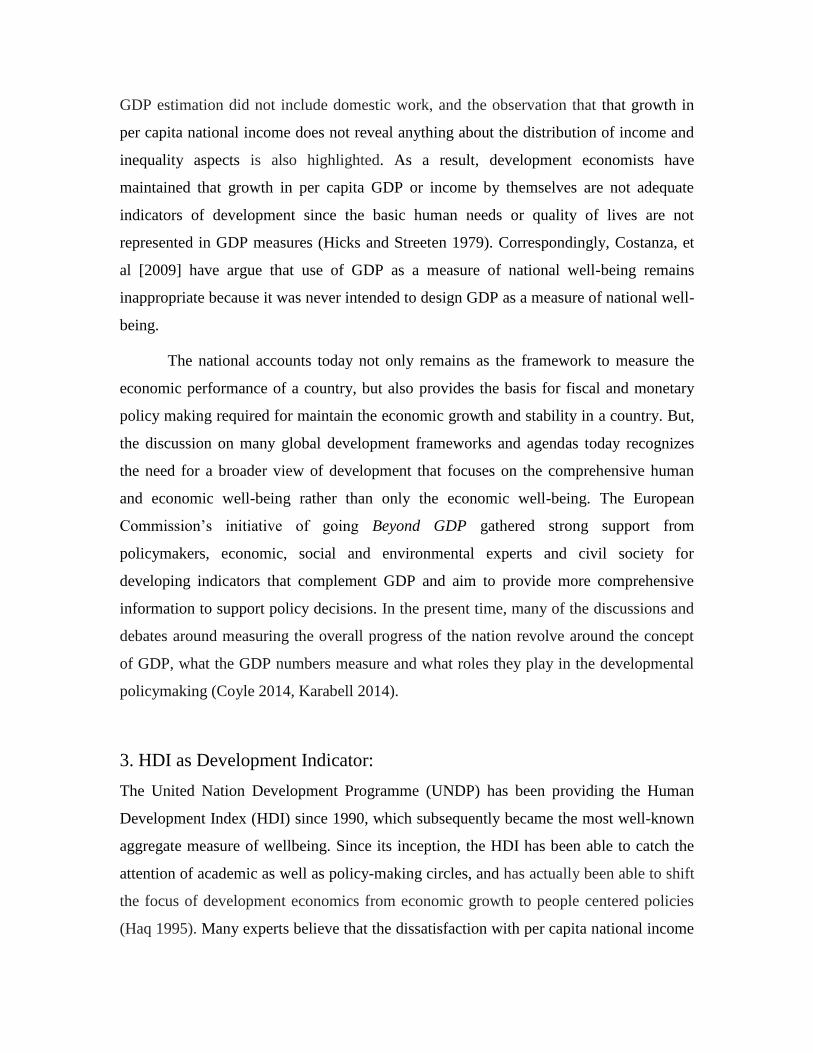
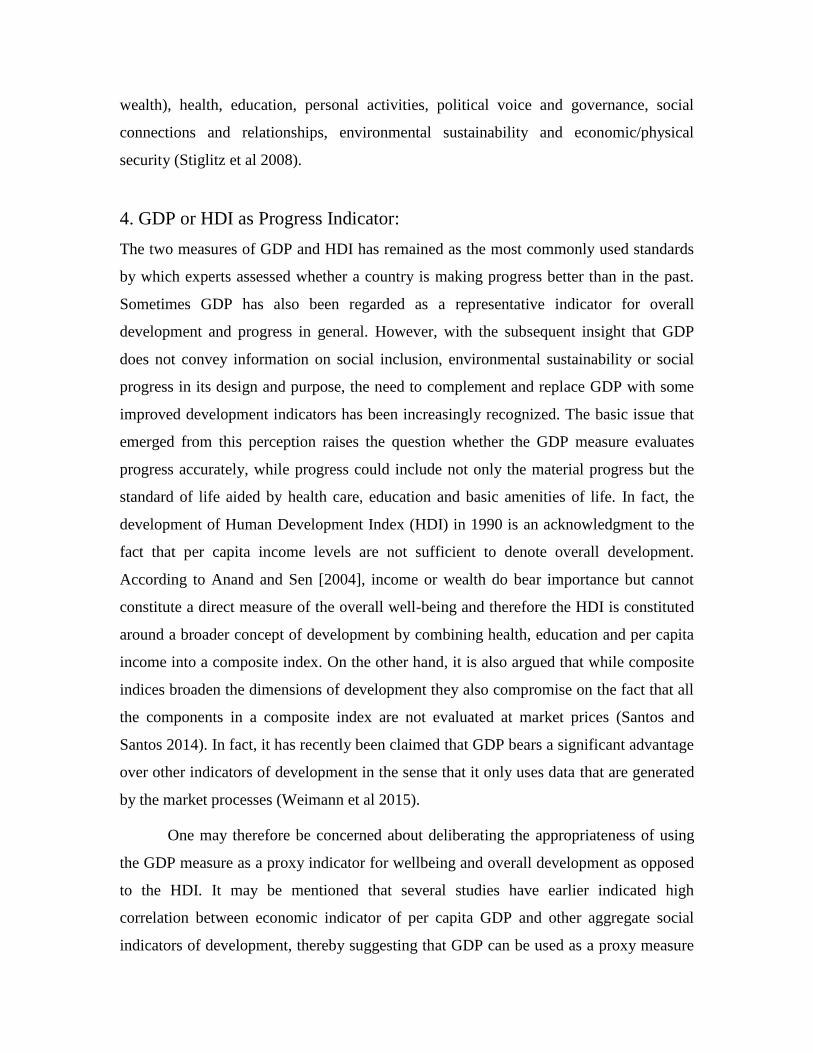
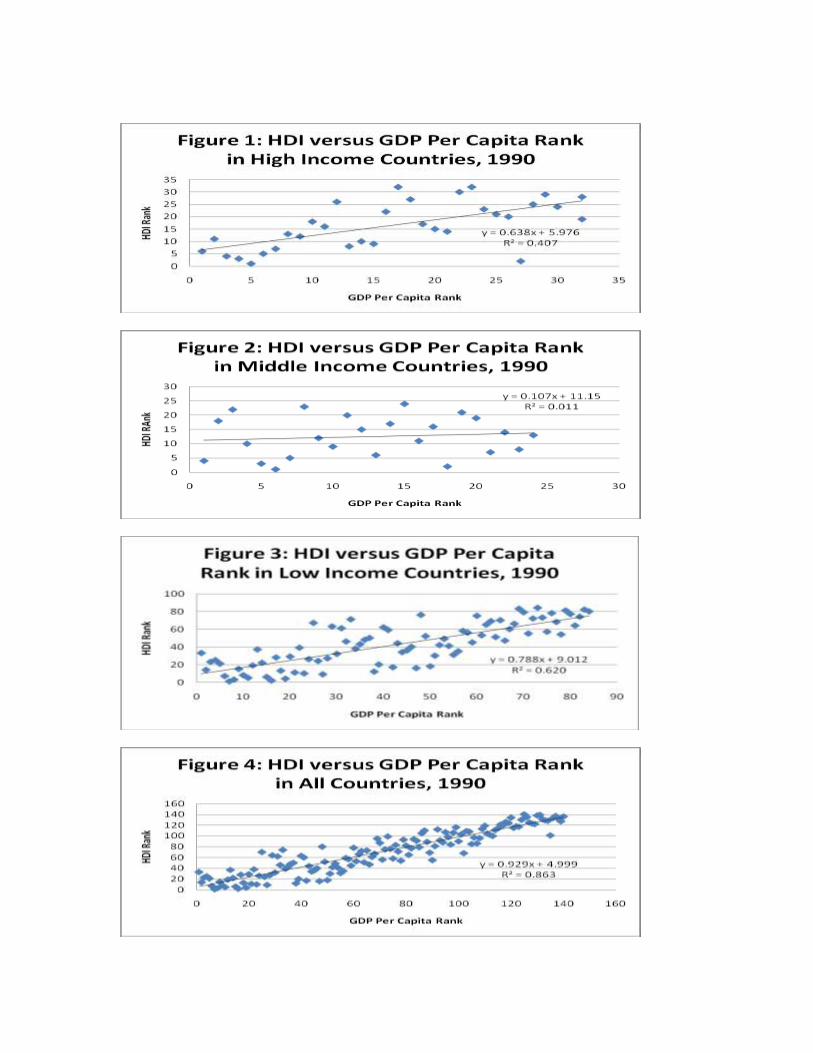
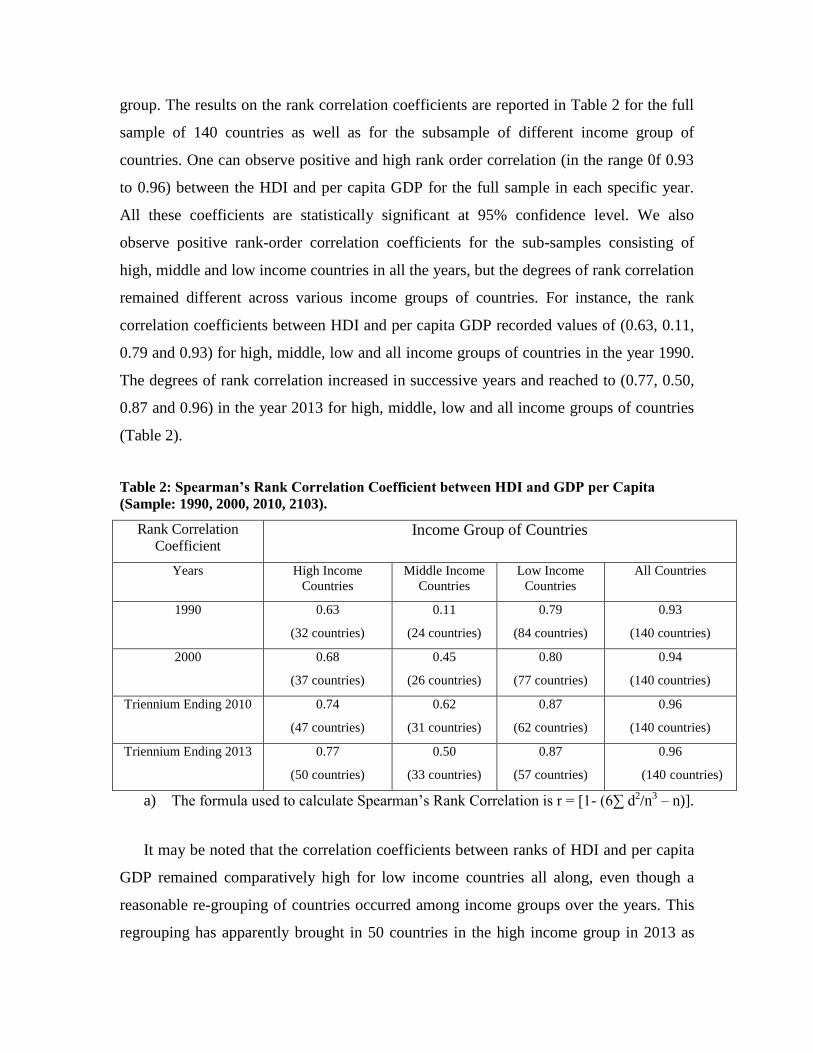
observed relationship is undergoing any change over time. The first three figures (Figures
1 to 3) demonstrates how closely the HDI and per capita incomes were related during the
year 1990 in high, middle and low income countries, while the same for all income
groups of countries are depicted in Figure 4. We observe a high positive correlation
between the per capita HDI and GDP rankings for all the 140 countries, so that the fitted
regression line also yielded a positive sloped line (Figure 4). The same line of analysis
but disaggregated over different income groups, however, disclose that positive
correlation is the highest in the case of low-income countries (Figure 3), which is

followed by the high income countries (Figure 1) and the lowest for the middle income
group of countries (Figure 2). Thus, the fitted regression lines are upward sloping for low
and high income countries and remain almost flat for middle income countries in 1990.
Similarly, the relationships during the year 2000 are graphically represented
through a scatter-plot of the two series for three specific income groups and all countries
in Figures 5 to 8. While the fitted regression lines are still upward sloping, the degrees of
correlation vary substantially among different income groups in the sample. The positive
relationship remains more pronounced in the low-income group of countries. Although
the observed correlation remained the lowest for the middle income group, it registered
higher degrees of correlation than the correlation in 1990. Figure 9 to Figure 12 depicts
the link between the rankings of HDI and per capita real GDP during the triennium
ending in 2010. The regression lines are positively sloped for all the income groups, but
the positive relationship remains more evident in low-income countries. Finally, Figure
13 to Figure 16 has been provided to represent the relationship between HDI and per
capita GDP rankings during the triennium ending in 2013 and the scatter-plots exhibit not
much differences from what was depicted in the year 2010. One can notice that the
positive association between the rankings of HDI and per capita GDP remains the highest
for the low income group of countries in comparison to the association in other income
groups during all the four time periods. Overall these results seem to indicate that
although the HDI ranking of countries is not very different from the ranking of per capita
GDP in the full sample of all countries, there remain substantial differences in the results
for sub-samples of countries containing different income groups.
5. 2 Rank Correlation Tests:
The rank correlation coefficient measures the degree of similarity between the two
rankings, and can be meaningfully used to assess the significance of the relation between
HDI and GDP per capita. The rank correlation coefficients are calculated using the full
sample comprising 140 country observations, together with sub-samples that comprise
countries classified by their income groups according to the World Bank classification as
low, middle and high income countries. The total sample of 140 countries has been
reorganized for three income groups depending on the range of incomes in each year
group. The results on the rank correlation coefficients are reported in Table 2 for the full
sample of 140 countries as well as for the subsample of different income group of
countries. One can observe positive and high rank order correlation (in the range 0f 0.93
to 0.96) between the HDI and per capita GDP for the full sample in each specific year.
All these coefficients are statistically significant at 95% confidence level. We also
observe positive rank-order correlation coefficients for the sub-samples consisting of
high, middle and low income countries in all the years, but the degrees of rank correlation
remained different across various income groups of countries. For instance, the rank
correlation coefficients between HDI and per capita GDP recorded values of (0.63, 0.11,
0.79 and 0.93) for high, middle, low and all income groups of countries in the year 1990.
The degrees of rank correlation increased in successive years and reached to (0.77, 0.50,
0.87 and 0.96) in the year 2013 for high, middle, low and all income groups of countries
(Table 2).
Table 2: Spearman’s Rank Correlation Coefficient between HDI and GDP per Capita
(Sample: 1990, 2000, 2010, 2103).
Rank Correlation
Coefficient Income Group of Countries
Years High Income
Countries
Middle Income
Countries
Low Income
Countries
All Countries
1990 0.63
(32 countries)
0.11
(24 countries)
0.79
(84 countries)
0.93
(140 countries)
2000 0.68
(37 countries)
0.45
(26 countries)
0.80
(77 countries)
0.94
(140 countries)
Triennium Ending 2010 0.74
(47 countries)
0.62
(31 countries)
0.87
(62 countries)
0.96
(140 countries)
Triennium Ending 2013 0.77
(50 countries)
0.50
(33 countries)
0.87
(57 countries)
0.96
(140 countries)
a) The formula used to calculate Spearman’s Rank Correlation is r = [1- (6∑ d2/n3 – n)].
It may be noted that the correlation coefficients between ranks of HDI and per capita
GDP remained comparatively high for low income countries all along, even though a
reasonable re-grouping of countries occurred among income groups over the years. This
regrouping has apparently brought in 50 countries in the high income group in 2013 as

against 32 countries in the year 1990. On the other hand, the rank correlations for the
middle income countries varied from 0.11 to 0.62, which is low in comparison to other
income group of countries in different years. All the rank correlation coefficients turn out
to be significant at one per cent level of significance indicating that there is no marked
difference These results suggest that there is marked similarities between the HDI and
GDP ranking for the full sample of countries in each time periods, but significant
differences in rank orders exist for the sub-samples of various income groups.
5.3 Ordered Logit and Probit Analysis:
Finally, we examine the aspect of rank differences between HDI and GDP per capita by
defining the occurrence of high HDI as a binary variable and considering per capita
income of countries as the explanatory variable. We basically inquire the questions as to
why the countries belong to the low or high human development groups and by how
much the country’s per capita income level influence the outcomes. The problem is
structured by using a model of binary choices, represented by a dummy variable that
takes the value one if a particular country belongs to the high human development
category and takes the value zero, otherwise in the sample of 140 countries. We
particularly estimate the following model:
HDI = f (PCGDP)
where:
HDI: Binary variable and takes the value 1 for high HDI, and zero otherwise,
PCGDP = per capita GDP in USD.
The dependent variable to be explained is HIGH-HDI, which is equal to zero for
HDI values less than 0.50 and equal to one according to HDI values more than 0.50.
Thus, 37 countries were assigned zeros for low HDI scores in the year 1990, which are
Afghanistan, Bangladesh, Benin, Burundi, Cambodia, Cameroon, Central African
Republic, Côte d'Ivoire, D.R. of the Congo, Gambia, Guatemala, Haiti, India, Kenya, Lao
People's DR, Lesotho, Malawi, Mali, Mauritania, Morocco, Mozambique, Myanmar,

Nepal, Nicaragua, Niger, Pakistan, Papua New Guinea, Rwanda, Senegal, Sierra Leone,
Togo, U.R. of Tanzania: Mainland, Uganda, Viet Nam, Yemen, Zambia and Zimbabwe.
In the same way, 35 countries in 2000, 24 countries in 2010 and 23 countries in 2013
were assigned zeros for low human development, which are: Afghanistan, Benin,
Burundi, Central African Republic, Côte d'Ivoire, D.R. of the Congo, Gambia, Haiti,
Lesotho, Malawi, Mali, Mauritania, Mozambique, Niger, Papua New Guinea, Rwanda,
Senegal, Sierra Leone, Togo, U.R. of Tanzania: Mainland, Uganda, Yemen and
Zimbabwe. We have considered per capita gross domestic product (GDP) in current U.S.
dollars during the corresponding years as the main explanatory variable.
Table 3: Logit Estimates of HDI on GDP Per Capita (Sample: 1990, 2000, 2010, 2103).
Dependent Variable → HDI Value
Explanatory Variables ↓ 1990 2000 2010 2013
Intercept -3.31
(-4.28) *
-3.07
(-4.23) *
-3.05
(-3.32) *
-3.69
(-3.34) *
Per Capita GDP in current
USD Value
0.004
(4.35) *
0.004
(4.08) *
0.003
(3.32) *
0.003
(3.32) *
Goodness of Fit 0.85 0.92 0.89 0.94
Factor for Calculating
Marginal Effects
0.000000007 0.0000 0.0000 0.0000
Pseudo R2 0.61 0.64 0.64 0.68
a) HDI is considered a dichotomous variable, which takes the value of 1 for values more than
0.50; otherwise 0.
b) * indicate statistical significance at 10% level of significance.
The logit maximum likelihood estimation of the model is provided in Tables 3 for
the combined sample of 140 countries in different years, with their t-statistics included
below the parameter estimates in parentheses. The measures of goodness of fit and
pseudo-R2 from the logit model indicate that model fit the data well. The estimated
coefficient for the PCGDP variable bears the expected positive sign in all the years
indicating a direct impact on the probability of high HDI scores. This would mean that as
the level of per capita income rise, there would be positive outcomes on the probability of
high HDI values in countries. The t-statistics of the coefficients imply that the parameter
estimates for the per capita income variable are statistically significant in all the years.

The Goodness of Fit and Pseudo R2 indicators convey that the performances of the model
have improved in subsequent years.
The probit maximum likelihood estimation of the model is provided in Tables 4,
and it can be seen that the results are not different from the logit model. The estimated
factor for the calculation of the marginal effects from the explanatory to the dependent
variable is also provided at the bottom of Tables 3 and Table 4. One can calculate the
marginal effect of a unit change in the explanatory variable computed at sample means on
the probability of high HDI scores by multiplying the factor with the coefficient of the
explanatory variable. We can notice that size of the factor for the calculation of the
marginal effects derived from the logit estimation remained small in the year 1990, which
became even smaller and recorded near-zero values in all the subsequent years. It is
understood that there exists other explanatory variables that are important in influencing
the probability rate of countries belonging to high human development category. Our
model has focussed on the single explanatory variable of PCGDP, the coefficient of
which turned out to be statistically significant. The positive coefficient indicates that the
GDP levels would determine the probability that a country would belong to the high
human development category.
Table 4: Probit Estimates of HDI on GDP Per Capita (Sample: 1990, 2000, 2010, 2103).
Dependent Variable → HDI Value
Explanatory Variables ↓ 1990 2000 2010 2013
Intercept -2.01
(-4.68) *
-1.71
(-4.59) *
-1.86
(-3.53) *
-2.14
(-3.61) *
Per Capita GDP in current
USD Value
0.002
(4.69) *
0.002
(4.52) *
0.001
(3.49) *
0.001
(3.55) *
Goodness of Fit 0.85 0.92 0.89 0.93
Factor for Calculating
Marginal Effects
0.0000 0.0000 0.0000 0.0000
Pseudo R2 0.62 0.64 0.65 0.68
a) HDI is considered a dichotomous variable, which takes the value of 1 for values more than
0.50; otherwise 0.
b) * indicate statistical significance at 10% level of significance.

Conclusions:
The limitations of GDP as a measure of societal well-being and sustainability are widely
recognized by now and alternative measures are increasingly being used for policy-
making at regional, national and international level.3 It is in fact argued that since the
GDP is mainly a measure of market production and economic activity within a country,
metrics derived from national accounts will never provide a comprehensive indicator of
well-being (Stiglitz, et al 2008). The Stiglitz Commission made several recommendations
for improvements on the existing GDP measure to provide a better measure of economic
performance. Similarly, the European Commission also identified the needs to improve,
adjust and complement the GDP measure with indicators that monitor social and
environmental progress in its member states. The GDP and Beyond roadmap adopted by
the European Commission in 2009 aims to complement GDP with high level indicators
reflecting issues such as environmental protection, quality of life and social cohesion
(European Commission 2013). According to the latest report, the most significant results
of this initiative so far include complementing GDP with environmental and social
indicators and improving measurement towards sustainability among others (European
Commission 2013).
We notice the existence of a high positive relationship between per capita GDP
and human development at the aggregate level of 140 countries during all the four time
periods. We subsequently inquired on the strength of the relationship between the two at
different income levels. When we focus on the nature of the association for high, middle
and low income level of countries, the scatter plots clearly revealed that the relationship
is adequately high in low income level countries and weak in middle income level
countries. Our results therefore suggest that the feature of similarity between the rankings
of HDI and per capita GDP is valid if we only consider the full sample of all countries,
because the extent of correlation remains very different for different income group of
countries. Thus, the low-income countries correlated the most in all the time periods
3 Besides the HDI, some other indicators that are used to measure economic progress today are
the Index of Sustainable Economic Welfare, the Index of Gross National Happiness or the Index of
Inclusive Wealth, among others.

since 1990 to the most recent year 2013, which is followed by the high and then the
middle income group of countries. The magnitude of correlation however increased for
all income groups during the specific points of time from 1990 to 2013.
It may be noted that there are studies that have attempted to examine whether
there existed an empirically discernable and robust tendency in the world for human
development convergence over the previous decades (Mazumdar 2002, Sutcliffe 2004,
Noorbakhsh 2006, Konya and Guisan 2008, Molina and Purser 2010, Mayer-Foulkes
2010). The findings lend support to the convergence hypothesis with the results that poor
and low-income countries managed to increase their HDI better than high income
countries. Overall, results of this study would imply that it may not be appropriate to use
GDP per capita as a representative indicator of the human progress, although there is
some visible correlation between the two. Because, it is important to discern that the
while GDP is a measure of the economic performance of a country, the HDI remains as
the measure of human and social progress.

Bibliography
Anand, S. and A. Sen [2004]: The Income Component of the Human Development Index,
Journal of Human Development, 1 (1).
Boozer, M., G. Ranis, F. Stewart and T. Suri [2003]: Paths to Success: The Relationship between
Human Development and Economic Growth, Discussion Paper No. 874, Economic Growth
Center, Yale University: New Haven, Available in http://ssrn.com/abstract=487469.
Cahill, M. B. [2005]: Is the Human Development Index Redundant, Eastern Economic
Journal, 31 (1).
Costanza, R., M. Hart, S. Posner and J. Talberth [2009]: Beyond GDP: The Need for
New Measures of Progress, The Pardee Papers No. 4, Boston University: Boston.
Coyle, D. [2014]: GDP: A Brief but Affectionate History, Princeton University Press:
New Jersey.
Decanq, K. and M.A. Lugo [2013]: Weights in Multidimensional Indices of Well-Being:
An Overview, Econometric Review, 32(1), pp. 7-34, January.
European Commission [2009]: GDP and Beyond: Measuring Progress in a Changing
World, Communication from the Commission to the Council and the European
Parliament, COM (2009) 433 (final): Brussels.
European Commission [2013]: Progress on the GDP and Beyond Actions, Staff Working
Document 2013 (303), Vol. 1, Brussels.
Fukuda-Parr, Sakiko (2003): The Human Development Paradigm: Operationalizing Sen’s
Ideas on Capabilities, Feminist Economics, 9 (2 – 3).
Haq, Mahbub ul (1995): Reflections on Human Development, Oxford University Press,
New York.
Hicks, N. and P. Streeten [1979]: Indicators of Development: The Search for a Basic
Needs Yardstick, World Development, 7(6), pp. 567-580.
Karabell, Z. [2014]: The Leading Indicators: A Short History of the Numbers that Rule
Our World, Simon & Schuster: New Jersey.
Konya, L. and M. Guisan [2008]: What Does the Human development Index tell us about
Convergence? Applied Econometrics and International Development, 8(1).
Mayer-Foulkes, D. [2010]: Divergences and Convergences in Human Development,
Human Development Research Paper 2010/20, UNDP.
McGillivray, M. [1991]: The Human Development Index: Yet another Redundant
Composite Development Indicator, World Development, 19 (10).

McGillivray, M. and White, H. [1993]: Measuring Development” The UNDP’s Human
Development Index, Journal of International Development, 5(2).
Mazumdar, K. [2002]: A Note on Cross-Country Divergence in Standard of Living,
Applied Economics Letters, Vol. 9, pp. 87-90.
Molina, G.G. and M. Purser [2010]: Human Development Trends since 1970: A Social
Convergence Story, Human Development Research Paper 2010/02, UNDP.
Noorbakhsh, F. [1998]: The Human Development Index: Some Technical Issues and
Alternative Indices, Journal of International Development, Vol. 10, pp. 589-605.
Noorbakhsh, F. [2006]: International Convergence or Higher Inequality in Human
Development: Evidence from 1975 to 2002, Research Paper, No. 2006/15, United
Nations University, World Institute of Development Economics Research.
Ranis, G. [2004]: Human Development and Economic Growth, Discussion Paper No. 887,
Economic Growth Center, Yale University: New Haven, Available in:
http://ssrn.com/abstract=551662
Ranis, G. and F. Stewart [2004]: Dynamic links between the Economy and Human Development,
United Nations Department of Economic and Social Affairs (UN-DESA) Working Paper No. 8,
UN: New York, Available in http://www.un.org/esa/desa/papers.
Ranis, G. and F. Stewart [2006]: Successful Transition towards a Virtuous Cycle of Human
Development and Economic Growth: Country Studies, Discussion Paper No. 943, Economic
Growth Center, Yale University: New Haven, Available in: http://ssrn.com/abstract=920603.
Ranis, G., F. Stewart and A. Ramirez [2000]: Economic Growth and Human Development, World
Development, 28(2), pp. 197-219.
Ravallion, Martin [2012]: Mash-up Indices of Development, World Bank Research
Observer, Vol. 27, No. 1, pp. 1-32.
Santos, M. E. G. Santos [2014]: Composite Indices of Development, in Bruce Currie-
Alder, Ravi Kanbur and D.M Malone [Edt]: International Development: Ideas,
Experience and Prospects, Oxford University Press: New York.
Stiglitz, J.E., A. Sen and Jean-Paul Fitoussi [2008]: Issues Paper, Commission on the
Measurement of Economic Performance and Social Progress, CMEPSP Issues Paper No.
25/07/08-1.
Sutcliffe, B. [2004]: World Inequality and Globalization, Oxford Review of Economic
Policy, Vol. 20, pp. 15-37.
United Nations [1993]: The System of National Accounts, 1993, United Nations: New
York.
United Nations [2008]: The System of National Accounts, 2008, United Nations: New
York.
United Nations Development Programme [1990]: Human Development Report 1990.
Oxford University Press for UNDP: New York.
United Nations Development Programme [1996]: Human Development Report 1996.
Oxford University Press for UNDP: New York.
Weimann, J., A. Knabe and R. Schob [2015]: Measuring Happiness: The Economics of
Well-Being, MIT Press: Cambridge.
![INHALT - CONTENTS - MATIÈRE · RHZ(DW10ATED); (66kW-120kW) 1.6 HDi; 1.6 HDi 110; 1.6 HDi 110 FAP; 1.6 HDi 110 FAP [04]; 1.6 HDi 110FAP; 1.6 HDi 90; 1.6 HDi 90 [04]; 2.0 HDi; 2.0](https://img.dokumen.tips/doc/110x75/605cc6e9948bf00b8613e09d/inhalt-contents-matire-rhzdw10ated-66kw-120kw-16-hdi-16-hdi-110-16.jpg)