Embed Size (px)
Citation preview

ENVIRONMENTENVIRONMENT
LE
MB
AG
A
JU
RU
TE
RA
M A L AY S I A
BOARD OF ENGINEERS MALAYSIALEMBAGA JURUTERA MALAYSIA
KDN PP11720/1/2006 ISSN 0128-4347 VOL.32 DEC 2006 - FEB 2007 RM10.00
BUMPERISSUE

cont
ents
Volu
me
32
Dec
2006
- F
eb 2
007
LE
MB
AG
A
JU
RU
TE
RA
M A L AY S I A
52
64
16
8
4 President’s MessageEditor’s Note
2T H E I N G E N I E U R
Announcement5 Professional Assessment Examination
Competency ExaminationPublication Calendar
Cover Feature6 Auditing For Hazards: Lessons Learnt From Kundasang
Landslide Complex, Sabah
10 Sustainability: Closing The Energy &Environment Cycles
16 Water Leakage Detection – Impact, Innovations AndEconomic Benefits
21 Contaminated Land Remediation Technologies:Current Usage And Applicability In Malaysia
Guidelines25 The National Urbanisation Policy
Seminar29 Safety In Construction: Rules & Responsibility Of
Professional Engineers
Engineering & Law31 Claims For Quantum Meruit And Section 71 Contracts
Act 1950: Is There A Nexus?
Feature35 Environment, Ethics & The Engineer
42 Assessment Of Raw Water Quantity And Quality ForWater Supply
47 Early Warning And Surveillance Systems In SurfaceWater Management
52 Bandar Lestari Environment Award
54 Development Of EWARNSTM Forecast And Real-TimeEarly Warning System On Erosion Risks/Hazards
59 Some Design And Practical PerspectivesIn Concrete Cracks (Part 2)
Engineering Features64 Roofed Bridge At Kg Baru Guchil,
Kuala Krai, Kelantan
Pg 28Borang H
PembaharuanPendaftaran
JuruteraProfesional 2007

Members of the Board of Engineers Malaysia(BEM) 2005/2006
PresidentYBhg. Dato’ Sri Prof. Ir. Dr. Wahid bin Omar
RegistrarIr. Dr. Mohd Johari Md. Arif
SecretaryYBhg. Dato’ Ir. Dr. Judin Abdul Karim
Members of BEMYBhg. Tan Sri Dato’ Ir. Md Radzi Mansor
YBhg. Datuk Ir. Hj. Keizrul AbdullahYBhg. Mej. Jen. Dato’ Ir. Ismail Samion
YBhg. Dato’ Ir. Shanthakumar SivasubramaniamYBhg. Datu Ir. Hubert Thian Chong HuiYBhg. Dato’ Ir. Prof. Chuah Hean Teik
Ar. Dr. Amer Hamzah Mohd YunusIr. Henry E ChelvanayagamIr. Dr. Shamsuddin Ab LatifIr. Prof. Dr. Ruslan HassanIr. Mohd. Rousdin HassanIr. Prof. Dr. Hassan BasriTn Hj. Basar bin JuraimiIr. Ishak Abdul Rahman
Ir. Anjin Hj. AjikIr. P E Chong
Editorial Board
AdvisorYBhg. Dato’ Prof. Ir. Dr. Wahid bin Omar
ChairmanYBhg Datuk Ir. Shanthakumar Sivasubramaniam
EditorIr. Fong Tian Yong
MembersIr. Prem Kumar
Ir. Mustaza SalimIr. Chan Boon Teik
Ir. Ishak Abdul RahmanIr. Prof. Dr. K. S. Kannan
Ir. Prof. Dr. Ruslan HassanIr. Prof. Madya Dr. Eric K H Goh
Ir. Nitchiananthan BalasubramaniamIr. Prof. Madya Megat Johari Megat Mohd Noor
Executive DirectorIr. Ashari Mohd Yakub
Publication OfficerPn. Nik Kamaliah Nik Abdul Rahman
Assistant Publication OfficerPn. Che Asiah Mohamad Ali
Design and ProductionInforeach Communications Sdn Bhd
The Ingenieur is published by the Board ofEngineers Malaysia (Lembaga Jurutera Malaysia)
and is distributed free of charge to registeredProfessional Engineers.
The statements and opinions expressed in thispublication are those of the writers.
BEM invites all registered engineers to contributearticles or send their views and comments to the
following address:
Publication CommitteeLembaga Jurutera Malaysia,Tingkat 17, Ibu Pejabat JKR,
Jalan Sultan Salahuddin,50580 Kuala Lumpur.
Tel: 03-2698 0590 Fax: 03-2692 5017E-mail: [email protected]
[email protected] site: http://www.bem.org.my
Advertising/SubscriptionsAdvertisement Form is on page 63
President’s Message
Editor’s NoteAs 2006 draws to a close, there were series of activities
nationwide on environmentally-related matters. The celebrationof World Habitat Day, National Recycling Day, NationalEnvironment Week and the launching of National UrbanisationPolicy were just some of the events.
Publication with the theme on environment remains the mostpopular among article contributors. The update section onNational Urbanisation Policy attempts to keep readers informed
of the major thrusts and directions on future planning requirements that will haveeffect on future development patterns.
A new section on photographs of interesting “engineering features” has alsobeen introduced since photographs for ”engineering nostalgia” are difficult to comeby. We hope to receive more photographs of such features which you may havepicked up during your daily work.
Meanwhile, on behalf of the Publication Committee, may I wish all our readersMerry Christmas and Happy New Year.
Ir. Fong Tian YongEditor
KDN PP11720/1/2007ISSN 0128-4347
VOL. 32 DEC 2006 - FEB 2007
4T H E I N G E N I E U R
The essence of the professionals is to create, to modifyand to develop the environment of man to serve the needs asperceived in the society of the time. Thus, some elementaryeconomic understanding is needed to be able to judge the“viability” of industrial projects. It is necessary, furthermore,to be informed on the nature and working of the humancommunities within which the professional will apply his skills.There has been, to varying extents in different places, anenlargement of programmes by means of the introduction ofinformation in the human and social sciences, in informationscience and economics.
However, during the last few decades there has been an evolutionary change inthe perception and evaluation of the “environment” in which we should live and inthe way in which we should exploit the resources of our planet. This has been reflectedin: the increasing awareness of the finite nature of many natural resources; the needfor more economic and equitable use of resources; recognition of the degradationand destruction already inflicted and the urgent need to halt and repair this damage;the growing body of legislation and state controls to protect and defend theenvironment; the mobilization of public opinion in the preservation of the quality oflife; the increased awareness and exposure of individuals and political institutions toall these problems and the creation of ministries/departments of environment, ofenergy and natural resources, of land management etc. All these changes have hadconsequences for the training of various professions engaged in the development andmodification of the environment.
It becomes necessary for us to train engineers by giving them the basic conceptsto an understanding of what constitutes sound environmental management, theprocesses involved in natural systems and ecology, and the impact of their professionon the interplay of physical and human factors constituting an environment. Engineershave, in many cases, become aware of the interdisciplinary nature of the problemswhich they face and the need for solutions of a similarly complex, process-orientedform. There is growing awareness of the need to collaborate among professionals andof the need imposed on the various professions by economic and social change totake account of new constraints and demands associated with environmentalconservation, the management of resources, and the changing values associated withacceptable or desired quality of life standards.
Dato’ Sri Prof. Ir. Dr. Wahid bin OmarPresidentBOARD OF ENGINEERS MALAYSIA

T H E I N G E N I E U R
The Board of Engineers Malaysiawishes all readers
The Board of Engineers Malaysiawishes all readers
MerryChristmas
HappyNew Year
2007
&
Gong XiFa Cai!
Publication Calendar
Announcement
The following list is the Publication Calendarfor the year 2007. While we normallyseek contributions fromexperts for each specialtheme, we are also pleased toaccept articles relevant tothemes listed.
Please contact the Editor orthe Publication Officer inadvance if you would like tomake such contributions or todiscuss details and deadlines.
March 2007: AGRICULTUREJune 2007: WASTESeptember 2007: POWER
MerryChristmas
HappyNew Year
2007
&
Gong XiFa Cai!
5
PROFESSIONAL ASSESSMENT EXAMINATION
The Board of Engineers Malaysia (BEM) has decided that the Professional Assessment Examination
(PAE) will be conducted by the Institution of Engineers Malaysia (IEM) on behalf of the Board with
effect from January 1, 2007.
All engineers who intend to sit for PAE are advised to contact IEM at the following address:
Institution of Engineers Malaysia,
Bangunan Ingenieur,
Lot 60/62 Jalan 52/4,
Peti Surat 222 (Jalan Sultan),
46720 Petaling Jaya, Selangor Darul Ehsan.
COMPETENCY EXAMINATION
Competency Examination will be conducted as an additional examination by BEM with effect from
January 1, 2008.
[BEM-255
th
Meeting / December 7, 2006]
DATO’ SRI PROF. Ir. Dr. WAHID BIN OMAR
President
Board of Engineers Malaysia

T H E I N G E N I E U R
By Professor Dato’ Dr Ibrahim Komoo and Sarah Aziz Abdul Ghani Aziz,Institute for Environment and Development (LESTARI), Universiti Kebangsaan Malaysia
6
cover
featu
re
Auditing For Hazards:Lessons Learnt From KundasangLandslide Complex, Sabah
It is a given fact that natural
hazards impact greatly on the
human socio-economic fabric. It
not only poses a threat to life,
destruction of property and
disruption of economic activity,
it also brings about a suite of
risks to planned and existing
developments, particularly in the
way land is to be used. Lessons
learnt from a study of large scale
landslides in Kundasang, Sabah
provide a brief insight of the
prerequisites in comprehending
the characteristics, nature and
potential risks as well as threats
which are often hampered by
inadequate linking of scientific
understanding and governance
processes. Methods from various
disciplines such as engineering
geology (mapping), geotechnical
assessment, socio-economic
impact and evaluation of
governance processes were key
in helping develop an integrative
approach towards better
assessment and control of the
impact and risks ensuing from
the landslides.
It is common practice in Malaysiato use the terms landslides andslope failures interchangeably
when in fact both are distinct in natureand characteristics. Based on a studyon large scale landslides conducted inKundasang, Sabah the main lessonlearnt was that current approaches andtechniques in assessing and mitigatingthe impacts of geo-hazards commonlyapplied in Peninsular Malaysia is notsuited for the phenomenon in Sabah.For one, the landslide complex in thestudy area is made up of six landslidesystems each mass ranging between1.5-5 million m3 and the rate ofmovement varies from location tolocation. It is highly influenced by thenature of the geological characteristicsand the underground water level.
It is important to note that thelandslide events are complex in naturerequiring a multi-disciplinaryapproach to address and ensure longterm risk reduction. Understanding andfinding solutions require applicationof refined science for geo-hazards(landslides), the sociological impactsof the hazard, the governance aspectrelated to control and the besttechnology for prevention andmitigation.
The impact meted by the landslideboth affected the natural surroundingsand the socio-economic fabric, and ina recorded landslide event near one ofthe landslide systems, two men losttheir lives. The study also showed thatthe measures to address impact playeda huge role in determining theeffectiveness of the solution applied.
In some cases, the solution providedresulted in continued rectification,which, in turn, has made a huge denton public spending. The developmentplan for Kundasang too has greatbearing on the stability of the area, asthe plans were drawn up based onexisting information andinterpretations of the same based onmethodologies suited for events inPeninsular Malaysia but notnecessarily in Kundasang.
This, in turn, has led to a ratherfragmented and reactive approachtowards addressing the problem arisingand potential risk posed by thelandslide complex.
Kundasang Landslide Complex:A Brief Introduction
As stated earlier, the KundasangLandslide Complex (KLC) is made upof six landslide systems of varyingsizes and shapes, which continuouslymove at different rates from a fewcm to a few metres per year (seeFigure 1). Its movement is largelydictated by the sub-catchment waterflow and the underground water level.Serious impacts include landsubsidence (see Figure 2), structuraldefects (see Figure 3), slantingstructures (see Figure 4) and damageto infrastructure and utilities such aswater pipes and tanks(see Figure 5),electric cables, poles and drainage.
Impact to the socio-economicfabric included loss of life, loss ofincome due to crop destruction, risingcost of living due to continuous repair

T H E I N G E N I E U R 7
cover
featu
re
and maintenance of property,restriction in transport mobility dueto poor roads and access to socialamenities. There is an element ofhaving to live in and with dangerconstantly, though the study inKundasang has shown the localcommunity, for want of a betteralternative, has indeed soldiered on.Much has to do with ownership ofthe land which has a propensity tomove, and there has been recordedincidences of land disputes whenboundary stones move or structuresinfringe on neighbouring lands.
The Government has spent quitea lot of money mitigating theimpacts particularly to roads andbuildings, but the repairs andmaintenance still continue to date.The case in point is the Tamparuli-Kundasang-Ranau road that cutsacross the landslide complex. It hasseen many facelifts and to date workstill continues.
Getting To Grips WithThe Landslide
‘Auditing’ the danger would be asensible place to begin. A systematicassessment process will have to be
Figure 1. Six landslide systems indicating major geodynamic features mapped between2003-2005 (Source: Komoo, et. al. 2005).
Figure 2. Photograph showing a two-tiered land subsidence due to landslide movement at the head of the landslide affecting themarket behind the Ranau-Tamparuli main road (Komoo, et. al. 2005)

T H E I N G E N I E U R 8
instituted taking into accountfour main prerequisites, that is:
� The need for a geo-hazardinformation system thattakes into account thenature and characteristic ofthe landslide; the impactsto the socio-economicfabric; and the methods andtools required to address therisk and impacts;
� A review of current plannedspatial development andland use taking intoaccount the suitabilityfactor of the areas and theability to absorb impact;
� A merger of sc iencesand methods whereby geo-scientific understandingbecomes the underlyingfactor in assessment andcontrol to complementgeotechnical andengineering solutionsproposed; and
� Re-designing and retro-fittingengineering control measures tosuit local conditions to alleviatethe stress and reduce the causalfactors.
Developing an information systemthat integrates sciences andhumanities would allow for betteranalysis of options in theimplementation of measures to either
mitigate impact or reduce therisk of the landslide. The use ofa geographical informationsystem (GIS) would help putinto perspective the variousthreats and options indeveloping an integratedframework for KLC assessmentand control. It would bring tofore the triggering and causalfactors, in addition reflect theactual scale of the risk andimpact in addition to mappingout the geodynamic features.
Reviewing spatialdevelopment, on the otherhand, would reduce the risk ofthe landslide causing moredamage, since a brief study ofthe changes in land use andland cover patterns ofKundasang has indicated thatsuitability should be the keyfactor in determining the typeand scale of developmentplanned. This itself has becomea crucial issue as Kundasang
has been earmarked for agriculturaland tourism development. Based onthe integrated information collected,special areas of risks can bedemarcated and zoned accordingly,
Figure 3: Photograph showing an opening of anextension crack along a retaining wall at the toe of alandslide unit near the SMK Kundasang (Komoo, et. al.2005)
Figure 4: Photograph showing an abandoned house badly affected by the landslide movement. The owner has since built anotherhouse adjacent to the old structure (Komoo, et. al. 2005)
cover
featu
re

T H E I N G E N I E U R 9
cover
featu
re
and physical developmentcontrol instituted based on theareas determined. Current landuse patterns would then have tobe re-looked to determine andestablish areas for conservation,rehabil i tation, naturalstabilisation and development.
Geo-scientific measures toowill have to be considered, asthe nature and characteristics ofthe landslide varies fromlocation to location. The properunderstanding of the influenceof degree of risk, suitability inaddition to the causal andtriggering factors areparamount in order to designappropriate and cost effectivesolutions. Given the influenceof the sub-catchment flow andunderground water level ,greater emphasis will have to begiven towards adopting an eco-system approach, includingunravell ing the geo-bioindicators that give thelandslides unique signatures.
Engineering solutions wil lremain a fixture towards mitigatingthe impact and reducing the risks,but a refocus will have to be madein light of geo-scientific findingsthat can tai lor the solutionsaccordingly. Two mains lessonslearnt from Kundasang include theneed to use engineering methods tostabilise slopes by increasing forceof resistance against the landslidemovement and reduce the casualfactors of the landslides to areduction in force of the landslides.A re-profile of the key areas, re-drainage and reconstruction ofstabil ising walls wil l have toconsidered based on the respectivenature and characteristics of thelandslide.
Concluding Remarks:Taking The Next Step
Landslides are costly in humanand economic terms, and change thenatural landscape affecting the eco-systems and socio-economic fabric.
The KLC study revealed that thecurrent governance systems andprocesses in place to address geo-hazards, were not designed to meetthe problems head on. Actions takenwere often piecemeal andfragmented, and the study has shownit has been costly, since the solutionsput in place often had to be rectified.Resources were constantlymortgaged, water being the keyvictim. Services such as sewerage,drainage and water supply were noteffective as the damage caused wasoften too great and the cost of repairtoo large. Roads, where possible werepatched up to fill up gaps where theroad had collapsed or cracked. Someroads had become inaccessibleexcept to those with powerful andreliable 4WD.
Stakeholder coordination is amust. The custodians of theresources (the land, naturalresources) and the people will haveto sit with those who can helpremedy the impacts caused by thelandslides as well as with those withthe will to change the physical and
economic landscape ofKundasang. By imparting basictechniques to help identify thegeo-bioindicators to the localcommunities, much time can besaved and danger reduced. Acomprehensive review ofplanned development must bedone taking into account thegeo-scientific information thathas identified the areas of risks(scales of which have beenearmarked) . Engineeringsolutions will have to suit thenature and characteristics ofthe landslides to ensurelongevity and reduce costs.
Much can be done forKundasang, and lessons learntshould provide a good basis fora re-look at the waygeohazards, particularlylandslides are being addressedthroughout the country.
REFERENCES
Komoo, I. & Morgana, S.N., 1999.The Kundasang LandslideComplex, Sabah (extendedabstract). Journal of NepalGeological Society, 20, 230.
Komoo, I. & Salleh, H., 2003.Living with danger: KundasangActive Landslide. In Salleh, H.;Othman, M.
Komoo, I. & Aziz, S. (eds.) Cultureand Science of Mountains .LESTARI UKM Pub., Bangi, 213-223.
Komoo, I., Salleh, H., Tjia, H.D.,Aziz, S., Tongkul, F., Jamaluddin,T.A. & Lim, C.S., 2005. KundasangLandlside Complex: Mechanism,Socio-Economic Impact andGovernance (in Malay).
Paper presented duringStakeholders Dialogue on‘Kundasang Landslide Risks:Impact, Role and Action’, May 22,2005, Kundasang, Sabah.
Figure 5: Photograph showing a badly damagedwater tank (inset) and pipe due to the lateralmovement of the landslide (Komoo, et. al. 2005)
BEM

T H E I N G E N I E U R 10
Sustainability is the latest buzzword to highlight the criticalneed to protect our society from
the vagaries of mankind and toremind us of the urgency to take careof our resources and fragileenvironment in a responsible mannerto ensure our very own sustainableexistence.
To many of us, sustainability inthe built industry may sound like anew terminology. However, if weexamine the concept behind thisword, it is actually not so, as manyof the philosophy expounded haveactually being promoted over theyears albeit under different names.These past terms would include thelikes of “Intelligent Buildings”, “SmartBuildings”, “K-Buildings”, “EnergyEfficient Buildings”, and many otherterms including the still vogue “GreenBuildings”.
Perhaps it would be simpler todefine sustainability as a relativelynew term that refers to our efforts atclosing the energy and environmentcycles.
As society progresses, awarenessnaturally spreads. With energy pricesset to soar and global warmingeffects already felt, the need toaddress sustainability in our dailylives inevitably becomes morepronounced and taken seriously. Infact, as the world’s populationcontinues to grow and the needincreases for more food, comfort and
luxuries, we must learn to do morewith less energy and materials. Wemust begin developing alternativeand renewable energy sources thatwill be available when the knownsupplies of fossil fuels are gone. Wemust also learn to turn our garbageinto a resource.
Simply put, today’s designers haveto develop a “cradle to grave” attitudein their designs.
By thinking initially about the fulllife-cycle of a product and how itmight ultimately be re-used, engineerscan make great strides in helping toclose the cycle. The technical conceptsleading to sustainable developmentespecially in the areas of EnergyEfficiency and Renewable Energy arevery well researched and advanced.The challenge now is to be able toapply these technologies optimallyand in the most sustainable manner.
Optimal applications (for example)in the Malaysian context wouldinclude the ability to adapt and usethese concepts to suit the localclimatic and social conditions –therein lies the formidable challengesof practical applications to also meetsocial and political agendas.
We simply cannot ignore thewritings on the wall and the followingnotable quotes will serve as a constantreminder in our never-ending questto achieve sustainable developmentin all that we do today and in thefuture.
Sustainable Concepts& Elements
At a recent internationalsymposium on sustainability (The2005 World Sustainable BuildingConference in Tokyo), it was quiteobvious (albeit to the author) that newEnergy Efficiency (EE) and RenewableEnergy (RE) concepts are beingexhausted – the challenge now is theiroptimal applications.
Hence, the most effectiveapplications of EE and RE concepts
cover
featu
re
Sustainability: Closing TheEnergy & Environment CyclesBy Ir. Chen Thiam Leong, Fellow & Distinguished Lecturer ASHRAE
This paper is an extract from the recent ASHRAE (American Society for Heating, Refrigerating and Air-Conditioning Engineers Inc.) Regional Conference held in Kuala Lumpur (on Aug 25, 2006) with thetheme “Sustainability: From Design & Installation to Commissioning & Maintenance” The theme wasconceived primarily to promote ASHRAE’s international agenda on Sustainability. Other reasonsincluded the need to address problems faced by developing nations where we are regularly remindedof our ability to achieve 1st Class Infrastructure but only to be undone by our 3rd Class Mentality infailing to sustain these facilities. In terms of the Building Services industry, this quote may be moreappropriately translated as the mentality of achieving 1st Class Design and Installation but 3rd ClassCommissioning and Maintenance habits.
❛Sustainable development isdevelopment that meets the needs ofthe present without compromisingthe ability of future generations tomeet their own needs.❜
Brundtland Commission reportof 1987
❛All political decisions must give dueconsideration to long-termeconomic, social and environmentalconsequences. The aim is to hand onto the next generation a society inwhich the major environmentalproblems have been solved.❜
Sweden
❛A hundred years after we are goneand forgotten, those who never heardof us will be living with the results ofour actions.❜
Oliver Wendell Homes

T H E I N G E N I E U R 11
for the built environment to optimizesustainability would constitute theultimate goal. Some of these conceptsare;
� All forms of low energy andpassive building design features/components
� Active building facades or BlueTechnology
� Proper insulation for walls androofing (including the applicationof green roofs)
� BIPV (Building Integrated PhotoVoltaic)
� Natural Ventilation� Natural Lighting� Solar water heating� High and low ceiling rooms� Ventilated roof� Occupant’s life-style� Good housekeeping� Water saving devices such as less
water flush wc, and water-lessurinals
� Rainwater harvesting and greywater recycling
� Hot water heat reclaim from air-conditioning system
� Energy Efficient lamps and otherelectrical appliances includingfridges, air-conditioners, fans,motors, televisions, personalcomputer’s and laptops.
� Latest and future technologiessuch as fuel-cell hot water –electricity units, air-conditioning- fuel cell units, embedded coolingpipes.
measures”, and the necessity for anincreased efficiency in all forms ofenergy utilization. The Kyoto Protocoland the need to fulfill it are steps inthis direction. There has been a lot ofeffort made to make buildings and theprocesses related to them, such asmaking domestic hot waterproduction more efficient, and toreduce the use of fossil energy sourcesin the built environment. In countrieslike Germany and many others, theapproach has been taken with lowenergy and passive houses, in whichalmost no surplus heating from theenergy supply is needed to keep thehouses at comfortable levels, evenduring harsh winter conditions. Also,research related attempts, such as hightechnology zero energy houses, havebeen made. The aim in all these effortsis to conserve natural and fossilenergy resources with the keyobjective of creating energy consciousand comfortably built environments.
There is nonetheless still a large“savings potential” left, due to the factthat the primary energy demand ofbuildings accounts for more than onethird of the world’s energy demand.Most of the energy supplied is utilizedfor room conditioning, to heat or coolthe room space to maintain atemperature of between 20° and 26°C.
The question remains, what isreally consumed under the law ofenergy conservation? Andfurthermore, is it sufficient to “save”
energy, to be “energy conscious”, orto make sustainable buildings withsustainable “energy” systems?
‘Exergy’ Way To Sustainable Design
It is often claimed that energy isconsumed. This assumption holds truenot only in everyday conversation butalso in scientific discussions associatedwith so-called energy andenvironmental issues. However, thisclaim tends to conflict with the factthat the total amount of energy isconserved even though the forms ofenergy may change from one toanother. It would hence seem ratherconfusing to use one of the most wellestablished scientific terms, “energy”,to mean “to be conserved” and “to beconsumed” simultaneously. This is whythere is need for a new terminology tobe derived - the concept of ‘exergy’ -to really understand what is consumed.
‘Exergy’ can be regarded as thevaluable part of energy. Energy existseverywhere around us, but in formswe cannot use, or at least not directly.So, in this regard, we must beconcerned with the quality of energyflow. The use of high quality energysources, like electricity or fossil fuelsare for high quality applications suchas lighting and driving machines. Butfor low quality energy applications,such as space heating or cooling, weshould not use these high qualityenergy sources.
cover
featu
re
Energy & Energy EfficiencyIn Design
The growing concern ofenvironmental problems, includingglobal warming, which have beenlinked to the extended use of energy,has increased both the importance ofall kinds of so-called “energy saving
Pict
ure
sour
ce: w
ww
.etis
olar
.ca/
high
light
s/BI
PV/

T H E I N G E N I E U R 12
To understand the difference (andimpact) between low and high qualityenergy applications, a simplereference to the generation ofelectricity from a waste incineratorplant would be a good example;
Waste is burned in air stream toensure complete combustion. Hot gasfrom the waste incinerator furnace isthen used to raise steam in a steamcycle to generate electricity. Thisrelatively low steam temperaturelimits electricity generation efficiencyto around 27% which is low whencompared to a coal power stationelectricity generation efficiency ofaround 35%. However, if this wasteheat is instead used directly in district(space) heating (i.e. bypassing theelectricity conversion stage), then theoverall efficiency is over 70% !
‘Exergy’ Efficiency In Design
Kilkis (2004) describes ‘exergy’as a qualitative measure of the usefulwork potential available for a givenamount of energy source. Forexample, low-temperature wasteheat is a low-‘exergy’ resourcebecause only low temperature andlimited applications such as domesticwater service can be realized. On theother hand, natural gas is a high-‘exergy’ resource because severaldifferent useful applications such aselectricity generation can be realized.Existing HVAC (Heating, Ventilation& Air-Conditioning) systems are notdirectly compatible with low-‘exergy’
renewable and waste energyresources unless either the equipmentis oversized and/or resourcetemperatures are conditioned, bothof which are costly measures anddiminish the appeal for renewableenergy resources. Furthermore,conventional HVAC systems dependupon fossil fuels even when heatpumps are used, as heat pumpsdepend on electric power generallysupplied from conventional powerplants using fossil fuels and deliveredat low transmission efficiency.
In the presence of seriousenvironmental issues, the globalneed for sustainable development,and high primary energy costs,
‘exergy’ analysis is the primaryengineering tool for addressing boththe rational utilization of energyresources and protection of theenvironment.
Alfvén (1975) compared energyaccounting irrespective of differentenergy qualities (grades) to a cashiercounting cash only by the numberof coins or notes and neglecting theirvalue. This comparison has a greatsimilarity with what is happening inthe energy-efficiency description ofan HVAC system. HVAC systems arerated only with respect to theirthermal efficiencies, which neglectsthe overall energy, environment, andeconomic relationships. CurrentHVAC systems generally rely onhigh-‘exergy’ fossil fuels for comfortfunctions, which only require low-grade heat or cold. This mismatchdestroys most of the ‘exergy’. ‘Exergy’of any flow or resource is the totalamount of useful work that isavailable, and an HVAC systemwastes most of that. Therefore, it isno surprise that their ‘exergy’efficiency is less than 10% (Rosenand Dincer 1996; Kilkis 2004), or5% on average for Swedish homes(Wall 1986).
It is unfortunate that thisproblem, which has been known fora relatively long time, has not yetbeen addressed: the building sector,with a dominant share in annualenergy use, has a very low ‘exergy’
cover
featu
re

T H E I N G E N I E U R
Low ‘Exergy’ Buildings
‘Exergy’ analysis applied tobuildings shows that the largestfraction of the total supplied ‘exergy’for heating in buildings is consumedwhen heat is generated from othersources, e.g. fossil fuels, natural gas.Parts of these losses occur duringenergy transformation, extraction,
efficiency for energy utilization andcontinues to be responsible forenvironmental degradation, mainlyin terms of CO2 emissions. Residentialand commercial buildings areresponsible for about 39% of theannual US primary energyconsumption, more than 70% of thetotal electric power consumed(Torcellini et al. 2004) and close to40% of CO2 emissions (DOE 1998). Onthe other hand, the thermal efficiencyof HVAC systems has reached a goodsaturation point, well above 90% onaverage, except for thermal energytransport and distribution losses.Therefore, according to Annex 37(IEA and ECBCS 2003), the prioritymust now be given to exergyefficiency and we must develop newHVAC systems with higher exergyefficiencies by addressing the rootcauses. The most rational way toaddress this priority is to utilize low-exergy waste and alternative energyresources directly in temperature-compatible HVAC systems yet to bedeveloped. In this respect, radiantpanels combined with novelconvective systems and independentof any compression cycle seempromising.
13
cover
featu
re
and transformation in power stationsor in heat generation, e.g. in the boiler.Only a small fraction of the ‘exergy’consumption happens within thebuildings (Schmidt and Shukuya2003).
This simply implies that ourknown energy systems consumemore ‘exergy’ than is needed for aspecific purpose. There is clearly a
Pict
ure
sour
ce: /
/virt
ual.v
tt.fi
/ann
ex31
teks
tiraa
mis
sa.h
tm

T H E I N G E N I E U R 14
cover
featu
re
larger potential for ‘exergy’ savingmeasures than for energy “savings”(Johannesson 2004).
There are examples of suchsystems already in the market, suchas thermally activated buildingcomponents used for floor heatingsystems or waterborne systems whereheating or cooling pipes are placedinto the concrete slab construction.Another is the airborne hollow coredeck system, where tempered air firstcirculates inside the construction walls,thereby heating or cooling the roomsbefore being released as fresh supplyair to the rooms (Johannesson 2004).There are many more systemalternatives, which are showcased inthe LowEx Guidebook.
‘Exergy’ analysis can enabledesigners to identify the location, tounderstand the origin, and to establishthe true magnitude of waste or loss.‘Exergy’ analysis is therefore animportant tool for the design ofthermal systems since it provides thedesigner with answers to twoimportant questions of where and whythe losses occur. The designer can thenproceed forward and work on how toimprove the thermal system.
There are a large number ofdemonstration projects which show thewide variety of possibilities to applylow ‘exergy’ heating and coolingsystems in buildings. A collection ofexample buildings can be found in thefinal report, LowEx Guidebook, of theIEA Annex 37. The application of low‘exergy’ systems provides manyadditional benefits besides a moreflexible energy supply, such as:improved thermal comfort, improvedindoor air quality and reduced energyuse. These aspects needs to be furtherpromoted to increase the applicationof low ‘exergy’ systems for heating andcooling of buildings.
Further research is needed toexplore new or not commonly used‘exergy’ resources for the use in thebuilt environment, such as the ground(e.g. using ground coolness forcooling), water (e.g. using ground-,sea- or river water as a cooling source),sky (e.g. using the radiation in a clearsky at night for cooling), snow orothers.
The building regulations andenergy strategies should take the
quality of energy into account morethan today. Wide application of low‘exergy’ heating and cooling systemsin buildings will create a buildingstock, which will be able to adapt tothe use of sustainable energy sources,when desired. Without this ability, thetransfer towards a sustainable builtenvironment will be delayed fordecades.
CONCLUSION
Closing the energy andenvironment cycles is certainly notan easy task. It is a necessarycommitment if the human race wantsto ensure its own sustainableexistence. We simply have no choicebut to work towards this goal of (atleast) stretching our resources.
For the built environment, theHVAC industry which has servedmankind extremely well (in terms ofcomfort convenience and the like),now needs to be at the forefront ofthis effort (since we will not likelysacrifice all the comfort and luxurythat HVAC has afforded and for whichwe are now accustomed to).
In order to reduce ‘exergy’ wasteit is imperative that we developinnovative yet practical and feasiblenew HVAC methods and equipment.Without such an ‘exergy’-conscious(rather than energy-conscious)change in the near future, buildingswill continue to contributeextensively to global warming.
The need to address“Sustainability: From Design &Installation to Commissioning &Maintenance” even when appliedonly to the HVAC sector, represents avery broad and dynamic subject. Wehave to adopt an integrated approachright at the onset of the design processall the way to installation before wecan assure proper commissioning canbe carried out and maintainability canbe achieved and thereafter sustained.It is far too common not to recognisethat the industry has progressed at arather large differential pace for thesefour different component stages, andwe really must close this gap to realisea sustainable built environment.
As a parting food for thought, theauthor’s rating of these fourcomponent stages (scale of 0 to10) in
the current built environment (inMalaysia) is as follows;
Average (Maximum)Standard Achieved
Design 7 (10)Installation 5 (9)Commissioning 5 (8)Maintenance 3 (7)
REFERENCES
Ahern J. 1980. The Exergy Methodof Energy System Analysis. NewYork: Wiley-IntersciencePublication, John Wiley and Sons.
Ala-Juusela, M. (ed.); Schmidt, D. et.al. 2004. Heating and Cooling withFocus on Increased Energy Efficiencyand Improved Comfort. Guidebookto IEA ECBCS Annex 37.
VTT Research notes 2256, VTTBuilding and Transport, Espoo,Finland, 2004.
Annex 37. 2005. InternationalEnergy Agency – Low Exergy heatingand Cooling of Buildings – Annex37, Web Homepage, http://www.vtt.fi/rte/projects/annex37/Index.htm.
Baehr H.D. 1980. ZurThermodynamik des Heizens- I. Derzweite Hauptsatz und diekonventionellen Heizsysteme.Brennstoff-Wärme-Kraft, Germany,Vol 32, No 1, 1980, pp. 9-15.
Baehr H.D. 1980a. ZurThermodynamik des Heizens- II.Primärenergieeinsparung durchAnergienutzung Brennstoff-Wärme-Kraft, Germany, Vol 32, No 2, 1980,pp. 47-57.
DIN 4701-10. 2001. Energy Efficiencyof Heating and Ventilation Systemsin Buildings – Part 10: Heating,Domestic hot Water, Ventilation.German National Standard. Berlin:Deutsches Institut für Normung e.V.
Birol I. Kilkis, PhD Fellow ASHRAE.From Floor Heating to Hybrid HVACPanel – A Trail of Exergy-EfficientInnovations
BEM

T H E I N G E N I E U R
By Prof. Madya Ir. Dr. Eric Goh, Head - Amquest Research, USM Engineering Campus, Universiti Sains Malaysia,Ir. Muhd. Sobri Zakaria, Senior Engineer - Penang Water Supply Corporation (PBA) andIr. Peter Chin Joo Negan, Managing Director - DemoCipta
Water Leakage Detection – Impact,Innovations And Economic Benefits
cover fe
atu
re
16T H E I N G E N I E U R
The headlines in the New Straits Times entitled‘Water shortage in Seremban at Critical Stage’ was ashock to everyone since Malaysia lies in theequatorial zone and is blessed with abundantrainfall. In the above-mentioned June 2005 newsarticle, it was also reported that the Sg. Terip Damsupplying water to the state capital of Serembancould only continue to supply water for another 39days in the absence of rain and that thecomplementary dam at Kelinchi was almost dry! Thenation was at a loss of words. Where had theexcessive rainfall, which at times causes floods,disappeared to? The State Authorities subsequentlyconcurred, with the results from Water NetworkManagement Studies carried out worldwide, that asignificant percentage of water is lost while in transitfrom treatment plants to consumers. Findings fromrecent investigations carried out by theInternational Water Supply Association (IWSA) in1991 indicate that the amount of water lost or‘unaccounted for’ is typically in the range of 20 to30% of the original production of treated water (IRC,2005). A recent study carried out in Sandakan,Sabah noted that physical leakages have beenassessed at 30.8MLD or 39% of the 77 MLD waterproductions. The leakage frequency for the Sabahwater supply mains is approximately 280 bursts/100km; a statistic that approximates to ten times
that of the acceptable ‘non-revenue’ level in the U.K. (HalcrowWater, 2005). In Penang, the state-ownedutility has tried its best to efficiently manage the supply water by paying considerable attention inupholding an effective water supply infrastructure, particularly in the replacement of old pipes, and inmaintaining an efficient water management network. Faulty pipes are the principal culprits in waterlosses. This has resulted in a 50% loss of water in most of the other states nationwide – the so-calledNon-Revenue Water (NRW) that the utilities corporation cannot account for primarily because ofleakages. In addition to environmental and economic losses caused by leakages, the presence of leakypipes pose a public health risk as leaks are potential entry points for contaminants should a pressuredrop occur in the water network system. An efficient water leakage detection system would be anadvantage to arrest further losses of this precious commodity. The impact, innovations and benefits foreffective water leakage detection would be of great economic benefit to the Government as it workstowards sustainable national development.

T H E I N G E N I E U R
Origin of Water Leak
Rapid decrease
of noise level
Maximum leak noise level
Water
Leakage
Detection
Technique
17
The need to conserve watersupplemented by the concernover public health risks are
good incentives to implement leakagedetection and control programs. ThePenang Water Authority is amongstthe most efficient in the country withNon-Revenue Water (NRW) lossesaveraging only about 20%. Incomparison, some of the other Statesin Malaysia have NRW losses of amuch greater magnitude; for example,the NRW losses in Sabah amount to58%, Kedah (48%), Pahang (48%) andKelantan (40%); with all the otherstates having NRW losses above 40%.Even Kuala Lumpur and Selangor, twoof the most progressive states in thecountry have NRW losses amountingto 40% (Water Watch, 2005). Therecent predicament by Negri Sembilanindicates that the NRW losses in thestate could be as high as 50%. Some ofthe potential benefits to every StateWater Authority of lower NRW waterloss statistics via effective leakdetection include:
� Increase in state revenue from theefficient delivery of treated waterto the community and industry.
� Savings in delayed capacityexpansion, as a result of well-organised usage of existing watersupply thus.
� Improved public relations betweenconsumers and the State WaterAuthorities.
� Reduced risk of contamination totreated water supply from seepageof pollution from environmentinto pipe network.
� Increased base of knowledge onwater distribution network forimproved response time for piperepair or replacement duringemergencies.
� Optimum energy consumptionsince pressure need not beincreased to deliver the water inthe supply network system.
� Efficient fire-fighting capabilitiesdue to optimum pressuremaintained in water pipedistribution networks servicinghydrants.
Causes Of Water Pipe Leakage
Owing to evolving changes in theclimate worldwide and the civicconcern of the internationalcommunity, water resources are nowconsidered a valuable commodity.The primary objective of all globalwater utility suppliers is the successfuldelivery of all treated water viadistribution networks to the respectiveconsumers. However, in reality asizable portion of treated water is lostwhilst in transit from treatment plantsto consumers. ‘Unaccounted-for’water is simply defined as thedifference between the treated waterproduced and the actual volume ofwater that reaches consumers at theend of the distribution networks. Theprinciple cause of excessiveunaccounted-for water is leakage.Some of the main factors contributingtowards leakage in water distributionnetworks include:
� Degradation of pipe materialquality due to harsh climatic andground conditions at site.
� Water quality which includesextreme temperatures, highpressures and abrasiveness ofimpurities transported in fluid.
� Inadequate maintenance ofpipelines and valves.
� Poor initial design of distributionor joining systems.
� Sub-standard usage of distributionsystem components during theinstallation phase.
� Uncoordinated maintenance oflocalised pipes which do notconform to overall distributionnetwork set-up.
� Structural damage or unplanned/accidental excessive load, stressfrom traffic vibrations applied toconcealed subsurface pipedistribution set-up.
� Inadequate corrosion protection.
Water LeakageDetection Surveys
Active leakage detection andcontrol is one of the basic methods ofmanaging real losses in any cleanwater supply network. Management
cover fe
atu
re

T H E I N G E N I E U R 18
of leakage control is a long-termactivity and is thus an essential exercisefor any State Water Authority. Thisinnovative cost saving method i.e.active leakage control is one of the mosteffective methods of reducing losses ofthis important commodity. The benefitsof reducing water leakage in thedistribution network are as follows:
� Less water needs to be produced.Therefore, this translates into costsavings on the operation andmaintenance via the reduction ofchemical usage for watertreatment process.
� Costs involved in leak repair arelower than the costs for repairingpipe bursts.
� Good public relations andcompany image.
� A systematic system or method ofreducing leakages will also reduce
the level of contamination inthe system.
� An in-depth knowledge of realwater consumption in thecommunity will help to improvethe prediction of water demand forreliable long-term economic andlogistic planning.
Mechanics Of NRWLeakage Detection
Basically three types of sounds areidentified as being caused by leakagefrom underground water pipes(SubSurface Leak Detection, 2005):
(i) Pipe vibrations due to reductionin orifice pressure.
(ii) Water impaction on nearby soil.(iii) Circulation and seepage of water
in the soil cavity formed due tothe leakage from pipe system.
From studies carried out, it wasobserved that pipe vibrations orresonance produce the loudest ormost intense leak noise, similar to a‘whoosh’ or a ‘hiss’. The sound of theimpaction and seepage of leakagewater is not so noticeable. Waterimpacting directly onto soil producesa ‘rapid thumping’ or ‘beating’sound; complemented by the soundof ‘a mountain stream’ when theleakage water infiltrates the soil orflows around the outer surface of thepipe.
The variables affecting theintensity and frequency of thesounds produced due to waterleakage from pipes and transmittedto the surface of the ground are:
� Water pressure within the pipe.� Material and Diameter of pipe.� Depth of overburden/soil
overlaying water pipe network.� Soil Type and Compactness.� Type of Surface Cover (cement,
asphalt, grass or loose soil).
A summary of research findingsfrom noise characteristics due toleakage from water distributionsystems include the following:
� PVC water pipes transmit waterleak sounds that are softer and oflower frequency compared tometal pipes (knowledge on pipematerial is essential in analysis).
� Leaks from small diameter pipes(whatever the material) transmitsmore noise and of higherfrequency compared to largediameter pipes.
� Hard and compacted soils are thebest medium for transmittingleakage noise. However, sandysoils, water-saturated soils andvery loose soils are not effectivetransmitters of leak noise.
� Depth of buried pipe network isanother factor since soil absorbsthe sound of water leaks. It iseasier to detect water leaks at 1mdepth compared to sites where thepipes are buried more than 3mbelow the surface.
cover fe
atu
re

T H E I N G E N I E U R 19
� Surface ground cover overlayingthe distribution pipe network canaffect leak detection analysis.Concrete slabs or hard surfacesresonate with the sounds of thewater leak; thus the sound of theleak can still be detected 2-3maway from the pipe. However,grass lawns and loose soil are notgood transmitters of vibrations.
Leakage Detection Technology
Specialised instruments that areused in an active leakage controlprogramme include:
� Noise Loggers.� Digital Noise Correlators.� Electronic Listening Devices.� High-tech Ground Microphones.
The water distribution system ischecked for leaks during the surveyphase by using acoustic equipmentthat detects the sound or vibrationsinduced by water as it escapes frompipes under pressure. The state-of-the-art acoustic equipment
commonly used includes listeningdevices such as aquaphones/sonoscopes and geophones/groundmicrophones (IRC,2005). Acousticequipment also includes leak noisecorrelators. Correlators arecomputer-based instruments thathave a simple field set-up and workby measuring leak signals (sound orvibrations) at two points thatbracket a suspected leak. Theposit ion of the leak is thendetermined autmatically based onthe time shift between the leaksignals calculated using the cross-correlation method.
Innovations of the digitalcorrelators, recently developed in2002, over its analogue predecessorinclude (IWA, 2003):
� Superior performance in locatingleaks on all pipe materials(including plastics) and sizes.
First-pass leak detection survey(daytime correlation and sounding)
No
No
Yes
Yes
Yes
Yes
Follow repair procedure
Follow repair procedure
Repair valves
Repair leaks found
Yes
No
No
No
Carry out night leak survey
Do leaks foundequal excess night flow?
Do leaks foundequal excess night flow?
Is a step-testworthwhile?
Carry out step-testplanning procedure
Are valves operable?
Carry out step-test
Analysis results
Leak locationrequired?
Flowchart of NRW Leakage Detection
cover fe
atu
re

T H E I N G E N I E U R
� Easy to use complemented withrapid processing time.
� Efficient transmission of digitaldata with no data loss.
Another technological innovationsto increase the accuracy of NRWleakage detection include thedevelopment of the combined acousticlogger cum leak noise correlator.Advantages of this new set-up includereduction in wait time in theidentification of the leak noise andpinpointing the exact location of theleak, thus reducing the repair time andeventually cost of repair.
The Ground Penetrating Radar(GPR) is another advancement that canbe used to locate leaks via observationsof cavities, voids or disturbed groundin the ground near the sub-surfacewater pipes. The GPR System worksbest in dry and granular soils. Usefulin locating leaks at sites with excessivebackground noise such as traffic orpumps.
The Gas Injection and Tracertechnique can also be used to detectaccurately the location of leaks. TheTracer Gas, normally industrialhydrogen, is introduced into the pipenetwork that will eventually escape atthe point of the leak. A sensor probe atthe surface is used to detect the pointwhere the Tracer Gas escapes to theenvironment.
Another innovation in NRW leakdetection is the usage of the SurfaceSensor Array. This equipment sends offradio frequency carrier signals into theground and the waves reflected fromthe various ground conditions aresubsequently analysed. Theinterferometer component of this set-up will detect the changes in phase andamplitude modulation of the reflectedsignal caused by flowing water from aleak source. The location of the leakcan thus be confirmed to a high degreeof accuracy.
Leak Abatement Programme
The phases of work for successfuloperation of a leak abatementprogramme are:
� Accurate mapping and continuousupdating of the entire distributionnetwork.
� Identification of high-risk leakprone sections of pipe systems.
� Inspection of valves and hydrantsin distribution system.
� Systematic placement of leakdetection equipment/loggers atstrategic locations in thedistribution network.
� Isolation of leaks, upon detection,to a particular line segment orlocal pipe network.
� Establish the exact location foreach leak detected.
� Characterisation of all leaksobserved according to theirmagnitude.
� Setting up of a computerised on-line database containing records ofall leaks detected for easy retrievaland future network planning anddesign.
CONCLUSION
The feature has successfullydiscussed the economic benefits andthe various innovative techniques forthe detection of leaks in any waterdistribution network. These activitiesare useful for further strategicdevelopment to decrease NRW losses.When treated water flow increases inefficiency, less energy is required totransport this valuable commodity tothe respective consumers. Theeconomic benefits generated by thistechnology means a ‘win-win’scenario for all concerned: thegovernment can quantitatively justifythat all the valuable water in thenation is being used effectively; therespective Water Authorities willgenerate savings via actualtransportation of all treated waterproduced to the consumers thus anincrease in revenue; whilst theconsumers will benefit via nosignificant increase in water tariffs/bills since the respective WaterAuthorities will now not be runningat a loss due to excessive leakages ofNRW to the environment. This nobleobjective should thus meet the
escalating demands of the communityand complement the Government’sneeds for further efficientindustrialisation and nationaldevelopment.
REFERENCES
IRC – Inst. of Research inConstruction (2005). LeakageDetection. http://irc.nrc.gc.ca
HalcrowWater (2005).Leak Detection.www.halcrowwaterservices.co.uk.
IWA (2005). Leak detectionpractices and techniques:a practical approach.www.iwapublishing.com
Lambert, A.O. (2004). PersonalCommunication, September.International Water DataComparisons Ltd, UK
Lambert, A.O., Myers, S. and Trow,S. (2004). Managing Water Leakage(Economic and Technical Issue)
NSTP – News Straits Times Press(2005). Water shortage inSeremban at Critical Stage.
Office of Water Services(OFWAT)(1999). 1998 - 1999 Report onleakage and water efficiency
RAJAC (2005). Leak detection andabatement in water utility.www.rec.org.
Reynolds, J. and Preston, S. (2004).The International Application ofBABE Concepts - From FeasibilityStudies to Performance TargetBased NRW Reduction Contracts
SubSurface Leak Detection (2005).How to find leaks.www.subsurfaceleak.com
Water Watch, 2005. Non-RevenueWater.http://greenfield.fortunecity.com
BEM
20
cover fe
atu
re

T H E I N G E N I E U R
By Yin Chun Yang1,3, Assoc. Prof. Ir. Dr. Suhaimi Abdul-Talib2,3, Ir. Dr. G. Balamurugan3 and Ir. Khew Swee Lian3
Contaminated Land RemediationTechnologies: Current Usage AndApplicability In Malaysia
21T H E I N G E N I E U R
Contaminated lands are often the blight of concerted industrialactivities in highly developed and industrialized countries.Unfortunately, Malaysia is not unaffected by this issue and thusrequires intervention in terms of tightening of legislation regardingcontaminated land as well as application of established remediationtechnologies. Since redevelopment of such sites are alreadyearmarked under the 9th Malaysia Plan, it is reckoned that the nextstep for related stakeholders is to focus on local customization orcreation of cost-effective and effectual contaminated landremediation technologies. As applications of these technologies arestill in their infancy in Malaysia, familiarity of such technologies islacking among pertinent stakeholders. Therefore, this paper aimsto provide an overview of the types of contaminated landremediation technologies with regards to their current usage andapplicability in the Malaysian context. Technologies such as soilvapour extraction, bio-remediation, containment, solidification/stabilization, excavation and phyto-remediation are described. It issuggested that a long-term strategy be established to ensure moreexpertise and technologies with regards to contaminated landremediation will be locally available. All agencies, either public orprivate should invest in the training of their personnel so that a poolof local experts can be made available in the near future.
The presence of contaminatedland has been the subject ofconcern in most developed
countries for at least two decades,especially countries that areexperiencing scarcity ofuncontaminated land (greenfields) fordevelopment. Even though thepredicament of contaminated land inMalaysia is not thought to be aswidespread as that found inindustrialized countries, the problemnevertheless exists and demandsintervention. Many of the olderindustrial areas in Malaysia havelarge patches of contaminated land
including petrol stations, wastedisposal sites and ex-mining sites.Land contamination in Malaysia isgenerally attributed to:
(a) Indiscriminate dumping of wastes;(b) Leaking of underground
petroleum storage tanks;(c) Improper and illegal storage of
fuel and chemicals withinindustrial premises;
(d) Years of gradual accumulationof chemicals within industrialpremises.
U t i l i za t ion o f e s tab l i shedtechnologies for land remediationin Malaysia is rather limited ascompared to developed countries.These technologies are mostlybeing utilized on a trial basis ino rde r to fac i l i t a t e loca lremediation engineers to evaluatethe t echn ica l and economicfeasibility of local application.However, wi th the imminentcreation of a National Register forcon tamina ted s i t e s andformulation of comprehensivepolicies on redevelopment of suchsites earmarked under the 9 th
Malaysia Plan, these technologieswil l be essent ial in ass is t ingsus ta inab le deve lopmentin i t i a t ive s in the count ry.H i the r to , the ma jo r i ty o fengineers and environmentalexperts in Malaysia are unawareo f the ex i s t ence o f suchtechnologies and this may hampere f fo r t s in r edeve lopment o fcontaminated sites. As such, theaim of this paper is to provide anoverv i ew o f the types o fcontaminated land remediationtechnologies with regards to theircurrent usage and applicability inthe Malaysian context.
1Faculty of Chemical Engineering, Universiti Teknologi MARA2Faculty of Civil Engineering, Universiti Teknologi MARA3Environmental Engineering Technical Division, The Institution of Engineers, Malaysia
cover fe
atu
re

T H E I N G E N I E U R
Contaminated Land Remediation In Malaysia
Petroleum Industry Other Industries
Retail DownstreamOperations
Oil Depots PetroleumRefineries
ChlorinatedHydrocarbons
Metal
Applicable Remedial Technologies
ApplicableRemedial
Technologies� Soil Vapour Extraction (SVE)� Remedial Natural Attenuation� Enhanced Attenuation� Bio-remediation� Containment
� Soil Vapour Extraction� Bio-remediation� Containment
ApplicableRemedial
Technologies
� Solidification/ Stabilization� Containment
22
The Need For ContaminatedLand Remediation TechnologiesIn Malaysia
Demand for contaminated landremediation technologies in Malaysiais low compared to developedcountries due to the exorbitant costsof carrying out remediation and thelack of legislation to obligate culpritsto bear the remediation costs. Large-scale contaminated land remediationis primarily conducted on a voluntarybasis and not regulatory driven, albeitsome organisations would find itnecessary to fulfill property lease orpurchasing requirements by carryingout remediation activities (Leong andNg, 2001). Therefore, cost still plays amajor factor for industries that arewilling to acquire the services ofenvironmental firms in order to cleanup contamination located within theirpremises. Other externalcircumstances that cause the need forcontaminated land remediation inMalaysia include property valuedepreciation, negative public
perception and requirement fromthird parties such as potential buyersof the property (Lee, 2001).
Description OfRemediation Technologies
The selection of remediationtechnology for cleaning up of aparticular contaminated land isdependent upon various factors suchas local soil conditions, hydro-geological conditions and the types ofcontaminants. Most establishedremediation technologies do notnecessitate localized customization.
The predominant industry thatfrequently conducts contaminatedland remediation in Malaysia is thepetroleum-based industry. Locationssuch as retail downstream operations(petrol kiosks), oil depots andpetroleum refineries are examples ofpetroleum-based premises thatgenerally require contaminated landremediation. This may be attributed tothe fact that the petroleum-basedindustry is managed by established
multi-national corporations thatincorporate efficient and well-organized environmentalmanagement systems in their routineoperations. As a result, these systems,which are standard corporaterequirements, compel thecorporations to carry out clean-upactivities of contaminated sites withintheir premises. Conversely, otherindustries such as metal plating, paperand textile in Malaysia are generallymanaged by small and mediumenterprises (SMEs) which generallyignore contaminated spots withintheir premises due to their supposedlymeagre profits to cover the high costsof remediation.
Figure 1 shows the list ofcontaminated land remediationtechnologies normally used inMalaysia. These technologies includesoil vapour extraction, bio-remediation; remedial naturalattenuation, containment,solidification and stabilization,contaminated soil excavation andphytoremediation. Subsequentsections provide a brief description ofthese technologies and theirapplicability in Malaysia
� Soil Vapour ExtractionSoil vapour extraction (SVE)
removes harmful chemicals, in theform of vapours, from the soil abovethe water table. These chemicals areusually organic compounds which areeasily volatilized (VOCs). The vapoursare extracted (removed) from theground by applying a vacuum to pullthe vapours out (USEPA, 2001). Thistechnology is depicted in Figure 2. Inmost local clean up projects involvingorganics (especially if groundwatercontamination is a concern),remediation is usually conducted bymeans of SVE and coupled with aboveground pump-and-treat (P&T) systemsthat incorporate small-scalewastewater treatment systems tofacilitate and expedite the clean upprocess. Local application of SVE isvery suitable due to constant warmtemperature (300 ± 50C) in the countrythroughout the year that facilitates
Figure 1: Contaminated land remediation technologies in Malaysia
cover fe
atu
re

T H E I N G E N I E U R 23
rapid evapouration of organic-basedchemicals under vacuum withincontaminated soil matrix.
� Bio-remediation And RemedialNatural AttenuationBio-remediation allows natural
processes to clean up harmfulorganic chemicals in theenvironment. Microbes that arepresent in soil and groundwaterdegrade certain harmful chemicals,such as those found in gasoline andoil spills. When microbes completelydigest these chemicals, they changethem into water and harmless gasessuch as carbon dioxide (USEPA, 2001).Bio-remediation can be conductedin-situ or ex-situ . The mostsignificant parameters affecting bio-remediation are temperature,concentration of nutrients/fertilizersand concentration of oxygen(aeration). In Malaysia, laboratory-scale treatability studies must becarried out prior to actual clean-up.A diagram illustrating themechanisms in bio-remediation isshown in Figure 3.
Natural attenuation relies onnatural processes to clean up orattenuate pollution in soil andgroundwater in-situ . Naturalattenuation occurs at most pollutedsites. However, the right conditionsmust exist to clean sites properly. Ifnot, cleanup will not be quick enoughor complete enough (USEPA, 2001).The supplementary engagement ofexperts to monitor or test theseconditions to ensure naturalattenuation is working is calledmonitored natural attenuation (MNA).In recent years, there have beenrequests for natural attenuation to bepart of contaminated soil remediationstrategies in Malaysia. This method isstill novel and generally conductedsubsequent to a primary clean-upactivity where monitoring of soilconditions is initiated.
� ContainmentThis is the simplest remediation
method currently used in Malaysia. Itis employed if there are no potentialenvironmental and/or public healththreats posed by the sub-surface
contaminants. This method merelyinvolves paving the entirecontaminated site with concrete toprevent public contact, with no efforton contaminant source removal.Additional steps involve placing acover over contaminated materialsuch as wastes buried at a landfill tostop rainwater from seeping throughthe wastes and carrying pollution intogroundwater, lakes or rivers.
� Solidification/StabilizationSolidification/Stabilization (S/S)
technology uses physical andchemical processes to producechemically stable solids withimproved contaminant containmentand handling characteristics (USACE,1995). Solidification refers to aprocess whereby wastes in the formof sludges or soils, are solidified toproduce free-standing and monolithicmasses with enhanced physicalintegrity (Cheng, 1991; USACE,1995). Stabilization is a chemicalalteration technique of reducing themobility and solubility ofcontaminants in wastes or soil(Conner 1990; Vipulanandan andWang, 1997). S/S is best utilized forsoil heavily contaminated with metalsand can be utilized either in-situ orex-situ. In-situ S/S operations,schematically shown in Figure 4,usually consist of augers to mixclean-up materials and metalcontaminated soils with addition ofwater. The clean-up materials usuallyconsist of chemical binders such ascement or lime (CaO) and otherpozzolanic materials. S/S is the BestDemonstrated Available Technology(BDAT) in the US for remediation ofmetal contaminated soils due to itshigh effectiveness in stabilizingmetals. This technology is also highlyadaptable to Malaysian weather ashigh humidity permits highcementitious hydration of mixedslurry, rendering high compressivestrength of the treated soils.
� Contaminated Soil ExcavationThis is the conventional method
used by the local authority (especiallyFigure 3: Mechanisms of bioremediation (Adapted from USEPA, 2001)
Extraction well
Water table
Wastewater
treatment
system
Treated
water
Ground surface
Feeding
tank
Polluted
groundwater
CO2 + H2O
(1) Microbes
approach
organic
contaminant
(2) Microbes
attached to
organic
contaminant
(3) Microbes
degrade
organic
contaminant
(4) Microbes
release CO2
and water into
soil matrix
Figure 2: Soil vapour extraction (Adapted from USEPA, 2001)
cover fe
atu
re

T H E I N G E N I E U R 24
BEM
the Department of Environment) toremove the direct threat ofcontaminated soil on groundwatercaused by illegal dumping ofscheduled wastes. The excavatedcontaminant is subsequently treatedex-situ at a treatment facility.Although this method is usually fastand cost-effective, alternative clean-up technologies are being consideredas excavation is not viable for clean-up of soils contaminated at depths ofmore than five metres.
� Phyto-remediationThis method utilizes plants to
accumulate heavy metals or organicsin contaminated soils. It consists oftwo mechanisms, namely, phyto-extraction involving uptake ofcontaminants by plants and phyto-stabilization, where excretion ofcomponents from plants decreasesoil pH and form metal complexes.The use of phyto-remediation forextraction of contaminants fromsoils is almost non-existent inMalaysia and is mainly limited tobench-scale research in academicinstitutions. However, thistechnology presents itself as anattractive remediation option as itincreases the aesthetic values of thecontaminated site and requires lessequipment and labour than any otherremediation methods.
Conclusions &Recommendations
Expertise and land remediationtechnologies are currently available inthe global market. In the short term,
Malaysia can rely on the pool ofavailable experts and technologies inthe global market. However, Malaysiamust consider a long-term strategy toensure expertise and technologies willbe available locally. All agencies, eitherpublic or private should invest in the
training of their personnel so that apool of local experts can be madeavailable in the near future. Varioustraining institutions in the countryshould also provide trainingprogrammes, courses, seminars bybringing in experts from developedcountries, especially from the US, orby tapping into the pool of expertsfrom multi-national companies basedin Malaysia. Contaminated soilremediation technologies, while still intheir infancy in Malaysia in terms ofmarket potential and applicability,should be viewed as importantcommodities especially since theGovernment plans to tightenlegislations and policies regardingcontaminated land remediation anddue diligence matters.
ACKNOWLEDGEMENT
The authors gratefully acknowledge Mr. Ng Hon-Seng, Regional Director ofENSR Corporation Sdn Bhd for his magnanimous contribution of valuableand up-to-date information pertaining to contaminated land remediationprojects in Malaysia.
REFERENCES
Cheng, K.Y. (1991). Controlling Mechanisms of Metals Release from Cement-based Waste Form in Acetic Acid Solution. Ph.D Thesis. University ofCincinnati, USA. unpublished
Conner J.R. (1990). Chemical Fixation and Solidification of HazardousWastes. Van Nostrand Reinhold, New York.
Leong, K. and Ng, H. S. (2001). Remediation Case Studies for Industrial Sitesin Asia. Proceedings of the National Conference on Contaminated Land:Brownfield 2001, 14 – 15 February 2001, Petaling Jaya, Selangor, Malaysia.
Lee, A. K. (2001). The Need for the Registration of Contaminated Sites inMalaysia. Proceedings of the National Conference on Contaminated Land:Brownfield 2001, 14 – 15 February 2001, Petaling Jaya, Selangor, Malaysia.
USACE (1995). Engineering and Design – Technical Guidelines forHazardous and Toxic Waste Treatment and Cleanup Activities, U.S. ArmyCorps of Engineers, Washington D.C., pp. 4-88 to 4-93.
USEPA (2001). Citizen’s Guides to Cleanup Methods. U.S. EnvironmentalProtection Agency.
Vipulanandan, C. and Wang S. (1997). Solidification/Stabilization ofHexavalent Chromium Contaminated Soil. Proceedings of the Conferenceon In-Situ Remediation of the Geoenvironment, 5-8 October 1997,Minneapolis, Minnesota, USA.
Figure 4: In-Situ solidification/stabilization of contaminated soil (USEPA, 2001)
Mixing of
cleanup
materials
and polluted
soil
Polluted soil
Clean soil
Ground
level
Water
tank
Cleanup
materials
cover fe
atu
re

T H E I N G E N I E U R 25
Issued by Jabatan Perancangan Bandar Dan Desa (JPBD)Submitted by Cheo Hong Keyong
The National Urbanisation Policy (NUP) will guide andcoordinate the planning and urban development of the countryto be more efficient and systematic particularly to handle theincrease in the urban population by 2020 with emphasis onbalancing the social, economic and physical developmentwithin urban areas. It will also serve as the foundation toencourage racial integration and solidarity for those who willreside in the urban areas.
The NUP will be the main thrust for all urban planning anddevelopment activities in Peninsular Malaysia includingdevelopment plans at the state and local level. This policywill outline the thrust, policy, measures and implementationplan to coordinate and manage the urbanisation process ofthe country.
Philosophy
The formulation of urbanisation policies should be based onthe philosophy of a liveable city which encompasses thefollowing:
� Generate economic development in order that the nation’sprosperity is shared equitably and beneficial to all.
� Provide quality urban services, utility and infrastructurerequired by the population.
� Emphasize safety aspects in towns.� Ensure the design and quality of urban fabric is based on
the local cultures of the nation.� Focus on the preservation and conservation of the
environment.� Promote social development and national unity.� Promote participation of the residents in their respective
community development towards enhancing governancefor greater efficiency and effectiveness.
� Eradicate urban poverty.� Be sensitive and innovative towards technological
advancement and development.
Goal
The goal of urban development to create a livableenvironment that could realize a peaceful community andliving environment requires a balance in all aspects ofdevelopment, namely physical, economy, social andenvironment. This is in line with efforts to achieve the goal
of Vision 2020 for Malaysia to be a developed nation. Toachieve this, the National Urbanisation Policy is guided bythe following goal:
To Create A Visionary City With A Peaceful Community AndLiving Environment Through Sustainable Urban Development.
Objective
Based on the above goal, six objectives have been identifiednamely:
i. To develop a planned, quality, progressive and sustainablecity;
ii. To develop and strengthen a competitive urban economy;iii. To create a conducive environment in order to encourage
social development;iv. To eradicate urban poverty;v. To strengthen the planning, implementation and
monitoring system;vi. To strengthen urban management and administrative
institutions.
National Urbanisation Policy Thrust
The National Urbanisation Policy is formulated on six thrustsas follows;
Thrust 1: An efficient and sustainableUrban Development
NUP 1 - The National Urbanisation Policy shall formthe basic framework for urban development inMalaysia.
NUP 2 - Urban development shall be based on the urbanhierarchy system of the NUP.
NUP 3 - Each urban development shall be based onthe Development Plan being prepared.
NUP 4 - Urban growth limit is determined based on itscarrying capacity for all towns in the country.
NUP 5 - Optimal and balanced landuse planning shallbe given emphasis in urban development.
The National Urbanisation Policy
guid
elines

T H E I N G E N I E U R
NUP 6 - Urban development shall give priority to urbanrenewal within the urban area.
NUP 7 - Village development in towns shall be integratedwith urban development.
NUP 8 - Environmentally sensitive areas and primeagricultural areas shall be conserved.
NUP 9 - Open space and recreational areas shall beadequately provided to meet the requirements of thepopulation.
Thrust 2: Development of an Urban Economy thatis resilient, dynamic and competitive
NUP 10 - The development of urban economic activitiesthat is value-added and knowledge based (k-economy)at all conurbations shall be promoted.
NUP 11 - Economic development of Major and MinorSettlement Centres shall be enhanced to support theirroles in regional development.
NUP 12 - Special feature towns shall be developed inaccordance to their respective potential and niches.
NUP 13 - Employment opportunities especially for thelow income group shall be improved and diversifiedirrespective of race.
NUP 14 - Development of urban areas shall take intoconsideration the Malaysian identity that is multi-racial.Bumiputera participation and those with low incomefrom the urban economic sector shall be improved. Atthe same time, the interest, opportunity and futurepotential of other races will not be neglected norobstructed.
Thrust 3: An integrated and efficient UrbanTransportation System
NUP 15 - An integrated, efficient and user-friendly publictransportation system shall be developed.
NUP 16 - A more comprehensive traffic managementshall be implemented to ensure a more efficient andeffective traffic flow.
NUP 17 - A more comprehensive road network shall bedeveloped to improve accessibility and mobility for interand intra urban.
For further details, please refer to publication of NationalUrbanisation Policy by JPBD
26
Thrust 4: Provision of urban services, infrastructureand utility of quality
NUP 18 - The provision of infrastructure and utilities shallbe improved while continuous management andmaintenance shall be ensured.
NUP 19 - A planned, effective and sustainable solid wasteand toxic management system shall be implemented.
NUP 20 - The quality of urban services shall be improvedto create a comfortable and liveable environment.
Thrust 5: Creation of a conducive liveable UrbanEnvironment with identity
NUP 21 - Sufficient housing shall be provided based onthe requirements of the population.
NUP 22 - Adequate, fully-equipped and user-friendlypublic amenities shall be provided with continuousmanagement and maintenance.
NUP 23 - Safe urban environment shall be provided.
NUP 24 - The formation of an urban image and identitycongruent with local function and culture that representsa multi-racial society.
NUP 25 - Areas and building of historical value and uniquearchitecture shall be restored and gazetted.
NUP 26 - A sustainable and environment-friendlydevelopment shall form the basis of environmentalconservation and improve the urban quality of life.
Thrust 6: Effective Urban Governance
NUP 27 - The institutional capacity shall be strengthenedto implement a more efficient and effective urbanadministration and management.
NUP 28 - Good corporate governance shall be practicedto promote a management culture that is transparent,has integrity and is accountable.
NUP 29 - The involvement of society shall be encouragedin urban planning and governance.
NUP 30 - The use of innovative technology in urbanplanning, development and urban services management.
guid
elines

T H E I N G E N I E U R 27
NOTIS
PEMBAHARUAN PENDAFTARAN JURUTERA PROFESIONAL 2007
LAMPIRAN A
1. * Kadar Bayaran Tempatan:
Tarikh Berumur bawah 60 tahun Berumur lebih 60 tahun
Kemukakan bayaran pada 1.1.2007 pada 1.1.2007
Sebelum 31.1.2007 RM200.00 RM100.00
Selepas 31.1.2007 RM500.00 + RM200.00 RM250.00 + RM100.00
(yuran 2007) + (yuran 2007) +
yuran tunggakan yuran tunggakan
(jika ada) (jika ada)
� Pembaharuan pendaftaran
Jurutera Profesional tahun
2007 boleh dikemukakan
dengan syarat bayaran dan
dokumen-dokumen yang
berikut disertakan:
(i) Borang H
* (ii) Bayaran kepada
“Lembaga Jurutera
Malaysia” mengikut
kadar yang berkenaan
melalui cek/bank draft/
postal order/money
order/
** online bill payment
(www.Maybank2U.com.my)
*** (iii) Laporan ringkas
“Continuous
Professional
Development (CPD)
2006”
**** (iv) Sekeping gambar
berukuran passport,
jika belum
dikemukakan.
� Pengesahan pembaharuan
pendaftaran 2007 akan
dicetak dalam Sijil
Pendaftaran. Tiada resit
bayaran akan dikeluarkan.
� Tuan/puan dinasihatkan
menyemak penjelasan di
Lampiran A kerana
kegagalan mematuhi syarat
akan menyebabkan
kelewatan memproses
pembaharuan pendaftaran.
� Tuan/puan diminta
mengambil perhatian
kepada seksyen 14, Akta
Pendaftaran Jurutera 1967
seperti berikut:
“Every registered Engineer
and Engineering consultancy
practice shall notify the
Registrar of any change in
his or its business address.”
Kegagalan mematuhinya,
tuan/puan boleh diambil
tindakan di bawah seksyen
25(1) Akta Pendaftaran
Jurutera 1967.
Category Ref Date CPD activity/ Allowable Time Actual Total
topic/provider/ weighted weighted hours weighted
(Please hours factor hours
summarise
the list
1. Formal Education and No limit 2
Training Activities
2a. Informal Learning Maximum 1
Activities: 20 hours
– on job learning per year
2b. Informal Learning Maximum
Activities: 10 hours
– private study per year 0.5
3. Conference No limit 1
and meeting
4. Presentation Maximum
and Papers 30 hours 10
5. Service Activities Maximum
30 hours 1
6. Industry Involvement
(for academician) Maximum
30 hours 1
TOTAL
* Kadar Bayaran dari Luar Negara (approximately RM200.00):
USD60 / AUD80 / GBP35 / CAD80 / EUR50 / SGD100
2. ** Online Bill Payment (www.maybank2U.com)
Bayaran secara “online” masih mengkehendaki tuan/puan mengemukakan Borang
H, Laporan CPD 2006 dan gambar passport jika gambar tuan/puan tidak ada di laman
web. Pengesahan bayaran 2007 akan dikeluarkan setelah dokumen-dokumen yang
berkaitan diterima.
3. *** Laporan ringkas CPD 2006
Seperti yang telah dimaklumkan melalui Pekeliling No. 1/2005, semua Jurutera
Professional dikehendaki mendapatkan 50 jam CPD setahun mulai 1.1.2005 untuk
pembaharuan pendaftaran. Oleh itu, Borang H hendaklah disertakan dengan “Laporan
Ringkas CPD 2006” mengikut format di LAMPIRAN B walau pun CPD belum
mencukupi 50 jam.
Keterangan mengenai CPD boleh diperolehi melalui laman web www.bem.org.my
(button “CPD & PDP”).
4. **** Gambar Berukuran Passport (jika belum mengemukakannya)
Sila semak rekod pendaftaran di laman web Lembaga Jurutera (button “Directory”/
“Professional Engineers”/“P.Eng”). Jika rekod tuan/puan tiada bergambar, sila
kemukakan:
(i) Gambar berukuran passport dihantar melalui pos bersama Borang H dan Laporan
ringkas CPD 2006; atau
(ii) E-mel gambar berukuran passport (file .jpg saiz 2KB) ke [email protected]
Nyatakan dengan jelas nama dan nombor pendaftaran di belakang gambar atau
di dalam e-mel.
LAMPIRAN B
LAPORAN RINGKAS CPD
✁

T H E I N G E N I E U R 28
A. PERMOHONAN UNTUK PEMBAHARUAN PENDAFTARAN SEBAGAI JURUTERA BERDAFTAR
(Hendaklah diisi oleh Pemohon dalam HURUF CERAI)
1. Permohonan untuk pembaharuan pendaftaran bagi tahun 2007 untuk:
* Jurutera Profesional
* Jurutera Sementara
* Pemeriksa Bertauliah
2. Nama: ……………………………………………………………………………………………………...…….…………
3. No. Kad Pengenalan/Passport: …………………………………………………………………………....…………
4. No. Pendaftaran: ………………………………………………………………………………………………………...
5. Alamat (jika ada perubahan):
Sila rujuk seksyen 14 dan 25(1), Akta Pendaftaran Jurutera 1967
………………………………………………………………………………………………………………………………
………………………………………………………………………………………………………………………………
………………………………………………………………………………………………………………………………
6. No. Tel: ……………….....……………………… No. Faks: ……………………………..........…………….………
7. E-mel: ………………………………………………………………………………………………………….…………
8. Bayar atas nama “Lembaga Jurutera Malaysia”. Butiran bayaran yang dikemukakan:
** Kiriman wang/draf bank/cek No. …………….….. berjumlah RM ……….........................
(sila sertakan komisyen bank sebanyak 50 sen bagi cek luar Lembah Kelang)
** Bayaran melalui Maybank2U berjumlah …………………...….. pada …………...............
……………………......……… ……………………..........…….
(Tandatangan) Tarikh
B. GAMBAR BERUKURAN PASSPORT
Rekod pendaftaran di laman web www.bem.org.my telah disemak dan saya sahkan:
* Rekod lengkap bergambar * Rekod tidak bergambar
Gambar dihantar dengan ** Borang H / e-mel
* CHECKLIST: Borang H Bayaran Laporan Ringkas CPD Gambar
* sila (�) yang mana berkenaan
** Potong yang mana tidak berkenaan
PERATURAN-PERATURAN PENDAFTARAN JURUTERA 1990
(Peraturan 20)
AKTA PENDAFTARAN JURUTERA 1967
BORANG H
“Cheque” checklist
Payabale to “Lembaga
Jurutera Malaysia”
Same amount & figure
Valid bank account and
signature
Valid “date/month/year”
Add bank commission for
outside of Klang Valley
No correction made on
the cheque
✁

T H E I N G E N I E U R 29
Ladies and Gentlemen,
Every human being wants to feel safe and be safe.To this end, he endevours to take all precautionarymeasures within his means, or seeks assistance fromexternal sources at a cost which he can afford. Manfeels endangered when he is not safe. Suchendangerment puts fear in him, a fear of injury ordeath, or even material losses. This fear of man hasbeen studied, and ways and means have been foundto keep him safe and comfortable.
Safety in the building industry should be a primeconcern of all parties; the planner, the architect, theengineers, the builder and the regulatory bodies.With proper design, proper selection of materials,strict compliance with the specifications and the useof appropriate supervisors and workers, there shouldbe no failure at all – all, that is, except an act ofGod.
Safety In Construction:Rules & Responsibility OfProfessional Engineers
With the recent publicity in the media of theaccidents at Sri Hartamas and Bukit Antarabangsa,safety concern in the construction industry is againbeing raised by the public. Despite what was done,much more need to be done to reduce suchaccidents.
I remember a similar seminar conducted in May1996 after the Highland Tower incident. I was toldthat among the resolutions adopted then to ensuresafety and stability of buildings, were among others:
(a) Design checks should be carried out on alltemporary works by a qualified ProfessionalEngineer, who should also be held responsiblefor “stressing” and “distressing” such works,
(b) Skilled workers such as tower crane operatorsand other relevant operators should be licensedand registered with the CIDB to ensure theircompetency in operation and safety,
(c) An independent or Accredited Checker systemshould be introduced to ensure safe structuraland geotechnical design,
(d) Proper supervision and control at theconstruction stage should be introduced in thefollowing measures:
� mandatory standing supervision by aProfessional Engineer for all constructionprojects above a prescribed project value
� Professional Engineers given theresponsibility to appoint independent sitesupervisors
This paper is an extract from a speech by YB Dato’ Seri S. Samy Vellu, Minister of Works,Malaysia, read by Dato’ Ir. Mohd Zin Mohamed during a seminar on “Safety In Construction:Rules & Responsibility of Professional Engineers” held on September 21, 2006 at theSheraton Hotel and Tower, Petaling Jaya.
sem
inar

But only an Accredited Checker system wasadopted and included in the 2002 amendment of theRegistration of Engineers Act.
However, I am glad that some of the otherresolutions are being implemented by BEM and CIDB.
In the 9th Malaysian Plan announced by the PrimeMinister Malaysia, YAB Datuk Seri Abdullah AhmadBadawi, RM200 billion had been allocated fordevelopment, out of which, RM27.5 billion isallocated for construction of roads, quarters and otherinfrastructure facilities in 2007. (Source: Speech bythe Prime Minister on the Ninth Malaysia Plan,2006-2010, Dewan Rakyat, March 31, 2006 & the2007 Budget Speech, Dewan Rakyat, September1,2006)
Recently YAB Prime Minister Malaysia announcedthe list of 880 new development project valued atRM15 billion would be tendered out soon.
With the motto “membina ketahanan,menghadapi cabaran” for the 9th Malaysian Plan, thebuilding industry must subscribe to the motto, tostrive with the Government, to ensure that thebuilding industry will minimize unnecessarystoppages and wastage due to negligence andavoidable accidents.
T H E I N G E N I E U R 30
sem
inar
My message to owners, developers, professionalsand the regulatory authorities is, “DO NOTcompromise on quality, standards and safety”. To theowners and builders, “DO NOT put pressure on thepersons entrusted to oversee the project tocompromise on quality”.
I would also call on professionals to complystrictly with existing acts especially the Factories AndMachinery Act 1967 and Occupational Safety AndHealth Act 1994.
On June 2004, the Government called for theCertificate of Fitness of Occupation to be replacedwith a Completion and Compliance Certificate issuedby the principal submitting person ie. the Architector the Engineer.
You should view this as an honour and live up tothe trust that is given to professionals to undertakesuch an important task.
However, it can be a double-edged sword if wefail to honour the task entrusted to us, as the liabilityattached to the honour is immense. The objective toimprove efficiency in the delivery system should neverbe compromised by a lack of safety and quality. Thepublic trust and confidence lie heavily in your hands.
With these measures in place and, greaterawareness and attention to safety in construction,together with proposed amendments of the variouslegislations, I believe the efficiency of the buildingdelivery system will be improved.
On that note, I would like to wish each and everyone of you a fulfilling professional life ahead of you.Thank you.

T H E I N G E N I E U R
By Ir. Harbans Singh K.S. 1
Claims For Quantum Meruit AndSection 71 Contracts Act 1950:Is There A Nexus?
One of the most common categories of construction/engineering related claims is the one labeled as‘extra-contractual’ claims 2. This class of claims
is basically premised outside the contract and generallyfalls within the purview of the common law. Principalexamples of such claims are claims in negligence,misrepresentation, defamation, other heads of tort,implied contracts, collateral contracts and quantummeruit. A claimant, in the usual course of a typicalclaim process would first attempt to pursue acontractual claim followed by, or, in the alternativewith an ‘extra-contractual’ claim. In all likelihood,the latter would encompass a quantum meruit claim.Whilst undertaking the latter, it is quite common forlocal practitioners to follow the English approach infurthering an assertion of rights along equitableprinciples encompassing such a claim. However, inMalaysia, it should be noted that our governinglegislation has made adequate provision in the formof Section 71 3 of the Contracts Act 1950 (Act 136)which covers many situations envisaged by thequantum meruit doctrine. In view of the above and inthe light of the High Court’s recent decision in Multi-Purpose Credit Sdn. Bhd v Tan Sri Dato’ Paduka (Dr)Ting Pek Khing 4, this short article has been formulatedto review both the core issues of quantum meruit andthe applicability of Section 71 of the Contracts Act inlike situations locally.
CLAIMS FOR QUANTUM MERUIT
Meaning
Despite the aura of mystery shrouding the term andits indiscriminate incantation by claimants in almostall claim situations, the term ‘quantum meruit’ has awell defined meaning ascribed by leading authoritiesin the engineering/construction industry; notableexamples of which are reproduced hereunder.
In ‘An Engineering Contract Dictionary’5 the term‘quantum meruit’ is defined as:
‘As much as he has deserved - a reasonable sum. ThisLatin phrase is often used as synonym for “quantumvalebat” which means “as much as it is worth”. It is ameasure of payment where the contract has not fixeda price or where, for some reason or another, thecontract price is no longer applicable.’
Murdoch & Hughes in the authoritative text entitled‘Construction Contracts Law and Management’ explaina ‘quantum meruit’ claim as 6:
‘…… one in which the contractor seeks payment of thereasonable value of work done for the employer. Sucha claim may arise in a variety of situations, not all ofwhich involve a breach of contract by the employer.The common thread which links these situations is,that there is either no contractual entitlement to thepayment or no contractual assessment of the amountdue.’
Brian Eggleston describes such claims as 7:
‘…. meaning ‘what is worth’ are sometimes calledquasi-contractual claims. They are highly popular withcontractors wishing to escape from the rigidity of alump sum or from contract rates towards payment ona cost-plus basis. Strictly speaking the phrase‘quantum meruit’ applies to the law of restitution forthe value of services rendered where there is nocontractual entitlement to payment. But it is alsocommonly used to describe claims made under acontract for a fair valuation or a reasonable sum’.
1. B.E. (Mech) S’pore, LLB (Hons) London, CLP, DipICArb, P.E.,C. Eng., Director HSH Consult Sdn. Bhd.
2. The others being ‘Contractual’ claims and ‘Ex-Gratia’ claims.3. Entitled ‘Obligation of Person Enjoying Benefit of Non-Gratuitous
Act’.4. [2006] 5 MLJ 589.5. by Powell-Smith, Chappell & Simmonds at P 510.6. [2nd Edn.] at P 3327. See ‘The ICE Design and Construct Contract: A Commentary’ at
P 313.
31
engin
eeri
ng &
law

T H E I N G E N I E U R
The following pertinent observations can be distilled fromthe abovementioned definitions:
� ‘Quantum Meruit’ claims are synonymous with ‘quasi-contractual’ claims and ‘quantum valebat’ claimsalthough the former label remains the popular modeof description;
� It is a class of claim that straddles the boundaries ofcontract and restitution. Therefore it is immaterialwhether the claim is framed as a ‘quantum meruit’claim or a claim for a reasonable sum as it does notassist in classifying the claim as contractual or quasi-contractual: British Steel Corporation v ClevelandBridge & Engineering Co. Ltd. 8; and
� The principle behind such remedies lies in theapplication of the so-called ‘Doctrine of UnjustEnrichment or Unjust Benefit’ which aims ‘to preventa man from retaining the money of, or some benefitderived from another which is against the consciencethat he should keep’: Fibrosa Spolka Akeyjna vFairbairn Lawson Combe Barbour Ltd. 9.
Situations Where Applicable
Since ‘quantum meruit’ claims are essentiallyrestitutionary in nature, the likely situations where theyare applicable are not precise owing to the complexity ofthe very substratum i.e. the law of restitution. Hence, muchdepends on the particular facts of the case underconsideration and the subsequent findings of the courts.As a general guide, a possible list of applicable situationshave been proposed by some leading authorities 10; acomprehensive rendition of which is summarizedhereunder:
� Where there is no price fixed in the contract i.e. workhas been done under a contract but:
(i) Without any express agreement as to price; or
(ii) A price fixing clause in the contract is invalid/ineffective;
� Where the contract is void i.e. work has been doneunder a contract which both parties believe to be validat the material time but which was actually void e.g.due to mistake, etc.;
� Where no contract is ever concluded i.e. work has beendone at the request of a party without the existence ofany express contract or as to agreement of the essentialterms i.e. price e.g. work done under a letter of intent:Marston Construction Ltd. v Kigrass Ltd. 11;
� Where the contract provides for payment of areasonable sum or fair valuation e.g. work has beendone pursuant to an express undertaking by theemployer to pay a ‘reasonable price’ or a ‘reasonablesum’;
� Where extra work is ordered which falls outside thescope of the contract i.e. work has been undertakenbut it falls outside the purview of an express variationclause: Sir Lindsay Parkinson & Co. v Commissionerof Works 12;
� Where the contract is for a lump sum and the employerprevents completion i.e. work has been, or is beingundertaken but the employer’s and/or his agent’s actsand/or omissions prevents the contractor fromcompleting his obligations under the contract;
� Where the contract is unenforceable i.e. work has beendone under the contract, which the parties believed tobe legally enforceable but is in reality invalid andunenforceable; and
� Where the contract is discharged by frustration i.e.work has been done under the contract but asupervening event has frustrated the contract and madefurther performance impossible: Wong Lau Ying vChinachem Investment Co. Ltd. 13.
It should be noted that a ‘quantum meruit’ claim isnot tenable where there is an adequate contractual remedyavailable under the contract e.g. suitable expresscontractual provisions for compensation: Morrison-Knudson Co. Inc. v British Columbia Hydro & PowerAuthority 14 and McAlpine Humbroack Ltd. v McDermottInternational Inc. 15. However, the absence of any definedformulae for the assessment of such claims is not a bar torecovery as evidenced in the English Cases of LaserboreLtd. v Morrison Biggs Wall Ltd. 16 and MarstonConstruction Co. Ltd. v Kirgrass Ltd. 17.
PROVISIONS OF THE CONTRACTS ACT 1950 18
Main Provision
The main provision of the Malaysian Contracts Act1950 governing such claims is Section 71 whichstipulates:
“Obligation of person enjoying benefit of non-gratuitousact
32
8. [1981] 24 BLR 949. [1942] 2 All ER 122.10. See ‘The ICE Design and Construct Contract: A Commentary’ at P
314, ‘An Engineering Contract Dictionary; by Powell-Smith,Chappell & Simmonds at P 510.
11. [1989] CILL 4812. [1949] 2 KB 63213. [1979] 13 BLR 8114. [1985] 85 DLR15. [1992] 58 BLR 6116. [1993] CILL 89617. [1989] CILL 4818. Act 136
engin
eeri
ng &
law

T H E I N G E N I E U R
Where a person lawfully does anything for anotherperson, or delivers anything to him, not intending to do sogratuitously, and such other person enjoys the benefitthereof, the latter is bound to make compensation to theformer in respect of, or to restore, the thing so done ordelivered.
ILLUSTRATIONS
(a) A, a tradesman, leaves goods at B’s house by mistake.B treats the goods as his own. He is bound to pay Afor them.
(b) A saves B’s property from fire. A is not entitled tocompensation from B, if the circumstances show thathe intended to act gratuitously.”
Scope of Section 71
Section 71 has been subjected to judicial scrutiny in astring of local cases; the most notable of which is thelocus classicus case of Siow Wong Fatt v Susur RotanMining Ltd. & Anor 19 where the Privy Council stated thefollowing principles of law governing the operation ofthe said provision:
“It has been common ground before their Lordshipsthat four conditions must be satisfied to establish a claimunder Section 71. The doing of the act or the delivery ofthe thing referred to in the Section: (i) must be lawful; (ii)must be done for another person; (iii) must not be intendedto be done gratuitously; (iv) must be such that the otherperson enjoys the benefit of the act or delivery. In theirLordship’s judgment these matters must be assured at thetime the act is done or the things delivered and this, theirLordships think is of fundamental importance” 20
The above-mentioned principles of law have beenconsistently applied by the Malaysian Courts over theyears; the most recent case being of Multi-Purpose CreditSdn. Bhd v Tan Sri Dato’ Paduka (Dr) Ting Pek Khing 21
where his Lordship, Abdul Malik Ishak J, following GunnChit Tuan J (as he then was) in New Kok Ann Realty Sdn.Bhd. v Development & Commercial Bank Ltd., NewHebrides (in liquidation) 22 said 23:
“In the context of the present appeal before me, thefour conditions as alluded to by Gunn Chit Tuan J (as hethen was) in that case must be satisfied in order to establisha claim under S71 of the Contracts Act 1950 (Act 136). Inmy judgment, the four conditions have been satisfied andfor convenience I will now consider them:
(1) Must be lawful
The act of the plaintiff lending the defendant themonies as mentioned earlier and the settlementagreement that was entered between the parties wereentirely lawful because the plaintiff is a licensedmoneylender under the Moneylenders Act 1951.
(2) Must be done for another person
The memorandum of agreement for the loan clearlyshowed that the sum of money was lent to thedefendant and the settlement agreement was for thebenefit of the defendant.
(3) Must not be intended to be done gratuitously
From the memorandum of agreement for the loan andthe memorandum of deposit of shares together withthe settlement agreement, it can readily be surmisedthat the plaintiff’s intention of entering into thoseagreements was entirely for commercial gains. Beinga licensed moneylender, the plaintiff was legallyauthorized, in the course of running its business, togrant the loan to the defendant. Such acts were notdone gratuitously.
(4) Must be such that the other person enjoys the benefitof the act or the delivery
The defendant has certainly benefited by the plaintiff’swithdrawal of its Suit No. D3-22-2499-1998 whichwas initiated pursuant to the memorandum ofagreement for a loan.
Now, S71 of the Contracts Act (Act 136) requires proofthat the promisee did not effect the performance or deliverywith gratuitous intent ……. At common law too there is arequirement that there must be an understanding that thepromisee would be remunerated for his efforts and it isthis kind of scenario that takes the fact situation out ofthe rubric of past consideration. Lord Scarman’srequirement in Pao On v Lau Yiu Long [1980] AC 614 atp629; [1979] 3 All ER 65 at p74 that the promise mustbe ‘legally enforceable’ is also reflected by the usage of theword ‘lawfully’ in Section 71 of the Contracts Act 1950(Act 136) …… The literal language employed in the twoillustrations to S71 of the Contracts Act 1950 (Act 136)as reproduced earlier seemed to suggest that there be norequest by the promisor for the benefit conferred uponhim by the promisee ….. Section 71 of the Contracts Act1950 (Act 136) is said to be wider in scope than thecommon law exception. It has been described in MohamedYusoof v Murugappa Chettiar (1941) FMSLR 106 at p113to go ‘far beyond English law’. It is clear that S71 of theContracts Act 1950 (Act 136) does not deal with a situationof past consideration simpliciter. Rather the provision ispremised on that all interesting concept of restitution …….The law relating to restitution has developed rapidly.Basically, it seeks to prevent unjust enrichment (LipkinGorman v Karpnale Ltd. [1991] 2 AC 548; [1991] 3 WLR10; and Woolwich Equitable Building Society v Inland
19. [1967] 2 MLJ 118; (1967) 2 PCC 413, PC.20. [1967] 2 MLJ 118 at p120.21. [2006] 5 MLJ 589, HC.22. [1987] 2 MLJ 57.23. [2006] 5 MLJ 589 at 599.
33
engin
eeri
ng &
law

T H E I N G E N I E U R
Revenue Commissioners [1993] AC 10; [1992] 3 WLR366). The law of restitution is concerned with thesesituations where the defendant has been unjustly enrichedat the expense of the plaintiff …….”.
From the foregoing write-up, the following salientpoints can be crystallized 24:
� In a case falling under the ambit of Section 71 of theContracts Act, the aggrieved party can neither pursuea contractual remedy nor one for specific performance,as there is no contract on which he can rely. Hence,his option lies only in ‘quasi-contract’ or restitution;
� The scope of Section 71 therefore not only covers thesituations envisaged in the earlier discussion onquantum meruit but is apparently even wider. Providedthe four conditions stipulated in Section 71 are met,the provisions of this Section can be invoked even inthe event of a void contract 25;
� For goods delivered or services rendered, the measureof compensation under Section 71 would normally bethe corresponding market price. Accordingly, it hasbeen held that the invoice price in respect of the goodsdelivered should be taken to be the prevailing marketvalue of the goods in dispute 26;
� Case law especially in India (whose provision of S70of the Indian Contracts Act 1872 is in pari materiawith S71 of the Malaysian Contracts Act 1950) hasshown that even when a person does an act for hisown benefit and that act incidentally benefits a thirdperson, S71 will also apply 27;
� In the construction/engineering context, where workdone by the contractor is pursuant to an invalidVariation Order (e.g. based on an oral instead of awritten instruction) issued by the contract administratorand the said work is within the framework of thecontract, such work is to be treated as additional workand since the employer receives its benefit, then thelatter is liable to pay the contractor for the same underSection 71 28; and
From a literal reading of the section, it is clearlyapparent that Section 71 is applicable in situations whereeither no formal contract has been entered into by theparties and one party has benefited at the expense of theother, or even if there is no contract at all for theperformance of certain work, if the aggrieved party haddone some work without intending to do that workgratuitously and the other party has benefited in a materialmanner, then adequate compensation has to be meted outto prevent unjust enrichment.
SUMMARY
A detailed discourse on the subject of quantum meruitand the scope and applicability of Section 71 of the
34
Contracts Act 1950 (Act 136) is beyond the remit of thisshort article. For this, the reader is encouraged to pursuethe relevant legal treatise or authoritative texts. Sufficeto say at this juncture is the fact that one shouldappreciate the essence, ambit, applicability and the nexusbetween these important specie of remedies circumscribedby the principles of restitution and quasi-contract. Inthe process, one should be mindful of the contemporaryMalaysian position whereat there exist statutorymechanisms e.g. Section 71 of the Contracts Act 1950which afford an aggrieved party with an appropriateremedy against unjust enrichment rather than pursuingthe ‘quantum meruit’ route under the common law; whichroute is purely equitable and discretionary. We arefortunate to have the former, as proceeding under thepurview of the Contracts Act has added advantagescompared to a purely common law claim. It is high timewe appreciate Section 71 and give due recognition to itsapplicability in practice. Be that as it may, a positiveway of breathing life into Section 71 is to give dueprominence to it and ensure that it is correctly and fullyutilized in furthering claims where its application isappropriate under the particular circumstances. Thissurely will propel it from its current state of relativeobscurity to the forefront of restitutionary and quasi-contractual claims in the construction/engineeringindustry.
REFERENCES
� Andrew Phang Boon Leong Chesire, Fifoot & FurmstonsLaw of Contract (First Singapore & Malaysian StudentsEdn.), Butterworths.
� Eggleston, B. The ICE Design & Construct Contract: ACommentary, Blackwell.
� Gajria, K. Law Relating to Building & EngineeringContracts in India (4th Edn.), Butterworths.
� Ir. Harbans Singh K.S. Engineering and ConstructionContracts Management: Post-Commencement Practice,Lexis-Nexis.
� Murdoch & Hughes Construction Contracts Law andManagement (3rd Edn.), E & FN Spon.
� Powell-Smith, Chappell & Simmonds An EngineeringContract Dictionary, Legal Studies & Services(Publishing) Ltd.
� Sinnadurai, V. Law of Contract (3rd Edn.), Lexis-Nexis/Butterworths.
24. See also Gajria, K. ‘Law Relating to Building & EngineeringContracts in India’ 4th Edn., p 64 to 66.
25. Mulam Chand v State of Madhya Pradesh AIR 1968 SC 1218.26. See Pilloo Dhunji Shah Sidhwa v Municipal Corporation of the
City of Poona AIR 1970 SC 1201.27. See Srirama Raju v Secretary of State (1943) 204 IC 561 (FB).28. Provided all other conditions of S71 are met. See State of UP v
Chandra Gupta & Co. AIR 1977 All 28.
BEM
engin
eeri
ng &
law

T H E I N G E N I E U R 35
The world is moving towards acomplex situation for survival.Increasing environmental
pollution, over population growth,increasing rate of consumption anduse of natural resource material areall creating an unsustainable situationfor the human being. Over use of non-renewable energy and resourceexploitation to run the Industrialeconomy and to reach the high levelsof production and consumption, hasgenerated global environmentalproblems. For example, transport isresponsible for up to 70% of all CO2emissions. Huge investment made inend-of-pipe equipment and cleanerand smarter technologies to minimiseenvironmental pollution and increaseresource productivity did not reallylead to drastic minimisation of overallenvironmental impacts, because itincreases rate of consumption, whichis driven by economies of scale(Gershenfeld, 2004).
According to an estimation, theWorld population will be almostdouble by 2025, which will againdemand an increase in resourceconsumption. If it is assumed tofollow the exponential growth of 5-6% for Developing countries and 3-4% for Developed countries accordingto Brundtland Report, then the Earthwill not be able to sustain such a hugegrowth. In its original context, thedefinition was stated solely from thehuman point of view. In order to
embrace the idea of a global ecologywith intrinsic value the meaning mustbe expanded to allow all parts ofnature to meet their own needs nowand in the future. Designing forsustainability requires therefore,awareness of the full short and longterm consequences of anytransformation of the environment.
The environment and economydepends depend on our ethics – oursense of right and wrong – thatincorporating ethics into decisionsmight begin to alter the pastobjectives of growth, accumulation,and excess towards new objectives ofsustainability, sharing and restraint.A more accurate phrase for theTwenty-First Century might be
economy, environment, energy andequity (Figure 1(a) and (b).
SUSTAINABILITY DESIGNAPPROACH
The designer has a role of strategicthinking in dealing with corporatestrategies and policies towardssustainable solutions. Strategicthinking and action in the form ofcreativity and capacity to respond tounforeseen-events must therefore becultivated at all levels of theorganisation. This creativity must becontextual and ecological – socialcreativity. Design is a journey ofcreation (McDonough, 1992). It is ajourney towards a desired future state,
Environment, Ethics AndThe EngineersBy Ir. Prof. Ruslan Hassan
Some complex regional or global systems are showing signs of failing,vizually traffic congestion, collapse of stocks of worldwide fishresources and global warming with attendant climatic changesresulting in floods. To address these issues, Sustainable Development,an often over-used word will be discussed within the context ofEnvironmental Ethics and the role of the ‘new engineers’. TheSustainable design approach, illustrated in the case of principles ofSustainable Building Design which addresses Economy of Resources,Life Cycle and Humane Design will be discussed. Finally, considerationon ethical issues and the engineers is presented.
Society Economy
Environment
Sustainable Development
Sustainable science focuses on thedynamic interactions between natureand society, with equal attention to howsocial change shapes the environmentand how environmental change shapessociety (Figure 1a).
Fig.1(a): Sustainable Science
featu
re

T H E I N G E N I E U R 36
which we define for ourselves andwant to realise. The metaphor of thejourney allows us to see design as amethod by which we can move fromthe present to a future situation thatis preferred to the present. This is are-thinking of strategy as arelationship to the future, and as aprocess – a journey. Strategy as designis also viewed as a journey of creation– and as a creative process.
Comparing realism versusidealism, design attempts to transcendthe two opposing positions. Realistsfocus on describing what is, anddeveloping theories, approaches, andstrategies on the basis of thedescription; idealists focus on whatought to be and plan on the basis oftheir ideals. The dichotomy ensuresthat realists are unlikely to go beyondexisting conceptual frameworks andexplore what could be, let alone whatshould be, whereas idealists often failto ground their strategies in a‘realistic’ assessment in a givensituation. The fundamentalassumption is that the environmentis by no means fully knowable, and aplurality of descriptions can give usa “rich picture” that can allow for adeeper understanding of the situation.
Design proceeds from outside-inrather than inside-out: this is a crucialdifference, which distinguishes designfrom planning. Inside-out inquiriesstart from within the planner’s alreadyexisting conceptual and empiricalboundaries. It is information-driven,because the inquiry is based onalready existing information ratherthan value-driven. This means it
occurs based on information derivedfrom the perspective of alreadyexisting conceptual frameworks inwhich values are implicit (“inside”),and there is no attempt to engage ina questioning of those fundamentalvalues themselves. Value-driven,outside-in design starts with anarticulation of our present situationin which our values concerning ourassessment of the situation are madeexplicit, and the values inspire us todesign a future system that conformsto those values. The stress is onarticulating values, and fosteringcreativity.
Design is a creative, decision-oriented disciplined inquiry that aimsto formulate expectations andrequirements of the system to bedesigned, clarify ideas and images ofalternative representations of thefuture system, devise criteria by whichto evaluate those alternatives, selectand describe or “model” the mostpromising alternatives, and preparea plan for the development andimplementation of the selected model.
Design is a systemic process: it isnot a linear, step-by-step processwhich separates components in achain of cause and effect, and focuseson the smallest unit of analysis byremoving it from its context. It israther a process of inquiry thatstresses the importance of the contextone works in, the context in whichthe present system operates, and inwhich the future system will emerge.
Design is also a creative process:emphasis is placed on developing analternative, or a series of alternative
solutions, to an existing problem.Design assumes that there are manydifferent ways of creating a model,and many different models, which canemerge from design. In design, aninductive model is created, which is“a representation of a system that doesnot yet exist but is intended to bebuilt”. Design is creative in the sensethat it does not develop a model bymerely shuffling around componentsof an already existing system withinthe parameters defined by thatsystem, but attempts to change orreconceptualize the nature of thesystem itself.
The creative dimension of designis “the dynamics of divergence-convergence,” in which “the designercontinually goes through alternatingsequences of generating variety(divergence) and reducing variety(convergence), while seeking thesingle most feasible and workablealternative”.
ILLUSTRATIVE PRINCIPLES OFSUSTAINABLE BUILDING DESIGN
Sustainability is an importantdesign principle. It is not an end-stateor system target; neither does itnecessarily have an explicit/analytic/measureable property. Therefore itmust be approached as a design goal.A problem is that indicators of poordesign are not immediatelyobservable. The challenge therefore isto use a systems approach to constructguidelines that facilitate sustainabledesign. In practice, we are often faced
Figure 1(b): Sustainable Development Approach
Economy Structured to meet objectives andvalues set by society
Decides objectives fordevelopment and sets ethical and value framework
Sets limits, the real bottom line
Society
Environment
featu
re
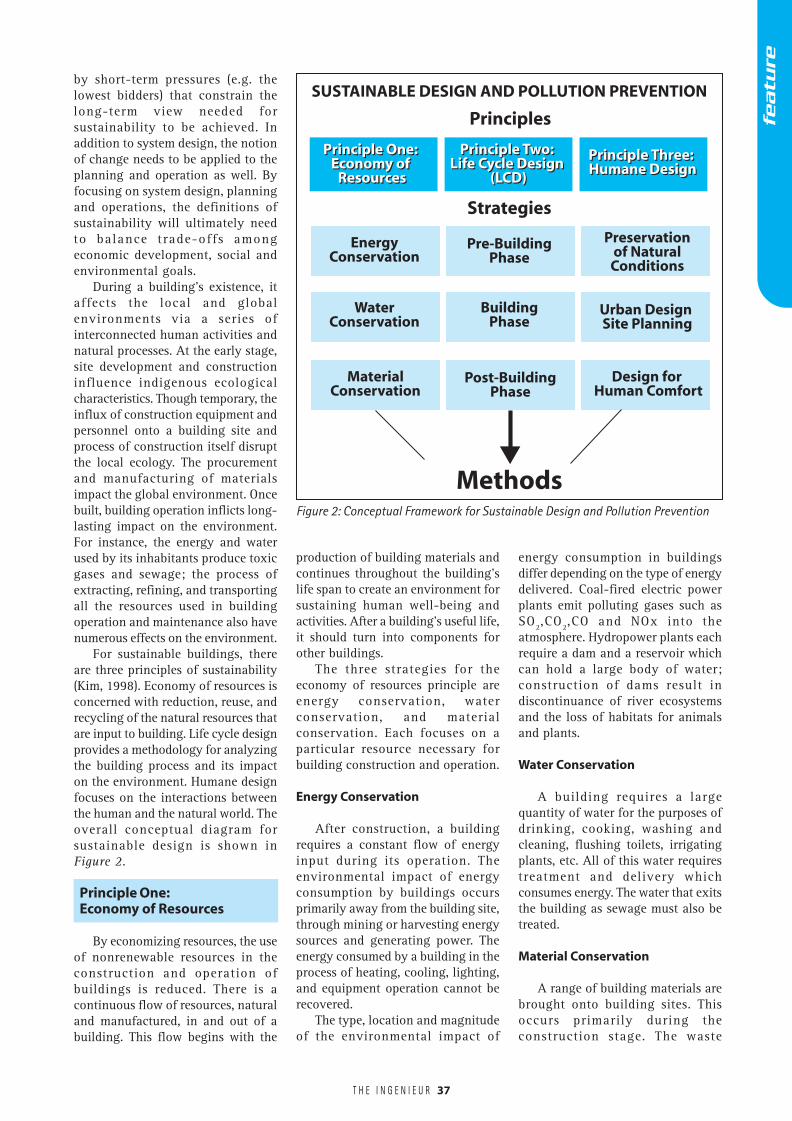
T H E I N G E N I E U R 37
by short-term pressures (e.g. thelowest bidders) that constrain thelong-term view needed forsustainability to be achieved. Inaddition to system design, the notionof change needs to be applied to theplanning and operation as well. Byfocusing on system design, planningand operations, the definitions ofsustainability will ultimately needto balance trade-offs amongeconomic development, social andenvironmental goals.
During a building’s existence, itaffects the local and globalenvironments via a series ofinterconnected human activities andnatural processes. At the early stage,site development and constructioninfluence indigenous ecologicalcharacteristics. Though temporary, theinflux of construction equipment andpersonnel onto a building site andprocess of construction itself disruptthe local ecology. The procurementand manufacturing of materialsimpact the global environment. Oncebuilt, building operation inflicts long-lasting impact on the environment.For instance, the energy and waterused by its inhabitants produce toxicgases and sewage; the process ofextracting, refining, and transportingall the resources used in buildingoperation and maintenance also havenumerous effects on the environment.
For sustainable buildings, thereare three principles of sustainability(Kim, 1998). Economy of resources isconcerned with reduction, reuse, andrecycling of the natural resources thatare input to building. Life cycle designprovides a methodology for analyzingthe building process and its impacton the environment. Humane designfocuses on the interactions betweenthe human and the natural world. Theoverall conceptual diagram forsustainable design is shown inFigure 2.
Principle One:Economy of Resources
By economizing resources, the useof nonrenewable resources in theconstruction and operation ofbuildings is reduced. There is acontinuous flow of resources, naturaland manufactured, in and out of abuilding. This flow begins with the
production of building materials andcontinues throughout the building’slife span to create an environment forsustaining human well-being andactivities. After a building’s useful life,it should turn into components forother buildings.
The three strategies for theeconomy of resources principle areenergy conservation, waterconservation, and materialconservation. Each focuses on aparticular resource necessary forbuilding construction and operation.
Energy Conservation
After construction, a buildingrequires a constant flow of energyinput during its operation. Theenvironmental impact of energyconsumption by buildings occursprimarily away from the building site,through mining or harvesting energysources and generating power. Theenergy consumed by a building in theprocess of heating, cooling, lighting,and equipment operation cannot berecovered.
The type, location and magnitudeof the environmental impact of
energy consumption in buildingsdiffer depending on the type of energydelivered. Coal-fired electric powerplants emit polluting gases such asSO2,CO2,CO and NOx into theatmosphere. Hydropower plants eachrequire a dam and a reservoir whichcan hold a large body of water;construction of dams result indiscontinuance of river ecosystemsand the loss of habitats for animalsand plants.
Water Conservation
A building requires a largequantity of water for the purposes ofdrinking, cooking, washing andcleaning, flushing toilets, irrigatingplants, etc. All of this water requirestreatment and delivery whichconsumes energy. The water that exitsthe building as sewage must also betreated.
Material Conservation
A range of building materials arebrought onto building sites. Thisoccurs primarily during theconstruction stage. The waste
Figure 2: Conceptual Framework for Sustainable Design and Pollution Prevention
featu
re
SUSTAINABLE DESIGN AND POLLUTION PREVENTION
Principles
Strategies
Preservationof NaturalConditions
Urban Design Site Planning
Design for Human Comfort
Pre-BuildingPhase
BuildingPhase
Post-BuildingPhase
EnergyConservation
WaterConservation
MaterialConservation
Methods
Principle One: Economy of
Resources
Principle Two: Life Cycle Design
(LCD)
Principle Three: Humane Design
Principle One: Economy of
Resources
Principle Two: Life Cycle Design
(LCD)
Principle Three: Humane Design
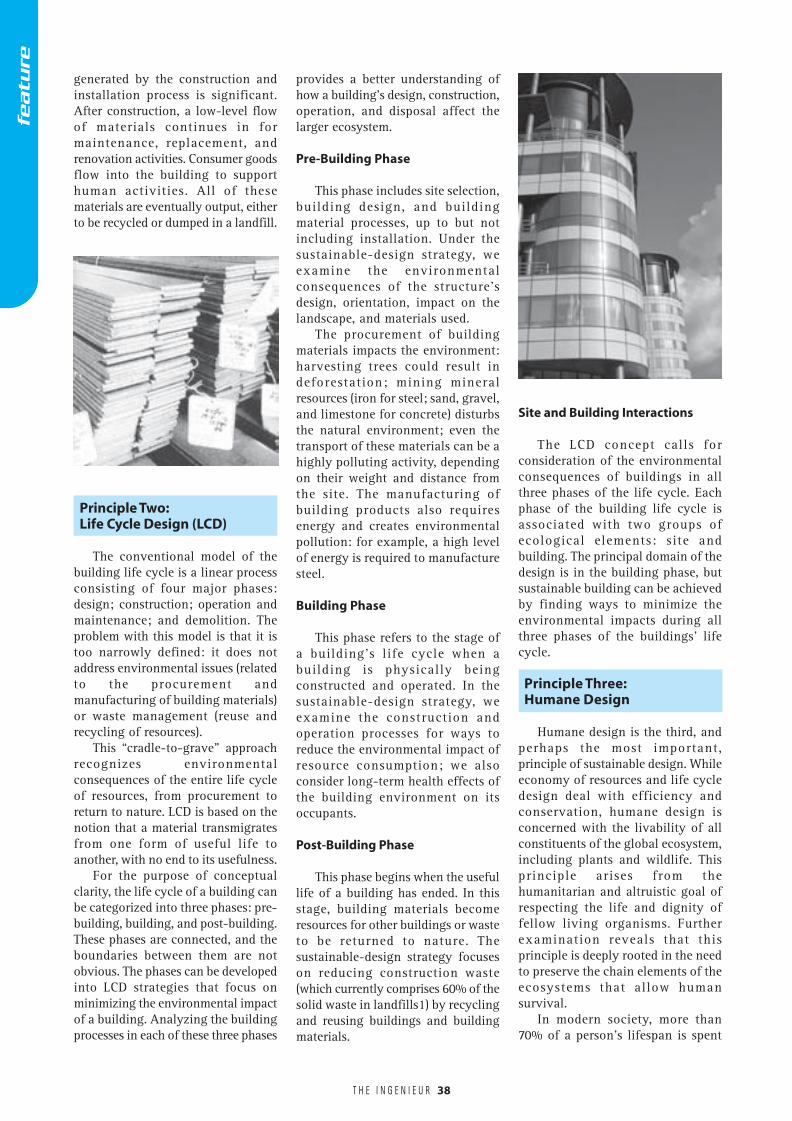
T H E I N G E N I E U R
generated by the construction andinstallation process is significant.After construction, a low-level flowof materials continues in formaintenance, replacement, andrenovation activities. Consumer goodsflow into the building to supporthuman activities. All of thesematerials are eventually output, eitherto be recycled or dumped in a landfill.
provides a better understanding ofhow a building’s design, construction,operation, and disposal affect thelarger ecosystem.
Pre-Building Phase
This phase includes site selection,building design, and buildingmaterial processes, up to but notincluding installation. Under thesustainable-design strategy, weexamine the environmentalconsequences of the structure’sdesign, orientation, impact on thelandscape, and materials used.
The procurement of buildingmaterials impacts the environment:harvesting trees could result indeforestation; mining mineralresources (iron for steel; sand, gravel,and limestone for concrete) disturbsthe natural environment; even thetransport of these materials can be ahighly polluting activity, dependingon their weight and distance fromthe site. The manufacturing ofbuilding products also requiresenergy and creates environmentalpollution: for example, a high levelof energy is required to manufacturesteel.
Building Phase
This phase refers to the stage ofa building’s life cycle when abuilding is physically beingconstructed and operated. In thesustainable-design strategy, weexamine the construction andoperation processes for ways toreduce the environmental impact ofresource consumption; we alsoconsider long-term health effects ofthe building environment on itsoccupants.
Post-Building Phase
This phase begins when the usefullife of a building has ended. In thisstage, building materials becomeresources for other buildings or wasteto be returned to nature. Thesustainable-design strategy focuseson reducing construction waste(which currently comprises 60% of thesolid waste in landfills1) by recyclingand reusing buildings and buildingmaterials.
Site and Building Interactions
The LCD concept calls forconsideration of the environmentalconsequences of buildings in allthree phases of the life cycle. Eachphase of the building life cycle isassociated with two groups ofecological elements: site andbuilding. The principal domain of thedesign is in the building phase, butsustainable building can be achievedby finding ways to minimize theenvironmental impacts during allthree phases of the buildings’ lifecycle.
Principle Three:Humane Design
Humane design is the third, andperhaps the most important,principle of sustainable design. Whileeconomy of resources and life cycledesign deal with efficiency andconservation, humane design isconcerned with the livability of allconstituents of the global ecosystem,including plants and wildlife. Thisprinciple arises from thehumanitarian and altruistic goal ofrespecting the life and dignity offellow living organisms. Furtherexamination reveals that thisprinciple is deeply rooted in the needto preserve the chain elements of theecosystems that allow humansurvival.
In modern society, more than70% of a person’s lifespan is spent
Principle Two:Life Cycle Design (LCD)
The conventional model of thebuilding life cycle is a linear processconsisting of four major phases:design; construction; operation andmaintenance; and demolition. Theproblem with this model is that it istoo narrowly defined: it does notaddress environmental issues (relatedto the procurement andmanufacturing of building materials)or waste management (reuse andrecycling of resources).
This “cradle-to-grave” approachrecognizes environmentalconsequences of the entire life cycleof resources, from procurement toreturn to nature. LCD is based on thenotion that a material transmigratesfrom one form of useful life toanother, with no end to its usefulness.
For the purpose of conceptualclarity, the life cycle of a building canbe categorized into three phases: pre-building, building, and post-building.These phases are connected, and theboundaries between them are notobvious. The phases can be developedinto LCD strategies that focus onminimizing the environmental impactof a building. Analyzing the buildingprocesses in each of these three phases
38
featu
re

T H E I N G E N I E U R
indoors. An essential role ofarchitecture is to provide builtenvironments that sustainoccupants’ safety, health,physiological comfort ,psychological well-being, andproductivity.
Because environmental quality isintangible, its importance has oftenbeen overlooked in the quest forenergy and environmentalconservation, which sometimesseemed to mean “shivering in thedark.” Compounding the problem,many building designers have beenpreoccupied with style and form-making, not seriously consideringenvironmental quality in andaround their built environments .
Remember the performancefactor of design. When a productsaves energy, does it perform as wellas what it is replacing? And howdoes it affect the performance of thebuildings’ occupants? For instance,early fluorescent lighting systemswere more efficient than theirincandescent counterparts;however, some fluorescents wereknown to buzz. The bulb might saveRM90 in annual energy costs, butif the noise irritated the employeeworking nearby, the employee’sresulting drop in productivity couldcost the employer a lot more,thereby wiping out any financialbenefits gained from lighting energyconservation.
A general rule of thumb in suchcomparisons is that the annualenergy bill of a typical officebuilding amounts to aroundfive hours of employee laborcost; therefore, any buildingenergy conservation strategythat annually reducesproductivity by more than fivehours per employee defeats itspurpose. This is not to say thatenergy conservation cannot befinancially beneficial, just thatit should be kept in holisticperspective, taking otherpertinent factors into account.
The following threestrategies for humane designfocus on enhancing thecoexistence between buildingsand the greater environment,and between buildings and theiroccupants:
1. Preservation ofNatural ConditionsAn architect/engineer should
minimize the impact of a building onits local ecosystem (e.g., existingtopography, plants, wild-life).
2. Urban Design and Site PlanningNeighborhoods, cities, and entire
geographic regions can benefit fromcooperative planning to reduceenergy and water demands. The resultcan be a more pleasant urbanenvironment, free of pollution andwelcoming to nature.
3. Human ComfortAs discussed previously,
sustainable design need not precludehuman comfort. Design shouldenhance the work and homeenvironments. This can improve
productivity, reduce stress, andpositively affect health and well-being.
ENGINEERING ETHICS
Sustainable development isdefined in the Brundland CommissionReport (WC, 1987) as meeting theneeds of the present withoutcompromising the ability of futuregenerations to meet their own needs.This definition of sustainability doesnot specify the ethical roles of humansfor their everlasting existence on theplanet. It also fails to embrace thevalue of all other constituentsparticipating in the global ecosystem.The need for finding long-termsolutions that warrant continuinghuman existence and well-being is farmore compelling than that of finding
a proper terminology to describethe human need. In this respect,the debate on the terms “green,”“sustainable,” or “ecological”architecture is not terriblyimportant.
The central ethical principlebehind sustainable developmentis intergenerational equity whichcan be defended in bothconsequentialist anddeontological terms. It can beconsidered in term of ensuringlong term consequences oftoday’s actions. This utilitarianviewpoint fits the pragmaticconcerns of some businessinterests. The environmentalcrisis threatens the sustainabilityof economic activity.Intergenerational equity can alsobe considered a duty that current
39
featu
re

T H E I N G E N I E U R
generations have to futuregenerations or right of futuregenerations. The Cost Benefit Analysis(CBA) is the ultimate embodiment ofconsequentialist ethics in that it seeksto ensure that good consequencesoutweigh bad consequences andconsequences are measured inmonetary terms. In reality however,CBA works against the ethic of equityand the measuring of sequences infinancial terms fails to capture theconsequence fully.
The valuation of the environmentin terms of the total of what eachindividual is willing to pay denies aseparate concept of public interest.The welfare of society has meaningonly as the summation the welfare ofits’ individual members. Thus, theeconomic view of value is based onthe reduction of human values toindividualism and reduces the worldto one in which individuals all seektheir own good and are indifferent tothe success or failure of otherindividuals. Therefore, valuation ofthe environment through CBA is aconcept that embraces the values ofethical egoism and is in factantithetical to an ethic of equity.
Engineering ethics however,normally go beyond ethical egoism,at least in principle. The ethicalprinciple that engineers put the publicinterest before other interests seemingworks against their self-interest.However, if we look at ethics andmorality in terms of a social contract,that serves self-interest in the longterm as well, the terms of this contractare that if everyone follows the ruleof morality rather than acting onpersonal self-interest, then everyonewill be better off, society will be abetter place to live in. Moralityconsists of governing how people areto treat one another, that rationalpeople will agree to accept, of theirmutual benefit, on the condition thatothers will follow these rules as well.
To extend this to environmentalethics, the ecological (non-humaninclusive) concerns should be givena practical shape in any ethicaldecision. This value-centred concernhas been the ultimate objective forthe universal common good of allcreated beings. On the basis of thisprinciple, that the repelling ofmischief is preferred to the acquisition
of benefits, we can build the theoryof abuse of rights governing therelations between neighbours. Itprovides that a person might bedenied the exercise of a right if itcauses excessive damage to others.Thus, an activity causing excessiveenvironmental pollution might bestopped or curtailed even though thismay cause loss to the owners of thebusiness. A wrong must be redressedfor the sake of justice even thoughthere may be economic benefits in theperpetuation of the wrong.
SUMMARY AND CONCLUSION
To achieve environmentalsustainability in the building sector,engineers and architects must beeducated about environmental issuesduring their professional training.Universities have to fosterenvironmental awareness, introducestudents to environmental ethics, anddevelop their skills and knowledge-base in sustainable design.
The current status of sustainabledesign is that of an ethic rather thana science. While a change of lifestylesand attitudes toward the local andglobal environments is important, thedevelopment of scientific knowledge-bases that provide skills, techniques,and methods of implementing specificenvironmental design goals is urgent.
To enhance environmentalsustainability, a building mustholistically balance and integrate allthree principles — Sustainable Design,Economy of Resources and Life CycleDesign — in design, construction,operation and maintenance, andrecycling and reuse of engineeringand architectural resources. Theseprinciples comprise a conceptualframework for sustainablearchitectural design. This frameworkis intended to help designers seeksolutions rather than giving them aset of solutions. Specific designsolutions compatible with a givendesign problem will emanate fromthese principles.
A change in new perspectives onethics is needed to displace thepowerful ethical egoism thatrationalizes the market as thepredominant decision-making tool inour society. Sustainable development
is in reality a way of endorsing marketmorality and seems to be alsoinadequate to the solution of modernenvironmental problems. It needs theover arching principles of goodmorality.
RECOMMENDATIONS
The following are recommended:
� To address the problem raised byunsustainable activities, top-downand bottom-up approaches arenecessary to realise the tangibletransitions towards sustainability.
� To integrate the notion ofsustainability into everydayengineering activities.
� To integrate sustainability intoeducation programmes by havinga more horizontal integrativeapproach to alter the mix of whatstudents learn so that they cancontribute professionally in aworld where sustainability is theoverarching design principle.
� To take a re-look at sustainabledevelopment for furtherrefinement within the context ofethical values.
REFERENCES
Gershenfeld, J.C., Field, F., Hall,R., Kirchain, R., Marks, D., Oye,K.and Sussman, J. (2004),Sustainability as an OrganizingDesign Principles for Large ScaleEngineering Systems , MITEngineering System Monograph.
Kim, J.J., (1998). Introduction toSustainable Design, NationalPollution Prevention Centre forHigher Education, Michigan AnArbor.
William McDonough and MichaelBraungart (1992). HannoverPrinciples: Design forSustainability, in green@works,com. 2003.
World Commission onEnvironment and Development,(1987). Our Common Future,London: Oxford University Press.
40
BEM
featu
re

T H E I N G E N I E U R
By Chris Nielsen, Felix Ko Kok Hou, Janice Ayog, DHI Water and Environment (Malaysia)
Assessment Of Raw Water QuantityAnd Quality For Water Supply
42T H E I N G E N I E U R
Potable water supply sourcedfrom rivers and streams iscommon in Malaysia and other
countries in the region. To assess theviability of the water source, severalaspects relating to water quantity andquality must be considered, which canbe aided by the use of numericalmodelling tools. This includes:
� Raw water availability,particularly during low flowconditions (droughts).
� The effects of catchment land useupon pollution generation.
� The ambient water quality in theriver or stream.
� The assessment methodology isdescribed, highlighting theapplication of numericalmodelling tools.
Raw Water Availability
A continuous water extraction isdesired. If the river dries up then thisis not possible. Before this extremecondition occurs there are otherconsiderations relating toenvironmental baseflow andprioritisation of the various riverextractions. Guidelines andregulations exist that limit the amountof water that can be extracted and/ora minimum flow below which noextraction is permitted. To ensurecontinuous supply when suchrestrictions exist, a storage facility(either within the distribution systemor in the river itself) can be consideredand/or an emergency alternative
source, such as groundwater extractionor desalination plants (if near thecoast).
Low Flow ConditionsLow flow periods can often occur
during periods of drought. These maybe a consequence of local anomalousweather or regional climatic patterns.Commonly considered low flowperiods are 1 day (daily), 7 day(weekly), 30 day (monthly) and 90 day(quarterly) durations. These differentdurations are important for differentapplications and conditions; forexample a monthly low flow conditionmay be of importance for groundwaterextraction and sustainability, while adaily low flow condition may be ofimportance for domestic water supply.A quarterly duration considers anextreme drought event.
The methodology used to assess the viability of river and stream extractions for potable water supplyis described. This includes design low flow conditions, which can be generated from available dischargedata or from catchment models. Water quality aspects consider land use and pollution loads generatedfrom the catchments (both point and non-point sources) and its effects upon in-stream water quality(via numerical modelling).
Assessment of River DischargeIn many cases river discharge can
be obtained from measurementstations; often stage measurementstations with an associated ratingcurve, generated by performinggauging exercises to determine arelationship between water level andflow. Potential limitations exist whenusing a rating curve, particularlywhen measured water levels arehigher than the highest gaugedrecord, or lower than the lowestgauged record. Unless located at ameasurement station, a scaling factoris often applied to the flowmeasurements, based upon relativedifferences in catchment areas, toestimate discharge at a proposedintake structure.
If no discharge data is available, ahydrologic model can be applied to
Figure 1 Overview of rainfall / runoff process
featu
re

T H E I N G E N I E U R
Figure 2 Overview of MIKE SHE components and modules
43
generate a simulated discharge fromavailable rainfall data. Runoff, theprocess by which falling rain flowsinto the river, is dependant upon theamount of rainfall and evaporationand the nature of the catchment suchas soil land use, vegetation and slope(Figure 1).
Hydrologic ModellingThe NAM hydrologic model (DHI,
2006) is a deterministic, lumped andconceptual model that cancontinuously represent hydrologicalprocesses, which makes it ideal forgenerating long duration time seriesof runoff. It represents variouscomponents of the rainfall runoffprocess by continuously accountingfor the water content in four differentand mutually interrelated storages;snow (not often used in this region),surface, lower or root zone andgroundwater storages.
An alternative, more physicallybased approach is via MIKE SHE (DHI,2006), which can simulate the entireland phase of the hydrological cycle.Each component of the cycle can bemodelled in various ways (Figure 2)with differing levels of detail. Thisflexibility enables the model to betailored to suit the specificrequirements of each application.MIKE SHE is generally morephysically based than other models,which reduces the interpretations andassumptions required during modelestablishment and, with a basisprimarily on spatial data (which isextracted directly from the GIS),makes changes and updates easier.
Statistical Analysis of DischargeMeasurements
Extreme value analysistechniques are available forpredicting design low flows. TheLog-Pearson III (LPIII) probabilitydistribution is widely used for lowflow estimation (including USEnvironmental Protection Agency;USEPA and US Geological Society;USGS). It can be argued that theselection of this distribution asopposed to any other is of lessrelevance compared to the visual fitof the curve and the accuracy,consistency and duration of theavailable data. Design low flow basedon the LPIII distribution is:
QD,T
= exp(u + Kg,T
s)
where D is duration, T is returnperiod, u is the mean of the naturallogarithms of the series, g is theskewness of the natural logarithms ofthe series, s is the standard deviationof the natural logarithms of the series,and Kg,T is the frequency factor forgiven skewness (g) and returnperiod (T).
Annual minimum series (AMS) aretypically plotted using a Cunnaneplotting position (Cunnane, 1978).The LPIII parameters are estimated bythe sample moments of thelogarithmic transformed data(moments in log space). To assessreliability, 95% confidence intervalscan be approximated (Chow, 1988).
Using the calculated design lowflows, the frequency of occurrence of
Figure 3 Daily design low flow conditions, generated from LPIII analysis (AMSshown as points)
featu
re

T H E I N G E N I E U R 44
non water extraction for variousdurations can be estimated. Thisprovides the basis for assessment ofthe viability of raw water supply.
Pollution Load Assessment
Pollution load assessmentdetermines the quality of water fromthe catchment, which considers thehydrological, agricultural, populationand land use information to predictpollution concentrations in acatchment runoff. Pollution load canbe categorised as:
� Non-point sources: related to theland use characteristics, non-pointloads are dependent uponcatchment runoff, which includessoil runoff from cleared areas,agricultural runoff, etc.
� Point Sources: these are identifiedsources of pollution, which areoften independent of catchmentrunoff. These include dischargesfrom industry, sewage outfalls, etc.
� Soil erosion: this is a non-pointsource of pollution, but itsgeneration and transport differ toother forms of pollution. Soilerosion depends upon terrain, soiltype, land cover and rainfallintensity.
Pollution load assessment can becarried out using the MIKE BASINmodel, with the LOAD and SEAGISmodules (DHI, 2006). The modeldescribes pollutant loads on an annualbasis but alternative time resolutionscan be applied. Estimated pollutionloads can subsequently be used toassess water quality processes inreceiving water bodies. Components,generated primarily from spatial datain a GIS, are as follows:
� Digital Elevation Model (DEM) ofcatchment terrain.
� River network of significantwaterways.
� Distance grid: Decay anddegradation occurs as pollutantstravel from their point of origin tothe river network. Using the DEMand river networks, the traveldistance from the pollution sourceto the nearest river point can beestimated. Decay is then estimatedusing a 1st order decay rate.
Figure 4 Steps for pollution load assessment
Figure 5 Calculation steps for soil erosion assessment (SEAGIS)
Figure 6 Identified pollution sources of Nitrogen (top, with non-point sourcesshaded and point sources as black dots). The bottom image shows estimatedloads at the coastline, which accounts for decay and dilution.
featu
re

T H E I N G E N I E U R 45
� The Runoff grid, representingannual runoff (mm/year) ,generated from a catchmentmodel.
� Landuse theme, from whichpollution rates for specific landuse categories are assigned.
� Population theme, from whichper capita loads are estimated.This considers sewered (treatedand non-treated) and non-sewered segments of thepopulation, and assigns pollutionrates for each.
� Point source theme, based uponidentif ied sources such asindustry, sewage treatmentplants, mills, etc.
� Source soil erosion risk map,estimated using one of threemodels; the Universal Soil LossEquation (USLE) (Wischmeier &Smith, 1978) and the revisedversion (RUSLE) (Renard et al.,1997), the Soil Loss Estimator forSouthern Africa (SLEMSA)(Elwell, 1978), and the Morgan,Morgan and Finney model(Morgan, 1986)
As an example, Figure 6 showsidentified pollution loads of Nitrogen,showing non-point sources (shaded)resulting from various land uses, andpoint sources (black dots), resultingfrom industry and population centres.Figure 6 (bottom) shows estimatedloads at the coastline, which takes intoaccount decay and dilution thatoccurs in the journey to the coastline.As an example, a heavy polluter inthe upper catchments may contributeless pollution load to the oceancompared to a much smaller polluteron the coast.
Raw Water Quality
Assessment of r iver waterquality is necessary for assessingviability of a water source, or toimplement and design a treatmentplant. In cases where a significantproportion of total river flow isextracted, consideration of theimpact and consequences toambient water quality downstreamis also necessary.
The MIKE 11 water quality model(DHI, 2006) uses a hydrodynamicand advection dispersion model to
Figure 8 Example of pollution loads from a given catchment for a numberof scenarios; pristine (natural conditions), existing, guidelines (if availableguidelines are followed) and future (with uncontrolled catchmentdevelopment)
Figure 7 A comparison of water quality model predictions tomeasurements of COD
Figure 9 Distribution of land use by total area (top) and by contribution to soilerosion (and subsequent river sediment concentrations, bottom). Thisdemonstrates which land use types are the largest contributors to pollution.
featu
re

T H E I N G E N I E U R
BEM
simulate the two mechanisms formovement of water borne material:
� Advection due to the flow of waterthrough the river system
� Dispersion (or spreading) due toconcentration gradients
The water quality module(ECOLAB) simulates the reactionprocesses of multi-compound systemsincluding the degradation of organicmatter, the photosynthesis andrespiration of plants, nitrification andthe exchange of oxygen with theatmosphere. Inputs for the modelcome directly from the LOADassessment.
The water quality modelcompletes the modelling tool, wherethe effect of changing catchmentconditions upon instream waterquality can be predicted. This isparticularly useful for assessment ofvarious scenarios, such as future landuse conditions as a result ofcatchment development andurbanisation, and its consequences onwater quality.
CONCLUSIONS
The methodology described is arelatively straightforward and effectiveapproach to assessment of water supplysources. The methodology applies toriver intakes, and also to assessment ofgroundwater sources and design of
REFERENCES
� VT Chow, DR Maidment and LW Mays. Applied Hydrology, 1988.� Cunnane, 1978. Unbiased Plotting Positions - A Review. J. Hydrol. 37, p 205-
222.� DHI Water and Environment, “MIKE 11 Users Manual, Release 2006”, DHI,
(2006).� DHI Water and Environment, “MIKE SHE Users Manual, Release 2006”,
DHI, (2006).� DHI Water and Environment, “MIKE BASIN Users Manual, Release 2006”,
DHI, (2006).� Elwell, H.A (1978): Modelling Soil Losses in South Africa. J. Agric. Engng.
Res. 23, 117-127.� Renard, K.G., Foster, G.A., Weesies, D.K., McCool, and D.C. Yooder,
coordinators, 1997. Predicting Soil Erosion by Water: A Guide to ConservationPlanning With the Revised Universal Soil Loss Equation (RUSLE). U.S.Department of Agriculture, Agriculture Handbook No. 703, 404 pp.
� Wischmeier, W.H. and D.D. Smith (1978): Predicting rainfall erosion losses.Agriculture handbook number 537. United States Department of Agriculture.
weirs and dams. A key feature is the useof numerical models in combinationwith other data analysis techniques,which provides particular advantagesespecially relating to runoff generation(quantity and quality) and theprediction of the impact of futurecatchment conditions.
featu
re

T H E I N G E N I E U R
By Chris Nielsen, Darren KK Soh, Julien Frachisse, DHI Water and Environment (Malaysia)
Early Warning AndSurveillance Systems InSurface Water Management
47T H E I N G E N I E U R
Early warning and surveillancesystems are available thatintegrate on-line monitoringand mathematical models. As anexample, during severe floodingthat occurred in Central Europesome year ago, on-line modelsystems were used extensivelyfor evacuation planning. Otheraspects of early warningsystems, such as for waterquality forecasting, are still in adevelopmental stage. Thispaper discusses the latesttechniques and methodsavailable, and the latest findingsfrom research. Examples ofapplications from around theworld are also presented,including applications that haveparticular relevance to Malaysia.
Systems are available thatcombine monitoring withmathematical models. In this
way, mathematical models arecontinuously updated by on-linemeasurements to provide an adaptiveforecasting tool. This technology hassignificantly improved forecastingand early warning for many waterrelated dangers including flooding,pollution of water supplies and publichealth issues.
This paper discusses thetechniques that are used for on-lineforecasting systems. Examples ofapplications to flooding and topollution spills are presented, plus adiscussion of the future direction ofthis technology.
Background: Flooding
The technology for the integrationof mathematical models and on-linemonitoring warning has beenavailable for almost a decade. Withrespect to flooding, the use ofmathematical models for forecastingof flow has been adopted worldwide.The basic elements of a flood warningsystem comprise of:
� Water level and flow sensors,meteorological forecasts, SCADAsystems and te lemetry foronl ine data processing andtransmission.
� Mathematical models for forecastsimulations.
� Data processing and outputgeneration tools, usually linked toGIS.
� Issue of warnings to the public (viainternet, radio, etc).
A prerequisite for reliable forecastis a data assimilation routine toimprove forecast accuracy. The basicelements of such a data assimilationroutine are:
� Comparison and analysis ofmeasured and simulated waterlevels and discharges are madeduring a hindcast period, definedas the period up to the presentwhere forecasting parametersare calculated.
featu
re

T H E I N G E N I E U R 48
� Using this information forecastingis made, usually with statisticallikelihood and confidenceintervals included.
� As more information frommeasurement stations arrives, theforecasting parameters arereassessed and improved. Thus, astime progresses and moreinformation becomes available,the more refined and accurate theforecasting system becomes.
Background: Water Quality
The elements of a water qualitywarning system are the same as thosediscussed for flooding, except that aselected water quality component (orcomponents) is measured andmodelled as well as water levels anddischarges.
Water quality warning systemsare based on a combination ofphysical, chemical and radioactiveanalyses, microbiological analyses,biomonitoring (bioalarms) and on-line sensors for such parameters asdissolved oxygen, temperature andturbidity. The coupling withmathematical models and relatedtechnology for data assimilation andwater quality forecast is a newtechnology. Also, availabletechnology for online monitoring ofwater quality components is stilllimited to only a few parameters.Future prospects are good however –there is rapid development in sensortechnology, including on-linemonitoring of heavy metals and toxiccompounds. Thus, coupling earlywarning systems with state of the artwater quality modelling techniquesand forecasting is realistic.
Data Assimilation AndForecasting Routine
The data assimilation routine thatgenerates the forecasting parametersis based upon Kalman filteringtechniques. These techniques takemeasurements and, through afeedback process, adjust and update anumerical model to matchobservations. The technique combinesMonte Carlo methods for randomised
forecasts with Ensemble Kalmanfiltering, which incorporates knownfeatures of the input signal. This is astochastic system, where it is alsopossible to forecast uncertainties. Byassigning statistical properties to theinputs and propagating uncertaintiesthrough the model, confidenceintervals can be assigned topredictions.
Figure 1Inundation Map
of Bangladesh,August 2002
showing asignificant
proportion ofthe countryunder flood
waters.
Figure 2Floodforecastinginternetinterface forBangladesh.
Illustration: Flooding
The following illustration gives anexcellent overview of what is possiblewith on-line forecasting, and howeffective this technology can be.Bangladesh regularly suffersenormous losses on a nationwidescale due to flooding of theBrahmaputra, Ganges and Maghna
featu
re

T H E I N G E N I E U R 49
Rivers, which can inundate over halfof the country (see Figure 1).
A flood forecasting and earlywarning system has beenimplemented for Bangladesh. Thesystem contains the followingcomponents:
� Data collection: On-line telemetrysystem, manned stations linked viaUHF radio and mobile phones,satellite imagery (cyclone trackingand cloud movement) and satelliteand radar rainfall data.
� Real time data management(input): GIS links, providing adisplay map of water level andrainfall status, automatic dataexchange to the forecastingmodel.
� Flood Forecast Model: Hydrologicmodel for simulation of rainfall/runoff from all catchments, linkedto hydrodynamic model of allrivers and floodplains.Forecasting techniques used toprovide projections of likely floodwater levels.
� Real time data management(output): GIS display of forecastwater levels, automaticgeneration of bulletins, issueflood status to local governmentand agencies, automatic
The end result of this system is anextremely effective flood warningtool that has significantly reduced lossof life during flood events.
Illustration: Early Warning ForWater Supply
An AWS survey in 1999 (USA)lists the most commoncontamination threats for surfacewater treatment plants:
� Transportation accidents, mostlyoil and petroleum products.
� Non point source pollution, suchas pesticides and nutrients fromagriculture.
� Sewage releases.� Industrial chemical releases.� Pipeline releases.
Such risks are equally applicableto Malaysia, although other possiblerisks could include:
� Saline intrusion� Turbidity
To illustrate a potential use of anearly warning system, consider ahypothetical example. Figure 4 showsa gold mine situated on a river.Downstream from the gold mine is awater intake supplying potable waterto a community. A system has beendeveloped to ensure that any cyanideaccidentally released from the goldmine does not enter the water supply.This system consists of a monitoringstation downstream of the mine, whichis continuously sampling the river
Figure 3 Time series of water level at selected river station.
Figure 4 Example of WQ early warning system – cyanide spill into a river systemupstream from a water supply intake.
generation of statistics, automaticpresentation of information onthe internet.
The online output from the floodforecasting system is shown inFigure 2 (taken from www.ffwc.net).
Flood risk at each station/populated area is categorised fromnormal (green) to severe (red). Byclicking on any location a timeseries of the water level can be seen,along with a forecast for thefollowing days (Figure 3). Alsoshown is the danger level (abovewhich flood damage may occur) andthe RHWL (highest recorded waterlevel).
featu
re

T H E I N G E N I E U R 50
water, and on-line measurements offlow at the upstream boundary (somedistance upstream from the mine).Downstream boundary conditionsassume normal flow.
The monitoring stations areconnected on-line to a onedimensional model that performscontinuous forecasting simulations. Ifthe forecasting simulation detects aspill and predicts that a dangerousconcentration of cyanide will reachthe water supply intake, a safety valveis automatically shut off at the intake.
The forecasting model iscontinuously running multiple waterquality simulations. Each simulationuses the latest measurements ofpollutant concentration with arandom variation applied. Themagnitude of the random variation isstatistically dependent upon theaccuracy of measurements at themonitoring station and also on theaccuracy of the water quality model.As more information is read and withimproved model calibration, therandom variation is reduced. Thismeans that at each sampling intervalof the measurement gauge astatistically significant number ofmodel simulations are performed, allusing slightly different boundaryconditions. This provides statisticallyrelevant confidence intervals to thepredictions.
Figure 5 to Figure 9 displaylongitudinal profiles of cyanideconcentrations along the river reachat different times during the spillevent. The black line represents theactual cyanide concentration in theriver. The red line represents theaverage concentration predicted bythe forecasting model.
Figure 5 shows the concentrationjust after the spill. The actualconcentration (black line) is at itshighest. The concentration has not yetreached the monitoring site, so theforecasting model does not yet predictany concentrations (except for somerandom fluctuations, created as partof the forecasting model). The nextfigure (Figure 6) shows that the spillis propagating downstream. Again,the forecast model has not yetdetected any concentrations.
Figure 6 Longitudinal profile of cyanide concentration, real(black) and predicted (red) – upstream of measurement station
Figure 7 Longitudinal profile of cyanide concentration, real(black) and predicted (red) – at measurement station
Figure 8 Longitudinal profile of cyanide concentration, real(black) and predicted (red) – forecast
Figure 9 Longitudinal profile of cyanide concentration, real(black) and predicted (red) – forecast at water supply intake
Figure 5 Longitudinal profile of cyanide concentration, real(black) and predicted (red) – just after spill
featu
re

T H E I N G E N I E U R
BEM
Figure 7 shows the spi l lreaching the monitoring station. Atthis point the forecasting model (inred) responds to the measuredconcentration, and commences aforecast simulation.
The final two figures (Figure 8and Figure 9) show the averageprediction from the forecastingmodel. The final figure (Figure 9) isat the water supply. This forecasthappens immediate ly af ter aconcentration is detected at themeasurement station – the forecastat the water supply is made longbefore the spill actually arrives.
As mentioned, the forecastingmodel performs an ensemble ofsimulations. This means that theforecast at the water intakeincludes a measure of theuncertainty of the prediction. Theaverage concentrations are shownabove – if required the confidenceintervals and standard deviation ofthe predictions could also bepresented.
Conclusions
Flood forecasting is a wellestablished technology. On the otherhand, forecasting of water quality andwater borne pollutants as a commonlyused tool is still developing. While themathematical tools and tools tointegrate measurements are available,much of the new development is in thesensor and measurement technologieswhere rapid progress is being made.
This paper has shown twoexamples of the application of earlywarning and surveillance systems insurface water management, where on-line measurement stations have beencoupled to numerical models and dataassimilation techniques to createextremely useful and valuableprediction tools. The benefits ofimproved forecasting and surveillancecan be summarised as:
� Early warning of natural and man-made disasters, reducing damageand potential loss of life.
� A cleaner, safer environment.� For water abstractions and
pollution sensitive issues, a betterestimate of risks and downtimeperiods improves production andminimises damage.
� Improved water resourcesmanagement in relation tofreshwater supply and distributionof domestic and irrigation water.
ACKNOWLEDGEMENTS
The information contained in thispaper is a summary ofdevelopment carried out within anumber of R&D projects over thepast decade, hosted by DHI Water& Environment.
REFERENCES
Web Page of the Flood Forecastingand Warning Centre, Bangladesh(www.ffwc.net).
featu
re

T H E I N G E N I E U R 52
Cities and urban centers arecomplex entities within whichvarious dynamic economic
and social interactions take place.For this reason, the task of ensuringsustainable development is achallenge for city planners andadministrators and requires broad-based cross-sectoral and stakeholderparticipatory approaches. However,if sustainable development is viewedas a process of change, efforts canbe made to ensure that a cityprogresses towards sustainability.Thus a Bandar Lestari is one whereachievements in social, economicand physical development are madeto last.
The concept of Bandar Lestariincorporates many dimensions. Inaddition to the environmentdimension, other strategicimperatives such as economic growthto meet essential needs, provisionsof shelter and urban services,efficient transportation, publicsafety, good governance andcommunity stakeholder participationare equally important.
The concept also promotes:
� Facilitating the sharing ofenv i ronment -deve lopment
information, expertise andbuilding inter-agency partnership
� Building environmental planningand management capacities
� Leveraging environmentalresources and managing risksfor achieving sustainabledevelopment
In col laborat ion with theMinistry of Housing and LocalGovernment and re levantGovernment agencies andcommunity-based organisations,the Department of Environment ofthe Ministry of Natural Resourcesand Environment has introduced‘Bandar Lestari - EnvironmentAward’ to give recognition to urbancentres for their overal lcommitment and efforts towardsenvironmental sustainability. Theaward is not des igned as acompetition and participation is ona voluntary basis.
OBJECTIVES
� Recognize the efforts andcontributions of local authoritieswith regard to environmentalsustainability in their policies andactions;
� Enhance awareness ofenvironmental sustainability withthe support of local communities;
� Encourage innovative approachesand promote good practicestowards environmentalsustainability.
ASSESSMENT & SELECTION
An Assessment Panel and aSelection Panel will be established toadminister the process. Both Panelsconsist of distinguished members withrelevant expertise and technicalsupport from the Institute forEnvironment and Development(LESTARI) of Universiti KebangsaanMalaysia.
The Department of Environmentserves as the Secretariat for the award.The Secretariat will collatepreliminary data and information forthe Assessment Panel. TheAssessment Panel will carry outevaluation based on the defined listof criteria and indicators as well asconduct field visits and interviews.The Assessment Panel will thenpresents its recommendation to theSelection Panel for a final decision.In addition, a Public PerceptionSurvey will also be carried out
Bandar Lestari Environment AwardContributed by Patrick Tan Hock Chuan, Director of Strategic Communications,Department of Environment Head Office, Putrajaya, Malaysia.
Sustainable Development - Bandar Kuantan
featu
re

T H E I N G E N I E U R 53
involving respondents residing in thearea. Existing environment qualitydata will also be evaluated.
ASSESSMENT CRITERIA
Physical Environment: Elementsthat relate to this criterion are basedon the extent of improvement to thesurrounding physical environmentalconditions for conducive urbanliving. Initiatives such as improvedair quality, improved water quality,and reduction of noise levels, amongothers are taken into account.
Ecological Initiatives: Elementsthat relate to this criterion areprotection of the naturalenvironment, biodiversity-related orhabitat enhancement initiatives;environment-friendly innovationssuch as energy savings, efficiencyand reduction of heat islands in thebuilt environment; innovativepractices like solar lighting,pedestrian malls, bicycle lane, amongothers; and new technological andexperimental practices such as useof alternative fuels or other
environment-friendly productdevelopment and usage.
Urban Services: Initiatives thatinculcate the practice of reducing,reusing and recycling of wastes aswell as improvement of transportmanagement system will berecognized. Other elements thatrelate to this category include waterand materials efficiency, clean-upprojects, sanitation and effluentmanagement.
Environmental Governance:This criterion recognizes leadershipin environmental sustainability.Elements that relate to this categoryinclude incorporation of policies,practices and procedures thatpromote accountable andtransparent governance; two-waycommunication with thecommunity, including the extent towhich issues such as publiccomplaints are addressed;inculcation of stakeholder andcommunity support; and quality ofenvi ronment managementtraining.
Education and Awareness: Thiscriterion encompasses the area ofeducation or communication thatcontributes to enhancing publicawareness and understanding ofenvironmental i ssues andinitiatives. Elements that relate tothis criterion include the relevanceand impact of communication,target audiences, and theeffectiveness of communicationmechanisms, whether individuallyor in collaboration with otherorganisations.
2003/2004 AWARDPRESENTATIONS
The 2003/2004 Bandar Lestari –Environment Award was presented tothe Kuantan Municipal Council by theRt. Hon. Deputy Prime Minister, YBDatuk Seri Najib Tun Abdul Razak ata glittering ceremony in Putrajaya onJuly 7, 2005. Five other localauthorities were presented withSpecial-Mentioned Awards inrecognition of their specificachievements, namely,
� Johor Bahru City Council:“Ecological Initiative – UrbanForest”
� South Kuching City Council:“Physical Environment Initiative(Landscaping)”
� Malacca Historical City Council:“Urban Services Initiative -Centralised Transportation”
� Penang Municipal Council:“Environmental Education andAwareness Initiative”
� Shah Alam City Council: “PhysicalEnvironment Initiative -Innovative Planning, BalancedQuality Living”
2005/2006 AWARD
The 2005/2006 Award will bepresented in 2007. Out of the 144local authorities in the country, 47have been pre-qual i f ied forassessment under three differentcategories. The Field Assessmentby a Panel of IndependentAssessors, Public Perception Surveyand Environment Qual i tyMonitoring and Data Evaluationare in progress and will be finalisedin early 2007. BEM
Kuantan RiverEsplanade
Tun Ismail Lane- Pedestrian
Mall
featu
re

T H E I N G E N I E U R
With many incidences of landslides, mudslides and erosion,especially in highlands in Malaysia, properties have beendamaged and lives lost. Seeing the need for resolving andminimizing such untoward incidences, a study has beenembarked on developing a forecast and real-time early warningsystem on erosion risks/hazards to provide an early warning tothe public. Consequently, a case study on Cameron HighlandsCatchment was carried out, which involved a detailed baselinedatabase of the study area. The highland catchment, is anenvironmentally sensitive area where many land developmentactivities such as agriculture, agro-tourism, propertydevelopment and road-widening projects are still on-going.
The early warning forecast on erosion risks/hazards would bebased on the baseline database developed and it is to beconfirmed by the weather forecast information provided by theMalaysian Meteorological Service (MMS). It is hoped that theapplication of this new locally developed system, which has beentrademarked under the name EWARNSTM (Early Warning And RiskNavigation Systems), would be beneficial to the local authorities,highway operators and public to provide early warning ofpossible erosion/landslides /mudslides especially during periodsof heavy rainfall.
With respect to numerouserosion, landslide andmudslide occurrences in
Malaysia, particularly at hillslopesand highlands, there is a greatconcern that these areas areextremely sensitive to disturbancesof any sort. Events over the pastyears, such as landslides at theGenting Highlands slip road (1996& 2004) , the col lapse of theHighland Tower (1993), landslide atBukit Antarabangsa (1999) ,landslides and mudslides at GuaTempurung (1996 & 2004) ,landsl ides at the KL–KarakHighway near Bentong (2003 &2004), landslides and mudslides inCameron Highlands (2000 & 2004)and smaller landslides in Fraser’sHill occurring almost every year,have indicated what can happenwhen things go wrong. Seeing theneed for resolving and minimizingsuch untoward incidences, a studyhas been embarked on developinga forecast and real-time earlywarning system on erosion risks/hazards so as to provide an earlywarning to the public. A casestudy on Cameron HighlandsCatchment has been carried out,which involved a detailed baselinedatabase of the study area. Thish ighland catchment i s be ingconsidered an environmentallysensitive area where many landdevelopment activities such asagr icu l ture , agro- tour i sm,property development and road-widening pro jec t s , had beencarried out and some are still on-going.
By Tew Kia Hui, Director, VT Soil Erosion Research & Consultancy,Dr. Faisal Hj. Ali, Professor, Department of Civil Engineering, Faculty of Engineering, University of Malaya
Development Of EWARNSTM ForecastAnd Real-Time Early Warning SystemOn Erosion Risks/Hazards
54T H E I N G E N I E U R
featu
re

T H E I N G E N I E U R
OBJECTIVE
The objective of this research anddevelopment of EWARNSTM is toprovide an early warning to theauthorities, tourists, hoteliers, farmersand public in general within theCameron Highlands Catchment bymonitoring the current situation theremore closely. This includes takingmitigative measures should there beat any time, specific locations withintheir jurisdiction that have higherosion risk, which would possiblyinduce landslides. This could be donesimply by just logging onto a websiteand checking the situation of theroads, agricultural farms and specificbuilt-up areas on the level of erosionrisks/hazards. Information on theseareas would be updated every minuteshould there be any rainfall event.Tourists and motorists heading toCameron Highlands would also bewell informed and be able to plantheir travel better as such informationwould be updated constantly via thenewly developed EWARNSTM website
� Rain sensing and transmissionunit (RSTU)
� Receiving unit, which includesprocessing of near real-time data
� Early warning system panel, whichwould be up hosted to theEWARNSTM website
METHODOLOGY
Methodology of research for thedevelopment of the EWARNSTM
forecast and real-time early warningsystem on erosion risks/hazards startsfirstly with the acquisition of baselinedata for the study area, CameronHighlands Catchment. Liaison with
(www.ewarns.com.my). Farmers andhoteliers in Cameron Highlands wouldalso be fore-warned of the dangersinvolved and be able to take necessarymeasures to protect and safeguardtheir properties. Local authorities andrelevant agencies would also benotified via SMS/e-mail to takeprecautions and carry out inspectionson high-risk areas when there are anyincidences of continuous heavydownpour within a specified area.
The scope of research anddevelopment includes developing:
� Baseline database for the CameronHighlands CatchmentFigure 1: EWARNSTM outdoor Rain Sensing
and Transmission Unit (RSTU)
Figure 2: Operation of EWARNSTM Real-Time Early Warning System on ErosionRisks / Hazards
55
featu
re

T H E I N G E N I E U R
various agencies was requiredto obtain the relevantinformation, which includes thelatest Cameron HighlandsStructure Plan (1995–2020),current land use using SPOT 4Satellite Imagery dated July 7,2002 (to be revised using SPOT5 Satellite Imagery dated April19, 2005), topographicalinformation usingTopographical Map (Sheet 74)and recorded rainfallinformation from nine existingrainfall stations within thecatchment area. Suchinformation is used forsimulation of data for input intothe early warning system.
Once this is completed, aprototype of actual real-timeoutdoor transmission unit isthen developed as shown inFigure 1. This could be doneusing solar-powered rainsensors, which would betriggered based on the rainfallamount and intensity. A SIM-card based GPRS transmitter,which is attached to theinterface module of the RainSensing and Transmission Unit(RSTU) would then send out e-mails/ Internet file transfers atevery minute interval, so thatthe data could be transferred toa receiving unit (a serverconnected to high speed Internetline). At this point, the e-mail/transferred file is read and datais processed within theGeographical InformationSystems (GIS) using anautomated keyboard simulationprogramme. The final processedvalues would then be set against thethreshold values, which will trigger anearly warning if any of the valueexceeds the threshold limits.
Subsequently, the early warningpanel, which is also known asEWARNSTM Display Panel, would beup hosted to the website(www.ewarns.com.my), whereby suchinformation would be made accessibleto the public and authorities involved.
The website’s map of erosion riskareas will also be updated everyminute as data from the sensors areconstantly calculated. A blinking redlight with continuous playback of the‘warning’ sound would indicate that acertain area is at high risk of erosion(> 1.0 t/ha/day), while yellow is formedium (0.51 – 1.0 t/ha/day), andblue for low risk locations (0 – 0.5 t/ha/yr). Remarks on the percentage ofrisk area and in acreage for the built-
up areas, roads and agricultural areaswould also be shown in the displaypanel.
F lowchart showing theoperation of the EWARNSTM real-time early warning system onerosion risks/ hazards is depicted inFigure 2. Subsequently, Figure 3shows the sample of EWARNSTM
display panel and correspondingrainfall erosivity (Figure 4) asviewed via the website.
56
Figure 4: Real-Time EWARNSTM Display Panel on Rainfall Erosivity
Figure 3: Real-Time EWARNSTM Display Panel on Erosion Risks / Hazards
featu
re

T H E I N G E N I E U R
As for the EWARNSTM forecast onerosion risks/hazards for CameronHighlands Catchment, theinformation of at least 10 yearsrainfall database was acquired to geta picture of the rainfall distributionon the catchment area, and to use thisinformation for forecasting of therainfall pattern. However, it wouldalso be very dependent on the weatherforecast information as provided bythe Malaysian Meteorological Service(MMS). This means that if the weatherforecast for a particular day is fair,therefore, the EWARNSTM forecast onerosion risks/hazards would be a lowrisk with zero rainfall erosivitypredicted. Such information would beupdated on a daily basis as theEWARNSTM website would search thelatest weather forecastprovided by MMS. Sampleof the seven-day forecaston erosion risks/hazards forCameron Highlands isshown in Figure 5.
BASELINE DATA ANDEARLY WARNING SYSTEMDEVELOPMENT
Baseline data acquisitionwas carried out for theCameron HighlandsCatchment to serve as aninput to the forecast andreal-time early warning system onerosion risks/hazards, which includethe latest rainfall, soil, topographicaland land use information for the areaas shown in Figure 6. This is crucial,as the early warning system requiresthe latest data to ensure thepredicted level of risk to achieve thebest accuracy possible. As forrainfall data, even though theseinformation would subsequently betransmitted by the RSTU in real-time, trial-runs on the system wouldbe required using historical dailyrainfall data acquired from theexisting rainfall stations within theCameron Highlands Catchment forpurpose of programme simulationand correlation with reportedincidences. Figure 7. Simulated EWARNSTM Display Panel observation on January 5, 2000
Figure 6: Baseline data acquisition and GIS database development
57
Figure 5: EWARNSTM 7 Days Forecast on Erosion Risks / Hazards
featu
re

T H E I N G E N I E U R
EXAMPLE OF TYPICAL REPORTED INCIDENCE ANDWARNING ISSUED
A reported incidence of heavy rain and subsequentlandslides occurred within Cameron HighlandsCatchment on January 5, 2000. During this incident,rain on that day was heavier than usual and possibly thehighest for the year 2000, triggering landslides and soilerosion occurrences on various agricultural farms withinCameron Highlands as well as cutting off access roadbetween Brinchang and Kg. Raja. Simulation ofmaximum erosivity index recorded was 62 MJ.mm/(ha.hr.day) and EWARNSTM warning signal (high risk) wasissued for all the areas of interest (built-up, roads andagriculture) as shown in Figure 7.
CONCLUSION
In conclusion, the development of EWARNSTM forecastand real-time early warning system on erosion risks/hazards would certainly assist various parties includingthe local authorities, relevant Government agencies, andthe public, consisting of motorists, tourists, hoteliers, andfarmers in highland areas, as it would serve as an earlywarning in the case of any potential erosion risks orpossible landslide occurrences. The EWARNSTM early
58
BEM
Special thanks are extended to various parties fortheir assistance and contribution, which include:
� Malaysian Meteorological Service� Malaysian Centre for Remote Sensing� SSJCH Generation Division, Tenaga Nasional
Berhad� Hydrology & Water Resources Division,
Department of Irrigation and Drainage Malaysia
ACKNOWLEDGEMENT
warning system, which consists of the transmission unit,receiving unit and EWARNSTM display panel, is hoped toachieve its purpose in providing early warning and alertingthe authorities as well as the public in general of thepotential high erosion risk areas within the affected areasonce there are incidences of heavy downpour.
Finally, with the introduction of EWARNSTM forCameron Highlands, it is hoped that better monitoring ofthe study area, Cameron Highlands Catchment could beprovided and more attention could be paid to controlindiscriminate or illegal clearing of areas with a potentiallyhigh erosion risk. Therefore, preventive and mitigationmeasures could be initiated early and duly enforced.
featu
re

T H E I N G E N I E U R 59
By Ir. Tee Horng Hean
Some Design AndPractical Perspectives InConcrete Cracks Part 2
� Deep Beams
In the British Code of Practice,BS8110, deep beams are defined asbeams with clear span of less thantwice their effective depths. TheIndian Code of Practice, IS 456 has asimilar definition but uniquedefinitions for simply supported andcontinuous beams (Pillai & Menon,1998, p. 169; Shina, 1988, p.353).For deep beams, BS8110 should notbe referred to as it is specificallymentioned in Clause 3.4.1.1 of thiscode that the design of deep beams isnot covered and specialist textsshould be consulted.
The design of beams in most Codeof Practices is based on linear-elasticmethods. However, when it comes todeep beams, the stresses involved arenon-linear as shown in Fig. 7.
� Structural Analysis
Obviously before any RCstructural elements are designed,structural analysis has to be carriedout. Results of a structural analysiscan depict the stresses that thestructural elements undergo andengineers can therefore prescribeadequate rebars at the tension zoneof these elements. With the use ofcomputers nowadays, care should betaken so that an engineer’s designconcept is inputted correctly.Incorrect inputs would result inincorrect outputs and consequentlyincorrect RC designs.
� Sites With Trees
Trees can cause direct damage tonearby structures by their roots
growing and consequently liftingor distorting structures (Fig. 8), bythe impact of the branches onto astructure, etc. which can lead tocracks. Trees can also causeindirect damage as certain speciesof t rees can abstract highervolumes of moisture from the soil
than others which indirectly affectthe foundation and consequentlythe RC structural elements. BS5837– Trees in Relation to Constructionshould be consulted when asituation arises where trees are tobe planted near a bui ldingstructure.
Figure 8
Figure 7
featu
re

T H E I N G E N I E U R 60
WHY CRACKS OCCUR?
It is seldom that RC is designed toresist direct tension but RC structuralmembers still experience tensile forcesdue to bending, shrinkage, changesin temperature, eccentricity, etc.Cracks often develop as a result ofthe tensile strength (or limiting tensilestrain) being exceeded (Pillai &
Menon, 1998, p.48). The reasons asto why the tensile strength of RC canbe exceeded may be attributed tooverloading of structural elements,accidental or unforeseen loadings(such as blast, earthquakes, explosion,landslide, etc.), tractive forces (Fig. 9),under-providing rebars, wrongdetailing, not consulting aprofessional engineer whenmodifying a structure, etc.
stress (Budynas, 1999, p.364). Thisis why slabs with square openingstend to develop cracks at the cornersunless diagonal bars were providedto control the propagation of thesecracks. Stress concentration wouldcause a material to crack if the stressexceeds the material’s endurance limitwhether the material is ductile (e.g.steel) or brittle (e.g. concrete)(Hibbeler, 2000, p.158). An exampleof the consequence of stressconcentrations can be observed atcorners of brick wall windowopenings (Fig. 10).
Without proper detailing, a RCstructure such as the six-metre highRC retaining wall as shown in Fig. 11and Fig. 12 can also experienceexcessive stress concentrations at thejoints and hence the development ofserious cracks with widths exceedingthose permitted by engineeringstandards.
THE PROS AND CONS OFFINE CRACKS
No doubt the word “cracks”normally have a negativeconnotation, but however, cracks aresometimes beneficial to our everydaylife. For instance, withoutintroducing a notch in a tree, onewould find difficulties in cuttingdown the tree with an axe. Onewould even find difficulties tearingstamps if stamps were notintentionally perforated.
Figure 9
Figure 10
Figure 11 Figure 12
Stress concentrations, which occurat sections where cross-sectionalareas of a structural element suddenlychanges (Hibbeler, 2000, p.159) cancause cracks. Stress concentrationsoccur when a small, localised area ofa structural element experiences high
featu
re
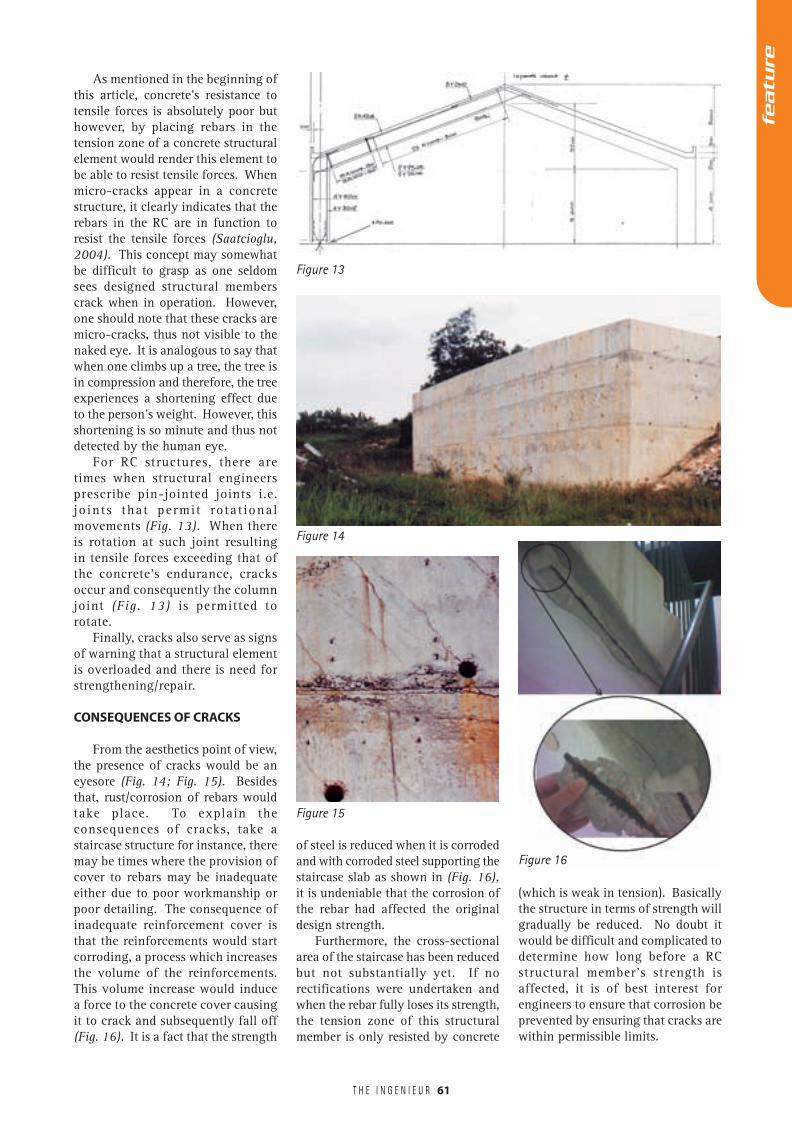
T H E I N G E N I E U R
Figure 14
Figure 15
As mentioned in the beginning ofthis article, concrete’s resistance totensile forces is absolutely poor buthowever, by placing rebars in thetension zone of a concrete structuralelement would render this element tobe able to resist tensile forces. Whenmicro-cracks appear in a concretestructure, it clearly indicates that therebars in the RC are in function toresist the tensile forces (Saatcioglu,2004). This concept may somewhatbe difficult to grasp as one seldomsees designed structural memberscrack when in operation. However,one should note that these cracks aremicro-cracks, thus not visible to thenaked eye. It is analogous to say thatwhen one climbs up a tree, the tree isin compression and therefore, the treeexperiences a shortening effect dueto the person’s weight. However, thisshortening is so minute and thus notdetected by the human eye.
For RC structures, there aretimes when structural engineersprescribe pin-jointed joints i.e.jo ints that permit rotat ionalmovements (Fig. 13). When thereis rotation at such joint resultingin tensile forces exceeding that ofthe concrete’s endurance, cracksoccur and consequently the columnjoint (Fig. 13) is permitted torotate.
Finally, cracks also serve as signsof warning that a structural elementis overloaded and there is need forstrengthening/repair.
CONSEQUENCES OF CRACKS
From the aesthetics point of view,the presence of cracks would be aneyesore (Fig. 14; Fig. 15). Besidesthat, rust/corrosion of rebars wouldtake place. To explain theconsequences of cracks, take astaircase structure for instance, theremay be times where the provision ofcover to rebars may be inadequateeither due to poor workmanship orpoor detailing. The consequence ofinadequate reinforcement cover isthat the reinforcements would startcorroding, a process which increasesthe volume of the reinforcements.This volume increase would inducea force to the concrete cover causingit to crack and subsequently fall off(Fig. 16). It is a fact that the strength
of steel is reduced when it is corrodedand with corroded steel supporting thestaircase slab as shown in (Fig. 16),it is undeniable that the corrosion ofthe rebar had affected the originaldesign strength.
Furthermore, the cross-sectionalarea of the staircase has been reducedbut not substantially yet. If norectifications were undertaken andwhen the rebar fully loses its strength,the tension zone of this structuralmember is only resisted by concrete
(which is weak in tension). Basicallythe structure in terms of strength willgradually be reduced. No doubt itwould be difficult and complicated todetermine how long before a RCstructural member’s strength isaffected, it is of best interest forengineers to ensure that corrosion beprevented by ensuring that cracks arewithin permissible limits.
Figure 13
Figure 16
61
featu
re

T H E I N G E N I E U R
Last but not least, cracks canalso be a nuisance and causeinconveniences to say an occupantof a building with a cracked andleaking (Fig. 17; Fig. 18) floorslab above him.
CONCLUSION
Some general guidelines toprevent concrete cracks werepre sen ted . The mer i t s anddemer i t s o f c racks and theconsequences of not attending tocracks were also discussed. Nodoubt there are numerous otherfactors that can be attributed toconcrete cracks, such as the useof impure materials, misuse ofs t ruc ture , e tc . , in th i s shor tarticle, only some factors werediscussed.
REFERENCES
Boughton, B. W., 1979, ReinforcedConcrete Detailer’s Manual, GranadaPublishing, London.
Budynas, R. G., 1999, AdvancedStrength and Applied Stress Analysis,Second Edition, McGraw Hill, Boston.
Hibbeler, R. C., 2000, Mechanics ofMaterials, Fourth Edition, PrenticeHall, New Jersey.
I. Struct. E. / ICE Joint Committee,1985, Manual for the Design ofReinforced Concrete BuildingStructures, Institution of StructuralEngineers, London.
Kong, F. K. & Evans, R. H., 1994,Reinforced and Prestressed Concrete,
Third Edition, Chapman & Hall,London.
MacGinely, T. J., 2001, ReinforcedConcrete – Design Theory andExamples, Second Edition, SponPress, London.
Mosley, W. H., Bungey, J. H. & Hulse,R., 1999, Reinforced Concrete Design,Fifth Edition, Palgrave, London.
NPIRD, 2004, Concrete LinedIrrigation Channels – Causes ofFailure, [Online], Available fromURL:….. http://www.npird.gov.au/p r o j e c t s / f i n a l r e p _ p d f / p d f /rroclic_pdf_protected/Concrete_Re-lining/Guide-Causes_of_Failure.PDF,Accessed [07 September 2004].
Perkins, P. H., 1997, Repair,Protection, and Waterproofing ofConcrete Structures, Third Edition, E& FN SPON, London.
Pillai, S. U. & Menon, D., 1998,Reinforced Concrete Design, TataMcGraw Hill, New Delhi.
Price, W. H., February 1951, FactorsInfluencing Concrete Strength, JournalACI, Vol. 47.
Ray, S. S., 1995, Reinforced Concrete– Analysis and Design, BlackwellScience, London.
Saatcioglu, M., 2004, ReinforcedConcrete Design, Class Notes forCVG3143, Reinforced Concrete DesignI Course, The Department of CivilEngineering, The University ofOttawa, Ottawa.
Shina, S. N., 1988, ReinforcedConcrete Design, Tata McGraw Hill,New Delhi.
Taft, B., Speck, S. W. & Morris, J. R.,1999, Dam Safety: Problems withConcrete Materials, [Online],Available from URL: http://www.dnr.state.oh.us/water/pubs/pdfs/fctsht56.pdf, Accessed [07 September2004].
Wang, C. K. & Salmon, C. G., 1992,Reinforced Concrete Design, FifthEdition, Harper Collins, New York.
Figure 17
Figure 18
BEM
62
featu
re

T H E I N G E N I E U R 64
engin
eeri
ng f
eatu
res
Roof
ed B
ridge
At K
g Ba
ru G
uchi
l, Ku
ala
Krai
, Kel
anta
nSu
bmitt
ed b
y W
ong
Sion
g H
wee


![Overview of Recommendation Techniques in Business Process …ceur-ws.org/Vol-1070/kese9-05_07.pdf · Structural recommendations: Mazanek et al. [8] proposed a syntax-based assis-](https://img.dokumen.tips/doc/110x75/5c77ab4109d3f21d538c1d64/overview-of-recommendation-techniques-in-business-process-ceur-wsorgvol-1070kese9-0507pdf.jpg)