Embed Size (px)
Citation preview

Federal Statistical Office of Germany
G7 in figuresSummit of the G7 states in Elmau 2015
Federal Statistical Office, G7 in Figures, 20152
Published by Statistisches Bundesamt (Federal Statistical Office), Wiesbaden
Author Daniel O’Donnell
Edited by / Layout and graphics Statistisches Bundesamt (Federal Statistical Office)
Published in May 2015 Order number: 0000155-15900-1
Photo copyright Cover page © Schloss Elmau
Page 4 © Bundesregierung / Denzel, Jesco Page 5 © Statistisches Bundesamt Page 8 © JFL Photography - Fotolia.com Page 10 © k5226933 / www.fotosearch.com Page 11 © johas - Fotolia.com Page 13 © zylox - Fotolia.com Page 17 © Frank Fennema - Fotolia.com Page 23 © Lukasz Janyst - Fotolia.com Page 31 © kagemusha - Fotolia.com
Printed on RecyStar Polar, 100% recycled paper, Blue Angel certified.
© Statistisches Bundesamt (Federal Statistical Office), Wiesbaden 2015 Reproduction and distribution, also of parts, are permitted provided that the source is mentioned.
Federal Statistical Office, G7 in Figures, 2015 3
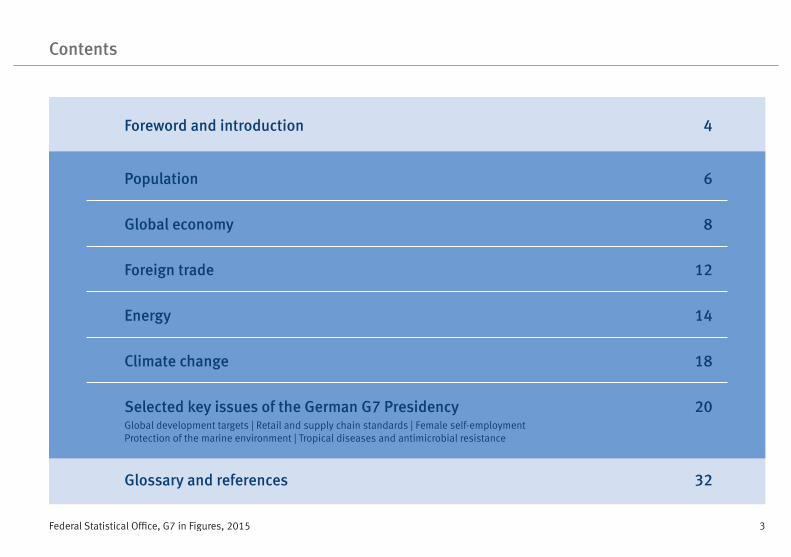
Contents
Foreword and introduction 4
Population 6
Global economy 8
Foreign trade 12
Energy 14
Climate change 18
Selected key issues of the German G7 Presidency 20Global development targets | Retail and supply chain standards | Female self-employment Protection of the marine environment | Tropical diseases and antimicrobial resistance
Glossary and references 32
Federal Statistical Office, G7 in Figures, 20154
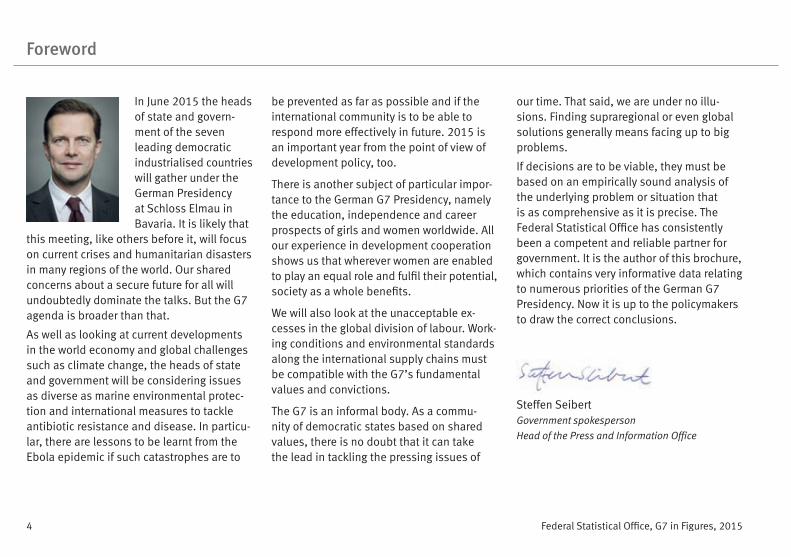
Foreword
In June 2015 the heads of state and govern-ment of the seven leading democratic industrialised countries will gather under the German Presidency at Schloss Elmau in Bavaria. It is likely that
this meeting, like others before it, will focus on current crises and humanitarian disasters in many regions of the world. Our shared concerns about a secure future for all will undoubtedly dominate the talks. But the G7 agenda is broader than that.
As well as looking at current developments in the world economy and global challenges such as climate change, the heads of state and government will be considering issues as diverse as marine environmental protec-tion and international measures to tackle antibiotic resistance and disease. In particu-lar, there are lessons to be learnt from the Ebola epidemic if such catastrophes are to
be prevented as far as possible and if the international community is to be able to respond more effectively in future. 2015 is an important year from the point of view of development policy, too.
There is another subject of particular impor-tance to the German G7 Presidency, namely the education, independence and career prospects of girls and women worldwide. All our experience in development cooperation shows us that wherever women are enabled to play an equal role and fulfil their potential, society as a whole benefits.
We will also look at the unacceptable ex-cesses in the global division of labour. Work-ing conditions and environmental standards along the international supply chains must be compatible with the G7’s fundamental values and convictions.
The G7 is an informal body. As a commu-nity of democratic states based on shared values, there is no doubt that it can take the lead in tackling the pressing issues of
our time. That said, we are under no illu-sions. Finding supraregional or even global solutions generally means facing up to big problems.
If decisions are to be viable, they must be based on an empirically sound analysis of the underlying problem or situation that is as comprehensive as it is precise. The Federal Statistical Office has consistently been a competent and reliable partner for government. It is the author of this brochure, which contains very informative data relating to numerous priorities of the German G7 Presidency. Now it is up to the policymakers to draw the correct conclusions.
Steffen SeibertGovernment spokesperson
Head of the Press and Information Office
Federal Statistical Office, G7 in Figures, 2015 5
Introduction
G7 and the summit in Schloss Elmau
The Group of Seven (G7) is an informal forum of the world’s leading industrialised countries – Canada, France, Germany, Italy, Japan, the United Kingdom and the United States. The G7 is committed to promoting democracy, economic stability and sustain-able development.
Every year the G7 meets for an annual sum-mit, at which the heads of state and govern-ment discuss topics which are currently of particular global relevance. The summits are also attended by representatives of the European Union.
Topics such as the current global economic climate or foreign and security policy are discussed at each G7 summit. In addition, the agenda includes current topics where a coordinated approach appears particularly appropriate or urgent.
The 2015 summit is being organised by the German Presidency and will take place on the 7th and 8th June in Elmau, near
Garmisch-Partenkirchen in Bavaria. The agenda is strongly influenced by two upcom-ing UN conferences: the Post-2015 Agenda conference, which aims to reach agreement on new global development and sustain-ability goals, and the UN climate conference, where a new legally binding and universal agreement on climate is to be negotiated.
The German Presidency has also chosen a number of other issues for the summit, including in particular energy, protection of the marine environment, Ebola, the fight against neglected tropical diseases and rising antimicrobial resistance, opportunities for women in terms of self-employment and vocational training, supply chain standards and resource efficiency.
This brochure features official international statistics on both the classic summit topics such as foreign trade and economic stability and on the key issues of this year’s G7 Presi-dency. The main focus is on the situation in the G7 states, but depending on the topic and data availability statistics are also pre-sented for other important partner countries such as the BRICS or G20 states.
Given that most topics chosen for the 2015 summit are multidimensional, this brochure can only offer a first insight into a small se-lection of the relevant data. Anyone interest-ed in researching a topic in greater detail will find links in each section providing access to useful databases and can also contact our international statistics team (www.destatis.de/contact) for further assistance.
Federal Statistical Office, G7 in Figures, 20156
Population
G7 and population ageing
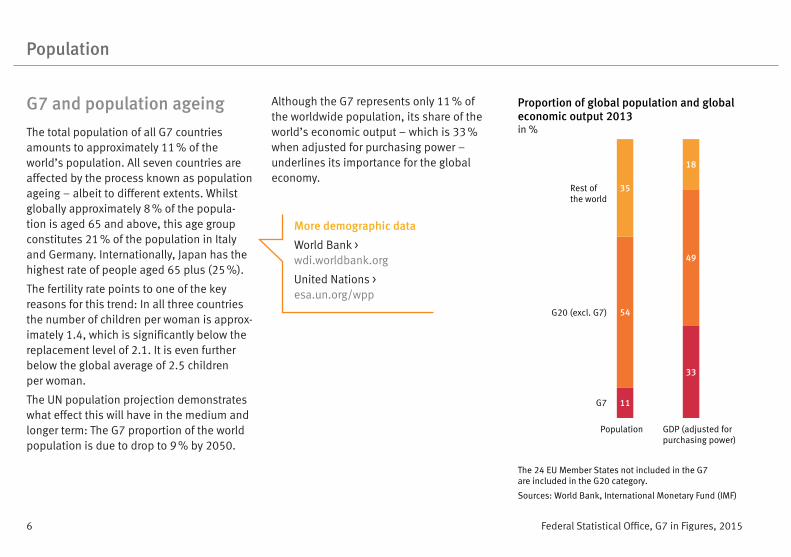
The total population of all G7 countries amounts to approximately 11 % of the world’s population. All seven countries are affected by the process known as population ageing – albeit to different extents. Whilst globally approximately 8 % of the popula-tion is aged 65 and above, this age group constitutes 21 % of the population in Italy and Germany. Internationally, Japan has the highest rate of people aged 65 plus (25 %).
The fertility rate points to one of the key reasons for this trend: In all three countries the number of children per woman is approx-imately 1.4, which is significantly below the replacement level of 2.1. It is even further below the global average of 2.5 children per woman.
The UN population projection demonstrates what effect this will have in the medium and longer term: The G7 proportion of the world population is due to drop to 9 % by 2050.
Although the G7 represents only 11 % of the worldwide population, its share of the world’s economic output – which is 33 % when adjusted for purchasing power – underlines its importance for the global economy.
More demographic data
World Bank > wdi.worldbank.org
United Nations > esa.un.org/wpp
11
54
35
33
49
18
Proportion of global population and globaleconomic output 2013in %
G7
Population
The 24 EU Member States not included in the G7are included in the G20 category.
Sources: World Bank, International Monetary Fund (IMF)
GDP (adjusted forpurchasing power)
G20 (excl. G7)
Rest ofthe world

Federal Statistical Office, G7 in Figures, 2015 7
G7 and G20: Population indicators
Population Total fertility rate Population aged 65 and over
Population projection | 1
Average annual population change
mn inhabitants births per woman % mn inhabitants %
G7 G20 2013 2013 2013 2050 2013
Germany 81 1.4 21 73 0.3
Canada 35 1.6 15 45 1.2
France 66 2.0 18 73 0.4
Italy 60 1.4 21 60 1.2
Japan 127 1.4 25 108 −0.2
United Kingdom 64 1.9 17 73 0.6
United States 316 1.9 14 401 0.7
Argentina 41 2.2 11 51 0.9
Australia 23 1.9 14 34 1.7
Brazil 200 1.8 8 231 0.9
China 1,357 1.7 9 1,385 0.5
European Union (EU28) 507 1.6 18 512 0.3
India 1,252 2.5 5 1,620 1.2
Indonesia 250 2.3 5 321 1.2
Mexico 122 2.2 6 156 1.2
Republic of Korea 50 1.2 12 51 0.4
Russian Federation 143 1.7 13 121 0.2
Saudi Arabia 29 2.6 3 40 1.9
South Africa 53 2.4 6 63 1.5
Turkey 75 2.0 7 95 1.3
Source World Bank World Bank World Bank UN DESA World Bank
1 Medium variant of UN population projection.

Federal Statistical Office, G7 in Figures, 20158
Global economy
G7 and G20: Driving forces of the global economy
The G7 states have a particular responsibility for the global economy. Adjusting for pur-chasing power, these seven countries are responsible for a third of the global economic output (2013: 32.7 %). Taking all G20 states into account, this value increases to 82 %. Given the high degree of global economic interdependence, this means that any dis-ruption of economic growth among the G20 states has a highly significant impact on all other countries worldwide.
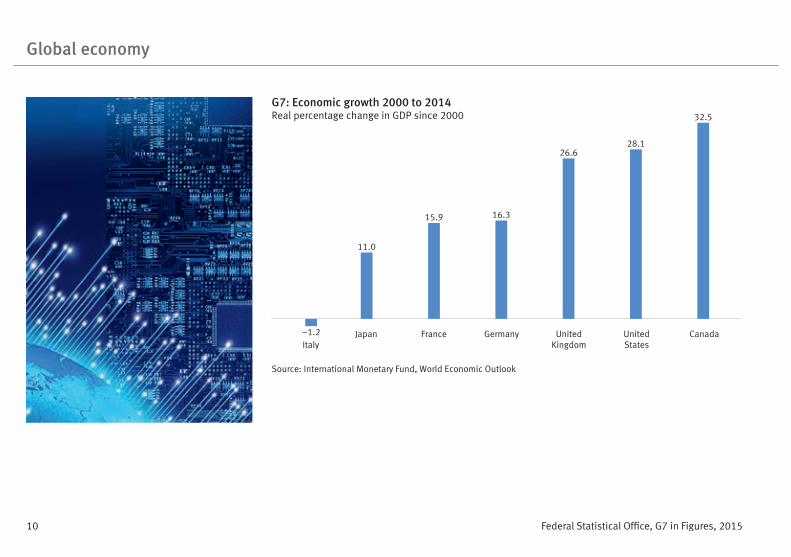
An analysis of the economic trend in recent years shows that – despite financial crises – overall most G7 states have managed to increase their economic output in real terms since 2000, with the North American countries achieving the largest increase in GDP. The only exception is Italy. Here the GDP measured in 2014 was more or less unchanged (–1.2 %) compared to the year 2000.
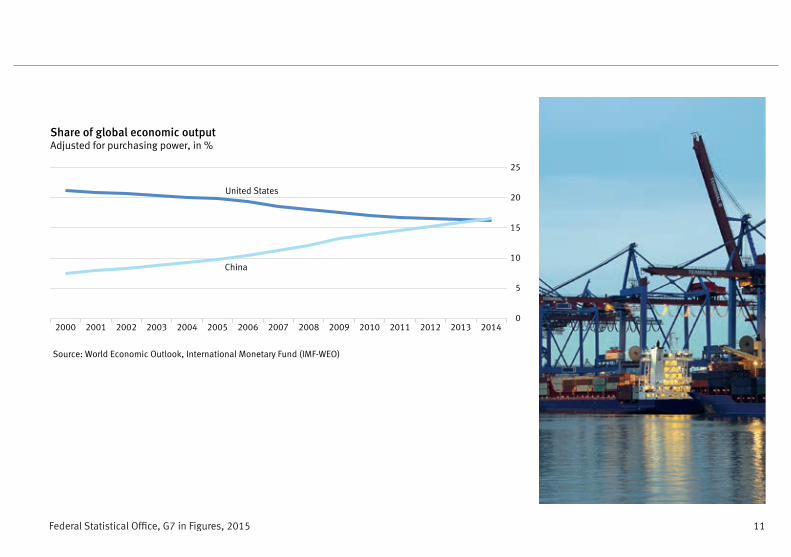
The high growth rates in countries such as China and India indicate that positions are starting to shift within the G20. Comparing the Chinese and US share of global eco-nomic output over time and adjusting for purchasing power, the resulting graph (page 11) illustrates just how fast some of these changes are occurring.
Economic and financial data
World Economic Outlook,International Monetary Fund (IMF) > www.imf.org/external/data.htm
National Accounts data
United Nations Statistical Division > unstats.un.org/unsd/snaama
Federal Statistical Office, G7 in Figures, 2015 9
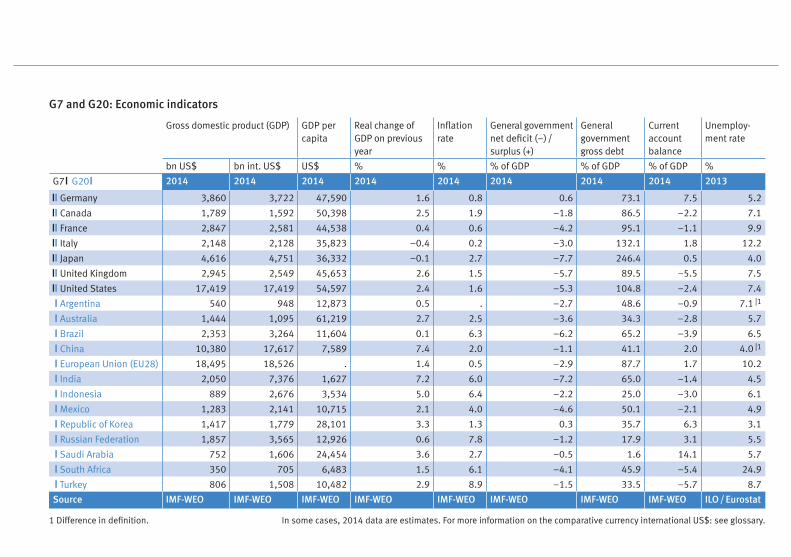
G7 and G20: Economic indicators
Gross domestic product (GDP) GDP per capita
Real change of GDP on previous year
Inflation rate
General govern ment net deficit (–) / surplus (+)
General government gross debt
Current account balance
Unemploy-ment rate
bn US$ bn int. US$ US$ % % % of GDP % of GDP % of GDP %
G7 G20 2014 2014 2014 2014 2014 2014 2014 2014 2013
Germany 3,860 3,722 47,590 1.6 0.8 0.6 73.1 7.5 5.2
Canada 1,789 1,592 50,398 2.5 1.9 –1.8 86.5 –2.2 7.1
France 2,847 2,581 44,538 0.4 0.6 –4.2 95.1 –1.1 9.9
Italy 2,148 2,128 35,823 –0.4 0.2 –3.0 132.1 1.8 12.2
Japan 4,616 4,751 36,332 –0.1 2.7 –7.7 246.4 0.5 4.0
United Kingdom 2,945 2,549 45,653 2.6 1.5 –5.7 89.5 –5.5 7.5
United States 17,419 17,419 54,597 2.4 1.6 –5.3 104.8 –2.4 7.4
Argentina 540 948 12,873 0.5 . –2.7 48.6 –0.9 7.1 |1
Australia 1,444 1,095 61,219 2.7 2.5 –3.6 34.3 –2.8 5.7
Brazil 2,353 3,264 11,604 0.1 6.3 –6.2 65.2 –3.9 6.5
China 10,380 17,617 7,589 7.4 2.0 –1.1 41.1 2.0 4.0 |1
European Union (EU28) 18,495 18,526 . 1.4 0.5 –2.9 87.7 1.7 10.2
India 2,050 7,376 1,627 7.2 6.0 –7.2 65.0 –1.4 4.5
Indonesia 889 2,676 3,534 5.0 6.4 –2.2 25.0 –3.0 6.1
Mexico 1,283 2,141 10,715 2.1 4.0 –4.6 50.1 –2.1 4.9
Republic of Korea 1,417 1,779 28,101 3.3 1.3 0.3 35.7 6.3 3.1
Russian Federation 1,857 3,565 12,926 0.6 7.8 –1.2 17.9 3.1 5.5
Saudi Arabia 752 1,606 24,454 3.6 2.7 –0.5 1.6 14.1 5.7
South Africa 350 705 6,483 1.5 6.1 –4.1 45.9 –5.4 24.9
Turkey 806 1,508 10,482 2.9 8.9 –1.5 33.5 –5.7 8.7
Source IMF-WEO IMF-WEO IMF-WEO IMF-WEO IMF-WEO IMF-WEO IMF-WEO IMF-WEO ILO / Eurostat
1 Difference in definition. In some cases, 2014 data are estimates. For more information on the comparative currency international US$: see glossary.
Federal Statistical Office, G7 in Figures, 201510
Global economy
G7: Economic growth 2000 to 2014Real percentage change in GDP since 2000
11.0
15.9 16.3
26.628.1
32.5
Source: International Monetary Fund, World Economic Outlook
ItalyJapan France Germany United
KingdomUnitedStates
Canada–1.2
Federal Statistical Office, G7 in Figures, 2015 11
Share of global economic outputAdjusted for purchasing power, in %
0
5
10
15
20
25
2000 2001 2002 2003 2004 2005 2006 2007 2008 2009 2010 2011 2012 2013 2014
China
United States
Source: World Economic Outlook, International Monetary Fund (IMF-WEO)

Federal Statistical Office, G7 in Figures, 201512
Foreign trade
G7: Important international trading partners
The G7 countries are important global trading partners: Approximately one third of all exports worldwide come from one of the G7 states and 35 % of all goods and services imported have a G7 destination.
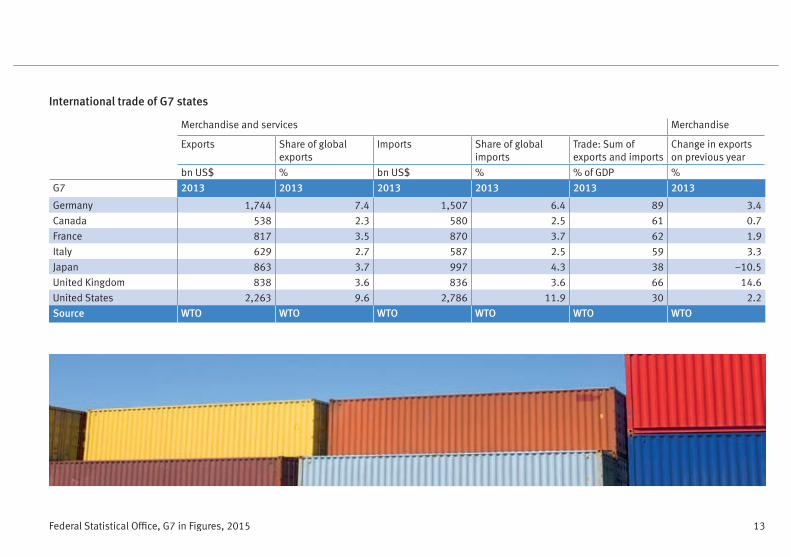
Germany is a leading export nation: With exports in 2013 totalling 1,744 billion US $ (goods and services) it was ranked third worldwide – behind China and the United States. Germany’s total trade in goods and services (exports and imports) amounted to 89 % of its gross domestic product in 2013, making its economy significantly more dependent on international trade than the other six G7 economies. Particularly the United States and Japan are more oriented towards domestic trade than Germany.
More international data on foreign trade
World Trade Organization (WTO) > stat.wto.org/Home/WSDBHome.aspx
United Nations (Comtrade) > comtrade.un.org
Global merchandise and services trade 2013Percentage of G7 states and the three largest non-G7 trade partners
35
10
33
50Exports
33
10
33
51 Imports
G7China, excl. Hong KongNetherlandsRepublic of KoreaOther countries
Source: World Trade Organization (WTO)
Federal Statistical Office, G7 in Figures, 2015 13
International trade of G7 states
Merchandise and services Merchandise
Exports Share of global exports
Imports Share of global imports
Trade: Sum of exports and imports
Change in exports on previous year
bn US$ % bn US$ % % of GDP %
G7 2013 2013 2013 2013 2013 2013
Germany 1,744 7.4 1,507 6.4 89 3.4
Canada 538 2.3 580 2.5 61 0.7
France 817 3.5 870 3.7 62 1.9
Italy 629 2.7 587 2.5 59 3.3
Japan 863 3.7 997 4.3 38 −10.5
United Kingdom 838 3.6 836 3.6 66 14.6
United States 2,263 9.6 2,786 11.9 30 2.2
Source WTO WTO WTO WTO WTO WTO
Federal Statistical Office, G7 in Figures, 201514
Energy
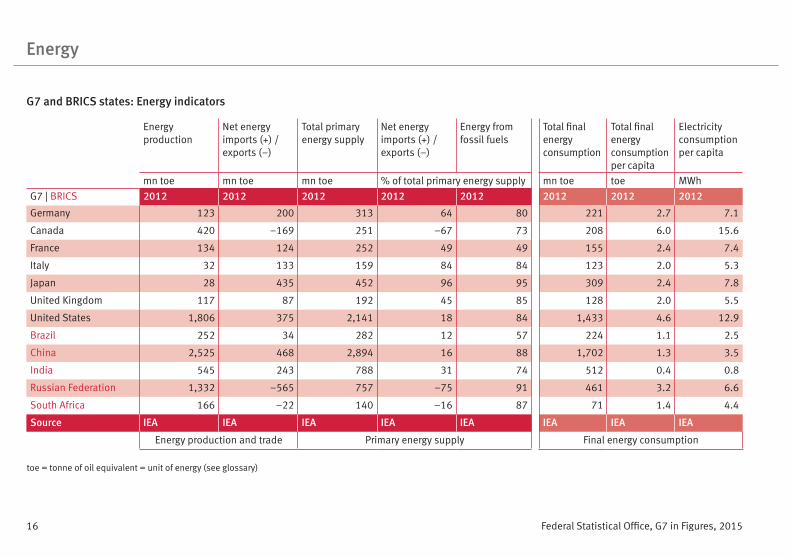
Supply, efficiency and sustainability
Most G7 countries depend on imports to cover their energy demand. This is particu-larly true for Japan, where energy imports amounted to 96 % of the total primary energy supply. Energy dependency was also high in Italy (84 %) and Germany (64 %). Canada, South Africa and the Russian Federation produced more energy than they needed for inland consumption, making them the only net energy exporters among the G7 and BRICS states.
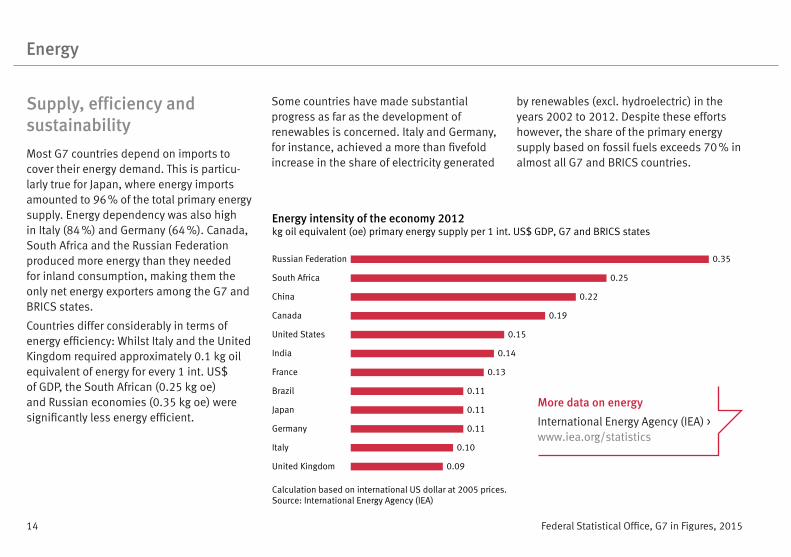
Countries differ considerably in terms of energy efficiency: Whilst Italy and the United Kingdom required approximately 0.1 kg oil equivalent of energy for every 1 int. US$ of GDP, the South African (0.25 kg oe) and Russian economies (0.35 kg oe) were significantly less energy efficient.
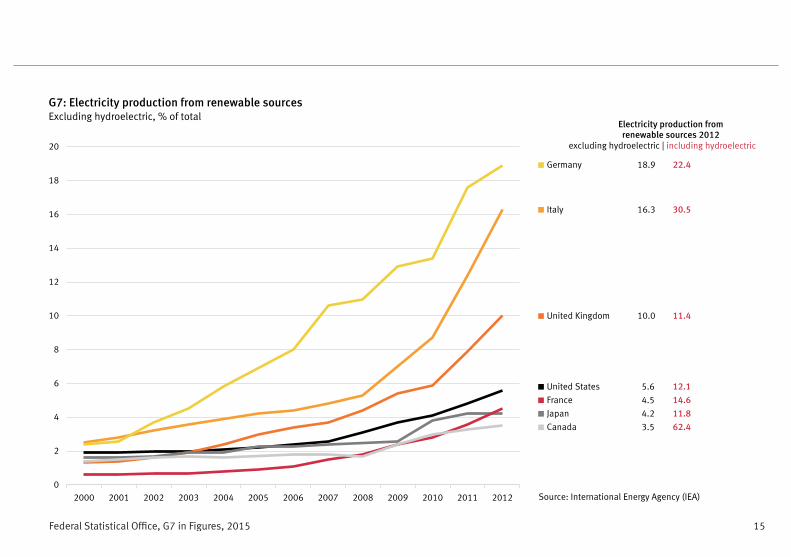
Some countries have made substantial progress as far as the development of renewables is concerned. Italy and Germany, for instance, achieved a more than fivefold increase in the share of electricity generated
by renewables (excl. hydroelectric) in the years 2002 to 2012. Despite these efforts however, the share of the primary energy supply based on fossil fuels exceeds 70 % in almost all G7 and BRICS countries.
Energy intensity of the economy 2012kg oil equivalent (oe) primary energy supply per 1 int. US$ GDP, G7 and BRICS states
Russian Federation
South Africa
China
Canada
United States
India
France
Brazil
Japan
Germany
Italy
United Kingdom
0.35
0.25
0.22
0.19
0.15
0.14
0.13
0.11
0.11
0.11
0.10
0.09
Calculation based on international US dollar at 2005 prices.Source: International Energy Agency (IEA)
More data on energy
International Energy Agency (IEA) > www.iea.org/statistics
Federal Statistical Office, G7 in Figures, 2015 15
G7: Electricity production from renewable sourcesExcluding hydroelectric, % of total
0
2
4
6
8
10
12
14
16
18
20
2000 2001 2002 2003 2004 2005 2006 2007 2008 2009 2010 2011 2012
Germany
Italy
United Kingdom
United States
France
Japan
Canada
18.9 22.4
16.3 30.5
10.0 11.4
5.6 12.1
4.5 14.6
4.2 11.8
3.5 62.4
Electricity production fromrenewable sources 2012
excluding hydroelectric | including hydroelectric
Source: International Energy Agency (IEA)
Federal Statistical Office, G7 in Figures, 201516
Energy
G7 and BRICS states: Energy indicators
Energy production
Net energy imports (+) / exports (–)
Total primary energy supply
Net energy imports (+) / exports (–)
Energy from fossil fuels
Total final energy consumption
Total final energy consumption per capita
Electricity consumption per capita
mn toe mn toe mn toe % of total primary energy supply mn toe toe MWh
G7 | BRICS 2012 2012 2012 2012 2012 2012 2012 2012
Germany 123 200 313 64 80 221 2.7 7.1
Canada 420 −169 251 −67 73 208 6.0 15.6
France 134 124 252 49 49 155 2.4 7.4
Italy 32 133 159 84 84 123 2.0 5.3
Japan 28 435 452 96 95 309 2.4 7.8
United Kingdom 117 87 192 45 85 128 2.0 5.5
United States 1,806 375 2,141 18 84 1,433 4.6 12.9
Brazil 252 34 282 12 57 224 1.1 2.5
China 2,525 468 2,894 16 88 1,702 1.3 3.5
India 545 243 788 31 74 512 0.4 0.8
Russian Federation 1,332 −565 757 −75 91 461 3.2 6.6
South Africa 166 −22 140 −16 87 71 1.4 4.4
Source IEA IEA IEA IEA IEA IEA IEA IEA
Energy production and trade Primary energy supply Final energy consumption
toe = tonne of oil equivalent = unit of energy (see glossary)
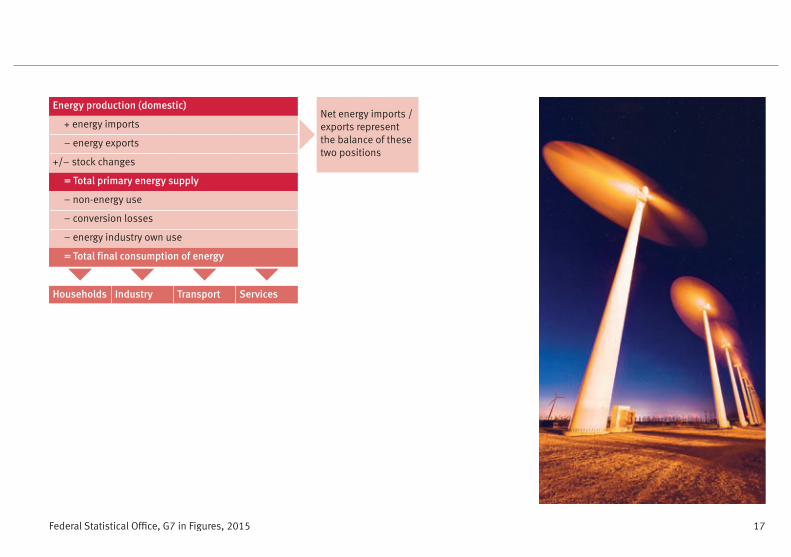
Federal Statistical Office, G7 in Figures, 2015 17
Energy production (domestic) Net energy imports / exports represent the balance of these two positions
+ energy imports
– energy exports
+/– stock changes
= Total primary energy supply
– non-energy use
– conversion losses
– energy industry own use
= Total final consumption of energy
Households Industry Transport Services
Federal Statistical Office, G7 in Figures, 201518
Climate change
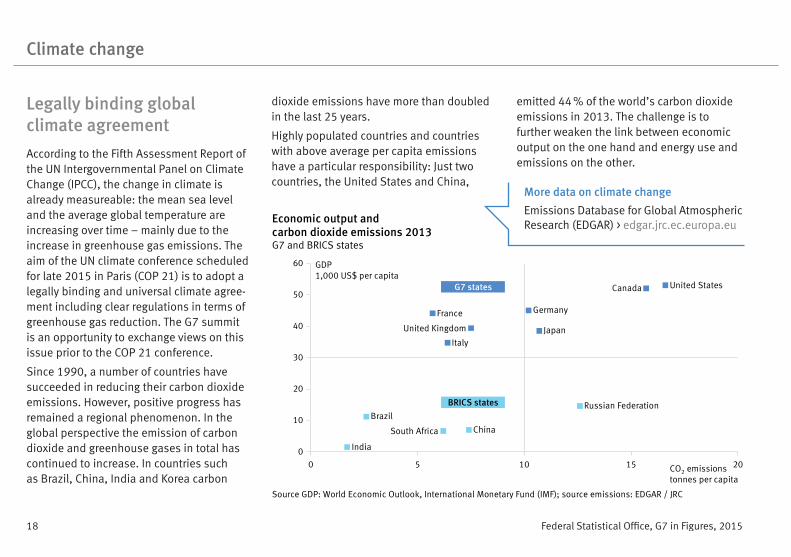
Legally binding global climate agreement
According to the Fifth Assessment Report of the UN Intergovernmental Panel on Climate Change (IPCC), the change in climate is already measureable: the mean sea level and the average global temperature are increasing over time – mainly due to the increase in greenhouse gas emissions. The aim of the UN climate conference scheduled for late 2015 in Paris (COP 21) is to adopt a legally binding and universal climate agree-ment including clear regulations in terms of greenhouse gas reduction. The G7 summit is an opportunity to exchange views on this issue prior to the COP 21 conference.
Since 1990, a number of countries have succeeded in reducing their carbon dioxide emissions. However, positive progress has remained a regional phenomenon. In the global perspective the emission of carbon dioxide and greenhouse gases in total has continued to increase. In countries such as Brazil, China, India and Korea carbon
dioxide emissions have more than doubled in the last 25 years.
Highly populated countries and countries with above average per capita emissions have a particular responsibility: Just two countries, the United States and China,
emitted 44 % of the world’s carbon dioxide emissions in 2013. The challenge is to further weaken the link between economic output on the one hand and energy use and emissions on the other.
Economic output andcarbon dioxide emissions 2013G7 and BRICS states
0 5 10 15 20
0
10
20
30
40
50
60 GDP1,000 US$ per capita
CO emissions2tonnes per capita
Source GDP: World Economic Outlook, International Monetary Fund (IMF); source emissions: EDGAR / JRC
Germany
United StatesCanada
JapanUnited Kingdom
France
Italy
Russian Federation
ChinaSouth Africa
Brazil
India
BRICS states
G7 states
More data on climate change
Emissions Database for Global Atmospheric Research (EDGAR) > edgar.jrc.ec.europa.eu
Federal Statistical Office, G7 in Figures, 2015 19
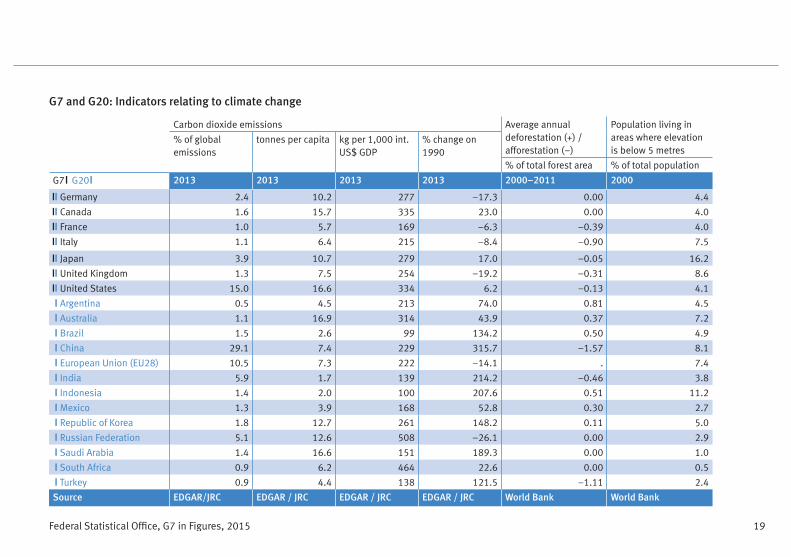
G7 and G20: Indicators relating to climate change
Carbon dioxide emissions Average annual deforestation (+) / afforestation (–)
Population living in areas where elevation is below 5 metres
% of global emissions
tonnes per capita kg per 1,000 int. US$ GDP
% change on 1990
% of total forest area % of total population
G7 G20 2013 2013 2013 2013 2000–2011 2000
Germany 2.4 10.2 277 −17.3 0.00 4.4
Canada 1.6 15.7 335 23.0 0.00 4.0
France 1.0 5.7 169 –6.3 –0.39 4.0
Italy 1.1 6.4 215 −8.4 −0.90 7.5
Japan 3.9 10.7 279 17.0 −0.05 16.2
United Kingdom 1.3 7.5 254 −19.2 −0.31 8.6
United States 15.0 16.6 334 6.2 −0.13 4.1
Argentina 0.5 4.5 213 74.0 0.81 4.5
Australia 1.1 16.9 314 43.9 0.37 7.2
Brazil 1.5 2.6 99 134.2 0.50 4.9
China 29.1 7.4 229 315.7 −1.57 8.1
European Union (EU28) 10.5 7.3 222 −14.1 . 7.4
India 5.9 1.7 139 214.2 −0.46 3.8
Indonesia 1.4 2.0 100 207.6 0.51 11.2
Mexico 1.3 3.9 168 52.8 0.30 2.7
Republic of Korea 1.8 12.7 261 148.2 0.11 5.0
Russian Federation 5.1 12.6 508 −26.1 0.00 2.9
Saudi Arabia 1.4 16.6 151 189.3 0.00 1.0
South Africa 0.9 6.2 464 22.6 0.00 0.5
Turkey 0.9 4.4 138 121.5 −1.11 2.4
Source EDGAR/JRC EDGAR / JRC EDGAR / JRC EDGAR / JRC World Bank World Bank
Federal Statistical Office, G7 in Figures, 201520
Global development targets
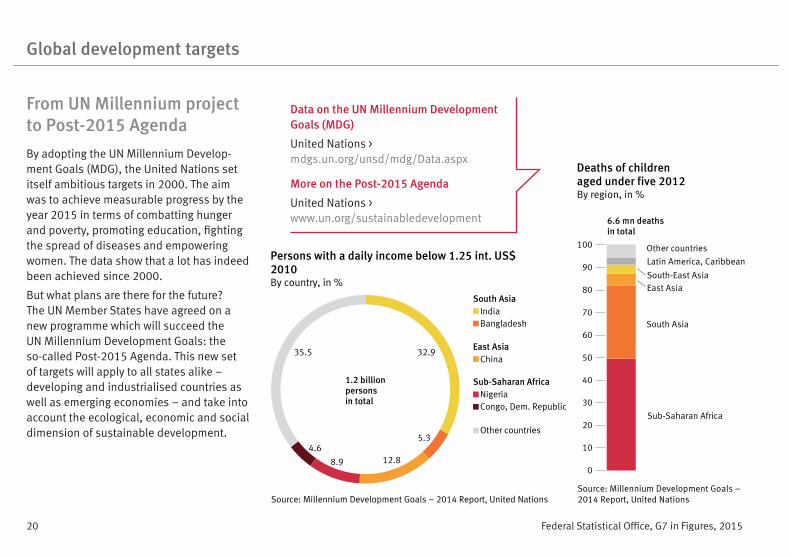
From UN Millennium project to Post-2015 Agenda
By adopting the UN Millennium Develop-ment Goals (MDG), the United Nations set itself ambitious targets in 2000. The aim was to achieve measurable progress by the year 2015 in terms of combatting hunger and poverty, promoting education, fighting the spread of diseases and empowering women. The data show that a lot has indeed been achieved since 2000.
But what plans are there for the future? The UN Member States have agreed on a new programme which will succeed the UN Millennium Development Goals: the so-called Post-2015 Agenda. This new set of targets will apply to all states alike – developing and industrialised countries as well as emerging economies – and take into account the ecological, economic and social dimension of sustainable development.
Data on the UN Millennium Development Goals (MDG)
United Nations > mdgs.un.org/unsd/mdg/Data.aspx
More on the Post-2015 Agenda
United Nations > www.un.org/sustainabledevelopment
Persons with a daily income below 1.25 int. US$2010By country, in %
India
1.2 billionpersonsin total
32.9
5.3
12.88.9
4.6
35.5
Bangladesh
Other countries
South Asia
Source: Millennium Development Goals – 2014 Report, United Nations
ChinaEast Asia
NigeriaCongo, Dem. Republic
Sub-Saharan Africa
Deaths of childrenaged under five 2012By region, in %
6.6 mn deathsin total
Other countries
South Asia
East Asia
Sub-Saharan Africa
Latin America, Caribbean
South-East Asia
Source: Millennium Development Goals –2014 Report, United Nations
100
90
80
70
60
50
40
30
20
10
0
Federal Statistical Office, G7 in Figures, 2015 21
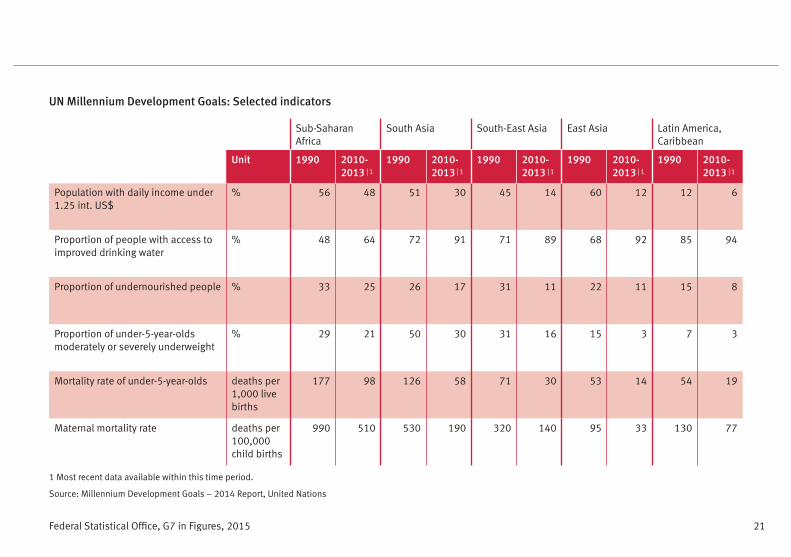
UN Millennium Development Goals: Selected indicators
Sub-Saharan Africa
South Asia South-East Asia East Asia Latin America, Caribbean
Unit 1990 2010-2013 | 1
1990 2010-2013 | 1
1990 2010-2013 | 1
1990 2010-2013 | 1
1990 2010-2013 | 1
Population with daily income under 1.25 int. US$
% 56 48 51 30 45 14 60 12 12 6
Proportion of people with access to improved drinking water
% 48 64 72 91 71 89 68 92 85 94
Proportion of undernourished people % 33 25 26 17 31 11 22 11 15 8
Proportion of under-5-year-olds moderately or severely underweight
% 29 21 50 30 31 16 15 3 7 3
Mortality rate of under-5-year-olds deaths per 1,000 live births
177 98 126 58 71 30 53 14 54 19
Maternal mortality rate deaths per 100,000 child births
990 510 530 190 320 140 95 33 130 77
1 Most recent data available within this time period.
Source: Millennium Development Goals – 2014 Report, United Nations
Federal Statistical Office, G7 in Figures, 201522
Retail and supply chain standards
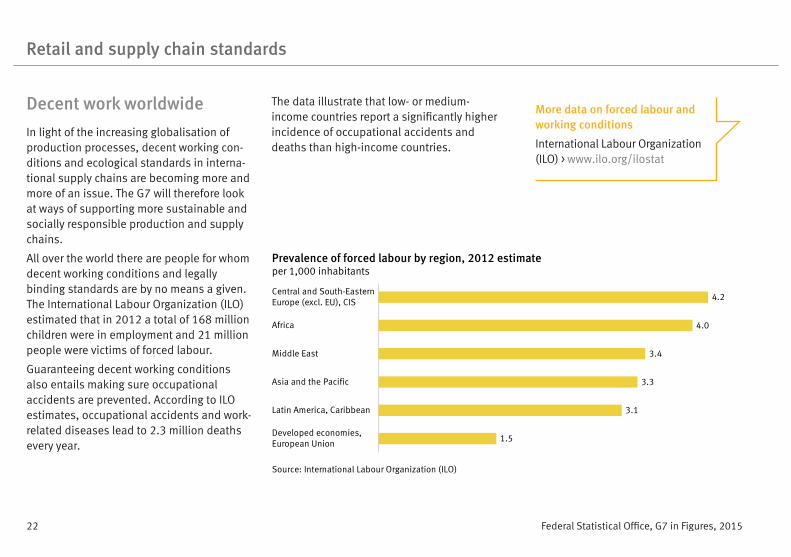
Decent work worldwide
In light of the increasing globalisation of production processes, decent working con-ditions and ecological standards in interna-tional supply chains are becoming more and more of an issue. The G7 will therefore look at ways of supporting more sustainable and socially responsible production and supply chains.
All over the world there are people for whom decent working conditions and legally binding standards are by no means a given. The International Labour Organization (ILO) estimated that in 2012 a total of 168 million children were in employment and 21 million people were victims of forced labour.
Guaranteeing decent working conditions also entails making sure occupational accidents are prevented. According to ILO estimates, occupational accidents and work-related diseases lead to 2.3 million deaths every year.
The data illustrate that low- or medium-income countries report a significantly higher incidence of occupational accidents and deaths than high-income countries.
More data on forced labour and working conditions
International Labour Organization (ILO) > www.ilo.org/ilostat
Prevalence of forced labour by region, 2012 estimateper 1,000 inhabitants
Central and South-EasternEurope (excl. EU), CIS
Africa
Middle East
Asia and the Pacific
Latin America, Caribbean
Developed economies,European Union
4.2
4.0
3.4
3.3
3.1
1.5
Source: International Labour Organization (ILO)
Federal Statistical Office, G7 in Figures, 2015 23
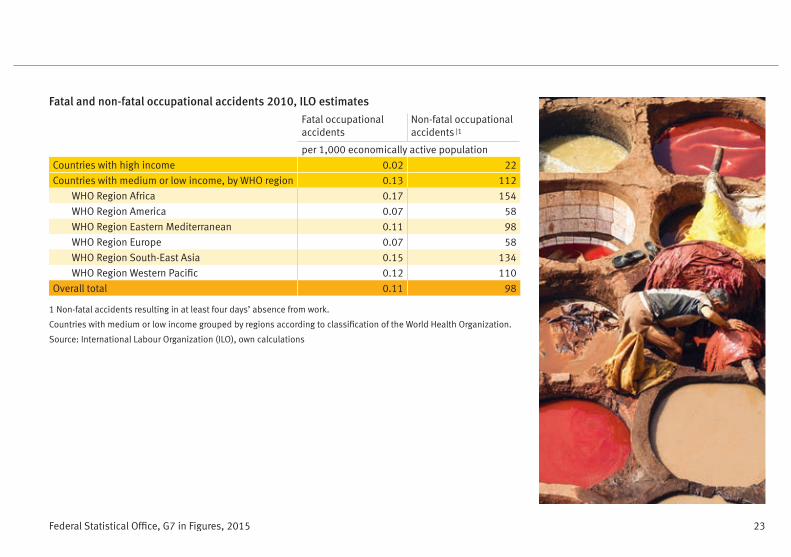
Fatal and non-fatal occupational accidents 2010, ILO estimates
Fatal occupational accidents
Non-fatal occupational accidents |1
per 1,000 economically active population
Countries with high income 0.02 22
Countries with medium or low income, by WHO region 0.13 112
WHO Region Africa 0.17 154
WHO Region America 0.07 58
WHO Region Eastern Mediterranean 0.11 98
WHO Region Europe 0.07 58
WHO Region South-East Asia 0.15 134
WHO Region Western Pacific 0.12 110
Overall total 0.11 98
1 Non-fatal accidents resulting in at least four days’ absence from work.
Countries with medium or low income grouped by regions according to classification of the World Health Organization.
Source: International Labour Organization (ILO), own calculations

Federal Statistical Office, G7 in Figures, 201524
Female self-employment
Empowering women
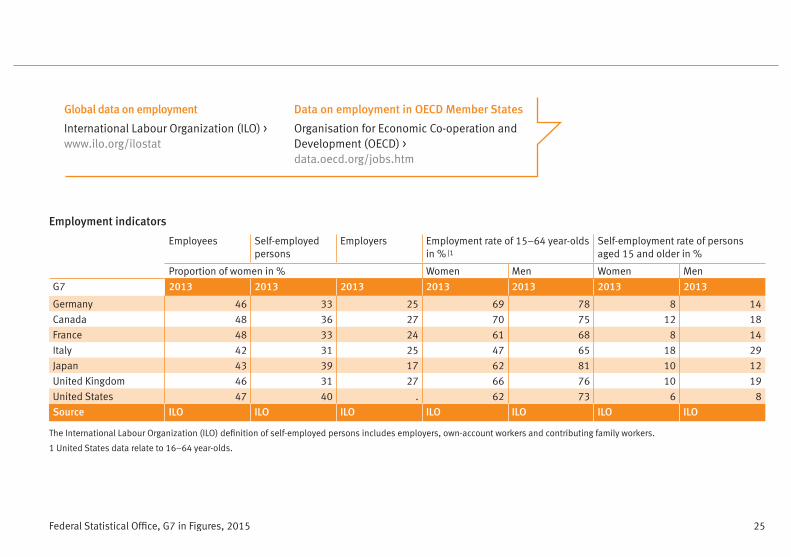
Striving for more gender equality and mak-ing more use of women’s potential on the labour market are measures which are not only beneficial for a country’s economy but also for society as a whole. The G7 summit will therefore discuss ways of supporting female self-employment and vocational training for girls and young women.
Data for the G7 countries published by the ILO show that men are more often self-employed than women and are more likely to run their own business. In most G7 countries, only 1 in 4 employers is female. In Japan, the ratio is even lower (17 %). The self-employment rate of women is below that of their male counterparts in all G7 states.
When comparing the self-employment rate from country to country, it is important to bear in mind that a higher ratio does not always indicate a higher degree of entrepre-neurialism, but can also stem from a higher level of employment in the agricultural sec-tor or from a lack of alternatives in terms of job opportunities.
Self-employment rate of women 2013% of female employed persons aged 15 and older, G7 states and selected G20 states
Republic of Korea
Brazil
Argentina
Italy
South Africa
Canada
Japan
United Kingdom
Germany
Australia
France
Russian Federation
United States
25
21
19
18
13
12
10
10
8
8
8
6
6
Source: International Labour Organization (ILO)
Federal Statistical Office, G7 in Figures, 2015 25
Global data on employment
International Labour Organization (ILO) > www.ilo.org/ilostat
Employment indicators
Employees Self-employed persons
Employers Employment rate of 15–64 year-olds in % |1
Self-employment rate of persons aged 15 and older in %
Proportion of women in % Women Men Women Men
G7 2013 2013 2013 2013 2013 2013 2013
Germany 46 33 25 69 78 8 14
Canada 48 36 27 70 75 12 18
France 48 33 24 61 68 8 14
Italy 42 31 25 47 65 18 29
Japan 43 39 17 62 81 10 12
United Kingdom 46 31 27 66 76 10 19
United States 47 40 . 62 73 6 8
Source ILO ILO ILO ILO ILO ILO ILO
The International Labour Organization (ILO) definition of self-employed persons includes employers, own-account workers and contributing family workers.
1 United States data relate to 16–64 year-olds.
Data on employment in OECD Member States
Organisation for Economic Co-operation and Development (OECD) >data.oecd.org/jobs.htm
Federal Statistical Office, G7 in Figures, 201526
Protection of the marine environment
Plastic waste and overfishing: Challenges facing the marine ecosystem
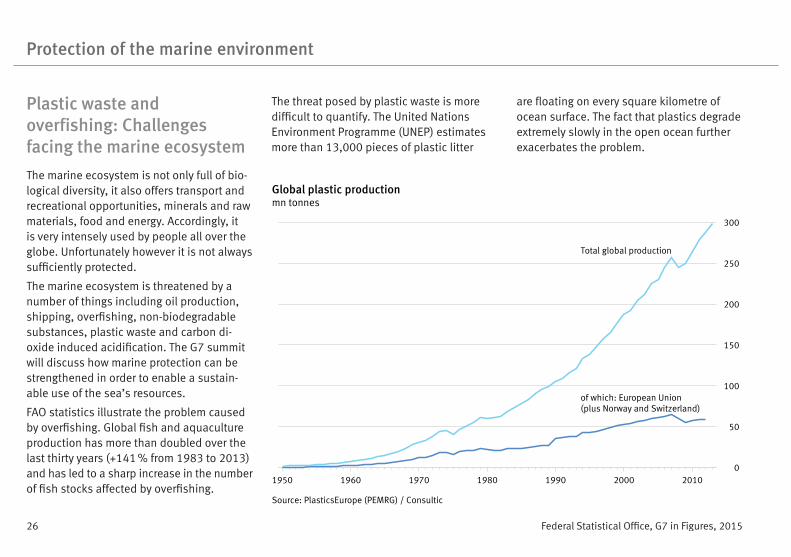
The marine ecosystem is not only full of bio-logical diversity, it also offers transport and recreational opportunities, minerals and raw materials, food and energy. Accordingly, it is very intensely used by people all over the globe. Unfortunately however it is not always sufficiently protected.
The marine ecosystem is threatened by a number of things including oil production, shipping, overfishing, non-biodegradable substances, plastic waste and carbon di-oxide induced acidification. The G7 summit will discuss how marine protection can be strengthened in order to enable a sustain-able use of the sea’s resources.
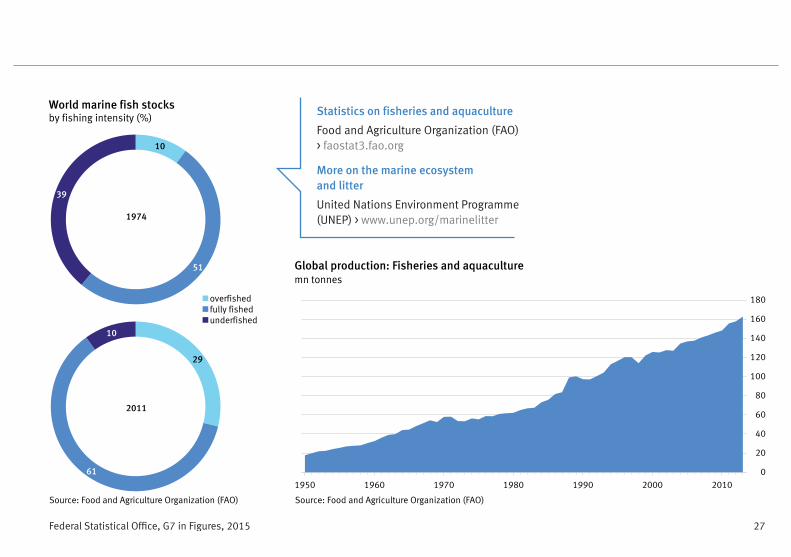
FAO statistics illustrate the problem caused by overfishing. Global fish and aquaculture production has more than doubled over the last thirty years (+141 % from 1983 to 2013) and has led to a sharp increase in the number of fish stocks affected by overfishing.
The threat posed by plastic waste is more difficult to quantify. The United Nations Environment Programme (UNEP) estimates more than 13,000 pieces of plastic litter
are floating on every square kilometre of ocean surface. The fact that plastics degrade extremely slowly in the open ocean further exacerbates the problem.
Global plastic productionmn tonnes
of which: European Union(plus Norway and Switzerland)
0
50
100
150
200
250
300
1950 1960 1970 1980 1990 2000 2010
Source: PlasticsEurope (PEMRG) / Consultic
Total global production
Federal Statistical Office, G7 in Figures, 2015 27
Statistics on fisheries and aquaculture
Food and Agriculture Organization (FAO) > faostat3.fao.org
More on the marine ecosystem and litter
United Nations Environment Programme (UNEP) > www.unep.org/marinelitter
World marine fish stocksby fishing intensity (%)
10
51
39
1974
overfishedfully fishedunderfished
29
61
10
2011
Source: Food and Agriculture Organization (FAO)
Global production: Fisheries and aquaculturemn tonnes
0
20
40
60
80
100
120
140
160
180
1950 1960 1970 1980 1990 2000 2010
Source: Food and Agriculture Organization (FAO)

Federal Statistical Office, G7 in Figures, 201528
Tropical diseases and antimicrobial resistance
Fighting neglected tropical diseases, reducing antimicrobial resistance
Antibiotics are essential to the treatment of numerous infectious diseases. However the global increase in antimicrobial resistance is hampering their efficacy. Both the intensive use of antibiotics in livestock farming and the continuous rise in goods and passenger transport are key contributing factors.
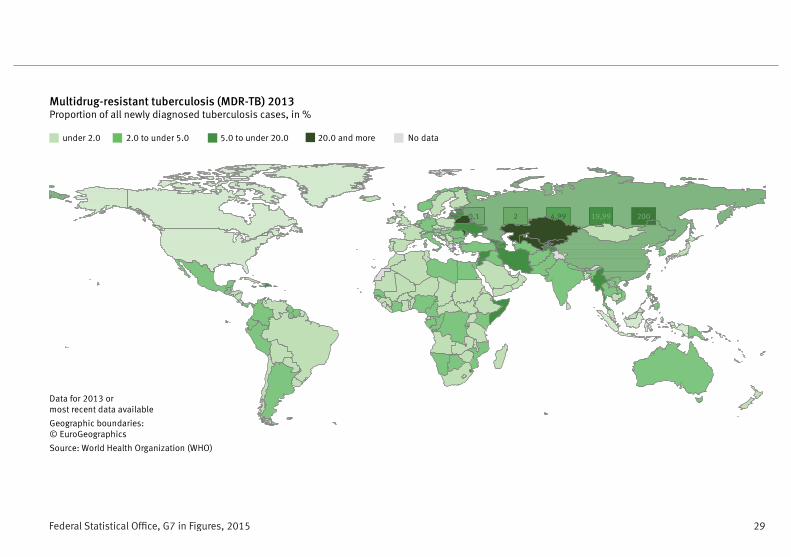
The increasing resistance leads to many problems, for example when treating dis-eases such as tuberculosis: According to the World Health Organization (WHO) there are now five countries, in which more than 20 % of newly diagnosed tuberculosis patients are faced with the problem of multidrug-resistance.
In addition to antimicrobial resistance, the G7 summit will also be addressing the issue of neglected tropical diseases (NTD).
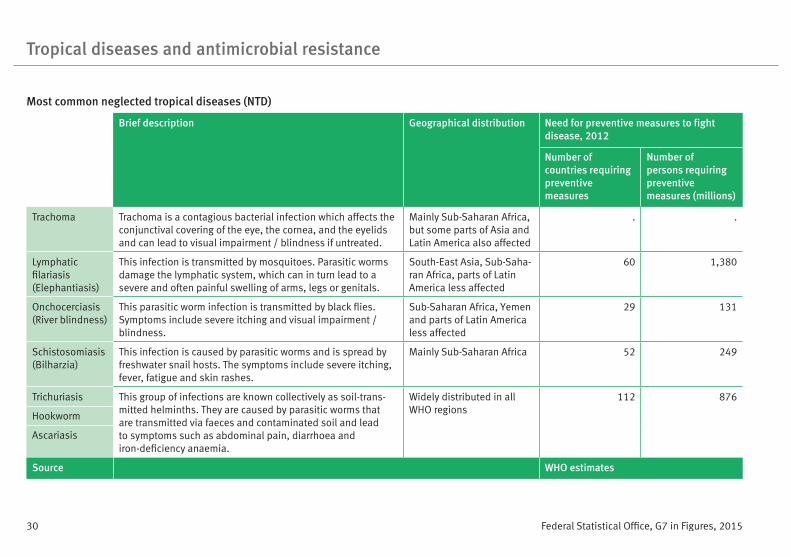
The table on page 30 offers an overview of the most common NTD.
In light of the recent Ebola epidemic in West Africa, the summit in Elmau will also look at ways of fighting this viral disease. Data on this topic are provided in the table above.
Data on neglected tropical diseases
World Health Organization (WHO) > apps.who.int/gho/data/node.main.A1629NTD
More on antimicrobial resistance
World Health Organization (WHO) > www.who.int/drugresistance
Current data on the Ebola epidemic
United Nations / WHO > ebolaresponse.un.org/data
Ebola: Number of cases and deaths in countries with intense transmission
confirmed probable suspected total
Guinea Cases 3,089 414 12 3,515
incl. deaths 1,919 414 . 2,333
Liberia Cases 3,151 1,879 4,832 9,862
incl. deaths . . . 4,408
Sierra Leone Cases 8,554 287 3,297 12,138
incl. deaths 3,465 208 158 3,831
Source: World Health Organization (WHO), cumulative data as of 05 April 2015
Federal Statistical Office, G7 in Figures, 2015 29
Multidrug-resistant tuberculosis (MDR-TB) 2013Proportion of all newly diagnosed tuberculosis cases, in %
under 2.0 2.0 to under 5.0 5.0 to under 20.0 20.0 and more
-0,1 2 4,99 19,99 200
No data
Source: World Health Organization (WHO)
Geographic boundaries:© EuroGeographics
Data for 2013 ormost recent data available
Federal Statistical Office, G7 in Figures, 201530
Tropical diseases and antimicrobial resistance
Most common neglected tropical diseases (NTD)
Brief description Geographical distribution Need for preventive measures to fight disease, 2012
Number of countries requiring preventive measures
Number of persons requiring preventive measures (millions)
Trachoma Trachoma is a contagious bacterial infection which affects the conjunctival covering of the eye, the cornea, and the eyelids and can lead to visual impairment / blindness if untreated.
Mainly Sub-Saharan Africa, but some parts of Asia and Latin America also affected
. .
Lymphatic filariasis (Elephantiasis)
This infection is transmitted by mosquitoes. Parasitic worms damage the lymphatic system, which can in turn lead to a severe and often painful swelling of arms, legs or genitals.
South-East Asia, Sub-Saha-ran Africa, parts of Latin America less affected
60 1,380
Onchocerciasis (River blindness)
This parasitic worm infection is transmitted by black flies. Symptoms include severe itching and visual impairment / blindness.
Sub-Saharan Africa, Yemen and parts of Latin America less affected
29 131
Schistosomiasis (Bilharzia)
This infection is caused by parasitic worms and is spread by freshwater snail hosts. The symptoms include severe itching, fever, fatigue and skin rashes.
Mainly Sub-Saharan Africa 52 249
Trichuriasis This group of infections are known collectively as soil-trans-mitted helminths. They are caused by parasitic worms that are transmitted via faeces and contaminated soil and lead to symptoms such as abdominal pain, diarrhoea and iron-deficiency anaemia.
Widely distributed in all WHO regions
112 876
Hookworm
Ascariasis
Source WHO estimates
Federal Statistical Office, G7 in Figures, 2015 31
Federal Statistical Office, G7 in Figures, 201532
Glossary
General
The Group of Twenty (G20) is an international forum of the world’s leading economies. Its main focus is the coordination of economic policy. The G20 includes all G7 countries, 12 other major economies and the European Union (EU28). Similar to the G7, the G20 does not have any official status as an international organisation and does not have an independent administrative infrastructure.
The Millennium Development Goals (MDG) were adopted by the United Nations in 2000. The UN Member States agreed upon eight development targets for the year 2015: 1. eradicate extreme hunger and poverty, 2. achieve universal primary education, 3. promote gender equality and em power women, 4. reduce child mortality, 5. improve maternal health, 6. combat HIV/AIDS, malaria and other diseases, 7. ensure environmental sustainability, 8. develop a global partnership for development. The United Nations is planning to adopt a new set of development goals in 2015 (Post-2015 Agenda).
The BRICS countries represent an association of five major emerging national economies. BRICS is an acronym referring to the member countries: Brazil, Russian Federation, India, China and South Africa. All BRICS countries are also members of the G20.
Population
The total fertility rate indicates how many children, on average, were born per woman in a particular year. It represents the fertility behaviour of women in a given calendar year. The total fertility rate is also interpreted as the average number of children a woman would have during her lifetime if she experienced the age-specific fertility rates observed in a given calendar year from age 16 to 50.
Population projections are based on certain assumptions regarding the development of major components of population change, such as fertility, mortality and migration, and show the changes in the size and age structure of the population within a specific time span. The United Nations publishes projections for all UN Member States and calculates a number of variants for each country.
Economy
The gross domestic product (GDP) is a measure of the economic performance of a national economy over a given period. It indicates the value of the goods and services produced in the economic territory (value added) unless used as inter- mediate consumption for the production of other goods and services. The rate of change of the price-adjusted GDP serves as a measure of econo-mic growth in a national economy.
The consumer price index for Germany measures the average price change for all goods and servi-ces purchased by households for consumption purposes. The percentage change of this index on the previous year is known as the inflation rate.
The general government net deficit / surplus represents the balance of state sector revenue and expenditure. The general government sector comprises central government, state government, local government, and social security funds.
The current account is a key component of a country’s balance of payments. The current ac-count balance represents the sum of net exports of goods and services, net primary income, and net secondary income. A current account surplus increases a nation’s net foreign assets by the amount of the surplus, and a current account deficit decreases it by that amount.
The international dollar (int. US$) is an artificial currency used by the World Bank and others to eliminate purchasing power differences when comparing national economies. The purchasing power of 1 int. US$ is equivalent to the purchasing power of 1 US$ in the United States.
Labour market
The employment rate represents the percentage of all persons of specified age and sex who are employed. According to the International Labour
Federal Statistical Office, G7 in Figures, 2015 33
Glossary
Organization (ILO) definition a person is consider-ed to be employed, if they are aged 15 or over and report that they have worked in gainful em-ployment (incl. self-employment) for at least one hour during the reference period or had a formal attachment to their job but were temporarily not at work during the reference period, for instance due to illness, holiday or parental leave.
The economically active population provides the supply of labour for economic production and is defined as all persons who, during a specified time, contribute to or are available to contribute to the production of economic goods and services. The economically active population is equal to the sum of employed and unemployed persons.
The unemployment rate represents the percen-tage of the economically active population that is unemployed. The unemployed comprise all persons (of specified age and sex) who were without work during the reference period, i.e. were not in paid employment or self-employment, but were available for self- or paid employment within a two week time period and had actively been seeking work during the last four weeks.
The self-employment rate represents the percen-tage of employed persons who are self-employed. Self-employed persons include own-account wor-kers, employers and contributing family workers.
Energy and climate change
Primary energy is an energy form found in nature that has not been subjected to any conversion or transformation process. The total primary energy supply corresponds to the sum of primary energy indigenous production and imports subtracting exports, international marine and aviation bun-kers and adjusting for stock changes.
The total final energy consumption is the energy supplied to the final consumer for all energy uses (households, enterprises, transport, agricul-ture etc.).
The indicator energy intensity is a measure of the energy efficiency of an economy. It is calculated by determining the ratio of an economy’s gross inland energy consumption and its gross domestic product.
Renewable energy sources are defined as sources which are naturally replenished within a short pe-riod of time. These include hydroelectric energy, wind and solar energy, ambient heat, biomass and geothermal energy.
The primary greenhouse gases include water vapour, ozone, carbon dioxide (CO2 ), methane (CH4 ), nitrous oxide (N2O), sulphur hexafluoride (SF6 ), hydrofluorocarbons (HFCs) and perfluoro-carbons (PFCs). The natural greenhouse gas con-centration in the atmosphere absorbs a significant
amount of the infrared radiation emitted from the Earth’s surface, thus providing an average surface temperature of approximately 15°C. The additio-nal emission of greenhouse gases due to human activity is slowly increasing the average tempera-ture and contributing to the process known as climate change.
A tonne of oil equivalent (toe) is a unit of energy. 1 kilogramme of oil equivalent (kg oe) equals 11.63 watt hours (Wh).
Health
The bacteria that cause tuberculosis (TB) can develop resistance to the antimicrobial drugs used to cure the disease. Multidrug-resistant tuberculosis (MDR-TB) is TB that does not respond to at least Isoniazid and Rifampicin, the two most powerful anti-TB drugs.
Neglected tropical diseases (NTD) are a diverse group of infections which are especially common in low-income populations in developing regions, such as Sub-Saharan Africa. The World Health Organization (WHO) has prioritized 17 NTD, which are endemic in more than 140 countries and affect more than 1.4 billion people worldwide. The group of NTD include viral diseases (e.g. Dengue fever), helminth infections (e.g. Onchocerciasis), bacterial infections (e.g. Trachoma) and protozoan infections (e.g. Chagas disease).
Federal Statistical Office, G7 in Figures, 201534
References: List of data sources
World Bank: World Development Indicatorsdatabank.worldbank.org
United Nations Department of Economic and Social Affairs (UN DESA): Population Divisionun.org/esa/population
International Monetary Fund: World Economic Outlook (IMF-WEO)imf.org/external/data.htm
International Labour Organization (ILO): ILOSTAT ilo.org/ilostat
Eurostat: Statistical Office of the European Union ec.europa.eu/eurostat
World Trade Organization (WTO): Statistics wto.org/statistics
International Energy Agency (IEA): Statistics iea.org/statistics
European Commission: Emissions Database for Global Atmospheric Research (EDGAR), Joint Research Centre (JRC) edgar.jrc.ec.europa.eu
World Health Organization (WHO): Global Health Observatory (GHO) who.int/gho/en
United Nations International Children’s Emergen-cy Fund (UNICEF): Statistics and Monitoring unicef.org/statistics
Food and Agriculture Organization of the United Nations (FAO): FAOSTATfaostat3.fao.org
Association of Plastics Manufacturers: PlasticsEuropewww.plasticseurope.org
More information about official international statistics
www.destatis.de/international_en
More information about the G7 summit
www.g7germany.de
Federal Statistical Office, G7 in Figures, 2015 35
Federal Statistical Office, G7 in Figures, 2015 Order number: 0000155-15900-1
www.destatis.de/G7EN www.destatis.de/international_en
www.g7germany.de
Central Information Service Written enquiries: www.destatis.de/contact Phone: + 49 (0)611 75 2405