Embed Size (px)
Citation preview

UN
ITED
NA
TIO
NS
ENVI
RON
MEN
T PR
OG
RAM
ME
GLOBAL TRENDS IN RENEWABLE
ENERGY INVESTMENT 2011
Analysis of Trends and Issues in the Financing of Renewable Energy

2 Global Trends in Renewable Energy Investment, 2011
Global new investment in renewable energy2004 - 2010 ($bn)
Source: Bloomberg New Energy FinanceNote: SDC = small distributed capacity. New investment volume adjusts for re-invested equity. Total values include estimates for undisclosed deals.
75% 57% 43% 23% 0.4% 32%
33
57
90
129
159 160
211
2004 2005 2006 2007 2008 2009 2010
Financial new investment SDC, corp RD&D, gov R&D
Growth:
Global Trendsin Renewable EnergyInvestment 2011

3 Global Trends in Renewable Energy Investment, 2011
Global transactions in renewable energy, 2010 ($bn)
Source: Bloomberg New Energy Finance; UNEP
Note: SDC = small distributed capacity. Total values include estimates for undisclosed deals. * data based on estimates from various industry sources.
+2 +3 +5 +3
+15 29 -6
+128
+60 211
+58 268
VC CorpRD&D
Totalinvestment
SDC*Assetfinance
GovR&D
Publicmarkets
new equity
M&A/B-O etc.
Total transactions
Re-invested
Totalcompany
investment
PE
Technology development
Equipment manufacturing/scale-up
Projects
Asset and company mergers, acquisitions, ref inancing, buy-outs etc.
Global Trendsin Renewable EnergyInvestment 2011

4 Global Trends in Renewable Energy Investment, 2011
Financial new investment in renewable energy:developed v developing countries, 2004-2010 ($bn)
Source: Bloomberg New Energy Finance; UNEP
Note: New investment volume adjusts for re-invested equity. Total values include estimates for undisclosed deals.
15
31
55
80 82
67 70
412
21
32
5155
72
2004 2005 2006 2007 2008 2009 2010
Developed Developing
Global Trendsin Renewable EnergyInvestment 2011

5 Global Trends in Renewable Energy Investment, 2011
Financial new investment and SDC in renewable energy by technology, 2010, and growth on 2009 ($bn)
Source: Bloomberg New Energy Finance; UNEP
Note: New investment volume adjusts for re-invested equity. Total values include estimates for undisclosed deals.
0.1
2
3
6
11
86
95
-44%
44%
-22%
-20%
-5%
52%
30%
Marine
Geothermal
Small hydro
Biofuels
Biomass & w-t-e
Solar
Wind
Growth:
*Small Distributed Capacity
Global Trendsin Renewable EnergyInvestment 2011

6 Global Trends in Renewable Energy Investment, 2011
VC/PE new investment in renewable energy by technology, 2010 ($bn)
Source: Bloomberg New Energy Finance; UNEP
Note: VC/PE new investment excludes PE buy-outs. Total values include estimates for undisclosed deals.
Solar2.2
Wind1.5
Biofuels0.7
Small hydro0.5
Biomass & w-t-e0.4
Geothermal0.1
Marine0.1
Global Trendsin Renewable EnergyInvestment 2011

7 Global Trends in Renewable Energy Investment, 2011
Public markets new investment in renewable energy by technology, 2010 ($bn)
Source: Bloomberg New Energy Finance; UNEP
Wind8.2Solar
5.3
Biofuels0.8
Small hydro0.5
Biomass & w-t-e0.4 Geothermal, 0.1
Marine, 0.01
Global Trendsin Renewable EnergyInvestment 2011

8 Global Trends in Renewable Energy Investment, 2011
Asset finance of new-build renewable energy assets by technology, 2010 ($bn)
Source: Bloomberg New Energy Finance; UNEP
Note: Total values include estimates for undisclosed deals.
Wind89.7
Solar18.9
Biomass & w-t-e10.2
Biofuels, 4.7
Small hydro2.3 Geothermal, 2.0
Marine, 0.04
Global Trendsin Renewable EnergyInvestment 2011

9 Global Trends in Renewable Energy Investment, 2011
Global financial new investment in renewable energy quarterly trend, Q1 2004-Q1 2011 ($bn)
Source: Bloomberg New Energy Finance; UNEP
Note: New investment volume adjusts for re-invested equity. Total values include estimates for undisclosed deals
54 5 6
910 9
14 13
1917
27
21 22
28
41
27
3835
33
19
35 34 34 32 3135
44
31
Q1 04
Q2 04
Q3 04
Q4 04
Q1 05
Q2 05
Q3 05
Q4 05
Q1 06
Q2 06
Q3 06
Q4 06
Q1 07
Q2 07
Q3 07
Q4 07
Q1 08
Q2 08
Q3 08
Q4 08
Q1 09
Q2 09
Q3 09
Q4 09
Q1 10
Q2 10
Q3 10
Q4 10
Q1 11
4Q running average
Global Trendsin Renewable EnergyInvestment 2011

10 Global Trends in Renewable Energy Investment, 2011
Financial new investment in renewable energy by region, 2004-2010 ($bn)
Source: Bloomberg New Energy Finance; UNEP
Note: New investment volume adjusts for re-invested equity. Total values include estimates for undisclosed deals. This comparison does not include small-scale projects.
Global Trendsin Renewable EnergyInvestment 2011

11 Global Trends in Renewable Energy Investment, 2011
Renewable power generation and capacity as a proportion of global power, 2004-2010 (%)
Source: Bloomberg New Energy Finance, EIA, IEA,
Note: Renewable power excludes large hydro. Renewable capacity figures based on Bloomberg New Energy Finance global totals.
10.2%
14.8% 13.4%
16.2%
25.9%
34.1% 34.2%
3.5%
7.9%
17.3%
29.4% 29.9%
4.3% 4.6% 5.0% 5.4%6.1%
7.1%8.1%
3.5% 3.6% 3.8% 4.0%4.7%
5.4%
0%
5%
10%
15%
20%
25%
30%
35%
2004 2005 2006 2007 2008 2009 2010
Renewable power capacity change as a % of global power capacity change (net)
Renewable power generation change as a % of global power generation change (net)
Renewable power as a % of global power capacity
Renewable power as a % of global power generation
Global Trendsin Renewable EnergyInvestment 2011

12 Global Trends in Renewable Energy Investment, 2011
VC/PE new investment in renewable energy by stage, 2004 – 2010 ($bn)
Source: Bloomberg New Energy Finance; UNEP
Note: Buy-outs are not included as new investment. Total values include estimates for undisclosed deals.
90% 217% 16% 88% -51% 19%
0.71.4
4.35.0
9.5
4.65.5
2004 2005 2006 2007 2008 2009 2010
PE expansion capital
VC late stage
VC early stage
Growth:
Global Trendsin Renewable EnergyInvestment 2011

13 Global Trends in Renewable Energy Investment, 2011
Public market new investment in renewable energy by stage, 2004-2010 ($bn)
Source: Bloomberg New Energy Finance; UNEP
0.4
4.0
11.0
22.0
12.8 12.5
15.4
2004 2005 2006 2007 2008 2009 2010
OTC
Convertible & Other
Secondary & PIPE
IPO
Global Trendsin Renewable EnergyInvestment 2011
14 Global Trends in Renewable Energy Investment, 2011
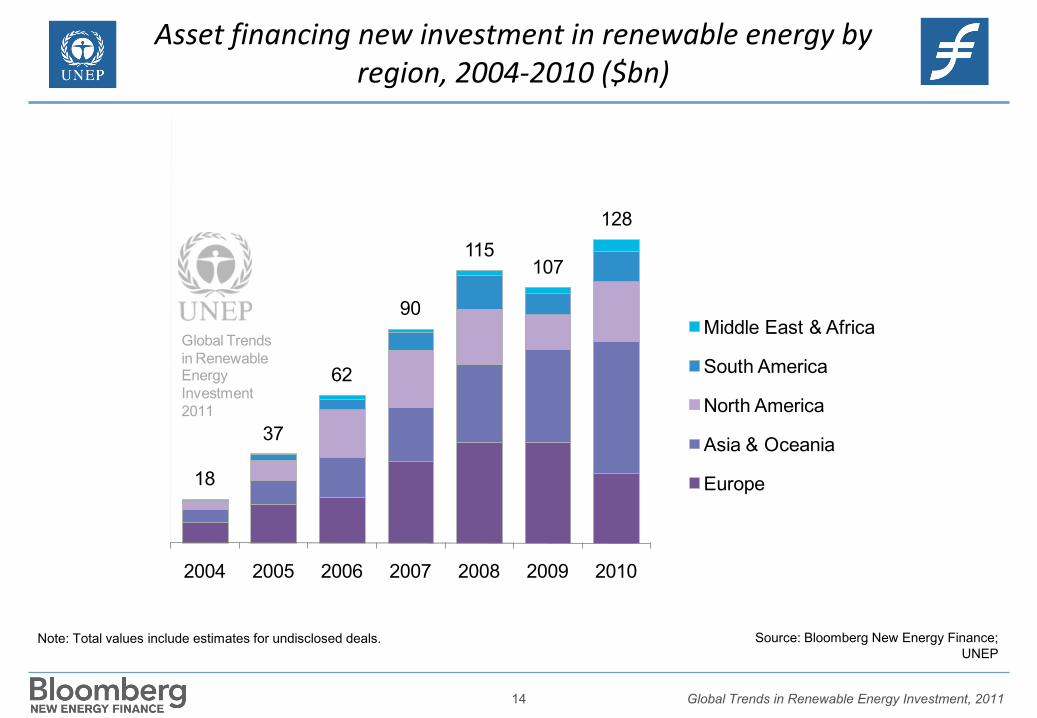
Asset financing new investment in renewable energy by region, 2004-2010 ($bn)
Source: Bloomberg New Energy Finance; UNEP
Note: Total values include estimates for undisclosed deals.
18
37
62
90
115107
128
2004 2005 2006 2007 2008 2009 2010
Middle East & Africa
South America
North America
Asia & Oceania
Europe
Global Trendsin Renewable EnergyInvestment 2011

15 Global Trends in Renewable Energy Investment, 2011
Asset financing new investment in renewable energy by sector, 2004-2010 ($bn)
Source: Bloomberg New Energy Finance; UNEP
Note: Total values include estimates for undisclosed deals.
18
37
62
90
115107
128
2004 2005 2006 2007 2008 2009 2010
Marine
Geothermal
Small hydro
Biomass & w-t-e
Biofuels
Solar
Wind
Global Trendsin Renewable EnergyInvestment 2011
16 Global Trends in Renewable Energy Investment, 2011
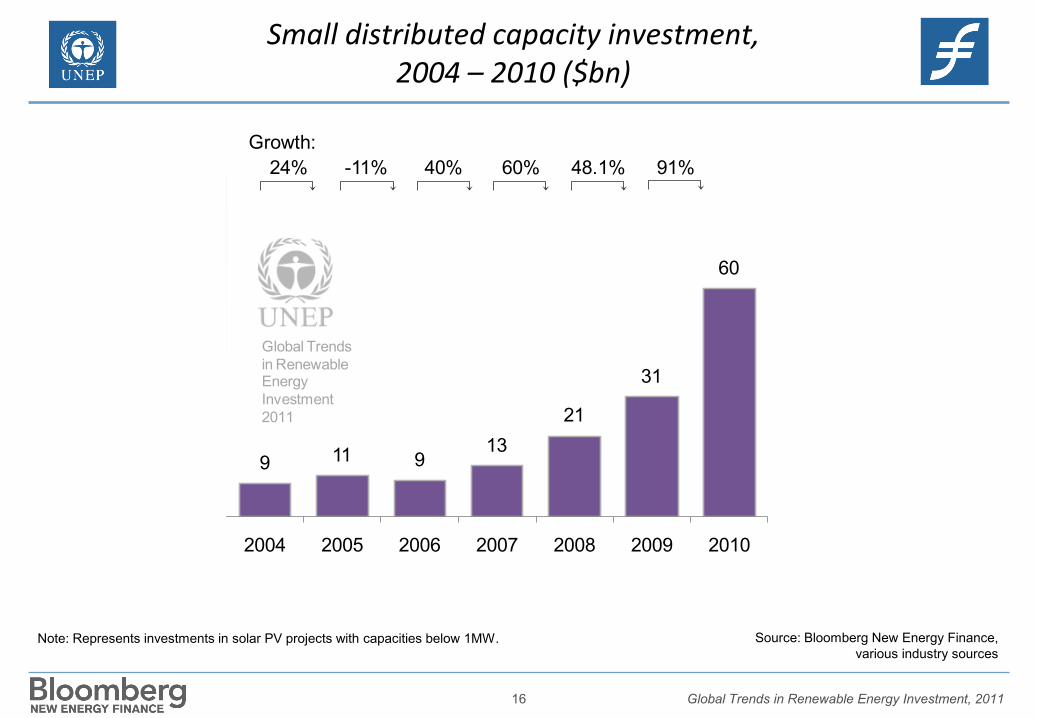
Small distributed capacity investment,2004 – 2010 ($bn)
Source: Bloomberg New Energy Finance,various industry sources
Note: Represents investments in solar PV projects with capacities below 1MW.
9 11 913
21
31
60
24% -11% 40% 60% 48.1% 91%
2004 2005 2006 2007 2008 2009 2010
Growth:
Global Trendsin Renewable EnergyInvestment 2011

17 Global Trends in Renewable Energy Investment, 2011
Acquisition transactions in renewable energy by type,2010 ($bn)
Source: Bloomberg New Energy FinanceNote: Total values include estimates for undisclosed deals.
9
26
35
5765 66
58
2004 2005 2006 2007 2008 2009 2010
PE buy-outs
Public market investor exits
Corporate M&A
Asset acquisitions & refinancing
Global Trendsin Renewable EnergyInvestment 2011

For more information, contact:
Frankfurt School – the UNEPCollaborating Centre for Climate &Sustainable Energy FinanceFrankfurt School of Finance & ManagementSonnemannstrasse 9-1 160314 Frankfurt/ MainGermanyTel: +49 69 154008-0E-mail: [email protected]/energy/financewww.fs-unep-centre.org
Bloomberg New Energy FinanceBloomberg LPCity Gate House39-45 Finsbury SquareLondon EC2A 1PQemail: [email protected]
Frankfurt SchoolUNEP Collaborating Centrefor Climate & Sustainable Energy Finance