Embed Size (px)
Citation preview
UNITED NATIONS EP
UNEP/EA.4/22
United Nations Environment Assembly of the United Nations Environment Programme
Distr.: General 21 January 2019
Original: English
United Nations Environment Assembly of the United Nations Environment ProgrammeFourth sessionNairobi, 11–15 March 2019Item 6 of the provisional agenda*
Programme of work and budget, and other administrative and budgetary issues
Global Resources Outlook 2019: Natural Resources for the Future We Want: summary for policymakers
Note by the secretariat
SummaryThe secretariat has the honour to present, set out in the annex to the present note, the summary
for policymakers of the report of the International Resource Panel entitled Global Resources Outlook 2019: Natural Resources for the Future We Want. The report was prepared in response to resolution 2/8 of the United Nations Environment Assembly of the United Nations Environment Programme, on sustainable consumption and production, in which the Environment Assembly invited the International Resource Panel to make available reports relevant to the resolution, including on the state, trends and outlook of sustainable consumption and production, to a future meeting of the Environment Assembly, but not later than 2019. The International Resource Panel report Assessing Global Resource Use: A Systems Approach to Resource Efficiency and Pollution Reduction was submitted to the Environment Assembly at its third session as an initial response to resolution 2/8. The Assembly welcomed that report in its resolution 3/4, on environment and health, in which it also welcomed further work by the Panel on the status and trends of natural resource use and management and their links with pollution and other environmental impacts, as well as on the identification of options for enhancing sustainable management of natural resources, and encouraged the Panel to make available reports to be considered, as relevant, at the sessions of the Environment Assembly.
The summary and the full report will be made available via the Official Document System of the United Nations and the UNEP website. In March 2019 both documents will also be made available at www.resourcepanel.org/reports/global-resources-outlook-2019.
** UNEP/EA.4/1/Rev.1.
K1804016 150219
UNEP/EA.4/22
Annex*
Global Resources Outlook 2019: Natural Resources for the Future We Want
Summary for policymakers
Produced by the International Resource Panel
This document highlights key findings from the report Global Resources Outlook 2019: Natural Resources for the Future We Want, and should be read in conjunction with the full report.
** The present annex has not been edited by the Division of Conference Services of the United Nations Office at Nairobi.
2
UNEP/EA.4/22
ForewordGlobal gross domestic product has doubled since 1970, enabling immense progress, and lifting of billions of people out of poverty. At the same time, this economic growth has been fueled by a relentless demand for natural resources. At no point in time nor at any level of income, has our demand for natural resources wavered.
Our consume and throwaway models of consumption have had devastating impacts on our planet. This report finds that 90 per cent of biodiversity loss and water stress are caused by resource extraction and processing. These same activities contribute to about half of global greenhouse gas emissions.
Moreover, the benefits of this type of resource use remain limited to but a few. Inequalities in the material footprint of countries, i.e. in the quantity of materials that must be mobilized globally to meet the consumption of an individual country, are stark. High-income countries maintain levels of per capita material footprint consumption that are 60 per cent higher than upper-middle income countries and more than thirteen times the level of the low-income countries.
Economic growth which comes at the expense of our planet is simply not sustainable. Our challenge is to meet the needs of all people within the means of our planet. Realizing this ambitious but critical vision calls on governments, business, civil society and people to reshape what we understand by progress and innovate to change people’s choices, lifestyles and behaviours.
Through a combination of resource efficiency, climate mitigation, carbon removal, and biodiversity protection policies, this report finds that it is feasible and possible to grow our economies, increase our wellbeing and remain within our planetary boundaries. But action must begin now. While the report highlights some progress, it is clear that much more needs to be done.
Scientific findings such as those by the International Resource Panel and other global assessments, presented at the 2019 United Nations Environment Assembly, provide us an opportunity to take a close look at the global use of natural resources and importantly, identify action that can have the maximum impact on our planet and ensure we sustainability manage natural resources for generations to come.
Joyce Msuya Acting Executive Director
UN Environment
3

UNEP/EA.4/22
PrefaceFor over 10 years, the International Resource Panel has provided scientific assessments of the trends in, patterns in and impacts of the way societies and economies extract, use and dispose of natural resources. This research has shown that the way in which we use natural resources has profound implications for the health and wellbeing of people and the planet, now and for future generations. Not only is the sustainable management of natural resources critical to achieving the Sustainable Development Goals, but also, the International Resource Panel findings point to its essential ties to international aspirations on climate, biodiversity and land degradation neutrality.
The Global Resources Outlook 2019 builds on this body of evidence to present the story of natural resources as they move through our economies and societies. It is a story of relentless demand and of unsustainable patterns of industrialization and development. Over the last 50 years, material extraction has tripled, with the rate of extraction accelerating since the year 2000. Newly industrializing economies are increasingly responsible for a growing share of material extraction, a situation largely due to the building of new infrastructure. Virtually none of the massive growth in materials consumption in the new millennium has taken place in the wealthiest countries; however, not much of it has taken place in the poorest countries either, which make up the group in the most urgent need of higher material living standards.
This is the story of the unequal distribution of the benefits of resource use and its increasingly global and severe impacts on human well-being and ecosystem health. While extraction and consumption are growing in upper-middle-income countries, high-income countries continue to outsource resource-intensive production. An average person living in a high-income country consumes 60 per cent more than someone in an upper-middle-income country and over 13 times what is consumed by someone in a low-income country. Overall, the extraction and processing of natural resources account for more than 90 per cent of global biodiversity loss and water stress impacts and for approximately half of global greenhouse gas emissions.
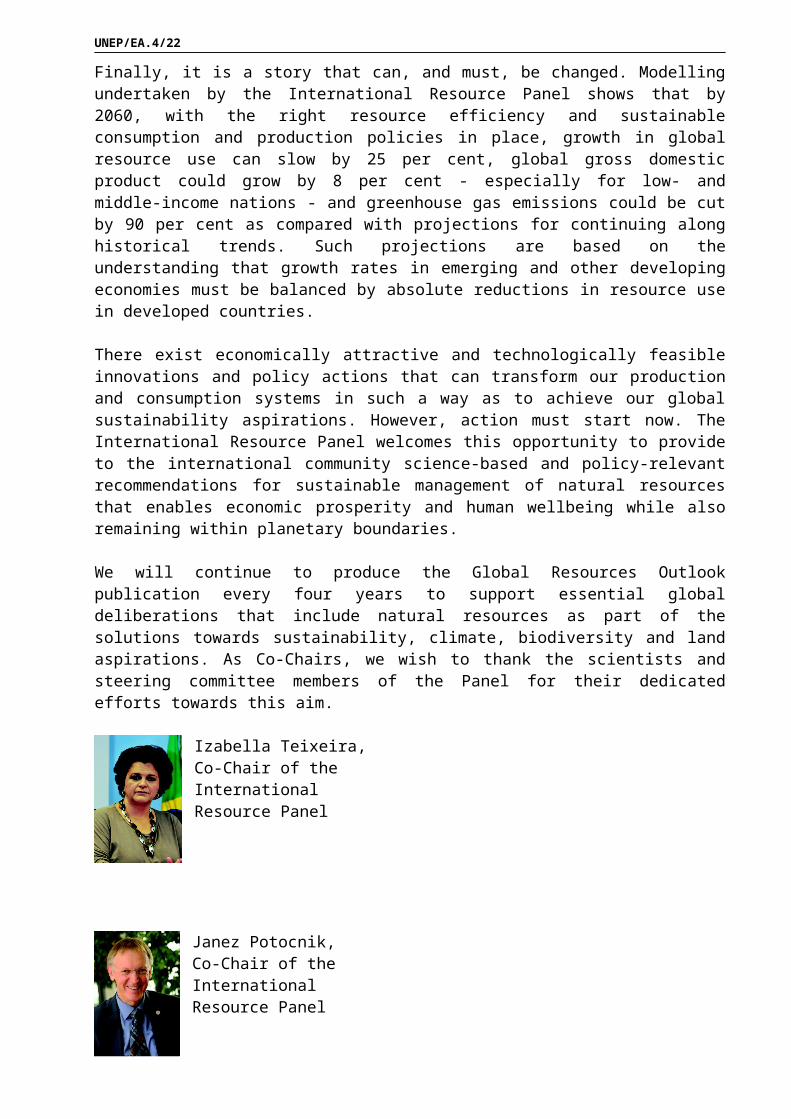
Finally, it is a story that can, and must, be changed. Modelling undertaken by the International Resource Panel shows that by 2060, with the right resource efficiency and sustainable consumption and production policies in place, growth in global resource use can slow by 25 per cent, global gross domestic product could grow by 8 per cent - especially for low- and middle-income nations - and greenhouse gas emissions could be cut by 90 per cent as compared with projections for continuing along historical trends. Such projections are based on the understanding that growth rates in emerging and other developing economies must be balanced by absolute reductions in resource use in developed countries.
There exist economically attractive and technologically feasible innovations and policy actions that can transform our production and consumption systems in such a way as to achieve our global sustainability aspirations.
4
UNEP/EA.4/22
However, action must start now. The International Resource Panel welcomes this opportunity to provide to the international community science-based and policy-relevant recommendations for sustainable management of natural resources that enables economic prosperity and human wellbeing while also remaining within planetary boundaries.
We will continue to produce the Global Resources Outlook publication every four years to support essential global deliberations that include natural resources as part of the solutions towards sustainability, climate, biodiversity and land aspirations. As Co-Chairs, we wish to thank the scientists and steering committee members of the Panel for their dedicated efforts towards this aim.
Izabella Teixeira, Co-Chair of the International Resource Panel
Janez Potocnik, Co-Chair of the International Resource Panel
5

UNEP/EA.4/22
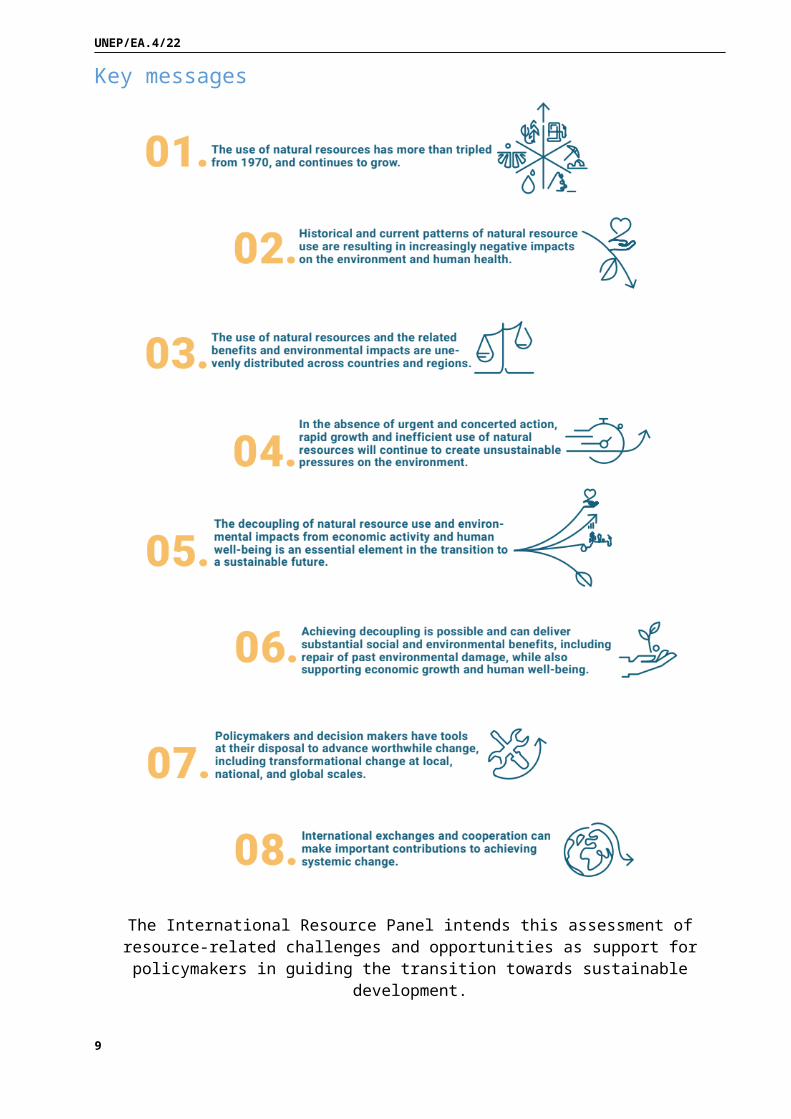
Key messages
The International Resource Panel intends this assessment of resource-related challenges and opportunities as support for policymakers in guiding the
transition towards sustainable development.
6
ADVANCE
UNEP/EA.4/22
One: Resources and the future we want 1. Over the past five decades, our global population has doubled, the
extraction of materials has tripled and gross domestic product has quadrupled. The extraction and processing of natural resources has accelerated over the last two decades, and accounts for more than 90 per cent of our biodiversity loss and water stress and approximately half of our climate change impacts. Over these last 50 years we have not once experienced a prolonged period of stabilization or a decline in global material demand.
2. The Sustainable Development Goals provide the framework for changing this situation through the implementation of sustainable consumption and production, and by the improvement in resource efficiency through the decoupling of environmental impacts from economic growth.
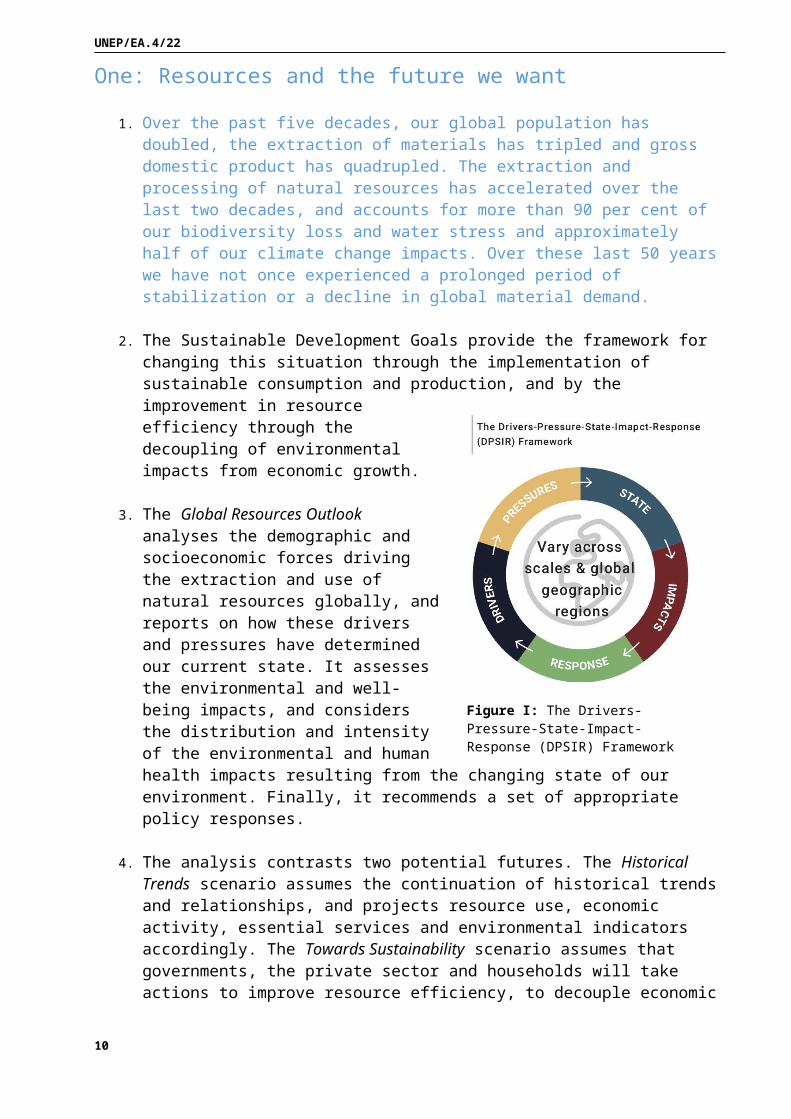
3. The Global Resources Outlook analyses the demographic and socioeconomic forces driving the extraction and use of natural resources globally, and reports on how these drivers and pressures have determined our current state. It assesses the environmental and well-being impacts, and considers the distribution and intensity of the environmental and human health impacts resulting from the changing state of our environment. Finally, it recommends a set of appropriate policy responses.
4. The analysis contrasts two potential futures. The Historical Trends scenario assumes the continuation of historical trends and relationships, and projects resource use, economic activity, essential services and environmental indicators accordingly. The Towards Sustainability scenario assumes that governments, the private sector and households will take actions to improve resource efficiency, to decouple economic growth from negative environmental impacts and to promote sustainable consumption and production.
5. The results illustrate that in order to realize our international goals – such as the Paris Agreement, the Aichi targets of the Convention on Biological Diversity, Land Degradation Neutrality of the Convention to Combat Desertification and the Sustainable Development Goals – while staying within the planetary boundaries, we need an urgent and systemic transformation of how we use and manage natural resources. All countries are urged to consider innovative solutions to address the environmental challenges associated with natural resource use and
7
Figure I: The Drivers-Pressure-State-Impact-Response (DPSIR) Framework used in the report
ADVANCE
UNEP/EA.4/22
more sustainable methods of consumption and production to resource the future we want.
Relentless demand
6. Current patterns of linear economic activity depend on a permanent throughput of materials that are extracted, traded and processed into goods, and finally disposed of as waste or emissions. From 1970 to 2017, the annual global extraction of materials grew from 27 billion tonnes to 92 billion tonnes, tripling in that time and continuing to grow. Since 2000, growth in extraction rates have accelerated to 3.2 per cent per annum, driven largely by major investments in infrastructure and higher material living standards in developing and transitioning countries, especially in Asia.1
7. Our use of natural resources has increased across the board:
a. Metals. The 2.7 per cent per year growth in the use of metal ores since 1970 reflects the importance of metals in construction, infrastructure, manufacturing and consumer goods.
b. Non-metallic minerals. Sand, gravel and clay account for most of the use of non-metallic minerals. The increased use from 9 billion tonnes to 44 billion tonnes from 1970 to 2017 represents a large shift in global extraction from biomass to minerals.
c. Fossil fuels. The use of coal, petroleum and natural gas increased from 6 billion tonnes in 1970 to 15 billion tonnes in 2017, but the share of total global extraction decreased from 23 per cent to 16 per cent.
d. Biomass. The total tonnage of biomass demand increased from 9 billion tonnes to 24 billion tonnes between 1970 and 2017, largely in the categories of crop harvest and grazing.
e. Water. Global water withdrawals for agriculture, industries and municipalities grew at a faster rate than human population in the second half of the twentieth century. From 1970 to 2010, the growth rate of withdrawals slowed, but still grew from 2,500 km3 per year to 3,900 km3 per year. Between 2000 and 2012, 70 per cent of global water withdrawals were used for agriculture – mainly for irrigation – while industries withdrew 19 per cent and municipalities 11 per cent.2
1 Schandl, H. and J. West, 2010: Resource use and resource efficiency in the Asia-Pacific region. Global Environmental Change-Human and Policy Dimensions20(4): 636-647
2 Food and Agriculture Organization, 2016: AQUASTAT website. Food and Agriculture Organization of the United Nations (FAO). Retrieved from http://www.fao.org/nr/water/aquastat/data/query/index.html?lang=en
8
ADVANCE
UNEP/EA.4/22
f. Land. Between 2000 and 2010 total global cropland area increased from 15.2 million km² to 15.4 million km². Cropland area declined in Europe and North America, but increased in Africa, Latin America and Asia. Global pasture area decreased from 31.3 million km² to 30.9 million km². Africa and Latin America experienced slight net forest losses while the other world regions had slight net increases.
Material productivity
8. The transition in the material composition of the global economy towards minerals and non-renewables has changed the nature of our major environmental pressures. Changing production and consumption patterns are also at play in the increasing use of resources. Improvements in material productivity – the efficiency of material use – helps reduce environmental pressure and impacts, but has grown much more slowly than labour and energy productivity. Global material productivity started to decline around 2000, and has stagnated in recent years. Material productivity has improved rapidly in many developed countries, but the simultaneous shift in global production away from economies that have higher material productivity to economies that have a lower material productivity kept the global material efficiency from improving as rapidly.
9. The global economy has focused on improvements in labour productivity at the cost of material and energy productivity. This was justifiable in a world where labour was the limiting factor of production. We have moved into a full world where natural resources and environmental impacts have become the limiting factor of production and shifts are required to focus on resource productivity.
9
ADVANCE
UNEP/EA.4/22
Two: Unequal use, impacts and burdens10. Historical and current patterns of natural resource use are resulting in
increasingly negative impacts on the environment and human health. Resource extraction and processing to materials, fuels, and food make up about half of the total global greenhouse gas emissions (disregarding climate impacts related to land use) and more than 90 per cent of biodiversity loss and water stress. The use of natural resources and the related benefits and environmental impacts are unevenly distributed across countries and regions.
11. These results illustrate that resources need to be put at the centre of climate and biodiversity policies, so as to stay within the safe operating space and enable the achievement of common international targets.
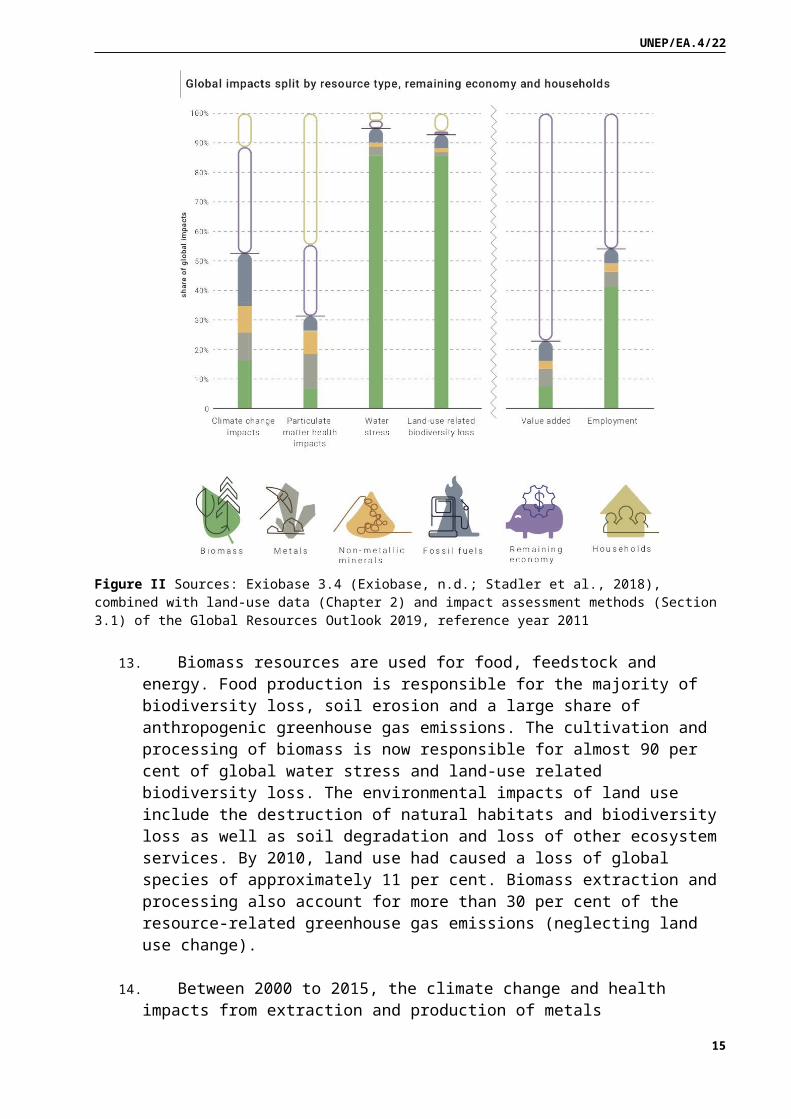
12. Agriculture, and especially household food consumption, is the main driver of global biodiversity loss and water stress. This contrasts with climate change and health impacts from particulate matter, for which all types of resources carry a significant share of the overall impacts.
Figure II Sources: Exiobase 3.4 (Exiobase, n.d.; Stadler et al., 2018), combined with land-use data (Chapter 2) and impact assessment methods (Section 3.1) of the Global Resources Outlook 2019, reference year 2011
10
ADVANCE
UNEP/EA.4/22
13. Biomass resources are used for food, feedstock and energy. Food production is responsible for the majority of biodiversity loss, soil erosion and a large share of anthropogenic greenhouse gas emissions. The cultivation and processing of biomass is now responsible for almost 90 per cent of global water stress and land-use related biodiversity loss. The environmental impacts of land use include the destruction of natural habitats and biodiversity loss as well as soil degradation and loss of other ecosystem services. By 2010, land use had caused a loss of global species of approximately 11 per cent. Biomass extraction and processing also account for more than 30 per cent of the resource-related greenhouse gas emissions (neglecting land use change).
14. Between 2000 to 2015, the climate change and health impacts from extraction and production of metals approximately doubled. Among metals, the global iron-steel production chain causes the largest climate change impacts and represents around one quarter of global industrial energy demand. Due to considerable production amounts and high energy requirements, aluminium production is also a significant contributor to the climate change impacts of metals, while for copper and precious metals, toxicity impacts are the major concern.
15. Although non-metallic mineral resource extraction makes up more than 45 per cent of the total mass of extracted resources and displays one of the highest growth rates of all resource groups, its contribution in terms of impacts to climate change and other impact categories remains limited. Most impacts related to non-metallic minerals occur in the processing stage, and the production of clinker – the main ingredient in cement – is responsible for the greatest share of climate change impacts and a substantial share of the other impacts. Nonetheless, mining and, in particular, mining for sand, may have critical impacts on local ecosystems
16. Coal, oil and natural gas provide energy and the raw material for pharmaceuticals, plastics, paints and many more products. Extraction, processing, distribution and use all contribute considerably to environmental pollution and especially air pollution. The final use phase of fossil fuels play a crucial role in their overall environment and health impacts. A more than 70 per cent increase in capacity for global fossil fuel electricity generation in recent years has increased access to affordable energy but with environmental and health trade-offs. The high capital costs and long lifetimes of power plants can lock in environmentally harmful technologies.
11

ADVANCE
UNEP/EA.4/22
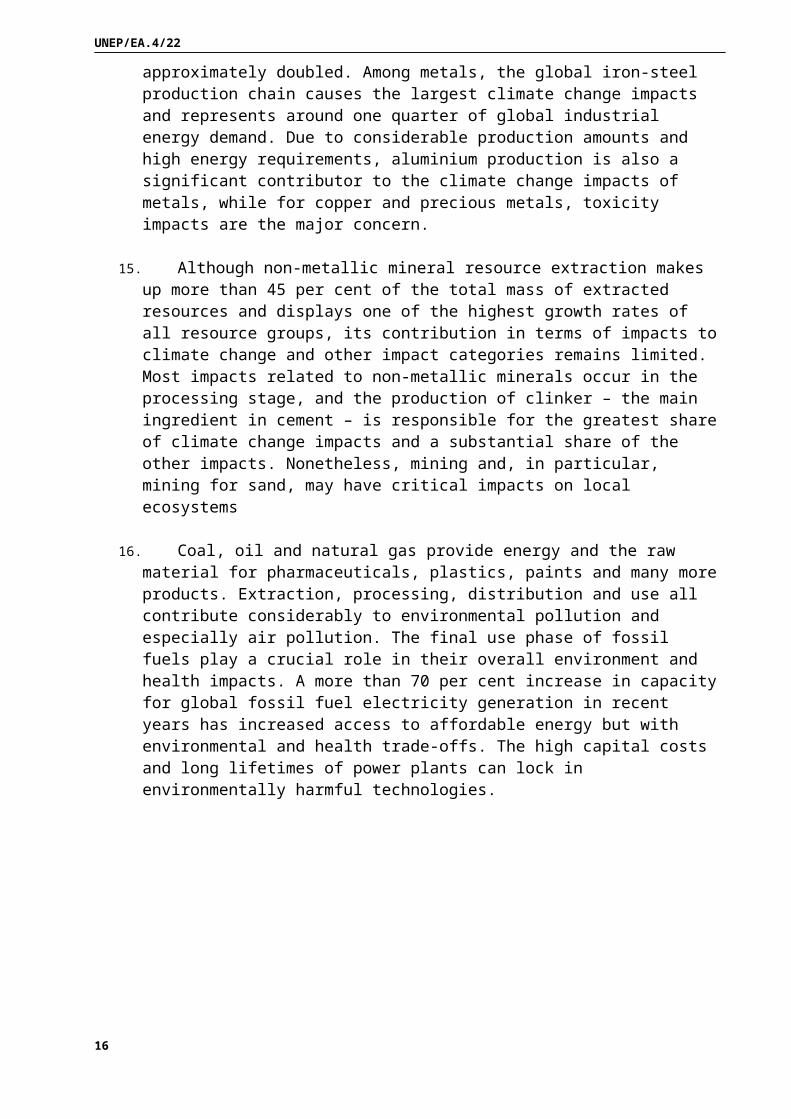
Figure III Source: Exiobase 3.4 (Exiobase, n.d.; Stadler et al., 2018).
17. Globally, resource-related climate change impacts associated with consumption are converging, with high-impact regions lowering their per capita impacts as low-impact regions were increasing theirs. The per capita impacts show that some regions consistently cause above average impacts through consumption while other regions – particularly Africa – have only minor per capita consumption-related environmental impacts.
18. Climate change impacts have been increasing, due to private consumption in most regions, though strongly driven by the buildup of infrastructure in the Asia and the Pacific region. This long-term
12
ADVANCE
UNEP/EA.4/22
investment in infrastructure is a likely path for many developing countries as they invest in their futures. Balancing the impacts of resource use against the development of infrastructure will likely require policy interventions. Advances in materials combined with innovative production methods and technologies such as digital fabrication and construction can help to balance the impacts of resource use against the development of infrastructure. Strategic intensification3 as part of urban design strategies can reduce material demand by establishing well networked connection nodes across cities, densifying cities and providing services to citizens at short distances thereby reducing mobility demand.
Consumption and income
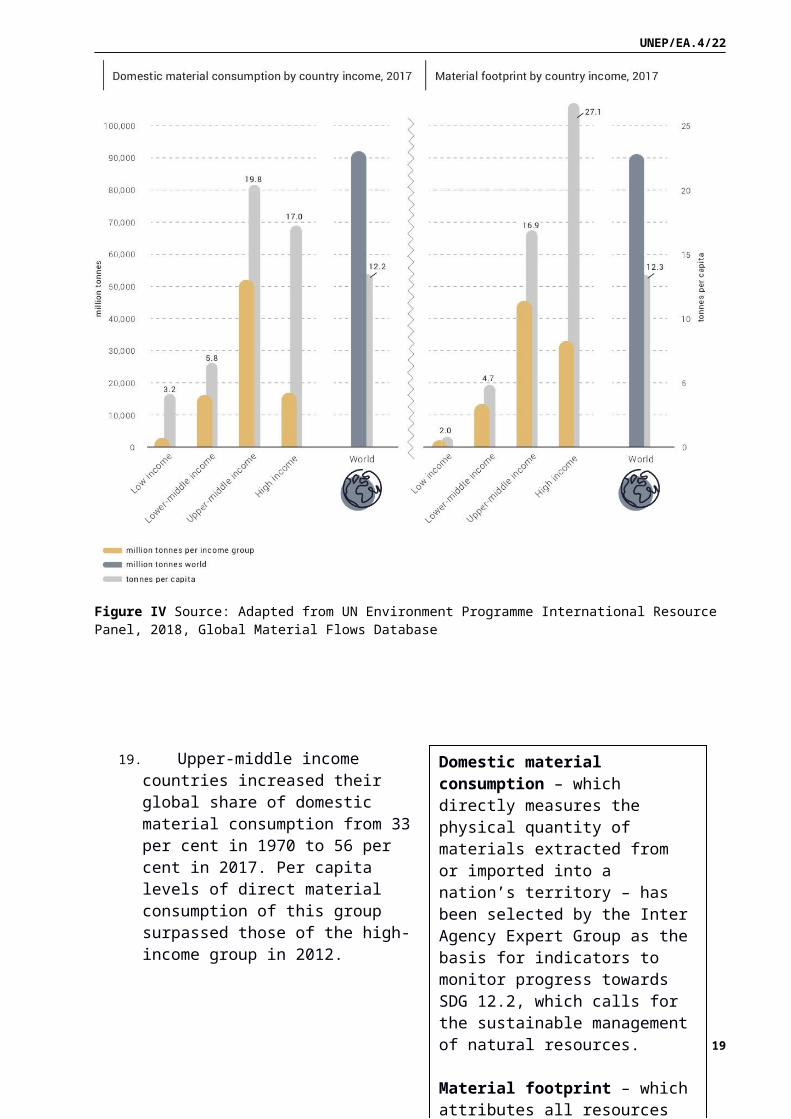
Figure IV Source: Adapted from UN Environment Programme International Resource Panel, 2018, Global Material Flows Database
3 International Resource Panel (IRP). (2018c). The Weight of Cities: Resource Requirements of Future Urbanization. Swilling, M., Hajer, M., Baynes, T., Bergesen, J., Labbe, F., Musango, J.K., Ramaswami, A., Robinson, B., Salat, S., Suh, S., Currie, P., Fang, A., Hanson, A. Kruit, K., Reiner, M., Smit. Nairobi, Kenya: A Report by the International Resource Panel. United Nations Environment Programme.
13
ADVANCE
UNEP/EA.4/22
19. Upper-middle income countries increased their global share of domestic material consumption from 33 per cent in 1970 to 56 per cent in 2017. Per capita levels of direct material consumption of this group surpassed those of the high-income group in 2012.
20. From 1970 to 2017, the share of domestic material consumption for high-income countries dropped from 52 per cent to 22 per cent. Domestic material consumption for lower-middle income groups increased by only 7 per cent in that time, while low-income groups remained steadily under 3 per cent. This shows that while virtually none of the massive growth in materials consumption in the new millennium has gone to the wealthiest countries, neither has much of it gone to the poorest countries, the group in most urgent need of higher material living standards.
21. Two major dynamics are at play – newly industrializing countries are building new infrastructure, and higher-income countries are outsourcing the more material- and energy-intensive stages of production to transitioning countries in the upper and lower-middle income group. High-income regions also import resources and materials and outsource the production-related environmental impacts to middle- and low-income countries.
22. The material footprint of consumption makes these trends clear. The material footprints of high-income country groups are much higher compared to their domestic material consumption. Despite this, the upper-middle income group also surpassed the material footprint rates of high-income countries in 2008. However, on a per capita basis, the high-income group maintains levels of material footprint consumption that are 60 per cent higher than the upper-middle income group, and thirteen times the level of the low-income groups.
Trade
23. Global trade in materials allows producers to compensate for regional differences in natural resources availability and supports global systems
14
Domestic material consumption – which directly measures the physical quantity of materials extracted from or imported into a nation’s territory – has been selected by the Inter Agency Expert Group as the basis for indicators to monitor progress towards SDG 12.2, which calls for the sustainable management of natural resources.
Material footprint – which attributes all resources mobilized globally to the final consumer – is the other material flow indicator that has been selected to monitor progress in the context of the Sustainable Development Goals, more specifically SDG
ADVANCE
UNEP/EA.4/22
of production and consumption.4 While creating value in the country of origin, the movement of resources may also contribute to unequal distribution of environmental or social impacts from the benefits of resource use across and within countries.
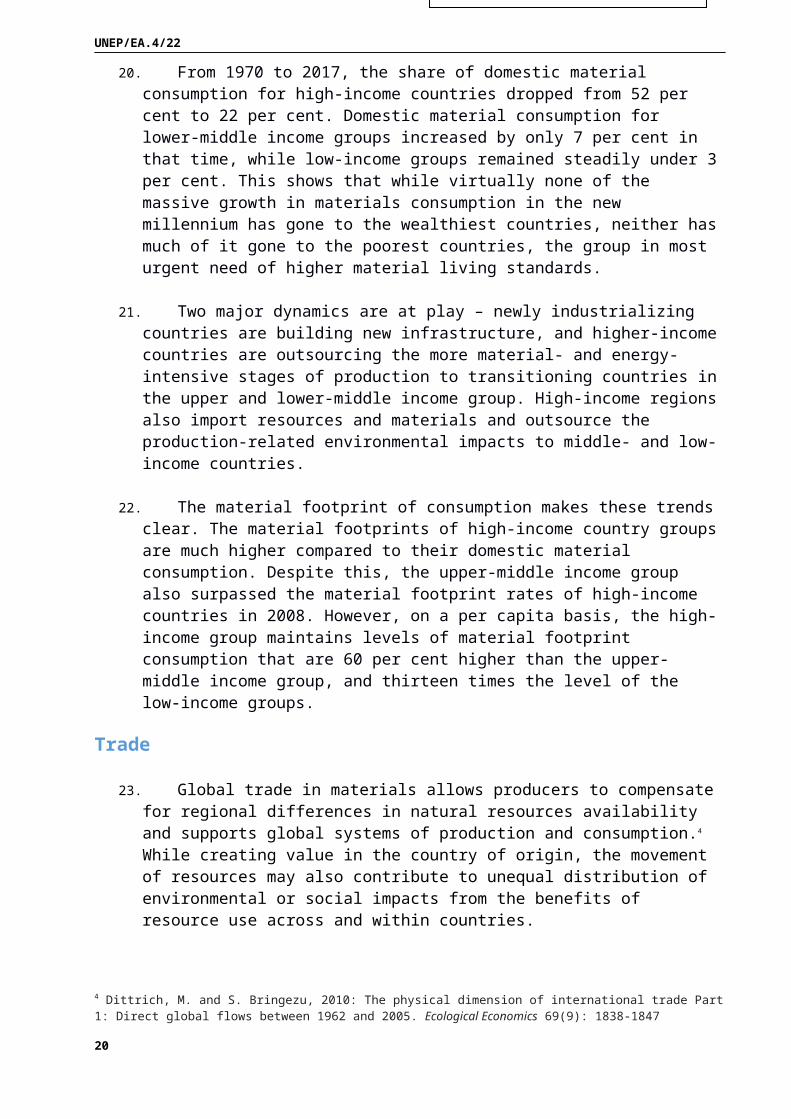
24. The physical trade balance indicates whether a country or region is a net importer or a net exporter of primary materials, and gives an idea of a country’s position and role in global supply chains.
Figure V Source: Adapted from UN Environment International Resource Panel, 2018, Global Material Flows Database
4 Dittrich, M. and S. Bringezu, 2010: The physical dimension of international trade Part 1: Direct global flows between 1962 and 2005. Ecological Economics 69(9): 1838-1847
15
ADVANCE
UNEP/EA.4/22
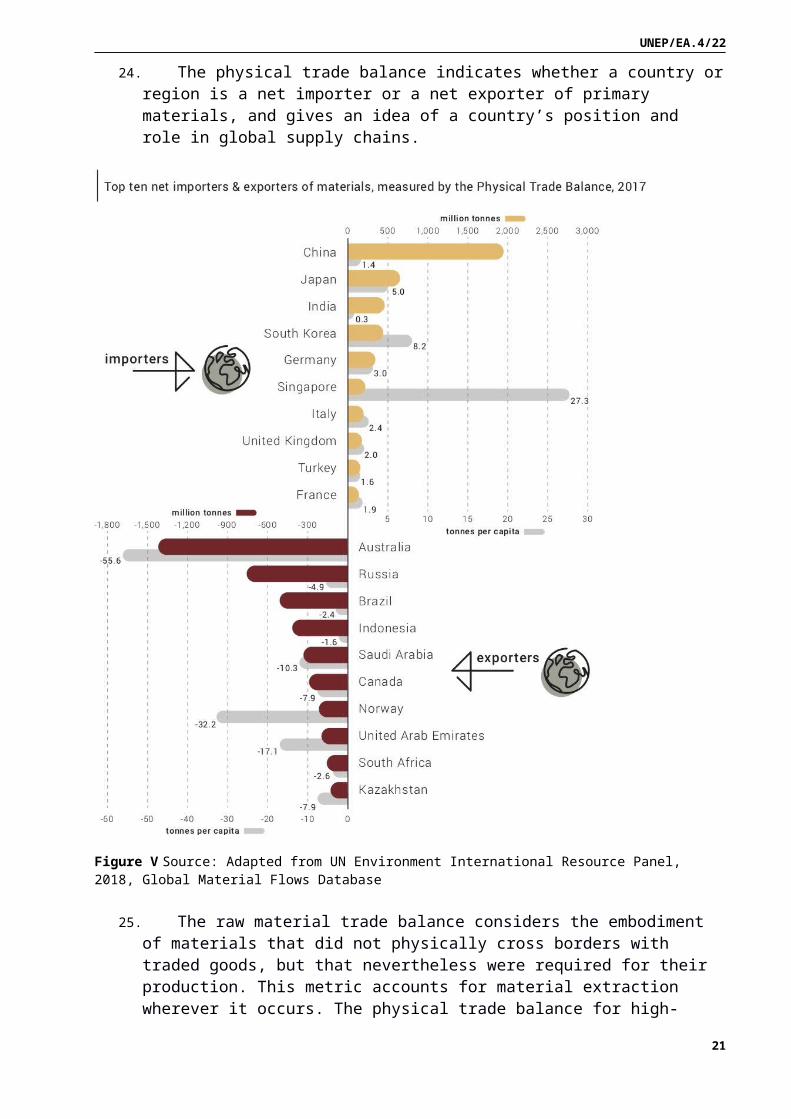
25. The raw material trade balance considers the embodiment of materials that did not physically cross borders with traded goods, but that nevertheless were required for their production. This metric accounts for material extraction wherever it occurs. The physical trade balance for high-income countries in 2017 implies that this group of countries was a small net exporter, but the raw material trade balance indicates that the trade of this group was equivalent to 11.8 billion tonnes of primary extraction from elsewhere in the world.
Figure VI Source: Adapted from UN Environment International Resource Panel, 2018, Global Material Flows Database
26. The physical trade balance in net imports for the upper-middle income group is dwarfed by the raw trade balance of the equivalent of 7.3 billion tonnes of primary extraction.
27. The economic activity in the high-income group of countries depends on extractions in other countries of large and growing levels of primary materials, which – embodied in traded commodities – are effectively imported. On a per capita basis, the high-income group in 2017 was reliant on 9.8 tonnes of primary materials mobilized elsewhere in the world. This reliance on external materials has been increasing at a rate of 1.6 per cent per year since 2000.
28. This material trade translated in displacement of all types of environmental and health impacts from the consuming high-income countries to the middle-and-low income countries. Per capita impacts
16
ADVANCE
UNEP/EA.4/22
caused by consumption of high-income countries are between three and six times larger than those of low-income countries. Water and land impacts show a smaller variation than climate and health impacts as they are mainly related to food consumption, which is less variable than fuel or material use between the groups. West Asia and Asia and the Pacific have the largest water stress impacts and Latin America and Asia and the Pacific the largest land use-related impacts, due to their unique ecosystems. Total resource-related greenhouse gas emissions and particulate matter health impacts are largest in Asia and the Pacific. For all these regions, the production-related impacts inside the region are higher than the consumption impacts due to the export of agricultural products.
17
ADVANCE
UNEP/EA.4/22
Three: Scenarios for our future29. A sustainable future will not occur spontaneously. In the absence of
urgent and concerted action, rapid growth and inefficient use of natural resources will continue to create unsustainable pressures on the environment.
30. The Historical Trends scenario, which assumes the continuation of historical trends, projects global material use to grow by 110 per cent from 2015 levels to reach 190 billion tonnes by 2060, and projects resource use to grow from 11.9 tonnes to 18.5 tonnes per capita. This growth in resource use would result in substantial stress on resource supply systems and in higher levels of environmental pressures and impacts.
31. Strong growth in gross domestic product and population would drive global domestic resource extraction to more than double – from 88 billion tonnes in 2015 to 190 billion tonnes in 2060. The additional needs for buildings and infrastructure would result in annual growth of 2.2 per cent in non-metallic minerals, growing to 59 per cent of overall extraction in 2060.
32. Biomass would have a 23 per cent share, followed by fossil fuels and metal ores, each at 9 per cent of total global extraction.
33. Global water withdrawals for industries and municipalities would rise, and climate change would create uncertainties related to the supply and distribution of water in agriculture.
34. Between 2010 and 2060, total global cropland would increase by 21 per cent with the largest increases coming in Africa, Europe and North America. The projected increases in yield would not be sufficient to compensate for the increased demand for food, especially in Africa.
35. Global pasture area would increase by 25 per cent, with the largest increases coming in Africa and Latin America.
36. Considering only drivers outside the forest sector, the Historical Trends scenario projects small losses in forest area on all continents and a total decrease in global forest area. Hotspots of deforestation are located in Africa, Latin America and Asia.
37. The total area of grasslands, shrub land and savannahs – important natural ecosystems that harbour a significant share of terrestrial biodiversity – would decrease by 20 per cent with the largest losses occurring in Africa, Latin America and Europe.
38. The current trajectory of natural resource use and management under the Historical Trends scenario is unsustainable, but under the Towards Sustainability scenario global society achieves large gains in resource efficiency and, in some cases, absolute impact decoupling.
18
ADVANCE
UNEP/EA.4/22
Decoupling39. The decoupling of natural resource use and environmental impacts from
economic activity and human well-being is an essential element in the transition to a sustainable future. Achieving decoupling is possible and can deliver substantial social and environmental benefits, including repair of past environmental damage, while also supporting economic growth and human well-being. Policy interventions, environmentally sound technologies, sustainable financing schemes, capacity-building, and public–private partnerships can all contribute.
40. Resource efficiency is a matter of achieving improved outputs with fewer inputs and adverse impacts – the goal of decoupling resource use and environmental pressures from economic activity. Relative decoupling occurs when resource use or a pressure on the environment or human well-being grows at a slower rate than the economic activity causing it, and absolute decoupling occurs when resource use or a pressure on the environment or human well-being declines while the economic activity continues to grow.5 The decoupling of well-being from resource use increases the service provided or satisfaction of human need per unit of resource use, and allows for well-being to increase independently of resource use. Resource efficiency alone, however, is not enough. What is needed is a move from linear to circular flows through a combination of extended product life cycles, intelligent product design and standardization and reuse, recycling and remanufacturing. Climate mitigation, protection of biodiversity and changes in consumer and societal behaviour are also important components.
5 International Resource Panel, 2011: Decoupling natural resource use and environmental impacts from economic growth, A Report of the Working Group on Decoupling to the International Resource Panel. Fischer-Kowalski, M., Swilling, M., von Weizsa cker, E.U., Ren, Y., Moriguchi, Y., Crane, W.
19
ADVANCE
UNEP/EA.4/22
Figure VII Source: Adapted from International Resource Panel, 2017, Assessing global resource use: A systems approach to resource efficiency and pollution reduction
41. Under the Towards Sustainability scenario, resource efficiency and sustainable consumption and production measures slow the growth of resource use significantly, so that incomes and other well-being indicators improve, while key environmental pressures fall. This relative decoupling boosts economic growth by 8 per cent over Historical Trends, outweighs the near-term economic costs of shifting to a 1.5 degree Celsius climate pathway and delivers more equal distribution of income and access to resources.
42. A slowdown in natural resource use in high-income countries offsets an increasing use among emerging and developing economies. Annual global extraction is 25 per cent lower than under Historical Trends. Global resource productivity increases by 27 per cent from 2015 to 2060, while average gross domestic product per person doubles and per capita resource use converges across different country groups – decreasing to 13.6 tonnes per capita in high-income countries and growing to 8.2 tonnes per capita in low-income countries.
43. The same actions are projected to achieve absolute decoupling of economic activity and resource use from environmental impact globally – including dramatic reductions in greenhouse gas emissions and substantial restoration of forests and native habitat from 2015 levels. Resource efficiency policies reduce GHG emissions by 19 per cent compared to Historical Trends, and combined with other climate measures see global emissions falling by 90 per cent in 2060, rather than rising 43 per cent. Global habitat loss is reversed, preventing the loss of 1.3 billion hectares of forests and other native habitat, and restoring a further 450 million hectares of forests by 2060.
20
ADVANCE
UNEP/EA.4/22
44. Well-being indicators grow faster than resource use, and natural resource use shows a sizable relative decoupling from income and such essential services as energy and food. An absolute decoupling of negative environmental impacts from economic growth and increasing resource use means that environmental pressures decline.
45. The absolute impact decoupling and relative resource decoupling achieved in this model is not at the expense of economic growth. The policy packages implemented in this scenario lead to net economic benefits before 2030 and to increases in gross domestic product per capita in every income group for the 2015–2060 period.
46. This projected decoupling contrasts starkly with the outlook under Historical Trends, which has similar projected increases in income, but higher resource extractions and escalating and clearly unsustainable environmental pressures –rising greenhouse gas emissions, reductions in the quality and area of forests and other native habitat, and increasing pressures on sensitive ecosystems.
Towards Sustainability: Assumptions
47. The Towards Sustainability scenario shows that changes in policies and behaviours can achieve decoupling. The model assumes shifts in social behaviour and the adoption of policy packages that, when implemented together, lead to a relative decoupling of natural resource use from income and an absolute decoupling of environmental damage from economic growth and increasing resource use.
Policy packages
48. Resource efficiency policies include public research programmes, incentives for private research and development, and support for demonstration projects, business incubators, and other incentives that drive the adoption of innovation and technology. These initiatives lead to the reduction in resources needed per unit of output and to an overall reduction in supply costs.
49. Such cost reductions may produce a rebound effect – an increase in demand that offsets the resource efficiency policy achievements. The policies to compensate for the rebound effect include a tax shift from income and consumption to resource extraction. Other policy measures target changes to regulations, technical standards and procurement policies.
50. Climate mitigation policies include a carbon levy applied equally to all countries and to all emission sources at a level consistent with limiting global temperature rise to 2 degrees Celsius. The revenue raised through these policies is distributed to households and governments in the form of a uniform global per capita carbon dividend payment –
21
ADVANCE
UNEP/EA.4/22
regardless of where the revenue is collected. Biosequestration from reafforestation and restored native habitat receives a subsidy at the same rate per tonne of carbon as the levy. Complementary policies put the world on track to 1.5 degrees Celsius through financial support for two carbon dioxide removal technologies – bioelectricity with carbon capture and storage and direct air capture of carbon dioxide.
51. Landscape and life-on-land policies protect biodiversity by ensuring that climate mitigation and energy policies are consistent with land and food system goals. Applying the carbon levy to emissions from land clearing helps avoid deforestation, and payments for land sector sequestration are provided only where such sequestration enhances biodiversity. Phasing out the incentives for crop-based biofuels by 2020 reduces competition for land and helps avoid increases in food prices.
Shifts in societal behaviour
52. The Towards Sustainability scenario assumes the adoption of healthier diets and the reduction of food waste throughout the food supply chain. The healthier diets are consistent with international dietary guidelines, and feature a 50 per cent reduction in meat consumption – replacing animal protein with plant protein – except in regions where diets are already low in meat. Higher average incomes, reduced poverty and improved public knowledge enable the dietary changes.
22
ADVANCE
UNEP/EA.4/22
Four: The multi-beneficial approach 53. We can improve how we extract, process and use natural resources,
and how we dispose of the resulting waste. Opportunities for innovation and systemic change are available throughout the entire life cycle of economic activities. By seizing these opportunities we can promote sustainable consumption and production and reduce the environmental impacts long associated with economic development.
54. Innovative solutions for stimulating fundamental changes in consumption and production systems enable economic growth and improvements in human well-being without putting unsustainable stress on the environment. In order to achieve these outcomes, the International Resource Panel recommends a multi-beneficial approach to policymaking.
Figure VIII Source: Adapted from International Resource Panel, 2017, Assessing global resource use: A systems approach to resource efficiency and pollution reduction
55. The multi-beneficial approach includes the following policymaking considerations:
a. Indicators and targets. Regular reporting on the metrics of resource use and efficiency across all levels of governance can inform policy development. National resource efficiency targets are an important first step, but international targets for
23
ADVANCE
UNEP/EA.4/22
sustainable levels of global resource consumption are also needed.
b. National plans. Backed by evidence and analysis and the engagement of stakeholders, national plans can identify priorities and lay out a coordinated path to achieving national targets.
c. Policy mixes. The success of the resource efficiency strategy is contingent on a combination of policy actions – the integration of natural resources legislation with biodiversity and climate policies, for example.
d. Sustainable financing. Cost estimates for meeting the Sustainable Development Goals and the Paris Agreement commitments run to trillions of dollars per year for the next decade or more.6 Governments can provide tax incentives and bonds for environmental projects, and private sources can provide financing tools that are accessible at the local level.
e. Unlocking the resistance to change. Progress towards sustainability likely entails the phasing out of certain industries and the jobs they provide. Targeted government support in the form of education and training programmes can help people adjust to the changing labour market. The revenue raised from any environmental taxes that support new programmes can help mitigate these and other negative distribution effects.7
f. Policies for the circular economy. The circular economy promotes the retention of value and the reduction of environmental impacts while simultaneously reducing costs and creating economic opportunities. Policy considerations include establishing an effective infrastructure for waste management and recycling, incentivizing extended product life cycles and intelligent product design, and ensuring that current regulations create no barriers to the development or adoption of value-retention processes.8
g. Leapfrogging. Industrializing countries can leapfrog old technologies and bypass the resource-intensive pathway of development paved by high-income, industrialized countries. By
6 United Nations Environment Programme, 2018: Making Waves: Aligning the Financial System with Sustainable Development. Retrieved from http://unepinquiry.org/wp-content/uploads/2018/04/Making_Waves_lowres.pdf
7 Organization for Economic Co-Operation and Development, 2017: Employment Implications of Green Growth: Linking jobs, growth, and green policies. OECD Report for the G7 Environment Ministers. Retrieved from www.oecd.org/greengrowth
8 International Resource Panel, 2018: Re-defining Value – The Manufacturing Revolution. Remanufacturing, Refurbishment, Repair and Direct Reuse in the Circular Economy. Nabil Nasr, Jennifer Russell, Stefan Bringezu, Stefanie Hellweg, Brian Hilton, Cory Kreiss, and Nadia von Gries. A Report of the International Resource Panel. Nairobi, Kenya
24
ADVANCE
UNEP/EA.4/22
using the most advanced technologies they need substantially fewer natural resources to meet their development demands.9
56. International exchanges and cooperation. In addition to their contributions to the other elements of policymaking, international exchanges and cooperation can help ensure fair competition in international trade. Exchanges and shared experiences can help countries navigate common obstacles, and cooperation can help compensate for unequal burdens, responsibilities and capabilities.
57. This multi-beneficial approach offers policymakers a range of choices for developing comprehensive strategies to respond effectively to the challenges of what has been a relentless demand for resources. The consequences of that demand are apparent, the stakes are high and the need for action is urgent. But the reasons for hope and optimism are compelling.
58. Our knowledge about the uses of natural resources and the consequences of those uses is extensive, and can serve as a base for analysis and action. We already have technologies to apply in the short term to improve natural resources management across sectors and countries – business models and best practices that embrace the circular economy and leapfrogging technologies that generate enormous resource and economic savings while still driving development.
59. Policymakers and decision makers have tools at their disposal to advance worthwhile change, including transformational change at local, national, and global scales. National plans for the sustainable use of natural resources enable governments to identify priorities and proceed in a coordinated way to achieve their natural resource efficiency targets. Progress toward the targets can, in turn, guide subsequent policy development, and resource efficiency programmes can help coordinate institutional responsibilities and policies. The set of policy instruments employed will differ in context and scope depending on the national situation from country to country. Working together across borders, countries can engage in the international exchanges and cooperation that can contribute to the achievement of the change we need for the future we want.
9 Gallagher, K. S.. 2006: Limits to leapfrogging in energy technologies? Evidence from the Chinese automobile industry. Energy Policy, 34(4), 383–394. https://doi.org/10.1016/J.ENPOL.2004.06.005
25