Embed Size (px)
Citation preview
1
FY 2019 Results
Analysts’ and Investors’ Conference
March 10, 2020
Gisbert Rühl | CEO
Dr. Oliver Falk | CFO
John Ganem | Member of the Management Board
Disclaimer
2
This presentation contains forward-looking statements which reflect the current views of the management of Klöckner & Co SE with respect to future events. They generally are designated by the words “expect”, “assume”, “presume”, “intend”, “estimate”, “strive for”, “aim for”, “plan”, “will”, “endeavor”, “outlook” and comparable expressions and generally contain information that relates to expectations or goals for economic conditions, sales proceeds or other yardsticks for the success of the enterprise. Forward-looking statements are based on currently valid plans, estimates and expectations and are therefore only valid on the day on which they are made. You therefore should consider them with caution. Such statements are subject to numerous risks and factors of uncertainty (e. g. those described in publications) most of which are difficult to assess and which generally are outside of the control of Klöckner & Co SE. The relevant factors include the effects of reasonable strategic and operational initiatives, including the acquisition or disposal of companies or other assets. If these or other risks and factors of uncertainty occur or if the assumptions on which the statements are based turn out to be incorrect, the actual results of Klöckner & Co SE can deviate significantly from those that are expressed or implied in these statements. Klöckner & Co SE cannot give any guarantee that the expectations or goals will be attained. Klöckner & Co SE –notwithstanding existing legal obligations – rejects any responsibility for updating the forward-looking statements through taking into consideration new information or future events or other things.
In addition to the key figures prepared in accordance with IFRS and German-GAAP respectively, Klöckner & Co SE is presenting non-GAAP key figures such as EBITDA, EBIT, Net Working Capital and net financial liabilities that are not a component of the accounting regulations. These key figures are to be viewed as supplementary to, but not as a substitute for data prepared in accordance with IFRS. Non-GAAP key figures are not subject to IFRS or any other generally applicable accounting regulations. In assessing the net assets, financial position and results of operations of Klöckner & Co SE, these supplementary figures should not be used in isolation or as an alternative to the key figures presented in the consolidated financial statements and calculated in accordance with the relevant accounting principles. Other companies may base these concepts upon other definitions. Please refer to the definitions in the annual report.
Rounding differences may occur with respect to percentages and figures.
The English translation of the Annual Report and the Interim Statement are also available, in case of deviations the German versions shall prevail.
Evaluating statements are unified and are presented as follows:
+/- 0-1% constant+/- >1-5% slight+/- >5% considerable
FY 2019 Results | Analysts’ and Investors’ Conference | Klöckner & Co SE
3
1. Highlights and update on strategy
2. Financials
3. Outlook
4. Appendix
Agenda
FY 2019 Results | Analysts’ and Investors’ Conference | Klöckner & Co SE
Details of FY 2019
4
01
FY 2019 Results | Analysts’ and Investors’ Conference | Klöckner & Co SE
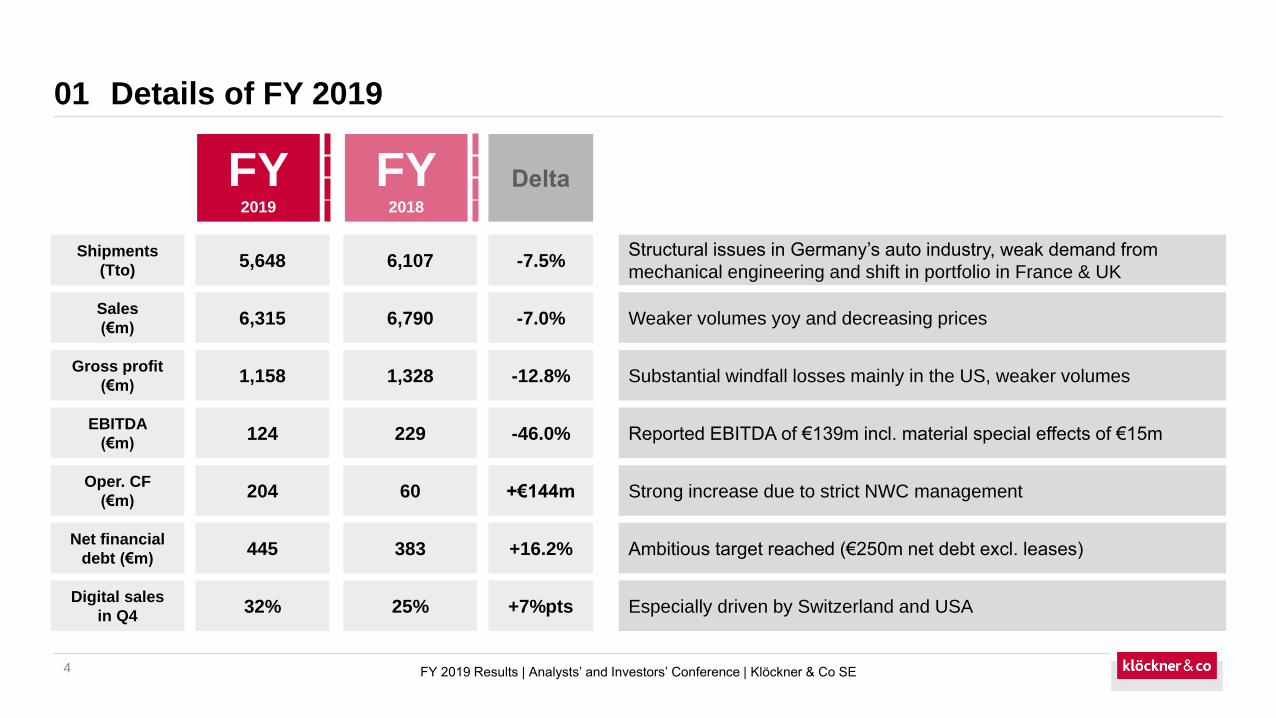
Shipments
(Tto)-7.5%
Sales
(€m)-7.0%
Gross profit
(€m)-12.8%
EBITDA
(€m)-46.0%
Oper. CF
(€m)+€144m
Net financial
debt (€m)
6,107
6,790
1,328
229
60
383
5,648
6,315
1,158
124
204
445 +16.2%
Structural issues in Germany’s auto industry, weak demand from
mechanical engineering and shift in portfolio in France & UK
Weaker volumes yoy and decreasing prices
Substantial windfall losses mainly in the US, weaker volumes
Reported EBITDA of €139m incl. material special effects of €15m
Ambitious target reached (€250m net debt excl. leases)
Strong increase due to strict NWC management
FY2019
FY2018
Digital sales
in Q425%32% +7%pts Especially driven by Switzerland and USA

Update on digitalization: kloeckner.i01
FY 2019 Results | Analysts’ and Investors’ Conference | Klöckner & Co SE
• Kloeckner Assistant turns almost every customer into a digital customer
• Time for quote creation process is reduced from 30 minutes to seconds
• Significant efficiency gains due to increasing digitalization and EBITDA effect already
visible in 2020
• Rollout on track and finished by year end
5
Kloeckner Assistant
Conversion
into digital
document
QuoteUnstructured
request
• Fax
• Voice
Logical
content
interpretation
Automatic
Pricing
Matching of
product
description
Accepting
the quote via
simple click
Customer Customer
AI AI AI
Update on digitalization: XOM Materials
6
01
FY 2019 Results | Analysts’ and Investors’ Conference | Klöckner & Co SE
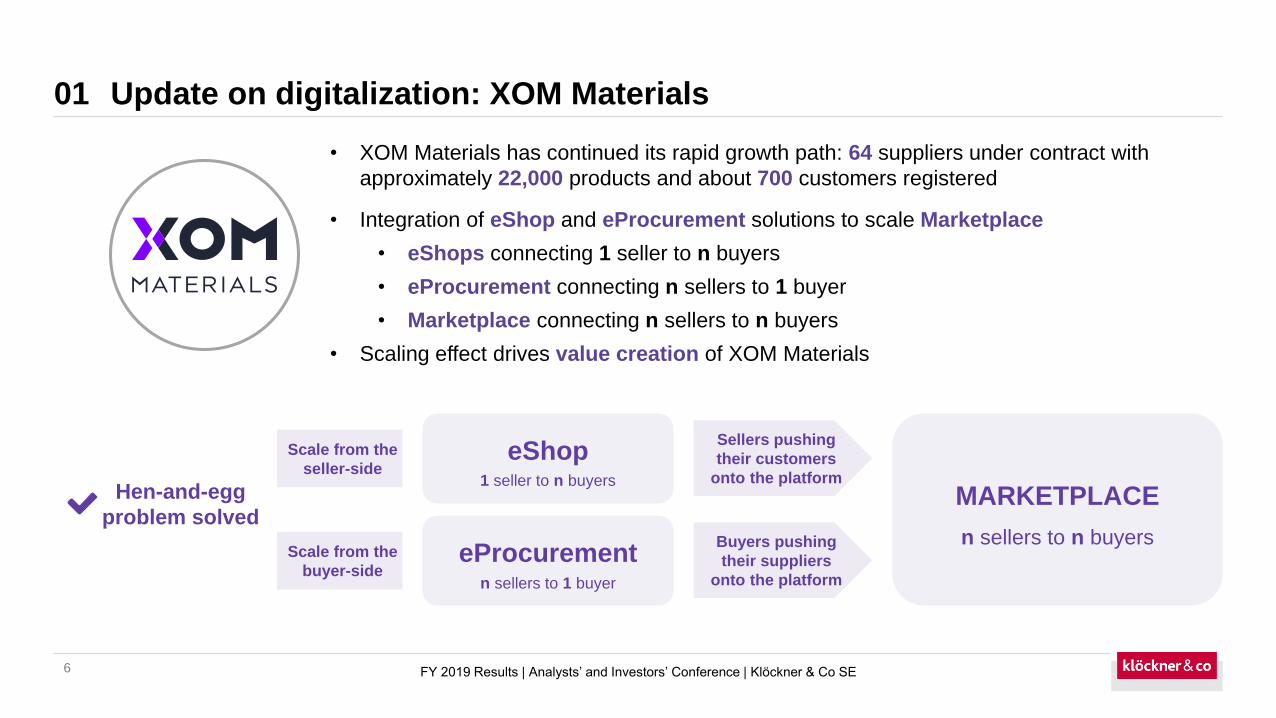
• XOM Materials has continued its rapid growth path: 64 suppliers under contract with
approximately 22,000 products and about 700 customers registered
• Integration of eShop and eProcurement solutions to scale Marketplace
• eShops connecting 1 seller to n buyers
• eProcurement connecting n sellers to 1 buyer
• Marketplace connecting n sellers to n buyers
• Scaling effect drives value creation of XOM Materials
Hen-and-egg
problem solvedn sellers to n buyers
MARKETPLACE
eShop1 seller to n buyers
eProcurementn sellers to 1 buyer
Scale from the
seller-side
Scale from the
buyer-side
Sellers pushing
their customers
onto the platform
Buyers pushing
their suppliers
onto the platform
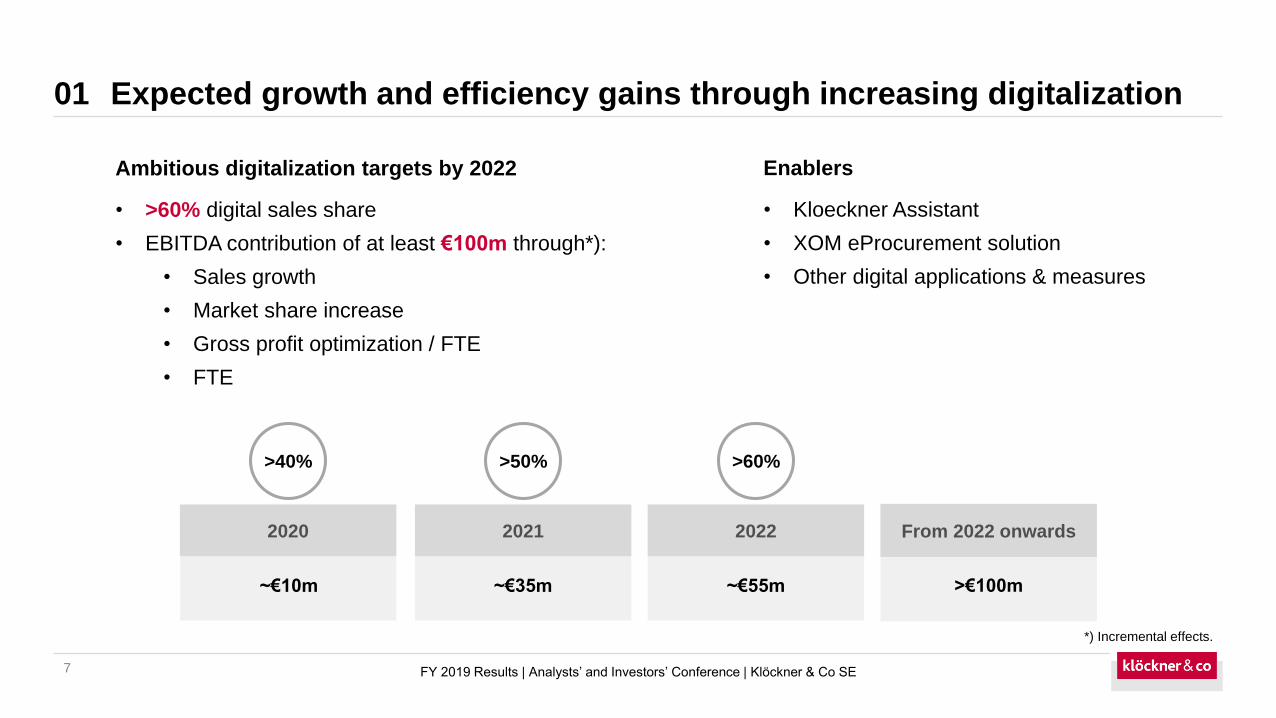
Expected growth and efficiency gains through increasing digitalization
7
01
FY 2019 Results | Analysts’ and Investors’ Conference | Klöckner & Co SE
2021
~€35m
2020
~€10m
2022
~€55m
From 2022 onwards
>€100m
>40% >50% >60%
Ambitious digitalization targets by 2022
• >60% digital sales share
• EBITDA contribution of at least €100m through*):
• Sales growth
• Market share increase
• Gross profit optimization / FTE
• FTE
Enablers
• Kloeckner Assistant
• XOM eProcurement solution
• Other digital applications & measures
*) Incremental effects.
8
1. Highlights and update on strategy
2. Financials
3. Outlook
4. Appendix
Agenda
FY 2019 Results | Analysts’ and Investors’ Conference | Klöckner & Co SE
9
02
FY 2019 Results | Analysts’ and Investors’ Conference | Klöckner & Co SE
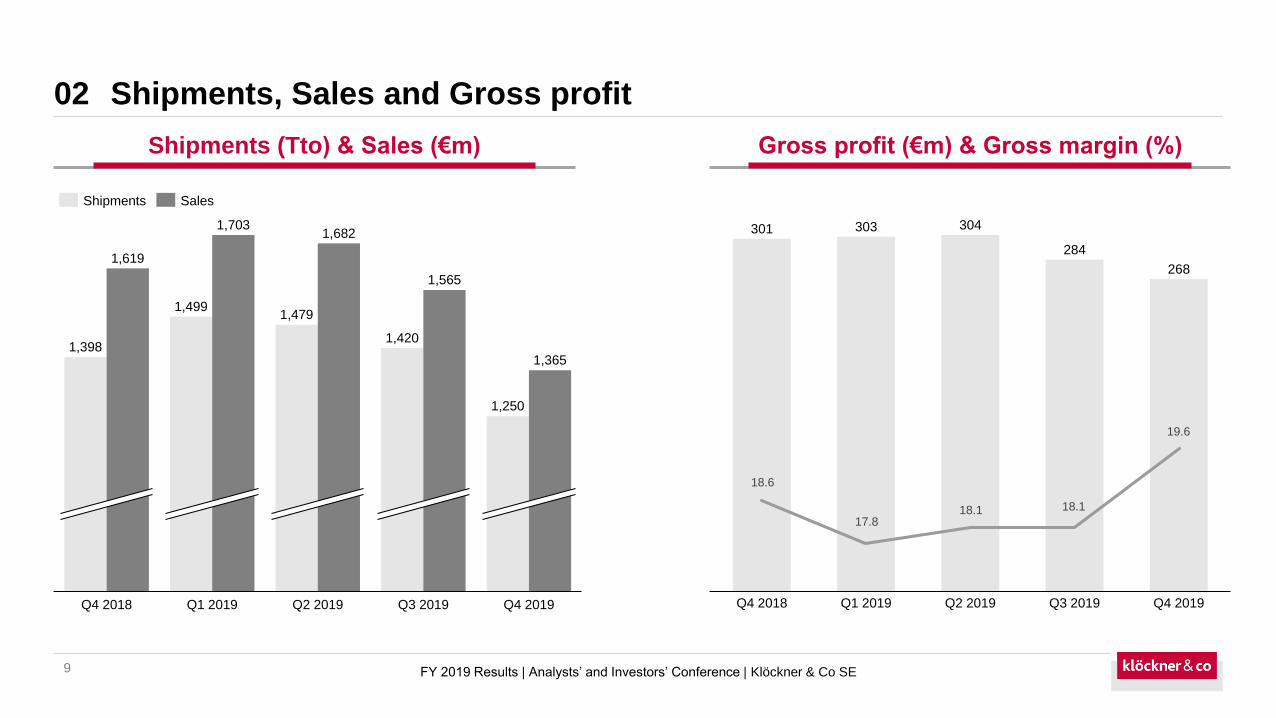
1,250
1,479
Q4 2018 Q1 2019 Q2 2019 Q3 2019 Q4 2019
1,398
1,619
1,703
1,499
1,682
1,420
1,365
1,565
Shipments Sales
Shipments, Sales and Gross profit
301 303 304
284
268
Q4 2018 Q3 2019Q1 2019 Q2 2019 Q4 2019
Shipments (Tto) & Sales (€m) Gross profit (€m) & Gross margin (%)
18.6
17.818.1 18.1
19.6
10
02
FY 2019 Results | Analysts’ and Investors’ Conference | Klöckner & Co SE
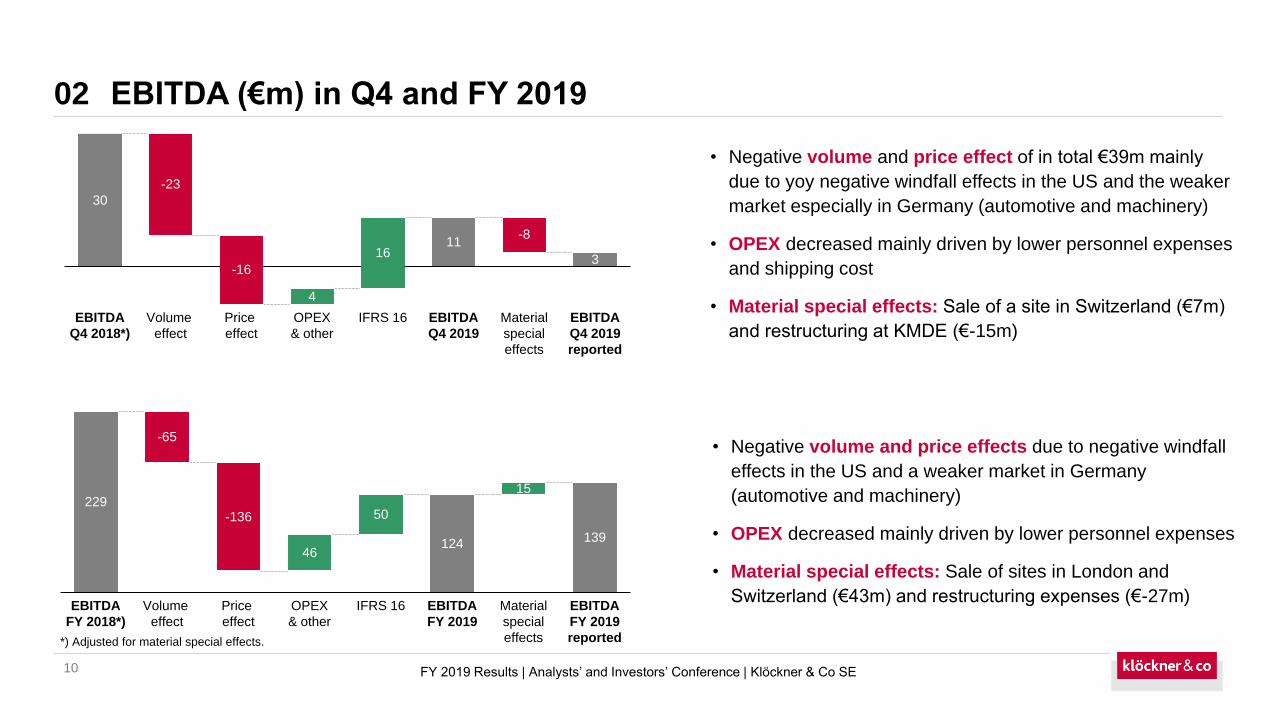
• Negative volume and price effects due to negative windfall
effects in the US and a weaker market in Germany
(automotive and machinery)
• OPEX decreased mainly driven by lower personnel expenses
• Material special effects: Sale of sites in London and
Switzerland (€43m) and restructuring expenses (€-27m)
30
11
3
EBITDA
Q4 2018*)
Volume
effect
-23
EBITDA
Q4 2019
-16
Price
effect
4
OPEX
& other
16
IFRS 16
-8
Material
special
effects
EBITDA
Q4 2019
reported
• Negative volume and price effect of in total €39m mainly
due to yoy negative windfall effects in the US and the weaker
market especially in Germany (automotive and machinery)
• OPEX decreased mainly driven by lower personnel expenses
and shipping cost
• Material special effects: Sale of a site in Switzerland (€7m)
and restructuring at KMDE (€-15m)
EBITDA (€m) in Q4 and FY 2019
229
124139
46
50
15
EBITDA
FY 2019
EBITDA
FY 2018*)
-65
Price
effect
Volume
effect
OPEX
& other
Material
special
effects
-136
IFRS 16 EBITDA
FY 2019
reported*) Adjusted for material special effects.

11
02
FY 2019 Results | Analysts’ and Investors’ Conference | Klöckner & Co SE
36
207
Net debt
12.2018
383
Other
-221
IFRS 16
Impact
Free
cash flow
-31
Dividends
-14
F/X, Swaps
-3
445
Net debt
12.2019
Cash flow FY 2019 (€m)
Net financial debt 12/2018 vs. 12/2019 (€m)
139
177
204
Taxes CapexChange in NWC
EBITDA FY 2019
Gain on sale of non-current assets
-32
Interest
-47
Free cash flow FY 2019
-18
-15
Other Cash flow from operating activities
3
207
• Strong net working capital release of €177m due
to tight management
• Gain on sale of non-current assets include the
sale of site in London (€36m) and Switzerland (€7m)
• Cash flow from operating activities of €204m
• Positive free cash flow of €207m
• Higher net financial debt driven by the
implementation of IFRS 16 – Leases, partly offset
by positive free cash flow
Cash flow and net debt development
12
1. Highlights and update on strategy
2. Financials
3. Outlook
4. Appendix
Agenda
FY 2019 Results | Analysts’ and Investors’ Conference | Klöckner & Co SE
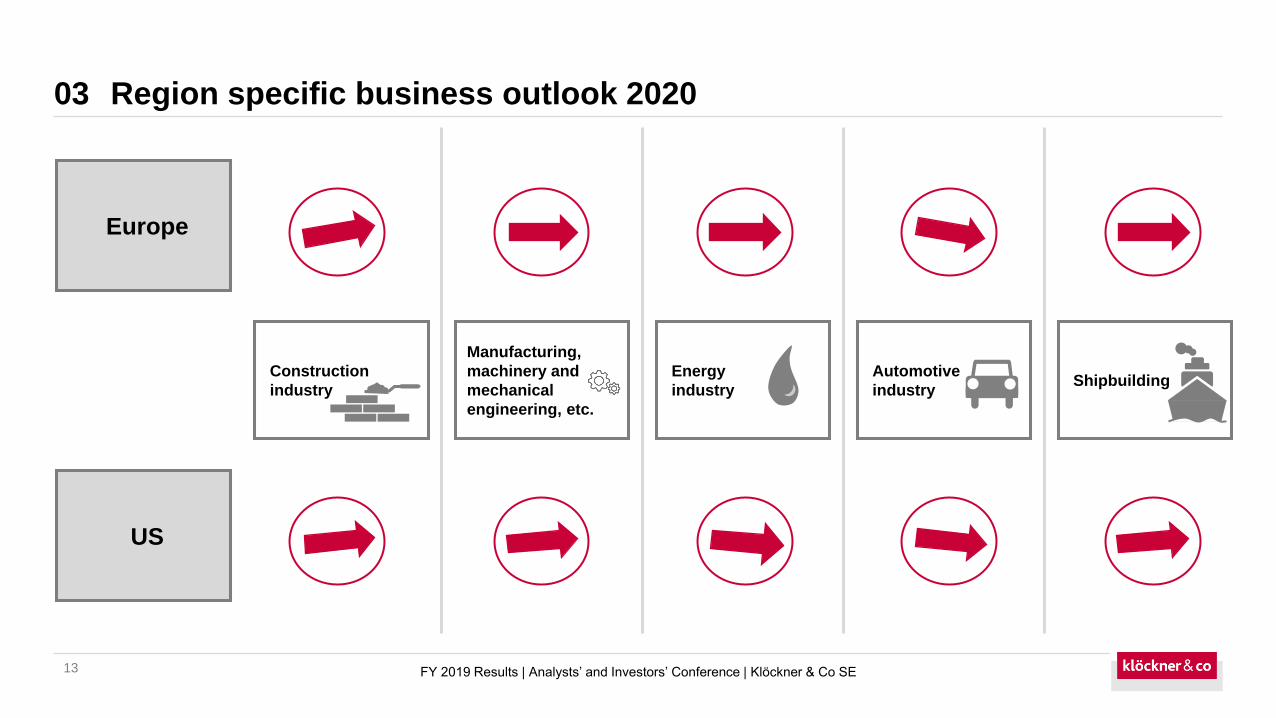
Region specific business outlook 2020
13
03
FY 2019 Results | Analysts’ and Investors’ Conference | Klöckner & Co SE
ShipbuildingEnergy
industry
Construction
industry
Manufacturing,
machinery and
mechanical
engineering, etc.
Automotive
industry
US
Europe
Outlook
14
03
FY 2019 Results | Analysts’ and Investors’ Conference | Klöckner & Co SE
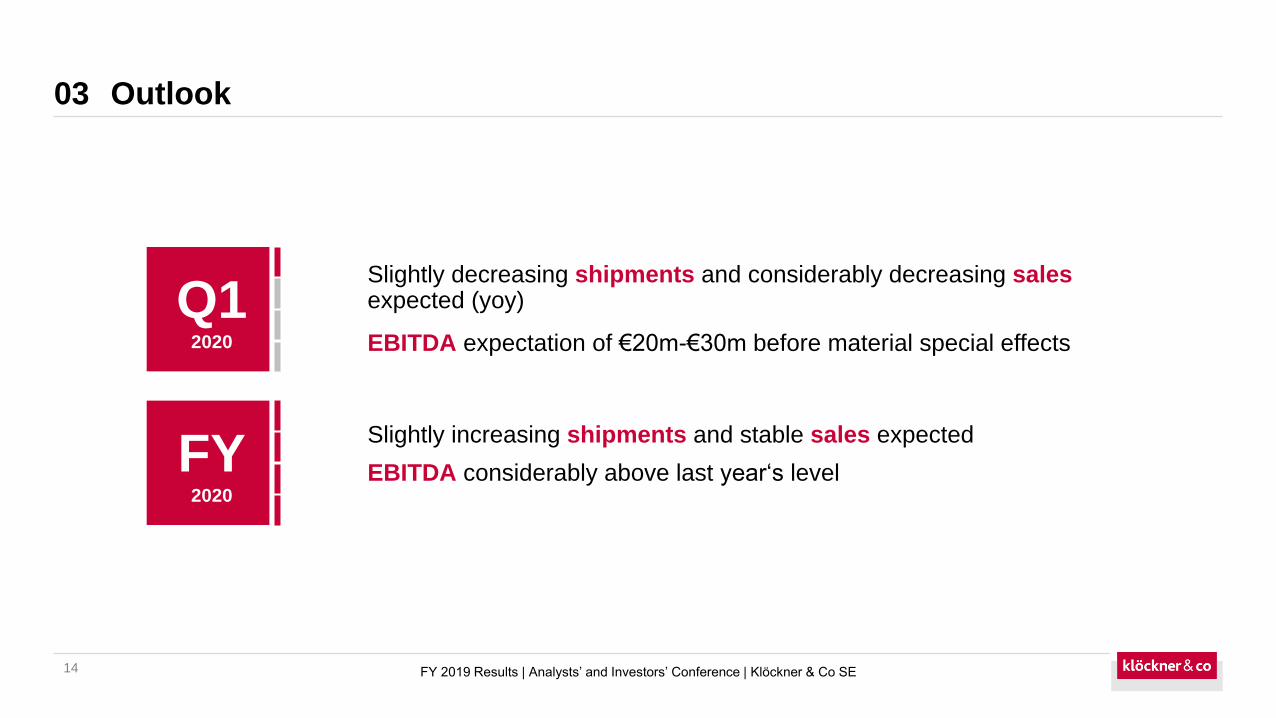
FY2020
EBITDA considerably above last year‘s level
Slightly increasing shipments and stable sales expected
Q12020 EBITDA expectation of €20m-€30m before material special effects
Slightly decreasing shipments and considerably decreasing sales expected (yoy)
15
1. Highlights and update on strategy
2. Financials
3. Outlook
4. Appendix
Agenda
FY 2019 Results | Analysts’ and Investors’ Conference | Klöckner & Co SE

16
04
FY 2019 Results | Analysts’ and Investors’ Conference | Klöckner & Co SE
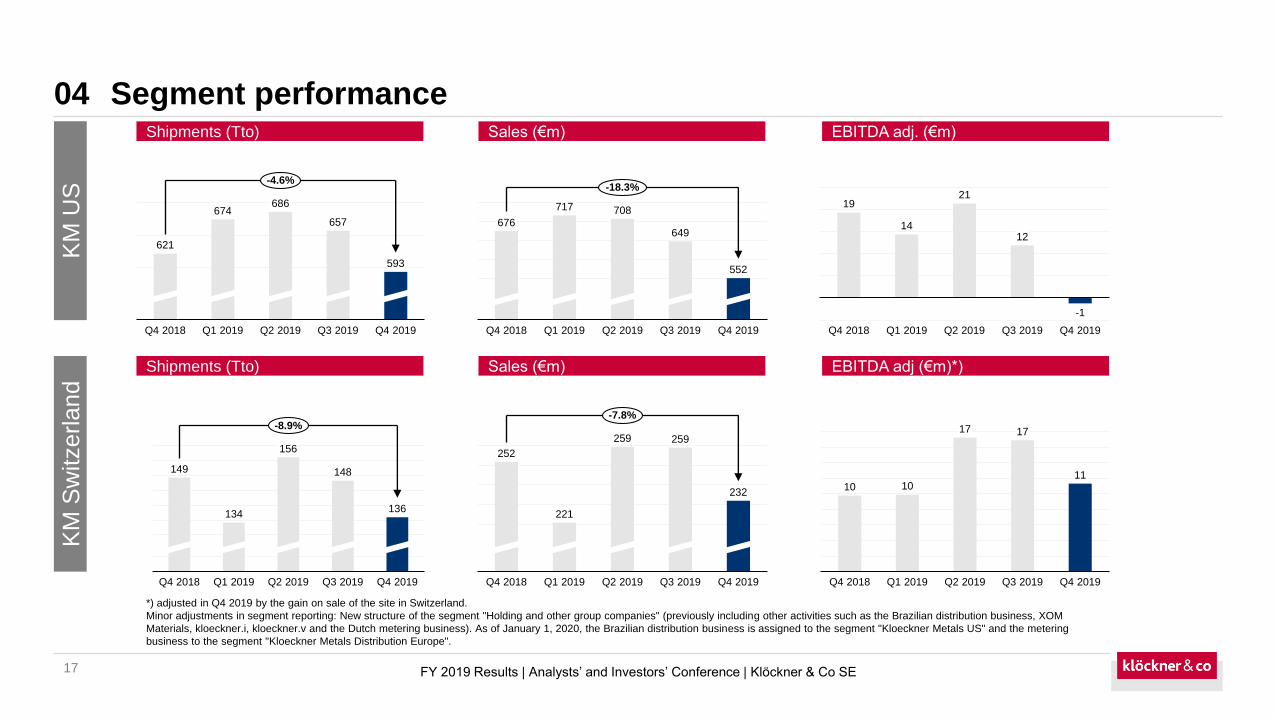
Quarterly and FY results
*) Since 2018 including supplier bonus receivables and contract assets.
17
04
Q4 2018 Q1 2019 Q2 2019 Q3 2019 Q4 2019
593
621
674686
657
-4.6%
676
552
Q1 2019Q4 2018 Q2 2019 Q3 2019 Q4 2019
717 708
649
-18.3%
19
14
21
-1
Q1 2019Q4 2018 Q2 2019 Q3 2019 Q4 2019
12
148
Q4 2019
136
Q4 2018 Q1 2019 Q2 2019
149
Q3 2019
134
156
-8.9%
Q2 2019
259
252
232
Q4 2018
259
Q1 2019 Q3 2019 Q4 2019
221
-7.8%
10 10
Q4 2018 Q1 2019 Q2 2019 Q3 2019 Q4 2019
17 17
11
KM
US
KM
Sw
itzerl
and
Shipments (Tto) Sales (€m) EBITDA adj. (€m)
Shipments (Tto) Sales (€m) EBITDA adj (€m)*)
FY 2019 Results | Analysts’ and Investors’ Conference | Klöckner & Co SE
*) adjusted in Q4 2019 by the gain on sale of the site in Switzerland.
Minor adjustments in segment reporting: New structure of the segment "Holding and other group companies" (previously including other activities such as the Brazilian distribution business, XOM
Materials, kloeckner.i, kloeckner.v and the Dutch metering business). As of January 1, 2020, the Brazilian distribution business is assigned to the segment "Kloeckner Metals US" and the metering
business to the segment "Kloeckner Metals Distribution Europe".
Segment performance
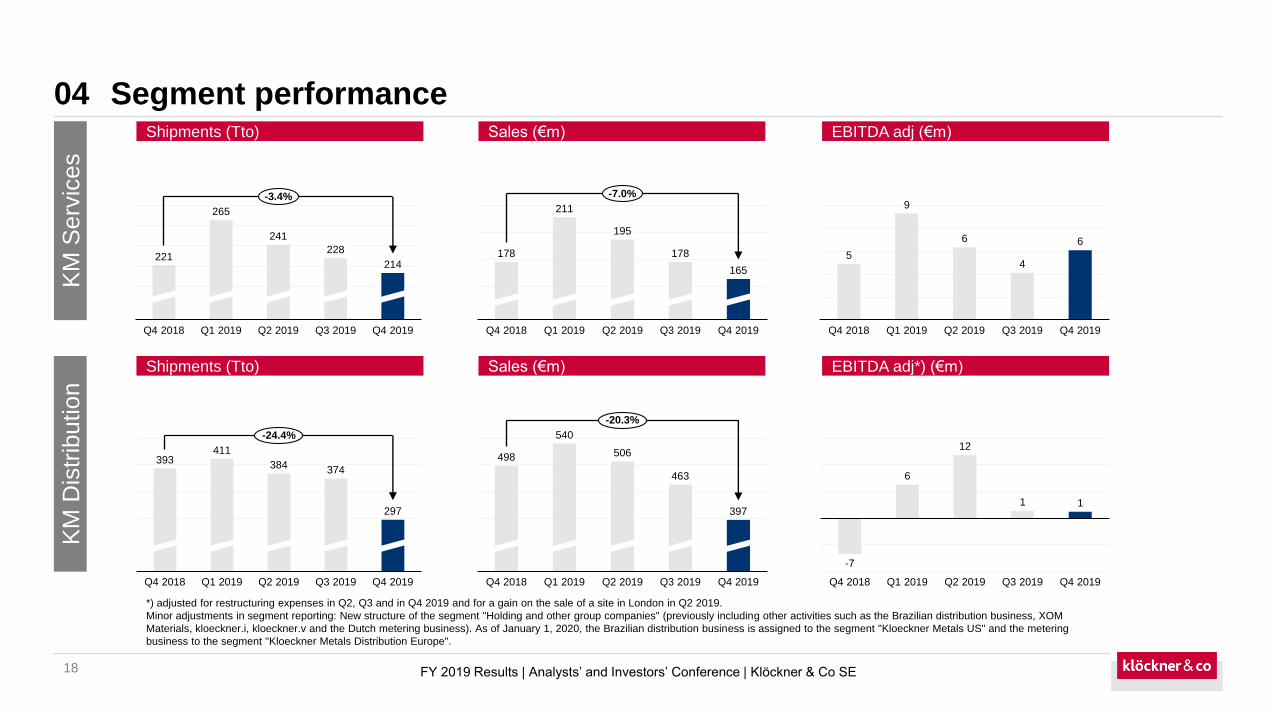
Segment performance
18
04
Q4 2018 Q2 2019 Q4 2019
228
Q1 2019 Q3 2019
221
265
241
214
-3.4%
Q4 2019
178
Q4 2018 Q2 2019Q1 2019 Q3 2019
195
211
178
165
-7.0%
6
4
6
Q4 2018 Q1 2019 Q2 2019 Q3 2019 Q4 2019
5
9
Q4 2018 Q1 2019
393
Q2 2019 Q3 2019 Q4 2019
411
384 374
297
-24.4%
463
540
Q4 2018 Q1 2019 Q2 2019 Q3 2019 Q4 2019
498 506
397
-20.3%
-7
6
12
1 1
Q2 2019Q4 2018 Q1 2019 Q3 2019 Q4 2019
KM
Serv
ices
KM
Dis
trib
ution
Shipments (Tto) Sales (€m) EBITDA adj (€m)
Shipments (Tto) Sales (€m) EBITDA adj*) (€m)
FY 2019 Results | Analysts’ and Investors’ Conference | Klöckner & Co SE
*) adjusted for restructuring expenses in Q2, Q3 and in Q4 2019 and for a gain on the sale of a site in London in Q2 2019.
Minor adjustments in segment reporting: New structure of the segment "Holding and other group companies" (previously including other activities such as the Brazilian distribution business, XOM
Materials, kloeckner.i, kloeckner.v and the Dutch metering business). As of January 1, 2020, the Brazilian distribution business is assigned to the segment "Kloeckner Metals US" and the metering
business to the segment "Kloeckner Metals Distribution Europe".
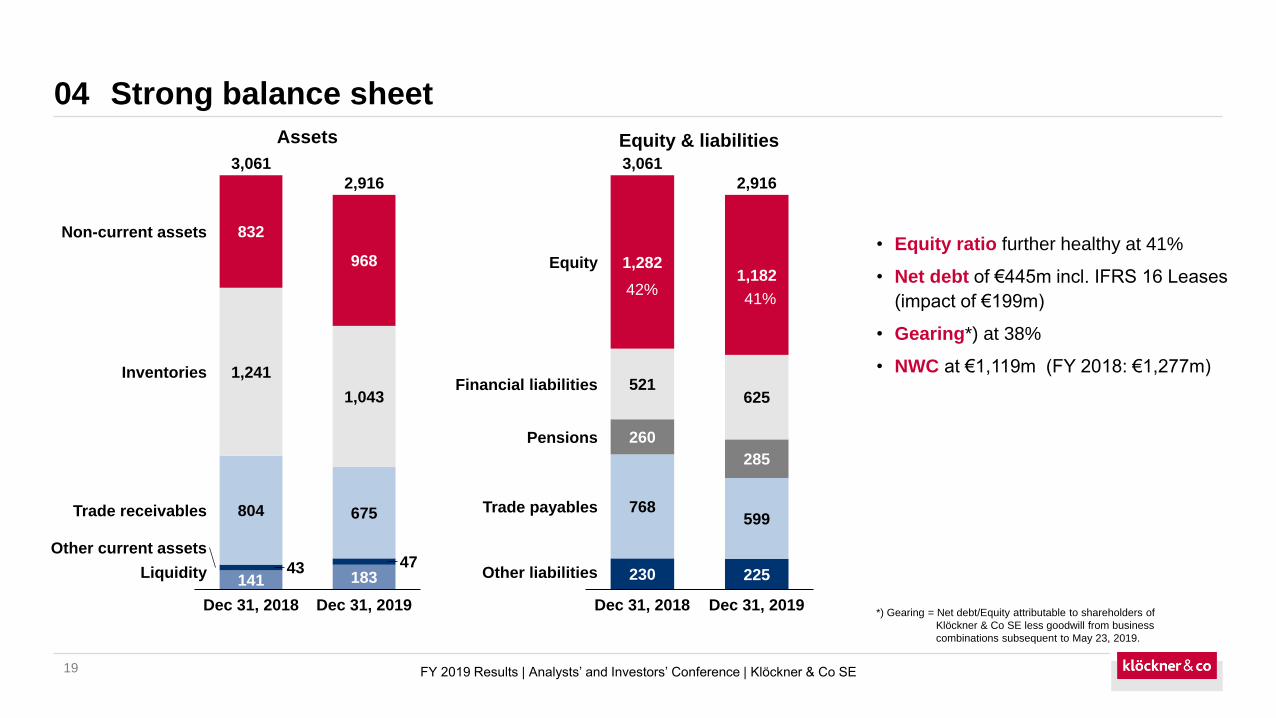
Strong balance sheet
19
04
141 18343 47
804 675
832
968
Dec 31, 2018
1,241
Dec 31, 2019
1,043
Non-current assets
Inventories
2,916
Trade receivables
Other current assets
Liquidity
3,061
230 225
768599
260
285
521625
1,182
Trade payables
Financial liabilities
1,282
Dec 31, 2018
Pensions
Dec 31, 2019
Equity
Other liabilities
3,061
2,916
Assets Equity & liabilities
41%42%
FY 2019 Results | Analysts’ and Investors’ Conference | Klöckner & Co SE
• Equity ratio further healthy at 41%
• Net debt of €445m incl. IFRS 16 Leases
(impact of €199m)
• Gearing*) at 38%
• NWC at €1,119m (FY 2018: €1,277m)
*) Gearing = Net debt/Equity attributable to shareholders of
Klöckner & Co SE less goodwill from business
combinations subsequent to May 23, 2019.

Maturity profile – well-balanced & diversified funding portfolio
20
04
FY 2019 Results | Analysts’ and Investors’ Conference | Klöckner & Co SE
Facility Committed (€m)Drawn amount (€m, IFRS*)
FY 2019 FY 2018
Syndicated Loan 300 0 0
ABS Europe 300 115 110
ABS/ABL USA 490 124 172
Convertible 2016 1) 148 142 138
Bilateral Facilities 2) 170 42 78
Leases 3) 205 205 26
Total Debt 1,613 628 524
Cash 183 141
Net Debt 445 383
€m FY 2019
Adjusted equity 1,176
Net debt 445
Gearing 4)38%
Maturity profile of financial instruments (excl. leasing) in €m
*) Including interest accrued, excluding deferred transaction costs.
1) Principal €148m, equity component €18m at issuance (September 8, 2016).
2) Mainly Switzerland.
3) First time application of IFRS 16 in Q1 2019. FY 2018 as reported (based on IAS 17 and not adjusted for IFRS 16).
4) Net debt/Equity attributable to shareholders of Klöckner & Co SE less goodwill from business combinations
subsequent to May 23, 2019.
2020 2021 2022 Thereafter
ABS/ABL USA BilateralsSyndicated Loan ABS EuropeConvertible Bond
2023
Left bar: committed facilities
Right bar: utilization (nominal amounts)
25 16 148 148
300
3 3 3 19 19
300
115
122
490
124
1
939
388
1
422
21
04
FY 2019 Results | Analysts’ and Investors’ Conference | Klöckner & Co SE
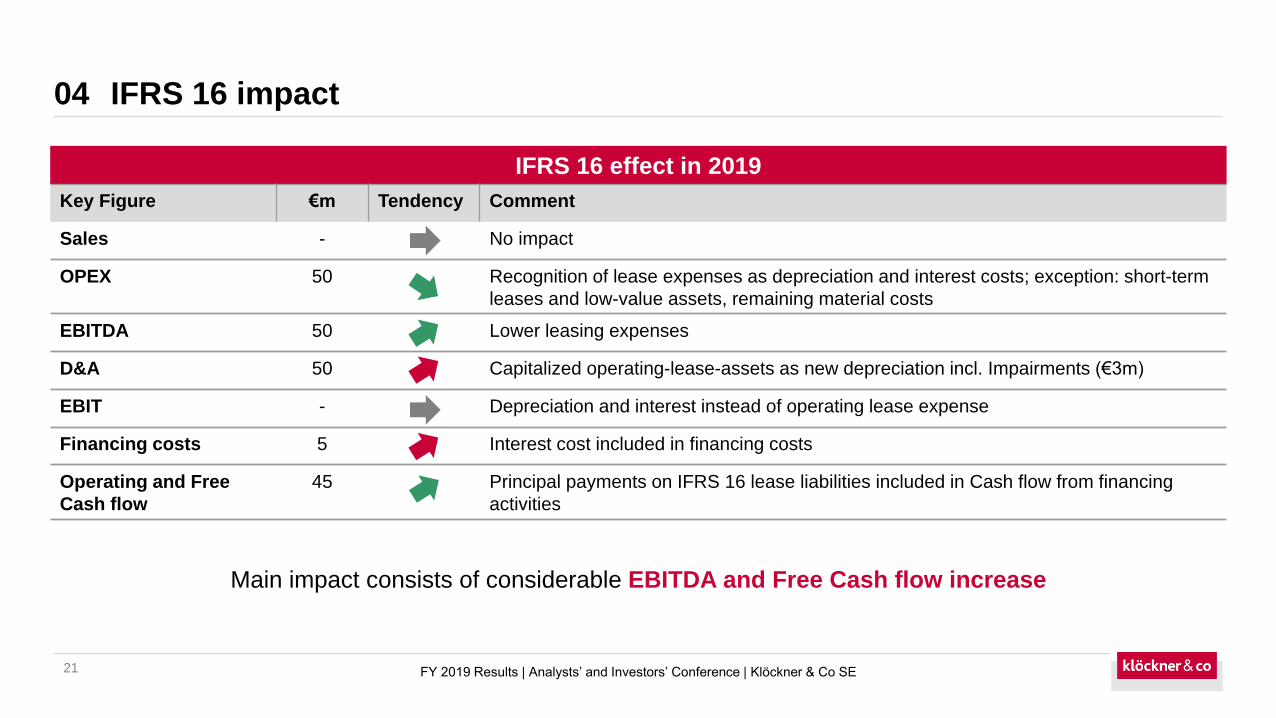
IFRS 16 impact
IFRS 16 effect in 2019
Key Figure €m Tendency Comment
Sales - No impact
OPEX 50 Recognition of lease expenses as depreciation and interest costs; exception: short-term
leases and low-value assets, remaining material costs
EBITDA 50 Lower leasing expenses
D&A 50 Capitalized operating-lease-assets as new depreciation incl. Impairments (€3m)
EBIT - Depreciation and interest instead of operating lease expense
Financing costs 5 Interest cost included in financing costs
Operating and Free
Cash flow
45 Principal payments on IFRS 16 lease liabilities included in Cash flow from financing
activities
Main impact consists of considerable EBITDA and Free Cash flow increase
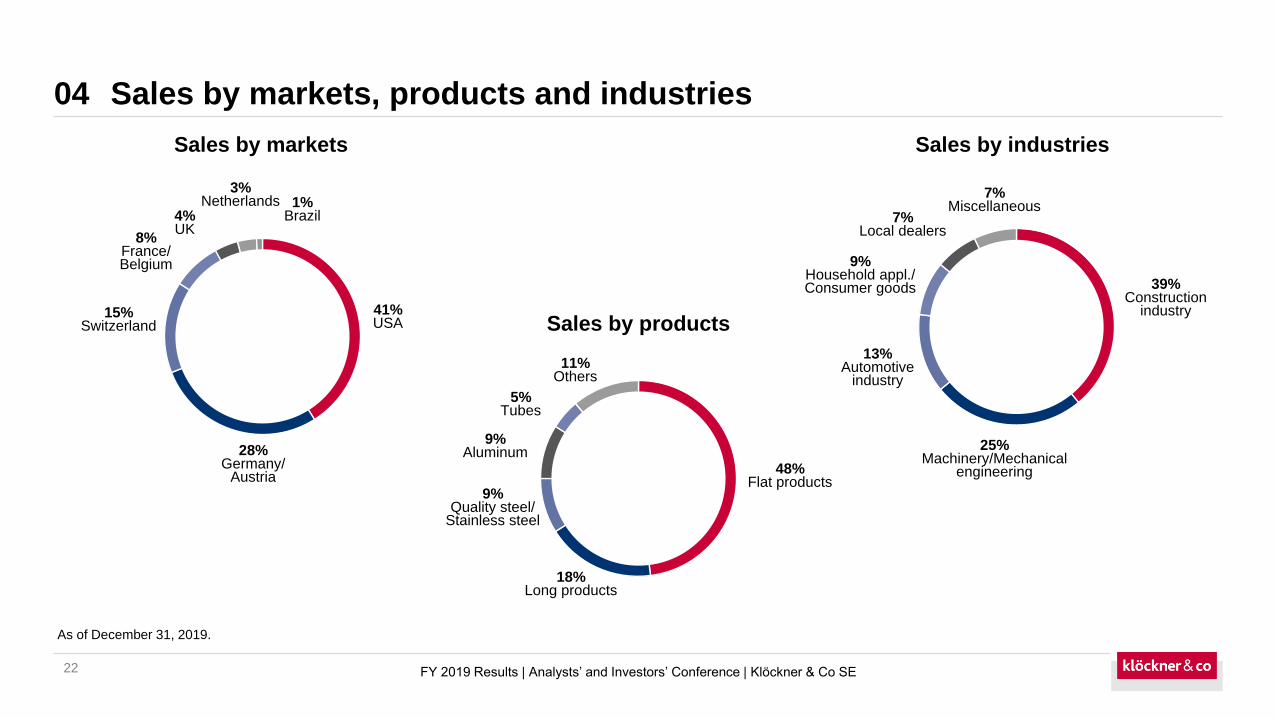
Sales by markets, products and industries
22
04
As of December 31, 2019.
Sales by industries
Sales by products
Sales by markets
4%UK
8%France/Belgium
15%Switzerland
28%Germany/
Austria
41%USA
3%Netherlands 1%
Brazil
9%Aluminum
5%Tubes
9%Quality steel/
Stainless steel
18%Long products
48%Flat products
11%Others
13%Automotive
industry
7%Miscellaneous
7%Local dealers
25%Machinery/Mechanical
engineering
39%Construction
industry
9%Household appl./Consumer goods
FY 2019 Results | Analysts’ and Investors’ Conference | Klöckner & Co SE

Current shareholder structure
23
04
FY 2019 Results | Analysts’ and Investors’ Conference | Klöckner & Co SE
Geographical breakdown of identified
institutional investors
• Identified institutional investors account for 62%
• German investors incl. retail dominate
• Top 10 shareholdings represent around 49%
• Retail shareholders represent 27%
As of December 2019.
6% Rest of EU
28% US
3% Rest of world1% Switzerland
4% UK
1% France
57% Germany
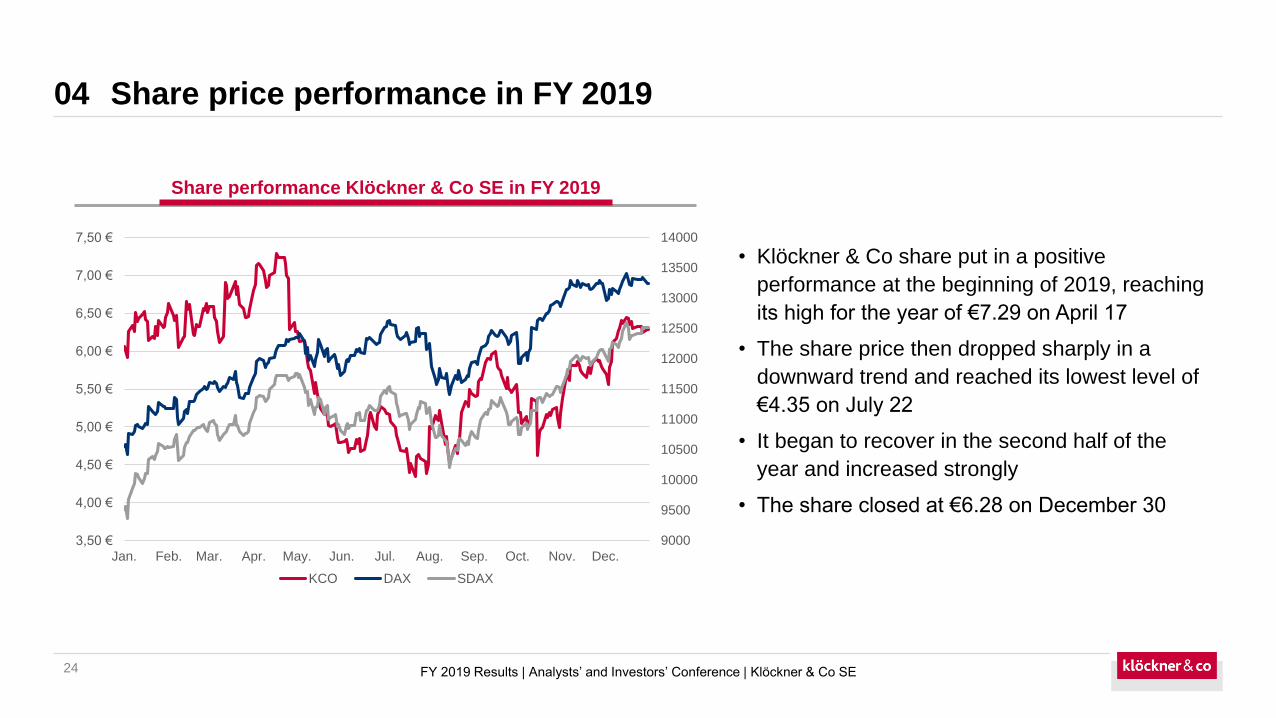
Share price performance in FY 2019
24
04
• Klöckner & Co share put in a positive
performance at the beginning of 2019, reaching
its high for the year of €7.29 on April 17
• The share price then dropped sharply in a
downward trend and reached its lowest level of
€4.35 on July 22
• It began to recover in the second half of the
year and increased strongly
• The share closed at €6.28 on December 30
FY 2019 Results | Analysts’ and Investors’ Conference | Klöckner & Co SE
9000
9500
10000
10500
11000
11500
12000
12500
13000
13500
14000
3,50 €
4,00 €
4,50 €
5,00 €
5,50 €
6,00 €
6,50 €
7,00 €
7,50 €
Jan. Feb. Mar. Apr. May. Jun. Jul. Aug. Sep. Oct. Nov. Dec.
KCO DAX SDAX
Share performance Klöckner & Co SE in FY 2019
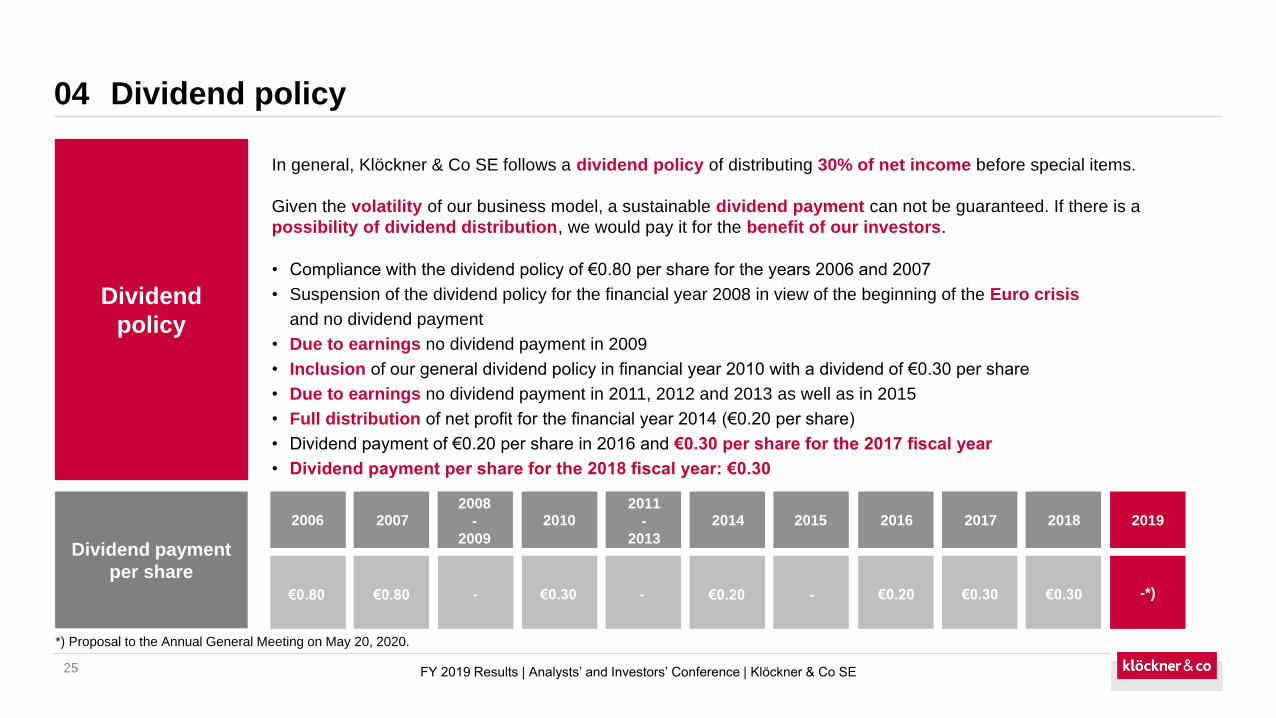
Dividend policy
25
04
In general, Klöckner & Co SE follows a dividend policy of distributing 30% of net income before special items.
Given the volatility of our business model, a sustainable dividend payment can not be guaranteed. If there is a
possibility of dividend distribution, we would pay it for the benefit of our investors.
• Compliance with the dividend policy of €0.80 per share for the years 2006 and 2007
• Suspension of the dividend policy for the financial year 2008 in view of the beginning of the Euro crisis
and no dividend payment
• Due to earnings no dividend payment in 2009
• Inclusion of our general dividend policy in financial year 2010 with a dividend of €0.30 per share
• Due to earnings no dividend payment in 2011, 2012 and 2013 as well as in 2015
• Full distribution of net profit for the financial year 2014 (€0.20 per share)
• Dividend payment of €0.20 per share in 2016 and €0.30 per share for the 2017 fiscal year
• Dividend payment per share for the 2018 fiscal year: €0.30
Dividend payment
per share
2006
€0.80
Dividend
policy
2007
€0.80
2008
-
2009
-
2011
-
2013
-
2014
€0.20
2015
-
2010
€0.30
2016
€0.20
2018
€0.30
FY 2019 Results | Analysts’ and Investors’ Conference | Klöckner & Co SE
2017
€0.30
2019
-*)
*) Proposal to the Annual General Meeting on May 20, 2020.
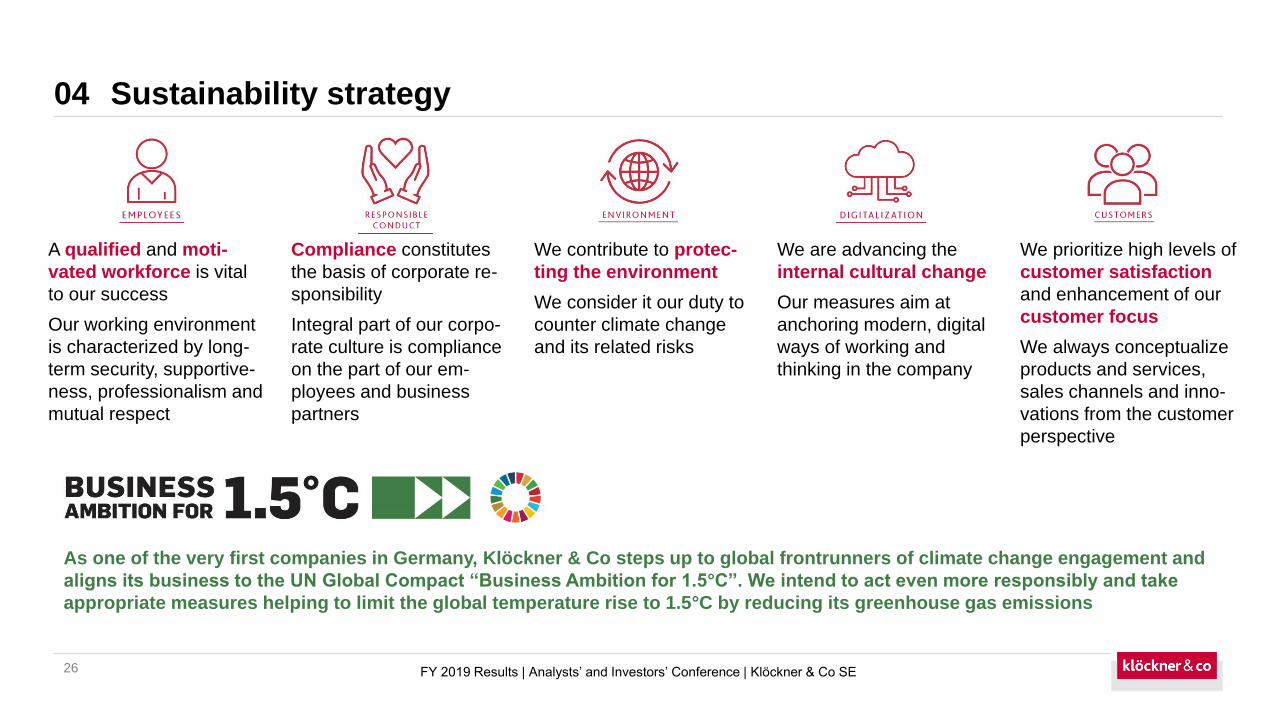
Sustainability strategy
26
04
FY 2019 Results | Analysts’ and Investors’ Conference | Klöckner & Co SE
As one of the very first companies in Germany, Klöckner & Co steps up to global frontrunners of climate change engagement and
aligns its business to the UN Global Compact “Business Ambition for 1.5°C”. We intend to act even more responsibly and take
appropriate measures helping to limit the global temperature rise to 1.5°C by reducing its greenhouse gas emissions
A qualified and moti-
vated workforce is vital
to our success
Our working environment
is characterized by long-
term security, supportive-
ness, professionalism and
mutual respect
Compliance constitutes
the basis of corporate re-
sponsibility
Integral part of our corpo-
rate culture is compliance
on the part of our em-
ployees and business
partners
We contribute to protec-
ting the environment
We consider it our duty to
counter climate change
and its related risks
We are advancing the
internal cultural change
Our measures aim at
anchoring modern, digital
ways of working and
thinking in the company
We prioritize high levels of
customer satisfaction
and enhancement of our
customer focus
We always conceptualize
products and services,
sales channels and inno-
vations from the customer
perspective

27
Financial calendar
Felix Schmitz
Head of Investor Relations, Internal Communications & Sustainability
Phone: +49 203 307 2295
Fax: +49 203 307 5025
Email: [email protected]
Internet: www.kloeckner.com
March 10, 2020 Annual financial statements 2019
May 4, 2020 Q1 quarterly statement 2020
May 20, 2020 Annual General Meeting 2020
August 14, 2020 Half-yearly financial report 2020
November 3, 2020 Q3 quarterly statement 2020
Contact details