Embed Size (px)
Citation preview

FY 2017 Results Presentation
Milan, 24th April 20182018 9M Results Presentation
Milan, 13th November 2018

FY 2017 Results Presentation
Milan, 24th April 2018Audience & Advertising

MACRO-ECONOMIC KEY INDICATORS
GDP & HH EXPENDITURE GOOD & SERVICE CONSUMPTION
CONSUMPTION PRICES
Inflation Rate (y.o.t monhtly var.)
GOOD & SERVICE CONSUMPTION BY MACRO-SECTOR
1.1
y.o.y montly growth rate, Source: CONFCOMMERCIOy.o.y growth rate
GDP
Inflation Rate (y.o.t monhtly var.) source: ISTAT
HH EXPENDITURE
ITALY | Macroeconomic scenarioKey Economic Indicators
SERVICES: + 1.9%AVG: + 0.2%GOODS: -0.6%
9M 2018
Recreational goods and services + 1.1%
Hotels and eating out +2.0%
Mobility goods and services -0.6%
Comunic. Goods and services +2.4%
Clothing and shoes -1.3%
Home goods and services 0.0%
Personal care goods & services + 1.0%
Food, beverages and tobacco - 0.8%-1
-0,5
0
0,5
1
1,5
2
2,5
2018: AVG: +1.2
-3,0
-2,0
-1,0
0,0
1,0
2,0
3,0
4,0
1.41,2 1.2
1.01.1
1.21.1
0.9 0.9 0.9
ISTAT (MAY 2018) BANCA ITALIA (JULY 2018) OCSE (SEPT. 2018)
PROMETEIA (SEPT. 2018) CSC (OCT 2018)
FCST OCT 1.0
| 3 |
-1.5 -1.0
-3.0 -3.4
-1.3-0.1
-4.8
2.4
-0.2
8.1
-8.2-7.4 -7.1
1.6
3.0
-7.5
-10
-8
-6
-4
-2
0
2
4
6
8
10
Food Beverage Pers.Care Home Care Clothing Retail Auto Telco
Sales AdEx
ITALY │Sector AnalysisSales & AdEx Trend by Key Sector
Jan – Sept 2018
| 4 |
Source: Nielsen, Confcommercio, UNRAE * Automotive Sales to Consumers; Adex Personal Care includes Toiletries.

9M 2018 vs 9M 2017 (Var %)
0.41.2
5.5
4.0
-7.3
5.0
Tot.Adv Mkt TV Radio Internet Print OOH
Mediaset addressable adv market +1.9%
ITALY | Analysis of the advertising market
| 5 |

9M 2017 9M 2018
1,458.7
MEDIASET 9M 2018 | Total advertising revenues 9M 2018 vs 9M 2017 (mio Eur)
1,423.3
+2.5%
| 6 |

3.5
35.4
9.78.3
12.6
30.5
MediasetRaiLa7
25.623.6
2.1
25.823.1
2.9
Mediaset DTT (Free+Pay)
Rai DTTDiscoverySky ChannelsFox ChannelsLa7 D
9.17.68.68.71.50.7
9.67.48.38.41.30.6
Sky+Fox-0.5
Mediaset
+0.7
La7+0.7
Rai -0,7
Other+0.1
Discovery-0.3
CORE CHANNELS
MULTICHANNELS
2017 2018
MEDIASET 9M 2018│Audience performanceCore channels vs multichannels, commercial target (15-64 yrs, 24H)
Jan – Sep 2018
| 7 |
Source: Auditel, Live+Vosdal

3.6
23.9
14.6
8.513.7
3.7
7.9
5.3
18.8 Food+4.6%
No Food-5.1%
TLC-3.4%
Auto+12.9%
Media8.0%
Pharma-4.1%
Retail+10.1%
Other+2.4%
MS TREND better than Total Adv Market
MS SHARE better than Total Adv Market
2.3
Finance+6.7%
MEDIASET 9M 2018│Advertising breakdown by sector9M 2018 vs 9M 2017
| 8 |
Source: Nielsen

Leading TV audience share: 36.4% on commercial target (15-64 yrs, 24 H) growing by 70 bps yoy
Mediaset FTA business delivering positive single digit yoy growth and outperforming the market (broadly flat* yoy)
Cross media strategy enabling adv market share expansion in 9M 18 vs 9M 17
Double digit yoy revenues growth (comparable basis) at Radio & Digital
MEDIASET 9M 2018│Advertising and audience performance
Successful launch of 2 new thematic channels: +1.9% audience share contribution
| 9 |
*Estimated

Key Drivers 1Q 2018 2Q 2018 3Q 2018 4Q 2018 Notes
Core channels• Positive audience trend for our core business• Strong line up and repositioning of Rete4 in
Autumn
Thematic channels • Leadership of our thematic channel portfolio
Football World Cup• Successful results• The highest audience share ever• Boost in Mediaset adv. collection
MS-Skyagreement
• Increase of audience share for MediasetPremium Cinema and Series channels
• Positive contribution to adv. collection• DAZN agreement on top
“Advanced TV”• First Screen Interactive Offer for connected
TVs, launched with football World Cup 2018• Extended Offer for Second Screen
MEDIASET│ Audience and Advertising Key drivers for 2018 and into 2019
| 10 |

FY 2017 Results Presentation
Milan, 24th April 2018Financials

MEDIASET GROUP 9M 2018 | P&L Highlights
(Euro mio) 9M 2017 9M 2018
Net Consolidated Revenues 2,473.0 2,433.5
Italy 1,772.4 1,737.9
Spain 701.3 696.4
EBITDA 858.5 753.7
Italy 551.2 473.9
Spain 307.5 280.4
EBIT 123.6 114.5
Italy (61.7) (66.8)
Spain 185.2 181.7
Net Profit reported 34.5 27.0
*Starting from 2018 July, 1st , Ei towers is consolidated with the equity method
**
Group Net Financial Position (1,395.8) (961.4)
Italy (1,495.9) (1,090.6)
Spain 100.1 129.2
| 12 |
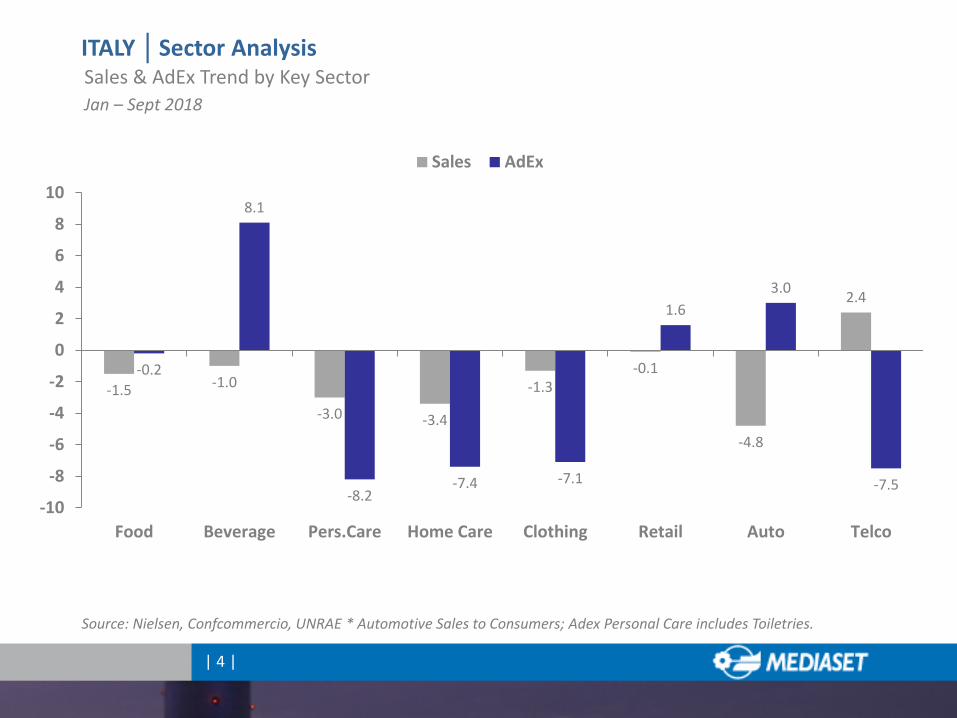
MEDIASET ITALIAN BUSINESS 9M 2018 | Integrated Tv activities
(Euro mio) 9M 2017 9M 2018
Total Net Revenues 1,772.4 1,737.9
Total Gross advertising revenues 1,423.3 1,458.7
Commissions (203.9) (208.2)
Total Net Advertising Revenues 1,219.4 1,250.5
Pay Tv Revenues 441.0 337.7
Other Revenues 112.0 149.6
Total Costs (1,834.1) (1,804.7)
Personnel Costs (281.7) (282.9)
Other Operating Costs* (939.5) (981.1)
Rights Amortisazion (554.9) (478.5)
Other Amortisazion & Depreciation (58.0) (62.2)
Operating Profit (61.7) (66.8)
*including costs vs EI Towers: 135.3 mio (9M2017) and 136.0 mio (9M2018)
| 13 |

MEDIASET ITALIAN BUSINESS 3Q 2018 | Integrated Tv activities costs
593543
479
3Q 2016 3Q 2017 3Q 2018
-19% vs 2016
(mio Euro)
| 14 |

MEDIASET ITALIAN BUSINESS 9M 2018 | P&L results
(Euro mio) 9M 2017 9M 2018
Operating Profit (61.7) (66.8)
Financial Income (Losses) (9.3) (13.2)
Associates 0.9 (1.4)
Pre-Tax Profit (70.0) (81.4)11.2
Taxes 9.4 11.1
Minorities 3.5 0.4
Discontinued operations 17.7 21.4
Net Profit reported (39.4) (48.6)
**
*Starting from 2018 July, 1st , Ei towers is consolidated with the equity method
| 15 |

MEDIASET ITALIAN BUSINESS 9M 2018 | Investments
354.7 382.7
20.118.3
(Euro mio) TV rights and cinema
Technical & immaterial
Total Investments
9M 20189M 2017
402.8373.1
**
*Starting from 2018 July, 1st , Ei towers is consolidated with the equity method
| 16 |

MEDIASET ITALIAN BUSINESS 9M 2018 | Cash flow statement
(Euro mio) 9M 2017 9M 2018
Initial Net Financial Position (1/01) reported (1,339.8) (1,527.5)
Cash Flow from Operation 492.0 440.0
Investments (373.1) (402.8)
Disinvestiments 6.6 0.0
Change in Net Working Capital (CNWC) (220.3) (38.9)
Cash Flow from Core Activities (94.7) (1.6)
Equity (investment)/disinvestment (36.5) (8.6)
Dividends received 153.4 129.2
Change in consolidation area (22.9) 0.1
Net Cash Flow (0.7) 119.1
Net Cash Flow discontinued operations (155.4) (40.1)
Net financial position discontinued operations 357.8
Final Net Financial Position (30/09) (1,495.9) (1,090.6)
**
*Starting from 2018 July, 1st , Ei towers is consolidated with the equity method
| 17 |

FY 2017 Results Presentation
Milan, 24th April 2018Back Up

MEDIASET SPANISH BUSINESS | Back up Slides

MEDIASET ESPANA 9M 2018 | P&L Results
(Euro mio) 9M 2017 9M 2018
Net Consolidated Revenues 701.3 696.4
Personnel (77.5) (76.6)
Other Operating Costs (316.3) (339.4)
EBITDA 307.5 280.4
Amortisation & Depreciation (122.3) (98.7)
EBIT 185.2 181.7
Financial Income (loss) (1.2) (0.2)
Associates 1.5 10.8
Pre-Tax Profit 185.5 192.3
Taxes (39.5) (45.4)
Net Profit 146.1 146.9
| 20 |

MEDIASET ESPANA 9M 2018 | Investments
131.1 117.7
8.2
(Euro mio) Tv rights and cinema
Co-production
Total Investments
156.1 131.3
9M 20189M 2017
5.48.8
Tangible & Intangible fixed assets
16.2
| 21 |

MEDIASET ESPANA 9M 2018 | Cash Flow Statement
(Euro mio) 9M 2017 9M 2018
Initial Net Financial Position (1/01) 177.4 135.3
Free Cash Flow 188.4 181.8
- Cash Flow from Operations 279.9 261.7
- Investments/Disinvestiments (156.0) (131.3)
- Change in Net Working Capital (CNWC) 64.5 51.4
Change in Equity 1.7 (1.6)
Financial investments 6.5 8.8
Dividends received 1.8 2.4
Dividends paid (175.7) (197.5)
Treasury shares (100.0) 0.0
Total Net Cash Flow (77.3) (6.1)
Final Net Financial Position (30/09) 100.1 129.2
| 22 |
Forward-looking Statements
Statements contained in this document, particularly the ones regarding any Mediaset Group possibleor assumed future performance, are or may be forward looking statements and in this respect theyinvolve some risks and uncertainties.
Mediaset Group actual results and developments may differ materially from the ones expressed orimplied by the above statements depending on a variety of factors.
Any reference to past performance of Mediaset Group shall not be taken as an indication of futureperformance.
This announcement does not constitute an offer to sell or the solicitation of an offer to buy thesecurities discussed herein.
The executive responsible for the preparation of the Mediaset S.p.A. accounts, declares that, as perpara. 2 art. 154-bis, of the “Testo Unico della Finanza”, that the accounting information contained inthis document corresponds to that contained in the company’s books.
Investor Relations Department:
Tel: +39 02 2514.7008
Fax: +39 02 2514.6719
Email: [email protected]
WebSite: www.mediaset.it/investor