Embed Size (px)
Citation preview

1
Baseline Report
December 2020
Future Fens Flood Risk Management

Future Fens Flood Risk Management - Baseline Report | December 2020
2 3
Cover Photo: The Ouse Washes in Flood; Paul Tibbs/Ian Burt Photography
Flood risk management in the Great Ouse Fens already prevents
the permanent flooding of over 17,000 households
Old Bedford Counter Drain Pidley Pumping Station Wissey out of channel during a 2015 flood event

Future Fens Flood Risk Management - Baseline Report | December 2020
4 5
Flood risk management in the Great Ouse Fens relies on over 300 assets such as 405km of raised embankments, pumping stations and sluice gates
Business supporting 70,000 jobs and 28%* of the workforce are protected from permanent flooding by flood risk management activities
Photo: King’s Lynn Docks, Martin Pearman
*within the Great Ouse Fens study area
Denver Complex from the air

Future Fens Flood Risk Management - Baseline Report | December 2020
6 7
Flooding of infrastructure is much more than an inconvenience - people take greater risks when
infrastructure is lost for long periods of time
Abandoned cars in the Ouse Washes
The cost of managing flood risk* over the next 100 years is in excess of £1.8 billion
Middle Level Barrier Bank
*Assumes maintaining the current Standard of Service only

Future Fens Flood Risk Management - Baseline Report | December 2020
8 9
Contents
1. INTRODUCTION
1.1. THE PROJECT1.2. PROJECT PARTNERS1.3. THIS REPORT
17
171819
2.3. HISTORY OF DRAINAGE AND FLOOD MANAGEMENT IN THE FENS FOCUSSING ON THE GREAT OUSE FENS2.3.1. PREHISTORIC AGES2.3.2. ROMAN PERIOD AND MIDDLE AGES2.3.3. SIXTEENTH CENTURY2.3.4. SEVENTEENTH CENTURY 2.3.5. EIGHTEENTH CENTURY2.3.6. NINETEENTH CENTURY2.3.7. TWENTIETH CENTURY
2.4. TWENTY FIRST CENTURY: THE GREAT OUSE FENS TODAY2.4.1. AGRICULTURE2.4.2. SILTATION AND BED LEVEL CHANGES
2.5. FLOOD RISK AND WATER LEVEL MANAGEMENT IN THE GREAT OUSE FENS2.5.1. SOUTH LEVEL2.5.2. MIDDLE LEVEL2.5.3. WEST OF OUSE2.5.4. EAST OF OUSE2.5.5. KING’S LYNN
26
28
29
31
31
34
35
36
3 8
42
46
50
54
64
74
78
80
2. GREAT OUSE FENS
2.1. GREAT OUSE FENS STUDY LOCATION AND EXTENT2.1.1. WELLAND AND NENE FENS LOCATION
2.2. MANAGING FLOOD RISKS: WHO IS RESPONSIBLE?2.2.1. DEFRA2.2.2. THE ENVIRONMENT AGENCY2.2.3. LEAD LOCAL FLOOD AUTHORITIES2.2.4. DISTRICT COUNCILS2.2.5. INTERNAL DRAINAGE BOARDS 2.2.6. HIGHWAY AUTHORITIES2.2.7. WATER AND SEWERAGE COMPANIES
21
2124
2424242525252525
2.6. SOURCES OF FLOOD RISK TO THE GREAT OUSE FENS2.6.1. CLIMATE CHANGE2.6.2. TIDAL 2.6.3. FLUVIAL2.6.4. SURFACE WATER2.6.5. SEWERS2.6.6. GROUNDWATER2.6.7. RESERVOIR
3. ECONOMIC APPRAISAL
3.1. APPROACH
3.2. TERMINOLOGY
3.3. SCENARIOS CONSIDERED3.3.1. DO NOTHING3.3.2. DO MINIMUM3.3.3. DAMAGES AND BENEFITS3.3.4. SENSITIVITY TO CHANGES IN ASSUMPTIONS3.3.5. WHAT IS INCLUDED?
82 8282 8587899090
93
9394969698
100100101
4. STAKEHOLDERS AND BENEFICIARY MAPPING
4.1. STAKEHOLDERS
4.2. BENEFICIARIES MAPPING
120
120120
FOREWORD
EXECUTIVE SUMMARY
11
12
3.4. SUMMARY OF DAMAGES AND BENEFITS3.4.1. TOTAL DAMAGES SUMMARY3.4.2. SOUTH LEVEL DAMAGES SUMMARY3.4.3. MIDDLE LEVEL DAMAGES SUMMARY3.4.4. WEST OF OUSE DAMAGES SUMMARY3.4.5. EAST OF OUSE DAMAGES SUMMARY3.4.6. KING’S LYNN DAMAGES SUMMARY
3.5. COSTS OF FLOOD RISK MANAGEMENT OVER THE NEXT 100 YEARS
3.6. PARTNERSHIP FUNDING
104
104105106107108109
110
112
5. CONCLUSIONS
6. GLOSSARY
7. REFERENCES
APPENDICES
126
128
132
132
Future Fens Flood Risk Management - Baseline Report | December 2020
10 11
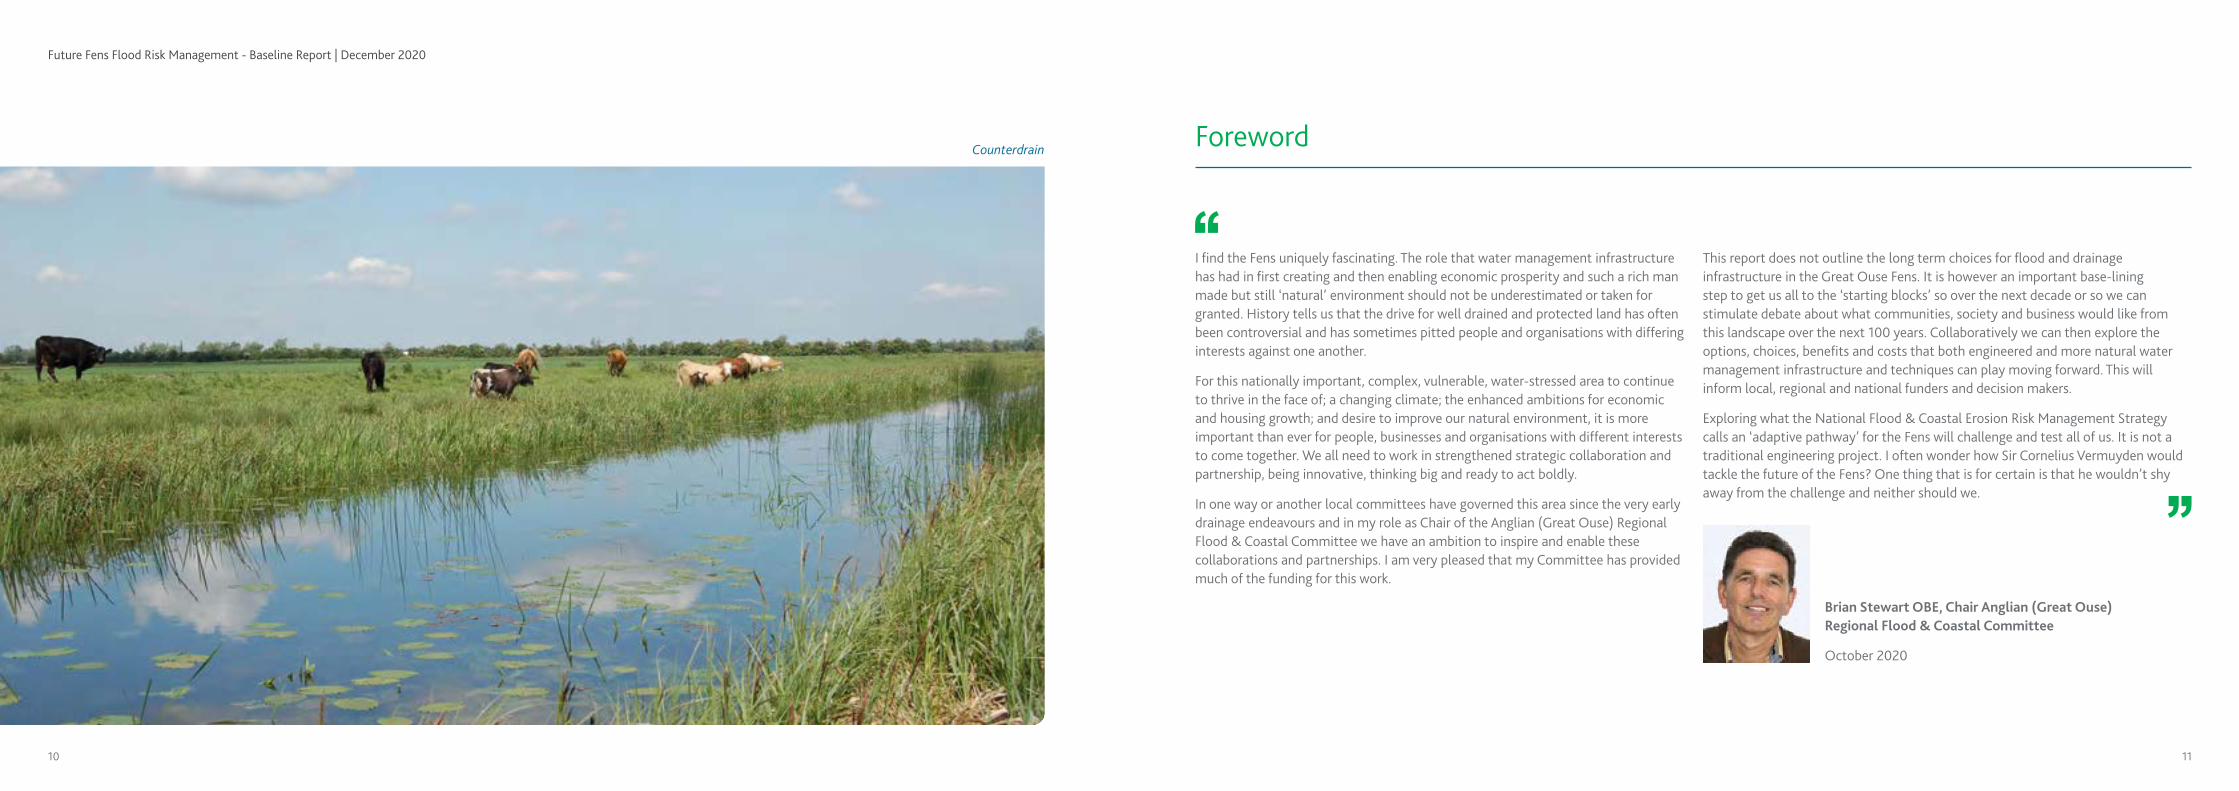
I find the Fens uniquely fascinating. The role that water management infrastructure has had in first creating and then enabling economic prosperity and such a rich man made but still ‘natural’ environment should not be underestimated or taken for granted. History tells us that the drive for well drained and protected land has often been controversial and has sometimes pitted people and organisations with differing interests against one another.
For this nationally important, complex, vulnerable, water-stressed area to continue to thrive in the face of; a changing climate; the enhanced ambitions for economic and housing growth; and desire to improve our natural environment, it is more important than ever for people, businesses and organisations with different interests to come together. We all need to work in strengthened strategic collaboration and partnership, being innovative, thinking big and ready to act boldly.
In one way or another local committees have governed this area since the very early drainage endeavours and in my role as Chair of the Anglian (Great Ouse) Regional Flood & Coastal Committee we have an ambition to inspire and enable these collaborations and partnerships. I am very pleased that my Committee has provided much of the funding for this work.
This report does not outline the long term choices for flood and drainage infrastructure in the Great Ouse Fens. It is however an important base-lining step to get us all to the ‘starting blocks’ so over the next decade or so we can stimulate debate about what communities, society and business would like from this landscape over the next 100 years. Collaboratively we can then explore the options, choices, benefits and costs that both engineered and more natural water management infrastructure and techniques can play moving forward. This will inform local, regional and national funders and decision makers.
Exploring what the National Flood & Coastal Erosion Risk Management Strategy calls an ‘adaptive pathway’ for the Fens will challenge and test all of us. It is not a traditional engineering project. I often wonder how Sir Cornelius Vermuyden would tackle the future of the Fens? One thing that is for certain is that he wouldn’t shy away from the challenge and neither should we.
ForewordCounterdrain
Brian Stewart OBE, Chair Anglian (Great Ouse) Regional Flood & Coastal Committee
October 2020

Future Fens Flood Risk Management - Baseline Report | December 2020
12 13
Executive Summary
Flood Risk Management for the Fens
The Environment Agency’s ‘Flood Risk Management for the Fens’ project considers what the future flood risk management choices for the Great Ouse Fens might look like. This study is the first of three main phases in an ambitious programme that will develop options and then deliver the future flood and drainage infrastructure that will provide flood resilience in and around the Fens for future generations. Future phases will need to be developed in collaboration with other major infrastructure investment programmes in housing, water resources, transport and energy in order to identify and unlock opportunities to integrate and provide best value for money.
This will also enable us all to maximise the environmental and social wellbeing value that investment in flood resilience provides. This report presents the findings of the first phase in the programme, setting out our shared understanding of the situation and challenges for managing all sources of flood risk, with the overall aim to develop flood risk options for the area’s long term flood risk management strategy, which will in turn feed into long term regional growth plans.
Organisations with flood risk assets in the project area are represented by members of the project’s Technical Group (TG). The two most important outcomes for phase 1 are for the TG to have a shared understanding of the current situation and the challenges for managing future flood risk in the Great Ouse Fens, and to have shared ownership for taking action to overcome these challenges.
The TG has worked together to set out all available data about flood risk in the area to calculate:
• Whole life costs to sustain the existing flood risk management assets
• Benefits of the existing flood risk management assets
• Total available Flood Risk Management Grant in Aid (Government funding)
This information has been used to highlight the difference between the funding required and the available funding.
The Great Ouse Fens is an area of 217,800 hectares of rural lowland, much of which is below sea level. It contains 130,878 households, 13,212 industrial and commercial properties, and a range of road, rail and utilities infrastructure. The area has large swathes of highly rich agricultural soil sustained by the artificial network of drains and water resource channels, and over time the navigable waterways managed by the Middle Level Commissioners have also become the UK’s 4th largest navigation network.
Over the centuries land in the Fens has lowered due to peat degradation and shrinkage resulting from agricultural and drainage activities. Drainage of the Great Ouse Fens commenced as early as Roman times, with creation of some flood risk management assets in 1600 which are still present today. Pressures on the Great Ouse Fens come from many sources, for example housing and infrastructure in the short to medium term and rising sea levels in the longer term.
The Great Ouse Fens is an area of national agricultural importance due to its rich peaty soils. The study area includes 2.1% of England’s farmed area and produces 4.4% of England’s total agricultural output, worth an estimated £740 million per year. Around 88% of all land in the Great Ouse Fens is cultivated. Due to area’s fertile peaty soils 82% of Fenland farmland is either grade 1 or 2 agricultural land, and accounts for about half of England’s grade 1 agricultural land.
The study area has been split into five separate sub catchments for this study, which are South Level, Middle Level, West of Ouse, East of Ouse and King’s Lynn.
Flood risk is managed through flood risk management (FRM) assets owned and maintained by the Environment Agency (EA), other Risk Management Authorities (RMAs), and landowners. This extensive and complex network includes drainage channels and other assets including 138 pumping stations, 24 sets of sluice gates, 95km of coastal defences and 405km of fluvial embankments. The system has continuously evolved with assets being created and modified; today and going into the future the system needs ongoing and active management. Many of the FRM assets are nearing the end of their design life and will require significant investment to keep fulfilling their function.
There are a number of large key FRM structures in the Great Ouse Fens. The Ely Ouse Flood Protection scheme is the latest major scheme, built in the 1950s-60s as a result of devastating floods in 1937 and 1947. Works included the construction of the Relief Channel, Cut-Off Channel, and bank improvement works to the Ten Mile and Ely Ouse rivers. In 2020 prices these works would cost over £150 million.
Other notable assets include the Denver Sluice Complex, and the Ouse Washes which at 90 million m3 of flood storage is Britain’s largest wash land occupying around 2,500 hectares. Welmore Sluice and Pumping Station allow flood water to re-join the Hundred Foot River from the Ouse Washes. In 1844, the Middle Level Main Drain was excavated to connect the Middle Level Area to the Great Ouse Tidal River at St. Germans; the latest St Germans Pumping Station was constructed and went online in April 2010 with a discharge capacity of 100m3/s, making it the largest pumping station in Britain, and the primary drainage outlet for an area of nearly 700km2.
Bevills Leam Pumping Station was constructed 1983 to boost the flow into the Middle Level River System and to provide temporary controlled storage of highland flood water. A Catchwater Drain collects the highland water, cutting off the upland brooks and redirecting flows to Bevills Leam. Additionally, in times of high flows it is possible to divert water to be stored in Woodwalton Fen National Nature Reserve, which can store 2 million m3 of water.
The Great Ouse Fens Flood Risk Management
River Delph at Welney on December 2020
Future Fens Flood Risk Management - Baseline Report | December 2020
14 15
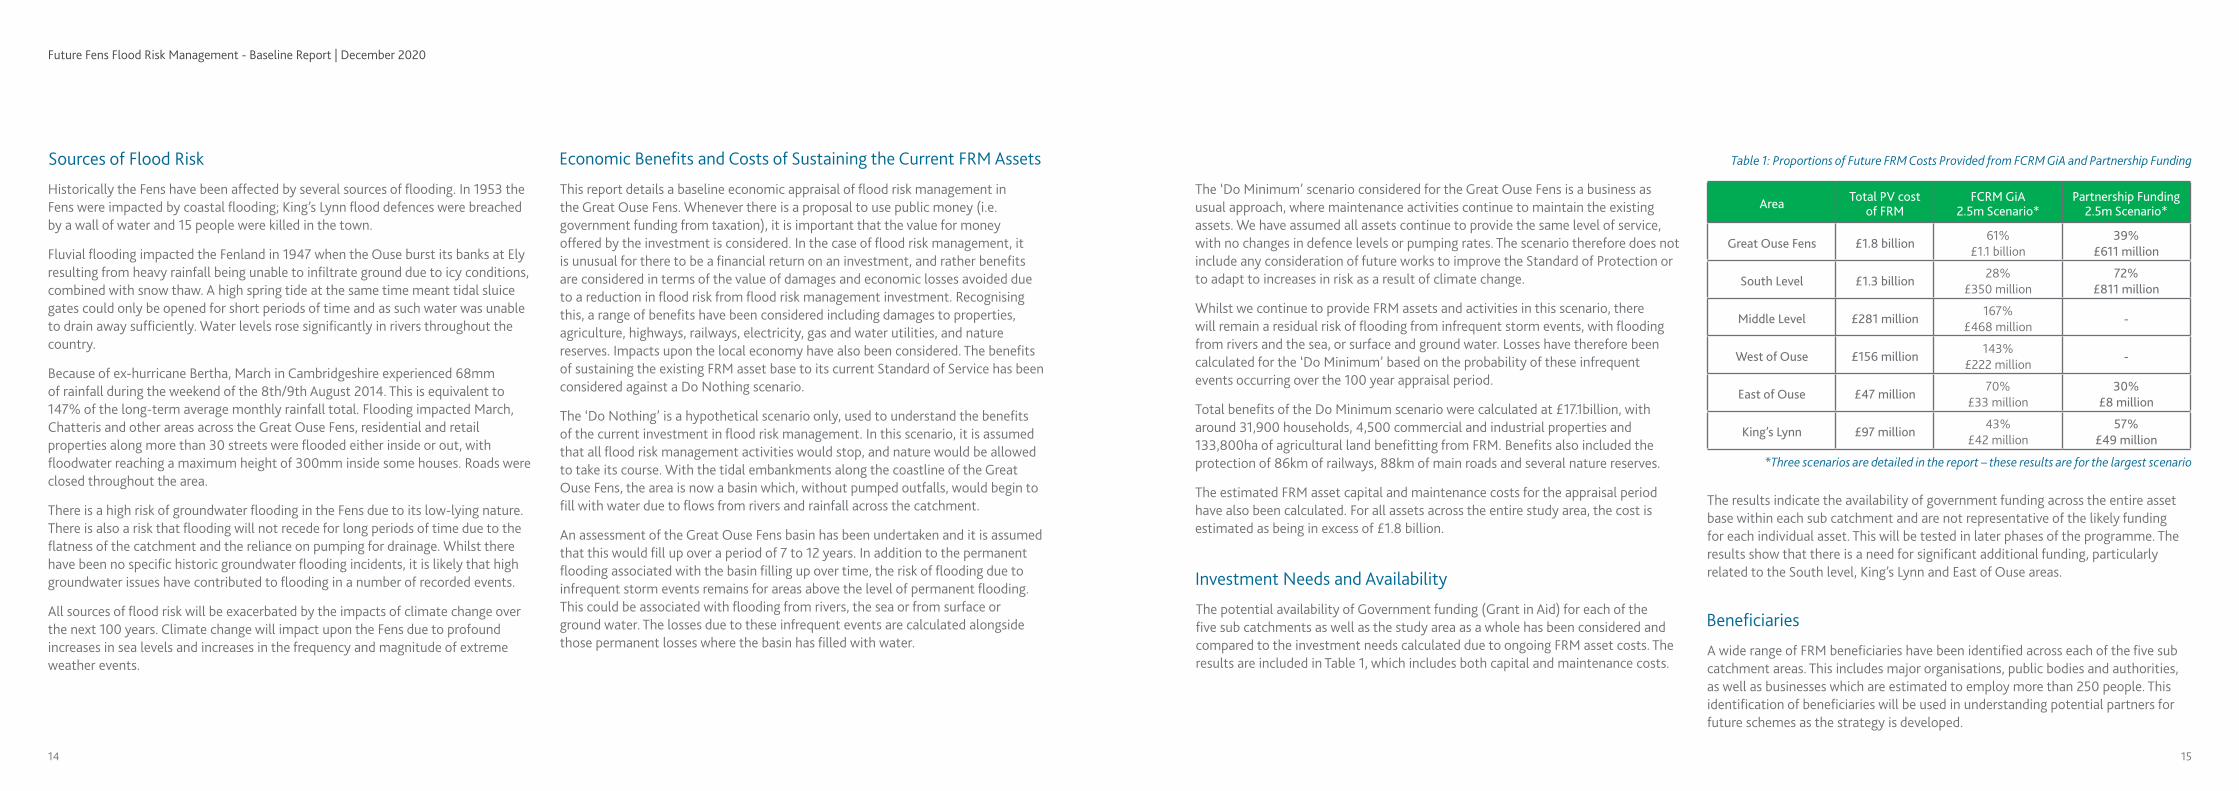
The ‘Do Minimum’ scenario considered for the Great Ouse Fens is a business as usual approach, where maintenance activities continue to maintain the existing assets. We have assumed all assets continue to provide the same level of service, with no changes in defence levels or pumping rates. The scenario therefore does not include any consideration of future works to improve the Standard of Protection or to adapt to increases in risk as a result of climate change.
Whilst we continue to provide FRM assets and activities in this scenario, there will remain a residual risk of flooding from infrequent storm events, with flooding from rivers and the sea, or surface and ground water. Losses have therefore been calculated for the ‘Do Minimum’ based on the probability of these infrequent events occurring over the 100 year appraisal period.
Total benefits of the Do Minimum scenario were calculated at £17.1billion, with around 31,900 households, 4,500 commercial and industrial properties and 133,800ha of agricultural land benefitting from FRM. Benefits also included the protection of 86km of railways, 88km of main roads and several nature reserves.
The estimated FRM asset capital and maintenance costs for the appraisal period have also been calculated. For all assets across the entire study area, the cost is estimated as being in excess of £1.8 billion.
Historically the Fens have been affected by several sources of flooding. In 1953 the Fens were impacted by coastal flooding; King’s Lynn flood defences were breached by a wall of water and 15 people were killed in the town.
Fluvial flooding impacted the Fenland in 1947 when the Ouse burst its banks at Ely resulting from heavy rainfall being unable to infiltrate ground due to icy conditions, combined with snow thaw. A high spring tide at the same time meant tidal sluice gates could only be opened for short periods of time and as such water was unable to drain away sufficiently. Water levels rose significantly in rivers throughout the country.
Because of ex-hurricane Bertha, March in Cambridgeshire experienced 68mm of rainfall during the weekend of the 8th/9th August 2014. This is equivalent to 147% of the long-term average monthly rainfall total. Flooding impacted March, Chatteris and other areas across the Great Ouse Fens, residential and retail properties along more than 30 streets were flooded either inside or out, with floodwater reaching a maximum height of 300mm inside some houses. Roads were closed throughout the area.
There is a high risk of groundwater flooding in the Fens due to its low-lying nature. There is also a risk that flooding will not recede for long periods of time due to the flatness of the catchment and the reliance on pumping for drainage. Whilst there have been no specific historic groundwater flooding incidents, it is likely that high groundwater issues have contributed to flooding in a number of recorded events.
All sources of flood risk will be exacerbated by the impacts of climate change over the next 100 years. Climate change will impact upon the Fens due to profound increases in sea levels and increases in the frequency and magnitude of extreme weather events.
Sources of Flood Risk Economic Benefits and Costs of Sustaining the Current FRM Assets
This report details a baseline economic appraisal of flood risk management in the Great Ouse Fens. Whenever there is a proposal to use public money (i.e. government funding from taxation), it is important that the value for money offered by the investment is considered. In the case of flood risk management, it is unusual for there to be a financial return on an investment, and rather benefits are considered in terms of the value of damages and economic losses avoided due to a reduction in flood risk from flood risk management investment. Recognising this, a range of benefits have been considered including damages to properties, agriculture, highways, railways, electricity, gas and water utilities, and nature reserves. Impacts upon the local economy have also been considered. The benefits of sustaining the existing FRM asset base to its current Standard of Service has been considered against a Do Nothing scenario.
The ‘Do Nothing’ is a hypothetical scenario only, used to understand the benefits of the current investment in flood risk management. In this scenario, it is assumed that all flood risk management activities would stop, and nature would be allowed to take its course. With the tidal embankments along the coastline of the Great Ouse Fens, the area is now a basin which, without pumped outfalls, would begin to fill with water due to flows from rivers and rainfall across the catchment.
An assessment of the Great Ouse Fens basin has been undertaken and it is assumed that this would fill up over a period of 7 to 12 years. In addition to the permanent flooding associated with the basin filling up over time, the risk of flooding due to infrequent storm events remains for areas above the level of permanent flooding. This could be associated with flooding from rivers, the sea or from surface or ground water. The losses due to these infrequent events are calculated alongside those permanent losses where the basin has filled with water.
Beneficiaries
A wide range of FRM beneficiaries have been identified across each of the five sub catchment areas. This includes major organisations, public bodies and authorities, as well as businesses which are estimated to employ more than 250 people. This identification of beneficiaries will be used in understanding potential partners for future schemes as the strategy is developed.
The results indicate the availability of government funding across the entire asset base within each sub catchment and are not representative of the likely funding for each individual asset. This will be tested in later phases of the programme. The results show that there is a need for significant additional funding, particularly related to the South level, King’s Lynn and East of Ouse areas.
Area Total PV cost of FRM
FCRM GiA2.5m Scenario*
Partnership Funding 2.5m Scenario*
Great Ouse Fens £1.8 billion61%
£1.1 billion39%
£611 million
South Level £1.3 billion28%
£350 million72%
£811 million
Middle Level £281 million167%
£468 million-
West of Ouse £156 million143%
£222 million-
East of Ouse £47 million70%
£33 million30%
£8 million
King’s Lynn £97 million43%
£42 million57%
£49 million
Investment Needs and Availability
The potential availability of Government funding (Grant in Aid) for each of the five sub catchments as well as the study area as a whole has been considered and compared to the investment needs calculated due to ongoing FRM asset costs. The results are included in Table 1, which includes both capital and maintenance costs.
Table 1: Proportions of Future FRM Costs Provided from FCRM GiA and Partnership Funding
*Three scenarios are detailed in the report – these results are for the largest scenario

Future Fens Flood Risk Management - Baseline Report | December 2020
16 17
1.1. The Project
Flood risk management for the Great Ouse Fens - planning together for a sustainable future
‘Flood risk management for the Fens’ is a project that has been set up to consider what the future flood risk management choices for the Great Ouse Fens might look like. We are currently in the first phase of this project which is developing a shared understanding of the situation and challenges for managing all sources of flood risk in the Great Ouse Fens.
The Great Ouse Fens comprise approximately 217,800 hectares of rural lowland, much of which is below sea level. The area contains 130,878 households and 13,212 industrial and commercial properties. The A1(M) runs across the southern part of the study area, and there are a number of other A roads linking the main urbanised areas of King’s Lynn, Ely, March and Downham Market, as well as Peterborough and Cambridge which are just outside the study area. The Cambridge to King’s Lynn railway and Cambridge to Peterborough railway also cross the area, used by passengers and freight between the East Coast Main Line and the North East of England.
Flood risk is managed through a complex and extensive set of thousands of flood risk management (FRM) assets owned and maintained by the Environment Agency (EA), other Risk Management Authorities (RMAs) and landowners. This includes at least 138 pumping stations, 24 sets of sluice gates, 95 kilometres of raised coastal embankments and approximately 405 kilometres of raised fluvial embankments.
It is essential that we understand the choices available to us for flood risk management of the Great Ouse Fens. This report explains those choices.
Understanding the choices available to us all in the future flood risk management of the Great Ouse Fens is detailed in this report.
The drainage of the Great Ouse Fens commenced as early as Roman times and the origin of the creation of some of the assets that are in place today started in the 1600s.The drainage of the Great Ouse Fens and creation of some of the assets that are in place today started in the 1600s. The system has continuously evolved with assets created and modified. The last major Great Ouse Fens improvement scheme was the Ely Ouse Flood Protection scheme in the 1950s-60s. The system needs ongoing and active management today and in the future. Much of this infrastructure is nearing the end of its design life and will require significant investment to keep fulfilling its function.
Pressures on the Great Ouse Fens come from many sources, for example housing and infrastructure in the short to medium term and climate change raising sea levels in the longer term.
A Technical Group has been formed of organisations, within the area, who either have flood risk assets, or represent those who do. This includes the main Consortia of Internal Drainage Boards (IDBs), Lead Local Flood Authorities, Environment Agency, Anglian Water, Water Resources East, Anglian (Great Ouse) Regional Flood and Coastal Committee and the National Farmers Union.
1.0 IntroductionFigure 1: Confluence of the Ten Mile river with the Tidal Hundred Foot and the Tidal Ouse at Denver Sluice. Bill Blake Heritage Documentation

Future Fens Flood Risk Management - Baseline Report | December 2020
18 19
1.2. Project PartnersProject partners for the Great Ouse Future Fens flood risk management study are shown on Figure 3. The project delivery team includes the Environment Agency with the appointed consultants Capita Aecom. A Technical Group has also been established.
The Technical Group will:
• Establish the scale of future funding challenge and publish the findings;
• Actively engage other Fens stakeholders to plan how future flood risk will be managed in the Fens; and
• Engage and influence decision makers.
The Group have been meeting regularly for the last 2 years, gathering together all of the data about flood risk in the area in order to better understand who is managing the assets, the asset maintenance costs involved, and how much Flood Risk Management Grant in Aid (Government funding) is potentially available.
Speaking about the project, Paul Burrows, Flood & Coastal Risk Manager for the Great Ouse Catchment, at the EA, said:
“Long term climate resilience for people, business and wildlife that benefit from the water management infrastructure in the Fens is not something flood authorities can tackle quickly or independently. The most important outcome for the first phase of this journey is to build a truly shared understanding of the challenges we face in managing flood resilience in the Fens”.
This study is the first of three main phases in an ambitious programme that will develop options and then deliver the future flood and drainage infrastructure that will provide flood resilience in and around the Fens for future generations. Future phases will need to be developed in collaboration with other major infrastructure investment programmes in housing, water resources, transport and energy in order to identify and unlock opportunities to integrate and provide best value for money. This will also enable us all to maximise the environmental and social wellbeing value that investment in flood resilience provides.
The final elements of Phase 1 will be some visualisation work to help us all engage others in helping develop the scope for Phase 2. Phase 2 will most likely be a long term adaptive plan for flood infrastructure in the Fens, which will build on the approaches outlined within the National Flood and Coastal Erosion Risk Management (FCERM) Strategy and appraise the flood infrastructure choices available to decision makers and prospective funders. The National FCERM Strategy contains an important measure to this end, the only measure within the whole document that is focussed on a specific geographical place:
Figure 2: Flood Risk Management for the Great Ouse Fens Programme Phases
ENGAGEMENT WITH STAKEHOLDERS AND PARTNERS
PHASE 1Years 1 – 3
BASELINE REPORTUnderstanding the future
challenges and establishing partnerships
PHASE 2Years 5 – 10OPTIONS
Testing options and choosing the preferred strategic flood risk management approach
PHASE 3Years 10 – 15
PLANNING AND DELIVERYPutting the strategy into
action, planning and delivering flood risk management options
• Baseline report• Understanding the scale of the funding challenge• Understanding who benefits• Project partners and stakeholders• Shared data between partners
• A partnership led approach• Hydraulic modelling• Funding and investment strategy• Environmental appraisals• Options
• Potential funding shortfall of 60-90%
PHA
SED
ETA
ILS
Measure 1.5.4: By 2025 the Environment Agency will work with farmers, land managers, water companies, internal drainage boards and other partners to develop a long-term plan for managing future flood risk in the Fens.
Figure 3: Great Ouse Flood Risk Management Technical Group Members
1.3. This ReportThis Baseline Report presents the results of Phase 1. It is designed to be used as a tool for all partners and stakeholders in identifying beneficiaries, raising awareness of long-term flood risk management needs and understanding of where there are FCERM (Flood and Coastal Erosion Risk Management) Partnership Funding requirements for the 100-year study appraisal period.
The remainder of the report is structured as follows:
Chapter 2: Study AreaDescribes characteristics of the study area in terms of flood risk and water level management.
Chapter 3: Economic SummaryDescribes the results of the economic appraisal and projected funding requirements.
Chapter 4: FRM Stakeholders and Beneficiaries MappingProvides a list of the key project stakeholders and describes who benefits from FRM in the Great Ouse Fens.

Future Fens Flood Risk Management - Baseline Report | December 2020
20 21
2.1. Great Ouse Fens Study Location and Extent
River Wissey
2.0 Great Ouse Fens
The River Great Ouse is the fourth longest river in the United Kingdom, with an overall length of 230km. It begins its journey in Central England at Wappenham in Northamptonshire, and makes its way through Buckinghamshire, Bedfordshire and Cambridgeshire before discharging into The Wash at King’s Lynn in Norfolk.
The catchment area for the river extends over 8,500 km2 and is home to around 1.7 million people.
The river is tidally influenced from Brownshill Staunch, near Needingworth, Cambridgeshire. Around 3km downstream of this the river splits at Earith sluice, with much of the flow being diverted over 31 kilometres through the Ouse Washes, a manmade flood storage reservoir, and some through the adjacent tidal Hundred Foot river which runs parallel with the Washes. From Earith the course of the Ouse continues in a wide loop down the Old West, becoming the Ely Ouse and then finally the Ten Mile bank, before re-joining the tidal River Ouse at Denver just below the outfall of the Ouse Washes at Welmore Sluice on the tidal Hundred Foot river. The Tidal River Ouse eventually discharges past King’s Lynn into the Wash.
The Great Ouse Fens area considered in this report covers 2,178km2 of Cambridgeshire and Norfolk adjacent to the lower reach of the Great Ouse River from Earith to The Wash. The area includes 130,878 residential properties, 13,068 non-residential properties and 184,895 hectares (1,849km2) of agricultural land.
This report considers the next 100-years of flood risk management for the Great Ouse Fens; the study area has been split into five sub-catchment areas, each with their own unique set of management drivers, beneficiaries and stakeholders. The five sub catchment areas are detailed further in section 2.5 and are the Middle Level, South Level, West of Ouse, East of Ouse and King’s Lynn.
The Great Ouse Fens study area consists of a complex system of channels forming a branched network, managed by numerous water level management structures. Watercourses in the study area include: the Hundred Foot River (also known as New Bedford River) from Earith to Denver and the Great Ouse Tidal River from Denver to King’s Lynn. Other watercourses in the area include: Old Bedford River, Ely Ouse, Wissey, Lark and Cam. In addition to the rivers there is an extensive network of drains including the Middle Level main drain, the Forty Foot drain and the Sixteen Foot drain. The tidal Hundred Foot River has raised embankments in excess of 6 metres, whilst the adjacent old Bedford River and the Flood Relief Channel don’t.

Future Fens Flood Risk Management - Baseline Report | December 2020
22 23
Watercourses and banks support diverse habitats;Photo - Counterdrain
The complexity of the drainage network helps creates the character and beauty of the Great Ouse Fens landscape, supporting the towns and villages as well as the biodiverse wildlife habitats and significant drainage engineering heritage.
The Ouse Washes is a 90,000,000m3 flood storage reservoir which is 31km long, and lies between the parallel Old Bedford and Hundred Foot Rivers. The area is seasonally flooded grassland of internationally recognised environmental value. The area has formal designation as a Site of Special Scientific Interest (SSSI), Special Protection Area (SPA) and Ramsar site. The Ouse Washes plays an important role in FRM of the area.
The key urban areas in this study area are March, Chatteris, Soham, Downham Market, Ely and King’s Lynn. Urban areas and villages are generally built on isolated ‘islands’ which are higher than the surrounding floodplain.
The topography is flat and low-lying with 32% of the study area lying below mean sea level, and 62% lying below 2.5m AOD (metres above Ordnance Datum). The natural catchment boundary on the south west is formed by the low clay hills of the Huntingdonshire uplands.
Higher ground is also found along the coast at The Wash. Since Roman times the low-lying terrain has steadily been getting lower due to heavily managed artificial drainage activities. The lowest area is furthest inland (close to the A1(M)) being as low as 4m below sea level and is generally acknowledged as the lowest land in the UK.
Climate change is widely recognised as one of the greatest threats facing not only the Great Ouse Fens but the entire world. The impacts of climate change, including profound increases in sea levels, increases in extreme weather events and the resultant increases in flood risk will greatly affect the Great Ouse Fens.
One of the impacts of climate change will be a rise in sea levels. Predictions based on the Environment Agency’s ‘Flood and coastal risk projects, schemes and strategies: climate change allowances’ guidance1 (Environment Agency, 2020) suggest that mean sea level could rise to between 0.21 and 0.34m AOD by 2050, resulting in 35-36% of the area lying below mean sea level. Within 100 years, mean sea level could rise to between 1.0 and 2.4m AOD, with the equivalent of 43-60% of the study area lying below this level.
Whilst climate change is recognised as a key threat to the Great Ouse Fens and the future of flood risk management in the area, there is at this stage of study a lack of existing data and modelling to inform a proper assessment of its likely impacts. Assessments have been made so far as is possible with available data. More detailed assessments will be made in future phases of the project using detailed modelling to ensure the scale of this threat is understood.
The area shown as the ‘Study Area’ in Figure 4 is referred to as the Great Ouse Fens in this report.
Figure 4: Study area and surrounding catchmentsBlack Tailed Godwit at Welney Wildfowl and Wetland Centre.
Photo: Welney Wetland Centre
1 www.gov.uk/guidance/flood-and-coastal-risk-projects-schemes-and-strategies-climate-change-allowances

Future Fens Flood Risk Management - Baseline Report | December 2020
24 25
The drainage of the Great Ouse Fens is inextricably linked with drainage from the Welland and Nene Fens which lie to the north of our study area, predominantly in Lincolnshire.
The intention is to undertake a similar study of the Welland and Nene Fens, which together with this study will inform our choices for Phase 2 of the Future Fens Strategy.
The study area will include both Fens and Lowland areas of the Lincs & Northants area. This area has specifically been identified as land below a level of 6mAOD, excluding land in and west of Lincoln.
The work undertaken in this commission will shape the adaptive approach in the Rivers Ancholme, Steeping, Witham, Welland & Nene. The area shown as the ‘The Fens’ in Figure 5 is referred to as the Fens in this report.
2.2. Managing flood risks: who is responsibleThe Environment Agency has permissive powers (not a duty) to carry out flood and coastal risk management work and to regulate the actions of other flood risk management authorities on main rivers and along the coast. Legal responsibility for main rivers lies with the landowners. On ordinary watercourses these powers reside with local authorities, or where they exist, Internal Drainage Boards (IDBs). If the Environment Agency chooses not to exercise its powers to maintain a flood defence or watercourse, it is not liable to third parties for losses, sustained as a result.
Consequently, the Environment Agency is not legally required to maintain flood defences but can decide, as it sees fit, whether or not to carry out maintenance works and the nature of any works it does carry out. Such decisions will be informed, for example, by government policy and assessments of flood risk, funding or environmental priorities.
As part of its strategic overview role, the Environment Agency has published its second National Flood and Coastal Risk Management Strategy for England. The strategy provides a lot more information designed to ensure that the roles of all those involved in managing risk are clearly defined and understood.
2.2.3. Lead Local Flood AuthoritiesLead Local Flood Authorities (unitary authorities or county councils) are responsible for developing, maintaining and applying a strategy for local flood risk management in their areas and for maintaining a register of flood risk assets. They also have lead responsibility for managing the risk of flooding from surface water, groundwater and ordinary watercourses.
2.2.4. District CouncilsDistrict Councils are key partners in planning local flood risk management and can carry out flood risk management works on minor watercourses, working with Lead Local Flood Authorities and others, including by taking decisions on development in their area which ensure that risks are effectively managed. District and unitary councils in coastal areas also act as coastal erosion risk management authorities.
2.2.5. Internal Drainage BoardsInternal Drainage Boards, which are independent public bodies responsible for water level management in low lying areas, also play an important role in the areas they cover (approximately 10% of England at present), working in partnership with other authorities to actively manage and reduce the risk of flooding. IDBs manage water levels in drainage districts; areas where there is a special need for drainage. This is often in broad open areas of lowland like the Great Ouse Fens. The drainage district each IDB covers is determined by the local hydrology and not by political boundaries.
2.2.6. Highway AuthoritiesHighway Authorities are responsible for providing and managing highway drainage and roadside ditches and must ensure that road projects do not increase flood risk.
2.2.7. Water and Sewerage CompaniesWater and Sewerage Companies are responsible for managing the risks of flooding from burst water mains, and foul, surface water or combined sewer systems that provide drainage from buildings and yards.
Figure 5: The Wider Fens
2.1.1. Welland and Nene Fens Location
Under the Flood and Water Management Act 2010 all risk management authorities mentioned below have a duty to co-operate with each other. The act also provides management authorities and the Environment Agency with a power to request information required in connection with their flood risk management functions. A key theme of the Pitt Review was for flood risk management authorities to work in partnership to deliver better flood risk management to the benefit of their communities.
2.2.1. DefraDefra has overall national responsibility for policy on flood and coastal erosion risk management and provides funding for flood risk management authorities through grants to the Environment Agency and local authorities.
2.2.2. The Environment AgencyThe Environment Agency is responsible for taking a strategic overview of the management of all sources of flooding and coastal erosion. This includes, for example, setting the direction for managing the risks through strategic plans; providing evidence and advice to inform Government policy and support others; working collaboratively to support the development of risk management skills and capacity; and providing a framework to support local delivery. The Environment Agency also has operational responsibility for managing the risk of flooding from main rivers, reservoirs, estuaries and the sea, as well as being a coastal erosion risk management authority.

Future Fens Flood Risk Management - Baseline Report | December 2020
26 27
2.3. History of Drainage and Flood Management in the Fenland Focussing on the Great Ouse Fens
QUATERNARY ICE AGEFenland formed; first settlements established
ROMAN PERIODMajor engineering works constructed (including canals and roads)
MIDDLE AGESFenland fully settled and commercially active
1588Dutch experts
examine the Fenland near Thorney
1590sSevere flooding
1600Act for reclamation approved
1630s‘Lynn Law’- Cornelius Vermuyden appointed to drain southern part
of the Fenland, construction of Old Bedford
1650‘Pretended Act’ Vermuyden instructed to make the Fenland dry year round
18th CENTURYIntroduction of pump engines
1936 -1940Continued flooding
1940Sir Murdoch MacDonald Report of Flood Protection published
1939-45 World War II(Flood Relief Channel project put on hold)
1947Major flooding
1949Great Ouse Flood Protection Act passed
1953Great Ouse Flood
Protection Act agreement reached
1954Murdoch MacDonaldscheme works started
1968Ely Ouse - Essex Water Act passed, resulting in
three new sluices to be built near Denver
1970Murdoch MacDonald scheme works finished
Sea level rises leaving Fens under water for two centuries
Francis, 4th Earl of Bedford, Henry Bone (Christie’s)
Sir Cornelius Vermuyden (1595-1677); Michiel Jansz. van Miereveld (Valence House Museum)
1844Middle Level Main Drain excavated to connect Middle Level Area to the Great Ouse at St. Germans
1934Pumping station at
St. Germans opened
Middle Level Main Drain, St Germans Pumping Station
2011New St. Germans Pumping
Station completed
2020Today, Phase 1 of the Future Fens
Flood Risk Management Project
The Church and Monasteries as major landowners hold power for management of drainage
1531Commissions of Sewers
1663General Drainage Act
1653Hundred Foot River built
The Church and Monasteries as major landowners hold power for management of drainage
The Bedford Level Corporation manage drainage in the Fens
1862Breakup of the Bedford Level Corporation
The Middle Level Commissioners take responsibility for drainage management within the Middle Level

Future Fens Flood Risk Management - Baseline Report | December 2020
28 29
The Oxford English Dictionary describes a ‘Fen’ as ‘a low and marshy or frequently flooded area of land’.
However, it also has a definition of the ‘Fens’ as ‘the flat low-lying areas of eastern England, mainly in Lincolnshire, Cambridgeshire, and Norfolk, formerly marshland but largely drained for agriculture since the 17th century’.
2.3.1. Prehistoric AgesThe Fens is a very low-lying area of England which was formed during the Quaternary Ice Age, when Britain and continental Europe were joined together. Despite being predominantly flat and low-lying, the surface of the Fens already had some ‘high’ spots known nowadays as ‘islands’.
Daniel Defoe (1660 – 1731) called the Fens “the sink of thirteen counties,” meaning that rivers drained most of Middle England into these low, flat lands. In the spring, these rivers would run in high floods, heavy with sediment. When they reached the flatter land in the Fens, they would slow down and drop the heaviest of their sediment load. Sand and clay bars would form and obstruct the channels, sending the rivers into wide meandering patterns, perhaps doubling their length before they meet the North Sea in the Wash, a large shallow bay. The longer the rivers took to fall to the sea, the slower they flowed, and the more sediment they dropped.
This process left the Fens with a shifting landscape of sluggish channels, choked by sediment banks both new and ancient. In between, standing water would foster rich marsh vegetation. This in turn caused the formation of peat, nearly pure plant material which had partially rotted to a brownish black mass but stopped rotting due to a lack of oxygen in the standing water. Peat, unlike normal vegetation, will never rot as long as it stays in standing water; over eons, it will turn into coal instead. Moreover, peat can accumulate at a remarkable rate - a foot or two in a decade.
Peat comprises terrestrial organic matter which has a high carbon concentration generated by photosynthesis. In deoxygenated standing water, organic matter does not rot, and instead peat forms. Over aeons this transforms into coal. Peat can accumulate at a rate of 300 to 600mm per decade. Peatland ecosystems are the Earth’s most efficient carbon sinks. When areas of peat are drained for agriculture, the lower water content causes its volume to shrink and the land to subside. Draining also exposes the peat to atmospheric oxygen leading it to decompose with carbon dioxide being released into the atmosphere.
Figure 6: Black Peaty Soils in the Great Ouse Fens
2.3.2. Roman Period and Middle Ages
The arrival of the Romans saw major engineering works including canals and roads being constructed. The areas we know as the Fens became a well-settled part of Roman Britain ruled from the town of Duroliponte (modern day Cambridge) by its native people, the Christianized Romano-Celtic Iceni.
At some point in the Roman period and between AD 350 and 550, there was a rise in sea levels, flooding the coasts of northern Europe with an extra 600mm of water. This brought with it a shift in the landscape, and sent the inhabitants of the coastal areas, folk known as Angles and Saxons, fleeing (or perhaps “conquering”) into ill-prepared Roman territories.
Extensive flooding from the rising sea brought with it vast silt deposits which settled along the coast in the areas illustrated on Figure 7. These silt deposits created embankments which held back upland streams and led to the formation of a number of large inland shallow lakes, or meres. The largest of these was Whittlesey Mere, the size of which varies across historic accounts, but has been reported at up to six miles by three miles. This would have made it the largest lake in lowland England.
When the Fens re-emerged from the sea after two centuries, Duroliponte and the Iceni had disappeared, and 121,400 hectares of marshlands covered the north-western flank of the pagan kingdom of East Anglia. The modern Fens had come into existence.
By medieval times, the Fens territory was fully used and settled. The Fenmen were a tough breed - stubbornly independent of the aristocracy, known to keep to themselves and resent outsiders. They found a good living, made better by tax avoidance, by fishing, catching waterfowl, trapping eels, coppicing willows and other marsh trees, making baskets, taking peat for fuel, and harvesting sedge and reeds. The area was very active commercially. The Fens was also home to some important monasteries, including Ely, Peterborough, Ramsey and Spalding, which were crucial to the commercial success of the area.
Approximate flooded area (on peat)
Islands and silt ridge
Meres
Settlesments in and around the Fens
Figure 7: How the Great Ouse Fens looked c.1066

Future Fens Flood Risk Management - Baseline Report | December 2020
30 31
Commercial activities at the time were heavily dependent on the existing natural waterways. During the early Middle Ages, the Rivers Nene, Ouse and the Cam were discharging into the sea at Wisbech. However, during the 13th century, the Wisbech estuary silted up and the Great Ouse began to flow via Wiggenhall into the sea at Lynn. As a result, goods from Cambridge and Ely were redirected towards Lynn before entering the Wash.
Throughout the Middle Ages, the marshland was naturally drained by a labyrinth of rivers; flood risk and drainage management was left to riparian landholders who looked after the assets in their territory, and the monasteries were chiefly responsible for keeping the channels in the region clear. These divided responsibilities for drainage management lead many to neglect or evade their duties. As a result, drainage was inadequately maintained. The ‘commission of the sewers’ was introduced at this time to ensure that landholders were fulfilling their duties. However, many of the commissioners were landholders themselves and remained unwilling to perform their duties.
Religion and religious figures held a great deal of power and influence during this period. One such figure was Bishop John Morton, the Bishop of Ely, and later Archbishop of Canterbury and Lord Chancellor. Around 1480, Morton was responsible for the cutting of the Mortons Leam. This predated the Smiths Leam, the current course of the River Nene between Peterborough and Guyhirn, which was dug by the Bedford Level Corporation around 250 years later.
Sir William Russell, by Marcus Gheeraerts the Younger
(tudorplace.com.ar)
2.3.3. Sixteenth Century
In 1531, following severe flooding, Henry VII decided to strengthen the administration of drainage by creating an Act of Parliament to grant further authority via the Commissions of Sewers. The Commissioners acquired judicial, executive and legislative powers, meaning that they had the right to punish offenders, administer financial arrangements for repairs, and make statutes and provisions as required. Crucially, however, the Commissioners had no right to construct new drains or banks.
Gradually, the idea of a large-scale drainage project to replace individual and local efforts was forming. In 1588, a general commission of the counties of Northampton, Lincoln, Cambridge and Huntingdon asked about the conditions of the Fens. Sir William Russell, second Earl of Bedford and Sewer Commissioner for Cambridgeshire, was among those taking an interest in the drainage of the area and brought three Dutch experts to examine the Fens near Thorney. Humprey Bardley, a Dutch surveyor, urged that the only way to drain the area was to direct the water along the shortest track possible through the biggest outfall at King’s Lynn.
2.3.4. Seventeenth Century
Before 1600, the Fens was still a vast low-lying area of estuarine wetland and shallow winding rivers. Much of it was below 2mAOD with its perimeter between 5 and 10mAOD; people had settled on intermittent Fen-islands which were marginally higher than the watercourses, the largest island being Ely at 26mAOD. The Fens was subject to frequent tidal inundation and flood flows from the upper catchments, particularly in winter.
Following some severe flooding in the late 1590s, pressure had grown on the local and national authorities to coordinate a definitive large-scale drainage solution, though there was some opposition from those with an interest in navigation, notably the University of Cambridge who received supplies via King’s Lynn. In 1600 an Act was approved for reclaiming many thousands of hectares of marshes within the Isle of Ely and the counties of Cambridge, Huntingdon, Northampton, Lincoln, Suffolk, Norfolk, Essex, Sussex and Kent. However, outside financial assistance was required due to a lack of funding from the state.
Francis Russell, the 4th Earl of Bedford and son of William, was tasked with freeing the Bedford Level from flooding. In 1630 he agreed a contract with the Commissioners of Sewers (who were responsible for Fens drainage) which was known as the “Lynn Law” after the town of King’s Lynn where it was drawn up.
Francis, 4th Earl of Bedford, Henry Bone
(Christie’s)
Fens Prior to any Drainage Work

Future Fens Flood Risk Management - Baseline Report | December 2020
32 33
Sir Cornelius Vermuyden (1595-1677); Michiel Jansz. van Miereveld (Valence House Museum)
The Earl, along with 12 associates known as Adventurers (i.e. venture capitalists), contracted to drain the southern part of the Fens within 6 years. The adventurers were offered part of the reclaimed land in exchange for their financial contributions.
The initial project for the drainage was based on an earlier proposal by John Hunt in 1604 – 1605, to construct a new 31km long river from Earith to Denver, shortening the length of the River Great Ouse by many kilometres. It was eventually named the Bedford River (and subsequently the Old Bedford River) after Francis Russell, 4th Earl of Bedford, who was the chief Adventurer and financier. The project, which also created or improved eight other channels, was judged as being substantially complete in 1637; however, it was criticized for its limited objective to provide “summer lands”, with the drained area still subject to winter flooding. The idea of completely eliminating flood risk all year round still appeared to be unreachable.
In 1640, Cornelius Vermuyden, a Dutch engineer who had been responsible for drainage of the Isle of Axholme, was appointed by Charles I to take over management of the drainage of the Fens. Works were interrupted by the outbreak of Civil War. However, in 1650, the ‘Pretended Act’ (so called because it never reached Royal Assent) set out the ambitious project to make the summer lands suitable as ‘winter grounds’
and to enable cultivation of colseed and rapeseed in the Fens. Vermuyden was instructed to make the Fens area dry all year round.
There were two main drainage options at this time: deepen and clear existing channels or shorten and straighten the course of existing rivers. Vermuyden was an advocate for straight cuts; he understood that a straightened river would speed flows through the Fens, scouring its channels and carrying sediments to the Wash.
In 1653, a second cut (the New Bedford/Hundred Foot) was built, running parallel to the Old Bedford. The Ouse Washes Counter Drain (parallel to the Old Bedford) and Welches Dam were also built in this period. The Hundred Foot River became the main channel for flood waters from the Great Ouse. The construction of this cut led to the creation of the 32-kilometre-long and 1.5-kilometre wide flood storage area of the Ouse Washes. When flood waters became too great for the two channels, the space between them provided flood storage. At the end of their 32-kilometre run, the channels intersected and re-joined the River Great Ouse, where a sluice could hold back flows at high tide and release them at low tide in order to scour the channel.
The Ouse Washes were also intended as a storage area for high tides and, for this purpose, a lock was installed near Denver preventing tidal ingress into the Ely Ouse system. For navigation purposes, Denver Sluice could be closed during summer, thus maintaining high freshwater levels along the Ely Ouse system. Vermuyden had successfully drained water from the black peaty fields into the Wash by gravity ancillary channels, and for a while agriculture thrived.
The work of Vermuyden had divided the Fens area into three parts: North Level (between the River Nene and the Welland), Middle Level (between the River Nene and the Old Bedford) and South Level (contained by the Hundred Foot River and the Ely Ouse). This geographical division was used for administrative purposes by the Commissioners. All levels were divided into districts under the regulation of their respective Commissions. Boundaries were subsequently revisited to include new areas in the early 20th century.
The Bedford Level Corporation was founded by the General Drainage Act to manage the draining of the Fens in 1663. It formalised the legal status of the Company of Adventurers previously formed by the Duke of Bedford. Despite the earlier drainage improvements, there were complaints that some lands in the South Level were still flooded or regularly flooding. This was attributed to siltation along the Great Ouse Tidal River and a lack of hydraulic head at Denver Sluice.
Over the years that followed, crops started to use up the rich organic matter, and the removal of water led to shrinkage of the peat. Land sunk to levels below the ancillary drains meaning gravity drainage was no longer possible. It also resulted in stability problems at the banks of the watercourses. Frequent maintenance works were required on the watercourses’ banks, together with dredging of bed channels and systematic weeding.
Silt deposits, which had accumulated at estuaries to the North Sea and along the river embankments, subsided at a slower rate than the peat, leaving marginally higher land. Such silt deposits at the Wash and along the Nene further accentuated the basin shape of the Great Ouse Fens.
The system became very expensive to maintain and increasingly prone to flooding. The Bedford Level Corporation was only responsible for maintaining existing drains and could not build any additional new dykes. As such, local landowners were forced to supplement the larger drainage scheme by local district enterprise at their own expense.
Sir Cornelius Vermuyden’s Original Plans for Draining the Fens
Sir Vermuyden Papers

Future Fens Flood Risk Management - Baseline Report | December 2020
34 35
2.3.5. Eighteenth Century
By the early eighteenth century, the Fens was once again flooded. Landowners had a dilemma. They had spent vast sums of money draining the Fens and enjoyed a tantalizing period of high agricultural returns, but further investment was now needed to keep their land drained.
The introduction of pump engines in the 18th century was a critical factor in saving the Fens from permanent flooding. The engines were initially powered by horses, wind or water mills. After an initial period of chaos, whereby one authority would “solve” their flooding by pumping unwanted flows onto a neighbour, the invention of modern engines allowed landowners to systematically drain the Fens.
Some tried to take a broader view and find a solution to the Fens flooding problem, but, as previously, the conflict of interest between navigation and agricultural needs continued.
Siltation was also an issue through the eighteenth century, with silt deposition at sluices (especially Denver Sluice) and formation of sandbanks in the Great Ouse Tidal River.
2.3.6. Nineteenth Century
By the nineteenth century, it was clear that wind and water mills were not adequate to deal with flooding of the Fens, which was worsened by continued shrinkage of peat lowering the land. Even where well-made, banks consisted of porous and light material, and were prone to breaching.
In 1821, the Eau Brink cut near Wiggenhall St. James was built to ease flow through the meandering Great Ouse Tidal River to The Wash. In 1825, Welmore Lake Sluice was built, together with works to widen and deepen the Hundred Foot River and enlarge the Cradge Bank.
In 1844, the Middle Level Main Drain was excavated to connect the Middle Level Area to the Great Ouse Tidal River at St. Germans. The existing pumps in the catchment were also gradually being replaced with steam driven pumps. These improvements in drainage were paralleled by advances in agricultural techniques. The Fens was gradually taking on its modern character.
In 1862, following the breakup of the Bedford Level Corporation, the Middle Level Commissioners took control of the management of drainage, navigation and flood protection in the Middle Level.
Wicken Fen is now only one of four surviving Fen marshes and the only place where you can see how the Great Ouse Fens appeared before the invention of steam engines, with its windmill still in operation to this day.
At 2.75m below mean sea level, Holme Fen in the southwest of the Great Ouse Fens is the lowest land point in Britain. In the 1800s, William Wells realised that draining the area would cause the peat to shrink. In 1848, he decided to install a timber gauging post into the clay layer beneath the peat to measure the subsidence. At that time there was about 22 feet of peat from the surface to the clay.
In 1851, the timber post was replaced by a cast iron column. As the post was progressively exposed by land subsidence it became unstable, and in 1957 steel guys were added along with a second post 6m to the northeast. Peat shrinkage has been measured intermittently throughout the years, and after initial drainage of the area 9 inches per year were recorded. Since installation of the original post, records show around 4m of ground subsidence in total.
Ground subsidences at Holme Fen
Figure 8: Holme Fen Posts. Source (left): The Great Fen Project.
Copyright: V Eade
Fens Drain construction in the c19th.

Future Fens Flood Risk Management - Baseline Report | December 2020
36 37
2.3.7. Twentieth Century
Despite major drainage improvements having been carried out from the seventeenth century onwards, some areas of the Fens still experienced flooding into the twentieth century, with large events in 1912, 1936, 1937, 1939, 1940 and 1947. There were major concerns around Denver Sluice and the Great Ouse Tidal River between Denver and King’s Lynn. From 1900, many shoals and obstructions on the Great Ouse Tidal River caused water to be higher than in previous years. When spring tides coincided with high flows in the rivers, a flood in the Ely Ouse system could occur as Denver Sluice gates could not be kept open long enough.
During these first years of the twentieth century, most of the South Level was waterlogged. In August 1912, it was reported that crops at Ramsey could be harvested only via boats. The addition of a new ‘eye’ (sluice gate) at Denver Sluice did not improve conditions.
In the 1930s, drainage and flood risk management within the Great Ouse Fens were modified by installation of St German’s Pumping Station at the downstream end of the Middle Level Main Drain, which had the capacity to pump 40 cubic meters of water per second out into the North Sea.
As flood issues continued in the South Level, the Great Ouse Catchment Board called in consulting engineers Sir Murdoch MacDonald and Partners to find a solution. In July 1940 Sir Murdoch MacDonald’s Report of Flood Protection was published. The report recommended building a Cut-Off Channel, collecting water from the Lark, Little Ouse and Wissey (key tributaries of the Ely Ouse) and construction of a Flood Relief Channel from Denver to King’s Lynn.
The Cut-Off Channel had first been suggested by Cornelius Vermuyden in 1639, and later was again suggested by John Rennie in 1810, but in both cases the cost was prohibitive. The MacDonald report included an alternative ‘cheaper’ option, which only included the Flood Relief Channel. The initial plan of the Board was to go for the most economic option due to a lack of funds and it seemed the cost of a Cut-Off Channel was again to prove too expensive. However, the project was put on hold with the outbreak of the Second World War.
In March 1947, following a particularly bad winter, very heavy rainfall accompanied snow melt and heavy winds which created waves against the banks of the watercourses; this led to breaches and significant flooding. Large areas of the South Level were under water for approximately two weeks with many areas remaining under water for over two months. The years following 1947 saw improvements in land drainage with diesel pumps being installed to cope with the decrease in the peat surface; however, the MacDonald scheme was yet to be implemented. The Great Ouse Board was keen to push forward with the scheme in light of the catastrophic effect of the 1947 flood, but as in the past, there were objections from the King’s Lynn Conservancy Board and other parties interested in navigation.
As a result, in 1949 the Great Ouse Flood Protection Act was passed with a clause for protection of shipping interests. Construction of the Flood Relief Channel was conditional upon protective works in the estuary being agreed amongst all interested stakeholders. In 1953 an agreement was finally reached. In the same year, a destructive tidal event took place along the North Sea Coast, which prompted the agreement to include heightening of the banks of the Great Ouse Tidal River.
In 1954, works for the Murdoch MacDonald scheme finally started. The scheme included the construction of the Flood Relief Channel, from Denver to the outskirts of King’s Lynn with water entering from A.G. Wright Sluice (also known as the Denver Head Sluice) and discharging from Tail Sluice; elimination of the Great Ouse bend at St. Mary Magdalen; deepening and widening of the Ely Ouse channel from Denver to its junction with the Cam; creation of the Cut-Off Channel; and additional works in The Wash for safeguarding shipping interests. The works lasted until 1970.
Silt Fen, Black Fen and Middle Drove flood storage reservoirs at Denver were constructed as part of the Ely Ouse Flood Protection Scheme, primarily to improve standards of flood protection following the March 1947 flood in which about 15,000 hectares of extremely valuable agricultural land were flooded in the Fens.
Whilst modification of the Great Ouse Fens drainage had always been undertaken with the aim of mitigating flood risk, in 1964 the Ministry of Housing and Local Government undertook a study which highlighted a potential shortage in water supply to the South Essex area due to ongoing expansion and development. As a result, the former Great Ouse and Essex River Authorities undertook a joint study to investigate the possibility of transferring surplus water from the Ely Ouse to the head waters of the Essex rivers and thus increase their flows.
The scheme was particularly attractive given it utilised existing reservoirs in Essex rather than new ones at the expense of agricultural land. Due to this work, the ‘Ely Ouse – Essex Water Act’ of 1968 was passed, and in 1970 three additional sluices were built near Denver (Residual Flow Sluice, Impounding Sluice and Diversion Sluice). The structures were required to ‘divert’ the course of the flow along the Cut-Off Channel and enable transfer of freshwater from the Great Ouse basin to Essex (known as the ‘Essex Transfer Scheme’).

Future Fens Flood Risk Management - Baseline Report | December 2020
38 39
2.4. Twenty First Century: The Great Ouse Fens Today
A new pumping station was built at St. German’s in 2011 to replace the one built in the early 1930s. The new station has a capacity of 100 cubic metres of water per second. It cost £40M to build, of which £26M came from the government through grant-in-aid. The remainder was funded through a 30-year public works loan and from the Middle Level Commissioners reserves. The new St Germans Pumping Station is the only drainage outlet for 700km2 of land and water will have been pumped twice before arriving at St Germans.
Today the Great Ouse Fens landscape remains a vast area of low lying highly rich agricultural land, topographically bound by slightly higher ground forming a basin. The artificial network of drains and water resource channels continues to sustain agriculture, and over time the navigable waterways managed by the Middle Level Commissioners have also become the UK’s 4th largest navigation network. Parts of the land continue to subside due to peat loss, and sea levels continue their rising trend. There are now additional pressures from global warming as a result of human activity, further increasing sea levels and intensifying rainfall, and from population growth.
The RMAs with responsibilities in the Great Ouse Fens operate and maintain the flood risk management infrastructure which is already in place and is described in Section 2.5. They also undertake maintenance activities and more major capital projects to refurbish, replace or improve infrastructure where necessary. General maintenance activities may include channel maintenance, such as dredging, weed screen clearance, vegetation maintenance, inspections, repairs of walls and embankments.
£1.8 bnThe cost of continuing to maintain existing flood risk management assets over the next 100 years
Summertime flooding in the Ouse Washes
The impacts of climate change present a serious threat to the Great Ouse Fens:
- Sea levels could rise by between 53-110cm before 2080- Storm surge events could increase in frequency and magnitude- Peak river flows may rise by 25%
There are over 95 kilometres of coastal defences and 405 kilometres of fluvial embankments
protecting the Great Ouse Fens from flooding
Flood risk management responsibilities are shared between the Environment Agency, Local
Authorities and Internal Drainage BoardsThe tidal river Great Ouse entering the Wash
Credit: www.klmagazine.co.uk

Future Fens Flood Risk Management - Baseline Report | December 2020
40 41
17,000The number of households directly protected against flooding, of approximately 130,000 in the study area. Those not directly protected benefit indirectly from flood risk management.
82%Amount of agricultural
land in the study area which is Grade 1 or 2
land, of 184,895ha
353m3 per secondCombined pumping rate across 138 pumping stations in the study area - enough to pump the equivalent of at least 12,200 Olympic sized swimming pools in 24 hours.
2,850More than 2,850 business are directly protected from flood risk by the existing flood risk management assets, supporting over 70,000 jobs.
Ely IDB, Prickwillow Pumping Station
New Mill New Pumps, Ely Group of IDBs

Future Fens Flood Risk Management - Baseline Report | December 2020
42 43
2.4.1. Agriculture
The Great Ouse Fens is an area of national agricultural importance due to its rich peaty soils. IDBs have the complicated task of balancing agricultural demands on water levels with those from other stakeholder groups such as the navigation community and nature reserves. Farmers prefer water levels to be a manageable distance below field level in ancillary drains, while statutory navigation channels must have water levels at the Normal Navigation Level, and nature reserves are given priority water supply rights in times of drought.
The study area includes 2.1% of England’s farmed area and produces 4.4% of England’s total agricultural output, worth an estimated £740 million per year. Around 88% of all land in the Great Ouse Fens is cultivated. Due to the rich peaty fertile soils in large parts of the Fens area, 82% of this farmland is either grade 1 or 2 agricultural land, with the wider Fens accounting for about half of England’s grade 1 land; this is the most productive type of farmland. It should be noted there are also areas of predominantly silty soils in the northern parts of the Fens, and where peat has “wasted”, a clay soil is often revealed.
The Breadbasket of BritainThe East Anglian region is known as the Breadbasket of Britain. Produce from the Great Ouse Fens ends up in shopping baskets and on plates across the country.
Figure 11: Tidal Hundred Foot River at High Tide, Water Above Surrounding Agricultural Land
Agricultural value
Farms in the Great Ouse Fens cover all sectors of agriculture and horticulture, including arable, livestock, poultry and dairy farming. A large number of farms also grow vegetables and ornamental plants. The importance of the agricultural sector in the Great Ouse Fens is highlighted by:
• potatoes;• sugar beet;• ornamental plants, such as daffodils;
The high-quality and fertile land in the Great Ouse Fens are famous for producing:
• wheat;• barley;• peas;• beans;
• a large range of other vegetables;• apples;• strawberries; and• salad.
• Crop production – the area accounts for 8.6% of England’s total crop production by value, worth £600m;• Livestock production – 0.9% of England’s livestock production by value is in this area, worth £70m; and
• 3.6% of England’s other agricultural activities, worth £70m, occur in the study area.
The study area’s farm output is significantly higher than its share of the national farmed area (2.1%) for every major crop. Of particular note are:
• Fresh vegetables, with 11% of the English crop;• Potatoes, with 8% of the English crop;
• Sugar beet, with 8% of the English crop; and• Cereals, with 3.7% of the English crop.
The Ouse washes provide high quality grazing land for cattle when not in flood.

Future Fens Flood Risk Management - Baseline Report | December 2020
44 45
Agriculture and the food chain
The whole food chain, from farm to fork, employs almost 45,000 people and generates £1.7 billion a year for the local economy. The estimated scale of the study area’s total food chain from agricultural inputs to final consumption is detailed in Table 2.
Stage of chain Employees* GVA (£m)*
Agriculture 7,512 242
Agricultural supply industry 1,662 95
Professional services 721 27
Food processing & packing 14,582 915
Retail and consumption 20,160 448
Total 44,637 1,727
* Figures extrapolated from NFU reports with original data analysis provided by Collison & Associates using published government data.
Farming is critical to the local economy with thousands of people permanently and directly employed. Due to being labour intensive, horticultural production accounts for thousands more people being employed temporarily throughout the year in the Great Ouse Fens to sow, harvest and process crops. The area is also home to a large number of food and drinks manufacturers given the access to a plentiful source of fresh produce. Agriculture is also increasingly involved in the production of energy. Alongside the direct employment for farming, energy and the food and drinks sector, there is also substantial indirect employment through the supply chain, for example in packaging or transportation services.
Agriculture and the environment
Ditch and hedgerow management for farms across the Great Ouse Fens help to ensure environmental sensitivity of farming activities, and provide habitat for a range of species, most notably including water vole.
Left: Figure 11: Agriculture is Increasingly Important in the Production of EnergyBelow: Figure 12: Lettuce Crops in the Great Ouse Fens
Table 2: Estimated Scale of Economic Contributions of Agriculture to the Local Economy
Future Fens Flood Risk Management - Baseline Report | December 2020
46 47
2.4.2. Siltation and bed level changes
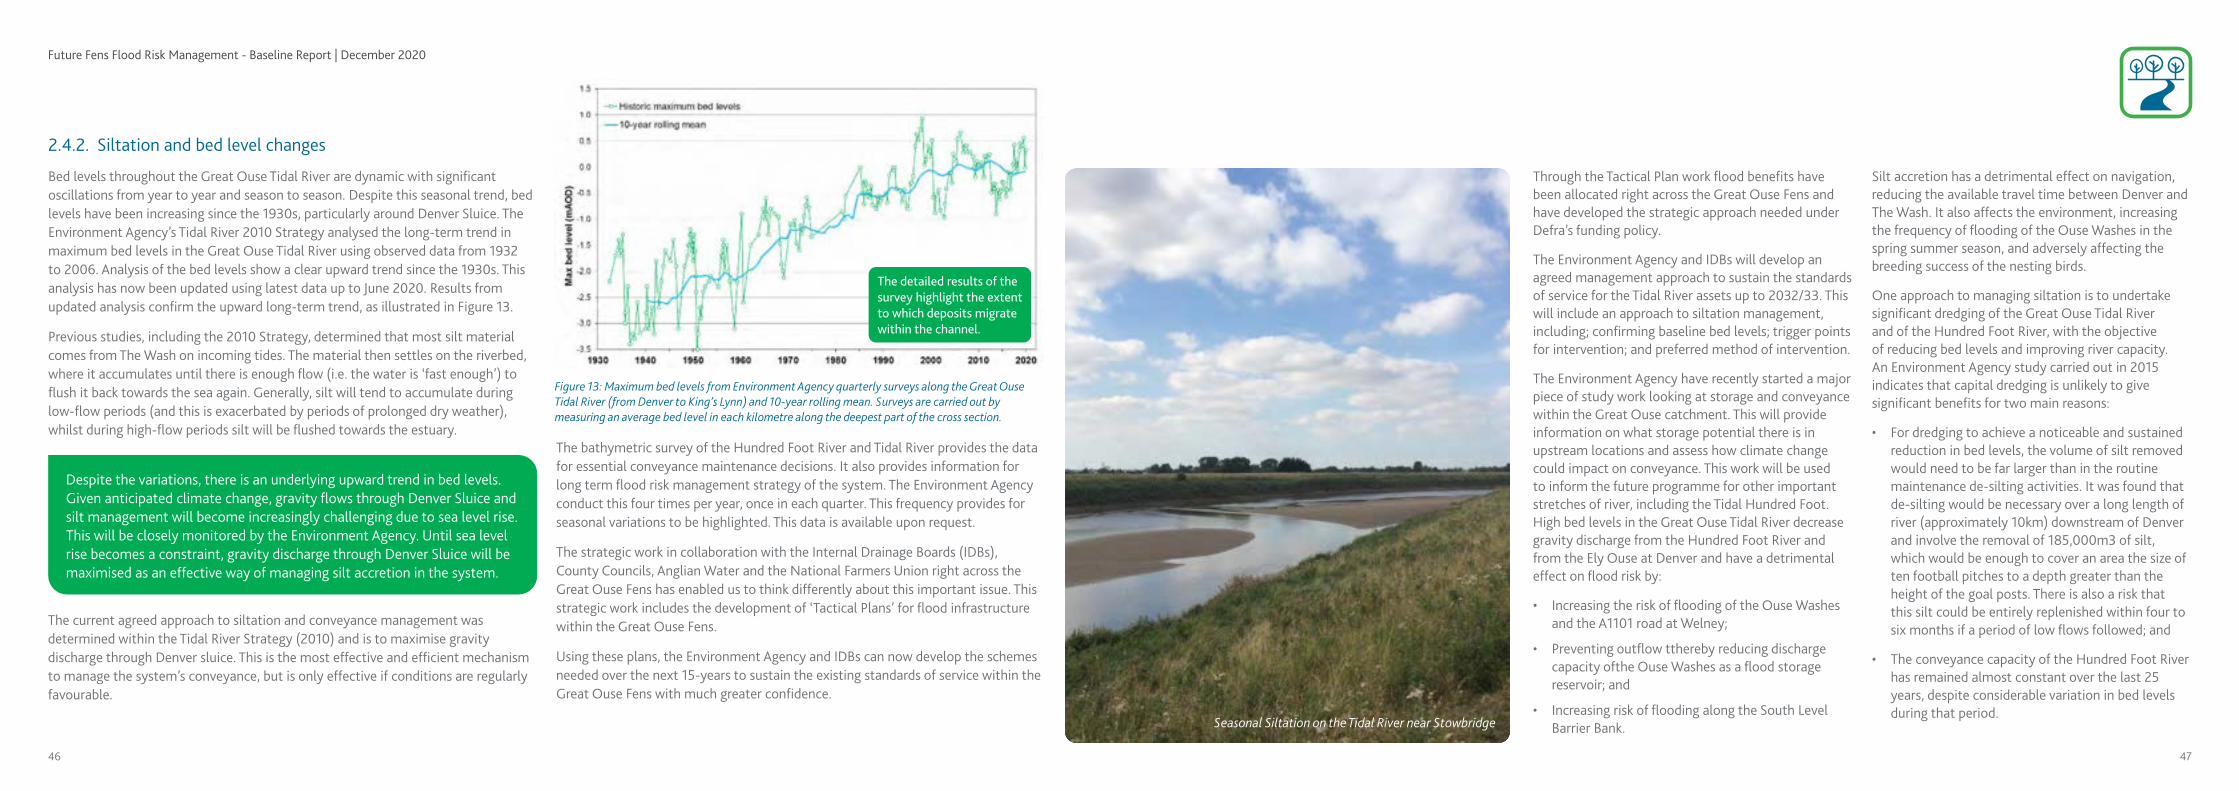
Bed levels throughout the Great Ouse Tidal River are dynamic with significant oscillations from year to year and season to season. Despite this seasonal trend, bed levels have been increasing since the 1930s, particularly around Denver Sluice. The Environment Agency’s Tidal River 2010 Strategy analysed the long-term trend in maximum bed levels in the Great Ouse Tidal River using observed data from 1932 to 2006. Analysis of the bed levels show a clear upward trend since the 1930s. This analysis has now been updated using latest data up to June 2020. Results from updated analysis confirm the upward long-term trend, as illustrated in Figure 13.
Previous studies, including the 2010 Strategy, determined that most silt material comes from The Wash on incoming tides. The material then settles on the riverbed, where it accumulates until there is enough flow (i.e. the water is ‘fast enough’) to flush it back towards the sea again. Generally, silt will tend to accumulate during low-flow periods (and this is exacerbated by periods of prolonged dry weather), whilst during high-flow periods silt will be flushed towards the estuary.
Figure 13: Maximum bed levels from Environment Agency quarterly surveys along the Great Ouse Tidal River (from Denver to King’s Lynn) and 10-year rolling mean. Surveys are carried out by measuring an average bed level in each kilometre along the deepest part of the cross section.
Despite the variations, there is an underlying upward trend in bed levels. Given anticipated climate change, gravity flows through Denver Sluice and silt management will become increasingly challenging due to sea level rise. This will be closely monitored by the Environment Agency. Until sea level rise becomes a constraint, gravity discharge through Denver Sluice will be maximised as an effective way of managing silt accretion in the system.
The bathymetric survey of the Hundred Foot River and Tidal River provides the data for essential conveyance maintenance decisions. It also provides information for long term flood risk management strategy of the system. The Environment Agency conduct this four times per year, once in each quarter. This frequency provides for seasonal variations to be highlighted. This data is available upon request.
The strategic work in collaboration with the Internal Drainage Boards (IDBs), County Councils, Anglian Water and the National Farmers Union right across the Great Ouse Fens has enabled us to think differently about this important issue. This strategic work includes the development of ‘Tactical Plans’ for flood infrastructure within the Great Ouse Fens.
Using these plans, the Environment Agency and IDBs can now develop the schemes needed over the next 15-years to sustain the existing standards of service within the Great Ouse Fens with much greater confidence.
The current agreed approach to siltation and conveyance management was determined within the Tidal River Strategy (2010) and is to maximise gravity discharge through Denver sluice. This is the most effective and efficient mechanism to manage the system’s conveyance, but is only effective if conditions are regularly favourable.
Through the Tactical Plan work flood benefits have been allocated right across the Great Ouse Fens and have developed the strategic approach needed under Defra’s funding policy.
The Environment Agency and IDBs will develop an agreed management approach to sustain the standards of service for the Tidal River assets up to 2032/33. This will include an approach to siltation management, including; confirming baseline bed levels; trigger points for intervention; and preferred method of intervention.
The Environment Agency have recently started a major piece of study work looking at storage and conveyance within the Great Ouse catchment. This will provide information on what storage potential there is in upstream locations and assess how climate change could impact on conveyance. This work will be used to inform the future programme for other important stretches of river, including the Tidal Hundred Foot.High bed levels in the Great Ouse Tidal River decrease gravity discharge from the Hundred Foot River and from the Ely Ouse at Denver and have a detrimental effect on flood risk by:
• Increasing the risk of flooding of the Ouse Washes and the A1101 road at Welney;
• Preventing outflow tthereby reducing discharge capacity ofthe Ouse Washes as a flood storage reservoir; and
• Increasing risk of flooding along the South Level Barrier Bank.
Silt accretion has a detrimental effect on navigation, reducing the available travel time between Denver and The Wash. It also affects the environment, increasing the frequency of flooding of the Ouse Washes in the spring summer season, and adversely affecting the breeding success of the nesting birds.
One approach to managing siltation is to undertake significant dredging of the Great Ouse Tidal River and of the Hundred Foot River, with the objective of reducing bed levels and improving river capacity. An Environment Agency study carried out in 2015 indicates that capital dredging is unlikely to give significant benefits for two main reasons:
• For dredging to achieve a noticeable and sustained reduction in bed levels, the volume of silt removed would need to be far larger than in the routine maintenance de-silting activities. It was found that de-silting would be necessary over a long length of river (approximately 10km) downstream of Denver and involve the removal of 185,000m3 of silt, which would be enough to cover an area the size of ten football pitches to a depth greater than the height of the goal posts. There is also a risk that this silt could be entirely replenished within four to six months if a period of low flows followed; and
• The conveyance capacity of the Hundred Foot River has remained almost constant over the last 25 years, despite considerable variation in bed levels during that period.
The detailed results of the survey highlight the extent to which deposits migrate within the channel.
Seasonal Siltation on the Tidal River near Stowbridge

Future Fens Flood Risk Management - Baseline Report | December 2020
48 49
The 2010 Strategy determined that flow discharged from the Ely Ouse to the Great Ouse Tidal River through Denver Sluice helps to flush out the silt and lower bed levels. This was proven by analysis of observed bed levels in the Great Ouse Tidal River and by using hydraulic and sediment models. Costs associated with this approach are also significantly lower than costs for other options (e.g. dredging). Optimal operation of Denver Sluice (i.e. 85% of theoretical maximum flow discharged through the sluice) is now considered the most effective way for managing bed levels in the river, apart from natural high flows in the Bedford Ouse.
Reflecting this understanding, the Environment Agency has a proactive approach in managing the siltation:
• Routine maintenance activities and capital interventions in recent years include major refurbishment of Denver Sluice in 2014/ 2015 and change in the operation of Denver Sluice, as recommended in the 2010 Strategy; and
• Bed levels in the Great Ouse Tidal River and the Hundred Foot River are surveyed every three months. The surveys help to measure an average bed level every kilometre along the deepest part of the river cross sections. These surveys, known as the ‘mean kilometre surveys’, have been undertaken since the 1930s.
Such management and operation of the system has been shown to improve conditions.
Due to a combination of the effective operation of Denver Sluice, high flows in 2012/13 winter and the upgrading and replacement of the guillotine gates, bed levels have significantly dropped in most recent years as shown in Figure 13. The measured maximum bed levels from 2012 to February 2014 dropped by over 1metre and were the lowest in 30 years. As shown in Figure 13, the measured maximum bed levels from 2012 to February 2014 dropped by over 1m and were the lowest in 30 years. Modelling of the river system confirms that decreases in bed levels help to improve gravity discharge from the Hundred Foot River, leading to flood risk benefits for the area further upstream.
Increases in mean sea level as a result of climate change will impact upon the operation of gravity discharge at Denver Sluice. Tidal levels will be above the maximum level for which gravity discharge can occur for longer. Currently, Denver will start to discharge when tidal level drops below 1.016m AOD. The typical tidal range at King’s Lynn is currently between -1.82m AOD and 3.86m AOD and it is estimated gravity discharge can occur for 59% of the time during normal conditions. With rising sea levels, this will drop to between 54-56% by 2050, 44-52% by 2080 and 21-45% within 100 years.
Tidal River at Stowbridge, with sand banks clearly visible - Photo: Travis Short, 2020

Future Fens Flood Risk Management - Baseline Report | December 2020
50 51
2.5. Flood Risk and Water Level Management in the Great Ouse Fens
A complicated network of flood risk and drainage channels, assets and structures has developed across the Great Ouse Fens to meet the various demands on water level management. This network includes:
• Hundred Foot River• Great Ouse Tidal River• Old Bedford/River Delph• Counter Drain/Old Bedford• Ouse Washes• Old West• Ely Ouse• Ten Mile River• Cut-off Channel• Denver Complex
• Flood Relief Channel• River Nar• River Wissey• River Lark• Little Ouse• Middle Level Main Drain• The lodes and numerous other IDB drains• Surface water management networks
Some watercourses in the Great Ouse Fens are known as ‘catchwater drains’; these are normally positioned along the edge of an IDB’s catchment to intercept water flowing from higher ground and reduce the amount of water flowing into the IDB district. Catchwater drains generally discharge water directly into main rivers via gravity and are usually maintained by the IDB’s who recover costs from the Environment Agency.
Local field ditches are managed by farmers and are connected to major drains managed by the IDB’s. From the major drains, water is pumped via IDB pumping stations up to main rivers. Many fields in the Great Ouse Fens also have underground land drains to improve land drainage, and these discharge into ancillary field ditches.
In the more developed, more impermeable areas, flood risk management ensures surface water drains appropriately. These systems are usually outside of IDB areas in settlements built on higher land. Networks exist of highway gullies, lateral drains and, in the larger settlements, Anglian Water surface water sewers, which outfall to watercourses. As surface water management deals with direct rainfall and surface runoff, flooding often occurs at source long before there is opportunity for the water to drain into the pumped IDB networks.
Highways Authorities and Lead Local Flood Authorities from our county councils work closely with Anglian Water to manage these systems. Surface water is covered in more detail in section 3.6.3.
The study area for the Great Ouse Fens is made up of 5 sub-catchments totalling 2,178km2 and crossing Cambridgeshire and Norfolk. These five sub catchments are;
• East of Ouse (170km2);• West of Ouse (291km2);• King’s Lynn (73km2);
• Middle Level (734km2); and• South Level (910km2).
Major FRM structures of the Fens

Future Fens Flood Risk Management - Baseline Report | December 2020
52 53
There are 138 pumping stations across the Great Ouse Fens study area, shown as green points on the plan. These range from the smaller pumping stations managing localised drainage to the UKs largest pumping station at St Germans pumping 100m3/s and draining a substantial portion of the catchment. All of these pumping stations are important in their own right, managing drainage in order to sustain the agriculture and providing flood risk protection in the study area. Whitehall Pumping Station
Prickwillow Pumping Station
New Mill Pumping Station
Black Borough End Pumping Station
St Germans Pumping Station
Bevills Leam Pumping Station
Pumping station locations in the study area
KEY: - Pumping Station

Future Fens Flood Risk Management - Baseline Report | December 2020
54 55
The South Level is an area of low-lying land to the south of the Ouse Washes, bounded by “higher” land at the Ouse Washes and the route of the A11 from Cambridge up to Mildenhall. It was reclaimed by drainage during the mid-17th Century. The South Level river system consists of over 300 km of watercourses and covers an area of over 91,000 hectares (910 km2).
Ely is the largest urban area situated in the South Level and is protected from fluvial flooding by a series of river embankments. Ely, at 26m AOD sits on a clay island which is the highest land in the Great Ouse Fens. The highest point being at Sutton on the Isle at 39m AOD.
2.5.1. South Level
South Level SystemMost water level management and land drainage in the South Level is carried out by the Ely and Downham Group of IDBs, which is a Consortium of 16 IDBs.
Photo: Dr. Volkmar Rudolf, 2018
5
3
4
6
7
2
1
5
3
4
6
7
2
1

Future Fens Flood Risk Management - Baseline Report | December 2020
56 57
Watercourses
Ten Mile RiverThe Ten Mile River is the length of channel between Littleport A10 Road Bridge and the Denver Sluice. The river is a high-level carrier with raised embankments on either side. Under normal conditions, flows are discharged into the Tidal River through Denver Sluice. During high flows and floods, water is discharged through the Head Sluice into the Relief Channel.
River LarkThe River Lark flows from Hawstead in Suffolk to its confluence with the Great Ouse River near Littleport. The structure at Isleham Lock consists of a navigational lock with vertical lift gates to allow the structure to act as a flood risk management sluice, and there is a drop leaf weir gate on a back channel used to maintain upstream water levels under normal flow conditions.
The A10 Bridge is close to the site of the former confluence between one of the historic routes of the River Great Ouse and the Little Ouse River; this became the Old Croft River; which flowed in a north-westerly direction reaching The Wash at Wisbech before the outfall of the River Great Ouse was changed.
Old West RiverThe Old West River is a section of the Great Ouse River which flows between Hermitage Lock at the Ouse Washes and its confluence with the River Cam. The river is a high-level carrier with raised embankments on either side. It is primarily used for navigation purposes with flood flows being discharged to the Ouse Washes through Earith Sluice.
Cambridgeshire Lodes systemThe Cambridgeshire Lodes consists of several high-level carrier rivers with raised embankments on either side and pumping stations at their downstream ends.
Ely Ouse RiverThe Ely Ouse River is the length of the Great Ouse between the confluence with the River Cam and Littleport A10 Road Bridge and is a continuation of the Ten Mile River. It was renamed after modifications in 1630. The river is a high-level carrier with raised embankments on either side.
Cottenham LodeCottenham Lode flows from Rampton in Cambridgeshire to its confluence with the Old West River. Between Cottenham and its confluence with the Old West the watercourse is a high-level carrier with raised embankments on either side of the channel.
River CamThe River Cam has a large upland catchment; it enters the Great Ouse Fens from the Bottisham Lock sluice at Waterbeach and flows to its confluence with the Old West River. The structure at Bottisham consists of a fixed weir, two automatic sluice gates and a navigation lock. The river is a high-level carrier with raised embankments on either side.
River WisseyThe River Wissey flows from Hilborough to its confluence with the Ten Mile River just upstream of Denver Sluice. The structure at the Wissey Sluices, near Stoke Ferry, consists of 2 sluice gates across the River Wissey, 2 sluice gates to divert water into the Cut-Off Channel, and a syphon to allow the Cut-Off Channel to flow under the River Wissey.
Little Ouse RiverThe Little Ouse River flows from Hinderclay to its confluence with the Great Ouse at Brandon Creek. Downstream of the Cut-Off Channel, the river is a high-level carrier with raised embankments on either side of the channel. The structure at Hockwold Sluices consists of 2 sluice gates across the Little Ouse, 2 sluice gates to divert water into the Cut-Off Channel, and a syphon to allow the Cut-Off Channel to flow under the Little Ouse River.
Willingham LodeWillingham Lode flows from Willingham in Cambridgeshire to its confluence with the Old West River and is a high-level carrier with raised embankments on either side of the channel.
1
2
3
4
5
6
7
8
11
9
10
12
3
54
6
11
8
9
10
7
1
2
3
4
5
6
7
8
Ten Mile River
A10 Bridge
Ely Ouse River
Willingham Lode
Old West River
Cottenham Lode
River Wissey
Cambridgeshire Lodes system
9
10
11
River Lark
Little Ouse River
River Cam

Future Fens Flood Risk Management - Baseline Report | December 2020
58 59
The Denver Complex is a collection of structures at the confluence of 5 watercourses. The Complex is a key hydraulic control for the flood risk management of the Great Ouse Fens, with all assets being manually operated. Under normal flow conditions water from the upper catchments flows down the Old West, Ely Ouse and Ten Mile rivers, and through the Denver Complex where flow is discharged to the Tidal River via Denver Sluice clearing silt from the channel to the Wash.
There has been a sluice at Denver since the Seventeenth Century (except between 1713, when the sluice was destroyed by tides, and 1750 when a replacement was built).
Under high flow conditions water still flows into the main rivers but when it is not possible to discharge enough water through Denver sluice and still maintain the retention levels in the Ely Ouse / Ten Mile, water is discharged through Denver Head sluice (also known as A G Wright sluice) into the relief channel which is part of the Ely Ouse Flood Protection scheme. The retention level for the Ely Ouse system at Ely is 1.5mAOD during winter and 1.6mAOD in summer. Under extreme flood conditions flows from the River Lark, Little Ouse and Wissey can be diverted up the Cut-Off Channel, stored and then released into the Relief Channel.
The Diversion Sluice is a water level management structure which allows water from the Ely Ouse to enter the Cut-Off Channel. The structure is a hinged variable height weir and is used to transfer flow into the Cut-Off Channel to meet the supply demands of the Ely Ouse Water Transfer Scheme to the Essex & Suffolk Water Company. The structure also incorporates a road bridge allowing vehicular access to boat moorings immediately upstream of the site.
Denver Complex
(Top) Figure 14: Plan of the Denver Complex
(Right) Figure 15: Aerial view of Great Ouse Rivers at Denver Sluice: Kite aerial photograph by Bill Blake Heritage Documentation
The Fens was hit by devastating flooding in 1937 and 1947. During the 1937 event, there were months of impacts across the Fens including farmland being drowned, schools being closed and access to communities being cut off. During the February and March 1947 floods, local communities were devastated. A total of 34 counties in England were impacted by the floods, with the southern Fens in particular being badly affected. Further details on the 1947 event are included in Section 2.6.2.
Due to the flooding throughout the 1930s, and in particular in 1937 and 1947, the Great Ouse Flood Protection Bill was passed and received Royal Assent in 1949. It sought to empower the Great Ouse Catchment Board to construct works and acquire land with the aim of reducing flood risk in the Great Ouse Fens. Specifically, schemes involving an expenditure of over £6 million (more than £150 million in 2020 prices) to prevent further flooding in the Great Ouse Fens were proposed.
Further flooding occurred in 1951 and 1953 before work on the Ely Ouse Flood Protection Scheme commenced in 1954 and was completed in 1964. The works comprised:
• Construction of the Relief Channel - this flows from Denver to King’s Lynn, discharging through the Tail Sluice, and acts as an additional flood storage reservoir discharging to the Wash at low tide.
• Bank improvement works and widening and deepening of the Ten Mile and the Ely Ouse rivers, from upstream of Denver to the confluence of the River Cam.
• Construction of the Cut-Off Channel – this flows from Mildenhall, to convey flood waters from the River Lark, Little Ouse River and the River Wissey away from the Great Ouse Fens.
Ely Ouse Flood Protection Scheme
Cambridge News, 23rd March 1937Children had been unable to go to school for months, housewives were marooned and unable to provide themselves with the necessities of life, crops had been destroyed bringing ruin to farmers and unemployment to farm workers. Half a million acres of the richest soil in the country were in daily peril during the winter. Much of the flooding had been caused to Government cuts in grants for land drainage, Arthur Greenwood declared.
Figure 16: Ely Ouse Flood Protection Scheme Cut-Off Channel Location
Cambridge News, 14th July 1937During recent floods the water in the Hundred Foot Washes had been held up causing great hardship to occupiers. Yet their drainage charges have greatly increased. The water is let into the Wash area through the Seven Holes Sluice at Earith. But Welmore Lake Sluice which had only been built about five years is unable to cope. The Hundred Foot should be dredged: at Littleport it was only 30 feet wide. Alternatively the water should be let through the Hermitage Sluice into the Old West River and then out at Denver Sluice. But the washes were there for the express purpose of taking flood waters and grazing land was hired under those conditions. The problem is that rivers in the uplands have been cleared meaning water arrives in about a day, whereas it used to take a week.

Future Fens Flood Risk Management - Baseline Report | December 2020
60 61
The Ouse Washes is a 90 million m3 capacity flood storage reservoir lying between Old Bedford River and the New Bedford River in Cambridgeshire and Norfolk and is retained by two embankments approximately 31km long. The rivers are artificial and were cut during the 17th Century in attempts to drain the Great Ouse Fens area. The Ouse Washes divide the Middle Level from the South Level whilst taking flows from the Bedford Ouse and protecting areas upstream of the Great Ouse Fens from flooding. Figure 19 shows how the Ouse Washes operate today.
Ouse Washes and Tidal RiverFigure 17: Wigeon Flock, photo courtesy of WWT, Welney Wetland Centre
Wildlife in the Washes:
• Black Tailed Godwit• Garganey and Wigeon• Whooper and Bewick’s Swan• Short-Eared Owl
• Merlin• Hen Harrier• Peregrine• Avocet
• Snipe• Redshank• Dragonflies• Moths and Butterflies
Under normal conditions, water flows down the Hundred Foot River on the eastern side of the Ouse Washes. Water enters the Old Bedford River via Earith Sluices during times of high flows. It can also overflow the Earith Causeway Road. When the Old Bedford River receives enough flow, water overtops the eastern bank into the Ouse Washes and is temporarily stored until it can be discharged to the Tidal River Ouse to be conveyed down to the Wash.
Water is also stored in the Ouse Washes when high river levels coincide with a high tide and drainage from low lying rivers into the Wash is impeded. The same problem occurs during spring tides, which even at low tide may be too high to allow much water to drain from the River Ouse system.
Water stored within the Ouse Washes is passed back into the Tidal River by draining into the River Delph, before flowing through Welmore Lake Sluice, also known as the John Martin Sluice. Tidal River flows are managed by flood walls, flood gates and embankments; there are no in-channel structures once water has entered the Tidal River. The coastal area to the west of the Tidal River is protected by sea banks.
The Ouse Washes area occupies around 1,900 hectares of land, making it Britain’s largest washland. The surface of the reservoir is grassland which is seasonally flooded. The Ouse Washes are of international importance in terms of their conservation interest, having SSSI (Site of Special Scientific Interest), Special Protection Area (SPA), Special Area of Conservation (SAC), and Ramsar designations, which legally protect the Washes from development and works that could be harmful to its flora, fauna, geological or physiographical/geomorphological features (SPA, SAC and Ramsar designated sites are collectively known as Natura 2000 sites).
The area of the Ouse Washes extending from Earith to Welmore Lake Sluice is registered as a Statutory Reservoir under the Reservoirs Act, 1975. The boundary of the reservoir to the north-west is taken to be the crest of the Middle Level Barrier Bank, the reservoir dam, and it includes the Old Bedford and River Delph channels. To the south-east, the boundary is taken to be the crest of the Cradge Bank, constructed on the left bank of the New Bedford (Tidal Hundred Foot) River. The right bank of the New Bedford River is a tidal riverbank, known as the South Level Barrier Bank. The reservoir sits entirely within the environmentally designated areas.
1955 - SSSI
1976 - Ramsar
1993 - SPA
2005 - SAC
The Ouse Washes hold enough waterto fill Wembley Stadium 22 times over
Figure 18: Sunrise Over the Washes
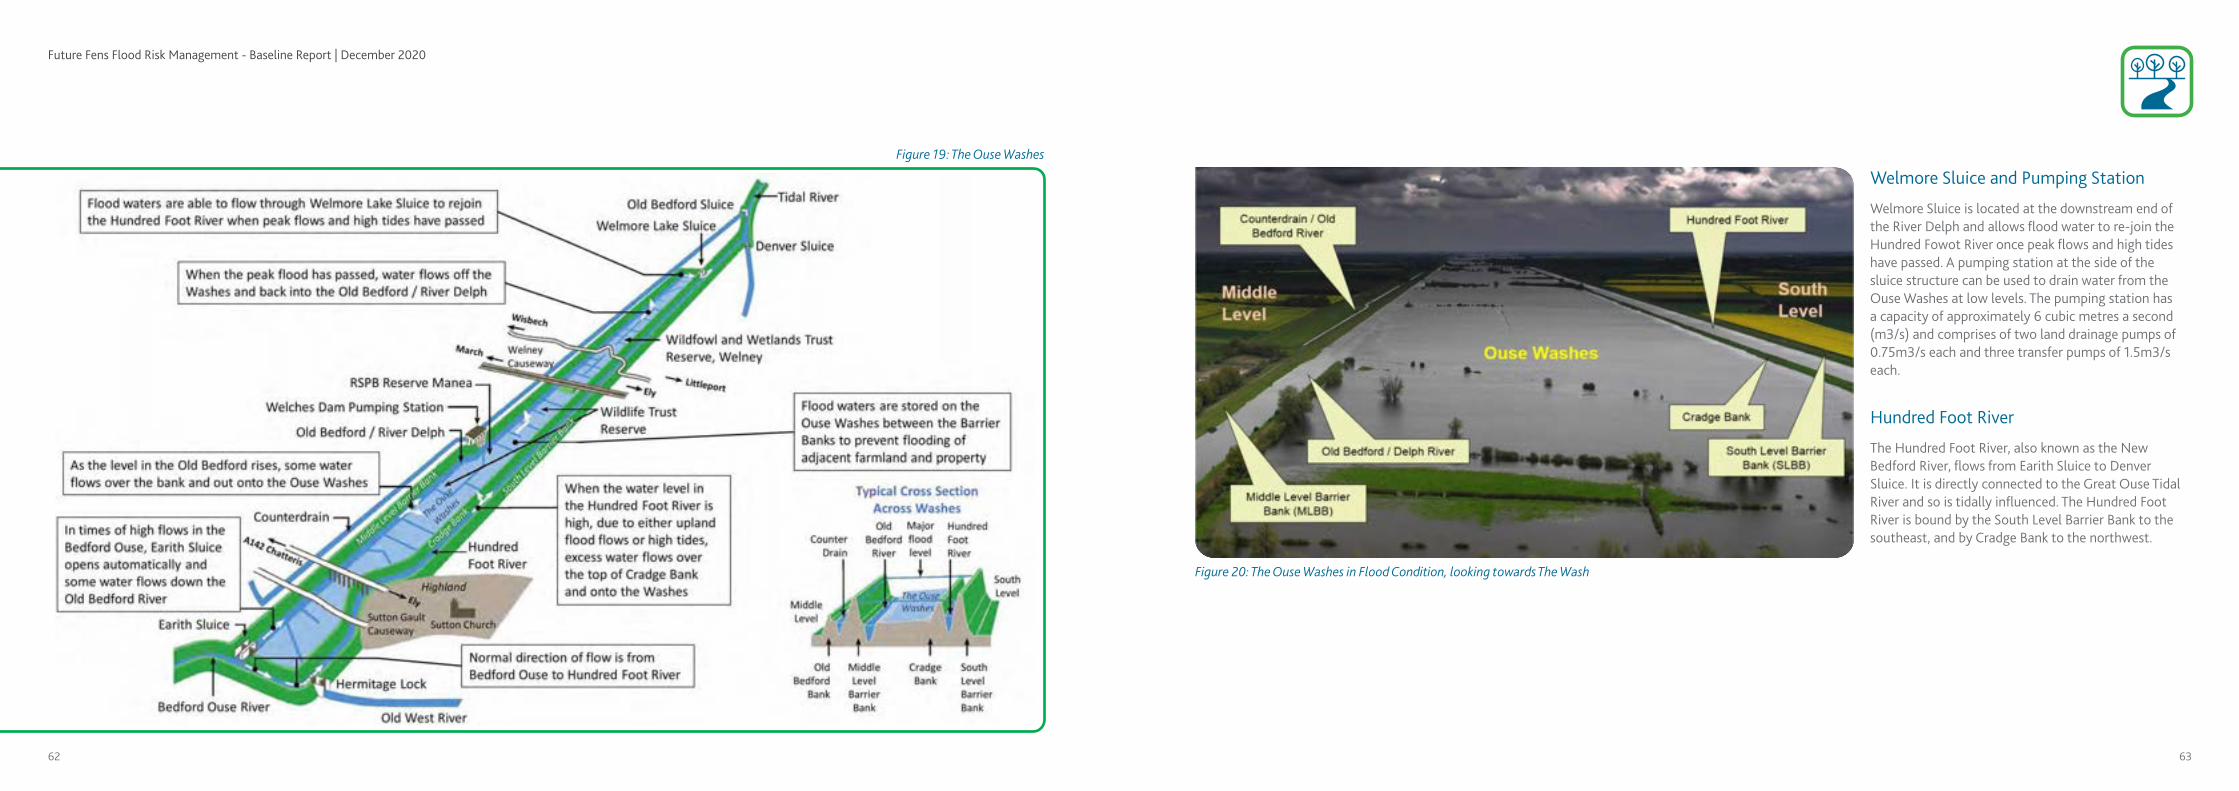
Future Fens Flood Risk Management - Baseline Report | December 2020
62 63
Figure 19: The Ouse Washes
Welmore Sluice is located at the downstream end of the River Delph and allows flood water to re-join the Hundred Fowot River once peak flows and high tides have passed. A pumping station at the side of the sluice structure can be used to drain water from the Ouse Washes at low levels. The pumping station has a capacity of approximately 6 cubic metres a second (m3/s) and comprises of two land drainage pumps of 0.75m3/s each and three transfer pumps of 1.5m3/s each.
Welmore Sluice and Pumping Station
The Hundred Foot River, also known as the New Bedford River, flows from Earith Sluice to Denver Sluice. It is directly connected to the Great Ouse Tidal River and so is tidally influenced. The Hundred Foot River is bound by the South Level Barrier Bank to the southeast, and by Cradge Bank to the northwest.
Hundred Foot River
Figure 20: The Ouse Washes in Flood Condition, looking towards The Wash
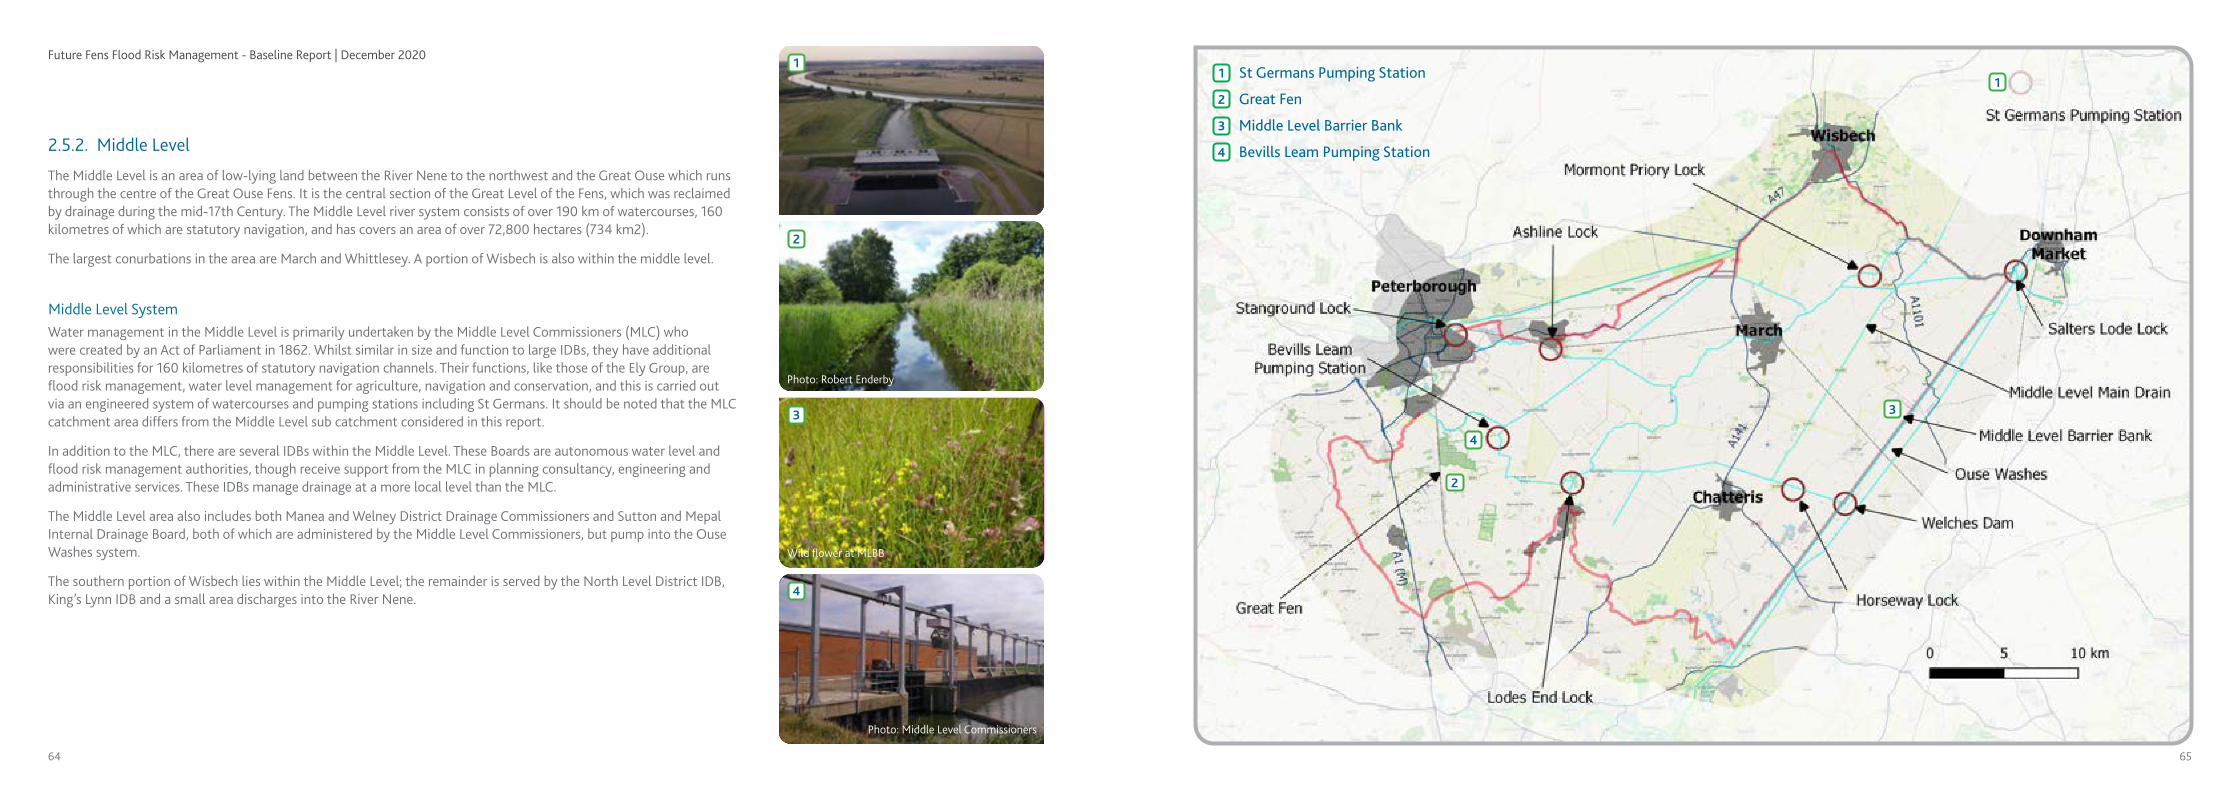
Future Fens Flood Risk Management - Baseline Report | December 2020
64 65
The Middle Level is an area of low-lying land between the River Nene to the northwest and the Great Ouse which runs through the centre of the Great Ouse Fens. It is the central section of the Great Level of the Fens, which was reclaimed by drainage during the mid-17th Century. The Middle Level river system consists of over 190 km of watercourses, 160 kilometres of which are statutory navigation, and has covers an area of over 72,800 hectares (734 km2).
The largest conurbations in the area are March and Whittlesey. A portion of Wisbech is also within the middle level.
2.5.2. Middle Level
Middle Level SystemWater management in the Middle Level is primarily undertaken by the Middle Level Commissioners (MLC) who were created by an Act of Parliament in 1862. Whilst similar in size and function to large IDBs, they have additional responsibilities for 160 kilometres of statutory navigation channels. Their functions, like those of the Ely Group, are flood risk management, water level management for agriculture, navigation and conservation, and this is carried out via an engineered system of watercourses and pumping stations including St Germans. It should be noted that the MLC catchment area differs from the Middle Level sub catchment considered in this report.
In addition to the MLC, there are several IDBs within the Middle Level. These Boards are autonomous water level and flood risk management authorities, though receive support from the MLC in planning consultancy, engineering and administrative services. These IDBs manage drainage at a more local level than the MLC.
The Middle Level area also includes both Manea and Welney District Drainage Commissioners and Sutton and Mepal Internal Drainage Board, both of which are administered by the Middle Level Commissioners, but pump into the Ouse Washes system.
The southern portion of Wisbech lies within the Middle Level; the remainder is served by the North Level District IDB, King’s Lynn IDB and a small area discharges into the River Nene.
3
4
2
1
2
3
4
1
Photo: Robert Enderby
Photo: Middle Level Commissioners
1
2
3
4
St Germans Pumping Station
Great Fen
Middle Level Barrier Bank
Bevills Leam Pumping Station
Wild flower at MLBB

Future Fens Flood Risk Management - Baseline Report | December 2020
66 67
Watercourses
River NeneThe River Nene is the tenth-longest river in the UK, flowing from its source at Arbury Hill in Northamptonshire to the Wash. From Northampton, the river is navigable all the way down to the Wash, a distance of 142km.
Historically, prior to the drainage of the Fens, the River Nene split into two just to the east of Peterborough. This northern branch, lying just north of the study boundary, meandered across the Fens with its outfall into the River Nene near Tydd Gote and Four Gotes. The term Gote literally means “go out” or outfall.
Bevills LeamBevills Leam is an artificial drainage channel running between the River Nene (old course) and the Twenty Foot Drain and Whittlesey Dyke.
Forty Foot or Vermuyden’s DrainThe Forty Foot Drain, also known as Vermuyden’s Drain, is a man-made river which flows 16.9 km, from Wells Bridge, where it joins the old River Nene, to Welches Dam Sluice, where it joins the Counter Drain. It is one of the key elements in drainage of the Middle Level. It was instrumental in Sir Cornelius Vermuyden’s drainage scheme.
Twenty Foot DrainThe Twenty Foot Drain runs from Whittlesey Dyke to the River Nene (Old Course) just outside March.
River Nene (Old Course)The southern branch of the Nene meanders across the Middle Level area and is identified on many maps as the River Nene (Old course). Whilst this is not incorrect it could easily be confused for the River Nene and so, like the River Great Ouse within the South Level, it is sub-divided and given other “local” names.
The length of watercourse between Yaxley and Stanground is known as the Pigwater. Whilst it has a small drainage function, serving the increasingly urbanised “higher” ground between it and the B1091, its main function is water transfer.
The Sixteen Foot DrainWater from the Forty Foot Drain flows via the Sixteen Foot Drain to Three Holes, and then via the Middle Level Main Drain. The Sixteen Foot Drain connects to the Forty Foot drain above Horseway Lock.
Old Bedford/River DelphThe Old Bedford River runs parallel to the Hundred Foot River from Earith Sluices to Welmore Sluice as part of the Ouse Washes system, the channel section downstream of Welches Dam is known as the Delph River.
Within the Ouse Washes, the Old Bedford is bound by the Middle Level Barrier Bank on its northwest side, and the Ouse Washes on its southeast. Earith Sluices allow flows from the Bedford Ouse to discharge into the Old Bedford, and in times of flood, waters will then flow into the Ouse Washes. Welmore Sluice discharges water from the Ouse Washes into the Hundred Foot River.
New Bedford RiverThe New Bedford River is a man-made river between Earith and Denver Sluices. It is tidal, with reverse tidal flow being clearly visible at Welney, 31 km from the sea. It is also known as the Hundred Foot Drain because of the distance between the tops of the two embankments on either side of the river.
Middle Level Main DrainThe Middle Level Main Drain is the length of drain from Three Holes to St Germans Pumping Station, crossing into the West of Ouse area at the A1122. It’s a high-level carrier that conveys water from the Middle Level area.
1
2
3
4
5
6
7
10
8
1
2
34
6
11
8
9
10
79
King’s Dyke/Whittlesey DykeKings Dyke is a “controlled” watercourse which only serves a small area of land. Its primary functions are water transfer, from the River Nene system via Stanground Lock into lower Bevills Leam and St. Germans “ponds”, and navigation, and forming part of the Nene-Ouse Navigation Link.
Ouse Washes Counter Drain/Old BedfordThe Cranbrook Drain flows from Somersham to the Ouse Washes where it becomes the Ouse Washes Counter Drain River. It is known as the Old Bedford River downstream of Welches Dam where it is outside of the Ouse Washes. The Ouse Washes Counter Drain runs adjacent to the Old Bedford upstream of Welches Dam, and within the Ouse Washes is bound by the Middle Level Barrier Bank to the southeast, and Low Bank to the northwest which provides protection to the Middle Level. The Old Bedford normally discharges water into the Tidal River through the Old Bedford Sluice, but also pumps backwards for water resources in the summertime. Together with Salters Lode, Welches Dam was an outfall for Vermuyden’s drainage scheme within the Middle Level.
11
1
5

Future Fens Flood Risk Management - Baseline Report | December 2020
68 69
St. Germans Pumping Station is the largest pumping station in Britain, and the primary drainage outlet for an area of nearly 700km2, including large swathes of high-grade agricultural land. Whilst the station lies outside of the Middle Level area, it is integral to the drainage of the area and is maintained by the Middle Level Commissioners.
Originally, water was discharged at St. Germans via a gravity sluice, first constructed in 1848. By the 1920s, it was understood that gravity discharge alone would not protect against flooding due to peat shrinking and, as a result, the level of the land lowering. St. Germans pumping station was the answer to this; originally built in the early 1930s and opened in 1934, it had the capability to discharge 40 cubic meters per second with 3 diesel powered pumps acting alongside gravity outfalls. The station was improved in 1951 with the installation of 2 electric motors and a fourth pump. This new configuration of 2 diesel and 2 electric pumps had a maximum discharge capacity of 70 cubic meters per second.
Land levels had now lowered to such an extent that the 1951 work also marked the end of the period when any gravity drainage was possible at St Germans via the sluices incorporated into the station.
By 2005, and following a major rainfall event at Easter of 1998, a detailed study of St. Germans showed that increasing run off, land shrinkage and development within the Middle Level area necessitated the improvement of the pumping facility. Following consideration of various options, a new St Germans pumping station was built just downstream of the original and came online in April 2010. The new station has a discharge capacity of up to 100 cubic meters per second.
St Germans Pumping Station
Figure 21: St Germans Pumping Station

Future Fens Flood Risk Management - Baseline Report | December 2020
70 71
In 1983, a major improvement scheme was completed by the MLC with the aim of continued protection of the south west area of the Middle Level; this area contains the lowest land levels and the deepest peat, which will continue to shrink into the future. The area is vulnerable, being the first part of the fen within the Middle Level to receive flood water from the bordering hills whilst being located furthest from St. Germans Pumping Station.
Bevills Leam Pumping Station was constructed to boost the flow into the remainder of the Middle Level River System and to provide temporary controlled storage of highland flood water. A new Catchwater Drain was dug to collect the highland water, cutting off the upland brooks and redirecting flows to Bevills Leam. Additionally, in times of high flows it is possible to divert water in to Woodwalton Fen National Nature Reserve through the closure of the Great Raveley Sluice at Woodwalton Fen. Water can be stored here and discharged into the river system at an acceptable controlled rate.
Bevills Leam Pumping Station has six pumps with approximately 20% of the capacity of St. Germans. Woodwalton Fen National Nature Reserve is capable of storing 2,000,000 cubic metres of water.
Upon completion of the Great Fen Project, which will include significant storage facilities, Natural England have proposed that the Woodwalton Fen is only used as a back-up storage facility. This reflects the increasing conservational importance of the site.
Bevills Leam Pumping Station Figure 22: Bevills Leam Pumping Station, Photo: Middle Level Commissioners
The Counter Drain is referred to herein as the Ouse Washes Counter Drain to distinguish it from the Counter Drain in the Nene Washes. Under adverse conditions, the Ouse Washes Counter Drain can overspill into the Well Creek at Salters Lode. This is a Middle Level Commissioners river.
Ouse Washes Counter Drain
Figure 23: Woodwalton Fen, Photo: Wildlife Trust
Woodwalton Fen National Nature Reserve is a Ramsar site, SSSI and part of the Fenland Special Area of Conservation.It is owned by the Wildlife Trust, managed by Natural England and is one of only four remaining fragments of the ancient wild fens that used to stretch across this area.

Future Fens Flood Risk Management - Baseline Report | December 2020
72 73
In some areas of the Fens there is a reliance on several “Tiers” of pumping. These areas include the Bevills Leam catchment in the south west of the Middle Level catchment and part of Warboy’s, Somersham and Pidley IDB in the south of the catchment. The assets, known as booster pumping stations, lift water from the very low lying areas of the catchment up into the main Middle Level System. The newly built Islington pumping station just north of Wiggenhall St Germans on the River Ouse is also an example of this double pumping regime with several IDB catchments pumping into a “Main Drain” which is then subsequently pumped into the Tidal River.
The Cranbrook and Counter Drain catchment in the Middle Level area, on the western side of the Ouse Washes is another example of this arrangement whereby several IDBs pump water into the Counter Drain, which in turn is pumped into the Ouse Washes by the Welches Dam pumping station maintained by the Environment Agency.
Double and Triple Pumping
Welches Dam Pumping StationPlan view of Welches Dam Pumping Station

Future Fens Flood Risk Management - Baseline Report | December 2020
74 75
The Tidal River area contains low-lying land on the East and West of the Tidal River between Denver Sluice and the Wash Estuary. The West of Ouse area is to the west of the Tidal River, north of the A1122 and bounded at its western extent by the River Nene. The area covers over 29,000 hectares (291km2) and includes over 170km of watercourses.
The largest settlements in the area are Terrington St. Clement, Emneth and Clenchwarton. The area also includes part of Wisbech.
As well as St Germans Pumping Station (referred to in Section 2.5.2), in channel structures in the area include Islington Pumping Station and Salters Lode Lock. Additional flood risk management assets include the Tidal River embankments and ‘hard defences’.
Significant lengths of the Tidal River embankments have erosion protection on the channel sides such as concrete block work.
The area to the west of the Tidal River is also at risk from coastal flooding and is protected by Sea banks.
2.5.3. West of Ouse
2
3
1
Photo: Andy F - Autumn colours on the River Nene near Sutton, CC BY-SA 2.0
St Germans Pumping Station is covered in the Middle Level section of this document.
The Great Ouse Tidal River is the length of channel from Denver Sluice to the Wash estuary. The river is a high-level carrier with raised embankments up to 6m above the surrounding land. The Ely Ouse system flows into the Tidal River through Denver Sluice/Little Eyes.
Smeeth Lode drains the area from Emneth to Terrington St Clement and is pumped via Islington Pumping Station (picture) to the Great Ouse Tidal River at Eau Brink.
The Middle Level Main Drain is the length of drain from Three Holes to its confluence with the River Great Ouse beyond St Germans Pumping Station, crossing from the Middle Level area at the A1122. It’s a high-level carrier that conveys water from the Middle Level area and discharges water into the Tidal River through St Germans Pumping Station. This drain and St Germans Pumping Station are maintained by the Middle Level Commissioners.
Salters Lode Lock is located at the confluence of the Well Creek navigation with the River Great Ouse. The hamlet of Salters Lode is scattered around the lock.
4
Photo: Dr Charles Nelson - Middle Level Main Drain, CC BY-SA 2.0
1
2
3
4

Future Fens Flood Risk Management - Baseline Report | December 2020
76 77
The Wash is the bay and estuary which sits in the north west corner of East Anglia where Norfolk meets Lincolnshire. It is fed by the Rivers Great Ouse, Nene, Witham and Welland, flowing out to the North Sea. It is a 62,046-hectare biological Site of Special Scientific Interest
The coastline at the Wash is constantly evolving, as it has across history, owing both to deposits of sediment and land reclamation. Evidence of this shifting coastline can be seen at towns such as King’s Lynn, once located on the coastline and now over 5km inland. Large sandbanks across the Wash also evidence the large amount of deposition which occurs, including at Breast Sand, Bulldog Sand, Roger Sand and Old South Sand, which are exposed at low tide.
Coastal flooding, downstream of King’s Lynn and along the Wash coastline, is not covered in this Baseline Report. The Wash Shoreline Management Plan, due to be completed in 2023 (SMP3), will consider the risk posed by this type of flooding.
The tidal Ouse falls within the Wash Shoreline Management Plan boundary as far inland as the A47 bridge at King’s Lynn. The SMP will deal with coastal flood management issues from the Wash.
The Wash SMP deals with issues of coastal protection and tidal inundation, and there are estuary strategies that cover all risks influenced by tidal processes within or around The Wash along this part of the coastline is generally expected to be due to strong northerly winds and significant high tides and storm surges which can cause damage to shingle banks along the south coast of Heacham. In turn the secondary embankment would be at risk if the primary defence fails.
The WashFigure 23: The tidal Great Ouse river entering the Wash (www.klmagazine.co.uk)
The Ordnance Survey carried out a survey in 2011 which revealed an additional 12km2 of coastline had been created by accretion since the previous surveys between 1960 and 1980.
Sea Bank and Saltmarsh

Future Fens Flood Risk Management - Baseline Report | December 2020
78 79
The East of Ouse area is triangular, lying to the east of the Tidal River, north of the A1122 and south of the A47. The area covers over 17,000 hectares (170km2) and contains over 88km of watercourses.
The largest settlements falling entirely within the area are Marham, West Winch and Watlington. The area also includes parts of Downham Market.
Drainage of the area is managed by East of Ouse, Polver and Nar Internal Drainage Board.
2.5.4. East of Ouse
1
2
1
The Tail Sluice is located at the downstream end of the Flood Relief Channel at Saddlebow, where water joins the Great Ouse Tidal River. The Tail Sluice, so named because it is at the tail end of the Flood Relief Channel, is used to control water flowing out of the Flood Relief Channel, which can hold more than 9.5 million cubic metres of water to reduce flood risk.
The Puny Drain runs to the north of the River Nar, turning northwards downstream of Setchey.
The Polver Drain runs along the south side of the River Nar to the Ouse Relief Channel, where there is a pumping station.
2
The River Nar is a tributary of the River Great Ouse, flowing 42 kilometres from Mileham (Norfolk) to the confluence with the Ouse at King’s Lynn. It flows through the East of Ouse catchment from the A47 at Narborough to the A47 at King’s Lynn.
The river is a biological Site of Special Scientific Interest. As Main River, the Nar is maintained by the Environment Agency and downstream of Narborough is a high-level carrier.

Future Fens Flood Risk Management - Baseline Report | December 2020
80 81
The King’s Lynn area sits directly to the north of the East of Ouse area, between the A47 and the A148. The area covers over 7,300 hectares (73km2) and includes around 50km of watercourses.
The primary flood risk management assets are the Tidal River embankments and ‘hard defences’, alongside IDB assets. The ‘hard defences’ comprise of a combination of flood walls and flood gates, mainly through the King’s Lynn urban area. Due to the frequency of astronomical high tides there are established operational procedures that can result in the closing of 61 sets of flood gates within King’s Lynn.
2.5.5. King’s Lynn
2
3
1
The River Nar flows northwards from the A47 in the King’s Lynn area until it reaches Wisbech Road at which point it turns northwest and discharges to the River Great Ouse via a sluice at Hardings Way.
For the times when discharge is tide locked, a storage area has been created along part of Blubberhouse Creek through excavation of the area. There is also a diversion channel to the Flood Relief Channel for high flows.
3
The Gaywood River flows 10.8 kilometres from its source to the northwest of the village of Gayton in Derby Fen to its outfall at the River Great Ouse in King’s Lynn.
The Pierpoint Drain flows into the River Nar in King’s Lynn upstream of the Southgates Roundabout.
2
4
1
4

Future Fens Flood Risk Management - Baseline Report | December 2020
82 83
2.6. Sources of Flood Risk to the Great Ouse FensThere are various sources of flood risk to the Great Ouse Fens. This section sets out the main sources of flood risk, and potential impacts from these sources. It will also consider historical events which highlight the issues.
Whilst climate change in itself is not a type of flood risk, the impacts of climate change will be to increase flood risk to the Great Ouse Fens across all sources as detailed within this section. Climate change is widely recognised as one of the greatest threats facing not only the Great Ouse Fens but the entire world.
The impacts of climate change on the Great Ouse Fens will be from increased risk as a result of profound increases in sea levels and increases in extreme weather events leading to higher and more intense rainfall, greater flows in rivers and greater surface water run-off.
Whilst climate change is recognised as a key threat to the Great Ouse Fens and the future of flood risk management in the area, there is at this stage of study a lack of existing data and modelling to inform a proper assessment of its likely impacts. Assessments have been made so far as is possible with available data. More detailed assessments will be made in future phases of the project using detailed modelling to ensure the scale of this threat is understood. In this section, potential impacts of climate change on each source of flood risk are noted.
2.6.1 Climate Change
- Mill Fleet- Nar Outfall (gravity with automated penstock to prevent tidal inundation);- Flood Relief Channel;- West Lynn Drain;
- Billy Kirkham Sluice;- Ely Ouse at Denver Sluice;- Ouse Washes at the John Martin Sluice;- Mepal outfall; and- Old Bedford Sluice.
• Vast parts of the study area lie below mean sea level with 707km2 (32% of the study area) below 0mAOD.
• The study area is protected from coastal flooding by tidal embankments along the coast which reach to 7mAOD.
• Sea levels are rising with the latest UK climate projection data predicting increases of 0.84 77 – 1.72m* at King’s Lynn by 2100. (* These projections are the range from the Higher Central (70th percentile) and Upper End Scenario (95th percentile) detailed in the Environment Agency’s ‘Flood and coastal risk projects, schemes and strategies: climate change allowances’ Guidance, 2020.)
• When these factors are considered together, it suggests the top end of the average tidal range could be between 4.63mAOD and 5.58mAOD by the year 2100.
• Within 100 years, mean sea level could rise to between 1.0 and 2.4m AOD, with the equivalent of 43-60% of the study area lying below this level. Tidal embankments will offer less protection from extreme events and any overtopping or breach of these embankments could lead to flooding of vast swathes of the Great Ouse Fens.
• The average low tide could rise to between -0.82 and 0.53m, reducing how effective gravity discharges at Welmore, Denver and Tail sluices will be; at Denver Sluice, the time during which gravity discharge is possible could reduce from 59% to between 21 and 45% of the time within 100 years.
Tidal flooding has an additional complication in the Great Ouse Fens due to the impact of saltwater on agriculture. Saltwater flooding has a lasting impact on soils in agricultural areas which can reduce the productivity of these areas for several years after the flood occurs. Given the importance of agriculture in the Great Ouse Fens both to the local economy and national food security, such impacts could have vast and far reaching consequences.
• The usual tidal range at the Freebridge King’s Lynn Monitoring Station is between -1.69m and 3.86m. It has been between these levels for 90% of the time since monitoring began.
• The typical recent level of the Freebridge King’s Lynn Monitoring Station over the past 12 months has been between -4.99m and 4.75m. It has been between these levels for at least 150 days in the past year2.
• The tidal range in the Wash during Spring tides is generally about 6m, falling to approximately 3m during neaps. This is the highest tidal range that occurs on the east coast of England and can be further increased by storm surges. King’s Lynn was affected by a storm surge of up to 6.17mAOD in the December 2013 east coast tidal event.
• There are 61 sets of flood gates are in place at King’s Lynn and a phased closure of these gates takes place at high tides. The first two gates are closed several hours before each high tide predicted to reach 4.5m AOD. All other flood gates close before a predicted high tide of 4.7m AOD and road closures and vehicle evacuations from the area in front of the defences takes place before a predicted high tide of 5m AOD.
2 - Correct as of 6th August 2020
The Wash Shoreline Management Plan (SMP) deals with issues of coastal protection and tidal inundation, and there are estuary strategies that cover all risks influenced by tidal processes within or around The Wash. Tidal flooding is the flood risk from the sea and can be caused by high astronomical tides, storm surges and wave action. Historically, severe coastal flooding has occurred when a storm surge peak has coincided with a high spring tide. In addition, breaches of tidal embankments can lead to flooding.
There are a number of issues around coastal flooding which affect risk in the Great Ouse Fens.
2.6.2 Tidal • For the upper two trigger levels, 25 staff are deployed in a range of roles including closing the floodgates, deploying sandbags and to undertake coastal and river patrols. This response includes several partner organisations and during an extreme event there are precautionary evacuation areas for some sections of the coast to the north of the scoping area.
• The tidal limit of the River Great Ouse is at Brownshill, just upstream of Earith, although the river as far upstream as St Ives is still affected by the tide; there is potential for flooding on the landward side of the defences if tidal conditions inhibit drainage though gravity outfalls from rivers.
• The tide has an effect on both drainage into the Great Ouse from certain tributaries, and on the deposition of silt along the river. Further information on the siltation issue is included in Section 2.4.2.
• Some tributaries drain into the main rivers by gravity alone, whilst others require pumps to overcome the difference in levels. Gravity drain outfalls affected by the tide include:
• A high tide can prevent rivers from discharging into the sea, a process known as tide locking. This problem is increased when a high tide coincides with high river flows, causing rivers and streams to ‘back-up.’
• It is anticipated that storm surges could increase by up to 70cm by 2070 as a result of climate change, increasing the risk of flooding and length of time over which tide locking may occur.

Future Fens Flood Risk Management - Baseline Report | December 2020
84 85
Coastal flooding impacted the Fens in 1953. During this event there was tidal inundation at King’s Lynn. The flood event was caused by a combination of a high spring tide and a severe wind storm over the North Sea which led to a water level of more than 5.6 metres above mean sea level in some places. The impact of the high water level and waves led to tidal defences being overwhelmed in the Netherlands, Belgium and in the UK.
In King’s Lynn, flood defences were breached by a wall of water and 15 people were killed in the town. The impacts of the flood left many homes destroyed and thousands homeless.
1953 Floods
Eastern Daily Press, 5th December 2013
“The worst floods of modern times occurred on January 31, 1953 and were caused by a freak combination of winds, atmospheric pressure and high tides.
Sea defences were swept aside by the wall of water which swept into King’s Lynn at 6.30pm, had reached Hunstanton by 7pm and was powering towards Great Yarmouth by 9pm.
Exactly 100 people were drowned, in Norfolk alone, that dreadful night. Thousands more spent a terrifying winter night, cowering on roofs, in trees, and on improvised rafts, soaked to the skin and lashed by salt-spray and hurricane-force winds. Tens of thousands more lost almost everything they owned and became homeless overnight.”
Figure 25: (right) 1953 Floods at King’s Lynn, St Margaret’s Church2
and (below) Military vehicles used to plug a hole in an embankment
2 - www.edp24.co.uk/news/weather/photo-galleries-from-the-archives-how-the-floods-of-1953-1978-and-2007-affected-the-region-1-3081153
2.6.3. Fluvial
Fluvial flooding occurs in a number of ways; firstly, when excessive rainfall or snowmelt leads to flows in a river exceeding its capacity, river levels can rise above bank level and overtop. Flood risk from watercourses can also be exacerbated by blockages at structures, often as a result of high flows washing debris downstream. Raised embankments or flood defences can also breach or fail.
There are a number of issues in the Great Ouse Fens in relation to fluvial flood risk.
• The catchment is largely flat and flows through the catchment are slow as a result. This also means that it takes a long time for flows to drain away, exacerbating any flooding as waters take a long time to recede.
• Due to the nature of the catchment, with many areas at or below sea level, watercourses can be tide locked at the downstream ends of the catchment during high tides.
• Drainage of the catchment is reliant on pumping where gravity outfalls are ineffective, or watercourses are tide locked.
• There are a large number of watercourses across the Great Ouse Fens to manage, including those for navigation and drainage.
• A number of the watercourses in the catchment are high level carriers and are perched above the levels of the surrounding land.
• Climate change will lead to increased flows in the catchment. Current Environment Agency guidance suggests there will be an increase in peak flows of between 25 and 65% by 2100 in the Anglian region.
• When these factors are considered together, it becomes clear that the Great Ouse Fens will be at increased risk of flooding from watercourses across the next 100 years, with flood flows tide locked and taking a long time to recede. Once water from high level carriers is out of bank, flows will be dependent upon pumping to drain the catchment. There are currently no pumps at Denver or Tail sluice meaning the Old West and Ely Ouse rivers, and all rivers feeding into this system, will be unable to discharge. This would have an impact beyond the study area, including to Cambridge. This emphasises the fluvial, pluvial and tidal interactions that need quantitative characterisation to offer useful options in the next phase of the project.
Flooding at Ouse Washes - Sutton Road

Future Fens Flood Risk Management - Baseline Report | December 2020
86 87
Fluvial flooding impacted the Fens in 1947 when the Ouse burst its banks at Ely. Following a harsh winter, heavy snow lay on the ground until March. On March 7th there was a heavy rainfall, unable to soak into the ground due to the icy conditions. A sudden thaw of the snow followed. A high spring tide at the same time meant tidal sluice gates could only be opened for short periods of time and as such water was unable to drain away sufficiently. Water levels rose significantly in rivers throughout the country.
The Ouse Washes flooded on March 13th and the River Ouse burst its banks at Ely, leading to the flooding of houses and Ely Station, as well as the railway to the North of Littleport. Many people were evacuated from their homes. There was a 30m wide breach in the Great Ouse banks at Over; Over and Willingham were flooded with water soon reaching Earith. Another breach occurred near Little Thetford and Thetford and Cawdle Fens were flooded. At Hockwold the banks of the Little Ouse also gave way at Wilton Bridge with water flooding into Feltwell and Lakenheath Fens. Despite the army joining efforts to protect and repair banks, further breaches occurred in numerous places with 100 mph gale force winds hampering efforts to repair breaches. Following the events, flood water remained lying on the land for two months in parts of the Great Ouse Fens.
1947 Floods
Figure 26: Mike Petty Cambridgeshire Collection - Army assistance in the 1947 floods
2.6.4. Surface Water
Surface water (or rainwater) flooding occurs when there is intense rainfall and an excess of overland flow before this reaches a watercourse or drainage network, or when rainwater cannot drain away through the normal drainage systems or soak into the ground; this may be due to a lack of capacity in the system, ground which is already saturated, or a failure of the drainage network due to a blockage or culvert collapse.
Whilst surface water flooding is usually the result of high intensity rainfall, it can also occur with lower intensity rainfall when the land has a low permeability. Permeability can be reduced by development and ground being frozen or saturated. Flooding can also result if a network is already at capacity and therefore water cannot drain easily to the intended watercourse or sewer.
In the Great Ouse Fens, surface water flooding is an issue because:
• Water can lie on the ground for many months due to the flat nature of the catchment.
• Roads and railways can be impacted; in the Great Ouse Fens many remote villages can be cut off due to this.
• Many of the watercourses are high level carriers perched above the surrounding land and rely on pumping.
• Climate change projections show that rainfall intensity will increase to the year 2100, with projections from the Environment Agency’s ‘Flood and coastal risk projects, schemes and strategies: climate change allowances’ 2020 guidance stating a potential increase of 20-40% in peak rainfall intensity.
Figure 27: Clinton Edwards - Ely Standard - Sainsburys car park flooded in Ely, 2014
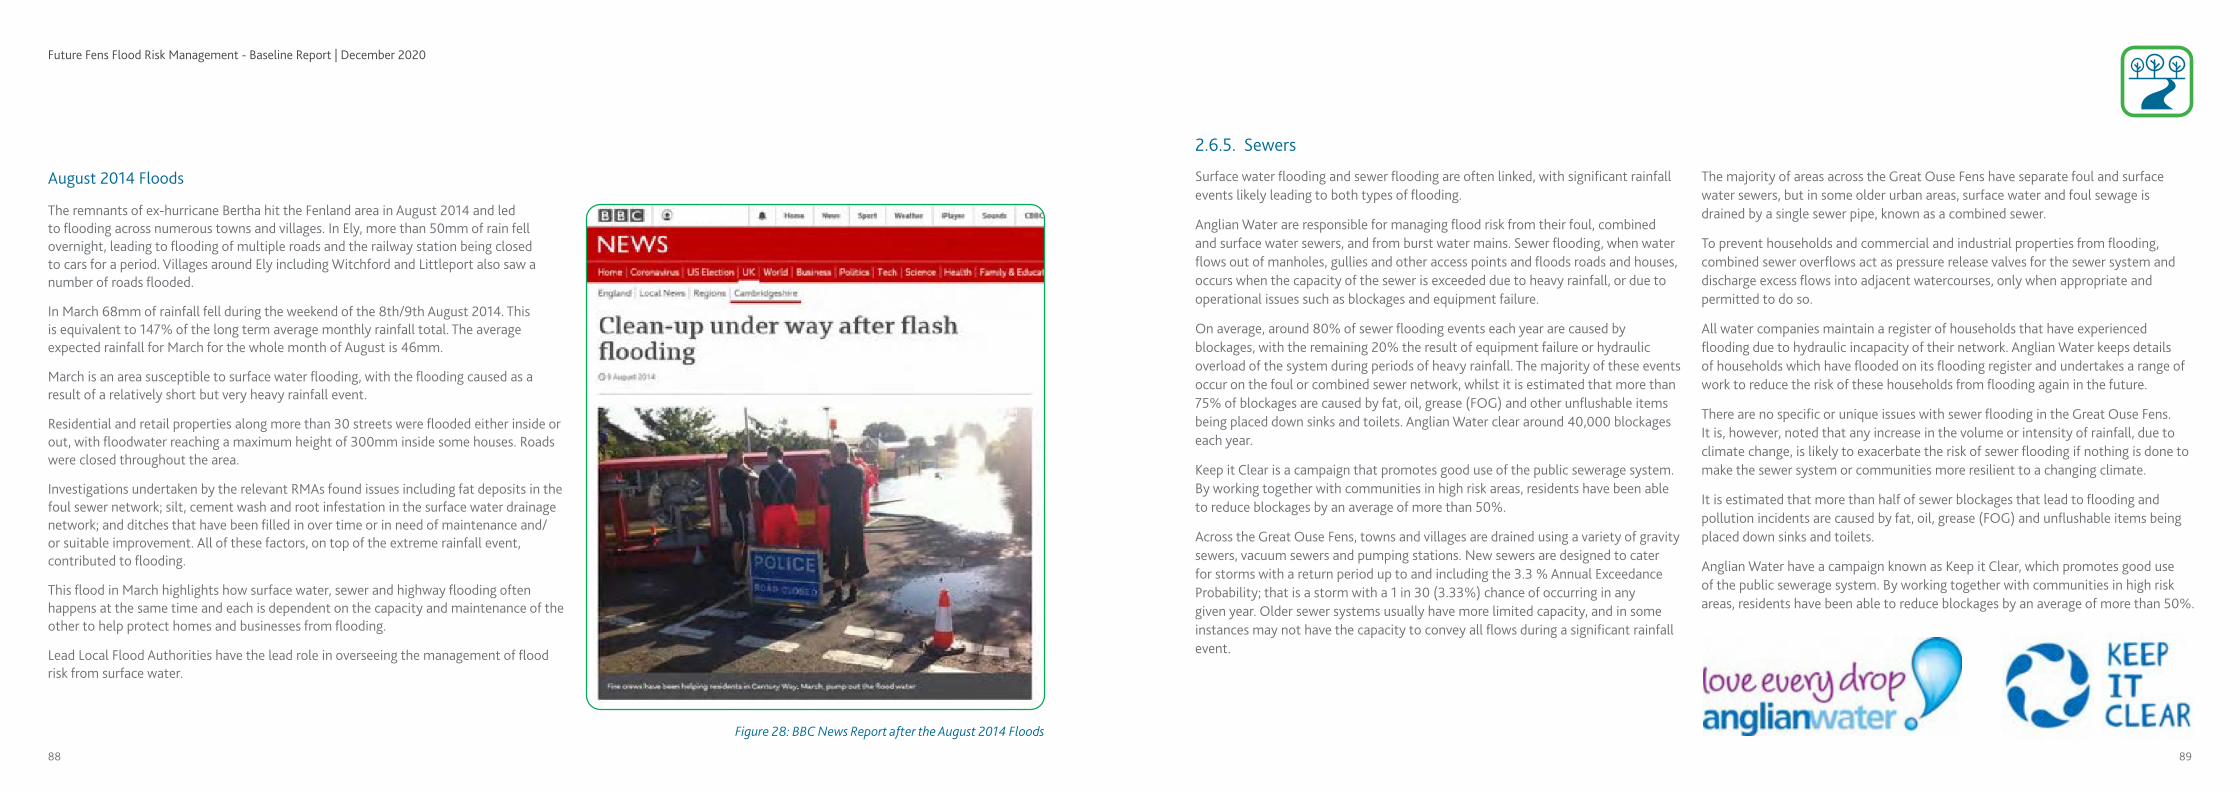
Future Fens Flood Risk Management - Baseline Report | December 2020
88 89
2.6.5. Sewers
Surface water flooding and sewer flooding are often linked, with significant rainfall events likely leading to both types of flooding.
Anglian Water are responsible for managing flood risk from their foul, combined and surface water sewers, and from burst water mains. Sewer flooding, when water flows out of manholes, gullies and other access points and floods roads and houses, occurs when the capacity of the sewer is exceeded due to heavy rainfall, or due to operational issues such as blockages and equipment failure.
On average, around 80% of sewer flooding events each year are caused by blockages, with the remaining 20% the result of equipment failure or hydraulic overload of the system during periods of heavy rainfall. The majority of these events occur on the foul or combined sewer network, whilst it is estimated that more than 75% of blockages are caused by fat, oil, grease (FOG) and other unflushable items being placed down sinks and toilets. Anglian Water clear around 40,000 blockages each year.
Keep it Clear is a campaign that promotes good use of the public sewerage system. By working together with communities in high risk areas, residents have been able to reduce blockages by an average of more than 50%.
Across the Great Ouse Fens, towns and villages are drained using a variety of gravity sewers, vacuum sewers and pumping stations. New sewers are designed to cater for storms with a return period up to and including the 3.3 % Annual Exceedance Probability; that is a storm with a 1 in 30 (3.33%) chance of occurring in any given year. Older sewer systems usually have more limited capacity, and in some instances may not have the capacity to convey all flows during a significant rainfall event.
The majority of areas across the Great Ouse Fens have separate foul and surface water sewers, but in some older urban areas, surface water and foul sewage is drained by a single sewer pipe, known as a combined sewer.
To prevent households and commercial and industrial properties from flooding, combined sewer overflows act as pressure release valves for the sewer system and discharge excess flows into adjacent watercourses, only when appropriate and permitted to do so.
All water companies maintain a register of households that have experienced flooding due to hydraulic incapacity of their network. Anglian Water keeps details of households which have flooded on its flooding register and undertakes a range of work to reduce the risk of these households from flooding again in the future.
There are no specific or unique issues with sewer flooding in the Great Ouse Fens. It is, however, noted that any increase in the volume or intensity of rainfall, due to climate change, is likely to exacerbate the risk of sewer flooding if nothing is done to make the sewer system or communities more resilient to a changing climate.
It is estimated that more than half of sewer blockages that lead to flooding and pollution incidents are caused by fat, oil, grease (FOG) and unflushable items being placed down sinks and toilets.
Anglian Water have a campaign known as Keep it Clear, which promotes good use of the public sewerage system. By working together with communities in high risk areas, residents have been able to reduce blockages by an average of more than 50%.
The remnants of ex-hurricane Bertha hit the Fenland area in August 2014 and led to flooding across numerous towns and villages. In Ely, more than 50mm of rain fell overnight, leading to flooding of multiple roads and the railway station being closed to cars for a period. Villages around Ely including Witchford and Littleport also saw a number of roads flooded.
In March 68mm of rainfall fell during the weekend of the 8th/9th August 2014. This is equivalent to 147% of the long term average monthly rainfall total. The average expected rainfall for March for the whole month of August is 46mm.
March is an area susceptible to surface water flooding, with the flooding caused as a result of a relatively short but very heavy rainfall event.
Residential and retail properties along more than 30 streets were flooded either inside or out, with floodwater reaching a maximum height of 300mm inside some houses. Roads were closed throughout the area.
Investigations undertaken by the relevant RMAs found issues including fat deposits in the foul sewer network; silt, cement wash and root infestation in the surface water drainage network; and ditches that have been filled in over time or in need of maintenance and/or suitable improvement. All of these factors, on top of the extreme rainfall event, contributed to flooding.
This flood in March highlights how surface water, sewer and highway flooding often happens at the same time and each is dependent on the capacity and maintenance of the other to help protect homes and businesses from flooding.
Lead Local Flood Authorities have the lead role in overseeing the management of flood risk from surface water.
August 2014 Floods
Figure 28: BBC News Report after the August 2014 Floods

Future Fens Flood Risk Management - Baseline Report | December 2020
90 91
2.6.6. Groundwater
Groundwater flooding occurs when the level of water within the land, known as the water table, rises above the surface of the ground. It tends to occur after long periods of sustained rainfall. Groundwater flooding can last for a sustained period of time, and often longer than other sources of flooding. Over an average year, the water table naturally rises and falls in response to seasonal rainfall. Groundwater flooding typically occurs in spring after periods of prolonged rainfall in the previous autumn.
In the Great Ouse Fens, there is a high risk of groundwater flooding due to the low-lying nature of the study area. There is also a risk that flooding will not recede for long periods of time due to the flat nature of the catchment and the reliance on pumping for drainage. Whilst no specific groundwater flood incidents are noted in the historic flooding events in the area, it is likely that high groundwater issues contributed to flooding in a number of these historic events.
2.6.7. Reservoir
Reservoir flooding is very rare but occurs when there is a failure of reservoir impounding structures such as raised embankments. By far the largest reservoir in the study area is the Ouse Washes. This flood storage reservoir is designed to be seasonally flooded and holds around 90 million cubic metres of water to help prevent flooding to surrounding villages and agricultural land.
Due to the nature of flood storage reservoirs such as the Ouse Washes, there is a residual risk that failure of the retaining structures could lead to catastrophic flooding of surrounding land and property. The Ouse Washes is surrounded by lower lying agricultural land with pumped drainage. Any failure of the embankments would lead to vast areas of land being inundated, and it is likely that flood waters would not recede for a long period of time.
The area of the Ouse Washes extending from Earith to Welmore Lake Sluice is registered as a Statutory Reservoir under the Reservoirs Act, 1975. The boundary of the reservoir to the north-west is taken to be the crest of the Middle Level Barrier Bank, the reservoir dam, and it includes the Old Bedford and River Delph river channels. To the south-east, the boundary is taken to be the crest of the Cradge Bank, constructed on the left bank of the New Bedford River. The right bank of the New Bedford River is a tidal riverbank, known as the South Level Barrier Bank. The Environment Agency is the undertaker for the reservoir under the Act. A Section 10 (S10) Inspection was completed in September 2013 under S10 (6) of the Act, and a report produced (by the Inspecting Engineer).
Due to the significance of the Ouse Washes Reservoir, it requires much higher standard and frequency of inspection and maintenance than other flood assets.
The Environment Agency inspect the main structures (Earith sluices, Welches Dam pumping station and Welmore Lake sluices) twice a year. The embankments are inspected once a year, normally in September. The Supervising Engineer visits twice a year accompanied by Environment Agency staff.
The Environment Agency must ensure it complies with its’ legal duties to maintain the reservoir dam in a safe condition. The most recent inspection identified 2 Matters in the Interest of Safety (MIOS) for the Ouse Washes. These MIOS are a legal obligation under the Reservoirs Act 1975.
• The crest level of the Middle Level Barrier Bank should be raised, where required, to permit no still water overflow and controls the height of wave overtopping. This work is required to be completed by December 2022.
• The ground profile and grass cover on the crest and outer face of the Middle Level Barrier Bank should be developed to provide erosion resistance. This work is due to be completed by December 2024.
The average finished crest level of the Middle Level Barrier Bank will be 6.2mAOD. Bank raising will be completed by October 2021 and works to accommodate the new demountable barrier at Welney will be completed in 2022. Capital maintenance works to ensure good grass cover will continue until October 2024.
The works will be carried out during the summer months over four years to avoid disturbing over-wintering and ground nesting birds. The new crest levels are designed to hold a 1 in 10,000 year flood. Major bank raising works were last carried out in the 1990s prior to the reservoir being designated under the Act. As such, the design criteria applied then was different to that now required to meet the MIOS requirements.
The reservoir is part of a system providing flood risk management to large areas of the low-lying Cambridgeshire Fens as defined in the Great Ouse Catchment Flood Management Plan, December 2009 and the Great Ouse Tidal River Baseline Report.
The impacts of climate change, amongst other things, will be to increase peak flows in rivers, raise sea levels, and increase the intensity of rainfall events. All of these issues will increase the frequency of use of the flood storage reservoirs in the Great Ouse Fens, such as the Ouse Washes, and the amount of time for which they are used. As such, it is likely there will be an increasing requirement for inspection and maintenance works to ensure these reservoirs are safe and are operating as intended.
Figure 29: Ouse Washes in flood from Welney, Paul Tibbs/Ian Burt Photography

Future Fens Flood Risk Management - Baseline Report | December 2020
92 93
Figure 30: Ouse Washes in flood at Welney, Paul Tibbs/Ian Burt Photography
3.1. Approach
3.0 Economic Appraisal
Whenever there is a proposal to use public money (i.e. government funding from taxation), it is important that the value for money offered by the investment is considered. In order to prove the value for money that an investment offers, an economic appraisal will be undertaken. The aim of an economic appraisal is to prove value for money by determining estimates of the total expenditure proposed and the total benefits that will be returned as a result of the investment. In the case of flood risk management, it is unusual for there to be a financial return on an investment, and benefits are considered in terms of the value of damages and economic losses avoided due to a reduction in flood risk as a result of the investment. This section of the report details the baseline economic appraisal undertaken for flood risk management in the Great Ouse Fens.
The economic appraisal has been carried out following Flood and Coastal Erosion Risk Management Appraisal Guidance (FCERM-AG, Environment Agency, 2010) and in accordance with HM Treasury’s Green Book. A methodology has been developed following the Multi Coloured Manual approach (Flood Hazard Research Centre, 2013), and making use of data from the Multi Coloured Handbook (Flood Hazard Research Centre, 2019). This is a standard approach to estimating economic benefits for flood risk management projects.
The economic appraisal for FRM in the Great Ouse Fens has considered a range of benefits. Some of these are standard considerations in FRM economic appraisal. Others have been considered in greater detail than they ordinarily would be or have been considered where they would normally not be considered at all.
The Green Book is guidance issued by HM Treasury on how to appraise policies, programmes and projects. The Green Book guidance applies to all proposals that concern public spending, and where there are changes to the use of existing public assets.
Standard FRM Benefits Additional Benefits for the Great Ouse Fens
- Damages avoided to properties
- Agriculture (considered in greater detail)
- Highways
- Railways
- Electricity utilities
- Land loss due to isolation
- Gross Value Added (GVA) to the local economy
- Water utilities
- Gas utilities
- Nature reserves

Future Fens Flood Risk Management - Baseline Report | December 2020
94 95
3.2. TerminologyThe following table provides some key terminology for understanding the results of the economic appraisal; further terminology is included in the Glossary.
TERM MEANING
BenefitThis is a monetary value (or cost) which represents the advantage to the
economy of one option over another.
DamageThis is a monetary value (or cost) assigned to an impact from flooding –
it is calculated based on the negative impact to the economy.
FCERMFlood and Coastal Erosion Risk Management;
in the context of the Great Ouse Fens we are considering flood risk management
Present Value (PV)
Monetary value of ongoing or future costs, discounted to provide equivalent present day costs.
Standard of Protection (SoP)
The design standard, measured by annual exceedance probability (AEP), that an existing asset or proposed project provides, based on the current assessment of risk. The SoP changes over time due to climate change impacts and asset deterioration.
Standard of Service (SoS)
The measurable and objective description of an asset such as the crest level of a wall or pumping capacity and a minimum condition grade.
Top: Fens EA Tree Management
Bottom: Fens Channel Maintenance
Left: Fens EA Weedcutting

Future Fens Flood Risk Management - Baseline Report | December 2020
96 97
3.3.1. Do Nothing
The ‘Do Nothing’ scenario is a hypothetical scenario only, used to understand the benefits of the current investment in flood risk management assets. In this scenario, it is assumed that all flood risk management activities would stop, and nature would be allowed to take its course. With the tidal embankments along the coastline of the Great Ouse Fens, the area is now a basin which, without pumped outfalls, would begin to fill with water due to flows from rivers and rainfall across the catchment.
The nature of the catchment is such that in this scenario, the switching off of pumps leads to an inability to drain what is essentially a bowl. The assessment the bowl begins to fill with water from day one as it cannot drain away. Over time, it was assumed the bowl would fill with water. Assessments were made of the volume of water
accrued in the catchment until reaching a limiting level. The limiting level was assumed to be controlled by the lowest point of the outside of the bowl at which level the water can spill into an adjoining catchment, rather than by existing embankment defence levels which have been breached in year zero. This level is around 5mAOD.
However, it is recognised that at some point the water level would reach an equilibrium where inflows would match losses from evaporation and seepage. It is assumed that this would fill up over a period of 7 to 12 years, depending on the maximum water level that would be reached. For the appraisal of economic losses, a range of maximum water levels has been considered, between 1.42 and 2.5mAOD; the economic losses presented in this report are based on an assumed maximum water level of 2.5mAOD.
The Do Nothing option is usually considered as a baseline option in most FCERM appraisals.
Where there are currently FCERM measures, it means that all further activities to maintain these measures stops from a specified date. This is usually the beginning of the appraisal period. The appraisal period is the time in years over which you are assessing the benefits of all the options you are considering.
However, the start of the appraisal period can sometimes be deferred until a later date. This may be the case when, for example, an appraisal has been started because an existing FCERM asset has failed.
If there are no current FCERM measures, then doing nothing is the current option. This is carried forward into your appraisal as the Do Nothing baseline option.
3.3. Scenarios ConsideredIn assessing the potential losses due to flooding in the Great Ouse Fens, we have considered the impacts in two scenarios.
Figure 31: How the Great Ouse Fens Basin Fills Over Time in a Do Nothing Scenario
The level of 1.42mAOD is taken from a previous study of potential filling of the bowl by consultants JBA. This was considered to be a conservative estimate and therefore additional levels at 2m and 2.5m AOD were also appraised.
A period of 7-12 years has been assumed. The previous work by JBA concluded a level of 1.42mAOD could be reached in three years, but this was considered overly pessimistic and as such the filling time for the bowl was extended to 12 years. This more conservative approach ensures flood risk management benefits are not over estimated at this stage of appraisal.
In addition to the permanent flooding associated with the basin filling up over time, the risk of flooding due to infrequent storm events remains for areas above the level of permanent flooding. This could be associated with flooding from rivers, the sea or from surface or ground water. The losses due to these infrequent events are calculated alongside those permanent losses where the basin has filled with water.
Figure 31 shows the scale of impacts in a Do Nothing scenario, where water filling the basin will lead to permanent flooding. As there is a large area below mean sea level, it is assumed that a large area within the basin would fill up very quickly, as shown by the area in red. There are gradual increases in the size of the area permanently flooded as more water fills the basin over time.

Future Fens Flood Risk Management - Baseline Report | December 2020
98 99
3.3.2. Do Minimum
The ‘Do Minimum’ scenario considered for the Great Ouse Fens is a business as usual approach, where maintenance activities continue in order to maintain the existing assets. Where appropriate, allowances have been made for future works to replace or refurbish existing assets such that FRM continues as it is throughout the appraisal period.
We have assumed all assets continue to provide the same level of service, with no changes in defence levels or pumping rates for example.
Whilst we continue to provide FRM assets and activities in this scenario, there will remain a residual risk of flooding from infrequent storm events, with flooding from rivers and the sea, or surface and ground water. Losses have therefore been calculated for the ‘Do Minimum’ based on the probability of these infrequent events occurring over a long time frame – in this case 100 years.
Figure 32 shows the flood risk across the Great Ouse Fens relating to infrequent events. Events are shown based on the probability of them occurring in any single year; so for the 1 in 10 year event, the chances of this event occurring in any given year are 1 in 10, or 10%. As the number increases, the chance of the event occurring reduce, such that the 1 in 1,000 year event has a 1 in 1,000 chance of occurring in any given year, or 0.1%. The map shows that the area at flood risk significantly increases when we consider the 1 in 100 year (1% chance) event.
The risk has been assessed using Risk of Flooding from Rivers and Sea (RoFRS) data. This is a broadscale model of risk. The dataset shows the chance of flooding from rivers and/or the sea, based on cells of 50m. It does not represent the existing local assets due to the nature of the modelling used, and therefore cannot be used to determine localised Standards of Protection for assets. The next phase of the project will determine Standards of Protection across the Great Ouse Fens with more detailed modelling.
Do Minimum
Undertaking measures for the minimum level of action to manage risks may not be considered attractive, but it is a do something option.
If FRM measures already exist, then doing the minimum would be a doing something less option. If there are no FRM measures then doing the minimum is a do something more option. This is because having no FRM measures is the Do Nothing option.
Business as usual
Business as usual describes the option to continue with the current approach to FRM regardless of its scale. Where appropriate, it would involve both revenue and capital funded measures. Depending on what is involved in undertaking the measures, business as usual could be the same as doing nothing.
Figure 32: Risk of Flooding from Rivers and the Sea Across the Great Ouse Fens

Future Fens Flood Risk Management - Baseline Report | December 2020
100 101
3.3.3. Damages and Benefits
Flood risk damages across the study area are quantified and estimated in monetary terms. Flood damages in the ‘Do Nothing’ scenario are far higher than they are in the ‘Do Minimum’ scenario, as no flood risk management activities are undertaken in the ‘Do Nothing’ scenario.
The benefits of continuing to carry out flood risk management activities are represented in the ‘Do Minimum’ scenario. Whilst we calculate the damages in this scenario due to residual flood risk, we are also able to estimate the damages we would avoid compared to the ‘Do Nothing’ scenario. These damages avoided are the flood risk management benefits.
DO NOTHING DO MINIMUM
Do minimum Benefits shown as a proportion of Do Nothing Damages
Loss
es (£
)
Damages Benefits
3.3.4. Sensitivity to Changes in Assumptions
As part of FCERM appraisal following Green Book methodology, it is important to consider a range of sensitivity tests for the economic appraisal. These tests are designed to test how sensitive the results of the analysis are to changes in the key assumptions and unknowns.
A range of tests were undertaken for the Great Ouse Fens appraisal in order to test the sensitivity of the results, which included those that are standard to FRM appraisal and some additional tests more specific to the study area. These tests and the results are detailed in the Economic Appraisal Report. The results have shown that, while some elements should be considered further at future stages of appraisal, changes to assumptions does not lead to a significant change in damages and benefits.
3.3.5. What is included?
The following table highlights the categories of potential losses due to flooding which we have chosen to calculate in this phase of the project for the scenarios, ‘Do Nothing’ and ‘Do Minimum’.
This is the losses caused to households due to flooding. Where households are permanently lost to flooding, the local average market value of houses by type of property has been used. For infrequent flooding, a national average for the damage to households has been used.
Households
This is the losses caused to commercial and industrial properties due to flooding. Where properties are permanently lost to flooding, the national average value of commercial space has been used alongside the floor area of the property. For infrequent flooding, a national average for the damage to commercial and industrial properties has been used.
This is the losses caused to agriculture because of flooding. For permanent flooding of land, this would include the lost value of agricultural production each year. For infrequent floods, losses are based on the loss of crops for that year.
Two methods of valuing agricultural damages were assessed, and a decision made on the most appropriate methodology to best represent the importance of agriculture in the Great Ouse Fens. Full details are included in the detailed economic appraisal report. The method chosen uses land use data and agricultural productivity, as well as assessing drainage conditions.
This is the damages caused to major highways across the Great Ouse Fens and is only calculated for permanent flooding where the infrastructure would be permanently lost. Major highways include A roads and primary roads. No allowance is made for minor and local roads.
This is the damages caused to railways across the Great Ouse Fens and is only calculated for permanent flooding where the infrastructure would be permanently lost. The lines which run through the Great Ouse Fens link Cambridge to King’s Lynn and Peterborough.
Commercial and Industrial Land and Properties
Agricultural Land
This is the impacts on water utilities for both clean and dirty water. The losses are calculated only where infrastructure would be permanently flooded.
Railways
Water utilities assets
Highways
Flood Embankment on the River Delph

Future Fens Flood Risk Management - Baseline Report | December 2020
102 103
This is the losses associated with the Ely Ouse – Essex Water Transfer system. It accounts only for the losses of infrastructure and does not account for the loss of service and transfer payments for the service. These losses only occur within the South Level catchment and are included within the Water Utilities Assets damages.
Ely Ouse: Essex Water Transfer
This loss is calculated for damages to electricity generation and distribution assets within the Great Ouse Fens. The losses are calculated only where the infrastructure would be permanently lost to flooding.
This is the impacts on gas utilities including the gas mains and distribution. The losses are calculated only where infrastructure would be permanently flooded.
These losses are calculated for the value of Natural Land lost to flooding, at nature reserves across the Great Ouse Fens. This is calculated both for permanent loss and for infrequent losses due to flooding.
There are considered to be additional losses where land becomes isolated due to permanent flooding, and the creation of new “islands” within the Great Ouse Fens. This has been valued based on the households, commercial and industrial properties and infrastructure affected.
Electricity utilities assets
Gas utilities assets
This is the damage to the local economy, which is calculated based on the number of jobs impacted, and the average value each job adds to the local economy (referred to as Gross Added Value).
Land lost due to isolation
Losses to the local economy
Nature Reserves
For a number of the damage categories listed, no damages are calculated in the Do Minimum scenario.
Highways, Railway, Water Utilities, Ely Ouse – Essex Water Transfer, Power Networks & Gas PipelineIn these categories, the damages in Do Nothing scenario are considered to be representative of a total loss of the infrastructure when it is permanently flooded. In the Do Minimum scenario, much of the infrastructure impacted by infrequent flooding will not be damaged and the value of losses when flooding recedes will be relatively minor. This is because the infrastructure is resilient to relatively short term flooding.
Isolated LandNo damages are calculated for Isolated Land in the Do Minimum scenario because it is considered that land only becomes isolated where permanent flooding occurs, as in the Do Nothing scenario; therefore, there are no losses in the Do Minimum scenario.
Losses to the Local EconomyWhilst businesses will be impacted by flooding in the Do Minimum scenario, and there will be financial losses associated with this, it is difficult to estimate the choices that these businesses would make following a flood event in terms of continuing to trade or moving premises for example. It is anticipated these losses can be calculated at future stages of appraisal when better data is available, though they will be relatively minor in comparison to the total loss of business assumed in the Do Nothing scenario.
Abandoned Car - Ouse Washes

Future Fens Flood Risk Management - Baseline Report | December 2020
104 105
Agricultural Land £2.6 billion £2.5 billion£99 million
Commercial and Industrial Land and Properties £4.5 billion £4.3 billion£139 million
Damages to Railways £934 million £934 million-
Damages to water utilities assets £1.5 billion £1.5 billion-
Damages to electricity utilities assets £1.1 billion £1.1 billion-
Damages to gas utilities assets £103 million £103 million-
Households £4.8 billion £4.6 billion£284 million
Damages to Nature Reserves £35 million £32 million£2 million
Land lost due to isolation £474 million £474 million-
Losses to the local economy* £5.3 billion £5.3 billion-
TOTAL £22.9 billion £22.4 billion£525 billion
3.4.1. Total Damages Summary
This set of results is for the entire Great Ouse Fens study area. It shows the scale of the benefits related to FRM across the entire area, with households, commercial and industrial properties and agriculture in particular being large beneficiaries.
Across the study area, there are 24,895 households at risk of periodic flooding from the rivers and the sea, while 17,149 households are at risk of permanent flooding in the Do Nothing scenario. A total of 3,733 commercial and industrial properties are at risk of periodic flooding whilst 2,979 are at risk of permanent flooding in the Do Nothing scenario.
In the Do Nothing scenario, 133,839ha of agricultural land is at risk of permanent flooding. 158,444ha is at risk or periodic flooding.
3.4. Summary of Damages and BenefitsThe following table provides some key terminology for understanding the results of the economic appraisal; further terminology is included in the Glossary.
Do Nothing Damages
Do Minimum Benefits
Do Minimum Damages
Damages to Highways £1.6 billion £1.6 billion-
*Losses to the local economy are forecast across ten years; all other losses are across a 100-year time horizon. Losses to the local economy are only forecast for 10 years because it is likely that where a business
impacted by flooding closes, another business will benefit from an increase in business, and this may lead to additional employment
opportunities at this business. It is therefore difficult to forecast impacts on employment and the local economy over a long time frame.
3.4.2. South Level Damages Summary
Within the South Level, the largest benefits are in commercial and industrial property and agricultural. There are also significant benefits relating to households, highways and water utilities. Water utilities benefits in the South Level include those relating to the Ely Ouse – Essex Water Transfer. The South Level also contains more than half of the total Nature Reserve benefits calculated.
There are 2,499 households protected from permanent flooding in the South Level, alongside 839 commercial and industrial properties. A total of 3,058 households are at risk from infrequent flooding with 980 commercial and industrial properties.
A total of 53,518ha of agricultural land is at risk of permanent flooding in the South Level, whilst 48,409ha is at risk of infrequent flooding.
Agricultural Land £1.2 billion £1.1 billion£36 million
Commercial and Industrial Land and Properties £1.3 billion £1.2 billion£35 million
Damages to Railways £568 million £568 million-
Damages to water utilities assets* £850 million £850 million-
Damages to electricity utilities assets £199 million £199 million-
Damages to gas utilities assets £6 million £6 million-
Households £802 million £732 million£70 million
Damages to Nature Reserves £20 million £18 million£2 million
Land lost due to isolation £157 million £157 million-
Losses to the local economy* £1.6 billion £1.6 billion-
TOTAL £7.4 billion £7.2 billion£142 million
Do Nothing Damages
Do Minimum Benefits
Do Minimum Damages
Damages to Highways £686 million £686 million-
* The water utilities asset damages include those for the Ely Ouse – Essex Water Transfer in the South Level.

Future Fens Flood Risk Management - Baseline Report | December 2020
106 107
3.4.3. Middle Level Damages Summary
Within the Middle Level, households and commercial and industrial properties give the biggest benefits, accounting for almost 50% of the total benefits. The Middle Level also includes a significant proportion of the Nature Reserve benefits calculated. Losses to the local economy are the largest of any of the sub catchments, as would be expected given the large value of damages associated with commercial and industrial properties.
There are 8,516 households protected from permanent flooding in the Middle Level, alongside 1,643 commercial and industrial properties. A total of 4,778 households are at risk from infrequent flooding with 1,197 commercial and industrial properties.
In the Middle Level, 56,658ha of agricultural land is at risk of permanent flooding, with 47,727ha at risk from infrequent flooding.
Agricultural Land £1.0 billion £947 million£45 million
Commercial and Industrial Land and Properties £2.1 billion £2.0 billion£23 million
Damages to Railways £341 million £341 million-
Damages to water utilities assets £359 million £359 million-
Damages to electricity utilities assets £275 million £275 million-
Damages to gas utilities assets £76 million £76 million-
Households £2.4 billion £2.3 billion£69 million
Damages to Nature Reserves £14 million £14 million£0.3 million
Land lost due to isolation £309 million £309 million-
Losses to the local economy* £3.5 billion £3.5 billion-
TOTAL £11.0 billion £10.8 billion£137 million
Do Nothing Damages
Do Minimum Benefits
Do Minimum Damages
Damages to Highways £698 million £698 million-
3.4.4. West of Ouse Damages Summary
The West of Ouse benefits are mainly in households, which accounts for over a third of the benefits. There are no railway or Nature Reserve damages or benefits calculated for the West of Ouse sub catchment.
There are 5,301 households protected from permanent flooding in the West of Ouse, alongside 294 commercial and industrial properties. A total of 8,516 households are at risk from infrequent flooding with 518 commercial and industrial properties.
The West of Ouse contains 19,431ha of agricultural land at risk of permanent flooding. There are 19,025ha at risk of infrequent flooding.
Agricultural Land £331 million £321 million£10 million
Commercial and Industrial Land and Properties £699 million £685 million£14 million
Damages to Railways - --
Damages to water utilities assets £210 million £210 million-
Damages to electricity utilities assets £458 million £458 million-
Damages to gas utilities assets £16 million £16 million-
Households £1.4 billion £1.4 billion£69 million
Damages to Nature Reserves - --
Land lost due to isolation £1 million £1 million-
Losses to the local economy* £166 million £166 million-
TOTAL £3.6 billion £3.5 billion£93 million
Do Nothing Damages
Do Minimum Benefits
Do Minimum Damages
Damages to Highways £241 million £241 million-

Future Fens Flood Risk Management - Baseline Report | December 2020
108 109
3.4.5. East of Ouse Damages Summary
The East of Ouse has a majority of benefits relating to commercial and industrial properties, equating to nearly half of the total benefits. There are no damages or benefits calculated for Nature Reserves in this sub catchment.
There are 595 households protected from permanent flooding in the East of Ouse, alongside 157 commercial and industrial properties. A total of 339 households are at risk from infrequent flooding with 211 commercial and industrial properties.
In the East of Ouse, 3,608ha of agricultural land is risk of permanent flooding, whilst a much larger area of 42,519ha is at risk of infrequent flooding.
3.4.6. King’s Lynn Damages Summary
For King’s Lynn, the majority of benefits relate to households and commercial and industrial properties. The sub catchment has the lowest damages and benefits related to agriculture, which is to be expected given the area is the most developed and densely urban of the sub catchments. No Nature Reserve damages or benefits are calculated for this sub catchment. No land becomes isolated in the Do Nothing scenario and as such there are no losses associated with isolated land. As the losses to the local economy are calculated across the first ten years of the appraisal only, there are no losses for this sub catchment; this is because all the commercial and industrial properties within the sub catchment sit above 2m AOD and therefore are no impacted in the Do Nothing scenario until beyond year 10.
There are 238 households protected from permanent flooding in King’s Lynn, alongside 46 commercial and industrial properties. A total of 8,158 households are at risk from infrequent flooding with 827 commercial and industrial properties.
Agricultural land totalling 624ha is at risk of permanent flooding in King’s Lynn, with 765ha at risk from infrequent flooding.
Agricultural Land £7 million £6 million£0.3 million
Commercial and Industrial Land and Properties £136 million £93 million£43 million
Damages to Railways £0.1 million £0.1 million-
Damages to water utilities assets £7 million £7 million-
Damages to electricity utilities assets £162 million £162 million-
Damages to gas utilities assets £0.6 million £0.6 million-
Households £113 million £40 million£73 million
Damages to Nature Reserves - --
Land lost due to isolation - --
Losses to the local economy* - --
TOTAL £439 million £323 million£116 million
Do Nothing Damages
Do Minimum Benefits
Do Minimum Damages
Damages to Highways £14 million £14 million-
Agricultural Land £58 million £51 million£8 million
Commercial and Industrial Land and Properties £278 million £253 million£25 million
Damages to Railways £26 million £26 million-
Damages to water utilities assets £32 million £32 million-
Damages to electricity utilities assets £11 million £11 million-
Damages to gas utilities assets £4 million £4 million-
Households £142 million £138 million£4 million
Damages to Nature Reserves - --
Land lost due to isolation £7 million £7 million-
Losses to the local economy* £15 million £15 million-
TOTAL £581 million £544 million£37 million
Do Nothing Damages
Do Minimum Benefits
Do Minimum Damages
Damages to Highways £8 million £8 million-
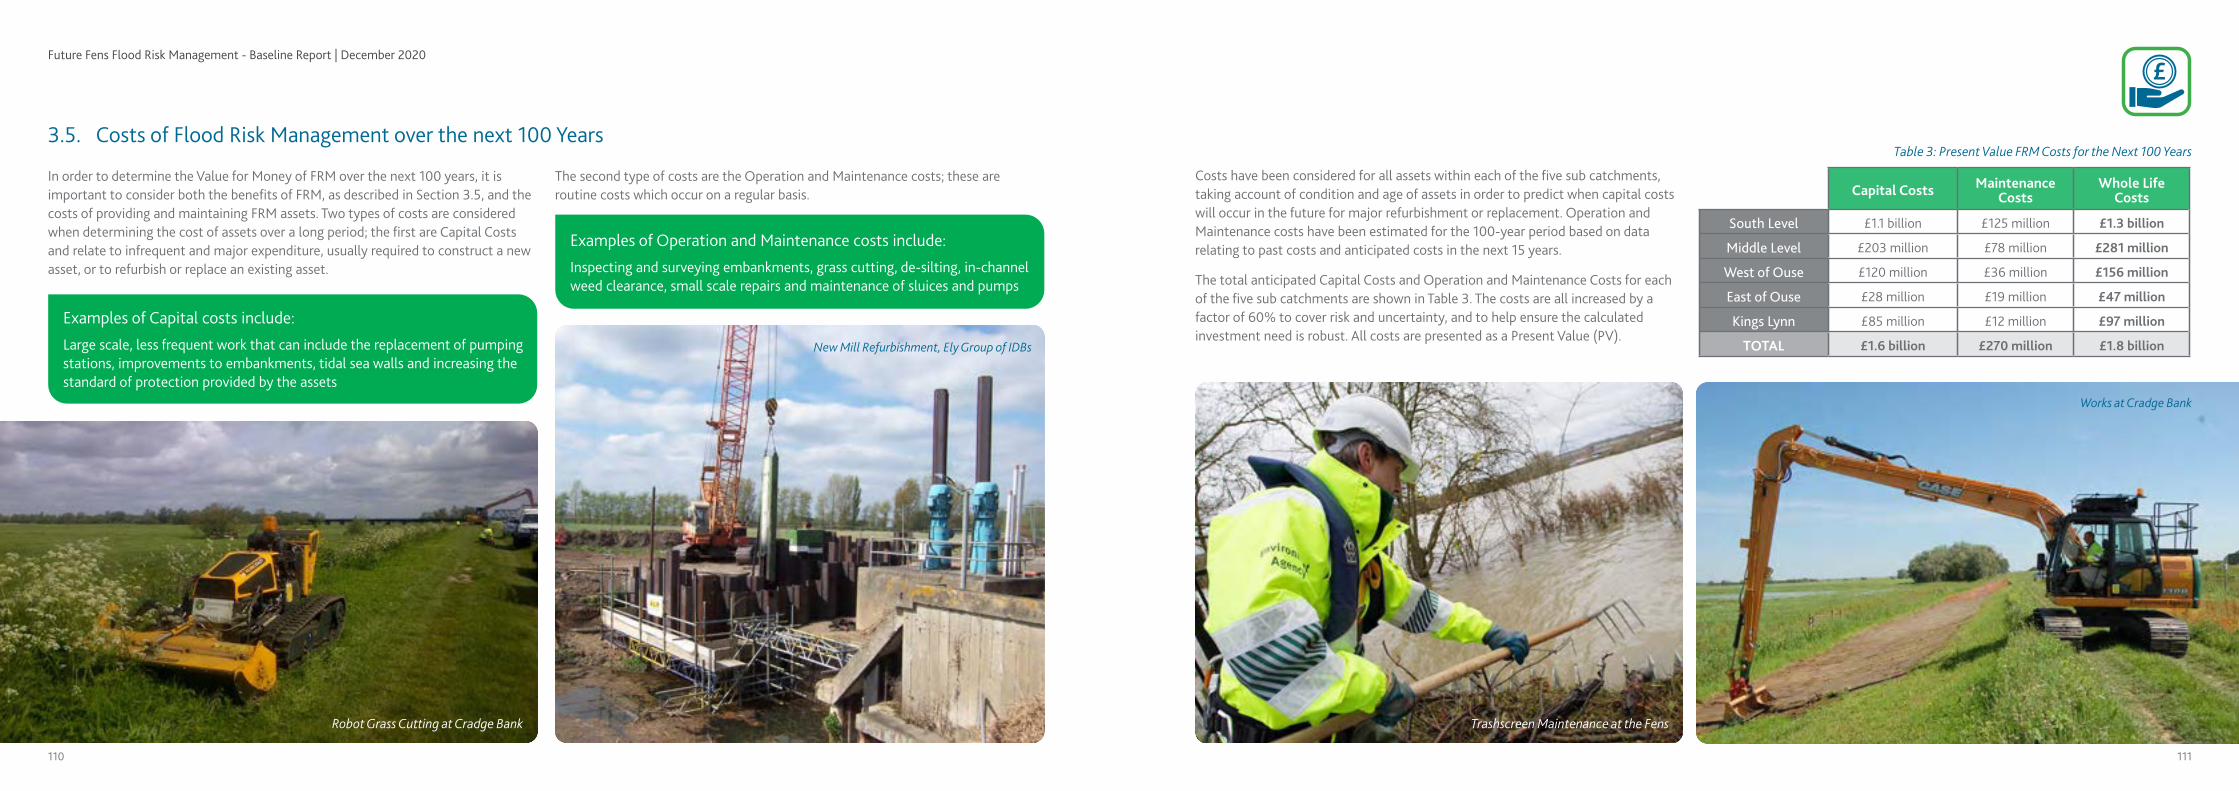
Future Fens Flood Risk Management - Baseline Report | December 2020
110 111
3.5. Costs of Flood Risk Management over the next 100 Years
In order to determine the Value for Money of FRM over the next 100 years, it is important to consider both the benefits of FRM, as described in Section 3.5, and the costs of providing and maintaining FRM assets. Two types of costs are considered when determining the cost of assets over a long period; the first are Capital Costs and relate to infrequent and major expenditure, usually required to construct a new asset, or to refurbish or replace an existing asset.
Examples of Capital costs include:
Large scale, less frequent work that can include the replacement of pumping stations, improvements to embankments, tidal sea walls and increasing the standard of protection provided by the assets
The second type of costs are the Operation and Maintenance costs; these are routine costs which occur on a regular basis.
Examples of Operation and Maintenance costs include:
Inspecting and surveying embankments, grass cutting, de-silting, in-channel weed clearance, small scale repairs and maintenance of sluices and pumps
Costs have been considered for all assets within each of the five sub catchments, taking account of condition and age of assets in order to predict when capital costs will occur in the future for major refurbishment or replacement. Operation and Maintenance costs have been estimated for the 100-year period based on data relating to past costs and anticipated costs in the next 15 years.
The total anticipated Capital Costs and Operation and Maintenance Costs for each of the five sub catchments are shown in Table 3. The costs are all increased by a factor of 60% to cover risk and uncertainty, and to help ensure the calculated investment need is robust. All costs are presented as a Present Value (PV).
Capital Costs Maintenance Costs
Whole Life Costs
South Level £1.1 billion £125 million £1.3 billion
Middle Level £203 million £78 million £281 million
West of Ouse £120 million £36 million £156 million
East of Ouse £28 million £19 million £47 million
Kings Lynn £85 million £12 million £97 million
TOTAL £1.6 billion £270 million £1.8 billionNew Mill Refurbishment, Ely Group of IDBs
Table 3: Present Value FRM Costs for the Next 100 Years
Robot Grass Cutting at Cradge Bank Trashscreen Maintenance at the Fens
Works at Cradge Bank

Future Fens Flood Risk Management - Baseline Report | December 2020
112 113
3.6. Partnership Funding
The Defra policy, flood and coastal erosion resilience partnership funding, is also known as partnership funding. The main objectives of partnership funding is to offer communities the opportunity to invest in (and benefit from) local flood and coastal erosion risk management (FCERM) measures, that could not be afforded from central government funding (GiA) alone. All projects supported by partnership funding will need to meet key criteria set out in Defra’s policy, and as a minimum in every case, demonstrate that in present value terms the expected whole-life benefits exceed the whole-life costs of the scheme.
To find out how much FCERM GiA a project is eligible for risk management authorities use a spreadsheet known as the partnership funding (PF) calculator. They include their expected contribution to specific benefits (outcome measures), their estimated costs and the amount of funding they intend to commit (their proposed financial contribution) within the spreadsheet. The PF calculator works out how much FCERM GiA may be available to support the project using the tariffs agreed with Defra for the updates to the partnership funding arrangements.
Calculators have been completed for each of the five sub catchment areas, plus the overall study area, based on the three Do Nothing scenarios with the results shown in Table 4 and Table 5. The scenarios show a range from low levels of required funding (1.42m scenario) to high levels of required funding (2.5m scenario), illustrating how available funding would reduce if our assumptions around the maximum water level in a Do Nothing scenario were to change.
It should be noted that the PF scores and eligibility for funding detailed here are representative when taking account of all assets working together to provide FRM across the study area. It does not provide an indicator for affordability of individual assets when considered in isolation. Assets are not considered in isolation at this stage of study, but will be undertaken following completion of detailed modelling in the next phase.
Table 4: Breakdown of Total FRM Costs and the proportions of the Total FRM Costs Provided from Up Front FCRM GiA (including maintenance) and Partnership Funding. Percentage values indicate proportion of total costs (including maintenance)
AreaPV Total
Costs of FRM
Capital Up front costs
PV Maintenance
Costs
Maximum eligible PV FCRM GiA (including maintenance) Partnership Funding
1.42m Scenario
2.0m Scenario
2.5m Scenario
1.42m Scenario
2.0m Scenario
2.5m Scenario
Great Ouse Fens £1.8 billion £1.6 billion £270 million
39% £722 million
46% £847 million
61% £1.1 billion
£946 million £839 million £611 million
South Level £1.3 billion £1.1 billion £125 million21%
£263 million23%
£292 million28%
£350 million£889 million £863 million £811 million
Middle Level £281 million £203 million £78 million120%
£337 million136%
£383 million167%
£468 million- - -
West of Ouse £156 million £120 million £36 million60%
£93 million85%
£132 million143%
£222 million£48 million £18 million -
East of Ouse £47 million £28 million £19 million13%
£6 million32%
£15 million70%
£33 million£24 million £19 million £8 million
Kings Lynn £97 million £85 million £12 million n/a low BCR n/a low BCR43%
£42 millionn/a n/a £49 million
Construction of New St Germans Pumping Station
The following dashboards illustrate the key facts in regard to FRM benefits, costing and funding arrangements for each of the five sub catchment areas and the overall study area.

Future Fens Flood Risk Management - Baseline Report | December 2020
114 115
Total Investment needed: £1.8 billion
FCRM GiA (£1.1bn)
Future Fens - Flood Risk
Great Ouse Fens
Funding(2.5m scenario,
including maintenance)
Funding required from others (£611m)
Allowance for uncertainty
Flood Risk Management Benefits
Agriculture
Railways
Water Utilities
Power Distribution
Households
Highways
Gas Line
Water Transfer
Natural Land
Isolated Property
Commercial and Industrial Properties £4.3 billion
31,858 households protected from flood risk in the Great Ouse Fens
4,523 commercial and industrial
properties protected against flood risk in the Great Ouse Fens
133,839 ha of agricultural
land protected from flooding
Total Investment needed: £1.3 billion
FCRM GiA (£350m)
Future Fens - Flood Risk
South Level
Funding required from others (£811m)
Allowance for uncertainty
3,580 households protected
from flood risk in the South
Level
1,169 commercial and industrial
properties protected against flood risk in the
South Level
53,518 ha of agricultural land at risk of permanent inundation in the
South Level
£4.6 billion
£2.5 billion
£1.6 billion
£935 million
£856 million
£1.1 billion
£103 million
£602 million
£32 million
£474 million
Agriculture
Railways
Water Utilities
Power Distribution
Households
Highways
Gas Line
Water Transfer
Natural Land
Isolated Property
Commercial and Industrial Properties £1.2 billion
£732 million
£1.1 billion
£686 million
£568 million
£248 million
£199 million
£6 million
£602 million
£18 million
£157 million
Infrastructure at risk
• Cambridge to Kings Lynn Railway• A10• A142
Key FRM Infrastructure
• Denver Complex• Ouse Washes• Ely Ouse Flood Protection Scheme
37.5km of roads
52km of railways
Flood Risk Management Benefits
£1.6bnGross Value Added to the local
economy by jobs protected through FRM in the next ten years
£125mOngoing operation and
maintenance costs for assets across South Level in the next
100 years
£1.1bnCapital costs for asset
refurbishment and replacement across South Level in the next
100 years
£5.3bnGross Value Added to the local
economy by jobs protected through FRM in the next ten years
£270mOngoing operation and
maintenance costs for assets across the Great Ouse Fens in
the next 100 years
£1.6bnCapital costs for asset
refurbishment and replacement across the Great Ouse Fens in
the next 100 years
The investment needs reported here are those required to sustain current Standard of Service of flood risk management assets only, and do not account for future improvements in protection.
Figures correct as of December 2020
The investment needs reported here are those required to sustain current Standard of Service of flood risk management assets only, and do not account for future improvements in protection.
Figures correct as of December 2020
Funding(2.5m scenario,
including maintenance)

Future Fens Flood Risk Management - Baseline Report | December 2020
116 117
Total Investment needed: £281 million
FCRM GiA (£468m)
Future Fens - Flood Risk
Middle Level
Funding required from others (£0m)
Allowance for uncertainty
Agriculture
Railways
Water Utilities
Power Distribution
Households
Highways
Gas Line
Commercial and Industrial Properties £2.0 billion
8,761 households protected from flood
risk in the Middle Level
1,681 commercial and industrial properties
protected against flood risk in the Middle Level
56,658 ha of agricultural land at risk of permanent inundation in the
Middle Level
Total Investment needed: £156 million
FCRM GiA (£222m)
Future Fens - Flood Risk
West of Ouse
Funding required from others (£0m)
Allowance for uncertainty
Flood Risk Management Benefits
9,233 households protected from flood
risk in the West of Ouse
1,169 commercial and industrial
properties protected against flood risk in
the South Level
19,431 ha of agricultural
land at risk in the West of
Ouse
£166mGross Value Added to the local
economy by jobs protected through FRM in the next ten years
£36mOngoing operation and
maintenance costs for assets across West of Ouse Fens in the
next 100 years
£120mCapital costs for asset
refurbishment and replacement across West of Ouse Fens in the
next 100 years
£2.3 billion
£947 million
£698 million
£341 million
£359 million
£275 million
£76 million
Agriculture
Households
Highways
Commercial and Industrial Properties £685 million
£1.4 billion
£321 million
£241 million
Infrastructure at risk
• A17• A47
Key FRM Infrastructure
• St Germans Pumping Station• Middle Level Main Drain
11km of roads
Natural Land
Isolated Property
£14 million
£309 million
Infrastructure at risk
• Cambridge to Peterborough Railway• A1(M)• A141
Key FRM Infrastructure
• Middle Level Main Drain• St Germans Pumping Station
37.5km of roads
31km of railways
Water Utilities
Power Distribution
Gas Line
£210 million
£458 million
£16 million
Isolated Property £0.8 million
Flood Risk Management Benefits
£3.5bnGross Value Added to the local
economy by jobs protected through FRM in the next ten years
£78mOngoing operation and
maintenance costs for assets across Middle Level in the next
100 years
£203mCapital costs for asset
refurbishment and replacement across Middle Level in the next
100 years
The investment needs reported here are those required to sustain current Standard of Service of flood risk management assets only, and do not account for future improvements in protection.
Figures correct as of December 2020
The investment needs reported here are those required to sustain current Standard of Service of flood risk management assets only, and do not account for future improvements in protection.
Figures correct as of December 2020
Funding(2.5m scenario,
including maintenance)
Funding(2.5m scenario,
including maintenance)

Future Fens Flood Risk Management - Baseline Report | December 2020
118 119
Flood Risk Management Benefits
Total Investment needed: £47 million
FCRM GiA (£33m)
Future Fens - Flood Risk
East of Ouse
Funding required from others (£8m)
Allowance for uncertainty
Agriculture
Railways
Water Utilities
Power Distribution
Households
Highways
Gas Line
Commercial and Industrial Properties £253 million
737 households protected from flood
risk in the East of Ouse
223 commercial and industrial properties protected against flood risk in the East of Ouse
3,608 ha of agricultural land at
risk in the South Level
Total Investment needed: £97 million
FCRM GiA (£42m)
Future Fens - Flood Risk
King’s Lynn
Funding required from others (£49m)
Allowance for uncertainty
8,344 households
protected from flood risk in King’s Lynn
827 business protected against flood risk in
King’s Lynn
Up to 400,000 households supplied
with power generated in King’s Lynn
£138 million
£51 million
£8 million
£26 million
£32 million
£11 million
£4 million
Infrastructure at risk
• A47• A149
Key FRM Infrastructure
• Great Ouse Tidal River
1km
Infrastructure at risk
• Cambridge to Kings Lynn Railway• A10• A47
Key FRM Infrastructure
• River Nar• Great Ouse Tidal River
0.4km
3km
Isolated Property £7 million
Agriculture
Railways
Water Utilities
Power Distribution
Households
Highways
Gas Line
Commercial and Industrial Properties £93 million
£40 million
£6 million
£14 million
£0.1 million
£7 million
£162 million
£0.6 million
Flood Risk Management Benefits
2,704Jobs protected through FRM in
the next fifteen years
£12mOngoing operation and
maintenance costs for assets across King’s Lynn in the next
100 years
£85mCapital costs for asset
refurbishment and replacement across King’s Lynn in the next
100 years
£15mGross Value Added to the local
economy by jobs protected through FRM in the next ten years
£19mOngoing operation and
maintenance costs for assets across East of Ouse in the next
100 years
£28mCapital costs for asset
refurbishment and replacement across East of Ouse in the next
100 years
The investment needs reported here are those required to sustain current Standard of Service of flood risk management assets only, and do not account for future improvements in protection.
Figures correct as of December 2020
The investment needs reported here are those required to sustain current Standard of Service of flood risk management assets only, and do not account for future improvements in protection.
Figures correct as of December 2020
Funding(2.5m scenario,
including maintenance)
Funding(2.5m scenario,
including maintenance)

Future Fens Flood Risk Management - Baseline Report | December 2020
120 121
4.1. Stakeholders
4.0 Stakeholders and Beneficiary Mapping
The infrastructure complexity, flood and coastal risk and water resources needs all have interdependencies and all need to be considered within a variety of future climate and growth scenarios. An adaptive approach is needed to manage this catchment to balance the needs of people, the environment and agriculture, to ensure we create the right legacy for the next 100 years. This approach will identify which decisions need to be taken now and which will need to be taken in the future. This could include a variety of long-term agreements between farmers, land managers and supermarkets about the future of the Great Ouse Fens and the contribution that investment in flood risk management could play in sustaining agriculture and future growth.
4.2. Beneficiaries MappingMaps have been created for the entire study area and each of the sub catchments individually in order to illustrate where the main beneficiaries of FRM lie. The maps show major organisations, public bodies and authorities, as well as businesses which are estimated to employ more than 250 people.
The key urban areas benefiting from FRM are also shown along with the number of households benefitting within each.
It should be noted that the maps show direct beneficiaries only and not indirect beneficiaries, of which there are many both within and beyond the study area.
New Mill New Pumps
Great Fen Project Board
The South Level sub-catchment

Future Fens Flood Risk Management - Baseline Report | December 2020
122 123
The Middle Level sub-catchmentThe Kings Lynn sub-catchment

Future Fens Flood Risk Management - Baseline Report | December 2020
124 125
West of Ouse sub-catchment East of Ouse sub-catchment

Future Fens Flood Risk Management - Baseline Report | December 2020
126 127
5.0 Conclusions
This report has been completed with significant input and involvement by the Technical Group members. It now means we have a shared understanding of all the land drainage and flood risk management assets, the economics supporting those assets and the wider land uses, the costs associated with maintaining and operating those assets, the FCERM GiA eligibility, and the partnership funding challenge for all sources of flooding in the Great Ouse Fens.
Prior to this report there were multiple studies, surveys, policies, plans and initiatives which covered a range of flood risk information. The information was held by different stakeholders, had conflicting and sometimes outdated data and overlapped in different areas.
A summary of the conclusions for the Fens Baseline Report are:
The Great Ouse Fens relies on an inter dependant and complex system of flood risk and drainage assets with 138 pumping stations, 24 sets of sluice gates, 95km of coastal defences, and 405km of fluvial embankments. Much of this infrastructure is nearing the end of its design life and will soon require significant investment to continue providing flood protection into the future.
• In the Do Nothing Scenario in the Great Ouse Fens there are 17,149 households and 2,979 non-residential properties protected from permanent flood inundation, and 24,895 households and 3,733 non-residential properties at risk of flooding from Rivers and the Sea across the Great Ouse Fens;
• There is also a total of 134,000 ha of high-grade agricultural land at risk of permanent flooding, and 158,000 ha of agricultural land at risk of flooding from Rivers and the Sea.
The Great Ouse Fens also has many kilometres of roads and railways, along with critical infrastructure for electricity and gas distribution, water mains and sewer pipes, and a major water transfer system which are at risk of permanent flooding in the Do Nothing scenario.
There are a number of internationally important, legally designated and environmentally sensitive nature reserves across the Great Ouse Fens which have substantial ecological, recreational and flood protection benefits amongst other things, and are at risk of permanent flooding and loss.
Alongside the direct damages, there are many indirect damages resulting from flood risk including isolation of properties;
• The benefit of flood risk management across the Great Ouse Fens amounts to many billions of pounds. Benefits are estimated at £17.1 billion in the 2.5m Do Nothing scenario, which is the highest level tested, this is before local benefits are considered;
• Flood risk management across the Great Ouse Fens over the next 100 years will cost in excess of £1.8 billion, accounting for capital works, and operation and maintenance of over 300 assets;
• Partnership Funding contributions of between £611milion and £946million are likely to be required over the next 100 years. Phase 2 of the programme will draw on the work of Phase 1 to develop and model different flood risk management options, and look at climate change in more detail.
• The Middle Level sub catchment has a raw PF score in excess of 100% in all scenarios;
• The West of Ouse has a raw PF score in excess of 100% in the 2.5m AOD scenario but below 100% in 1.42m and 2m AOD scenarios;
• The South Level catchment has a relatively low Benefit Cost Ratio (BCR) across all three scenario levels. This is due to the high cost associated with assets in the area, which make up a significant proportion of the total asset costs across the Great Ouse Fens.
• South Level and East of Ouse catchments require significant contributions in all three Do Nothing scenarios 1.42m, 2m, and 2.5m;
• The benefits of flood risk management outweigh the costs in all Do Nothing scenarios for all sub catchments except King’s Lynn where the benefits only outweigh costs in the scenario where an equilibrium level of 2.5m AOD is achieved in Do Nothing. It is recognised that a vast majority of the cost within King’s Lynn relates to the Environment Agency’s tidal river assets, which protect large swathes of land in the King’s Lynn sub catchment and beyond from coastal flooding. However, the appraisal of benefits in this Phase of the project does not account for coastal flooding or breach analysis of these assets, and therefore the whole benefits are not truly captured.
• King’s Lynn attracts no FCRM GiA in 1.42m and 2m AOD scenarios but has a raw score of 43% in the 2.5m AOD scenario; however, sensitivity testing of costs in the King’s Lynn catchment shows significant increases in economic viability and affordability for the 2m and 2,5m AOD scenarios where Tidal River asset costs are removed;
• The BCR for King’s Lynn remains below 1 for both the 1.42m and 2m scenarios. This is because the majority of benefits within the King’s Lynn catchment are from receptors above 2m AOD and they are therefore are not impacted until we consider the 2.5m AOD scenario.
Flood and land drainage infrastructure in the Fens is not only crucial in enabling surrounding agricultural land, businesses and communities to prosper, it also plays a crucial role as enabling infrastructure within the wider Great Ouse catchment. The catchment faces some of the most ambitious housing and transport infrastructure growth plans in the country over the next 30-years.
The infrastructure complexity, flood and coastal risk and water resources needs all have interdependencies and all need to be considered within a variety of future climate and growth scenarios. An adaptive approach is needed to manage this catchment to balance the needs of people, the environment and agriculture, to ensure we create the right legacy for the next 100 years. This approach will identify which decisions need to be taken now and which will need to be taken in the future.
Delivering this will require a partnership approach because innovative, co-ordinated and sustainable solutions will only come from a willingness to co-operate and from active partnership between risk management authorities, private landowners, businesses, planning authorities and communities effective. These long term management choices in the Fens need to be developed in partnership across a large number of bodies and interests.

Future Fens Flood Risk Management - Baseline Report | December 2020
128 129
6.0 Glossary
Accretion Process by which particles carried by the flow of water or by the wind are deposited and accumulate (opposite is erosion).
Annual Exceedance The probability associated with a return period (T), Probability (AEP) e.g. event of return period 100 years has an AEP of 1/T or 0.01 or 1%.
Asset In flood defence, any man-made or natural feature – such as a raised defence, retaining structure, channel, pumping station or culvert – that performs a flood defence or land drainage function. Includes components owned by the Environment Agency or another body, whether or not flood defence is the primary function or is incidental to some other purpose, and components which may be detrimental to flood defence objectives.
Asset Management Systematic and coordinated activities through which an organisation manages its assets and asset systems for the purpose of achieving its strategic aims. This includes the performance of the assets and the associated risks and expenditures throughout their lifecycles and carries an implication that the management is undertaken in an optimal and sustainable manner.
Benefit This is a monetary value (or cost) which represents the advantage to the economy of one option over another.
Benefit Cost Ratio BCRs are used to identify the relative worth of one (BCR) approach over another. It is the ratio of the PV benefits to the PV costs for each option.
Conveyance For a channel, function of the flow area, shape and roughness of a channel, which can be used as a constant in a formula relating discharge capacity to channel gradient.
Crest Top surface of a weir or other control structure over which water passes, highest part of flood bank.
Damage This is a monetary value (or cost) assigned to an impact from flooding – it is calculated based on the negative impact to the economy.
Desilting Removal of accumulated sediment from the bed of a channel, generally as a maintenance activity. Also referred to as dredging, although this term is more commonly reserved for major works rather than routine maintenance.
Discharge The volume of water that passes through a channel cross section in unit time, normally expressed at cubic metres per second (m3/s) in fluvial design (often more simply referred to as ‘flow’).
Embankment An artificial, usually earthen, structure, constructed to prevent or control flooding, or for various other purposes including carrying roads and railways.
Erosion Process by which particles are removed by the action of wind, flowing water or waves (opposite is accretion).
Flood and Coastal Defra guidance to Risk Management Authorities on the Erosion Risk process for appraising flood and coastal defence projects Management Appraisal to ensure best use of public money. Guidance (FCERM-AG)
Flood and Coastal Government money allocated to Risk Management Risk Management Authorities (Environment Agency, Local Authorities, Grant in Aid Internal Drainage Boards) for capital works which manage (FCRM-GiA) and reduce flood and coastal erosion risk.
Flood Bank Flood embankment.
Flood Defence Asset Any structure with the prime purpose to provide flood defence, e.g. culvert.
Fluvial Relating to the flow in the river that originates from the upstream catchment and not the sea.
Flood Risk Flood risk management aims to reduce the likelihood and/ Management (FRM) or the impact of floods. Experience has shown that the most effective approach is through the development of flood risk management programmes incorporating the following elements:
Prevention Preventing damage caused by floods by avoiding construction of houses and industries in present and future flood-prone areas; by adapting future developments to the risk of flooding; and by promoting appropriate land-use, agricultural and forestry practices
Protection Taking measures, both structural and non-structural, to reduce the likelihood of floods and/or the impact of floods in a specific location;
Preparedness Informing the population about flood risks and what to do in the event of a flood
Emergency Developing emergency response plans in the case of a response flood
Recovery and Returning to normal conditions as soon as possible and lessons learned mitigating both the social and economic impacts on the affected population.
Floodplain Area of land bordering a river which is partly or wholly covered with water during floods.
Floodwall Wall, of any form of construction, built to prevent or control the extent of flooding.
High Level Water A river/ watercourse whose bed level lies above the level Carrier of the surrounding floodplain; an embanked channel where the water level in it is higher than the land through which it flows.
Incremental Benefit Ratio of the additional benefit/cost for two options. Cost Ratio (IBCR)
Infrequent flooding This term has been used to describe flooding represented by the RoFRS dataset – whilst it is recognised that it is not possible to predict when flooding will occur and therefore it is impossible to say whether flooding will be infrequent, this term has been used to differentiate this type of flood risk from that represented in the Do Nothing scenario where flooding is considered to be permanent.
Inspecting Engineer An inspecting engineer is appointed to inspect a reservoir every 10 years. As a result of that inspection, a safe operating regime will be specified and works required ‘in the interests of safety’ may be recommended.

Future Fens Flood Risk Management - Baseline Report | December 2020
130 131
Lead Local Flood After flooding in 2007 the government commissioned Authority a review, which recommended that “Local authorities should lead on the management of local flood risk, with the support of the relevant organisations (The Pitt Review, 2008). This led to the Flood and Water Management Act (2010) and the set-up of Lead Local Flood Authorities (LLFA) who have new powers and duties for managing flooding from local sources, namely Ordinary Watercourses, surface water (overland runoff) and groundwater.
Main river Main rivers are usually larger rivers and streams. Other rivers are called ‘ordinary watercourses’. The Environment Agency carries out maintenance, improvement or construction work on main rivers to manage flood risk. Environment Agency powers to carry out flood defence work apply to main rivers only. Lead local flood authorities, district councils and internal drainage boards carry out flood risk management work on Ordinary Watercourses. The Environment Agency decides which watercourses are main rivers. It consults with other risk management authorities and the public before making these decisions.
Maintain Active intervention to keep defences at their current level of protection.
Multi-coloured Provides techniques and data that can be used in benefit Manual (MCM) assessments.
Ordnance Datum The height of mean sea-level, taken from a reference point at Newlyn in Cornwall.
Outfall Structure through which water is discharged into a channel or other body of water.
Overtopping The passage of water over a component such as a flood bank or seawall, due to high water levels or wave action Overtopping does not necessarily represent ‘failure’ of a flood defence to perform its function.
Present Value (PV) Monetary value of ongoing or future costs, discounted to provide equivalent present day costs.
Property Flood Measures installed at individual properties including Resilience households to provide resilience against flooding. Includes flood board, air brick covers and flood gates.
Ramsar The Convention on Wetlands of International Importance, called the Ramsar Convention, is the intergovernmental treaty that provides the framework for the conservation and wise use of wetlands and their resources.
Resilience In asset management, the ability of an asset or asset system to resist the damaging effect of extreme loading Resilience measures can, for example, help to achieve design standards beyond the standard of protection.
Risk Risk is a combination of the probability that an event will occur and the consequence to receptors associated with that event.
Risk of Flooding from This information shows the likelihood of flooding taking Rivers and Sea into account flood defences which protect people and property
Scour Erosion of the bed or banks of a watercourse by the action of moving water, typically associated with the presence of a feature such as bridge pier or abutment that constricts the flow.
Sediment Material ranging from clay to gravel (or even larger) that is transported in flowing water and that settles or tends to settle in areas where the flow slows down.
Sluice/sluice gate Rectangular gate that moves vertically between guides.
Stakeholder An individual or group with an interest in, or having an influence over, the success of a proposed project or other course of action.
Standard of Protection The design standard, measured by annual exceedance (SoP) probability (AEP), that an existing asset or proposed project provides, based on the current assessment of risk. The SoP changes over time due to climate change impacts and asset deterioration.
Standard of Service The measurable and objective description of an asset such (SoS) as the crest level of a wall or pumping capacity and a minimum condition grade.
Strategy Plan A documented strategy which is developed from a strategic study into a problem and describes the course of action which has been determined to implement the preferred option.
Supervising Engineer A supervising engineer is required to supervise the operation and maintenance of the reservoir and produce an annual statement. A supervising engineer must be available at all times (unless the reservoir is under construction). They can also recommend that an inspecting engineer carry out an inspections.
Sustainability The concept of development that meets the needs of the present without compromising the ability of future generations to meet their own needs.
System Asset Long-term investment plan for a flood defence system Management Plan that identifies the investment needed and the benefits (SAMP) provided.
Uncertainty Lack of precision that is due to (i) natural variability and (ii) knowledge uncertainty arises principally from lack of knowledge or of our ability to measure or to calculate, which give rise to potential differences between the assessment of some factor and its ‘true’ value.
Upfront Costs All costs to build the scheme excluding maintenance.
Washland Low land adjacent to a river or other channel used for the temporary storage of flood water, often developed for that use by the erection of bunds and control structures.
Watercourse Defined natural or man-made channel for the conveyance of drainage flows.
Weir Structure over which water may flow, used to control the upstream water level in a channel or other body of water, and/or to measure the discharge.
Wetland Transitional habitat between dry land and deep water Wetlands include marshes, swamps, peatlands (including bogs and fens), flood meadows, river and stream margins.

Future Fens Flood Risk Management - Baseline Report | December 2020
132 133
7.0 References
Great Ouse Tidal River Baseline Report, Environment Agency, 2017
Flood and Coastal Erosion Risk Management appraisal guidance, Environment Agency, 2010
Ouse Washes: The Heart of the Fens; https://ousewasheslps.wordpress.com/2014/02/07/flooding-in-the-fens-1947-floods/
East Anglia Film Archive; www.eafa.org.uk/catalogue/1174
Fenland District Council Strategic Flood Risk Assessment, Scott Wilson, 2011
Middle Level Commissioners Booklet, Middle Level Commissioners, 2013
St Germans New Pumping Station, Middle Level Commissioners, 2012
Why Farming Matters in the Fens, National Farmers Union, 2019
An introduction to Internal Drainage Boards, ada, 2017
Flood and coastal risk projects, schemes and strategies: climate change allowances, Environment Agency, 2020; www.gov.uk/guidance/flood-and-coastal-risk-projects-schemes-and-strategies-climate-change-allowances#peak-rainfall-intensity-allowances
Appendices
Appendix A. Economic Appraisal Report
Appendix B. Literature Review
Appendix C. Gauging Station Review Report
Appendix D. Survey Review Report

Future Fens Flood Risk Management - Baseline Report | December 2020
Getting in contact
We are keen to answer your questions on the Future Fens. If you require any further information you can email us at: