Embed Size (px)
Citation preview

Guidance for Flood Risk Analysis and Mapping
Flood Risk Map
May 2016
This Document is Superseded. For Reference Only.

Flood Risk Map May 2016 Guidance Document 9 Page i
Requirements for the Federal Emergency Management Agency (FEMA) Risk Mapping, Assessment, and Planning (Risk MAP) Program are specified separately by statute, regulation, or FEMA policy (primarily the Standards for Flood Risk Analysis and Mapping). This document provides guidance to support the requirements and recommends approaches for effective and efficient implementation. Alternate approaches that comply with all requirements are acceptable.
For more information, please visit the FEMA Guidelines and Standards for Flood Risk Analysis and Mapping webpage (www.fema.gov/guidelines-and-standards-flood-risk-analysis-and-mapping). Copies of the Standards for Flood Risk Analysis and Mapping policy, related guidance, technical references, and other information about the guidelines and standards development process are all available here. You can also search directly by document title at www.fema.gov/library.
This Document is Superseded. For Reference Only.

Flood Risk Map May 2016 Guidance Document 9 Page ii
Document History
Affected Section or Subsection Date Description
First Publication May 2014
Initial version of new transformed guidance. The content was derived from the Guidelines and Specifications for Flood Hazard Mapping Partners, Procedure Memoranda, and/or Operating Guidance documents. It has been reorganized and is being published separately from the standards.
Multiple May 2016
Changed language referencing the composite risk assessment results to be more in line with Flood Risk Assessment dataset terminology changes being implemented as part of the May 2016 update.
This Document is Superseded. For Reference Only.

Flood Risk Map May 2016 Guidance Document 9 Page iii
Table of Contents 1.0 Overview ............................................................................................................................ 1
2.0 Map Graphics and Layout .................................................................................................. 1
2.1 Page Size ....................................................................................................................... 1
2.2 Map Layout and Dimensions .......................................................................................... 3
2.3 Map Title ......................................................................................................................... 5
2.4 Legend (Map Symbology) .............................................................................................. 5
2.5 Project Locator Diagram ................................................................................................. 6
2.6 Title Block ....................................................................................................................... 8
2.7 Scale and North Arrow ................................................................................................. 11
2.8 Page Content ................................................................................................................ 12
3.0 Map Features ................................................................................................................... 13
3.1 Base Data ..................................................................................................................... 14
3.2 Flood Hazard Data ....................................................................................................... 18
3.3 Flood Risk Data ............................................................................................................ 20
3.4 Areas of Mitigation Interest ........................................................................................... 21
3.5 Callouts ......................................................................................................................... 23
4.0 FRM Variations for Coastal Areas .................................................................................... 27
5.0 FRM Variations for Dams ................................................................................................. 29
6.0 FRM Variations for Levees ............................................................................................... 31
7.0 Uses in Outreach, Collaboration, and Flood Risk Communication .................................. 34
List of Figures Figure 1: Example of a Flood Risk Map Developed at the Watershed Level ................................ 2
Figure 2: Map Dimensions (Portrait) ............................................................................................. 4
Figure 3: Map Dimensions (Landscape) ....................................................................................... 5
Figure 4: Map Legend Example .................................................................................................... 6
Figure 5: Locator Diagram Example ............................................................................................. 6
Figure 6: Flood Risk Legend Examples for Census-Block (left) and Site-Specific (right) Data ... 21
Figure 7: Example of an AoMI Callout ........................................................................................ 24
Figure 8: Callout Box and Leader Placement Guidance ............................................................. 25
This Document is Superseded. For Reference Only.

Flood Risk Map May 2016 Guidance Document 9 Page iv
Figure 9: Example of a Flood Risk Map Developed for Coastal Areas ....................................... 28
Figure 10: Inundation Scenario Legend Example ....................................................................... 29
Figure 11: Project Locator Inset Example for Dams ................................................................... 29
Figure 12: Example of a Flood Risk Map Developed for Dams .................................................. 30
Figure 13: Levee Freeboard Legend Example ........................................................................... 31
Figure 14: Levee Areas of Mitigation Interest Legend Example ................................................. 31
Figure 15: Project Locator Inset Example for Levees ................................................................. 32
Figure 16: Example of a Flood Risk Map Developed for Levees ................................................ 33
List of Tables Table 1: Recommended Project Locator Fonts and Symbology ................................................... 7
Table 2: Recommended Title Block Fonts, Notes, and Symbology .............................................. 9
Table 3: Recommended North Arrow and Scale Symbology ...................................................... 11
Table 4: Overprinting Hierarchy .................................................................................................. 12
Table 5: Recommended Base Data Fonts and Symbology ........................................................ 16
Table 6: Recommended Flood Hazard Data Fonts and Symbology ........................................... 19
Table 7: Recommended Areas of Mitigation Interest Symbology ............................................... 22
Table 8: Recommendations for Callout Fonts and Symbology ................................................... 26
Table 9: Recommended Symbology for Coastal-Specific Legend Features .............................. 27
This Document is Superseded. For Reference Only.
Flood Risk Map May 2016 Guidance Document 9 Page 1
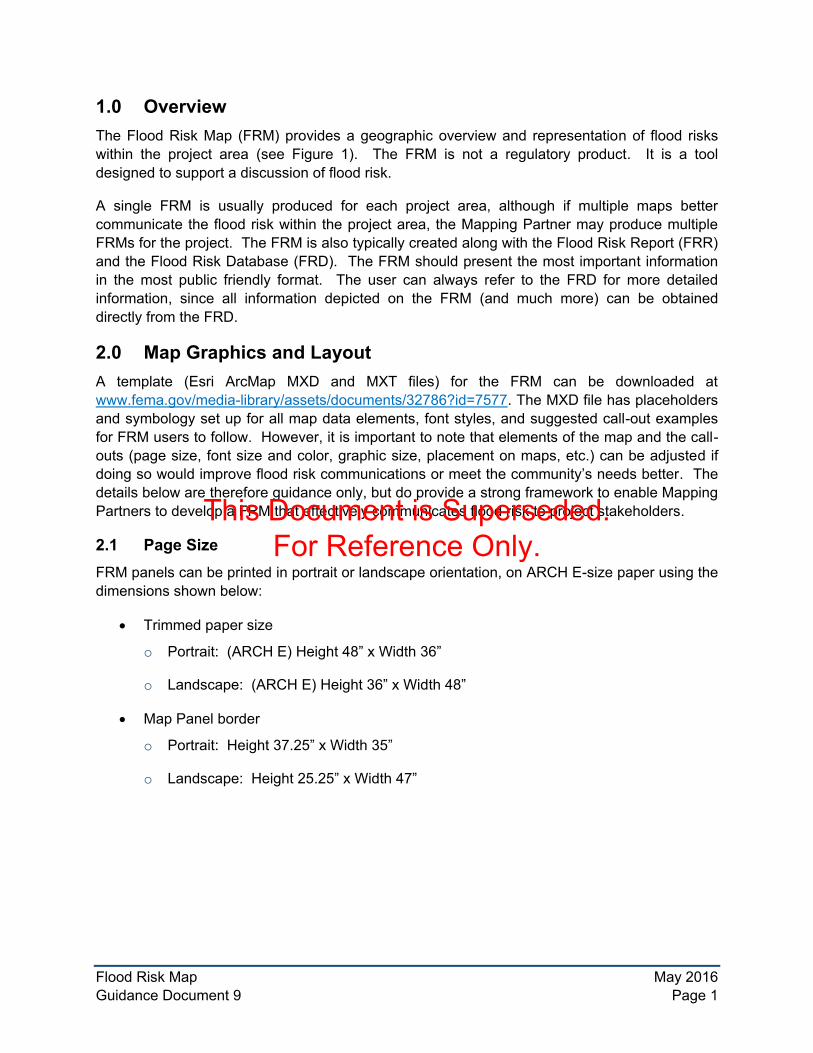
1.0 Overview The Flood Risk Map (FRM) provides a geographic overview and representation of flood risks within the project area (see Figure 1). The FRM is not a regulatory product. It is a tool designed to support a discussion of flood risk.
A single FRM is usually produced for each project area, although if multiple maps better communicate the flood risk within the project area, the Mapping Partner may produce multiple FRMs for the project. The FRM is also typically created along with the Flood Risk Report (FRR) and the Flood Risk Database (FRD). The FRM should present the most important information in the most public friendly format. The user can always refer to the FRD for more detailed information, since all information depicted on the FRM (and much more) can be obtained directly from the FRD.
2.0 Map Graphics and Layout A template (Esri ArcMap MXD and MXT files) for the FRM can be downloaded at www.fema.gov/media-library/assets/documents/32786?id=7577. The MXD file has placeholders and symbology set up for all map data elements, font styles, and suggested call-out examples for FRM users to follow. However, it is important to note that elements of the map and the call-outs (page size, font size and color, graphic size, placement on maps, etc.) can be adjusted if doing so would improve flood risk communications or meet the community’s needs better. The details below are therefore guidance only, but do provide a strong framework to enable Mapping Partners to develop a FRM that effectively communicates flood risk to project stakeholders.
2.1 Page Size FRM panels can be printed in portrait or landscape orientation, on ARCH E-size paper using the dimensions shown below:
Trimmed paper size
o Portrait: (ARCH E) Height 48” x Width 36”
o Landscape: (ARCH E) Height 36” x Width 48”
Map Panel border
o Portrait: Height 37.25” x Width 35”
o Landscape: Height 25.25” x Width 47”
This Document is Superseded. For Reference Only.
Flood Risk Map May 2016 Guidance Document 9 Page 2
Figure 1: Example of a Flood Risk Map Developed at the Watershed Level
This Document is Superseded. For Reference Only.

Flood Risk Map May 2016 Guidance Document 9 Page 3
2.2 Map Layout and Dimensions The FRM panel should have dimensions that make the map readable. A Portrait or Landscape layout will be chosen by the Mapping Partner to best fit the project area based on the polygon in S_FRD_Proj_Ar. It is recommended that the map panel frame outline be 1 Pt. with a color of black (Red, Green, Blue – RGB: 0,0,0). Suggested layout dimensions are depicted in Figure 2 and Figure 3, and are also listed below.
North Arrow, Scale border
o Height 4” x Width 1.5”
Legend
o Portrait: Height 7” x Width 19.5”
o Landscape: Height 7” x Width 31.5”
Project Locator
o Portrait: Height 7” x Width 6”
o Landscape: Height 7” x Width 6”
Title Block, FEMA Logo border
o Portrait: Height 7” x Width 7.5”
o Landscape: Height 7” x Width 7.5”
FEMA Logo
Portrait: Height 2.25” x Width 6.3”
Landscape: Height 2.25” x Width 6.3”
This Document is Superseded. For Reference Only.

Flood Risk Map May 2016 Guidance Document 9 Page 4
Figure 2: Map Dimensions (Portrait)
This Document is Superseded. For Reference Only.

Flood Risk Map May 2016 Guidance Document 9 Page 5
Figure 3: Map Dimensions (Landscape)
2.3 Map Title The title on the map should be the name of the project area and should match the FRR and the data in the PROJ_NM field in the S_FRD_Proj_Ar feature class of the FRD. As depicted on the FRM, it is recommended that the first part of the map title be Arial, Bold, 82 pt., aligned center with a color of black (RGB: 0,0,0). For the second part of the map title (the watershed or project name) it is recommended that it be Arial, Bold, Italic, 82 pt., aligned center with a color of black (RGB: 0,0,0). Alternate fonts that emulate these recommendations may also be used.
2.4 Legend (Map Symbology) The map legend should contain those items that are needed to assist the map user in interpreting map symbols, base data, flood hazard data, flood risk, and Areas of Mitigation Interest (AoMIs) (see Figure 4). It is recommended that the legend title be Franklin Gothic Medium, 28 pt., aligned left with a color of black (RGB: 0,0,0). It is recommended that the legend category title be Franklin Gothic Medium, 24 pt., aligned center or left with a color of black (RGB: 0,0,0). It is recommended that the legend item label be Franklin Gothic Medium, 18 pt., aligned left with a color of black (RGB: 0,0,0). Alternate fonts that emulate these recommendations may also be used.
This Document is Superseded. For Reference Only.

Flood Risk Map May 2016 Guidance Document 9 Page 6
Figure 4: Map Legend Example
2.5 Project Locator Diagram The project locator serves as a reference to orient the map user as to where the project area exists in relation to other known locations, (e.g., adjacent watersheds or counties). The following guidance applies to the preparation of the project locator diagram (Figure 5):
The diagram size may vary with the size of the watershed or project area and the space constraints of the diagram.
The diagram should center on the project area and should show adjacent county or watershed boundaries significant to the project area.
Visible states and significant bodies of water should also be labeled.
The diagram should have the mapped Project Area highlighted.
North orientation should be consistent with the Project Locator and the Map Panel.
Figure 5: Locator Diagram Example
This Document is Superseded. For Reference Only.
Flood Risk Map May 2016 Guidance Document 9 Page 7
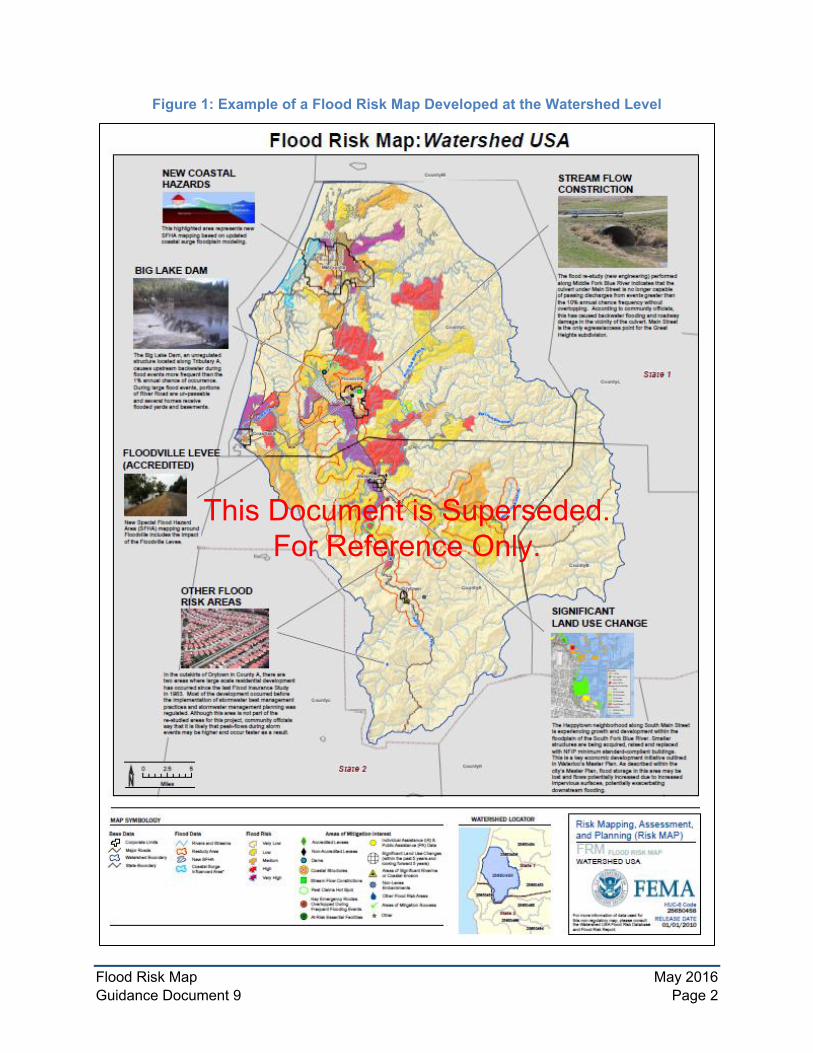
If applicable, the watersheds immediately adjacent (share a border) to the studied watershed should be numbered using their eight-digit Hydrologic Unit Code (HUC-8). If the study is not a sub-basin study (i.e., county-based, Coastal-only Project, Physical Map Revision (PMR), or projects consisting of a single or potentially multiple Levees or Dams), adjacent counties are suggested to be shown and labeled.
Recommended fonts and symbology are described in Table 1.
Table 1: Recommended Project Locator Fonts and Symbology
Example Feature Recommendation*
[Hatch Pattern] (RGB Values)
PROJECT LOCATOR
Title 28 Pt., Franklin Gothic Medium, Aligned center, Black (0, 0, 0), CAPS
12345678 Project Area or Watershed Label
12-22 Pt., Arial Bold, Aligned center, Blue(0, 77, 168), 2 Pt. White Halo
12345678 Adjacent Watershed or County Label
10-14 Pt., Arial Bold, Italic, Aligned center,Black (0, 0, 0), 2 Pt. White Halo
State State Label 12-22 Pt., Arial Bold, Italic, Aligned center,Brown (115, 0, 0), 2 Pt. White Halo, CLC
Lake Erie Major Body of Water 10-14 Pt., Arial, Italic, Aligned center.,Blue (0, 92, 230), CLC
Project Area Grey (225, 225, 225) Outline, Line weight 3 Pt., Grey (104, 104, 104)
State
Yellow (255, 255, 173) Top Line, Line weight 2 Pt., Brown (115, 0, 0), Dashing [6pt- 4pt- 2pt- 4pt- 2pt- 4pt] Outline, Line weight 3 Pt., Grey (170, 170, 170) 50 percent Transparency
Surrounding Watersheds or Counties
Outline, Line weight 3 Pt., Grey (204, 204, 204)
This Document is Superseded. For Reference Only.

Flood Risk Map May 2016 Guidance Document 9 Page 8
Example Feature Recommendation*
[Hatch Pattern] (RGB Values)
Major Body of Water Blue (190, 232, 255) Outline, Line weight 0.4 Pt., Blue (0, 197, 255)
Leader line Line weight 2.0 Pt, Black
Note: * Alternate fonts that emulate these recommendations may also be used
2.6 Title Block Every FRM should contain a title block that contains the name of the project area (and HUC-8 code if applicable), and the release date. The project area name should match the FRR and the data in the field PROJ_NM in the S_FRD_Proj_Ar feature class. The HUC-8 code can go after the project name if the study is watershed based. The HUC-8 code can be found in the HUC8_CODE field in the S_FRD_Proj_Ar feature class. Table 2 provides recommendations for the title block features.
This Document is Superseded. For Reference Only.

Flood Risk Map May 2016 Guidance Document 9 Page 9
Table 2: Recommended Title Block Fonts, Notes, and Symbology
Example Feature Recommendation*
[Hatch Pattern] (RGB Values)
Title Block Neatline 3 Pt. Black (0,0,0)
Risk Mapping, Assessment, and Planning (Risk MAP)
Risk MAP Header 40 Pt. Franklin Gothic Medium Cond, Blue (0, 82, 171), Aligned Left
Dividing Line 3 Pt. Black (0,0,0) Horizontal Line, 6.9” Wide
FRM FLOODRISK MAP
FRM Header
56 Pt. Franklin Gothic Medium, (168, 194, 194), Aligned Left, CAPS 30 Pt. Franklin Gothic Medium, Grey (168, 194, 194) , Aligned Left, CAPS
This Document is Superseded. For Reference Only.

Flood Risk Map May 2016 Guidance Document 9 Page 10
Example Feature Recommendation*
[Hatch Pattern] (RGB Values)
Place t
Department of Homeland Security Seal
his seal on the right side of the title block
Width: 6.3” Height: 2.25”
PROJECT NAME, HUC-8 Code
Project Name text (HUC-8 Code if applicable). Place this text below FRM Header.
28 Pt. Arial, Aligned Left, Black CAPS
RELEASE DATE 12/31/9999
Release date text. Place this text in the bottom right corner of the title block.
24 Pt. Franklin Gothic Medium Cond, Blue (0,82,171), Aligned Right, CAPS 26 Pt. Franklin Gothic Medium, Black, Aligned Right, CAPS
For more information on the data used for this map, please consult the Project Name Flood Risk Database and Flood Risk Report.
This note identifies that the Flood Risk Map corresponds to data in the Flood Risk Database and the Flood risk report. Replace “Watershed” text with the name of the watershed or project area studied. Place this note in the bottom left corner of the title block.
16 Pt. Arial, Aligned Left, Black
Note: * Alternate fonts that emulate these recommendations may also be used
This Document is Superseded. For Reference Only.

Flood Risk Map May 2016 Guidance Document 9 Page 11
2.7 Scale and North Arrow The extent of the FRM is to be determined by the Mapping Partner. The initial extent is generally based on the project area (S_FRD_Proj_Ar) but may be adjusted to allow room for supporting data or extra room within the layout for callout boxes, and can be scaled to fit appropriately. The map should also have a north arrow, a scale bar, and scale text. Table 3 gives a list of recommendations for the north arrow and scale features.
Table 3: Recommended North Arrow and Scale Symbology
Example Feature Recommendation*
[Hatch Pattern] (RGB Values)
North arrow; can be ESRI standardor equivalent Place to the left of scale bar.
Line weight 0.72 Pt. Width 0.2219” Height 0.9819” Black
Top and Bottom line 3 Pt. Black (0,0,0) Horizontal Line 4” Wide
0 2.5 5
Miles
The FRM scale bar includes references to miles. Note that this scale bar is not shown to actual size; can be ESRI standard or equivalent. Place within Map Panel frame in the bottom left, center or right. Mapping Partner should make the scale bar length equal to a whole number, and the dividers set at half or thirds of the entire scale bar length.
Line weight 1.0 Pt. (Scale Bar [Miles]) Length: 5”, Black (Scale Bar Labels) 22 Pt. Arial, Black CAPS
Note: * Alternate fonts that emulate these recommendations may also be used
This Document is Superseded. For Reference Only.
Flood Risk Map May 2016 Guidance Document 9 Page 12
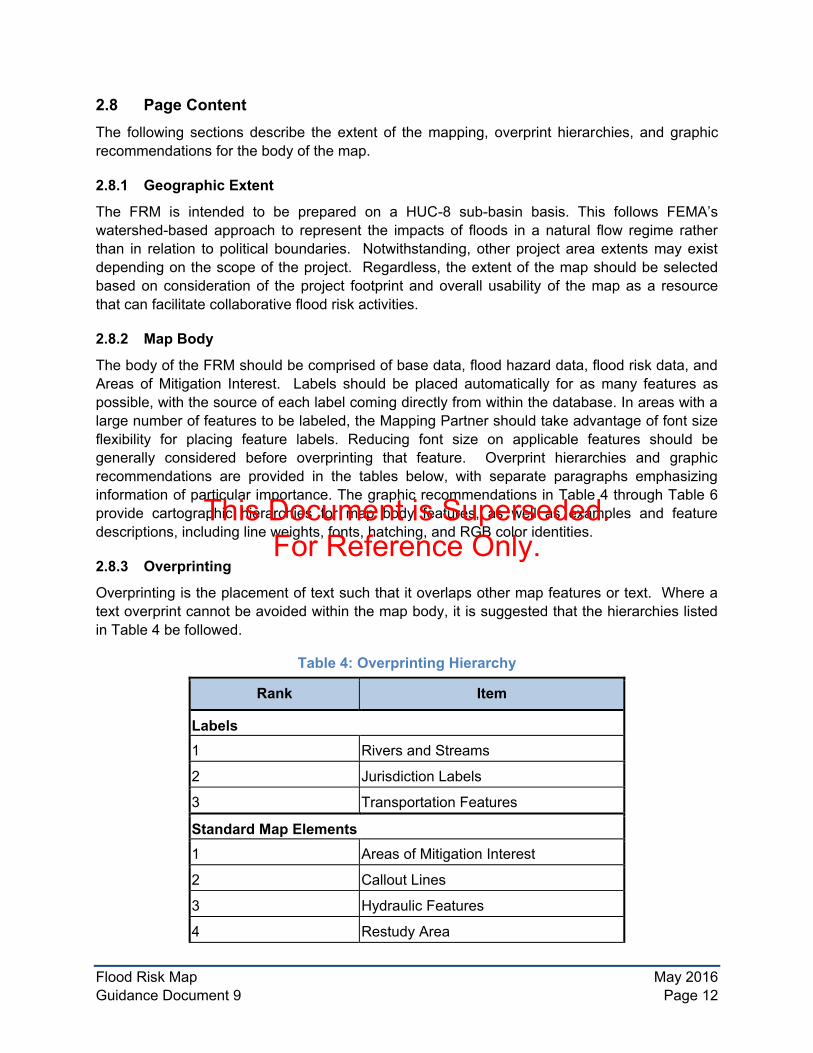
2.8 Page Content The following sections describe the extent of the mapping, overprint hierarchies, and graphic recommendations for the body of the map.
2.8.1 Geographic Extent
The FRM is intended to be prepared on a HUC-8 sub-basin basis. This follows FEMA’s watershed-based approach to represent the impacts of floods in a natural flow regime rather than in relation to political boundaries. Notwithstanding, other project area extents may exist depending on the scope of the project. Regardless, the extent of the map should be selected based on consideration of the project footprint and overall usability of the map as a resource that can facilitate collaborative flood risk activities.
2.8.2 Map Body
The body of the FRM should be comprised of base data, flood hazard data, flood risk data, and Areas of Mitigation Interest. Labels should be placed automatically for as many features as possible, with the source of each label coming directly from within the database. In areas with a large number of features to be labeled, the Mapping Partner should take advantage of font size flexibility for placing feature labels. Reducing font size on applicable features should be generally considered before overprinting that feature. Overprint hierarchies and graphic recommendations are provided in the tables below, with separate paragraphs emphasizing information of particular importance. The graphic recommendations in Table 4 through Table 6 provide cartographic hierarchies for map body features, as well as examples and feature descriptions, including line weights, fonts, hatching, and RGB color identities.
2.8.3 Overprinting
Overprinting is the placement of text such that it overlaps other map features or text. Where a text overprint cannot be avoided within the map body, it is suggested that the hierarchies listed in Table 4 be followed.
Table 4: Overprinting Hierarchy
Rank Item
Labels 1 Rivers and Streams
2 Jurisdiction Labels
3 Transportation Features
Standard Map Elements 1 Areas of Mitigation Interest
2 Callout Lines
3 Hydraulic Features
4 Restudy Area
This Document is Superseded. For Reference Only.

Flood Risk Map May 2016 Guidance Document 9 Page 13
Rank Item
5 New Special Flood Hazard Area (SFHA)
6 HUC-8 Sub-basin Line
7 Coastal Surge Influenced Area
8 Corporate Limits
9 River and Stream Features
10 Lakes and Waterbody Areas
11 Transportation Features
12 Flood Risk Areas
13 HUC-8 Sub-basin Area
14 HUC-10 Watershed Area
15 County Areas
16 Hillshade
Boundaries 1 HUC-8 Sub-basin Boundary
2 Community Boundary
3 County Boundary
4 State Boundary
2.8.4 Hierarchy for Labels and Map Features
Table 4 illustrates the order of priority (rank) of the various items depicted in the map body. These lists should be used as a guideline to resolve overprinting issues for labels and map features. The items are listed in rank from most important to least important. Those items with a lower numbered rank (e.g., 1) may be printed on top of higher numbered rank (e.g., 3) items.
2.8.5 Leader Lines
Labels may be leadered to a feature using a plain leader if space does not permit the label to be within or adjacent to the feature. It is recommended to use a line weight of 1.0 pt, with a color of black (RGB: 0,0,0) for the leader lines.
3.0 Map Features Guidance for specific elements of the FRM (excluding the call-outs, which can be adjusted as needed) is provided in the following sections. Not all map features must be included with every FRM, and only significant map features should be shown on the FRM. Cartographic abstraction is acceptable to fit multiple features into a small geographic area, and the FRM should be designed to show the user the type and extent of data contained within the FRD. A project area mask may also be applied to gray out any data not directly within the project area itself.
This Document is Superseded. For Reference Only.

Flood Risk Map May 2016 Guidance Document 9 Page 14
There are two general categories of map features shown on the FRM: those that are associated with a flood risk dataset (such as Areas of Mitigation Interest, Flood Risk Assessment data, etc.), and those that are used to simply provide a cartographic enhancement or background to the FRM (such as political areas, roads, study areas, etc.) For the latter category, regardless of the data source, all of these features should be stored within the S_Carto_Pt, S_Carto_Ln, or S_Carto_Ar layers of the Flood Risk Database, as this allows the database to be used to generate the Flood Risk Map. The S_Carto layers of the FRD were designed to be flexible enough to allow the user to expand the feature class through the use of user-defined features, which may help to enhance the communication capability of the FRM. The S_Carto layers do not need to be clipped by the S_FRD_Proj_Ar polygon.
3.1 Base Data Base data that can be shown on the FRM includes political boundary features, planimetric data such as transportation features, hydraulic structures, and watershed boundaries. There are a variety of base map data sources that are acceptable to use for these layers. The locations of features in the base map data files are used “as is”, and thus, Flood Insurance Rate Map (FIRM) base map accuracy requirements do not apply. Base map features from one source may be clipped where they meet those from another source.
The assigned Mapping Partner should depict the following types of base data features on the FRM if they occur within the mapped area and are effective in communicating locational awareness of the flood risk within the overall project area:
Boundaries that identify county and State boundaries, corporate limits (whereapplicable), extraterritorial jurisdictional areas (ETJs), HUC-8 sub-basin boundaries, andHUC-10 watershed boundaries
Major transportation features: Interstates, U.S. highways, State highways, and significant airports (where applicable)
Hydraulic structures (i.e., levees, dams, and significant hydraulic structures)
A hillshade of the watershed as a background layer
Guidance on the display order and priority for each base map layer are shown in Table 4. The Mapping Partner can use leader lines as appropriate to reduce clutter. Cartographic recommendations for these features are outlined in Table 5.
3.1.1 Corporate Limits
Political entities (incorporated areas, areas of extraterritorial Jurisdiction, etc.) should be labeled with their formal name. When ETJs are significant enough to be labeled on a FIRM, they can also be shown on the FRM. In instances where the ETJ boundary resides outside the corporate limits, only the outermost boundary line should be shown and the area labeled with the community name.
All other areas, such as military and Tribal lands, State and national parks or forests are not required, but should be shown on the FRM if they are relevant to flood risk in the FRM project
This Document is Superseded. For Reference Only.

Flood Risk Map May 2016 Guidance Document 9 Page 15
area. These features should be labeled by name at least once. In crowded or segmented areas, these labels can be leadered, but leadering is not required.
When additional jurisdictions that fall outside the project area are needed for the FRM, those features should reside in the S_Carto_Ar feature class of the FRD.
3.1.2 Watershed Boundaries
Data for this layer should come from the Watershed Boundary Dataset (WBD). The WBD is a companion dataset to the National Hydrography Dataset (NHD). The United States Geological Survey (USGS) and Natural Resources Conservation Service (NRCS) update and maintain the WBD as needed. FEMA uses the HUC boundaries in the WBD to prioritize projects based on multiple criteria. The boundaries delivered should be those HUCs from the WBD used for the most recent FEMA prioritization.
The HUC-8 sub-basin boundary is the basis for the FRM, unless a different project area has been specified. This information should be pulled directly from the S_HUC_Ar feature class within the FRD. The HUC-10 watershed boundary can also be shown on the FRM. If displayed, this information should be stored in the S_HUC_Ar feature class within the FRD.
3.1.3 Transportation Features
Interstates, U.S. highways, State highways, and major airports should be shown and labeled on the FRM. Secondary roads can be shown if they would enhance the usability of the map. Road shield labels should be placed on the line it represents, and horizontal to the map frame. County highways, major roads, and other airports should be added for clarity at the Mapping Partner’s discretion, as long as their addition does not render the map unreadable due to excessive clutter. Road name labels may be leadered into the feature as necessary.
3.1.4 Hydraulic Structures
All levees (or other flood control features), dams or other significant hydraulic structures stored within the S_Carto_Ln, S_Carto_Ar, or S_Carto_Pt feature classes in the FRD should be shown on the FRM. A label may be placed if the structure(s) necessitate a label. The hydraulic structures can be stored as a point, line, or polygon in their respective feature classes (i.e., S_Carto_Ar, S_Carto_Ln or S_Carto_Pt).
3.1.5 Topographic Hillshade
The watershed hillshade should be shown on the Flood Risk Map to convey a sense of the watershed’s overall topographic relief. As this layer is only intended to help support the overall picture of what the project area looks like, it is not necessary that the hillshade be generated from the same terrain data source that was used in the engineering study. A more readily available terrain data source that covers the entire project may be used to produce the hillshade layer.
This Document is Superseded. For Reference Only.

Flood Risk Map May 2016 Guidance Document 9 Page 16
3.1.6 FRM Base Data Symbology
Table 5: Recommended Base Data Fonts and Symbology
Example Feature Recommendation*
[Hatch Pattern] (RGB Values)
Boundaries
Counties (within Watershed or Project Area)
Top Line, Line weight 0.4 Pt., Black, Dashing [6pt- 1pt- 3pt- 1pt] Bottom Line, Line weight 3 Pt., Grey (170, 170, 170)
Counties (outside Watershed or Project Area)
Grey (225, 225, 225) Top Line, Line weight 0.4 Pt., Black, Dashing [6pt- 1pt- 3pt- 1pt] Outline, Line weight 3 Pt., Blue (170, 170, 170) 50 Percent Transparency
Corporate Limits (within Watershed or Project Area)
Outline, Line weight 1.5 Pt., Black
Corporate Limits (outside Watershed or Project Area)
Grey (204, 204, 204) Outline, Line weight 1.5 Pt., Grey (104, 104, 104) 50 Percent Transparency
HUC-8 Sub-basin Outline, Line weight 3 Pt., Blue (0, 77, 168)
HUC-10 Watershed
Outline, Line weight 1 Pt., Grey (104, 104, 104) 20 Percent Transparency
Flood County
County Label 8-14 Pt. Times New Roman Bold, Italic,Aligned center., Black, Centered; 1.0 Pt. Halo,White, CLC
City, Village, or Other
Community Area Label
8-14 Pt. Times New Roman Bold, Black,Centered; 1.0 Pt. Halo, White, CLC
Fort Bragg Military Base
Area Label 14 Pt. Times New Roman, Bold, Black, Centered 1.0 Pt. White Halo, CLC
This Document is Superseded. For Reference Only.

Flood Risk Map May 2016 Guidance Document 9 Page 17
Example Feature Recommendation*
[Hatch Pattern] (RGB Values)
Transportation
Interstates Top Line, line weight 1 Pt., White Bottom Line, line weight 2 Pt., Black
Interstate Highway, can be ESRI standard or equivalent
Interstate Marker – 24 Pt., Black Interstate Marker – 24 Pt., Blue (0, 0, 255) Interstate Marker – 24 Pt., Red (255, 0, 0) 7 Pt. Arial Bold Narrow, White, CAPS
U.S. Highway Symbol, can be ESRI standard or equivalent
Standard U.S. Route Shield Size 0.200” x 0.200” to 0.400” x 0.480” 8 Pt. Arial Bold Narrow, Black, 0.75 Pt. White Halo, CAPS Line weight 0.72 Pt., Black
State Highway Symbol, can be ESRI standard or equivalent
Circle Diameter 0.200” to 0.280” 8 Pt. Arial Bold Narrow, Black, 0.75 White Halo, CAPS Line weight 0.72 Pt., Black
County Highway Symbol (optional), can be ESRI standard or equivalent
Rectangle Size .150” x .250” to 0.300” x 0.400” 8 Pt. Arial Bold Narrow, Black, 0.75 Pt. White Halo, CAPS Line weight 0.72 Pt., Black
Major Roads Top Line, Line weight 1 Pt., Yellow (255, 255, 190) Bottom Line, Line weight 2 Pt., Red (255, 0, 0)
SPRING CREEK LANEMajor Roads Label (optional)
8 Pt., Arial Bold, Black, Aligned left, 0.75 Pt. White Halo, CAPS
Dulles International
Airport Major Airport 12 Pt., Calibri Bold, Aligned center, Grey (78,
78, 78), 1 Pt. White Halo, CLC
Floodville Community Airport
Airport (optional) 8 Pt., Calibri Bold, Aligned center, Grey (78, 78, 78), 1 Pt. White Halo, CLC
This Document is Superseded. For Reference Only.
Flood Risk Map May 2016 Guidance Document 9 Page 18
Example Feature Recommendation*
[Hatch Pattern] (RGB Values)
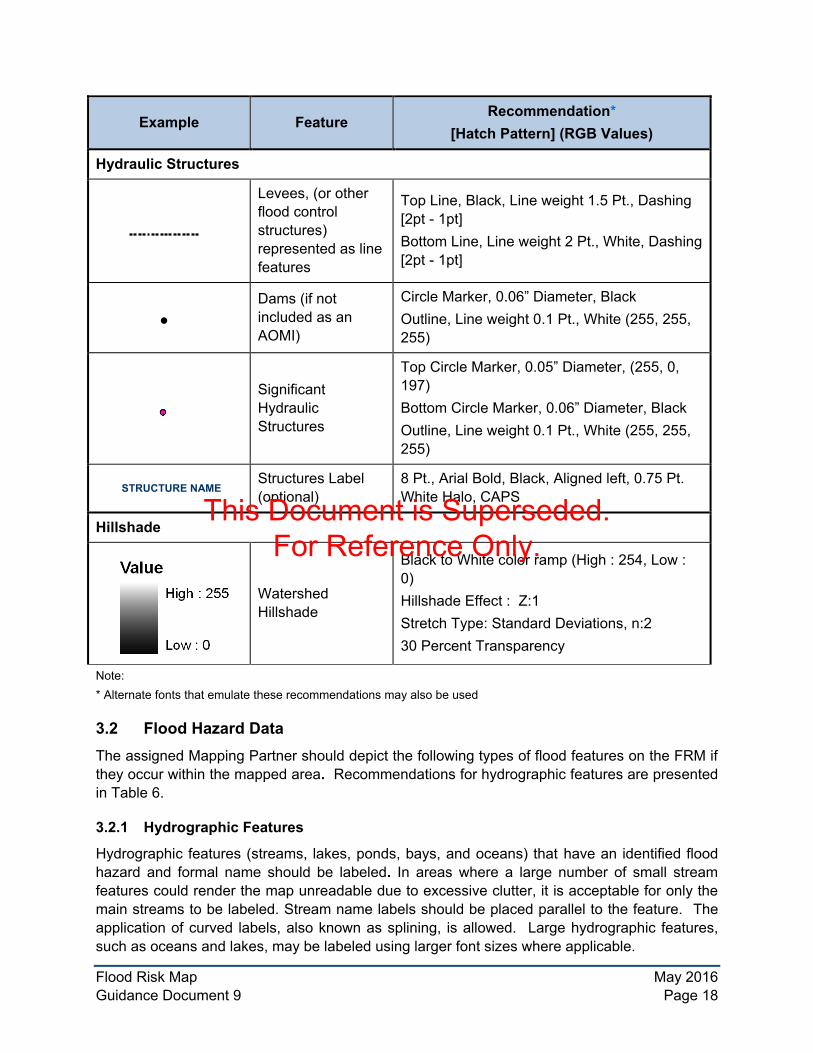
Hydraulic Structures
Levees, (or other flood control structures) represented as line features
Top Line, Black, Line weight 1.5 Pt., Dashing [2pt - 1pt] Bottom Line, Line weight 2 Pt., White, Dashing [2pt - 1pt]
Dams (if not included as an AOMI)
Circle Marker, 0.06” Diameter, Black Outline, Line weight 0.1 Pt., White (255, 255, 255)
Significant Hydraulic Structures
Top Circle Marker, 0.05” Diameter, (255, 0, 197) Bottom Circle Marker, 0.06” Diameter, Black Outline, Line weight 0.1 Pt., White (255, 255, 255)
STRUCTURE NAMEStructures Label (optional)
8 Pt., Arial Bold, Black, Aligned left, 0.75 Pt. White Halo, CAPS
Hillshade
Watershed Hillshade
Black to White color ramp (High : 254, Low : 0) Hillshade Effect : Z:1 Stretch Type: Standard Deviations, n:2 30 Percent Transparency
Note: * Alternate fonts that emulate these recommendations may also be used
3.2 Flood Hazard Data The assigned Mapping Partner should depict the following types of flood features on the FRM if they occur within the mapped area. Recommendations for hydrographic features are presented in Table 6.
3.2.1 Hydrographic Features
Hydrographic features (streams, lakes, ponds, bays, and oceans) that have an identified flood hazard and formal name should be labeled. In areas where a large number of small stream features could render the map unreadable due to excessive clutter, it is acceptable for only the main streams to be labeled. Stream name labels should be placed parallel to the feature. The application of curved labels, also known as splining, is allowed. Large hydrographic features, such as oceans and lakes, may be labeled using larger font sizes where applicable.
This Document is Superseded. For Reference Only.

Flood Risk Map May 2016 Guidance Document 9 Page 19
3.2.2 Restudy Areas
Restudy areas are a buffer of the newly studied stream centerlines. The buffer should be approximately 0.25” measured at map panel scale on the FRM, although this can be modified to avoid crowding.
3.2.3 New SFHAs
New SFHAs are from newly studied, non-coastal flooding sources resulting from the Flood Risk Project. All SFHAs within the FIRM database not related to coastal flooding should be used to compose this layer.
3.2.4 Coastal Surge Influenced Area
Coastal Surge Influenced Areas are any newly studied coastal flooding polygons resulting from the Flood Risk Project. Only coastal flooding SFHAs within the FIRM database should be used to compose this layer.
3.2.5 FRM Flood Hazard Data Symbology
Table 6: Recommended Flood Hazard Data Fonts and Symbology
Example Feature Recommendation*
[Hatch Pattern] (RGB Values)
River, Stream, or Other Hydrographic Feature Line weight 1 Pt., Blue (151, 219, 242)
Lake
Blue (151, 219, 242) Outline, Line weight 0.4 Pt., Blue (64, 101, 235) 50 Percent Transparency
Missouri Creek Name of River, Stream, or Other Hydrographic Feature
5-10 Pt., Times New Roman Bold, Italic,Aligned left., Blue (0, 77, 168), 0.75 Pt. WhiteHalo, CLC
Restudy Area
Top Line, Line weight 1.5 Pt., Orange (255, 85, 0) Bottom Line, Line weight 3 Pt., Yellow (255, 255, 0)
New SFHA
Area Pattern #1, Line weight 0.7 Pt., Grey (107, 126, 174), Angle 45 degrees, Offset 0, Separation 0.1” Area Pattern #2, Top Line, Line weight 0.7 Pt., Grey (107, 126, 174), Angle 135 degrees, Offset 0, Separation 0.1”
This Document is Superseded. For Reference Only.

Flood Risk Map May 2016 Guidance Document 9 Page 20
Example Feature Recommendation*
[Hatch Pattern] (RGB Values)
River, Stream, or Other Hydrographic Feature Line weight 1 Pt., Blue (151, 219, 242)
Lake
Blue (151, 219, 242) Outline, Line weight 0.4 Pt., Blue (64, 101, 235) 50 Percent Transparency
Coastal Surge Influenced Area
Area pattern #1, Line weight 1.5 Pt., Blue (115, 223, 255), Angle 135 degrees, Offset 0, Separation 0.2” Area pattern #2, Line weight 1.5 Pt., Blue (115, 223, 255), Angle 135 degrees, Offset 0, Separation 0.2”
Note: * Alternate fonts that emulate these recommendations may also be used
3.3 Flood Risk Data The objective of the flood risk data layer shown on the FRM is to show the dollar exposure risk, and to draw attention to the areas of highest risk within the project area at a high level. The flood risk data shown on the FRM are based on the Asset Loss Total values from the Risk Analysis Results table and symbolized at the census block level (field TOT_LOSSES in table L_RA_Results, linked to S_CenBlk_Ar). The 1% annual chance flood risk assessment results are typically used for the purposes of symbolizing this data on the FRM, although other scenarios, such as the annualized losses, can be used if they help better communicate relative flood risk within the project area.
Census block data is stored in the FRD with two different types. Beginning with Hazus 2.2 SP1, the Hazus model provided the user the ability to conduct analysis for either homogenous or dasymetric census blocks. Homogenous census blocks represents the “full’ census blocks traditionally used for risk assessment where only open water areas have been clipped out of the original census block boundaries from the US Census Bureau. Dasymetric census blocks have had additional “undeveloped” land areas (primarily wetlands and forest) clipped out of the original census block boundaries based on Land Use-Land Cover data from the USGS. The decision to use homogenous or dasymetric census block data is left to the discretion of the FEMA Regional Project Officer and Mapping Partner producing this dataset. Therefore, FRM developers will need to consider these different census block data types when making flood risk data symbology choices.
Five relative flood risk categories are most commonly used for depiction and symbolization of this data on the FRM – Very Low, Low, Medium, High, and Very High. Multiple approaches,
This Document is Superseded. For Reference Only.

Flood Risk Map May 2016 Guidance Document 9 Page 21
however, exist for classifying the flood risk data results into one of these five categories. The quantity ranges should be determined relative to the total risk within the project area. Although no one method is preferred over another, and other symbolization methods may be applied, one simple option for categorization of the flood risk data is to start by using the Natural Breaks (Jenks) method. Within ArcGIS (or similar) software, 5 classes of breaks can be set using the Natural Breaks method, which helps assign the flood risk values into different classes based on the overall range and distribution of the flood risk values. This approach is fairly quick and automated, and often limits the number of census blocks that would get displayed in the “Very High” category, but may also add many census blocks into the “Very Low” category for larger project areas.
For projects whose flood risk assessment data is produced at the site-specific level, the census block-based risk assessment data can be used when symbolizing the census blocks on the FRM if that data is available. However, in addition to, or in place of, this, the flood risk assessments calculated at the building level can also be depicted as points on the FRM, or as the aggregation of points to identify hot spots and concentrated areas of higher risk.
Figure 6: Flood Risk Legend Examples for Census-Block (left) and Site-Specific (right) Data
Symbology recommendations are to use a light color for the very low category, and then gradually increase to a bold color for very high (with a 20% transparency for each).
3.4 Areas of Mitigation Interest Specific guidance exists that outlines the collection and creation process for the Areas of Mitigation Interest dataset. Depending on their proximity to one another, not all AoMIs in the Flood Risk Database may be able to be clearly shown on the FRM. Some may naturally overlap others. There may, therefore, be overprints of the AoMI point features on the FRM. If this is the case, there is no prescription for which types of AoMI have a higher display priority on the FRM than others. Those decisions should be made on a project-by-project basis.
It is also important to know that AoMI points used to depict past claims or repetitive loss data cannot be location-specific. In other words, in areas where there may be higher quantities of
This Document is Superseded. For Reference Only.

Flood Risk Map May 2016 Guidance Document 9 Page 22
this type of privacy-sensitive data, the AoMI points should be aggregated and displayed at the centroid of a census block, so as not to allow one to be able to identify specific structures.
Table 7 provides suggestions for the symbolization of this data on the map.
Table 7: Recommended Areas of Mitigation Interest Symbology
Example Feature Recommendation*
[Hatch Pattern] (RGB Values)
Accredited Levees Diamond Marker – 28 Pt., Green (56, 168, 0) 2 Pt. White Halo
Non-accredited Levees Diamond Marker – 28 Pt., Black 2 Pt. White Halo
Dams Circle Marker – 17 Pt., Blue (0, 169, 230) Outline, 1 Pt., Black
Coastal Structures
Cross Hair Marker – 16.8 Pt., Red (230, 0, 0) Circle Marker – 16.8 Pt., White Circle Marker – 19.6 Pt., Red (255, 0, 0) Circle Marker Outline – 28 Pt., Black Circle Marker – 28 Pt., Yellow (255, 255, 0)
Stream Flow Constriction Square Marker Outline – 21 Pt., Black Square Marker – 21 Pt., Green (0, 255, 0)
Past Claims Hot Spot
Hexagon Symbol Outline – 76 Pt., Green (85, 255, 0) Hexagon Symbol Outline – 80 Pt., Green (211, 255, 190)
Key Emergency Routes Overtopped During Frequent Flooding Events
Circle Marker Outline -20.57 Pt., Black Circle Marker – 20.57 Pt., Red (230, 76, 0) Circle Marker – 24 Pt., Blue (0, 92, 230)
At-Risk Essential Facilities Circle Marker Outline -20.57 Pt., Black Circle Marker – 20.57 Pt., Green (85, 255, 0)
Individual Assistance (IA) and Public Assistance (PA) Data
Circle Marker Outline – 22 Pt., Black Circle Marker – 22 Pt., Yellow (255, 255, 0)
Significant Land Use Changes (within the past 5 years and looking forward 5 years)
Symbol Hatch Marker – 80 Pt., Black
This Document is Superseded. For Reference Only.

Flood Risk Map May 2016 Guidance Document 9 Page 23
Example Feature Recommendation*
[Hatch Pattern] (RGB Values)
Areas of Significant Riverine or Coastal Erosion
Triangle Symbol Marker – 22 Pt., Black Triangle Marker – 22 Pt., Yellow (255, 255, 0)
Non-Levee Embankments Symbol Marker Outline – 24 Pt., Black Symbol Marker – 24 Pt., Blue (115, 178, 255)
Other Flood Risk Areas Symbol Marker – 23.81 Pt., Blue (0, 92, 230) Symbol Marker – 30 Pt., White
Areas of Mitigation Success Symbol Marker – 28 Pt., Green (85, 255, 0) 1 Pt. White Halo
Other Symbol Marker Outline – 30 Pt., Black Symbol Marker – 30 Pt., Orange (255, 170, 0)
Note: * Alternate fonts that emulate these recommendations may also be used
3.5 Callouts Callouts are a way to highlight and point the reader towards specific areas within the overall project area that may warrant additional discussions or focus in outreach meetings and communications (see Figure 7). The Project Team should work with the community to determine what items are to be shown on the FRM as callouts. Each callout should contain an image, title, and descriptive text to be shown on the FRM. These callouts can be used to highlight things such as AoMIs (i.e., S_AOMI_Pt), areas of high risk, or other significant locations.
This Document is Superseded. For Reference Only.

Flood Risk Map May 2016 Guidance Document 9 Page 24
Figure 7: Example of an AoMI Callout
General guidance and recommendations on the placement of callouts follows, but as with all guidance, variations to this may be implemented if doing so would enhance the overall product (see Figure 8).
3.5.1 S_FRM_Callout_Ln
Callouts are stored in the S_FRM_Callout_Ln feature class. Callouts should be placed in the areas surrounding the project area in the white space of the map and should not overlap the project area. The S_FRM_Callout_Ln feature class within the FRD will depict where the callout is to be placed on the map. The callout box should be centered on the initial (from) node of the line, while the final (to) node of the line should point to the actual map feature being showcased by the callout. There should generally be one line per callout box. Each line is used as the leader line for the callout boxes. The size of the callout image is suggested to be 4” x 6” or 6” x 4”, with the descriptive text box directly below the image and matching the width of the image. The descriptive text may be placed elsewhere in relation to the image if necessary. The Mapping Partner should adjust the layout orientation of the callout box according to the image orientation of the image being included (portrait or landscape).
This Document is Superseded. For Reference Only.

Flood Risk Map May 2016 Guidance Document 9 Page 25
Figure 8: Callout Box and Leader Placement Guidance
3.5.2 Callout FRD-Related Guidance
Callout Image:
o Callout Height stored in the FRD: Table Name S_FRM_Callout_Ln, Field Name:IMG_HEIGHT
o Callout Width stored in the FRD: Table Name S_FRM_Callout_Ln, Field Name:IMG_WIDTH
o Format: 300 dpi, 24-bit depth
o Storage: Stored in the FRD: Table Name S_FRM_Callout_Ln, Field Name:IMG_BINARY – additional guidance on how to load the image within the appropriateFRD field can be found within the help resources of Geographic Information System(GIS) software. For example, a search on the phrase “Adding raster datasets asattributes in a feature class” can be performed within the Esri ArcGIS help files orresource center to find additional information on how this can be performed.
Callout title text stored in the FRD: Table Name: S_FRM_Callout_Ln, Field Name:IMG_TITLE
This Document is Superseded. For Reference Only.
Flood Risk Map May 2016 Guidance Document 9 Page 26
Callout descriptive text stored in the FRD: Table Name: S_FRM_Callout_Ln, FieldName: IMG_CPTION
Callout descriptive text box: White Fill, Outline: Line weight 1 Pt., Black, 5 Pt. Margins
Callout descriptive text box Size: Width 6” or 4”, Height will vary to fit the amount of text
Callout descriptive text box is to be placed directly below Callout Image Box, centeraligned with the Callout Image Box
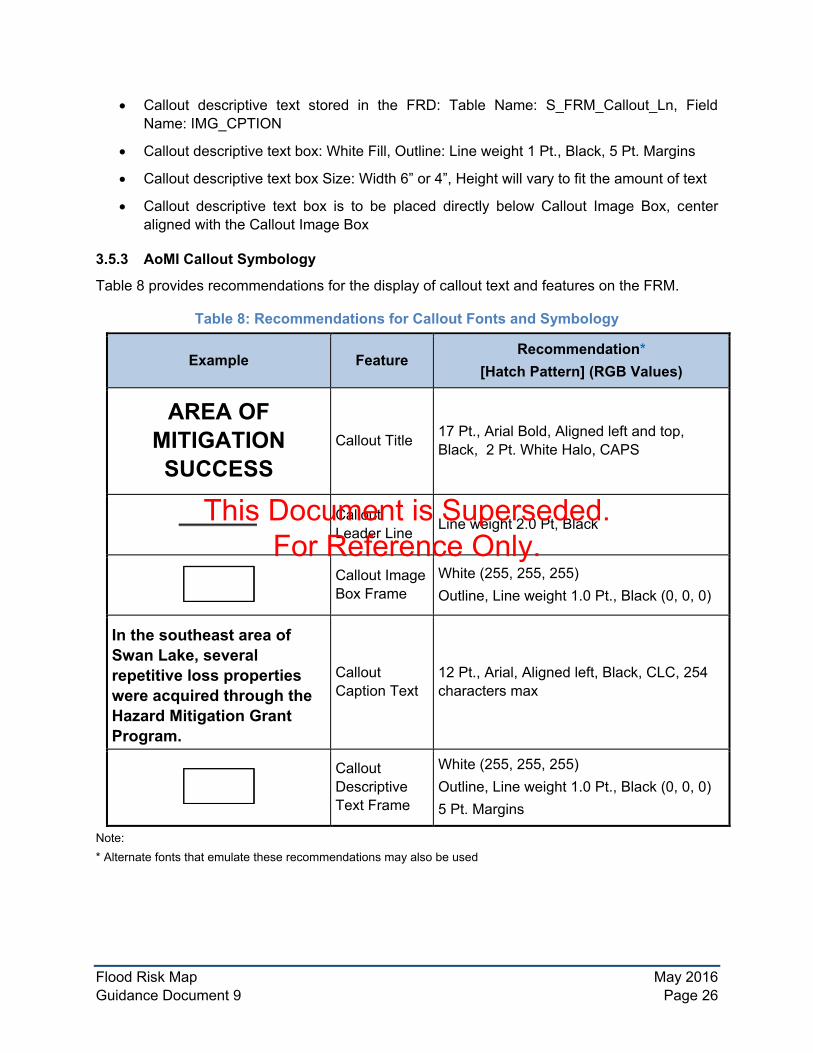
3.5.3 AoMI Callout Symbology
Table 8 provides recommendations for the display of callout text and features on the FRM.
Table 8: Recommendations for Callout Fonts and Symbology
Example Feature Recommendation*
[Hatch Pattern] (RGB Values)
AREA OF MITIGATION SUCCESS
Callout Title 17 Pt., Arial Bold, Aligned left and top, Black, 2 Pt. White Halo, CAPS
Callout Leader Line Line weight 2.0 Pt, Black
Callout Image Box Frame
White (255, 255, 255) Outline, Line weight 1.0 Pt., Black (0, 0, 0)
In the southeast area of Swan Lake, several repetitive loss properties were acquired through the Hazard Mitigation Grant Program.
Callout Caption Text
12 Pt., Arial, Aligned left, Black, CLC, 254 characters max
Callout Descriptive Text Frame
White (255, 255, 255) Outline, Line weight 1.0 Pt., Black (0, 0, 0) 5 Pt. Margins
Note: * Alternate fonts that emulate these recommendations may also be used
This Document is Superseded. For Reference Only.

Flood Risk Map May 2016 Guidance Document 9 Page 27
4.0 FRM Variations for Coastal Areas For coastal projects, several minor variations can and should be applied when producing the FRM. Since different flood risk data may be produced as part of a coastal study, the callouts and AoMIs for a coastal FRM may reasonably be different from a typical watershed FRM.
The legend for the coastal FRM should show any new VE Zones if they were produced for the study. Table 9 shows the recommended symbology for the depiction of these features on the FRM.
Table 9: Recommended Symbology for Coastal-Specific Legend Features
Example Feature Specification
[Hatch Pattern] (RGB Values)
New Zone VE
Line weight 2 Pt., Cyan (0, 255, 197), Angle 90 degrees, Offset 0, Separation 9
Figure 9 shows an example of a Coastal FRM.
This Document is Superseded. For Reference Only.

Flood Risk Map May 2016 Guidance Document 9 Page 28
Figure 9: Example of a Flood Risk Map Developed for Coastal Areas
This Document is Superseded. For Reference Only.

Flood Risk Map May 2016 Guidance Document 9 Page 29
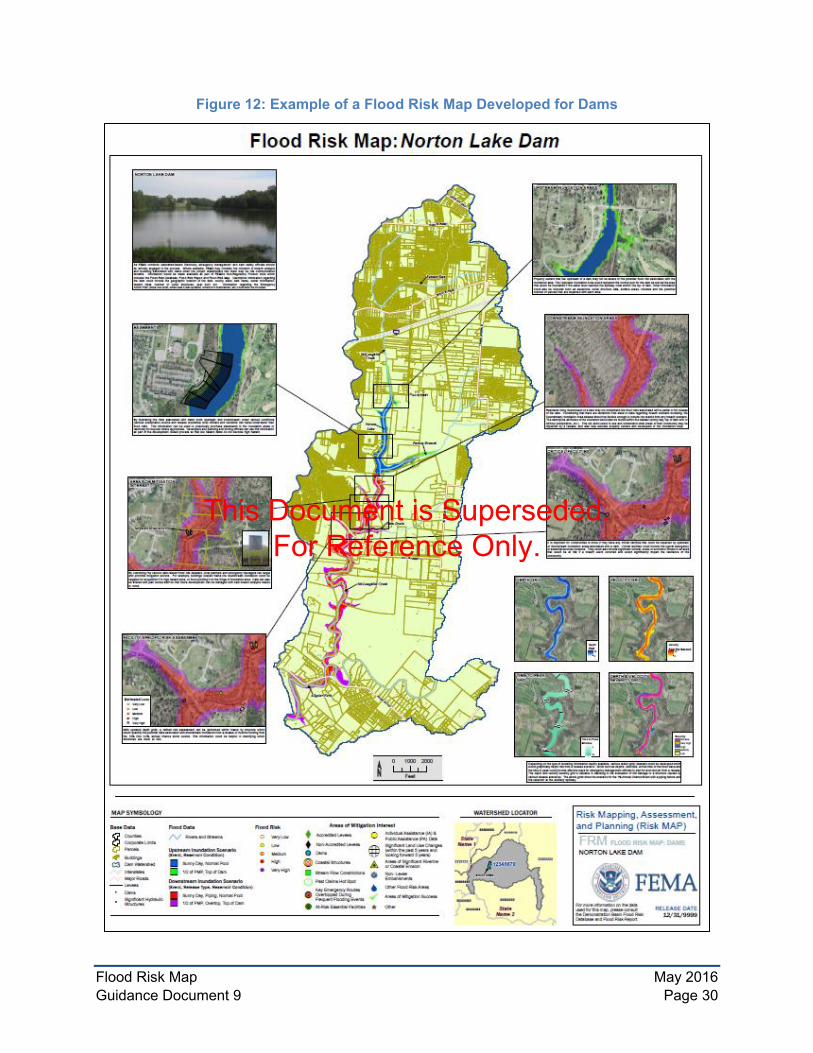
5.0 FRM Variations for Dams Similar to coastal FRMs, for projects that have assessed the risks associated with a dam, several minor variations can and should be applied when producing the FRM. Since different flood risk data may be produced for dams, the callouts and AoMIs for a dam FRM may reasonably be different from a typical watershed FRM. In general, a FRM is anticipated to be produced for each dam scoped to be studied in the project area. However, if multiple dams are studied in close proximity to each other, a single FRM may be produced for multiple dams assuming that the flooding risk can be readily communicated on the combined map.
The standard FRM legend should be modified to include any inundation scenarios presented on the map. The following figure is an example legend for different upstream and downstream scenarios:
Figure 10: Inundation Scenario Legend Example
The project locator inset for dam analysis FRMs should include the location of the dam(s) and upstream and downstream inundation areas (if legible) in the context of the remainder of the watershed-based project. Figure 11 is an example project locator:
Figure 11: Project Locator Inset Example for Dams
Figure 12 provides an example of a dam FRM.
This Document is Superseded. For Reference Only.
Flood Risk Map May 2016 Guidance Document 9 Page 30
Figure 12: Example of a Flood Risk Map Developed for Dams
This Document is Superseded. For Reference Only.

Flood Risk Map May 2016 Guidance Document 9 Page 31
6.0 FRM Variations for Levees In general, a FRM is anticipated to be produced for each levee scoped to be studied in the project area. However, if multiple levees are studied in close proximity to each other, a single FRM may be produced for multiple levees assuming that the flooding risk can be readily communicated on the combined map. The standard FRM legend should be modified to include any levee scenarios presented on the map. If levee freeboard is shown on the primary map, Figure 13 shows an example for adding this to the Flood Risk section of the legend.
Figure 13: Levee Freeboard Legend Example
If the flood risk datasets showing historic levee breach locations (S_Lev_Breach_Pt) and/or drainage or protection structures along the levee (S_Lev_Elements_Pt) are produced as part of the Flood Risk Project, these point features should be included within the Areas of Mitigation Interest section of the legend. Figure 14 provides an example of how this could be shown.
Figure 14: Levee Areas of Mitigation Interest Legend Example
This Document is Superseded. For Reference Only.

Flood Risk Map May 2016 Guidance Document 9 Page 32
Similar to the FRM for areas affected by dams, the project locator inset for levee analysis FRMs should include the location of the levee(s) and the major drainage feature in the context of the remainder of the watershed-based project. Figure 15 is an example levee project locator:
Figure 15: Project Locator Inset Example for Levees
Figure 16 provides an example of a levee FRM.
This Document is Superseded. For Reference Only.

Flood Risk Map May 2016 Guidance Document 9 Page 33
Figure 16: Example of a Flood Risk Map Developed for Levees
This Document is Superseded. For Reference Only.
Flood Risk Map May 2016 Guidance Document 9 Page 34
7.0 Uses in Outreach, Collaboration, and Flood Risk Communication The Flood Risk Map may be used by community and elected officials to visually support high level presentations, proposals, and discussion about flood risks within the watershed or project area. For example, the Flood Risk Map identifies flood risk “hot spots” within the community and potential flood risk mitigation opportunities. This could facilitate discussions within the community about future land use and economic development planning, and steps to reduce potential flood risk for community citizens and business owners.
The FRM can also be an effective tool to use at community outreach meetings where citizens and/or local or regional media outlets are involved. This map can be an effective first visual to have posted visibly within the meeting area, as it illustrates the flood risks in the project area and conditions that may cause flooding. For watershed-based studies, it also provides a good reference for these same stakeholders who may be unaware of the watershed within which they are located, and which communities are located upstream and downstream.
This Document is Superseded. For Reference Only.