Embed Size (px)
Citation preview

Full-year results 2015 10 March 2016

Ian McHoul Chief Financial Officer and interim CEO
2
Full-year results 2015 10 March 2016
This presentation contains forward-looking statements which are subject to risks and uncertainties because they relate to future events. These forward-looking statements include, without limitation, statements in relation to Amec Foster Wheeler’s projected financial results of the 2016 financial year. Some of the factors which may cause actual results to differ from these forward-looking statements are discussed in the slide titled “Important information” in the appendix of this presentation.

Priorities for 2016
3
Action area Progress
Deal with challenging markets Solid operational & commercial discipline Innovate to meet customer needs Driving cost reduction plans ahead
Review portfolio Non-core assets identified GPG disposal process underway
Strengthen the balance sheet
Refinancing completed (announced last week) Dividend cut (announced in November) Objective to halve net debt over next 15 months
Appoint CEO Progressing well

£ million 2015 2014
► Revenue 5,455 3,993
► (Loss)/profit before tax (235) 155
► Reported EPS (66.1)p 35.1p
► Dividend per share(1) 29.0p 43.3p
► Net debt 946 803
Headline statutory numbers
4
► Trading performance in line with November update
► Loss caused by GPG write- down, intangible amortisation and integration costs
► Final dividend 14.2p; full impact of reduction in 2016
► Net debt below guidance, with good working capital inflow and Longview payment delayed until Q1
(1) Including proposed final dividend of 14.2p
Summary underlying numbers
5
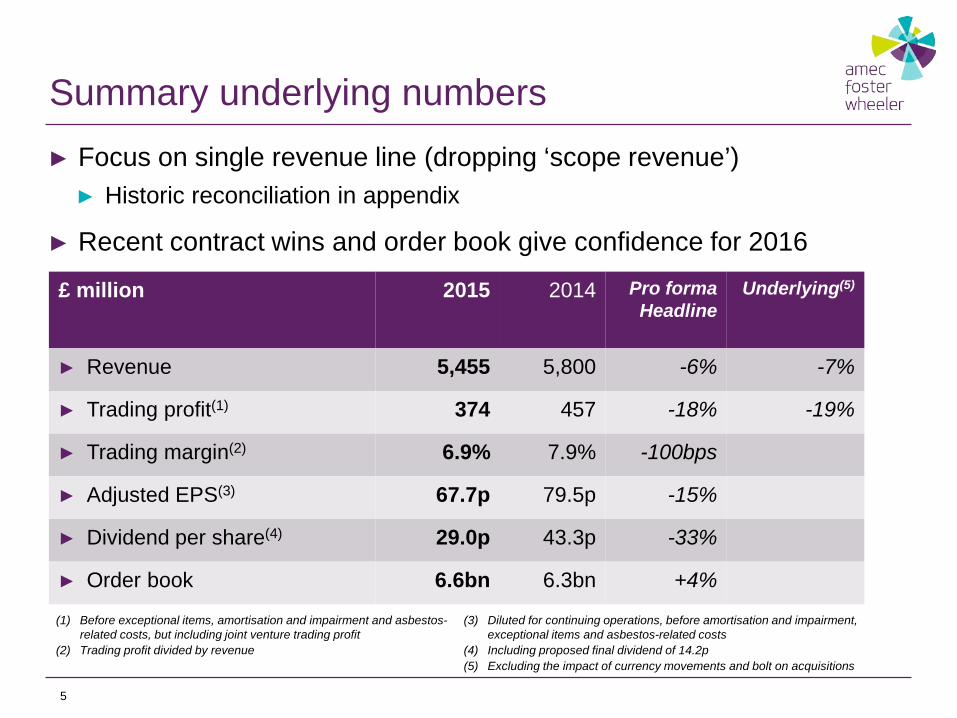
► Focus on single revenue line (dropping ‘scope revenue’) ► Historic reconciliation in appendix
► Recent contract wins and order book give confidence for 2016
£ million 2015
2014 Pro forma Headline
Underlying(5)
► Revenue 5,455 5,800 -6% -7%
► Trading profit(1) 374 457 -18% -19%
► Trading margin(2) 6.9% 7.9% -100bps
► Adjusted EPS(3) 67.7p 79.5p -15%
► Dividend per share(4) 29.0p 43.3p -33%
► Order book 6.6bn 6.3bn +4%
(1) Before exceptional items, amortisation and impairment and asbestos-related costs, but including joint venture trading profit
(2) Trading profit divided by revenue
(3) Diluted for continuing operations, before amortisation and impairment, exceptional items and asbestos-related costs
(4) Including proposed final dividend of 14.2p (5) Excluding the impact of currency movements and bolt on acquisitions

Revenue by business unit
6
(1) Excluding the impact of currency movements and bolt on acquisitions
£ million 2015 Pro forma Headline Underlying(1)
► Americas 2,646 -2% -3%
► NECIS 1,492 -12% -13%
► AMEASE 1,050 +2% +2%
► GPG 364 -20% -20%
► Centre and i/c eliminations (97)
5,455 -6% -7%
► Revenue decline reflects challenging market conditions in O&G and Mining
Revenue by market
7
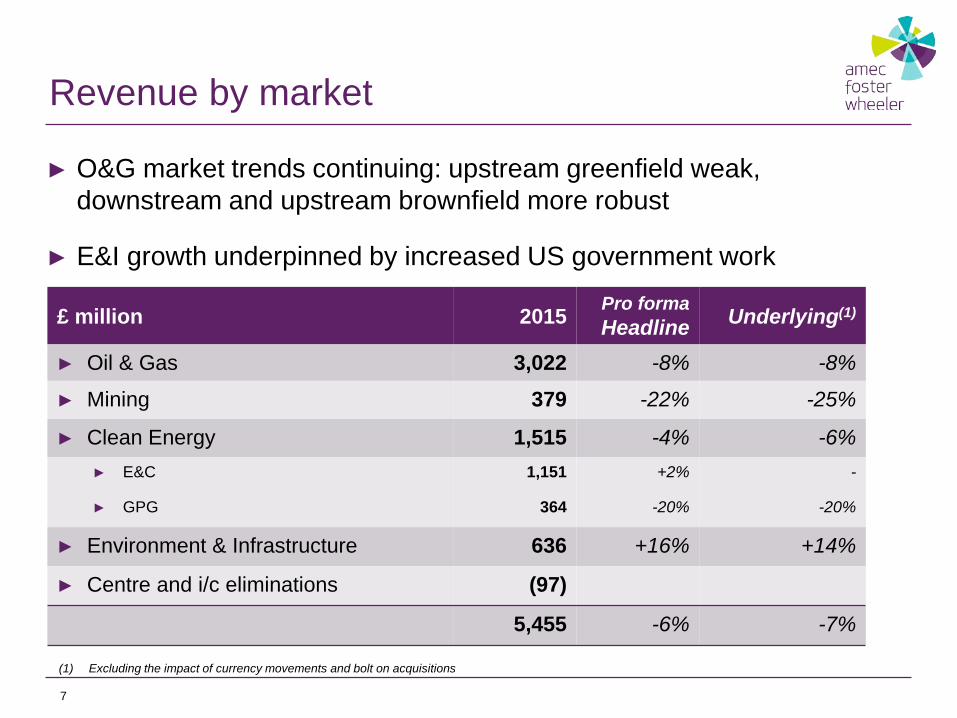
(1) Excluding the impact of currency movements and bolt on acquisitions
£ million 2015 Pro forma Headline Underlying(1)
► Oil & Gas 3,022 -8% -8%
► Mining 379 -22% -25%
► Clean Energy 1,515 -4% -6% ► E&C 1,151 +2% -
► GPG 364 -20% -20%
► Environment & Infrastructure 636 +16% +14%
► Centre and i/c eliminations (97)
5,455 -6% -7%
► O&G market trends continuing: upstream greenfield weak, downstream and upstream brownfield more robust
► E&I growth underpinned by increased US government work

Trading margin
8
(1) After corporate costs
2015 2014PF
► Americas 6.1% 9.6%
► NECIS 9.0% 8.0%
► AMEASE 6.5% 5.2%
► GPG 14.0% 15.2%
Group(1) 6.9% 7.9%
► Note: now calculated from revenue, scope revenue has been dropped ► Historic reconciliation in appendix
► Expect rate of decline to slow significantly in 2016

Americas
9
£ million 2015 2014PF Underlying(1)
► Revenue
► Oil & Gas 1,067 1,130 -7%
► Mining 295 369 -20%
► Clean Energy 821 785 +3%
► Environment & Infrastructure 463 421 +7%
Total 2,646 2,705 -3%
► Trading profit 161 258 -36%
► Trading margin 6.1% 9.6%
► O&G downstream growth partially offsetting upstream weakness
► Clean Energy H2 growth, and backlog growth
► Do not expect further margin dilution from more EPC
(1) Excluding the impact of currency movements and bolt on acquisitions

Northern Europe & CIS (NECIS)
10
£ million 2015 2014PF Underlying(1)
► Revenue
► Oil & Gas 1,125 1,307 -15%
► Mining 1 - -
► Clean Energy 320 344 -6%
► Environment & Infrastructure 46 54 -15%
Total 1,492 1,705 -13%
► Trading profit 134 137 -5%
► Trading margin 9.0% 8.0%
► Revenue impacted by lower rates in UKNS passed on to customers
► O&G activity supported by hook-ups in UKNS, greenfield in Azerbaijan
► Dissolution of NMP in H1 will impact 2016 margin by c.100bp
(1) Excluding the impact of currency movements and bolt on acquisitions
Asia, Middle East, Africa & S. Europe (AMEASE)
11
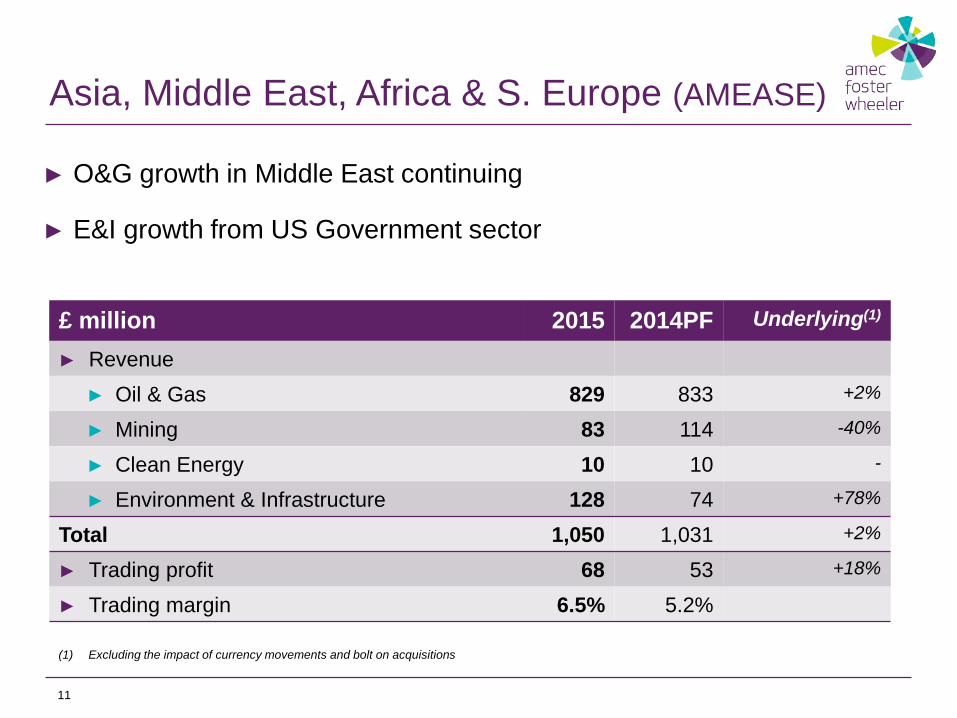
£ million 2015 2014PF Underlying(1)
► Revenue
► Oil & Gas 829 833 +2%
► Mining 83 114 -40%
► Clean Energy 10 10 -
► Environment & Infrastructure 128 74 +78%
Total 1,050 1,031 +2%
► Trading profit 68 53 +18%
► Trading margin 6.5% 5.2%
► O&G growth in Middle East continuing
► E&I growth from US Government sector
(1) Excluding the impact of currency movements and bolt on acquisitions

Global Power Group (GPG)
12
£ million 2015 2014PF Underlying(1)
► Revenue 364 454 -20%
► Trading profit 51 69 -31%
► Trading margin 14.0% 15.2%
► Solid fuel power market remains challenged
► Pipeline still includes US$500m of projects awaiting full notice to proceed
► 2014 includes £20m one-off income from license settlement
► £308m non-cash impairment charge
► Advisers have been appointed to explore sale of GPG
(1) Excluding the impact of currency movements and bolt on acquisitions

Net debt bridge
13
388
114
36
85
45 47 51
167
80
200
400
600
800
1000
Net
Deb
t 201
4
Trad
ing
cash
flow
Inte
rest
+Tax
Net
inve
stm
ent
Exc
eptio
nals
Asb
esto
s/Le
gacy
Oth
er
Acq
uisi
tions
Div
iden
ds
FX a
djus
t
Net
Deb
t 201
5
Net
Deb
t 201
6F
2015 free cash flow: £155m
£milli
on 803
946
c.1,000

£ million 2015
► Trading profit 374 ► JV trading profit (40)
334 ► JV dividends received 42 ► Non-cash items(1) 32
408 ► Working capital (20) ► Trading cashflow(2) 388 ► Trading cash conversion 104%
14
Trading cash flow
(1) Depreciation, share based payments and profit on disposal of PPE (2) Trading cash flow excludes exceptional items, discontinued operations and legacy settlements, the difference between pension payments and amounts
recognised in the income statement and certain foreign exchange movements, but includes dividends received from joint ventures. (3) 2010-2014 data for AMEC alone.
► Important measure of current commercial discipline
► Strong Q4 working capital in-flow
0%
20%
40%
60%
80%
100%
2010
2011
2012
2013
2014
2015
Trading Cash Conversion (3)

New banking facility
15
► New facility with syndicate of 20 banks signed in March ‘16 ► 3 year £650m term loan ► 5 year £650m term loan ► 5 year £400m revolver
► Covenants ► Net debt to EBITDA <3.75x for 2
years, then <3.5x thereafter ► Interest cover >3x
► Credit ratings ► Ba1 stable (Moody’s) ► BB+ negative (S&P)
0
200
400
600
800
1000
1200
2016
2017
2018
2019
2020
2021
£milli
on
Repayment schedule

£ million 2015 FY 2016 guidance
Bank interest (31)
Pension financing (2)
Other interest(1) (5)
Income statement (38)
Joint ventures (2)
Total (40) (60)
16
(1) Mainly interest on uncertain tax provisions
Interest
► Post refinancing, blended interest rate for net debt of 5%

Tax
(1) Weighted average geographic rate (2) For continuing businesses before amortisation, exceptional and asbestos-related items and including JV tax
17
£ million 2015 FY 2016 guidance
► Underlying rate(1) 27.4% c.28%
► P&L charge(2) 22.0% c.22% ► Cash paid £79m
► Targeting a sustainable rate in the low-to-mid 20s

Impairments and liabilities
18
► Impairment ► GPG impairment of £308m ► No impairment of E&C business
► Purchase Price Allocation ► Reduction in Foster Wheeler net tangible assets during 1st year ► Includes provisions and contingencies for claims and litigation, old
receivables, uncertain tax positions and fixed asset carrying values ► No material change to asbestos provision ► Net tangible assets reduced by c.£175m
► c.20% asset write downs (non cash outflow) ► Balance includes Longview ($70m (£50m) paid in March 2016)

£ million 2015 FY16 guidance Continuing operations Impairment(1) (308) Amortisation(2) (136) (130) Merger costs restructuring and cost reduction (91) facility fees written off (13) other (6)
(110) (40)
Asbestos related items(3) 6 Other items (11)
(559) Related tax 45
(514) Discontinued operations(4) 1 Total (513)
19
(1) Impairment of GPG (2) Amortisation of intangible assets £129m and impairment of backlog £7m
Amortisation and exceptional items
(3) Impact of movements in the discount rate, £5m and experiential gains £9m offset by unwind of the discounting, £(7)m and costs £(1)m (4) Adjustments to existing provisions in respect of prior year business disposals

Priorities for 2016
Full-year results 2015 10 March 2016

Oil & Gas 56%
21
Diversity
Professional
services Project delivery
Other
Reimbursable
Fixed price
Opex Capex
Mining
Clean Energy
E&I
Upstream
Downstream
Oil & Gas 55%
Mining
Clean Energy
E&I
Upstream
Downstream
Americas
NECIS
AMEASE
GPG
2015 YE Order Book 2015 Revenues

22
Our core offering
► Diverse ► Mix of markets ► Mix of customers ► Mix of services ► Worldwide
► Adaptable ► Transfer resources between markets ► Tailor customer offering in each market
► Scalable ► Expand into new opportunities rapidly ► Focus on common systems and tools

Portfolio review update
23
► Announced in November 2015 ► Several businesses/assets identified as non-core
► Disposals will be major contributor to objective to halve net debt over the next 15 months
► Advisers have been appointed to explore sale of GPG
► Target completion in H2
► Intention is to retain the asbestos liability

Operational initiatives
24
► Integrated operating model launched on 1 January 2015 ► Re-launched company wide safety programme: “Beyond Zero”
► Investment in business development
► Collaboration and engagement with customers ► Commercial discipline and focus on big opportunities in the pipeline
► Rolling out operating model improvements ► More4Less ‘new normal’ for minor mods in UKNS pilot for greenfield/
other sectors; both UK and international

Cost efficiency update
25
► On track to meet £130m savings per annum by 2017 ► Ongoing programme to find further savings
£ million 2014 2015 2016 2017 Cumulative
One-off charge
30 90 40 - 160
Cumulative benefit
0 50 100 130 130
People Central duplication
Regional duplication
Optim-isation
Infrastructure IT IT, office space, shared services
Procurement Early wins Further benefits
Are
as o
f Foc
us

Maintaining efficient resources
26
► 3 criteria for our workforce for ongoing success ► Cost effective unit rates ► Flexible ► High utilisation
► 2016 priorities ► Reduce overhead roles ► Optimise workshare ► Maximise efficiency
Adapting the North Sea workforce
Maintaining utilisation in Canada
50
75
100
125
150
Jan Apr Jul Oct
Inde
xed
Billable hours
Utilisation
0
25
50
75
100
125
150
2011 2012 2013 2014 2015 2016F2017F
Inde
xed
Onshore
Offshore

Fishing where the fish are
27
Changing end markets 2012-15 Changing scope of work
Projectdelivery
Consulting Engineeringonly
Y-Y
Rev
enue
cha
nge
Growth:
Americas downstream
Renewables
Government
services
Stable:
Nuclear
Brownfield Declined:
Mining
Oil sands GPG

Top 50 contract wins since H1 results >£2bn
28
Top 10 contract wins by revenue(2)
Utility Solar EPC
Government Nuclear decommissioning services
NOC Refinery EPC
Utility Solar EPC
Government Missile defence project EPC
Utility Solar EPC
NOC Upstream brownfield PMC
Government Military base support services
E&P Integrated services
Chemical Co Methanol EPCm
Upstream O&G
Downstream O&G
Government
Renewables
Nuclear
Other
>80% outside upstream O&G(1)
(1) Top 50 contract wins since the H1 results by sector
(2) Since H1 results

Order book
29
£ billion
2015FY
15HY 14FY
► Americas 2.0 2.1 2.0
► NECIS 2.4 2.3 2.3
► AMEASE 1.8 1.8 1.6
► GPG 0.4 0.4 0.4
6.6 6.6 6.3
► O&G decline in upstream greenfield, offsetting downstream and brownfield resilience
► Significant growth in solar ► US tax credits extended in December 2015
£ billion
2015FY
15HY 14FY
► Oil & Gas 3.7 4.0 4.2
► Mining 0.2 0.3 0.4
► Clean Energy(1) 2.0 1.8 1.4
► E&I 0.6 0.6 0.5
6.6 6.6 6.3
(1) Including GPG
Outlook
30
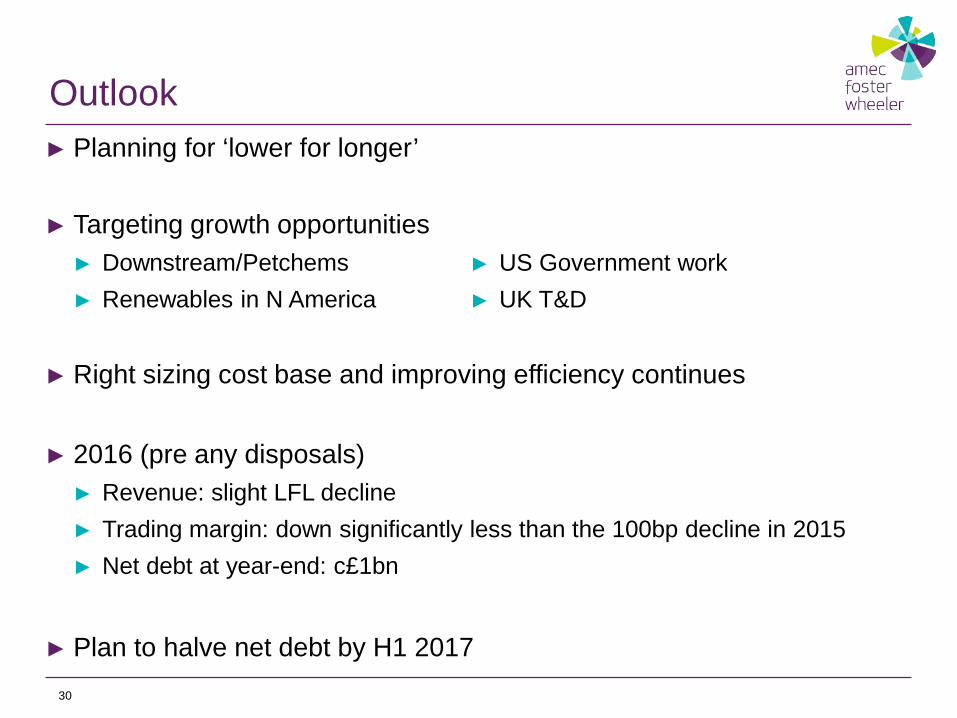
► Planning for ‘lower for longer’
► Targeting growth opportunities ► Downstream/Petchems ► Renewables in N America
► Right sizing cost base and improving efficiency continues ► 2016 (pre any disposals)
► Revenue: slight LFL decline ► Trading margin: down significantly less than the 100bp decline in 2015 ► Net debt at year-end: c£1bn
► Plan to halve net debt by H1 2017
► US Government work ► UK T&D

Priorities for 2016
31
Action area Progress
Deal with challenging markets Solid operational & commercial discipline Innovate to meet customer needs Driving cost reduction plans ahead
Review portfolio Non-core assets identified GPG disposal process underway
Strengthen the balance sheet
Refinancing completed (announced last week) Dividend cut (announced in November) Objective to halve net debt over next 15 months
Appoint CEO Progressing well

Appendix – financial information
32
Full-year results 2015 10 March 2016

33
► Acquisition of Foster Wheeler completed on 13/11/14
► Squeeze out of remaining shareholders completed 19/1/15
► Presentation of all numbers on a pro forma basis, unless otherwise stated
► Foster Wheeler historic results restated for IFRS and AMEC accounting policies
Appendix Basis of preparation

34
2015 2014 2013 15/14
Income statement
► Cdn $ 1.96 1.82 1.62 +8%
► US $ 1.52 1.64 1.57 -7%
► Euro € 1.39
Balance sheet
► Cdn $ 2.05 1.81 1.76 +13%
► US $ 1.47 1.56 1.66 -6%
► Euro € 1.36 1.29 1.20 +5%
Appendix Foreign exchange
As reported by Reuters

35
Appendix Profit reconciliation
£ million
Per consol
income statement
Joint(2) ventures
Per presentation
Americas 161
NECIS 134
AMEASE 68
GPG 51
Investments Services 14
Corporate costs (54)
Profit before net financing expense 334 40 374
Net financing expense (38) (2) (40)
Share of joint ventures 28(1) (28) -
Profit before tax 324 10 334
Income tax (63) (10) (73)
Profit after tax 261 - 261
Post-tax amortisation, impairment, exceptional items and discontinued operations
(518) - (518)
Loss for the year (257) - (257) (1) Share of joint venture results shown after tax in the consolidated income statement (under IFRS 11) (2) Joint venture results disaggregated in the presentation

36
£ million Group
companies JVs Total Trading profit per presentation 334 40 374
Net financing income (38) (2) (40)
296 38 334
Tax (63) (10) (73)
PAT per consolidated 233 28 261
Tax rate 21.5% 25.5% 22.0%
(1) Before amortisation and impairment, exceptional items and asbestos related items
Appendix Tax rate(1)

Appendix Cash flow
(1) The difference between pension payments and amounts recognised in the income statement, receipts on maturity of net investment hedges, amortisation of finance arrangement fees, cash received on net share movements and certain foreign exchange movements
37
£ million 2015 FY 2016 guidance
► Trading cash flow 388 ► Interest and tax (114) ► Net investment (36) ► Exceptional items (85) ► Asbestos and Legacy settlements (45) ► Other(1) 47 ► Free cashflow 155 c. 50 ► Acquisitions (51) ► Dividends (167) ► Net cash flow (63) ► Opening net debt (803) ► Exchange movement on opening net debt (80) ► Closing net debt (946) c. (1,000)

38
Appendix H1/H2 split
£ million Revenue Trading Profit
H1 H2 FY15 H1 H2 FY15
Americas 1,267 1,379 2,646 82 79 161
NECIS 736 756 1,492 70 64 134
AMEASE 518 532 1,050 33 35 68
GPG 195 169 364 21 30 51
Centre/i-company eliminations (52) (45) (97) (18) (22) (40)
Group
2,664
2,791
5,455
188
186
374

39
Appendix Scope revenue reconciliation
£ million 2015 2014 2013 2012
Americas 2,646 2,705 2,902 3,078
NECIS 1,492 1,705 1,716 1,428
AMEASE 1,050 1,031 1,026 1,158
GPG 364 454 507 611
Internal (97) (95) (65) (54)
Revenue 5,455 5,800 6,086 6,221
Trading profit 374 457 537 526
Trading margin 6.9% 7.9% 8.8% 8.4%
Pass-through procurement (279) (307) (574) (850)
Scope Revenue 5,176 5,493 5,512 5,371
Margin (using scope revenue) 7.2% 8.3% 9.7% 9.8%

40
Appendix Modelling assumptions
2016 guidance
Revenue Slight fall in LFL revenue
Trading margin Down, but significantly less than 2015 (down <100bp)
Cost savings –charge / benefits £(40)m charge. Cumulative savings of £100m in 2016. £130m run rate by end of 2016
Trading cash conversion 80-100%
Net finance charge £(60)m
Tax rate (based off PBTA inc JVs) c.22%
Non trading cash charges Capex £(20)m Asbestos £(20)m Legacy payments £(20)m Longview £(50)m paid in March 2016
FY Free cashflow c. £50m
YE net debt c. £(1.0)bn (pre disposal proceeds)
Dividend Declared: c21.5p =1/2 of 43.3p, split HY/FY 1/3rd 2/3rd Cash: £(112)m, HY15:14.8+FY15:14.2 = 29.0p *388m ISC

Appendix Market by market outlook
Selected markets 2016 Rev 2016 commentary
Oil & Gas upstream Down <10% HUC/backlog underpins 2016. Further impact in 2017
Oil & Gas – oil sands Down >20% Continued declines
Oil & Gas downstream Flat Pipeline remains, but timing of go-ahead more uncertain
Mining Down >10% Generally weak
Clean Energy – nuclear Flat New work at Sellafield to replace old Tier 1 role
Clean Energy – solar/wind Up >10% Strong backlog growth in Q4; US tax incentives extended
Clean Energy – T&D Up >10% Strong backlog growth over past 12 months
Clean Energy – GPG Up >10% With some risk, as $500m “shadow backlog” still uncertain
E&I – Government Up <10% Strong performance in US market
41
► Challenging market conditions set to continue ► Significant variation in outlook

Important information
This presentation contains “forward-looking statements” within the meaning of the US Private Securities Litigation Reform Act of 1995 with respect to Amec Foster Wheeler’s financial condition, results of operations and businesses and certain of Amec Foster Wheeler’s plans and objectives. In particular, such forward-looking statements include: the outlook and the statements relating to Amec Foster Wheeler’s future performance generally; expectations regarding global economic conditions or other macroeconomic developments in the geographic regions and markets in which Amec Foster Wheeler operates, including fluctuations in exchange rates; expectations regarding revenues, trading profits and other results of operations, and tax rates for the 2016 financial year; and expectations regarding the integration or performance of current and future investments, associates, joint ventures and newly acquired businesses, including Foster Wheeler. Forward-looking statements are sometimes, but not always, identified by their use of a date in the future or such words as “will”, “anticipates”, “aims”, “could”, “may”, “should”, “expects”, “believes”, “intends”, “plans” or “targets”. By their nature, forward-looking statements are inherently predictive, speculative and involve risk and uncertainty because they relate to events and depend on circumstances that will occur in the future. There are a number of factors that could cause actual results and developments to differ materially from those expressed or implied by these forward-looking statements. These factors include, but are not limited to, the following: global economic conditions or other macroeconomic developments in the geographic regions and markets in which Amec Foster Wheeler operates, including fluctuations in exchange rates; changes in commodity prices which may impact demand for Amec Foster Wheeler’s services; Amec Foster Wheeler’s exposure to the risks associated with operating in emerging markets; the failure to meet targets associated with our cost-savings programme and ongoing portfolio review; the failure to meet customer expectations on project delivery, which could result in damage to reputation and/or loss of repeat business and potentially lead to litigation; future business performance depending upon factors which are not entirely within Amec Foster Wheeler’s control, including the selection process for new contracts and their subsequent award and timing for performance; long term contracts which may be subject to early termination, variation or non renewal provisions; projects included in Amec Foster Wheeler’s order book which may be delayed or cancelled; lump sum contracts, which are subject to the risks associated with unanticipated modifications, technical problems and delays; the failure to successfully defend against claims made by project owners, suppliers or subcontractors, or the failure to recover adequately on claims made against project owners, suppliers or subcontractors; the exposure to risks related to Amec Foster Wheeler’s projects’ technical design and associated warranty obligations; the loss of senior management or difficulty in attracting and retaining appropriately skilled personnel; the failure to comply with health, safety and environmental laws; the possibility of major safety incidents that can lead to reputational damage and increase potential liabilities; the likelihood of being materially adversely impacted by regional, national and/or global requirements in respect of greenhouse gas emissions; the possibility that the regulatory environment in which Amec Foster Wheeler operates may change; obligations and liabilities relating to Amec Foster Wheeler’s divested and non core businesses; the failure or security breaches of its information technology systems and/or data security; the failure to comply with anti corruption laws and regulations, economic sanction programmes or other laws and regulations, which may result in Amec Foster Wheeler becoming subject to fines or penalties and the disruption of its business activities; the satisfactory performance by Amec Foster Wheeler’s joint venture partners of their contractual and other obligations, on which the success of Amec Foster Wheeler substantially depends; and the potential to be negatively impacted by increases in Amec Foster Wheeler’s effective tax rate. All subsequent written or oral forward-looking statements attributable to Amec Foster Wheeler or any persons acting on its behalf are expressly qualified in their entirety by the factors referred to above. No assurances can be given that the forward-looking statements in this presentation will be realised. Except as otherwise stated herein and as may be required to comply with applicable law and regulations, Amec Foster Wheeler does not intend to update these forward-looking statements and does not undertake any obligation to do so. This presentation includes pro forma numbers which have not been audited and are therefore subject to change.
42

[email protected] +44 (0) 207 429 7500 +1 713 570 8327
www.amecfw.com/investors
43
Further information