Embed Size (px)
Citation preview
REVIEW PAPER
From Poverty to Disaster and Back:a Review of the Literature
Stéphane Hallegatte1 & Adrien Vogt-Schilb2 & Julie Rozenberg1 & Mook Bangalore1 &
Chloé Beaudet1
Received: 17 January 2020 /Accepted: 4 February 2020 /Published online: 24 April 2020# International Bank for Reconstruction and Development/The World Bank 2020
AbstractPoor people are disproportionally affected by natural hazards and disasters. This paperprovides a review of the multiple factors that explain why this is the case. It explores therole of exposure (often, but not always, poor people are more likely to be affected byhazards), vulnerability (when they are affected, poor people tend to lose a larger fractionof their wealth), and socio-economic resilience (poor people have a lower ability to copewith and recover from disaster impacts). Finally, the paper highlights the vicious circlebetween poverty and disaster losses: poverty is a major driver of people’s vulnerability tonatural disasters, which in turn increase poverty in a measurable and significant way. Themain policy implication is that poverty reduction can be considered as disaster riskmanagement, and disaster risk management can be considered as poverty reduction.
Keywords Poverty . Disasters . Risk . Climate change
Introduction
In many ways, it is obvious that poor people are disproportionally affected by natural disasters.Almost by definition, poor people aremore vulnerable to shocks, regardless of their origin: becausethey are poor, any impact on their asset or consumption level threaten subsistence and long-termprospects, and they have less resources to reduce risks or cope with the shock when it occurs.
However, to guide policies and better prioritize action to manage natural hazards, it is usefulto go beyond the generic statement (“poor people are disproportionally affected”) and inves-tigate the various factors that make poor people more vulnerable. Is it because they are more
Economics of Disasters and Climate Change (2020) 4:223–247https://doi.org/10.1007/s41885-020-00060-5
* Stéphane [email protected]
1 The World Bank, Washington, DC, USA2 The Inter-American Development Bank, Washington, DC, USA

likely to live in place affected by natural hazards? Is it because they are experiencing largerlosses when they are affected? Is it because they struggle to replace the lost assets?
This paper builds on recent World Bank reports (Hallegatte et al. 2016c, b, c, 2018) andinvestigates these questions to identify the main drivers of the relatively higher vulnerability ofpoor people. It does so by mobilizing the standard framework for risk assessments, which focuseson: (i) hazard—the probability of an event occurring; (ii) exposure—the population and assetslocated in an affected area; (iii) asset vulnerability—the asset value lost when affected by a hazard.
But this paper goes beyond these traditional factors, which describe the risk to assets—thatis, the average monetary value of the damages that disasters inflict on assets (often measured asreplacement or repair value) and other direct impacts of disasters. To better understand theimpact of natural hazards on people’s well-being, this paper extends risk assessment to includethe ability of the affected population to cope with and recover from disaster losses. After all,experiencing asset losses is not so much of a problem, if the affected people can easily andpainlessly replace the lost assets and move on with their lives. In the rest of this paper, thisability will be referred to as “socioeconomic resilience” and will play a key role in explainingwhy poor people are disproportionally affected by natural disasters (Fig. 1).
The next section reviews evidence that poor people are often more exposed to naturalhazards than the rest of the population. Then, the paper turns to vulnerability and shows poorpeople are always more vulnerable to disasters. Then it introduces the concept of socio-economic resilience and the factors that contribute to the lower capacity of poor people torespond and bounce back after natural disasters. The papers finally describes the vicious cyclesthat keep people in poverty due to natural disasters.
Exposure Bias: Are Poor People more Often Affected by Natural Hazards?
The Economic Factors Pushing People to Risky Areas
Poor people are more often affected by natural hazards because they often have to settle inrisky areas, for two major reasons. First, at risk areas may be more attractive when they offereconomic opportunities, public services or direct amenities, and higher productivity andincomes (Hallegatte 2012). For example, households in regularly flooded areas of Mumbaireport that they are aware of the flood risks but accept them because of the opportunitiesoffered by the area such as access to jobs, schools, health care facilities, and social networks(Patankar 2015). Globally, there has been a trend toward increased risk taking: from 1970 to
Fig. 1 A comprehensive framework to understand the impact of natural hazards on well-being
224 Economics of Disasters and Climate Change (2020) 4:223–247
2010 the world population grew by 87%, while the population in flood plains increased by114% and in cyclone-prone coastlines by 192%. Risky areas thus attract all kind of population,including poor people.
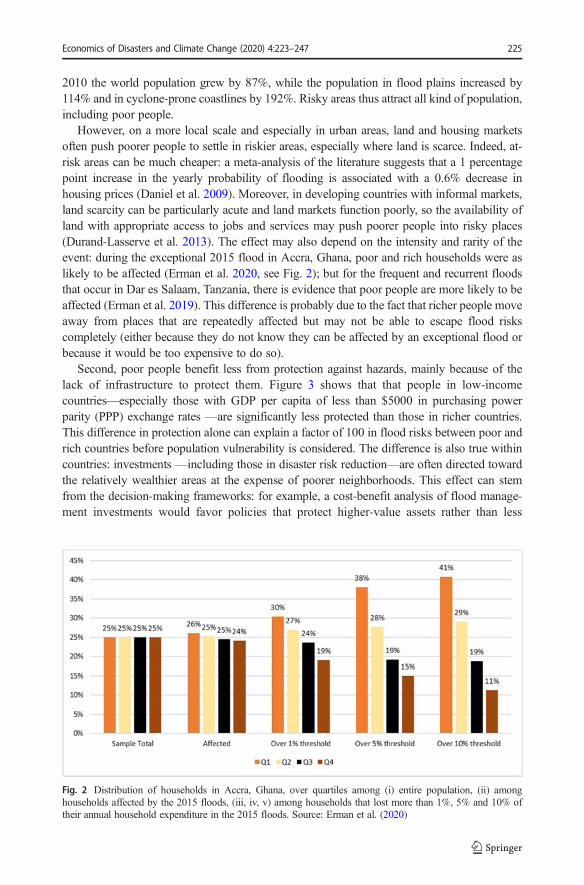
However, on a more local scale and especially in urban areas, land and housing marketsoften push poorer people to settle in riskier areas, especially where land is scarce. Indeed, at-risk areas can be much cheaper: a meta-analysis of the literature suggests that a 1 percentagepoint increase in the yearly probability of flooding is associated with a 0.6% decrease inhousing prices (Daniel et al. 2009). Moreover, in developing countries with informal markets,land scarcity can be particularly acute and land markets function poorly, so the availability ofland with appropriate access to jobs and services may push poorer people into risky places(Durand-Lasserve et al. 2013). The effect may also depend on the intensity and rarity of theevent: during the exceptional 2015 flood in Accra, Ghana, poor and rich households were aslikely to be affected (Erman et al. 2020, see Fig. 2); but for the frequent and recurrent floodsthat occur in Dar es Salaam, Tanzania, there is evidence that poor people are more likely to beaffected (Erman et al. 2019). This difference is probably due to the fact that richer people moveaway from places that are repeatedly affected but may not be able to escape flood riskscompletely (either because they do not know they can be affected by an exceptional flood orbecause it would be too expensive to do so).
Second, poor people benefit less from protection against hazards, mainly because of thelack of infrastructure to protect them. Figure 3 shows that that people in low-incomecountries—especially those with GDP per capita of less than $5000 in purchasing powerparity (PPP) exchange rates —are significantly less protected than those in richer countries.This difference in protection alone can explain a factor of 100 in flood risks between poor andrich countries before population vulnerability is considered. The difference is also true withincountries: investments —including those in disaster risk reduction—are often directed towardthe relatively wealthier areas at the expense of poorer neighborhoods. This effect can stemfrom the decision-making frameworks: for example, a cost-benefit analysis of flood manage-ment investments would favor policies that protect higher-value assets rather than less
Fig. 2 Distribution of households in Accra, Ghana, over quartiles among (i) entire population, (ii) amonghouseholds affected by the 2015 floods, (iii, iv, v) among households that lost more than 1%, 5% and 10% oftheir annual household expenditure in the 2015 floods. Source: Erman et al. (2020)
Economics of Disasters and Climate Change (2020) 4:223–247 225

productive one. Explicit choices to support poor communities are thus necessary to ensure thatrisk management policies support communities with the least adaptive capacities.
Exposure Bias in Past Disasters
At the local level and based on past disasters, poor people seem more likely to be affected bynatural disasters. After Cyclone Aila hit Bangladesh in 2009, a postdisaster survey of 12villages on the southwest coast found that 25% of poor households in these villages wereexposed to the cyclone, whereas only 14% of nonpoor households were (Akter and Mallick2013). However, this pattern is not universal. Most studies find that poor people are moreexposed (Fig. 4), but the relationship between poverty and disaster exposure depends on thetype of hazard, local geography, institutions, and other mechanisms.
For example, Narloch and Bangalore (2016) find that in Vietnam the overexposure of poor tofloods is limited to urban households (Fig. 5), an environment where land scarcity can push thepoor toward the high-risk areas that richer households prefer to avoid. Bangalore et al. (2019)find that a higher percentage of the potential slum areas are exposed to floods (69% for a 10-yearreturn period) compared to the urban area as a whole (63% for a 10-year return period). In ruralareas, more abundant land (and possibly the benefits of floods for agricultural production) mayexplain why poor people are not systematically overexposed (Hallegatte et al. 2016c, b, c).
This overexposure is likely to increase as population and climate change over time.(Bangalore et al. 2019) find that 70% of urban expansion areas is prone to flooding. This is
Fig. 3 Protection level as a function of GDP per capita, PPP-adjusted, by return period. Source: Scussolini et al.2016, Note: PPP = purchasing power parity. Figure shows protection level from FLOPROS (FLOod PROtectionStandards, a global open and collaborative database) as a function of GDP per capita. A 100-year protection levelmeans that the protection can prevent all floods that are more frequent than the 100-year flood (that is, all floodswith an annual probability of occurrence higher than 1%). Each dot represents a country. The y-axis is truncatedat 200 years. A few countries in the database have higher protection levels such as the Netherlands (more than4000 years)
226 Economics of Disasters and Climate Change (2020) 4:223–247

consistent with the idea that urbanization takes place first in safer areas and then extendstoward riskier areas as urban population growth, economic growth, and climate changeincrease land scarcity (Hallegatte 2014).
Current Exposure Bias
The Shock Waves report by Hallegatte et al. (2016c, b, c) examined poverty-specific exposureto floods and drought in 52 countries (Park et al. 2015; Winsemius et al. 2018). The report uses
0
20
40
60
80
100
120
Poor Non-Poor
Fig. 4 Percent of poor and nonpoor affected by natural hazards, selected countries. Sources: Bangadesh 1: Akterand Mallick 2013; Bangladesh 2: del Ninno et al. 2001; Guatemala: Tesliuc and Lindert 2003; Guyana: Pelling1997; Haiti: Fuchs 2014; Honduras: Carter et al. 2007; Kenya: Opondo 2013; MENA: Wodon et al. 2014;Mumbai: Baker et al. 2005, Ranger et al. 2011; Nepal: Gentle et al. 2014; San Salvador and Tegucigalpa: Fay2005; Vietnam: Nguyen 2011. Note: MENA=Middle East and North Africa. Each study has a differentdefinition of “poor” and “nonpoor” people. The definition of exposure differs based on the type of hazard andcontext in which it occurs
a. Rural areas b. Urban areas
010
2030
4050
6 7 8 9ln_pcexp
1020
3040
do olf
6 7 8 9 10ln_pcexp
Fig. 5 Flood risk for different consumption percentiles: rural and urban areas of Vietnam, 2014. Source: Narlochand Bangalore 2016. Note: The x-axis in both panels shows the percentiles of logged per capita expenditureamong households in 2014. The y-axis in both panels indicates the level of flood exposure. The blue dots showthe binned scatterplots—that is, the mean flood exposure for each consumption level. The red line is the line ofbest fit
Economics of Disasters and Climate Change (2020) 4:223–247 227
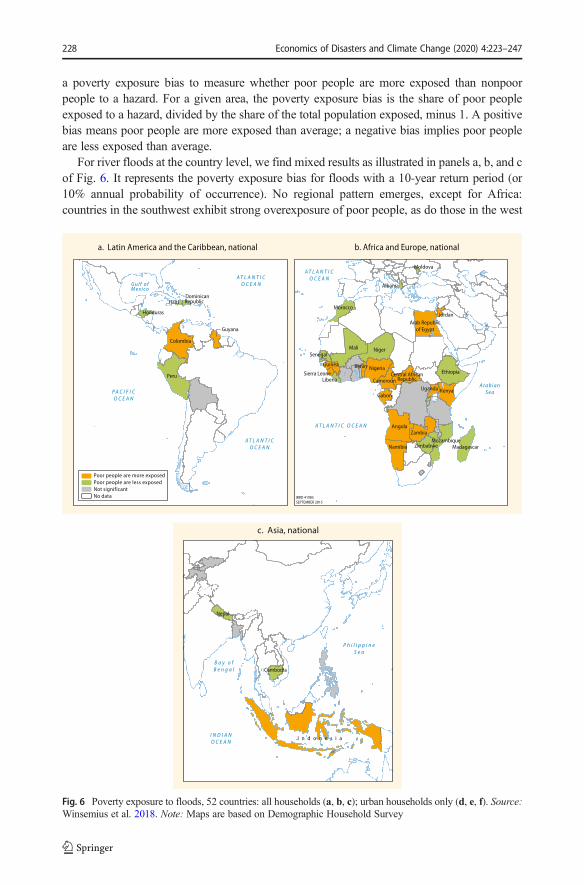
a poverty exposure bias to measure whether poor people are more exposed than nonpoorpeople to a hazard. For a given area, the poverty exposure bias is the share of poor peopleexposed to a hazard, divided by the share of the total population exposed, minus 1. A positivebias means poor people are more exposed than average; a negative bias implies poor peopleare less exposed than average.
For river floods at the country level, we find mixed results as illustrated in panels a, b, and cof Fig. 6. It represents the poverty exposure bias for floods with a 10-year return period (or10% annual probability of occurrence). No regional pattern emerges, except for Africa:countries in the southwest exhibit strong overexposure of poor people, as do those in the west
Fig. 6 Poverty exposure to floods, 52 countries: all households (a, b, c); urban households only (d, e, f). Source:Winsemius et al. 2018. Note: Maps are based on Demographic Household Survey
228 Economics of Disasters and Climate Change (2020) 4:223–247

with larger rivers such as Benin, Cameroon, and Nigeria. About 60% of the population of theanalyzed countries live in countries where poor people are more exposed than average tofloods.
When we focus only on urban households, the results reveal a clear difference between theexposure of poor and nonpoor people, as can be seen in panels d, e, and f of Fig. 6. In mostcountries (about 73% of the analyzed population), poor urban households are more exposed tofloods than the average urban population. There is no such pattern for rural households,suggesting that land scarcity is a driver of flood risk in urban areas.
Fig. 6 (continued)
Economics of Disasters and Climate Change (2020) 4:223–247 229

For drought, the poverty exposure bias is evident: 85% of the analyzed population lives incountries in which poor people are overexposed to drought. In most Asian and African (exceptfor Niger, Tanzania, Malawi and Namibia) countries, poor households are more exposed todrought. In Latin America, poor people appear underexposed in Bolivia and Peru, butoverexposed in Colombia, Guyana, and Honduras.
Finally, people are often more exposed to higher temperatures: 37 out of 52 countries(representing 56% of the population) exhibit a positive bias. Many of these countries arealready hot. Cooler countries exhibit a smaller bias, and in some cool countries a negative biasbecause in these cool countries the nonpoor tend to settle in areas with higher temperatures,which are climatically more desirable. These results suggest a sorting of the population intodesirable and less desirable areas within a country, with wealthier households typically livingin desirable areas and poorer households in less desirable ones.
Recurrent Hazards and Hidden Costs
Large-scale events make the news, but repeated small adverse events such as regular floodsoften have serious implications for poor people. Although poor and nonpoor people maydecide to live in places that are sometimes affected by natural hazards, only poor people live indwellings which are frequently exposed to natural hazards.
For example, recurrent floods in Mumbai, India, during the monsoon season, have signif-icant impacts on poor people (Patankar 2015). A survey of 200 households has yielded twokey insights. First, floods cause problems with transport, drinking water, power supply, andfood and fuel availability. It also has economic consequences because affected households loseworkdays—on average 2.5 a year because of poor infrastructure (more than 50% of surveyedpeople cite the unavailability of transport or flooded roads)—implying a loss of income,productivity, and sometimes jobs. Second, floods cause diarrhea in 40% of households eachyear, malaria in 64%, and viral fever in 86%. Health problems are also observed in MetroManila, the Philippines, because of improper sanitation and lack of potable water and healthsystems. In this city, only a small fraction (13%) of those who were sick were able to obtainfree medicine; all others had to pay out of pocket. On average, households spent 1930 pesos onmedical care, and some households reported spending more than 10,000 pesos (Porio 2011).
Vulnerability Bias: Do Poor People Lose More when Hit by a Disaster?
Exposure is only one component of risk; vulnerability is another. Vulnerability is defined hereas the fraction of wealth lost by people when they are hit by a shock. Do poor people lose morethan the nonpoor as a result of a disaster? To determine the differences in vulnerability, we usethirteen local case studies which have examined exposure to a disaster by poverty status, andfive (in Bangladesh, Honduras, and Mumbai) which have examined the losses of the poor andnonpoor separately (calculated as income losses, asset losses, or both). As they have moreassets and higher incomes, wealthier people lose more from flood or storm in absolute terms.In relative terms, however, poor people always lose more than the nonpoor from floods and storms(Fig. 7).
In Mumbai, for example, the 2005 floods not only caused direct losses of household assetsbut also led to lost income and large expenditures on home repairs or reconstruction (Patankarand Patwardhan 2016). According to a survey of 1168 households, the nonpoor had higher
230 Economics of Disasters and Climate Change (2020) 4:223–247
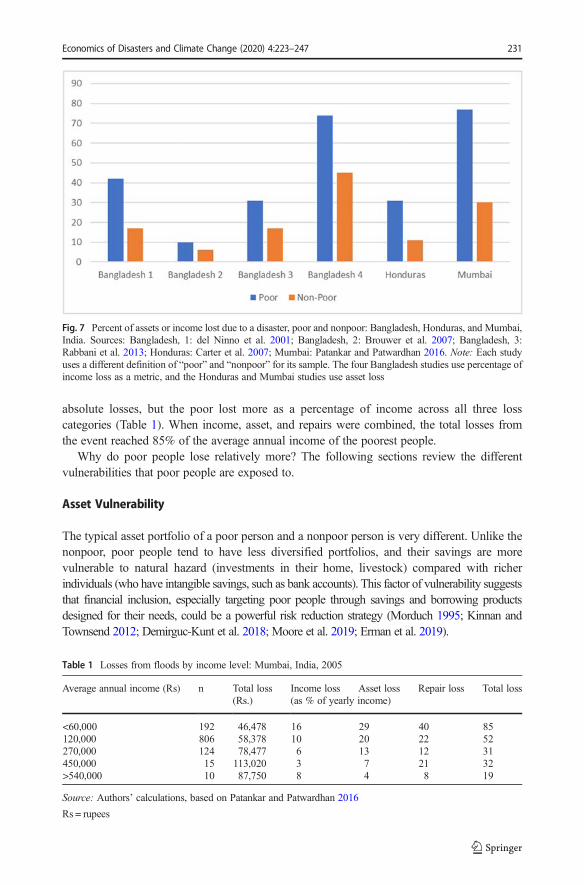
absolute losses, but the poor lost more as a percentage of income across all three losscategories (Table 1). When income, asset, and repairs were combined, the total losses fromthe event reached 85% of the average annual income of the poorest people.
Why do poor people lose relatively more? The following sections review the differentvulnerabilities that poor people are exposed to.
Asset Vulnerability
The typical asset portfolio of a poor person and a nonpoor person is very different. Unlike thenonpoor, poor people tend to have less diversified portfolios, and their savings are morevulnerable to natural hazard (investments in their home, livestock) compared with richerindividuals (who have intangible savings, such as bank accounts). This factor of vulnerability suggeststhat financial inclusion, especially targeting poor people through savings and borrowing productsdesigned for their needs, could be a powerful risk reduction strategy (Morduch 1995; Kinnan andTownsend 2012; Demirguc-Kunt et al. 2018; Moore et al. 2019; Erman et al. 2019).
Table 1 Losses from floods by income level: Mumbai, India, 2005
Average annual income (Rs) n Total loss Income loss Asset loss Repair loss Total loss(Rs.) (as % of yearly income)
<60,000 192 46,478 16 29 40 85120,000 806 58,378 10 20 22 52270,000 124 78,477 6 13 12 31450,000 15 113,020 3 7 21 32>540,000 10 87,750 8 4 8 19
Source: Authors’ calculations, based on Patankar and Patwardhan 2016
Rs = rupees
Fig. 7 Percent of assets or income lost due to a disaster, poor and nonpoor: Bangladesh, Honduras, and Mumbai,India. Sources: Bangladesh, 1: del Ninno et al. 2001; Bangladesh, 2: Brouwer et al. 2007; Bangladesh, 3:Rabbani et al. 2013; Honduras: Carter et al. 2007; Mumbai: Patankar and Patwardhan 2016. Note: Each studyuses a different definition of “poor” and “nonpoor” for its sample. The four Bangladesh studies use percentage ofincome loss as a metric, and the Honduras and Mumbai studies use asset loss
Economics of Disasters and Climate Change (2020) 4:223–247 231

In addition to the portfolio composition effect, the quality of assets owned by poor people islower. An example is housing stock. Households living in slums or informal settlementsconstructed of wood, bamboo, and mud and occupying steep slopes will suffer more damagefrom a natural disaster than households whose homes are made of stone or brick. In coastalcommunities in southwest Bangladesh following Cyclone Aila, 76% of households in kachahouses (traditional homes built of mud and bamboo) reported structural damage—far abovethe 47% for those in pucca houses (built of concrete and wood). In terms of economic damage,the average for kacha houses, $400, was also well above the $133 for pucca ones (Akter andMallick 2013). In Jamaica, Henry et al. (2019) investigate the impact of tropical storms onhousehold consumption and find that only households that live in buildings with less windresistant walls are affected.
Agricultural Income and Ecosystems
Poor people, especially in rural areas without functioning markets, are highly dependent onagricultural income and ecosystems, and they are therefore vulnerable to the impacts of naturaldisasters on yields and the health and functioning of ecosystems. Large-scale events can wreakhavoc on natural capital and threaten these sources of income. This is what happened in 2008when Cyclone Nargis hit southwest Myanmar. It killed 140,000 people and inflicted damageon embankments and streams, making fields more prone to flooding. Moreover, after Nargisthe duration of daily and monthly tides became longer, making fields more saline and prone topest infestation. As a result, yields fell, as did incomes.
On the other hand, natural capital also often serves as a safety net after a disaster when notdepleted (Barbier 2010). In Bangladesh after Cyclone Aila hit in 2009, households livingclosest to the coast, while more exposed and vulnerable to the storm (and poorer), had moreresilient income because the proximity to mangrove reserves offered higher income generationopportunities than those available to inland inhabitants (Akter and Mallick 2013). However,the effects of climate change on these ecosystems may impair their ability to serve as a safetynet and to smooth consumption in the face of shocks (Noack et al. 2015).
In developing countries, livelihood diversification is becoming a crucial part of dealing withnatural hazards. For example, engaging with tourists can serve as a means of livelihooddiversification (Mbaiwa and Sakuze 2009). Crop choice and other forms of agriculturaldiversification are a form of insurance against various agricultural risks for rural households,which have been used in Ethiopia by risk-averse farmers (Mesfin et al. 2011).
This said, the better-off have better opportunities to diversify their livelihood. For example,their greater access to credit and financial capital, or advantages in the labor market providethem with more diversification opportunities (Barrett et al. 2001).
Consumption Patterns and Food Security
Because of the lack of access to markets, isolated communities in rural areas are morevulnerable to the food security consequences of a natural disaster. Indeed, if local productionis lost to a drought or a flood, they cannot rely on production from other areas. Safir et al.(2013) found a 4% decrease in food consumption in areas of the Philippines with lowprecipitation, but this effect disappears in areas close to highways.
Even in well-connected areas, natural disasters can result in food price spikes because ofsupply shocks. Disasters can destroy crops and seed reserves, destroying in turn productive
232 Economics of Disasters and Climate Change (2020) 4:223–247

assets in agricultural communities and sparking food price shocks, as occurred after theunprecedented 2010 floods in Pakistan (Cheema et al. 2015). The floods destroyed 2.1 millionhectares of agricultural land, decimating production and sending the price of wheat up to morethan 50% above the preflood level.
However, poor people are more vulnerable to increases in food prices: in developing countries,that spend on average between 40 and 60% of their household budget on food—far more than the25% spent by the nonpoor (Hallegatte et al. 2015). However, effects are often complex, and thesometimes disasters affect the food basket composition, more than the total calories amount. Forinstance, McCarthy et al. (2018) analyze the impacts of the floods that occurred during the 2014/15growing season inMalawi, and find that while maize yields were lower for all households, drops infood consumption expenditures were less dramatic, and calories per capita were higher. But dietarydiversity was significantly lower, suggesting that households adjust their consumption basket tomaintain total intake at a lower cost (but at the expense of micronutrients).
More generally, poor people are less able to cope with income losses by adjusting theirconsumption basket. They cannot cut back on luxury consumption or delay consumption theway wealthier households can. In many countries they are close to the subsistence level, whichmeans that reducing consumption can have immediate negative impacts on health (if food intake isreduced or medical care becomes unaffordable), education (if children are taken out of school), oreconomic prospects (if essential assets have to be sold) (Karim andNoy 2016). These consumptioncuts have a large impact on immediate well-being, but can also affect human capital through healthor education, creating long-term consequences on income and prospects (see below).
Mitigation Mechanisms: Higher Productivity of Capital and Transfers
All this said, poor people do have sources of resilience. For one thing, as discussed by Hallegatte andVogt-Schilb (2019), physical capital is scarce in many developing countries, and production is morelabor-intensive. The productivity of capital thus tends to be higher in low-income countries.Consequently, with less physical capital to damage, the asset losses from natural disasters are smallerwhen compared with production, and a smaller share of consumption needs to be redirected towardreconstruction. This reduces the impact on well-being and the duration of the reconstruction phase.
Another source of the resilience of poor people is the transfers they receive from govern-ment or family. In most countries, a large share of the income of poor people is composed oftransfers, and especially from social protection (cash transfers, work programs, subsidies,contributory pensions and health insurance, and unemployment compensation). Thus, if theirlabor income is reduced or interrupted by a disaster, the relative effect on total income issmaller, assuming that transfers are unchanged. This pattern is not observed, however, in low-income countries: below $5000 in GDP per capita (PPP-adjusted), the difference in the incomestructure of the poor and nonpoor is small, and the share of income from transfers in thesecountries is very low, usually less than 15%. Therefore, the entire population of these countriesis dependent on labor income, which is vulnerable to natural disasters.
Socioeconomic Resilience: Are Poor People less Able to Cope with andRecover from Disasters?
With less resources, poor people struggle more to cope with and recover from disasters. Poorpeople also tend to be more alone in the struggle to cope and recover: they receive less support
Economics of Disasters and Climate Change (2020) 4:223–247 233
than nonpoor people from financial instruments, social protection schemes, and privateremittances. For example, in response to the flooding and landslides in communities in Nepalin 2011, only 6% of the very poor sought government support, compared with almost 90% ofthe well-off (Gentle et al. 2014).
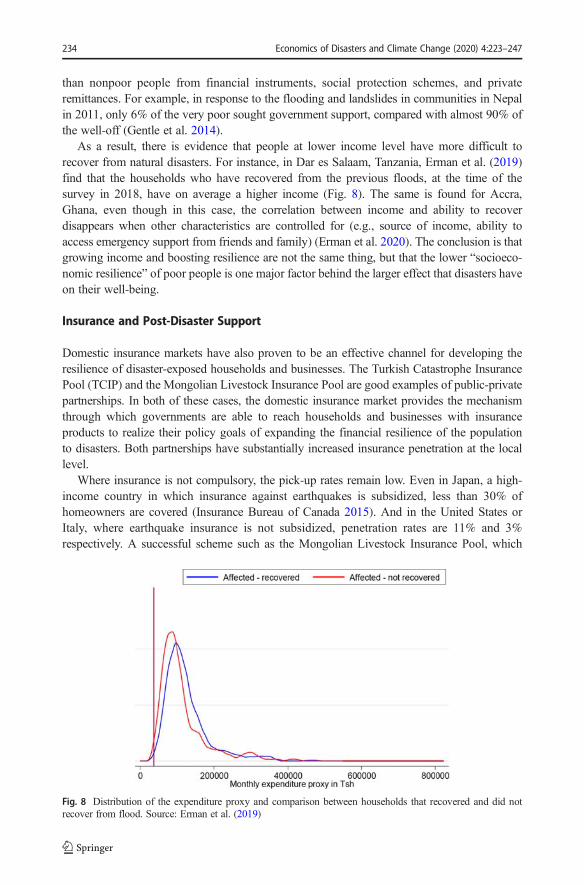
As a result, there is evidence that people at lower income level have more difficult torecover from natural disasters. For instance, in Dar es Salaam, Tanzania, Erman et al. (2019)find that the households who have recovered from the previous floods, at the time of thesurvey in 2018, have on average a higher income (Fig. 8). The same is found for Accra,Ghana, even though in this case, the correlation between income and ability to recoverdisappears when other characteristics are controlled for (e.g., source of income, ability toaccess emergency support from friends and family) (Erman et al. 2020). The conclusion is thatgrowing income and boosting resilience are not the same thing, but that the lower “socioeco-nomic resilience” of poor people is one major factor behind the larger effect that disasters haveon their well-being.
Insurance and Post-Disaster Support
Domestic insurance markets have also proven to be an effective channel for developing theresilience of disaster-exposed households and businesses. The Turkish Catastrophe InsurancePool (TCIP) and the Mongolian Livestock Insurance Pool are good examples of public-privatepartnerships. In both of these cases, the domestic insurance market provides the mechanismthrough which governments are able to reach households and businesses with insuranceproducts to realize their policy goals of expanding the financial resilience of the populationto disasters. Both partnerships have substantially increased insurance penetration at the locallevel.
Where insurance is not compulsory, the pick-up rates remain low. Even in Japan, a high-income country in which insurance against earthquakes is subsidized, less than 30% ofhomeowners are covered (Insurance Bureau of Canada 2015). And in the United States orItaly, where earthquake insurance is not subsidized, penetration rates are 11% and 3%respectively. A successful scheme such as the Mongolian Livestock Insurance Pool, which
Fig. 8 Distribution of the expenditure proxy and comparison between households that recovered and did notrecover from flood. Source: Erman et al. (2019)
234 Economics of Disasters and Climate Change (2020) 4:223–247

covers more than 10,000 herders and was initiated in 2005, still has a relatively low pick-uprate (less than 15% of the herders in the covered areas).
In developing countries, poor people usually have no access to disaster insurance due toaffordability issues, large transaction costs for small portfolios, and weak institutions and lackof trust (Kunreuther et al. 2013). And even in rich countries where disaster insurance isprovided through public-private partnership, the effect of insurance has been found to beregressive (Owen and Noy 2019).
Even when poor households receive support after a disaster, the amounts received are oftentoo small to enable better coping strategies. In Bangladesh following the 1998 Great Flood, thetargeting was relatively good: 66% of households in the bottom quintile received transfers,compared with 33% in the top quintile (del Ninno et al. 2001). However, the transfer amountswere small (only 4% of the total household monthly expenditure for poor households), andpoor households affected by the flood borrowed six to eight times more than this amount of thetransfer.
Post disaster support often fails to provide the poorest with enough resources because oftheir lack of voice and influence. When poor people are excluded from governance and haveno say in the decision-making process, support is unlikely to be provided in a timely andadequate manner. In particular, different categories of the population compete for help after adisaster, and those with better connections are likely to get more, or faster, support. In two casestudies on Thailand, it was found that the majority of government support after a floodbenefited the well-off, with 500 baht per capita (about $14) going to the richest quartile,compared with 200 baht per capita for the poorest quartile (Noy and Patel 2014).
Safety Net Programs
After a shock, when income and wealth are reduced and people’s health is affected, broadsafety net programs may automatically scale up if they are designed to respond to changes inhousehold situations. In the United States, postdisaster support through nondisaster programsis more than five times larger than the dedicated transfers that follow federal disasterdeclarations. Nondisaster transfers per capita in affected counties increase by about $1000(compared with $150 for dedicated postdisaster support). Most of these transfers are fromMedicare (especially disability) and unemployment insurance (Deryugina 2016). Strong socialprograms thus increase people’s resilience even in the absence of explicit disaster-relatedtriggers.
But there are obvious limits to what nondisaster programs can achieve in the aftermath of adisaster. First, budgetary constraints or the design of the programs can make it impossible fortransfers to increase enough or to increase fast enough. This is particularly true in developingcountries with liquidity constraints, where the ability to scale up is limited in the absence of adedicated financial mechanism.
Second, the coverage of social protection programs is limited in developing countries, andthese programs are therefore not always able to support the affected population. Althoughconditional and unconditional cash transfers specifically target poor households and areincreasingly associated with good coverage among households in the bottom quintile, thetwo other types of transfers—social insurance and labor market policies—reach poor andnonpoor households in about the same proportion. This does not necessarily mean that thoseschemes are poorly designed; some programs such as contributory pensions are designed forthose who can afford to contribute.
Economics of Disasters and Climate Change (2020) 4:223–247 235

Moreover, poor people are often excluded from programs that should benefit them.Aldrich (2010) shows that access to post-disaster assistance in India (after the 2004tsunami) was biased away from the most disadvantaged and poorest castes. In Aldrich(2012), the same author argues that generally the poor have less social capital, andtherefore are disadvantaged pre- and post-disaster in multiple dimensions. For example,some programs are tied to formal employment, whereas most poor people work in theinformal economy. Also, poor people in remote rural areas can be difficult to reach.However, the conditional and unconditional cash transfer programs that have revolution-ized social protection over the last decade are easier to deploy in rural areas than in urbanareas because of the challenge of targeting the poor in cities where they often live nextdoor to the wealthier (Gentilini 2015).
Finally, targeting methods used by social assistance programs are often based on data thatare costly and hard to collect. It makes it difficult for these programs to adjust quickly to thechanging conditions of households, as would be needed to prevent the negative copingbehaviors in the aftermath of a disaster such as reduced food intake (Bastagli 2014;Gentilini 2015; Kuriakose et al. 2013).
Domestic and Global Remittances
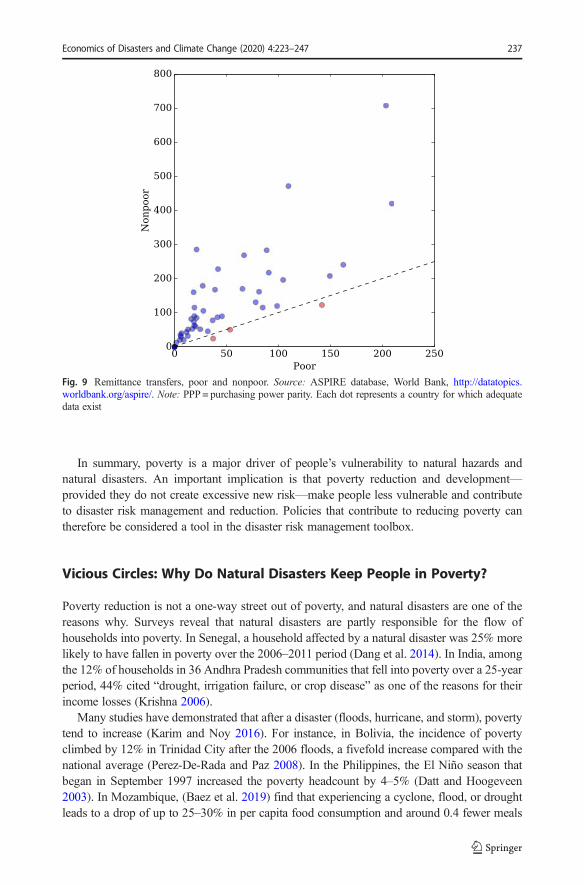
Remittances— that is, the private transfer of money by foreign workers to individuals in theirhome country—were estimated at $584 billion worldwide in 2014. They are a vital resourcefor developing countries and significantly exceed official development assistance. Afternatural, economic, financial, and political shocks, these flows have been found to eitherremain stable or increase (Clarke and Wallsten 2004; Fagen 2006; Mohapatra et al. 2009;World Bank 2015). Thus, they can help smooth consumption and finance recovery andreconstruction. In the Philippines, it was estimated that remittances compensated for nearly65% of lost income after rainfall shocks in 1997 (Yang and Choi 2007). In Indonesia,households that received remittances in the Aceh region recovered faster from the 2004tsunami, despite disruptions in financial services and informal transfer channels (Wu 2006).However, international and domestic remittances tend to benefit the better-off within a country(Fig. 9). For example, Henry et al. (2019) find that in Jamaica, the households that are able topartially buffer the effects of tropical storms on consumption (through savings and remittances)are the ones who live in buildings with more wind-resistant walls.
Conflict-Prone Areas
A weakened capacity to respond to a natural hazard, at whatever the level of government, isone reason natural disasters have worse impacts in an area that is already riddled by conflict.1
Generally, the vulnerability to climate shocks is highest in more fragile and conflict-affectedareas (UNISDR 2009). And because many poor people live in such fragile areas, they usuallyreceive less support when they are hit by a hazard. Indeed, countries in the throes of a violentconflict and governance issues are less likely to successfully support local communities in theirstruggles to cope with the aftermath of natural disasters (IPCC 2012). For example, in Somalia,the government does not have full control of its territory, and so it cannot respond successfullyto natural disasters (Ferris 2010). This determinant of the vulnerability of the poor will becomeincreasingly important: by 2030, almost half of the world’s poor is expected to live in countriesaffected by fragility, conflict, and violence.
236 Economics of Disasters and Climate Change (2020) 4:223–247
In summary, poverty is a major driver of people’s vulnerability to natural hazards andnatural disasters. An important implication is that poverty reduction and development—provided they do not create excessive new risk—make people less vulnerable and contributeto disaster risk management and reduction. Policies that contribute to reducing poverty cantherefore be considered a tool in the disaster risk management toolbox.
Vicious Circles: Why Do Natural Disasters Keep People in Poverty?
Poverty reduction is not a one-way street out of poverty, and natural disasters are one of thereasons why. Surveys reveal that natural disasters are partly responsible for the flow ofhouseholds into poverty. In Senegal, a household affected by a natural disaster was 25% morelikely to have fallen in poverty over the 2006–2011 period (Dang et al. 2014). In India, amongthe 12% of households in 36 Andhra Pradesh communities that fell into poverty over a 25-yearperiod, 44% cited “drought, irrigation failure, or crop disease” as one of the reasons for theirincome losses (Krishna 2006).
Many studies have demonstrated that after a disaster (floods, hurricane, and storm), povertytend to increase (Karim and Noy 2016). For instance, in Bolivia, the incidence of povertyclimbed by 12% in Trinidad City after the 2006 floods, a fivefold increase compared with thenational average (Perez-De-Rada and Paz 2008). In the Philippines, the El Niño season thatbegan in September 1997 increased the poverty headcount by 4–5% (Datt and Hoogeveen2003). In Mozambique, (Baez et al. 2019) find that experiencing a cyclone, flood, or droughtleads to a drop of up to 25–30% in per capita food consumption and around 0.4 fewer meals
Fig. 9 Remittance transfers, poor and nonpoor. Source: ASPIRE database, World Bank, http://datatopics.worldbank.org/aspire/. Note: PPP = purchasing power parity. Each dot represents a country for which adequatedata exist
Economics of Disasters and Climate Change (2020) 4:223–247 237

per day per person. Poverty increased by 12 and 17.5 percentage points in two of the threeevents analyzed.
Beyond the immediate impact after a disaster, evidence suggests that natural disastersincrease poverty over the medium and long term. Glave et al. (2008) studied exposure todisasters and poverty from 2003 to 2008 at the provincial level in Peru. They found that oneextra disaster per year increased poverty rates by 16–23%. In Ecuador, Calero et al. (2008)found that from 1970 to 2007 exposure to drought increased the incidence of poverty by 2%on average. And in Asia, Akter and Mallick (2013) surveyed households in coastal commu-nities affected by Cyclone Aila in 2010 in the southwest of Bangladesh. Unemploymentskyrocketed, from 11% in 2009 to 60% in 2010, and the poverty headcount rate increased from41% before the storm to 63% afterward.
However, the impact of natural disasters on poverty is not homogeneous; it depends onlocal capacity. For instance, in Burkina Faso, Reardon and Taylor (1996) found that droughtconditions in the 1980s increased poverty levels by 17% in the Sahelian zone (poorest climate,least household diversification) and by 3% in the Sudanian zone, but not in the Guinean zone(best climate, most household diversification).
This large and growing body of empirical evidence suggests that household well-being andpoverty status are largely susceptible to natural disasters, at least in the short term. But what arethe drivers of these impacts?
Disasters Impact on Economic Growth
Aggregate economic growth is the main driver of poverty reduction over time (Dollar et al.2013; Dollar and Kraay 2002), and so any impact of disasters on economic growth has directimplications for poverty.
Researchers agree that disasters, especially high-intensity ones, have negative short-term impacts on economic growth (Cavallo and Noy 2009). For example, Felbermayrand Gröschl (2014) find that disasters in the top decile of magnitude result on averagein a 3% reduction in GDP growth. The loss is only 1.5% for disasters in the top 15%of magnitude and 0.8% for disasters in the top 20%. For smaller disasters, they detectno impact. Impacts are also visible at the subnational level. Strobl (2010) has investi-gated the impact of hurricane landfall on county-level economic growth in the UnitedStates. Growth in a county struck by at least one hurricane over a year is reduced onaverage by 0.79 percentage points.
There is little doubt, then, that such short reductions in economic activity, GDP, oreconomic growth have a direct impact on short-term poverty and poverty reduction. Bycontrast, the long-term impacts of natural disasters on growth remain less clear. Althoughearly studies, notably by Albala-Bertrand (1993) and Skidmore and Toya (2002), suggestednatural disasters have a positive influence on long-term economic growth, a few recent studiesfind negative impacts on long-term economic growth.
It is the case of Peter, Dahlen, and Saxena’ study (2012). Using a data set of naturaldisasters from 1960 to 2011, they find that a typical natural disaster causes a drop in long-termeconomic growth of 0.6–1.0% and results in a permanent output loss of two to three times thismagnitude, with higher estimates for larger natural disasters. A recent study by Best and Burke(2019) investigated the impact of the 2010 earthquake on GDP in Haiti. The authors found thateven up to 6 years after the event (the 6 years cut-off was limited by the end of their sampleperiod) losses still amounted to an average of 12% of Haiti’s annual GDP.
238 Economics of Disasters and Climate Change (2020) 4:223–247

Although these studies find long-term impacts, most existing studies find a returnto normal economic conditions after a few years. In a recent meta-analysis using morethan 750 estimates, Klomp and Valckx (2014) confirm that natural disasters appear tohave a negative effect on growth, particularly in developing countries. However, theimpact is in the short term; long-term GDP per capita returns to its original growthpath. Using the same counterfactual methodology as Coffman and Noy (2012) andcomparing across countries and decades, Cavallo et al. (2013) find that naturaldisasters do not have any significant effect on subsequent long-term economic growth.The largest disasters (such as those in the 99th percentile) have some long-termimpacts on growth, but this effect disappears entirely when controlled for politicalchange: the long-term impact occurs only when the disaster is followed by politicalinstability. This result suggests that the secondary impacts of natural disasters throughpolitical instability and conflicts could play a major role in determining their long-term effects. In a recent review, Noy and duPont IV, (2018) argue that sinceeconomies are constantly changing, one cannot compare the economy long after thedisaster to what it was before. The method used by researchers thus have a significantimpact on results, and it is hard to conclude on the presence or absence of long-termimpact.
Disasters Impact on Conflict
In 2013 the Overseas Development Institute (ODI) issued a special report summarizing theliterature on the natural disaster and conflict nexus (Harris et al. 2013). The report concludedthat more often disasters exacerbate existing conflicts because they add to existing grievances,reduce opportunities in the immediate aftermath, and lead to a power vacuum, which may befilled by criminal groups.
The outcome depends on how the authorities react. A natural disaster may give way togrievances that could translate into conflict if they are not addressed properly. An example isthe 1970 typhoon in East Pakistan. The failed response of the central government in WestPakistan contributed to the civil war and the struggle for independence, which eventually led tothe creation of Bangladesh. In this case, popular discontent with the disaster response was thereason the government was overthrown (Bhavani 2006).
The 2004 Indian Ocean tsunami, one of the deadliest natural disasters ever recorded,provides insights into the impacts of a disaster on conflict. The tsunami struck 14 countries.The two worst affected, Indonesia and Sri Lanka, were both in a state of civil war, but had verydifferent responses to the tsunami.
In Aceh, a territory in Indonesia, the natural disaster brought peace to a region that had beenin the throes of a civil war for nearly 30 years. The tsunami crucially contributed to thecessation of violence between the Indonesian army and the Acehnese rebels and to the signingof a peace treaty. The floods made way for a massive humanitarian response and unprece-dented cooperation between the central government and the rebels as they sought a unifiedresponse to the disaster. Jakarta first responded by lifting military emergency law, which pavedthe way for reconstruction.
By contrast, in Sri Lanka, the tsunami may have had the opposite effect. The tsunami’s rolein the ongoing conflict in Sri Lanka is less clear than the one in Aceh. However, the floodsappear to have stoked the flames of war and rekindled violence and armed conflict (Kuhn2009).
Economics of Disasters and Climate Change (2020) 4:223–247 239

Direct Disasters Impact in the Absence of Visible Impacts on GDP
The impact of natural disasters on poverty is not necessarily due to their effect on economicgrowth. Disasters may affect poverty directly in many ways. Even when losses from disastersare small on average, some victims may lose everything during an event, including their healthand, in the case of children, their chances of escaping poverty through education.
Disproportionate Long-Term Impacts
Because poor people suffer disproportionately from natural disasters, these events increaseinequality, making the impacts of disasters highly heterogeneous. The average losses mayunderestimate the effects of large losses on some individuals, especially those who are close tothe subsistence level.
Large losses by some households can have long-term consequences. After Ethiopia’s 1984–85 famine, it took a decade on average for asset-poor households to bring livestock holdingsback to prefamine levels (Dercon 2004). One explanation offered by Carter and Barrett (2006)is that if household assets go below a certain critical value—the Micawber threshold—itbecomes difficult or almost impossible to rebuild the asset stock, and people may end uplocked in poverty traps.
Irreversible Impacts on Health and Education
After intense shocks, poor households may be forced to make choices with detrimental long-term effects, such as withdrawing a child from school or reducing health care expenses. For thepeople experiencing large losses, the possible long-term effects, such as a reduction in foodintake, health effects and disability, and exclusion from job markets, can push households intopoverty traps. In addition, there is evidence that children in utero and young children are themost vulnerable to natural disasters and suffer the most long-lasting negative effects, contrib-uting to the intergenerational transmission of poverty (Caruso 2017).
Impacts on education are prevalent. In Africa, enrollment rates have declined 20% inregions affected by drought (Jensen 2000); drought-affected households have delayed startingchildren in school by 3.7 months on average, and 0.4 fewer grades are completed (Aldermanet al. 2006). Such findings are not restricted to Africa; similar postdisaster impacts on healthand education have been found in Asia, Latin America, and elsewhere (Baez et al. 2010;Maccini and Yang 2009) (Baez et al. 2019; Rush 2018).
Evidence also suggests that disasters have acute impacts on health. Sometimes, the effect isdirect; for instance when floods bring diseases (Yonson 2018; Erman et al. 2019; Noji 2000;Sur et al. 2000). Sometimes, the impact goes through lower postdisaster consumption,especially after a drought. In Sub-Saharan Africa, asset-poor households respond to weathershocks by reducing the quality of the nutrition provided to their children (Alderman et al.2006; Dercon and Porter 2014; Hoddinott 2006; Yamano et al. 2005), a behavior which hasshort- and long-term impacts, particularly for children younger than 2. For example, within thisgroup, the stature of children in these households was permanently lowered by 2–3 cm(Alderman et al. 2006; Dercon and Porter 2014).
In Central America, major disasters have also reduced investments in human capital. InGuatemala, Storm Stan increased the probability of child labor by 7.3% in departments hit bythe storm (Bustelo 2011). Natural disasters also increase the multidimensional poverty index
240 Economics of Disasters and Climate Change (2020) 4:223–247

through a deterioration of “education conditions” and “child and youth conditions,” asdemonstrated by Sanchez and Calderon (2014) for Colombia from 1976 to 2005.
Reduced Incentives to Invest
The losses the poor suffer are not the only way in which disasters and natural risks contributeto ongoing poverty. When people do not have the proper tools to manage natural risk, theytend to spread risk over a large array of lower-risk activities and to reduce their investments,thereby reducing in turn returns to assets and income (Hallegatte et al. 2016b; ODI andGFDRR 2015; World Bank 2013). For example, smallholders plant low-return, low-risk cropsand limit their investment in fertilizers (Cole et al. 2013). Ex ante reductions in investmentsthus account for two-thirds of the difference (the rest stems from the actual destruction ofcapital because of shocks).
Disaster risk reduction can thus generate growth and benefits, beyond avoided losses, bypromoting more investment. The Triple Dividend report refers to this benefit as the “seconddividend of disaster risk reduction” (ODI and GFDRR 2015). (The first dividend is thatdisaster losses can be avoided, and the third dividend refers to co-benefits such as when awater retention area can also be used as a recreation park or a dike is combined with a road.)
Existence of the second dividend is supported by empirical evidence. In Ethiopia, the R4 RuralResilience Initiative (previously HARITA) program is providing risk management support, includ-ingweather-indexed insurance, to small-scale and subsistence farmers. An evaluation of the programhas found that insurance is enabling farmers to increase their savings, which can act as an importantreserve in the case of floods or drought. Moreover, insured farmers increase their investments inproductive assets—in particular, oxen, fertilizer, improved seeds, and compost—thereby improvingtheir overall productivity (Madajewicz et al. 2013).
The second dividend also has implications for future disasters: as countries become richerand better able to afford better protection, they will invest in measures that would prevent themost frequent events (drainage systems, irrigation…). As a result, they will see a reduction inthe frequency of disasters because only higher-intensity hazards will lead to losses. Reducingthe level of risk will also attract additional investment and assets in at-risk areas. However,even though these additional investments are positive and desirable—on average, they increasewell-being—they also increase the consequences of a protection failure (or of an exceptionalevent that exceeds the protection design). Thus countries will experience, and have to beprepared for, rarer but larger disasters (Hallegatte 2017).
How Many People Fall into Poverty every Year Due to Disasters?
Another metric can illustrate the impact of natural disasters: the number of people who arefalling into poverty every year due to natural disasters. In Hallegatte et al. (2016a, b, c), it isestimated that if all disasters could be prevented next year, the number of people in extremepoverty would be immediately reduced by around 26 million (7 million if all the mostoptimistic assumptions are combined, and 77 million if we retain only the most pessimisticassumptions). In the Philippines only, a more precise analysis suggests that almost half amillion Filipinos per year face transient consumption poverty due to natural disasters (Walshand Hallegatte 2020).
As shown in Fig. 10, floods and droughts are responsible for most of the impact on poverty,because of the low-intensity high-frequency events, showing the importance of considering the
Economics of Disasters and Climate Change (2020) 4:223–247 241
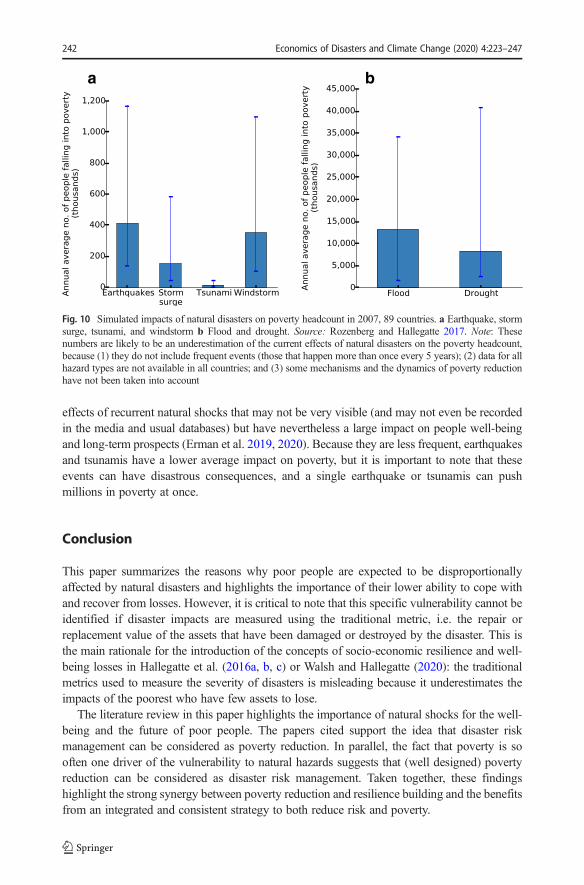
effects of recurrent natural shocks that may not be very visible (and may not even be recordedin the media and usual databases) but have nevertheless a large impact on people well-beingand long-term prospects (Erman et al. 2019, 2020). Because they are less frequent, earthquakesand tsunamis have a lower average impact on poverty, but it is important to note that theseevents can have disastrous consequences, and a single earthquake or tsunamis can pushmillions in poverty at once.
Conclusion
This paper summarizes the reasons why poor people are expected to be disproportionallyaffected by natural disasters and highlights the importance of their lower ability to cope withand recover from losses. However, it is critical to note that this specific vulnerability cannot beidentified if disaster impacts are measured using the traditional metric, i.e. the repair orreplacement value of the assets that have been damaged or destroyed by the disaster. This isthe main rationale for the introduction of the concepts of socio-economic resilience and well-being losses in Hallegatte et al. (2016a, b, c) or Walsh and Hallegatte (2020): the traditionalmetrics used to measure the severity of disasters is misleading because it underestimates theimpacts of the poorest who have few assets to lose.
The literature review in this paper highlights the importance of natural shocks for the well-being and the future of poor people. The papers cited support the idea that disaster riskmanagement can be considered as poverty reduction. In parallel, the fact that poverty is sooften one driver of the vulnerability to natural hazards suggests that (well designed) povertyreduction can be considered as disaster risk management. Taken together, these findingshighlight the strong synergy between poverty reduction and resilience building and the benefitsfrom an integrated and consistent strategy to both reduce risk and poverty.
a b
Fig. 10 Simulated impacts of natural disasters on poverty headcount in 2007, 89 countries. a Earthquake, stormsurge, tsunami, and windstorm b Flood and drought. Source: Rozenberg and Hallegatte 2017. Note: Thesenumbers are likely to be an underestimation of the current effects of natural disasters on the poverty headcount,because (1) they do not include frequent events (those that happen more than once every 5 years); (2) data for allhazard types are not available in all countries; and (3) some mechanisms and the dynamics of poverty reductionhave not been taken into account
242 Economics of Disasters and Climate Change (2020) 4:223–247

The opinions expressed in this article are those of the authors and do not necessarily reflect the views of theWorld Bank Group, its Board of Directors, or the countries they represent.
Open Access This article is licensed under the terms of the Creative Commons Attribution-NonCommercial-NoDerivatives 3.0 IGO License, which permits any non-commercial use, sharing, distribution and reproductionin any medium or format, as long as you give appropriate credit to the World Bank Group and provide a link tothe Creative Commons licence. You do not have permission under this licence to share adapted material derivedfrom this article or parts of it.The use of the World Bank Group’s name, and the use of the World Bank Group’s logo, shall be subject to aseparate written licence agreement between the World Bank Group and the user and is not authorized as part ofthis CC-IGO licence. Note that the link provided below includes additional terms and conditions of the licence.The images or other third party material in this article are included in the article’s Creative Commons licence,unless indicated otherwise in a credit line to the material. If material is not included in the article’s CreativeCommons licence and your intended use is not permitted by statutory regulation or exceeds the permitted use,you will need to obtain permission directly from the copyright holder.To view a copy of this licence, visit http://creativecommons.org/licenses/by-nc-nd/3.0/igo/.
References
Akter S, Mallick B (2013) The poverty–vulnerability–resilience Nexus: evidence from Bangladesh. Ecol Econ96:114–124. https://doi.org/10.1016/j.ecolecon.2013.10.008
Albala-Bertrand JM (1993) Political economy of large natural disasters: with special reference to developingcountries. Clarendon Press and Oxford University Press, New York and Oxford
Alderman H, Hoddinott J, Kinsey B (2006) Long term consequences of early childhood malnutrition. Oxf EconPap 58:450–474. https://doi.org/10.1093/oep/gpl008
Aldrich DP (2010) Separate and unequal: post-tsunami aid distribution in southern India. Soc Sci Q 91(5):1369–1389
Aldrich D (2012) Building resilience. University of Chicago Press, ChicagoBaez J, de la Fuente A, Santos IV (2010) Do natural disasters affect human capital? An assessment based on
existing empirical evidence. Discussion paper no. 5164. IZA, BonnBaez JE, Caruso G, Niu C (2019) Extreme weather and poverty risk: evidence from multiple shocks in
Mozambique. Economics of Disasters and Climate Change. https://doi.org/10.1007/s41885-019-00049-9Baker J, Basu R, Cropper M, Lall SV, Takeuch A (2005) Urban poverty and transport: the case of Mumbai.
Policy research working paper 3693. World Bank, Washington, DCBangalore M, Smith A, Veldkamp T (2019) Exposure to floods, Climate Change, and poverty in Vietnam.
Economics of Disasters and Climate Change 3(1):79–99. https://doi.org/10.1007/s41885-018-0035-4Barbier EB (2010) Poverty, development, and environment. Environ Dev Econ 15:635–660. https://doi.
org/10.1017/S1355770X1000032XBarrett CB, Reardon T, Webb P (2001) Nonfarm income diversification and household livelihood strategies in
rural Africa: concepts, dynamics, and policy implications. Food Policy 26:315–331Bastagli F (2014) Responding to a crisis: the design and delivery of social protection. Overseas Development
Institute, LondonBest R, Burke PJ (2019) Macroeconomic impacts of the 2010 earthquake in Haiti. Empir Econ 56:1647.
https://doi.org/10.1007/s00181-017-1405-4Bhavani R (2006) Natural disaster conflicts. Manuscript. Harvard University, CambridgeBrouwer R, Akter S, Brander L, Haque E (2007) Socioeconomic vulnerability and adaptation to environmental
risk: a case study of climate change and flooding in Bangladesh. Risk Anal 27:313–326Bustelo M (2011) Bearing the burden of natural disasters: child labor and schooling in the aftermath of the
tropical storm Stan in Guatemala. University of Illinois at Urbana-ChampaignCalero C, Maldonado R, Molina A (2008) Relación entre eventos climáticos y geológicos externos y pobreza.
Document prepared for ISDR/RBLAC Research Project on Disaster Risk and PovertyCarter MR, Barrett CB (2006) The economics of poverty traps and persistent poverty: an asset-based approach. J
Dev Stud 42:178–199Carter MR, Little PD, Mogues T, Negatu W (2007) Poverty traps and natural disasters in Ethiopia and Honduras.
World Dev 35:835–856. https://doi.org/10.1016/j.worlddev.2006.09.010Caruso G (2017) The legacy of natural disasters: the intergenerational impact of 100 years of disasters in Latin
America. J Dev Econ 127:209–233
Economics of Disasters and Climate Change (2020) 4:223–247 243
Cavallo EA, Noy I (2009) The economics of natural disasters: a survey. SSRN Electron J. https://doi.org/10.2139/ssrn.1817217
Cavallo E, Galiani S, Noy I, Pantano J (2013) Catastrophic natural disasters and economic growth. Rev Econ Stat95(5):1549–1561
Cheema I, Hunt S, Jakobsen M, Marzi M, O’Leary S, Pellerano L (2015) Citizen’s damage compensationProgramme: impact evaluation report. Oxford Policy Management, Oxford, U.K.
Clarke G, Wallsten S (2004) Do remittances protect households in developing countries against shocks?Evidence from a natural disaster in Jamaica. World Bank, Washington, DC
Coffman M, Noy I (2012) Hurricane Iniki: measuring the long-term economic impact of a natural disaster usingsynthetic control. Environ Dev Econ 17:187–205. https://doi.org/10.1017/S1355770X11000350
Cole S, Gine X, Tobacman J, Topalova P, Townsend R, Vickery J (2013) Barriers to household risk management:evidence from India. Am Econ J Appl Econ 5:104–135. https://doi.org/10.1257/app.5.1.104
Dang HA, Lanjouw PF, Swinkels R (2014) Who remained in poverty, who moved up, and who fell down? Aninvestigation of poverty dynamics in Senegal in the late 2000s. Policy research working paper 7141. WorldBank, Washington, DC
Daniel VE, Florax RJGM, Rietveld P (2009) Flooding risk and housing values: an economic assessment ofenvironmental Hazard. Ecol Econ 69(2):355–365
Datt G, Hoogeveen H (2003) El Niño or El Peso? Crisis, Poverty and Income Distribution in the Philippines.World Development, special issue: “Economic Crises, Natural Disasters, and Poverty.” 31:1103–24.https://doi.org/10.1016/S0305-750X(03)00060-3
del Ninno C, Dorosh PA, Smith LC, Roy DK (2001) The 1998 Floods in Bangladesh: Disaster Impacts,Household Coping Strategies, and Response. Research Report No. 122. International Food PolicyResearch Institute, Washington, DC
Demirguc-Kunt A, Klapper L, Singer D, Ansar S, Hess J (2018) The global Findex database 2017: measuringfinancial inclusion and the Fintech revolution. The World Bank. https://doi.org/10.1596/978-1-4648-1259-0
Dercon S (2004) Growth and shocks: evidence from rural Ethiopia. J Dev Econ 74:309–329Dercon S, Porter C (2014) Live aid revisited: long-term impacts of the 1984 Ethiopian famine on children. J Eur
Econ Assoc 12:927–948. https://doi.org/10.1111/jeea.12088Deryugina T (2016) The fiscal cost of hurricanes: disaster aid versus social insurance. National Bureau of
Economic Research, CambridgeDollar D, Kraay A (2002) Growth is good for the poor. J Econ Growth 7:195–225. https://doi.org/10.1023
/A:1020139631000Dollar D, Kleineberg T, Kraay A (2013) Growth still is good for the poor. Policy research working paper 6568.
World Bank, Washington, DCDurand-Lasserve A, Selod H, Durand-Lasserve M (2013) A systemic analysis of land markets and land
institutions in west African cities: rules and practices—the case of Bamako, Mali. Policy research workingpaper 6687. World Bank, Washington, DC
Erman A, Motte E, Goyal R, Asare A, Takamatsu S, Chen X, Malgioglio S, Skinner A, Yoshida N, Hallegatte S(2020) The road to recovery: the role of poverty in the exposure, vulnerability and resilience to floods inAccra. Economics of Disasters and Climate Change, this issue
Erman A, Tariverdi M, Obolensky M, Hallegatte S (2019) Flooded in Dar Es Salaam – the role of poverty indisaster risk. Policy Research Working Paper 8976. The World Bank
Fagen PW (2006) Remittances in conflict and crises: how remittances sustain livelihoods in war, crises andtransitions to peace. Policy Paper, International Peace Academy, New York, February
Fay, M. 2005. The urban poor in Latin America. Directions in Development–General, World Bank, Washington,DC
Felbermayr G, Gröschl J (2014) Naturally negative: the growth effects of natural disasters. Journal ofDevelopment Economics, special Issue: “Imbalances in Economic Development.” 111:92–106. https://doi.org/10.1016/j.jdeveco.2014.07.004
Ferris E (2010) Natural Disasters, Conflict, and Human Rights: Tracing the Connections. Brookings Institution–University of Bern Project on Internal Displacement, March 3
Fuchs A (2014) Shocks and poverty in Haiti. Presentation at the Poverty and Climate Change in the LatinAmerica and Caribbean Region Workshop, September 14
Gentilini U (2015) Safety nets in urban areas: emerging issues, evidence and practices. In: The state of socialsafety nets. World Bank, Washington, DC, pp 62–72
Gentle P, Thwaites R, Race D, Alexander K (2014) Differential impacts of climate change on communities in themiddle hills region of Nepal. Nat Hazards 74:815–836. https://doi.org/10.1007/s11069-014-1218-0
Glave M, Fort R, Rosemberg C (2008) Disaster risk and poverty in Latin America: the Peruvian case study.Document prepared for the ISDR/RBLAC Research Project on Disaster Risk and Poverty
244 Economics of Disasters and Climate Change (2020) 4:223–247
Hallegatte S (2012) An exploration of the link between development, economic growth, and natural risk. Policyresearch working paper 6216. World Bank, Washington, DC
Hallegatte S (2014) Natural disasters and climate change. Springer International Publishing, BaselHallegatte S (2017) A normative exploration of the link between development, economic growth, and natural
risk. Economics of Disasters and Climate Change 1(1):5–31. https://doi.org/10.1007/s41885-017-0006-1Hallegatte S, Vogt-Schilb A (2019) Are losses from natural disasters more than just asset losses?: the role of
capital aggregation, sector interactions, and investment behaviors. In: Advances in Spatial Science, 15–42.Springer International Publishing. https://doi.org/10.1007/978-3-030-16237-5_2
Hallegatte S, Bangalore M, Nkoka FS (2015) Recent floods in Malawi hit the poorest areas: what this implies.Voices—Perspectives on Development http://blogs.worldbank.org/voices/recent-floods-malawi-hit-poorest-areas-what-implies
Hallegatte S, Vogt-Schilb A, Bangalore M, Rozenberg J (2016a) Unbreakable: building the resilience of the poorin the face of natural disasters. The World Bank. https://doi.org/10.1596/978-1-4648-1003-9
Hallegatte S, Bangalore M, Bonzanigo L, Fay M, Kane T, Narloch U, Rozenberg J et al (2016b) Shock waves:managing the impacts of climate change on poverty. Climate change and development series. World Bank,Washington, DC
Hallegatte S, Bangalore M, Jouanjean MA (2016c) Higher losses and slower development in the absence ofdisaster risk management investments. Policy research working paper 7632. World Bank, Washington, DC
Hallegatte S, Fay M, Barbier EB (2018) Poverty and climate change: introduction. Environ Dev Econ 23(3):217–233
Harris K, Keen D, Mitchell T (2013) When disasters and conflicts collide: improving links between disasterresilience and conflict prevention. Overseas Development Institute (ODI), London
Henry M, Spencer N, Strobl E (2019) The impact of tropical storms on households: evidence from Panel data onconsumption. Oxf Bull Econ Stat 82:1–22. https://doi.org/10.1111/obes.12328
Hoddinott J (2006) Shocks and their consequences across and within households in rural Zimbabwe. J Dev Stud42:301–321
Insurance Bureau of Canada (2015) The financial management of flood risk. An International Review: LessonsLearnt from Flood Management Programs in G8 Countries. Toronto
IPCC (Intergovernmental Panel on Climate Change) (2012) Special report on managing the risks of extremeevents and disasters to advance Climate Change adaptation: summary for policymakers: a report of workinggroups I and II of the IPCC. Geneva
Jensen R (2000) Agricultural volatility and Investments in Children. Am Econ Rev 90:399–404. https://doi.org/10.1257/aer.90.2.399
Karim A, Noy I (2016) Poverty and natural disasters: a regression meta-analysis. Review of Economics andInstitutions 7(2):26
Kinnan C, Townsend R (2012) Kinship and financial networks, formal financial access, and risk reduction. AmEcon Rev 102(3):289–293. https://doi.org/10.1257/aer.102.3.289
Klomp J, Valckx K (2014) Natural disasters and economic growth: a meta-analysis. Glob Environ Chang 26:183–195
Krishna A (2006) Pathways out of and into poverty in 36 villages of Andhra Pradesh, India. World Development,part special issue: “Corruption and Development: Analysis and Measurement.” 34:271–88. https://doi.org/10.1016/j.worlddev.2005.08.003
Kuhn R (2009) Tsunami and conflict in Sri Lanka. Background paper for the Joint World Bank–UN Project onthe Economics of Disaster Risk Reduction, Washington DC
Kunreuther H, Pauly S, McMorrow S (2013) Insurance and behavioral economics: improving decisions in themost misunderstood industry. Cambridge University Press, New York
Kuriakose AT, Heltberg R, Wiseman W, Costella C, Cipryk R, Cornelius S (2013) Climate-responsive socialprotection. Dev Policy Rev 31:o19–o34. https://doi.org/10.1111/dpr.12037
Maccini S, Yang D (2009) Under the weather: health, schooling, and economic consequences of early-liferainfall. Am Econ Rev 99:1006–1026. https://doi.org/10.1257/aer.99.3.1006
Madajewicz M, Tsegay AH, Norton M (2013) Managing risks to agricultural livelihoods: impact evaluation ofthe Harita program in Tigray, Ethiopia, 2009–2012. Oxfam, London
Mbaiwa JE, Sakuze LK (2009) Cultural tourism and livelihood diversification: the case of Gcwihaba caves andXaiXai Village in the Okavango Delta, Botswana. J Tour Cult Chang 7(1):61–75
McCarthy N, Kilic T, de la Fuente A, Brubaker JM (2018) Shelter from the storm? Household-level impacts of,and responses to, the 2015 floods in Malawi. Economics of Disasters and Climate Change 2(3):237–258.https://doi.org/10.1007/s41885-018-0030-9
Mesfin W, Fufa B, Haji J (2011) Pattern, trend and determinants of crop diversification: empirical evidence fromsmallholders in eastern Ethiopia. Journal of Economics and Sustainable Development 2(8):78–89
Economics of Disasters and Climate Change (2020) 4:223–247 245

Mohapatra S, Joseph G, Ratha D (2009) Remittances and natural disasters: ex-post response and contribution toex-ante preparedness. Policy research working paper 4972. World Bank, Washington, DC
Moore D, Niazi Z, Rouse R, Kramer B (2019) Building resilience through financial inclusion: a review ofexisting evidence and knowledge gaps. www.poverty-action.org
Morduch J (1995) Income smoothing and consumption smoothing. J Econ Perspect 9(3):103–114. https://doi.org/10.1257/jep.9.3.103
Narloch UG, Bangalore M (2016) Environmental risks and poverty: analyzing geo-spatial and household datafrom Vietnam. Policy research working paper 7763. World Bank, Washington, DC
Nguyen van K (2011) Building livelihood resilience in changing climate. Paper presented at Asia RegionalConference, Kuala Lumpur, Malaysia
Noack F, Wunder S, Angelsen A, Boerner J (2015) Responses to weather and Climate: a cross-section analysis ofrural incomes. Policy research working paper 7478. World Bank, Washington, DC
Noji EK (2000) The public health consequences of disasters. Prehosp Disaster Med 15(4):147–157. https://doi.org/10.1017/s1049023x00025255
Noy I, Patel P (2014) Floods and Spillovers: Households after the 2011 Great Flood in Thailand. Working PaperSeries No. 3609, School of Economics and Finance, Victoria University of Wellington
Noy I, W. duPont IV. (2018) The long-term consequences of disasters: what do we know, and what we still Don't.Int Rev Environ Resour Econ 12(4):325–354. https://doi.org/10.1561/101.00000104
ODI (Overseas Development Institute) and GFDRR (Global Facility for Disaster Reduction and Recovery)(2015) Unlocking the triple dividend of resilience—why investing in DRM pays off. http://www.odi.org/tripledividend
Opondo DO (2013) Erosive coping after the 2011 floods in Kenya. Int J Global Warm 5:452–466. https://doi.org/10.1504/IJGW.2013.057285
Owen S, Noy I (2019) Regressivity in public natural Hazard insurance: a quantitative analysis of the NewZealand case. Economics of Disasters and Climate Change 3(3):235–255. https://doi.org/10.1007/s41885-019-00043-1
Park J, Hallegatte S, Bangalore M, Sandhoefner E (2015) The deck is stacked (and hot)? Climate Change, laborproductivity, and developing countries. Policy research working paper 7479. World Bank, Washington, DC
Patankar A (2015) The exposure, vulnerability and adaptive capacity of households to floods in Mumbai. Policyresearch working paper 7481. World Bank, Washington, DC
Patankar A, Patwardhan A (2016) Estimating the uninsured losses due to extreme weather events and implica-tions for informal sector vulnerability: a case study of Mumbai, India. Nat Hazards 80(1):285–310.https://doi.org/10.1007/s11069-015-1968-3
Pelling M (1997) What determines vulnerability to floods: a case study in Georgetown, Guyana. Int J EnvironProbl 9:203–226
Perez-De-Rada E, Paz D (2008) Análisis de la relación entre amenazas naturales y condiciones de vida: El Casode Bolivia. ISDR/RBLAC Research Project on Disaster Risk and Poverty
Porio E (2011) Vulnerability, adaptation, and resilience to floods and climate change-related risks amongmarginal, riverine communities in metro Manila. Asian J Soc Sci 39(4):425–445
Rabbani G, Rahman SH, Faulkner L (2013) Impacts of climatic hazards on the small wetland ecosystems(ponds): evidence from some selected areas of coastal Bangladesh. Sustainability 5:1510–1521. https://doi.org/10.3390/su5041510
Ranger N, Hallegatte S, Bhattacharya S, BachuM, Priya S, Dhore K, Rafique F et al (2011) An assessment of thepotential impact of climate change on flood risk in Mumbai. Climate Change 104:139–167
Reardon T, Taylor JE (1996) Agroclimatic shock, income inequality, and poverty: evidence from Burkina Faso.World Dev 24:901–914. https://doi.org/10.1016/0305-750X(96)00009-5
Rozenberg J, Hallegatte S (2017) Model and methods for estimating the number of people living in extremepoverty because of the direct impacts of natural disasters. Policy Research Working Paper. World Bank,Washington, DC
Rush JV (2018) The impact of natural disasters on education in Indonesia. Economics of Disasters and ClimateChange 2(2):137–158. https://doi.org/10.1007/s41885-017-0022-1
Safir A, Piza SFA, Skoufias E (2013) Disquiet on the weather front: the welfare impacts of climatic variability inthe rural Philippines. Policy Research Working Paper. World Bank, Washington, DC
Sanchez F, Calderon S (2014) Natural Disasters and Multidimensional Poverty in Colombia. Paper presented atthe Workshop on Climate Change and Poverty in the Latin America Region. World Bank, Washington, DC
Scussolini P, Aerts J, Jongman B, Bouwer L, Winsemius HC, de Moel H, Ward PJ (2016) FLOPROS: anevolving global database of flood protection standards. Nat Hazards Earth Syst Sci 16(5):1049–1061.https://doi.org/10.5194/nhess-16-1049-2016
Skidmore M, Toya H (2002) Do natural disasters promote long-run growth? Econ Inq 40:664–687
246 Economics of Disasters and Climate Change (2020) 4:223–247
Strobl E (2010) The economic growth impact of hurricanes: evidence from U.S. coastal counties. Rev Econ Stat93:575–589. https://doi.org/10.1162/REST_a_00082
Sur D, Dutta P, Nair GB, Bhattacharya SK (2000) Severe cholera outbreak following floods in a northern districtof west Bengal. Indian J Med Res 112(NOV.):178–182
Tesliuc E, Lindert K (2003) Vulnerability: a quantitative and qualitative assessment. Working paper 36209.World Bank, Washington, DC
UNISDR (United Nations Office for Disaster Risk Reduction) (2009) United Nations global assessment report ondisaster risk reduction. UNISDR, Geneva
Peter G von, von Dahlen S, Saxena SC (2012) Unmitigated Disasters? New Evidence on the MacroeconomicCost of Natural Catastrophes. BIS Working Paper No. 394, Bank for International Settlements, Basel,Switzerland
Walsh B, Hallegatte S (2020) Measuring natural risks in the Philippines: socioeconomic resilience and wellbeinglosses. Economics of Disasters and Climate Change. https://doi.org/10.1007/s41885-019-00047-x
Winsemius HC, Jongman B, Veldkamp TIE, Hallegatte S, Bangalore M, Ward PJ (2018) Disaster risk, climatechange, and poverty: assessing the global exposure of poor people to floods and droughts. Environment andDevelopment Economics, March, 1–21. https://doi.org/10.1017/S1355770X17000444
Wodon Q, Liverani A, Joseph G, Bougnoux N (2014) Climate Change and migration: evidence from the MiddleEast and North Africa. World Bank, Washington, DC
World Bank (2013) World development report 2014: risk and opportunity—managing risk for development.World Bank, Washington, DC
World Bank (2015) Can remittances help promote consumption stability? (global economic prospects). WorldBank, Washington, DC
Wu T (2006) The role of remittances in crisis: an Aceh research study. Overseas Development Institute, LondonYamano T, Alderman H, Christiaensen L (2005) Child growth, shocks, and food aid in rural Ethiopia. Am J Agric
Econ 87:273–288. https://doi.org/10.1111/j.1467-8276.2005.00721.xYang D, Choi H (2007) Are remittances insurance? Evidence from rainfall shocks in the Philippines. World Bank
Econ Rev 21:219–248Yonson R (2018) Floods and pestilence: diseases in Philippine urban areas. Economics of Disasters and Climate
Change 2(2):107–135. https://doi.org/10.1007/s41885-017-0021-2
Publisher’s Note Springer Nature remains neutral with regard to jurisdictional claims in published maps andinstitutional affiliations.
Economics of Disasters and Climate Change (2020) 4:223–247 247