Embed Size (px)
Citation preview

1
Homeowners and Poverty: A Literature Review
A report for the Joseph Rowntree Foundation Alison Wallace July 2016 The Joseph Rowntree Foundation (JRF) commissioned this paper to contribute ideas for its Housing and Poverty Programme, specifically to inform a project examining homeowners and poverty. This paper examines:
The interactions between poverty and homeownership
The extent of poverty among homeowners
The characteristics of homeowners who experience poverty
The potential and limits of homeownership for low-income homeowners, and
The sustainability of homeownership.

2
Foreword The Joseph Rowntree Foundation commissioned this paper to inform a research project
examining homeownership and poverty.
The overall aims of this research project are to consider the circumstances of low-income
homeowners and the impacts of various issues on new and existing low-income homeowners in
the near future. Cross-sectional and longitudinal analysis will be undertaken using the British
Household Panel Survey/ Understanding Society data sets, supplemented with a suite of
stakeholder interviews. This literature review will contribute to the analysis.
The project is part of an overarching Joseph Rowntree Foundation Housing and Poverty
Programme, which examines the role housing plays in the lives of people experiencing poverty,
as there has been relatively little evidence on how housing affects experience of poverty or of
how housing can act as a potential route into or out of poverty. Interim findings from this wider
programme can be found here. This Programme will in turn form part of the Foundation’s
commitment to developing an evidence-based UK anti-poverty strategy for all ages.
The Homeowners and Poverty research report will be published early 2017.

3
Contents
Foreword 2
Contents 3
Summary 4
Introduction 5
Theorising the Relationship Between Housing, Homeownership And Poverty 7
The Extent of Poverty And Homeownership 9
Characteristics of Homeowners Who Experience Poverty 14
The Potential of Homeownership For Poor Households 25
Sustaining Homeownership 28
Future Trends 33
Conclusion 35
References 35

4
Summary
This paper addresses the relationship between homeownership, low-incomes and
poverty and examines both the tenures’ potential, and its limits. Homeownership is
often assumed to have universal benefits but there are indications that it is
experienced unevenly due to socio-demographic or spatial differences. In aggregate,
homeowners have better outcomes than renters but as the tenure is far larger than
social or private renting, a diverse range of experiences are masked.
● During 2013/ 2014, half of all poor households were in homeownership rather than
renting. Taking housing costs into account, minimal housing costs for outright owners
reduce the proportion of households in poverty in homeownership to around a third.
● Long term homeowners have more frequent spells of poverty but poverty for renters is
a more enduring experience and associated with greater material deprivation.
● Households fall out of homeownership for similar reasons to entering poverty, and are
most at risk in the earlier years of ownership, due to labour market problems,
relationship breakdown, indebtedness, and lower incomes.
● Homeownership has the highest incidence of poor housing conditions due to its size,
associated with low-incomes and ageing.
● Although rising base rates remain uncertain in the near future, homeowners overall are
better prepared for a rate rise. There are, however, indications that a significant pool of
lower income homeowners are, however, encumbered with unsecured debt and are
vulnerable to further income or economic shocks.
● Homeownership is being bolstered with a range of government schemes while the
sustainability of the sector is simultaneously being undermined. Reforms to safety-nets
(i.e. Support for Mortgage Interest and Universal Credit) weaken the lenders’ ability to
forbear if borrowers struggle with mortgage payments.
● Housing wealth is the most evenly distributed form of investment across the
population, but accrues unevenly, to those with higher incomes and in certain
locations.
● For some homeowners, drawing on housing equity may be a cost-effective buffer to
smooth incomes, but for lower-income owners is associated with higher risks of
repossession and undermines the qualities they value in homeownership.
● The spatial and socio-demographic differences in homeowners’ circumstances render
attempts at welfare improvements arising from the use of housing equity untenable.
● Future research should disaggregate housing tenure to identify the circumstances in
which the benefits of homeownership are achieved and those for whom
homeownership represents an inappropriate risk.

5
Introduction Why discuss poverty and homeownership when compared to social and private renters
homeowners are, on average, better off? Homeownership is the ‘hitherto unquestioned
centrepiece of housing systems’ (Wood et al., 2015, p.1). Consequently, popular
discussion associates the tenure with affluence and a range of universal social and
economic benefits, but there are misconceptions around the tenure. The size of
homeownership compared to other housing tenures masks the incidence of homeowners
with low-incomes and poor housing conditions who have limited support. While
homeownership has also been a mechanism to accumulate assets these benefits flow
unevenly along spatial and socio-economic lines. This paper addresses the relationship
between homeownership, low-incomes and poverty and examines both the tenures’
potential, and its limits. It forms part of a wider project examining the circumstances of
contemporary homeowners on low-incomes and contributes to the Joseph Rowntree
Foundation’s Housing and Poverty Programme.
In the UK, homeowners in general enjoy lower rates of overcrowding, enjoy higher space
standards, are more likely to be in employment, have greater assets and wealth and higher
incomes than renters (DCLG, 2016). But as the homeownership sector matured and expanded
its reach, the tenure encompassed a greater range of households. The experience of
homeownership has not, therefore, been uniform and studies found that ‘half the poor’ were in
fact homeowners (Burrows, 2003; Burrows & Wilcox, 2001). Although previous research
highlighted this stratification of the tenure (Forrest et al., 1990; Ford & Wilcox, 1994), in rising
markets after the millennium, arguably the focus of this work shifted elsewhere. Concerns about
divergent experience remained but arguments became about insider and outsider cleavages,
and rising inequality as renters were unable to accumulate housing equity (Stephens, 2011;
Thomas & Dorling, 2004). Interestingly, the early housing classifications of Rex and Moore
(1967, in (Munro, 2007)) did not treat homeowner experiences as homogenous, but
differentiated between outright owners and owners buying with a mortgage, deemed to be the
most desirable housing tenures, and owners who had bought with short term loans and had to
rent rooms to meet repayments, considered to be near the bottom in terms of desirability of their
six classifications. Murie and Williams (2015) call for analysis to shift away from using housing
tenure as an analytic lens to look at social and spatial variations in housing as differences within
tenure can be more profound than differences between. Housing and labour markets are not
unitary markets and prices and opportunities move at different rates in different locations
distributing risk and reward unevenly (Malpass, 2008). This review will, therefore, inform an
unbundling of the homeownership tenure and examine divergent experiences within.
Why is exploring the differential and poverty experiences of homeowners of interest now? The
financial crisis of 2007-8 amplified trends of constrained entry to the tenure due to a disconnect
between earnings and house prices, not aided by a more prudent mortgage market (Policis,
2010). The proportion of households in homeownership peaked around 2003 when 71 percent
of households were owners, but by 2014/15 the proportion had reduced to 64 percent. The
sector has aged due to fewer younger new entrants, with outright owners representing a larger
6
proportion of households (33 percent) compared to mortgaged homeowners (30 percent)
(DCLG, 2016)1 . Government policy responses have expanded support to first time buyers to
halt the recent decline of homeownership, including measures to support demand using the
Help to Buy branded affordable homeownership schemes (including equity loans, mortgage
guarantees, matched savings schemes and an expanded shared ownership offer), enhanced
discounts via Starter Homes and the Right to Buy extended to housing associations; and thus
largely indirectly, bolster the supply of new homes, with the ambition that this will also exert
downward pressure on house prices (DCLG, 2011; Finlay et al., 2016). New push-factors may
also influence the demand for homeownership from social housing tenants as the Housing and
Planning Act 2016 will further limit long-term tenancies and institute a ‘pay-to-stay’ policy to
move towards market rents for those households with incomes over £30,000 outside London
and £40,000 in London (Shelter, 2016). Additionally, there are increased pressures on
registered providers to supply homes to the low cost homeownership market to cross-subsidise
other social housing activities. There are concerns that this emphasis on homeownership is
misplaced and that greater tenure neutrality is required in housing policy, not least to deliver the
new supply of homes required (Lyons, 2016).
Policy shifts towards greater (low- to middle-income) homeownership occur simultaneously with
moves that undermine the support to existing homeowners who face income shocks. Although
the payment risks associated with homeownership occur across the income spectrum, there is a
social gradient to those who bear the greatest burden (DCLG, 2015). A range of policy
measures weaken the already limited safety nets available to homeowners who suffer payment
problems and increase the likelihood that people will fall out of ownership (Wilcox & Pawson,
2012; Ford et al., 2011) .
Awareness or acknowledgement of low-income homeownership has subsided. Previous policy
support for homeownership was premised on a mass tenure, a ‘property owning democracy’,
but is now associated with a more individualised wealth creating mechanism (Murie & Williams,
2015; Malpass, 2008). The social justice narrative of allowing lower and middle income
households to build assets and foster self-reliance as more affluent households emerged under
New Labour (Malpass, 2008; ODPM, 2005), has arguably been replaced simply by rhetoric
around meeting assumed universal aspiration to the tenure without claims for social policy
outcomes being articulated. But O’Sullivan and Gibb (2012) ask if aspiration is a sufficient basis
for public policy and proposes that homeownership is subjected to similar evaluation as other
policy instruments. Not least if it is the case that the benefits claimed fail to reach all
households. Burrows (2003) previously studied the relationship between homeowners and
poverty for the Joseph Rowntree Foundation using data collected during 1999. Since then,
tumultuous events have occurred in respect of the housing markets, mortgage markets and the
economy, changing the context in which we consider the experiences of and risks marginal
homeowners face.
This paper therefore aims to highlight existing knowledge about the relationship between
homeowners and poverty, the diversity of homeownership experiences and what the potential is
1 Due to rounding these figures do not total the proportion of all households in homeownership.

7
for homeownership to support poor households The following section discusses the broad
relationships between housing, homeownership and poverty; the next section examines the
extent of homeowners in poverty; the characteristics of poor homeowners is then explored;
followed by sections on the potential of homeownership for low-income households and the
existing evidence relating to the sustainability of the tenure for low-income households. A brief
note of changing trends is introduced before the concluding remarks.
Theorising the relationship between housing, homeownership and poverty The relationship between housing and poverty is underdeveloped and more attention should be
afforded to the impact of housing on material living conditions (Tunstall et al., 2013; McInnes et
al., 2014). This is notably due to little overlap between those who study poverty, inequality,
welfare regimes and housing systems (Stephens & van Steen, 2011).
The housing consequences of poverty are not necessarily universal and may be mediated by
interactions between local labour markets, the mortgage market, the shape and characteristics
of local housing markets as well as the welfare system. These factors combine to influence the
extent of and risks associated with homeownership across different countries (Wilcox et al.,
2010; Ford & Wallace, 2012). For example, Schelkle (2012) noted that despite greater credit
bubbles in the UK - and France – it was the US that saw the biggest fallout from the financial
crisis as social policies, conducted through state mechanisms or via private market regulation,
shaped the outcomes observed. Furthermore, a developed literature addresses the links
between low welfare regimes and homeownership, associating low housing costs for
homeowners in later life with the capacity to withstand less generous pension arrangements
(Kemeny, 2005; de Wilde and Raeymaeckers, 2008), identifies how the mortgage market
interact with welfare systems (Schwartz & Seabrooke, 2008) and how homeownership is
associated with a shift of responsibilities from collective welfare to individual self-insurance
(Doling & Ronald, 2010). Generally speaking, people in poverty and with low wealth have fewer
housing options available to them and less capacity to sustain any housing obtained (Tunstall et
al., 2013). However, other social policy interventions such as the provision of housing benefit
and social housing in the UK has historically has broken the association between poor housing
conditions and poverty seen in other EU countries (Bradshaw et al., 2008; Stephens and van
Steen, 2011). Indeed, across Europe, de Wilde and Raeymaeckers (2008) identify
homeownership as a poverty reducing measure, although not to the same extent as social
housing.
Measurements of poverty are disputed, but are largely based on household incomes relative to
others, not least as material deprivation is associated with low-incomes. A poverty threshold at
or below 60 percent of median household income is commonly adopted and can therefore be
used comparatively (DWP, 2015). As this measure shifts with median income, meaning that a
reduction in median income saw an associated reduction in poverty during the recession, there

8
were calls for alternative measures. An absolute measure of poverty was determined using the
60 percent or below median income during 2010/11 so offering a fixed point from which to
compare trends. Interestingly, the relative and absolute measures have diverged little since
2010/11 due to their being little upward movement in earnings since that time (ibid.). Other
poverty measures reflect material deprivation (McInnes et al., 2014), and/or the capacity of a
household to enjoy a publicly defined minimum acceptable living standard (Hirsch, 2015).
Typically, measures of poverty are taken before housing costs are deducted from income (BHC)
rather than after housing costs (AHC), and recent attention has highlighted how incorporating
housing costs into poverty estimates is associated with increased poverty rates, notably in the
private rented sector (McInnes et al., 2014).
But the calculation of housing costs are also subject to dispute which means that housing costs
for homeowners may be underestimated (Stephens et al., 2014; Tunstall et al., 2013; Burrows &
Wilcox, 2004). A note of caution may be made that high housing costs may also reflect choices
made for higher quality, higher space standards or more desirable locations, and lower costs
may reflect trade-offs in respect of these factors so using AHC and BHC is not perfect
(Stephens & van Steen, 2011). Nevertheless, the AHC measure represents a simple indicator of
the impact of housing expenditure on household incomes. There are, however, concerns about
how housing costs and income are determined. Typically, the Households Below Average
Income data uses ground rent and mortgage interest payments only, not the repayments
associated with the loan principal, to calculate housing costs for homeowners (DWP, 2015). But
renters also have their repairs, building insurance costs and service charges incorporated into
housing costs, suggesting that the AHC calculations for homeowners who pay for these
separately, are further underestimated (Stephens et al., 2014). Conversely, in addition to
housing costs there may also be housing income, rental income from letting rooms, for example,
but critically imputed rental income from homeownership is usually omitted2; although imputed
rental income from sub-market rents found in social housing is also omitted (Searle & Köppe,
2014; Tunstall et al., 2013). As well as having a use value, in that occupiers obtain housing
services from an owned property, homeowners’ property also has an asset value, unlike a
rented home, and can accumulate wealth, due to paying down a mortgage - enforced saving
(Searle & Köppe, 2014) - or by capital gains due to rising markets. The use of housing equity to
overcome poverty is discussed below, but suffice to note that rarely is this potential incorporated
into assessments of household resources (Stephens et al., 2014).
Other indicators of the impact of housing costs on household income adopt affordability
thresholds based on household income to housing costs ratios (Bramley, 2011). This approach
to determining affordability of housing is problematic. The thresholds imply that households who
pay above the threshold for their housing have a problem that policy must address (Whitehead,
1991). However, high earners that pay a high proportion of their income on housing costs are
likely to still have a reasonable sum remaining, a residual income, on which to have an
acceptable living standard (Stone, 2006). In contrast, a high proportion of a low earners’
income spent on housing costs is more likely to induce financial distress. Bramley (2011)
2 Imputed rental income is the assumed benefit in kind obtained by homeowners paying low housing
costs below market rates. Until 1963 homeowners’ imputed rental income was subject to taxation.

9
acknowledged the debate about measuring affordability and finds composite measures using
ratios and subjective payment problems are preferable, but adopting the traditional ‘rule of
thumb’ of a single threshold measure of 25 percent household income to housing cost ratio is
justified. Operational affordability thresholds have, notably, risen above this threshold over time
as housing has become less affordable. Stone (2006) notes that appropriate thresholds were
considered to be 20 percent in the 1980s and 30 percent in the 1990s in the US. In the UK,
normative affordability thresholds have been further stretched upwards. The Homes and
Communities Agency, for example, currently assumes household debt to income ratio for
affordable homeownership programmes must lie between a 30 and 45 percent based on
multiples of 2.5 to 4.5 times household income for mortgage lending purposes (HCA, n.d.). The
impact of increasing mortgage debt burden on household poverty rates is, however, under-
explored.
There are also arguments about whether attributes of housing and/or homeownership can help
or hinder moves into and out of poverty, whether different work incentives or propensities to
move towards more buoyant labour markets exist between different housing tenure (Morton,
2010; Ford et al., 1996; Fletcher, 2009). A long standing hypothesis has been that homeowners
are less mobile and that the tenure can therefore increase unemployment (Oswald, 1999). But
several studies have found that homeowners do move towards employment opportunities.
Higher wage growth and expected capital gains can offset constraints imposed by higher house
prices in more buoyant labour markets and homeowners move to contiguous areas and
commute to new employment opportunities (Murphy et al., 2006; Cameron & Muellbauer, 1998;
Battu et al., 2008). Whether spatially divergent housing markets after the financial crisis mean
such results still hold is unclear, however. Gibb et al. (2016) also note evidence that high
mortgage costs incentivise homeowners to find work more quickly than renters, although those
who enter homeownership may be closer to the labour market at the outset. Moreover,
homeowners can facilitate entry to self-employment more easily than renters due to having
workspace in their home and being free from tenancy constraints that may prohibit home
working (ibid.).
The extent of poverty and homeownership A number of studies provide quantitative data about the characteristics of low-income
homeowners a decade or more ago using a range of data sources (Burrows & Wilcox, 2001;
Burrows, 2003; Meadows & Rogger, 2005; Burrows & Wilcox, 2004) and more recent data from
the Family Resources Survey (including Households Below Average Income), the English
Housing Survey (DCLG, 2015a; Wallace et al., 2014; DWP, 2015) and Minimum Income
Standard data (Padley & Hirsch, 2015). Moreover, two studies examine the pathways into and
out of poverty and homeownership using longitudinal data contained within the British
Household Panel Survey (Stephens et al., 2014; Wood et al., 2015).
The headline finding of Wilcox and Burrows (Burrows & Wilcox, 2001; Burrows, 2003) that ‘half
the poor’ were homeowners - regardless of poverty measure adopted - was confirmed by DWP

10
analysis using a range of datasets (Meadows & Rogger, 2005). Burrows (2003) used the
measure of poverty highlighting material deprivation and an inability to achieve a minimum
acceptable standard of living from the Poverty and Social Exclusion Survey (PSE) and found
homeowners made up half of those below this poverty threshold, 32 per cent mortgaged
households and 18 per cent outright owners. This compares to 41 percent of households below
the threshold being social housing tenants and only nine percent in private renting at the time
the data were collected in 1999.
Taking a full account of housing income, resources and housing costs, the UK housing system
reduces the rate of poverty created from labour markets and welfare systems to a greater extent
(6.3 percentage points) than the Netherlands (3.7 percentage points) although poverty remains
higher in the UK than the Netherlands (Stephens & van Steen, 2011). The main beneficiaries
are poorer households with social and regulated tenancies and also outright homeowners. The
proportion of households that remain poor after cash, housing income and resources are
included stands at 15.3 percent in the UK and 9.6 percent in the Netherlands (ibid.). The DWP
(2015) estimated that 15 percent of all UK households were in relative poverty during 2013/14
BHC, but 21 percent AHC. The corresponding DWP data for 2007 by comparison was 7.1
percent BHC and 8.7 percent AHC (DWP, 2009), illustrating that findings in relation to poverty
and housing are sensitive to the methods adopted (Burrows, 2003), and has changed
substantially over time.
This overarching finding of earlier work, that half of poor households live in homeownership,
remains the case today. The English Housing Survey confirms that the number of homeowners
in the lowest income quintile has remained stable at around 309,000 households, but as the
sector has contracted rises proportionately from 4.2 percent of all households in this income
quintile during 2003/3 to 4.5 percent during 2013/14 (DCLG, 2015b). Smaller proportions of
homeowners, especially mortgagors compared to households in other tenure, are in relative
poverty with the greatest proportions of households in poverty found among social housing
tenants (Fig.1) (DWP, 2015). But as homeownership is a much larger part of the housing
system than other housing tenures, in terms of the absolute number of people living in relative
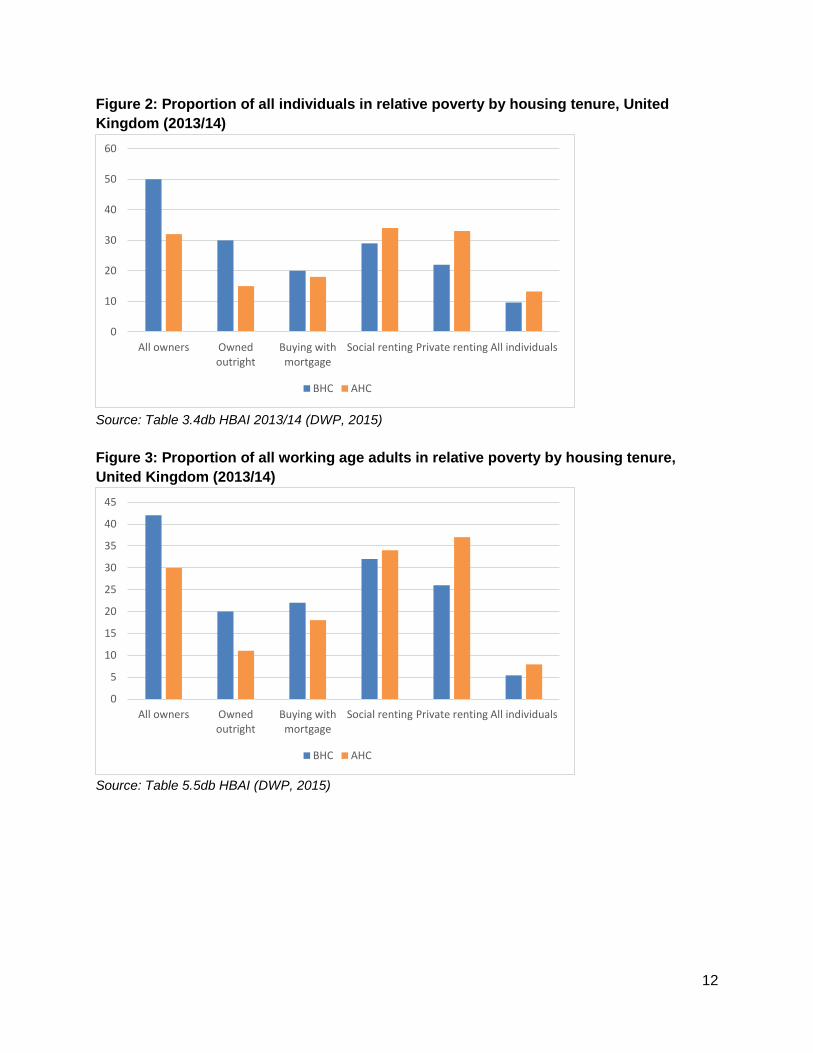
poverty conditions, 50 percent of them still live in owner-occupation (Fig. 2). Low-income
individuals comprise 30 percent outright owners and 20 percent mortgagors (BHC). (Although
the data and poverty measures are inconsistent this recent DWP data reflects the growth in
outright ownership, as outright homeowners now comprise the greatest proportion of
homeowners in poverty, reversing the situation found by Burrows (2003) where mortgaged
owners formed the largest group of homeowners in poverty.) The DWP data shows that the
inclusion of housing costs reduces the proportion of individuals living in relative poverty in
owner-occupied accommodation to 32 percent of all households in poverty, but this remains a
similar proportion of the population who are in relative poverty who live in social housing (34 per
cent) and private renting (33 percent). This equates to 4.8 million people living in poverty in
owner-occupied homes (BHC) and 4.2 million (AHC).
This picture also holds when working age adults are considered. A total of 42 percent of working
age adults in relative poverty (BHC) live in an owner-occupied home, compared to 32 percent in

11
social housing and 26 percent in private renting (Figure 3). Again this proportion of poor working
age homeowners falls after housing costs are included when 30 percent of poor working age
adults live in owner-occupied homes, just slightly fewer than the 34 percent in social housing
and 37 percent in private renting. This equates to 2.4 million working age adults in
homeownership in relative poverty (AHC) compared to 2.7 million in social renting and 2.9
million in private renting.
The situation is more pronounced when considering pensioners in relative poverty (Figure 4).
Here 85 percent of all pensioners in relative poverty (BHC) are in homeownership falling to 60
percent (AHC) - the vast majority in outright ownership. This compares to only 10 percent in
social housing (BHC) which rises to 26 percent (AHC) and six percent in private renting (BHC)
which rises to 13 percent (AHC). Clearly, minimal housing costs for homeowners in later life
reduce the extent of poverty, but housing costs exert an upward pressure on the number of
pensioners in poverty in rented accommodation. The increase in older homeowners with
minimal housing costs has made an important contribution to the lower incidence of pensioner
poverty in recent years (Cribb, et al., 2012).
Figure 1: Proportion of housing tenure occupied by individuals in relative poverty, United
Kingdom (2013/14)
Source: Table 3.6db HBAI 2013/14 (DWP, 2015)
0
5
10
15
20
25
30
35
40
45
50
All owners Ownedoutright
Buying withmortgage
Social renting Privaterenting
All individuals
BHC AHC
12
Figure 2: Proportion of all individuals in relative poverty by housing tenure, United
Kingdom (2013/14)
Source: Table 3.4db HBAI 2013/14 (DWP, 2015)
Figure 3: Proportion of all working age adults in relative poverty by housing tenure,
United Kingdom (2013/14)
Source: Table 5.5db HBAI (DWP, 2015)
0
10
20
30
40
50
60
All owners Ownedoutright
Buying withmortgage
Social renting Private renting All individuals
BHC AHC
0
5
10
15
20
25
30
35
40
45
All owners Ownedoutright
Buying withmortgage
Social renting Private renting All individuals
BHC AHC

13
Figure 4: Proportion of all pensioners in relative poverty by housing tenure, United
Kingdom (2013/14)
Source: Table 6.3db HBAI (DWP, 2015)
Similarly, the majority of poor children live in owner-occupied homes (56 percent),
predominantly in mortgaged accommodation (Table 1). The proportion of all children living in
relative poverty (BHC) in homeownership is similar at 37 percent to the proportion living in social
housing (38 percent) and above that in private renting (26 percent). However, measuring
relative poverty after housing costs are deducted (AHC) the proportion of children in poverty in
homeownership reduces to 26 percent. Housing costs have little impact on the proportion of
poor children living in social renting (again 38 percent AHC) but increase the proportion of poor
children in private renting to 36 percent). The nature of material deprivation and severe low-
income is, also much lower for children living in owner-occupied homes (18 percent), compared
to 55 percent in social housing.
Meadows and Rogger (2005) identified the largest groups of low-income homeowners to be
lone parents, 69 percent of lone parents and 62 percent of couples with dependent children in
homeownership had incomes below 60 percent of median income AHC.
Using different indicators of poverty shows that tenants are at greater risk of having incomes
that preclude an acceptable standard of living, with more than half (52.4 percent) of social
housing tenants having an income below MIS and 44.3 per cent of private tenants (Padley &
Hirsch, 2015). The risk of homeowners having an income below MIS is much lower, 12.6
percent for mortgaged households and 10.6 percent for outright owners. However, in absolute
numbers homeowners below MIS are likely to again form a significantly large group.
0
10
20
30
40
50
60
70
80
90
All owners Ownedoutright
Buying withmortgage
Social renting Private renting All individuals
BHC AHC

14
Table 1: Proportion of all children in relative poverty by housing tenure, United Kingdom
(2013/14)
Material Deprivation Relative poverty
All
children and low-
income1
and severe
low-income2
BHC AHC
All Owners 17 18 37 26 56
- Owned outright 3 5 10 5 9
- Buying with mortgage 14 13 27 21 48
Social rented sector tenants 55 54 38 38 22
All rented privately 27 28 25 36 22
All children (millions=100%)6 1.7 0.5 2.3 3.7 13.4
Source: Table 4.4db HBAI 2013/14 (DWP, 2015) 1 A family is in low-income and material deprivation if materially
deprived and a household income below 70 per cent of median income, Before Housing Costs. 2 A family is in severe
low-income and material deprivation if they are materially deprived and score of 25 or more and a household income
below 50 per cent of contemporary median income, Before Housing Costs.
Marginal homeownership may be less prevalent today but remains significant. Corlett et al.
(2016) show that while the most benefit reliant households are significantly represented among
social housing, over half of low- to middle-income households (defined as households below
average incomes but without substantial benefit income) live in homeownership (55 percent).
This figure has diminished since 1998 when around 70 percent of low- to middle-income
households were homeowners. Indeed, mortgagors form the largest groups of people falling into
to poverty especially prior to the financial crisis when around 62 percent of new entrants to
poverty were mortgaged homeowners, compared to 45 percent by 2010 (Gibb et al., 2016).
These data are presented with the caveats mentioned above that housing costs may be
underestimated for homeowners and that the asset value potential of the tenure is omitted. The
data does, nevertheless, present a consistent picture with research undertaken a decade or
more ago, and shows that significant and often overlooked proportions of people living in
relative poverty reside in owner-occupied as well as rented homes.
Characteristics of homeowners who experience
poverty
The purpose of the overarching research, that this literature review informs, is to determine the
present circumstances of homeowners who experience poverty as limited analysis exists that
describes or furthers our current understanding of their position. This section reviews existing

15
evidence into their circumstances, poverty transitions, spatial variations and the consequences
of being a poor homeowner.
Characteristics of lower-income homeowners
The contraction of homeownership since 2003 has been uneven. Contemporary data show that
there have been slight shifts across the housing market cycle in the proportions of homeowners
drawn from professional and managerial occupations at the expense of those from routine or
manual occupations (Wallace et al., 2014) (Table 2).
Moreover, fewer younger age groups have been accessing homeownership (Figure 5). CML
(2015) estimates show that older first time buyers have not returned to the market at the same
rate as younger cohorts, who themselves remain below that of the rising market of 2001-2005. If
first time buyers were to return in to the housing market in the same volumes the
homeownership rate for 25 year olds would be ten percentage points higher (ibid.). As
discussed below, younger aged homeowners are at greater risk of poverty and default.
Table 2: Occupational classes of UK homeowners through market cycle
UK Homeowners
HRP NS-Sec 5 class 2002/3- 2004/5 2005/6- 2007/8 2008/9-2010/11
Managerial/ Professional 49.7% 51.4% 52.9%
Intermediate 9.0% 8.5% 9.0%
Small employers/ own account 10.3% 10.4% 10.1%
Lower supervisory/ technical 11.0% 10.0% 9.4%
Semi-routine/ routine 18.5% 17.4% 16.5%
Never worked 1.5% 2.2% 2.1%
Source: Taken from Analysis of Family Resources Survey in Wallace et al. (2014)
Figure 5: Average annual number of first-time buyers by age group, 000s
Source: CML estimates from CML (2015) *2015 and 2016-2020 estimated based on 2014 propensity to
own data
0
20
40
60
80
100
120
140
18-24 25-29 30-34 35-39 40-44 45+
2001-2005
2006-2010
2011
2012
2013
2014
2015
2016-20

16
Affordability constraints, stagnant wage income and the more prudent lending environment after
the financial crisis are likely to have contributed to this sea change in the composition of
homeowners. Plausibly, this change has the potential to limit future incidence of homeowners in
poverty by excluding those most at risk. But in truth we know little about the current
circumstances of homeowners who experience poverty or the risks they face, a gap the wider
project will fill.
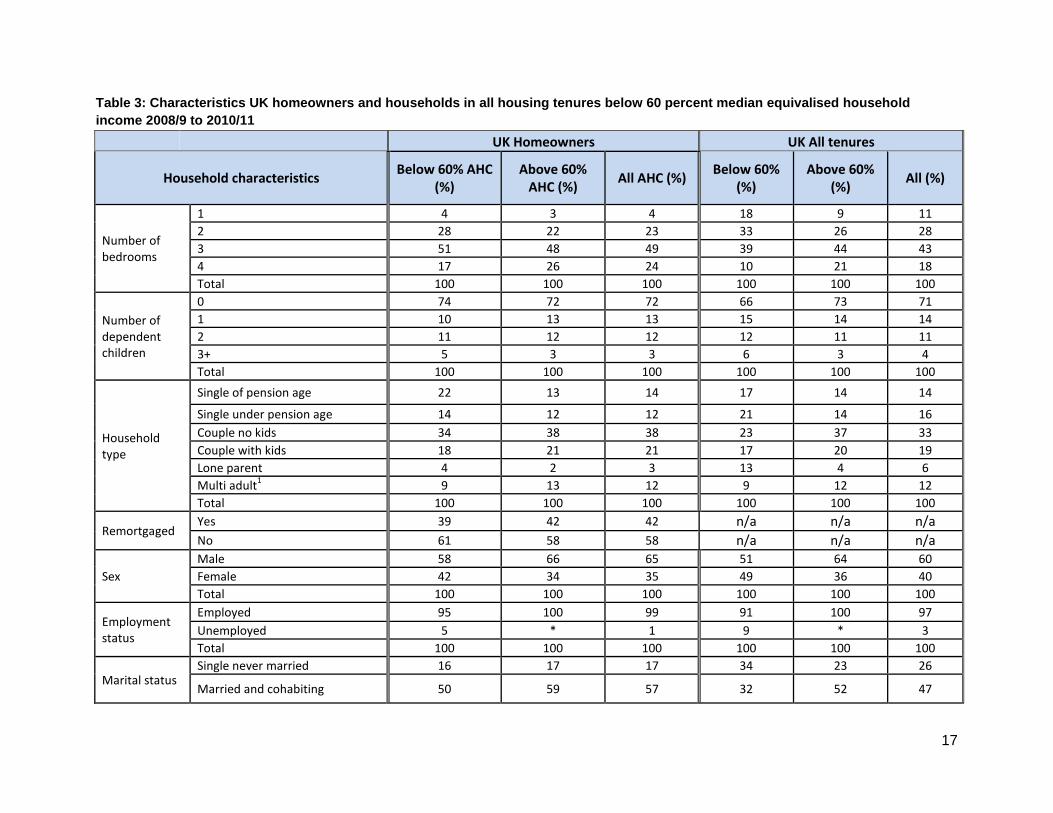
However, unpublished analysis of pooled Family Resources Survey data, drawn from Wallace
et al. (2014) shown in Table 3 shows differences between homeowners and poor or non-poor
households across all housing tenure. Table 3 shows that low-income homeowners have
smaller homes than homeowners not in poverty, but their homes remain larger than other poor
households. A higher proportion of poor homeowners have no children than other poor
households, which is likely to be a function of homeowners’ older age profile. More single
people are represented among low-income homeowners than more affluent homeowners, and
especially more single pensioner households compared to other poor households. Household
reference persons who are female, separated or divorced are more represented among poor
homeowners, but not to the same extent as among other poor households. There are a greater
proportion of widows among poor homeowners than among other poor households, again
reflecting the age profile of the tenure. There are also fewer unemployed households in low-
income homeownership than other low-income households across all tenure. Lastly, there are
more routine occupations or reference persons who have never worked among homeowners in
poverty compared to homeowners not in poverty, and a greater proportion of self-employed
households among poor homeowners than found among other homeowners or even among
other poor households across all tenure.
Earlier work indicated that certain homeowners were more at risk of poverty than others.
Meadows and Rogger (2005) showed that the composition of poor homeowners differed from
that of poor tenants. For example, a quarter of low-income tenants were lone parent households
without employment compared to only five per cent of poor homeowners. In addition, poorer
homeowners were found to be older than the population of homeowners overall, reflecting the
incidence of lower incomes among older people, perhaps at that time when pensioner poverty
was higher. Indeed, 60 percent of poor homeowners were over 60 years old. But the risk of
being a poor homeowner was greater amongst younger age groups (Burrows, 2003).
Burrows used multivariate analysis to show that the mortgagors most likely to be below the PSE
poverty threshold were those:
● with no work (a third of mortgagor households living in poverty), while those with work
were the least likely to be in poverty (13 percent);
● lone parent households;
● young mortgagors aged between 25 and 34 years old, 27 percent of whom were in
poverty;
17
Table 3: Characteristics UK homeowners and households in all housing tenures below 60 percent median equivalised household
income 2008/9 to 2010/11
UK Homeowners UK All tenures
Household characteristics Below 60% AHC
(%) Above 60%
AHC (%) All AHC (%)
Below 60% (%)
Above 60% (%)
All (%)
Number of bedrooms
1 4 3 4 18 9 11
2 28 22 23 33 26 28
3 51 48 49 39 44 43
4 17 26 24 10 21 18
Total 100 100 100 100 100 100
Number of dependent children
0 74 72 72 66 73 71
1 10 13 13 15 14 14
2 11 12 12 12 11 11
3+ 5 3 3 6 3 4
Total 100 100 100 100 100 100
Household type
Single of pension age 22 13 14 17 14 14
Single under pension age 14 12 12 21 14 16
Couple no kids 34 38 38 23 37 33
Couple with kids 18 21 21 17 20 19
Lone parent 4 2 3 13 4 6
Multi adult1 9 13 12 9 12 12
Total 100 100 100 100 100 100
Remortgaged Yes 39 42 42 n/a n/a n/a
No 61 58 58 n/a n/a n/a
Sex
Male 58 66 65 51 64 60
Female 42 34 35 49 36 40
Total 100 100 100 100 100 100
Employment status
Employed 95 100 99 91 100 97
Unemployed 5 * 1 9 * 3
Total 100 100 100 100 100 100
Marital status Single never married 16 17 17 34 23 26
Married and cohabiting 50 59 57 32 52 47

18
UK Homeowners UK All tenures
Household characteristics Below 60% AHC
(%) Above 60%
AHC (%) All AHC (%)
Below 60% (%)
Above 60% (%)
All (%)
Married and separated 4 3 3 6 3 4
Divorced 12 10 10 15 11 12
Widowed 18 11 12 13 11 12
Total 100 100 100 100 100 100
National Statistics Socio Economic Class (NS-SEC)
Managers/ professionals 25 56 53 16 52 46
Intermediate 8 9 9 7 9 9
Small employers/ own account workers
26 8 10 16 8 9
Lower supervisory/ technical 7 10 9 6 10 9
Semi-routine/ routine 24 16 16 33 19 21
Never worked/ LT unemployed 10 1 2 22 2 5
Total 100 100 100 100 100 100
Source: Unpublished analysis of Family Resources Survey data from Wallace et al. (2014)

19
● households headed by someone in a manual occupation, where a third of homeowners
in social class IV were in poverty compared to only 2 percent of Social Class I;
● people who self-identify as being from a minority ethnic group, where over half of BME
mortgagors were in poverty;
● households residing in Wales or the Midlands; and
● people who experienced divorce and/or separation.
For outright owners, the factors that increase their odds of being in poverty were affected by the
older age profile of the group, but included:
● those with no workers, those still active in the labour market are the least likely to be in
poverty 9 percent compared to 16 percent with no workers;
● single person households;
● younger households;
● households headed by a manual social class.
Transitions into and out of lower-income homeownership
We saw in Table 1 that the nature of poverty was different for children in owner-occupation, with
significantly fewer homeowners with severe low-income and material deprivation. Using
longitudinal data Stephens et al. (2014) found that among settled homeowners - those that
remained in homeownership continually - homeowners experienced poverty spells more
frequently but of a shorter duration than households in social renting, and fewer homeowners
experienced chronic long term poverty. The less enduring nature of poverty among
homeowners is likely to explain the higher incidence of car ownership, durable items and
savings among low-income homeowners compared with low-income tenants (Meadows and
Rogger, 2005). The frequent nature of poverty spells among homeowners was also apparent in
earlier analysis, with a quarter of BHPS homeowner households experiencing poverty at least
once in the twelve year period studied (ibid.)
While the reach of homeownership extended down the income scale during the expansionary
period of homeownership up to 2003, critically, low-income homeowners became poor after they
entered the tenure (Burrows, 2003; Meadows & Rogger, 2005; Widdowfield & Wilkinson, 2002).
Meadows and Rogger (2005) found that the movement of homeowners into and out of poverty
was similar to that of other low-income households. This is in contrast to Stephens et al.’s
(2014) more recent analysis set out above that used more waves of the BHPS than Meadows
and Rogger. Differences may be a function of the residualisation of social housing over time.
Important triggers for entering low-income homeownership were relationship breakdown, job
loss and retirement. Most movements out of low-income homeownership - nine out of ten -were
associated with increased incomes. Regression analysis found that getting a job increased the
likelihood of moving from low-income to higher-income homeownership, whereas having a new
baby reduced the likelihood (Meadows and Rogger, 2005). Widdowfield and Wilkinson (2002)
found that the main reasons for homeowners becoming poor in Scotland were that they
experienced relationship breakdown and divorce; death of a partner, or becoming a carer. It is
unclear why slightly different factors are apparent.

20
Whether work continues to lift poor homeowners out of poverty to the same extent is uncertain.
While households with people in work are less likely to be in poverty, the majority of households
in poverty have at least one person in work (Gibb et al., 2016). Self-employment has grown
largely as a response to loss of employment following the financial crisis, but does not
guarantee a change in poverty status. Self-employed homeowners were overrepresented
among lower-income homeowners; with a 39 percent of lower-income homeowner households
with someone in employment being self-employed compared to only 13 percent of higher-
income homeowners with someone employed (Meadows and Rogger, 2005). Analysis of FRS
data in Table 6 shows that during the period 2008/9 to 20101/11 26 percent of poor
homeowners were self-employed, despite forming only 10 percent of all homeowners. Indeed,
Gibb et al. (2016) found that in 2008, 28 percent of men in poverty were self-employed,
compared to 22 percent who were out of work. This is important as self-employed people find it
difficult to access mortgage safety nets and can have uncertain incomes (Burrows & Ford,
1998).
It is assumed that people move into homeownership once, when they first purchase and remain
in that tenure, and for the majority this is the case. However, the housing market is dynamic with
significant movements of households moving from homeownership to other tenures in any one
year. While too few households move from social renting to homeownership for analysis in the
English Housing Survey data, an estimated 12,000 households moved from homeownership to
social renting during 2013/14 (DCLG, 2015). Similarly, while popular discourse focuses on the
flow of 184,000 households from private renting to homeownership, a similar number (170,000
households) made the move in the opposite direction (ibid.). So homeowners may shift their
poverty status but are these transitions accompanied by changes in tenure? Meadows and
Rogger (2005) found that 8 percent of transitions out of low-income homeownership were due to
a move to rented accommodation.
Wood et al. (2015) found that for new entrants to homeownership between 2002 and 2010 the
risk of remaining a homeowner by year 8 (=2010) was 68 per cent in the UK. The risk of leaving
homeownership was greatest in the early years and reduced over time, but a social gradient to
this risk was identified. In the UK, the factors associated with exits from homeownership were: a
younger age, being divorced and separated, lower incomes, and having a higher loan to value
ratio. Being in poor health, having only a basic education and being in financial distress were
also associated with leaving the tenure. Stephens et al. (2008) note that moves towards a low
inflation environment increase the burden and therefore the risk of sustaining homeownership
for new entrants as wages rise slowly and inflation fails to erode the value of the debt. It would
seem that the risks of losing the home are greater for lower-income homeowners and intersect
with the reasons why households enter poverty.
Notwithstanding the fact that most poor homeowners become poor after their home purchase,
households can also enter low-income homeownership by changing tenure in situ, via the right-
to-buy. Most purchasers exercising the Right-to-Buy were skilled working class or lower middle
class households on below average incomes, but 13 per cent received external funding from

21
family or agents, and little appraisal of their ability to meet any mortgage payments was made
prior to the financial crisis (Cole et al., 2015). Unskilled council tenants in the lowest income
quintile were largely unable to access the provisions of right-to-buy, however.
Spatial differences in lower-income homeownership
There are variations in the proportion of households that live in homeownership across the UK,
including the proportions of outright owners and mortgagors (Table 4). Homeownership forms
the highest proportion of households in Wales (69 percent) and the lowest in Scotland (61
percent). Within the English regions, inner London has the smallest proportion of homeowners
(38 percent) and the South East the highest (69 percent). The proportion of outright owners also
varies geographically, with 40 percent in Wales and 13 percent in inner London, providing
indications of different dynamics at play, suggesting an older age profile of homeownership in
Wales and that few people complete their homeownership career in London. We can also see
that the lowest cost regions do not automatically correspond with the higher homeownership, as
the North East has lower house prices across England but also the lowest proportion of
homeowners outside London (60 percent). There are also variations in how homeownership
expanded and in the variable impacts of the housing market cycle (DCLG Live Tables 104, 106,
107 and 108). Homeownership in Wales peaked at 75 percent during the years 2003 to 2007
prior to the crisis, compared to a peak of 70 percent in 2002 in England, a 73 percent in
Northern Ireland in 2007 and 65 percent in Scotland in 2008 and has reduced by 7 points in
England but only 4 points in Scotland (ibid.).
Homeownership also varies by ethnicity, which could also interact with location to produce
variance in ownership rates. Using Family Resources Survey data, only 37 percent of
households that identify as black were homeowners during 2013/14, compared to 68 percent of
households of white ethnicity. Moreover, only for white homeowners does the proportion of
outright owners exceed that of mortgagors suggesting overall that minority ethnic
homeownership has a younger age profile. Burrows (2003) found that self-identified BME
homeowners had increased risks of being in poverty.
One expression of the uneven spatial distribution of lower-income homeowners is found in the
Support for Mortgage Interest caseload, although it may also reflect homeowner's’ inability to
meet higher housing costs without assistance and the volume of homeowners in each
government region (DWP, 2012). While the North East comprises four percent of SMI claims,
the North West and London represent 14 and 13 percent of the caseload respectively.
Meadows and Rogger (2005) did not examine the spatial distribution of low-income
homeownership but found poor homeowners lived in smaller and lower-value homes. As noted,
Burrows (2003) identified that being a homeowner in the Midlands or Wales increased the
likelihood of being in poverty.

22
Table 2: Proportion of homeowners by country and region (2013/14)
Region Country
Ownership Tenure
NE (%)
NW YH EM WM E L Inner L
Outer L
SE SW England Wales Scotland NI GB UK
All owners 60 64 63 68 66 67 49 38 55 69 67 63 69 61 65 63 63
Owned outright 30 32 33 35 36 34 20 13 25 36 38 32 40 32 37 33 33
Buying with a mortgage
30 32 30 32 30 33 29 25 31 32 29 31 29 30 29 31 31
Total 100 100 100 100 100 100 100 100 100 100 100 100 100 100 100 100 100
Source: Family Resources Survey Table 3.1

23
Analysis in Northern Ireland shows that over the course of the last housing market cycle,
between 2002/3 and 2004/5 and 2008/9 to 2010/11 homeownership households in the UK
became slightly more professional and managerial and slightly less lower grade occupations but
that this shift was less pronounced in Northern Ireland (Wallace et al., 2014). Northern Ireland
also retained a higher rate of self-employed homeowners compared to the UK as a whole.
Low-income homeowners in Scotland were predominantly outright owners (two thirds) and were
slightly more likely to live in rural areas than higher income homeowners (Widdowfield &
Wilkinson, 2002). Two-fifths (43 percent) had no savings but homeowners in the bottom income
quintile had more equity than those in the middle quintile, possibly as older homeowners may be
on low-incomes but have accrued equity due to being a homeowner for longer. Few low-income
homeowners entered homeownership poor, but right-to-buy purchasers comprised a quarter of
all low-income homeowners (ibid.).
Separate analysis of poor homeowners in Wales found that the odds of being a poor
homeowner increased if the household reference persons were single, lone parents,
Pakistani/Bangladeshi, retired or unemployed (Burrows & Wilcox, 2004).
Consequences of lower-income homeownership
Associations between low-income homeownership and physical and mental health and poor
housing conditions are apparent. The mechanisms through which impacts are transmitted are
less clear, but evidence indicates that they include interactions between low-incomes, age and
(mortgage) indebtedness.
Overall, Widdowfield and Wilkinson (2002) report positive independent relationships between
good health and homeownership but found that poor homeowners also had poorer health,
possibly due to their older average age. They noted that low-income may also have indirect
effects on health by restricting access to good quality housing and increasing stress through
increasing worry about money, debt and repossession. Reflecting prolonged disadvantage,
Burrows (2003) found that poor renters reported indicators of social exclusion and poor physical
health and wellbeing more frequently than poor homeowners, although poor homeowners
reported problems with mental health slightly more frequently than renters. Moreover, mortgage
debt amplified the association between poor health and unemployment (Lau and Leung, 2014);
losing the home through repossession has impacts on the mental health of homeowners not
observed among renters facing eviction (Pevalin, 2009); adversely impacts on well-being for
both men and women and for men increased their doctor attendance (Nettleton and Burrows,
1998); and the psychological distress is greater in areas of falling markets, possibly due to the
potential for larger shortfall debts on repossession and/or failing local economies (Gathergood,
2012). The English Housing Survey (DCLG, 2015b) shows that homeowners in the lowest
income quintile are slightly less satisfied with their accommodation and with their life, slightly
more anxious and more overcrowded (although this last measure has fallen in the last ten
years) when compared to higher income homeowners.

24
Non-decent homes3 are proportionately more likely to be in the private rented sector (29
percent) compared to owner-occupation (19 percent) and social housing (14 percent) (DCLG,
2016). However, the larger size of homeownership tenure means that there are 2.7 million non-
decent owner-occupied homes compared to 1.2 million non-decent homes in the private rented
sector and 0.5 million in the social rented sector. Consequent to this, despite the private rented
sector reflecting a particular risk of poor housing conditions, more children are living in poor
housing in homeownership than any other housing tenure, with over 975,000 children in social
rented housing, 845,000 children in private rented housing but over 1.7 million children in
homeownership (Cullinane et al., 2013). There is evidence that poor housing conditions impact
upon health for children and those over retirement age. The relationship between poor health
and poor housing in social renting is less clear, due to the multiple factors that can impact upon
health but also perhaps as poor health is one reason why people may be allocated social
renting. Evidence from the Northern Ireland House Condition Survey 2009/10 shows that older
people are more likely to live in non-decent homes in rural areas and in private properties, again
with a higher proportion in private renting (27.7 percent) and homeownership (18.1 percent)
compared to 13.7 percent in social housing (Wallace et al., 2016). Moreover, category 1
hazards4 are more prevalent among older people’s homes frequently in homeownership
(Davidson et al., 2012). Evidence from Wales also suggests that the greatest volume of homes
in poor conditions is within homeownership, with 72 percent of unfit homes having been owner-
occupied (Burrows & Wilcox, 2004). There is also some evidence that Right-to-Buy properties
have been of poor quality and that purchasers have faced unanticipated repairs costs,
particularly in leasehold flats, although many of these may have been in poor physical condition
prior to purchase (Cole et al., 2015). The English Housing Survey does not report physical
housing conditions by household profiles except that people 65 years old or more are the least
likely to have an electrical system compliant with all safety features (43 percent) compared to all
age groups in social housing who have compliance rates over 70 percent (DCLG, 2015b)
But what is the relationship between poor housing conditions, homeownership and poverty?
Tunstall et al. (2013) indicate elevated rates of poor housing indicators for households living in
poverty compared to households that were not living in poverty. But among households below
the Poverty and Social Exclusion poverty threshold, Burrows (2003) found few differences in
housing conditions of poor renters and homeowners. Poor renters were, however, more likely to
report dissatisfaction with their neighbourhood, poor homeowners were slightly more likely to
report dissatisfaction with specific physical conditions of their home, notably leaking roof, rotting
window frames and damp. Poor homeowners in Scotland were slightly more likely to live in
poor conditions (9 percent compared to 7 percent across all households) but were less likely to
undertake repair and maintenance work to their home (39 percent) compared to more affluent
owners (70 percent) (Widdowfield & Wilkinson, 2002). This is likely to be a function of age as
3 The Decent Homes Standard is met when dwellings achieve basic safety standards, be in a reasonable
state of repair, have reasonably modern facilities and services and have efficient heating and effective insulation. 4 Category 1 hazards are identified by the Housing Health and Safety Ratings System (HHSRS) and
includes the most serious faults in the home that have a higher probability that they will lead to harm of the occupant such as trip hazards, faulty wiring or damp.

25
well as income as over two thirds of poor homeowners in Scotland were older (71 percent),
although poor younger families in homeownership had other spending priorities.
The potential of homeownership for poor households That homeownership has multiple qualities is well recognised (Elsinga & Hoekstra, 2015; Smith,
2015). On the one hand it offers low-income homeowners the opportunity to gain assets, status
and control, but simultaneously it allows states to retrench and shift responsibility for welfare
onto individuals, with the associated risks and cost burdens (Doling and Ronald, 2010).
Several studies have identified that homeownership can offer a buffer against market turmoil, or
an insurance policy against uncertainty in countries with the greatest inequalities (Watson &
Webb, 2009; Deidda, 2014; Wallace et al., 2014; Colic et al., 2010). In a recent study of shared
owners, the security of tenure that homeownership offers was certainly of significant appeal
over that offered by the private rented sector (Cowan et al., 2015), a situation that may become
apparent in social housing following the limitations on lifetime tenures in the Housing and
Planning Act 2016. The control, security and financial and cultural imperative to own informs
much of the strong aspirations to homeownership (Wallace, 2010), but as is seen in the next
section, homeownership also represents a number of risks, from mortgage arrears (Ford et al.,
2001) to loss of housing equity (Smith et al., 2008).
A number of claims are made for the benefits of homeownership but the evidence is mixed.
There is an extensive US literature that examines social and community benefits such as
enhanced social involvement, residential satisfaction and educational outcomes for
homeowners, for example, but the field is challenged by selection effects, the potential that
different types of households enter homeownership rather than renting at the outset (Rohe and
Lindblad, 2013). More work is required to determine under what circumstances the benefits of
homeownership are achieved and for whom (ibid.). In the UK, indications for greater educational
achievements for homeowners’ children were found (Bramley & Karley, 2007). But it has been
the economic benefits that are emphasised, as housing wealth can be used to support owners’
welfare (Quilgars & Jones, 2010; Hancock, 1998; Parkinson et al., 2009). Some studies find
little or inconclusive evidence of positive outcomes of the tenure on issues from greater self-
esteem, enhanced voting or repairs behaviours (Kearns et al., 2001; Hiscock et al., 2001;
Englehardt et al., 2010; Kleinhans and Elsinga, 2010).
While the UK evidence base for the social and community benefits of homeownership is
underdeveloped, not least for lower income households, it is the wealth generating qualities of
the tenure that have been subject of much recent debate. Previous governments were explicit in
seeking to extend the asset-accumulation qualities to wider sections of society (ODPM, 2005).
That the housing market can drive inequalities between owners and renters and between
generations has been a significant concern (Stephens, 2011). Nonetheless, homeownership
has been central to a shift from collective responses to welfare towards individual responsibility

26
(Rowlingson & McKay, 2012) and de facto asset-based welfare policies. Financial asset-
accumulation is associated with lower poverty levels and targeted savings schemes can alter
the savings behaviour of lower-income households (Searle & Köppe, 2014) and have a positive
effect on life chances (McKnight, 2011). Housing assets operate differently but through a
combination of paying down mortgage debt and long-run capital gains equity can be
accumulated over time. Housing equity is also more evenly distributed than other financial
assets and represents a greater proportion of wealth (Bastagli & Hills, 2013), But the impact of
housing assets as opposed to financial assets is under-explored. Nonetheless, policies
promoting homeownership have shifted from alleviating households from state control by
fostering a ‘property owning democracy’ to those more closely associated with an ‘asset-owning
democracy’, the accumulation of wealth, positional goods and property for letting (Murie &
Williams, 2015). Rising markets held the promise of lower-income homeowners being able to
transcend inequalities derived from the labour market through the accumulation of housing
equity (Thomas & Dorling, 2004).
However, the accrual of housing equity remains strongly skewed towards more affluent
households. Several studies highlight that greater equity accrues to the most affluent, and is
socio-spatially unevenly distributed (Hamnett, 1999; Burbidge, 2000; Montgomerie &
Büdenbender, 2015). Despite the expansion of homeownership since the post war period and
beyond, the incidence of inheritance was mildly equalising in terms of net wealth but maintained
inequalities rather than narrowed them (Karagiannaki, 2011). Despite the Right-to-Buy
transferring some estimated £150-200 billion in equity through discounted values to low- to
middle-income households, many properties generated little discernible wealth as they were of
low value and many had been difficult to raise a mortgage on (Cole et al., 2015). Indeed, US
and UK evidence also points to a weaker ability to accrue equity for lower-income homeowners
due to purchases in low-value markets with greater volatility, fewer switches to lower mortgage
interest deals, shorter periods of homeownership and less benefits from tax breaks (Burbidge,
2000; Pryce & Sprigings, 2009; Belsky et al., 2007).
Homeowners have of course been using housing equity to overcome additional household
expenditure but there are limitations. Crouch (2009) identified this flow of housing equity to the
wider economy as ‘privatised keynesianism’, critical to the buoyancy of the UK economy.
However, there were and continue to be significant downsides to this incorporation of housing
wealth into personal financial planning. Repeat remortgaging increases the household debt
burden and thus the risk of repossession (Searle, 2013). Indeed secondary lending and
additional borrowing through remortgaging was evident in half of the mortgage rescue
applications during 2009/10 (Wilcox et al., 2010). Wood et al. (2015) noted that equity
withdrawal is a convenient inexpensive resource for more affluent households but represents a
risk for those with the fewest resources. Equity release in later life is posited as a poverty
alleviating measure but few homeowners who are cash poor- equity rich can benefit in this way
as their homes are of low value and the sums involved are insufficient to change their poverty
status (Hancock, 1998). Equity release customers currently benefits those on moderate
incomes supplementing pension income rather than low-income homeowners transforming their
finances (Overton, 2010). Withdrawing home equity is bound with emotional conflicts about

27
undermining the homeownership status, undermining the bequest motive for asset accumulation
(Fox O’Mahony & Overton, 2014) and is likely to be used only in the last resort (Quilgars &
Jones, 2010).
Differential rates of net property wealth across the regions are illustrated in Figure 5. Searle and
McCollum (2014) highlight the divergent experiences of house price growth across the UK by
different age groups and found that in the regions of northern England and devolved
administrations had the lowest sums of housing equity and the starkest disparities between age
groups were among 50-64 years old the generation, deemed to have benefited the most from
rising housing markets.
Figure 5: Net housing wealth by region, 2010/12.
Source: ONS (2014)
ONS analysis of the Assets and Wealth Survey demonstrate the differential impacts of the
housing market downturn on net property wealth across the regions, with upper quartile wealth
in the North East remaining below that of the median sums in London and the South East
(Figure 6) (ONS, 2014). Property wealth also changes by household type with lone parents
holding the least net equity, with a median sum of £84,000 (£42,000 at lowest quartile) and
couples with at least one member over state pension sage holding the most, with a median sum
of £220,000 (£140,000 at the lowest quartile). For net equity below £125,000 the variation by
socio-economic classification is minor, but above this greater wealth flows to more skilled,
professional and managerial occupations (ibid.) Lower sums of housing equity may be
associated with highly leveraged recent purchases rather than attributable to low-incomes and
lower property values, an issue to be explored in the wider project.
0
50,000
100,000
150,000
200,000
250,000
300,000
350,000
400,000
Lower Quartile Median Upper Quartile

28
Figure 6: Percentage change in median household net property wealth between 2006/08
and 2010/12, by region of residence: Great Britain
Source: Assets and Wealth Survey ONS (2014)
Lastly, the extraordinary flow of housing wealth witnessed in the last thirty years is likely to be a
generational windfall and with contracting ownership and large regional disparities unlikely to be
repeated (Montgomerie & Büdenbender, 2015). For these reasons, housing equity asset-based
welfare systems are increasingly seen as offering limited potential to offer adequate support for
households in need (Montgomerie & Büdenbender, 2015; Searle & McCollum, 2014; Burbidge,
2000).
Sustaining homeownership The UK housing market displays extraordinary volatility, with four periods of boom and busts
since the 1970s (Stephens, 2011). Causal associations are often drawn from the last financial
crisis 2007/8 and the US subprime debacle, but UK homeownership was itself exposed and
displayed weaknesses prior to the US housing market crisis (Ford & Wallace, 2009; Wilcox,
2005). UK homeownership saw an increase in lower-incomes and insecure employment,
mortgage market innovation that targeted marginal borrowers, incomplete safety nets and more
loans with high loan to values and loan to incomes (ibid.). Moreover, mortgage arrears started
rising from 2003 onwards, well before the financial crisis emerged. The crisis accelerated the
growth in mortgage default, but the volume of arrears and possessions from 2008 onwards did
not reach the scale of the 1990s market downturn. Only in Northern Ireland was the impact of
the crisis as profound as that in the US or Ireland (FSA, 2012). Britain’s lower volume of arrears
and possessions was due to a combination of historically low bank rates, government policy
intervention on a number of fronts and changed lender forbearance practices (Wallace & Ford,
2010), and that unemployment was lower during this last recession and more greatly affected
the 16-24 age group who, particularly in contemporary housing markets, are less exposed to
mortgage debt (FSA, 2012).
7
-5
-3
0
0
9
-3
-7
-1
-3
-6
-10
-15 -10 -5 0 5 10 15
Scotland
Wales
England
South West
South East
London
East of England
West Midlands
East Midlands
Yorkshire & the Humber
North West
North East
Change (%)

29
The official arrears and possessions statistics should however, not be regarded as a complete
measure of mortgage payment distress (FSA, 2012; Ford et al., 2010; Financial Inclusion
Centre, 2011; Wilcox & Pawson, 2012). While the rate of mortgages three months or more in
arrears did not exceed 2.5 percent (Q2-2009 CML Statistics), a total of between 5 and 8 percent
of mortgages were subject to forbearance mechanisms during 2012 (FSA, 2012). Moreover, the
FSA (2012) report that only 44 percent of homeowners who lost their home due to mortgage
costs did so because they were repossessed by lenders and 56 percent sold their homes
voluntarily to avoid or remedy mortgage arrears. Moreover, among all existing households, the
magnitude of homeowners who have had experience of selling up to alleviate payment
problems (246,000) is far in excess of those who experienced formal (55,000) or voluntary
repossessions (80,000) (Ford et al., 2010). Wilcox and Pawson (2012) note that Council of
Mortgage Lender figures only include first charge lending and not secondary secured lending.
Aron and Meulbauer (2016) adopt a double trigger approach to estimating mortgage arrears,
such that a loss of income combined with equity loss combine to produce default. Labour
market disruptions - loss of hours or pay, job loss or failing self-employment - are the prime
reasons of mortgage arrears but ill-health and relationship breakdown are also important (Ford
et al., 2001; Gall, 2009; Ford et al., 2010; FSA, 2012). As noted earlier, these are similar
demographic and labour market changes that prompt household moves into poverty, factors
that conflict with mortgage loans advanced on the premise of a stable long term income-stream.
The recent market downturn was also complicated by the incidence of secondary borrowing and
bankruptcy or other debt management arrangements complicating the management of
mortgage arrears for borrowers and lenders alike (Ford & Wallace, 2009; Ford et al., 2010;
Wilcox et al., 2010; Wallace et al., 2011). Moreover, by the time of the financial crisis in 2008
subprime lending had developed to a greater extent than in the early 1990s, with these
borrowers being seven times more likely to experience mortgage arrears (Stephens & Quilgars,
2008) and accounting for between 70-80 percent of mortgage rescue applications in the
scheme's’ first year (Wilcox et al., 2010). These additional debts compounded problems with
negative equity producing large shortfall debts for borrowers even after losing their homes.
The UK literature has always resisted a narrative that negative equity prompts arrears, derived
as it does from economic analysis of no-fault states in the United States where borrowers can
walk away from defaulting loans without incurring shortfall debts as in the UK (Tatch, 2011).
Recent studies have shown that negative equity does not on its own trigger default based on the
‘investment’ ‘poorly performing’ as the property is at once an asset and a home, but that once
negative equity reached significant proportions, over 60 percent of home value, then there was
a greater risk of default (Bhutta et al., 2010). The mechanism for this is likely to be that the
option to voluntary sell the home to remedy mortgage debt is removed or limited if a large
shortfall debt is incurred (Ford et al., 2010). In Northern Ireland voluntary sales were limited by
the steep reduction in house values and subsequent widespread negative equity, contributing to
higher rates of arrears and possessions (Wallace et al., 2014). Moreover, there was an inverse
social gradient to the incidence of negative equity, with higher income quintiles having more
frequent experiences of negative equity, but conversely, the lowest income quintile held the

30
greatest sums of negative equity, suggesting poorer homeowners suffer disproportionately once
the bottom falls out of the market (ibid.).
The Financial Conduct Authority (FCA, 2014) concerns about over-indebtedness remain, noting
evidence that 18 percent of the UK adult population (some 8.8 million) are over-indebted and
are behind with payments and burdened by their debt, and that personal debt has begun to rise
again after the crisis. Problem debt is greatest among younger people, renters, those on low-
incomes and in receipt of benefit or with few savings. Recent survey data shows that the total
debt to income ratio for mortgagors has fallen back since 2012, and subsequently reports of
financial distress has fallen consistently since 2008 but leaves around 11 percent of borrowers
with problematic mortgage costs (Bunn, 2015). Low Bank of England base rates cushioned the
impact of the downturn for many struggling borrowers and the much muted prospect of higher
base rates, now or in the near future, represents a further threat to owners who have normalised
current repayments (Blacklock & Whittaker, 2014). The prospect of rising rates in the near future
may be receding as the economic conditions remain weak (Carney, 2016) and the ability of
households to manage base rate rises has improved over the last year or so (Bunn, 2015).
However, the proportion of struggling homeowners remains significant, not least among those
who have a large debt overhang from prior to the financial crisis (Whittaker, 2014).
But to what extent are low-incomes and poverty bound up with the incidence of unsustainable
homeownership? As we have seen above most homeowners become poor rather than enter
poor, but the lowering of the entry barriers to ownership during the 1980s and 1990s expanded
the tenure to include households more susceptible to economic risk. The English Housing
Survey indicates a pronounced social gradient to mortgage arrears as the lower the income the
more likely respondents were to be in arrears, with 9 percent in the lowest income quintile in
arrears compared to 0.2 percent in the fifth highest quintile (DCLG, 2015a). Homeowners in the
lowest income quintiles spent 54 percent of their income on housing costs, the second quintile
27 percent and the fifth quintile only 14 percent (ibid.).
The FSA (2012) notes that borrowers with certain characteristics were more likely to accrue
mortgage arrears and include: high loan to values, self-employed, those with previous credit
impairment and right to buy purchasers. Credit hungry families and households on the
breadline are disproportionately those that accrue arrears of two months or more and
experience possession (ibid.). Wood et al. (2015) also identified homeowners in the early years
of homeownership to be at greater risk of falling out of the tenure due to financial distress, and
Cole et al. (2015) also reported that right-to-buy purchasers were two or three times more likely
to accrue mortgage arrears than other borrowers. Burrows’ (1998) found, however, that being
a first time buyer or having purchased property through the right-to-buy was associated with
1.75 and 1.8 times more mortgage arrears than average, but neither of these factors exerted an
independent influence on the odds of being in mortgage arrears after controlling for other
characteristics, so purchasing through the right-to-buy served as a proxy for other factors. The
factors that increased the odds of being three months or more in arrears were if the head of the
household was aged 18-24 years old, divorced or separated, a single man, self-employed,
unemployed, held a 100 percent mortgage, obtained a mortgage from a centralised lender

31
indicating relaxed lending criteria, lived in the South East of England, and had purchased their
property at the height of the previous housing market peak 1987-1989.
The most recent data using English Housing Survey 2013/14 shows that the groups that report
being behind with mortgage payments more frequently were those in the lowest income quintile
(8.7 percent), lone parents (7.2 percent), those most dissatisfied with their local area (5.8
percent), households with a disabled person (5.0 percent) and youngest child over 12 (4.1
percent) and first time buyers who have lived five years or more in the property (3.5 percent)
(DCLG, 2015b). The Resolution Foundation identify 12 percent of working households in private
renting are paying more than 50 percent of their income in housing costs, but only 6% of
mortgagors are what they term ‘housing pinched’; but as homeownership is a larger tenure
396,000 households in PRS spend over 50 percent but 491,000 households in homeownership
do so (Gardiner, 2014).
The regional experience of mortgage debt following the financial crisis in the 2000s was
different to that of the 1990s. Northern Ireland had by far the greatest proportion of mortgagors
with mortgage arrears and possession, followed by the northern regions of England and Wales
(FSA, 2012). It is in these areas that mortgage arrears has fallen the least following the initial
shock of 2008/9.
Support for low-income mortgage borrowers suffering mortgage shocks has been weak for
many years, and renters, up until recently at least, have had more comprehensive system of
housing allowances to cover housing costs after payment shocks (Burrows, 2003). During the
1990s Income Support for Mortgage Interest (ISMI) was available after 8 weeks of claiming, and
was based upon actual interest charged and payable to borrowers. In return for lenders support
in stemming the flow of possessions the government switched payments to lenders, which
helped them exercise forbearance. In 1995, the waiting time for the renamed Support for
Mortgage Interest (SMI) payments increased to 39 weeks, with the intention that borrowers
would privately insure themselves against accident, sickness and unemployment through
mortgage payment protection insurance (MPPI) schemes (Ford & Kempson, 1997; Stephens et
al., 2008). These schemes were found to be ineffective in securing a comprehensive safety net
for borrowers as they never exceeded a third of borrowers, were expensive, were purchased
unnecessarily or by borrowers with the lowest risks, and did not cover a key trigger of mortgage
debt such as relationship breakdown (ibid.). In addition, increasing the waiting time to 39 weeks
when take-up of MPPI was low meant more struggling borrowers lost their homes (Stephens et
al., 2008). The high volume of repossessions in the 1990s and beyond was associated with
physical and mental ill-health (Nettleton & Burrows, 2000; Pevalin, 2009), family and child
dislocation and an entry route to poverty for women (Nettleton et al., 1999).
From 2008/9, the government implemented a series of measures that would limit the impact of
the downturn on individual borrowers, included a pre-action protocol in the county courts,
requiring lenders to assure the courts that repossession was the last resort; the waiting period
for Support for Mortgage Interest (SMI) was decreased from 39 weeks to 13 weeks temporarily;
and provided additional funds for housing debt advice services (Wallace & Ford, 2010; Munro et

32
al., 2010). In addition, a mortgage rescue scheme was introduced in England which offered a
flexible tenure scheme where struggling mortgagors could remain in their homes on a shared
equity or intermediate rent basis (Wilcox et al., 2010). A mortgage to rent scheme already
existed in Scotland (Bramley et al., 2008), a range of housing associations operate schemes in
Wales, but there is no flexible tenure provision in Northern Ireland (DSD, 2015). Lenders also
adopted a managed forbearance approach to mortgage debt collection, in contrast to their pay
or possess approach of the 1990s (Wallace & Ford, 2010), which was underpinned by
government measures on welfare and advice (Ford et al., 2011). A range of policy measures
since 2010 have eroded the safety systems, with the withdrawal of the mortgage rescue
scheme from 2014 (Wilcox et al., 2010) and changes to Support for Mortgage Interest (SMI) that
since 2010 have capped the length of some claims and reduced the amount of interest on which
payments are made (Ford et al., 2011), and from April 2017 the 39 weeks waiting period before
payments are made will be reinstated (gov.uk). Furthermore, from 2018 when Universal Credit
is rolled out to all claimants, any SMI claimed will be converted to an equity loan held against
the property and some couples with any part time work will no longer be eligible for support
(Treasury, 2015). Universal credit also contains proposals to reduce eligibility for some couples
where the partner works 0-16 hours, limiting the transition to work for mortgagors and the
potential for Universal Credit to offer a much needed in-work housing allowance for
homeowners (Wilcox & Pawson, 2012).
Not all homeowners were able to take advantage of historically low interest rates as fixed rate
loans delayed the point at which they could remortgage or enjoy lower interest rates (Ford and
Wallace, 2009); subprime borrowers paid very high interest rates to reflect higher risks of
arrears (Stephens and Quilgars, 2007); and because the fixed interest rate used in Support for
Mortgage Interest from 2009 left many of these borrowers with payment shortfalls (Ford et al.,
2011)5. Increased cautiousness and new mortgage market regulation effectively raised the
threshold of entry to mortgage finance. ‘Mortgage prisoners’ emerged, borrowers unable to
switch mortgage deals because they have high loan-to-values (typically first time-buyers),
interest-only loans that are no longer available (typically remortgagors or home-movers), but
also because of previous remortgaging and a history of payment problems (typically right-to-buy
purchasers) (FSA, 2012).
The accrual or consequences of mortgage arrears are determined by the degree of social
protection offered to people through a country's welfare system and labour market and the
regulation of the mortgage market (Ford and Wallace, 2011). The UK’s current prudential
lending environment alone cannot stem all job loss, household dissolution or ill-health that
occurs throughout the housing market cycle, as life events happen to people across the income
spectrum and to those whose circumstances were stable at the outset of the loan (Wilcox &
Williams, 2013). The UK safety net as currently constituted is an important bulwark against
repossession (Ford et al., 2011) but has key omissions. As mentioned there is no in-work
equivalent of housing benefit for mortgagors - tax credits have played a role for lower-income
borrowers (Wilcox, 2003) but these are to be weakened - the waiting time extended and any
5 Although many SMI recipients also received payments in excess of their own interest commitments.

33
households with work, however few hours, will become ineligible entirely under Universal Credit
(Wilcox and Pawson, 2012).
Despite significant proportions of poor household comprising homeowners, they are at a greater
disadvantage when they suffer income shocks in terms of the support offered by the state than
tenants (Burrows, 2003). There is a policy conundrum, however, as payments of SMI are
frequently well below that paid through housing benefit to repossessed households who move
to the private rented sector through housing benefit, but meeting mortgage costs means also
funding the acquisition of a capital asset (Ford et al., 2011). This is partially overcome by
placing an equity charge on the property to repay SMI on sale, this means poor homeowners
become wholly responsible for their welfare and could deter borrowers from making claims.
Alternative safety nets could address these weaknesses. The Sustainable Home Ownership
Partnership (SHOP) proposes a compulsory joint scheme funded by borrowers, lenders and
government; partners who share the burden of unsustainable homeownership and therefore
could all contribute to mitigating its impact (Stephens et al., 2008). A SHOP scheme could offer
the following protection and would be compulsory for all borrowers:
● Non-means tested payment of actual mortgage capital and interest payments from the
beginning of the third until the end of the twelfth month following the occurrence of a
particular ‘designated’ risk, such as unemployment, failure of self-employment, accident
or sickness, and means tested assistance thereafter if the unemployment, sickness, etc.
continues.
● Means tested assistance with mortgage capital and interest payments from the third
month and indefinitely if the loss of income arises from a non-designated risk.
● During the first two months, lenders would be expected to exercise forbearance.
SHOP would also be supplemented by a tax credit to provide support for in-work but low-income
homeowners. Costs could be controlled by long term payments by placing a charge on
borrowers’ homes as is suggested for SMI from 2017 (Wilcox and Williams, 2013). Alternatively
another idea is to continue forbearance, but supplement it with an auto-enrolled private
insurance system and a state-backed payment system.
Future trends While there is some existing data that indicate associations between poverty, low-incomes and
homeownership, they are largely based on historic data mostly arising prior to the financial
crisis. A number of factors suggest the relationships may play out differently in the future.
On the one hand, the decline in homeownership across the UK has been deeper among low to
mid-range occupational classes (Wallace et al., 2014). These occupational groups have
declined as a proportion of the workforce anyway due to technological change and the hollowing
out of the labour market (McIntosh, 2013). The impact of constrained access to homeownership

34
has also been felt unevenly, with the biggest fall in homeownership among low to middle income
households, 73 percent of whom were homeowners in 2000 compared to 55 per cent by 2014
(Corlett et al., 2016). Moreover, wages for people in their 20s remains 12 percent below that
prior to the financial crisis, with important ramifications for new entrants to homeownership
(ibid.). While overarching trends towards insecure employment have not changed markedly in
recent years - 30 percent of employees were part-time, temporary, self-employed or low paid
during 1994, and 32 percent by 2014 - the proportion of insecure employees increased from 55
percent to 66 percent for 18-29 year olds and from 23 percent to 29 percent during the same
period (Gregg & Gardiner, 2015). These trends may further limit younger cohorts’ access to
homeownership. Prudent lending after the financial crisis, cemented by the mortgage market
review, effectively raised the threshold for entry to homeownership by ensuring the loans are
affordable and the quality of the income stream (Policis, 2010).
Workings against these factors that may limit marginal homeownership on the other hand are
the expansion of government demand-side schemes that aim to bolster access to the tenure for
low- to middle-income households, Help to Buy, shared ownership and Starter Homes.
Although, shared ownership and Help to Buy equity loans are often now used by middle to
higher income households struggling with high housing costs rather than low-incomes (GLA
Housing Committee, 2015; Pharaoh et al., 2015; Finlay et al., 2016). A number of factors may
strengthen demand for homeownership: including pressures from registered providers including
those outside of London and the South East to more widely offer shared ownership to cross-
subsidise other activities; shared ownership is set to expand and has a lower entry threshold
than Help to Buy or Starter Homes (de Santos, 2013); and moves such as Pay-to-Stay and the
limitations on lifetime tenancies in social housing (Shelter, 2016). The impact of these
government sponsored schemes on any decline in homeownership among lower occupational
classes and younger households are likely to be modest, however, so may do little to increase
marginal ownership, rather shift subsidy further up the income scale in pressured housing
markets. Setting the bar higher may limit some of the marginal owners who were at greater risk
of poverty and dropping out of the tenure in the future, while once again promoting the tenure
among routine or manual income groups holds the potential to expand the risks of
homeownership and it is uncertain how these competing pressures will play out.
There are indications that mortgage terms are extending to stretch affordability increasing the
total sums to be repaid and prolonging the debt burden ever further. The proportion of first time
buyers with mortgages over 30 years is 38 percent (DCLG, 2015b) and for loans advanced on
terms over 35 years the proportion has risen from 16 percent in 2007 to 26 percent by 2015
(Halifax, 2016). Given the average age of first time buyers is 33 (DCLG, 2016), it means that
fewer homeowners are likely to enjoy a mortgage free period prior to retirement, or be able to
extend their terms to stretch affordability during the period of their mortgage if they were
struggling and/or had to capitalise any arrears. The FSA (2010) wanted affordability appraisals
calculated on a 25 year basis but fell short of proscribing loan terms to 25 years. The FSA
(2012) noted that in 2007, 26 percent of loans were advanced with the expectation that they
would extend beyond retirement, despite only 11-12 percent of people working beyond that age.
Employment in later life is increasing so income shocks may be less prevalent, but this remains

35
problematic as borrower types that are more likely to hold loans into retirement are: credit-
impaired, purchased using the Right-to-Buy, self-certified, self-employed, debt consolidation and
interest-only, although this is possibly due to some of these borrowers having an older age
profile anyway who display additional payment problems (ibid.). Overton and Fox-Mahoney
(2015) note that tighter regulation has brought the proportion of loans for those in retirement
down, and that for some borrowing into retirement may be a sensible strategy to manage
income and assets, but for others it reflects a financial strain, not least for those with interest-
only loans without a repayment vehicle or other debts. Whether there will be an overhang of
problematic loans in later life from the period of more liberal lending prior to the crisis or whether
this issue will be managed into decline is uncertain.
Conclusion While the UK saw rising housing markets the weaknesses in mass homeownership were side-
lined until exposed by the financial crisis. We see today, that half of all poor households are still
homeowners and that the impact of the downturn has been more greatly felt by homeowners on
the lowest incomes. The potential of housing wealth to promote transitions out of poverty is
apparent for older outright homeowners but increases financial distress for lower-income
mortgagors, and is unevenly distributed across the country limiting its universal utility. Any
resumption of area-based initiatives to support households in poverty may also miss low-income
homeowners. Homeownership has been popular with the public but also amongst politicians as
it shifts responsibilities towards individual households to secure their own future. While there
are now greater publicly sponsored opportunities for homeownership for households down the
income spectrum, social security safety nets available to struggling mortgage borrowers are
simultaneously being undermined leaving a significant policy gap. The transfer of risk that
homeownership represents is currently underplayed, possibly taking comfort from the less
profound impact of the last economic downturn on arrears and repossessions than during the
1990s downturn. Nonetheless, the risks are felt across the income spectrum but are significant
for less affluent households and can induce financial distress and adversely impact upon
homeowners’ mental health. Further moves to once again expand the tenure must be
contingent on securing adequate social protection for homeowners who face the increasing
precarity of the labour market, particularly for younger households; extended debt burdens, not
least because we have a low inflation environment; and borrowers and lenders have fewer tools
to apply to any new income shocks for individuals or the wider economy.
References Aron, J. & Muellbauer, J., (2016) Modelling and Forecasting Mortgage Delinquency and
Foreclosure in the UK. Journal of Urban Economics. Accepted manuscript available at:
http://www.sciencedirect.com/science/article/pii/S0094119016000255.

36
Bradshaw, J., Chzhen, Y. and Stephens, M. (2008) Housing: the saving grace in the British
welfare state?, in S. Fitzpatrick and M. Stephens (eds.) The Future of Social Housing, Shelter,
London, pp. 7-25.
Bastagli, F. & Hills, J. (2013) Wealth accumulation, ageing, and house prices. Wealth in the UK:
Distribution, Accumulation, and Policy. 63.
Battu, H., Ma, A. & Phimister, E. (2008) Housing Tenure, Job Mobility and Unemployment in the
UK*. The Economic journal of Nepal. 118 (527), 311–328.
Belsky, E., Retsinas, N. & Duda, M. (2007) The financial returns to low-income homeownership.
Blacklock, K. & Whittaker, M. (2014) Hangover Cure: Dealing with the household debt overhang
as interest rates rise.
Bramley, G. (2011) Affordability, poverty and housing need: triangulating measures and
standards. Journal of Housing and the Built Environment. 27 (2), 133–151.
Bramley, G. & Karley, N.K. (2007) Homeownership, Poverty and Educational Achievement:
School Effects as Neighbourhood Effects. Housing Studies. 22 (5), 693–721.
Bramley, G., Karley, N.K., Lederle, N., Littlewood, M., Morgan, J., Sosenko, F., Stephens, M. &
Wallace, A. (2008) Evaluation of the national mortgage to rent scheme. Scottish
Government Social Research.
Bunn, P. (2015) The potential impact of higher interest rate and further fiscal consolidation o
households: evidence from the NMG Consulting survey. London: Bank of England.
Burbidge, A. (2000) Capital Gains, Homeownership and Economic Inequality. Housing Studies.
15 (2), 259–280.
Burrows, R. (2003) Home ownership and poverty in Britain. York: Joseph Rowntree Foundation.
Burrows, R. (1998) Mortgage indebtedness in England: an’epidemiology'. Housing Studies. 13
(1), 5–21.
Burrows, R. & Ford, J. (1998) Self-Employment and Home Ownership after the Enterprise
Culture. Work, employment & society: a journal of the British Sociological Association. 12
(1), 97–119.
Burrows, R. & Wilcox, S. (2001) Half the poor: Home-owners with low-incomes. London: Council
of Mortgage Lenders.
Burrows, R. & Wilcox, S. (2004) Low-income Homeowners in Wales. Joseph Rowntree
Foundation.
Bhutta, N., Dokko, J and Shan, H. (2010), The depth of negative equity and mortgage default
decisions. Finance and Economics Discussion Series, Washington DC, Federal Reserve

37
Board.
Cameron, G. & Muellbauer, J. (1998) The Housing Market and Regional Commuting and
Migration Choices. Scottish journal of political economy. 45 (4), 420–446.
Carney, M. (2016) Turn of the Year Speech, Preston Lecture, Queen Mary University, London
19 January 2016. Available at:
http://www.bankofengland.co.uk/publications/Pages/speeches/2016/873.aspx
Cole, I., Green, S., McCarthy, L. & Pattison, B. (2015) The Impact of the Existing Right to Buy
and the Implications for the Proposed Extension of Right to Buy to Housing Associations.
Sheffield: Centre for Regional Economic and Social Research, Sheffield Hallam University.
Colic‐ Peisker, V. & Johnson, G. (2010) Security and Anxiety of Homeownership: Perceptions
of Middle‐ class Australians at Different Stages of their Housing Careers. Housing, Theory
and Society. 27 (4), 351–371.
Corlett, A., Finch, D. & Whittaker, M. (2016) The experiences of low to middle income
households in downturn and recovery. London: Resolution Foundation.
Cowan, D., Wallace, A. and Carr, H. (2015) Exploring Experiences of Shared Ownership
Housing: Reconciling Owning and Renting Bristol, Law School.
Cribb, J., Hood, A., Joyce, R. and Phillips, D. (2012) Living Standards, Poverty and Inequality in
the UK: 2013. London: Institute for Fiscal Studies.
Crouch, C. (2009) Privatised Keynesianism: An Unacknowledged Policy Regime. British Journal
of Politics and International Relations. 11 (3), 382–399.
Cullinane, C., Scott, S. & Silvester, H. (2013) People living in bad housing – numbers and health
impacts. London: Shelter/National Centre Social Research.
Davidson, M., Nicol, S., Roys, M., Garrett, H., Beaumont, A. & Turner, C. (2012) The Cost of
Poor Housing in Northern Ireland. IHS Bre Press.
DCLG (2011) Laying the Foundations: A Housing Strategy for England. London: Department of
Communities and Local Government.
DCLG (2016) English Housing Survey- Headline Report 2014-215. London: Department of
Communities and Local Government.
DCLG (2015a) English Housing Survey Households Annual report on England’s households,
2013-14. London: Department of Communities and Local Government.
DCLG (2015b) English Housing Survey PROFILE OF ENGLISH HOUSING 2013. London:
Department of Communities and Local Government.
Deidda, M. (2014) Economic Hardship, Housing Cost Burden and Tenure Status: Evidence from

38
EU-SILC. Journal of family and economic issues. 36 (4), 531–556.
Dewilde, C. & Raeymaeckers, P. (2008) The trade-off between home-ownership and pensions:
individual and institutional determinants of old-age poverty. Ageing and society, 28(06),
pp.805–830.
Doling, J. & Ronald, R. (2010) Home ownership and asset-based welfare. Journal of Housing
and the Built Environment. 25 (2), 165–173.
DSD (2015) Housing Repossessions Taskforce’s Final Report. Belfast: Department of Social
Development.
DWP (2009) Households below average income: An analysis of the income distribution
1994/95-2008/09. London: Department of Work and Pensions.
DWP (2015) Households Below Average Income: An analysis of the income distribution
1994/95 to 2013/14. London: Department of Work and Pensions.
DWP (2012) SMI profile household and PTE FINAL.doc. London: Department of Work and
Pensions.
Elsinga, M.G. & Hoekstra, J. (2015) The Janus Face of Homeownership-based Welfare. Critical
Housing Analysis, 2 (1), 2015.
FCA (2014) Consumer credit and consumers in vulnerable circumstances. London: Financial
Conduct Authority.
Finlay, S., Williams, P. & Whitehead, C. (2016) Evaluation of the Help to Buy Equity Loan
Scheme. London: Department of Communities and Local Government.
Fletcher, D.R. (2009) Social Tenants, Attachment to Place and Work in the Post-industrial
Labour Market: Underlining the Limits of Housing-based Explanations of Labour
Immobility? Housing Studies. 24 (6), 775–791.
Ford, J., Bretherton, J., Jones, A. & Rhodes, D. (2010) Giving Up Home Ownership: A
qualitative study of voluntary possession and selling because of financial difficulties.
London: Communities and Local Government.
Ford, J., Burrows, R. & Nettleton, S. (2001) Home ownership in a risk society: a social analysis
of mortgage arrears and possessions. Associated University Press.
Ford, J. & Kempson, E. (1997) Bridging the Gap?: Safety nets for mortgage borrowers. Centre
For Housing Policy, University Of York.
Ford, J., Kempson, E. & England, J. (1996) Housing costs, housing benefits and work
disincentives. Vol. 185. York: Joseph Rowntree Foundation.
Ford, J., Munro, M., Smith, S., Sprigings, N. & Wallace, A. (2011) Review of the 2009 and 2010

39
Changes to Support for Mortgage Interest. London: Department of Work.
Ford, J. & Wallace, A. (2012) Mortgage default: consequences. International Encyclopaedia of
Housing and the Home. 346–353.
Ford, J. & Wallace, A. (2009) Uncharted territory: Managing mortgage arrears and possessions.
London: Shelter.
Ford, J. & Wilcox, S. (1994) Affordable housing, low-incomes and the flexible labour market.
National Federation of Housing Associations.
Forrest, R., Murie, A. & Williams, P. (1990) Home ownership: Differentiation and fragmentation.
Unwin Hyman London.
Fox O’Mahony, L. & Overton, L. (2014) Financial Advice, Differentiated Consumers, and the
Regulation of Equity-release Transactions. Journal of law and society. 41 (3), 446–469.
FSA (2012) Mortgage Market Review Data Pack. London: Financial Services Authority.
FSA (2010) Mortgage Market Review: Responsible Lending. London: Financial Services
Authority.
Gall, A. (2009) Understanding Mortgage Arrears. Building Societies Association.
Gardiner, L. (2014) Housing pinched. Understanding which housheholds spend the most on
housing costs. Resoluton Foundation.
Gathergood. J. (2012) Debt and Depression: Causal links and social norm effects. The Economic Journal 122 (September) 1094-1114. Gerardi, K., K. Herkenhoff, L. Ohanian and P. Willen (2013), ‘Unemployment, negative equity
and strategic default’, Working Paper, Atlanta: Federal Reserve Bank of Atlanta.
Gibb, K., Stephens, M., Reuschke, D., Wright, S., Besemer, K. & Sosenko, F. (2016) How does
housing affect work incentives for people in poverty? York: Joseph Rowntree Foundation.
GLA Housing Committee (2015) First Steps on the Ladder? An appraisal of shared ownership in
London. London: Greater London Assembly.
Gregg, P. & Gardiner, L. (2015) A steady job? Stability since the millennium. London:
Resolution Foundation.
Halifax (2016) Number of first-time buyers remains buoyant at over 300,000 for second year- Press Release 11 January 2016. London: Lloyds Banking Group.
Hamnett, C. (1999) Winners and losers. London: Routledge.
Hancock, R. (1998) Housing wealth, income and financial wealth of older people in Britain.

40
Ageing and society.
HCA (n.d.) Shared Ownership Affordability Calculators – Guidance note. London: Homes and
Communities Agency.
Hirsch, D. (2015) A minimum income standard for the UK in 2015. York: Joseph Rowntree
Foundation.
Inclusion, C.F.F. (2011) Report 1: Debt and Household Incomes. London: Consumer Credit
Counselling Service.
Karagiannaki, E. (2011) The impact of inheritance on the distribution of wealth: Evidence from
the UK. London: London School of Economic CASE.
Kemeny, J. (2005) “The Really Big Trade‐Off” between Home Ownership and Welfare: Castles’
Evaluation of the 1980 Thesis, and a Reformulation 25 Years on. Housing, Theory and Society, 22(2), pp.59–75.
Lau, C. & Leung, L.A. (2014) Mortgage debt as a moderator in the association between
unemployment and health. Public health. 128 (3), 239–245.
Lyons, M. (2016) The Lyons Housing Commission- Update February 2016.
Malpass, P. (2008) Housing and the New Welfare State: Wobbly Pillar or Cornerstone? Housing
Studies. 23 (1), 1–19.
McInnes, T., Aldridge, H., Bushe, S., Tinson, A. & Born, T.B. (2014) Monitoring Poverty and
Social Exclusion 2014. York: Joseph Rowntree Foundation.
McIntosh, S. (2013) Hollowing out and the future of the labour market. Department of Business
and Skills.
McKnight, A. (2011) Estimates of the Asset-Effect: The Search for a Causal Effect of Assets on
Adult Health and Employment Outcomes.
Meadows, P. & Rogger, D. (2005) Low-income homeowners in Britain: descriptive analysis.
London: Department for Work and Pensions (DWP).
Montgomerie, J. & Büdenbender, M. (2015) Round the Houses: Homeownership and Failures of
Asset-Based Welfare in the United Kingdom. New Political Economy. 20 (3), 386–405.
Morton, A. (2010) Making housing affordable. Policy Exchange. London.
Munro, M. (2007) Evaluating Policy Towards Increasing Owner Occupation. Housing Studies.
22 (2), 243–260.
Munro, M., Smith, S. & Ford, J. (2010) An evaluation of the January 2009 arrangements for
Support for Mortgage Interest.

41
Murie, A. & Williams, P. (2015) A Presumption in Favour of Home Ownership? Reconsidering
Housing Tenure Strategies. Housing Studies. 30 (5), 656–676.
Murphy, A., Muellbauer, J. & Cameron, G. (2006) Housing market dynamics and regional
migration in Britain. Centre for Economic Policy Research.
Nettleton, S. & Burrows, R. (2000) When a capital investment becomes an emotional loss: the
health consequences of the experience of mortgage possession in England. Housing
Studies. 15 (3), 463–478.
Nettleton, S., England, J., Burrows, R. & J (1999) Losing the family home Understanding the
social consequences of mortgage repossession. York: York: York Publishing Services Ltd.
ODPM (2005) HomeBuy – expanding the opportunity to own. London: Office of the Deputy
Prime Minister.
ONS (2014) Property Wealth, Wealth in Great Britain 2010-12. London: Ofrfice of National
Statistics.
O’Sullivan, A. & Gibb, K. (2012) Housing Taxation and the Economic Benefits of
Homeownership. Housing Studies. 27 (2), 267–279.
Overton, L. (2010) Housing and Finance in Later Life: A study of UK equity release customers.
London and Birmingham, Age UK and University of Birmingham.
Overton, L. & Fox-Mahoney, L. (2015) Consumer Demand for Retirement Borrowing. London:
Council of Mortgage Lenders.
Padley, M. & Hirsch, D. (2015) Households below a Minimum Income Standard: 2008/09 to
2013/14. York: Joseph Rowntree Foundation.
Parkinson, S., Searle, B.A., Smith, S.J., Stoakes, A. & Wood, G. (2009) Mortgage equity
withdrawal in Australia and Britain: towards a wealth-fare state? European Journal of.
Pevalin, D.J. (2009) Housing repossessions, evictions and common mental illness in the UK:
results from a household panel study. Journal of epidemiology and community health. 63
(11), 949–951.
Pharoah, R., Holland, J. and Wooton, J. (2015) A fair share? Understanding residents’
experiences of shared ownership. London: Viridian Housing.
Policis (2010) New approaches to mortgage market regulation. London: Council of Mortgage
Lenders.
Pryce, G. & Sprigings, N. (2009) Outlook for UK housing and the implications for policy: Are we
reaping what we have sown? International Journal of Housing Markets and Analysis. 2 (2),
145–166.

42
Quilgars, D. & Jones, A. (2010) Housing Wealth: A Safety Net of Last Resort? Findings from a
European Study. The Blackwell Companion to the Economics of Housing: The Housing
Wealth of Nations. 295.
Rohe, W.M. & Lindblad, M., (2013) Re-examining the social benefits of homeownership after the
housing crisis. In Paper originally presented at ‘Homeownership Built to Last: Lessons from
the Housing Crisis on Sustaining Homeownership for Low-Income and Minority Families’--A
National Symposium held on April. Available at:
http://jchs.harvard.edu/sites/jchs.harvard.edu/files/hbtl-04.pdf
Rowlingson, K. & McKay, S. (2012) Wealth and the Wealthy: Exploring and Tackling Inequalities
Between Rich and Poor. Policy Press.
de Santos, R. (2013) Homes for forgotten families. London: Sheler.
Schelkle, W. (2012) A Crisis of What? Mortgage Credit Markets and the Social Policy of
Promoting Homeownership in the United States and in Europe. Politics & society. 40 (1),
59–80.
Schwartz, H. & Seabrooke, L. (2008) Varieties of Residential Capitalism in the International
Political Economy: Old Welfare States and the New Politics of Housing. Comparative
European Politics. 6 (3), 237–261.
Searle, B.A. (2013) Recession, Repossession and Family Welfare. Child and Family Law
Quarterly.
Searle, B.A. & Köppe, S. (2014) Assets, saving and wealth, and poverty: A Review of evidence.
Final report to the Joseph Rowntree Foundation. York: Joseph Rowntree Foundation.
Searle, B.A. & McCollum, D. (2014) Property-based welfare and the search for generational
equality. International Journal of Housing Policy. 14 (4), 325–343.
Shelter (2016) Housing and Planning Bill: Second reading briefing (House of Commons).
London: Shelter.
Smith, S.J. (2015) Owner occupation: at home in a spatial, financial paradox. International
Journal of Housing Policy. 15 (1), 61–83.
Smith, S.J., Searle, B.A. & Cook, N. (2008) Rethinking the Risks of Home Ownership. Journal of
social policy. 38 (01), 83–102.
Stephens, M. (2011) Tackling housing market volatility in the UK. York: Joseph Rowntree
Foundation.
Stephens, M., Dailly, M. & Wilcox, S. (2008) Developing safety nets for home-owners. Joseph
Rowntree Foundation York.
Stephens, M., Leishman, C., Bramley, G., Ferrari, E. & Rae, A. (2014) What will the housing

43
market look like in 2040. York: Joseph Rowntree Foundation.
Stephens, M. & Quilgars, D. (2008) Sub-prime Mortgage Lending in the UK. International
Journal of Housing Policy. 8 (2), 197–215.
Stephens, M. & van Steen, G. (2011) ‘Housing Poverty’ and Income Poverty in England and
The Netherlands. Housing Studies. 26 (7-8), 1035–1057.
Stone, M.E. (2006) A Housing Affordability Standard for the UK. Housing Studies. 21 (4), 453–
476.
Tatch, J. (2009), ‘Homeowner housing equity through the downturn’, Housing Finance, Issue 1,
2009. London: Council of Mortgage Lenders.
Thomas, B. & Dorling, D. (2004) Know your place: housing, wealth and inequality in Great
Britain, 1980-2003 and beyond. London: Shelter.
Treasury, H.M. (2015) Summer Budget 2015. London: HM Treasury.
Tunstall, R., Bevan, M. & Bradshaw, J. (2013) The links between housing and poverty: an
evidence review. York: Joseph Rowntree Foundation.
Wallace, A. (2010) 'Public attitudes to housing', paper for the Housing Market Taskforce, York;
Joseph Rowntree Foundation.
Wallace, A. & Ford, J. (2010) Limiting Possessions? Managing Mortgage Arrears in a New Era.
International Journal of Housing Policy. 10 (2), 133–154.
Wallace, A., Jones, A. & Rhodes, D. (2014) Financial Resilience and Security: Examining the
Impact of Falling Housing Markets on Low-income Homeowners in Northern Ireland.
Belfast: Office of the First Minister and Deputy Prime Minister.
Wallace, A., Quilgars, D. & Ford, J. (2011) Exiting Unsustainable Homeownership:
Understanding Current Practice and the Potential of Assisted Voluntary Sales: Final Report.
Centre for Housing Policy, University of York.
Watson, D. & Webb, R. (2009) Do Europeans View their Homes as Castles? Homeownership
and Poverty Perception throughout Europe. Urban studies . 46 (9), 1787–1805.
Whitehead, C.M.E. (1991) From Need to Affordability: An Analysis of UK Housing Objectives.
Urban studies . 28 (6), 871–887.
Widdowfield, R. & Wilkinson, D. (2002) Owner Occupation among Low-income Households in
Scotland. Edinburgh: Scottish Executive.
Wilcox, S. (2005) Home-ownership Risks and Sustainability.
Wilcox, S. & Pawson, H. (2012) UK Housing Review -Briefing Paper. Coventry: Chartered

44
Institute of Housing.
Wilcox, S., Wallace, A., Bramley, G., Morgan, J., Sosenko, F. & Ford, J. (2010) Evaluation of
the mortgage rescue scheme and homeowners mortgage support. London: Department of
Communities and Local Government.
Wilcox, S. & Williams, P. (2013) Building an effective safety net for home owners and the
housing market. York: Joseph Rowntree Foundation.
Wood, G.A., Smith, S.J., Cigdem, M. & Ong, R. (2015) Life on the edge: a perspective on
precarious home ownership in Australia and the UK. International Journal of Housing
Policy. 0 (0), 1–26.
Ford, J., & Wallace, A. (2011). The consequences of mortgage default. In Smith, S (Ed)
International Encyclopaedia of Housing and Home. London: Elsevier.
Oswald, A.J. (1999) The Housing Market and Europe’s Unemployment: A Nontechnical Paper,
mimeo University of Warwick.
Wallace, A (2016) Housing and Communities’ inequalities in Northern Ireland. Belfast, Equality
Commission for Northern Ireland
Wilcox S (2003) Giving Credit Where it's Due: Home owners and tax credits. London: Council of
Mortgage Lenders.


![Poverty Myths...60 will be below the official poverty line for at least one year, and another 10% will be near the poverty line for a year.[2] A literature review on poverty dynamics](https://img.dokumen.tips/doc/110x75/5f3c44b99b207c16bd568492/poverty-myths-60-will-be-below-the-official-poverty-line-for-at-least-one-year.jpg)