Embed Size (px)
Citation preview

Technical Report Documentation Page
I. Repor' No. 2. Government Accession No. 3. Recipient"s CO'olog No.
FHWA/TX-93+l2ll-lF
4. T"le and Sub,,'le
FRETTING FATIGUE IN EXTERNAL POST-TENSIONED TENDONS
5. Repor' Da'e
December 1992 6. Performing Organi za'ion Code
1--:;----:--:-:--------------------------------1 8. Performing Organi za'i an Repor' No. 7. Au'horis)
K. K. Ryals, J. E. Breen, and M. E. Kreger
9. Performing Organi zalion Name and Address
Center for Transportation Research The University of Texas at Austin Austin, Texas 78712-1075
Research Report l2ll-lF
10. Work Un,' No. (TRAIS)
II. Conlracl or Gran' No.
Research Study 3-5-89/2-1211
13. Type of Reporl and Period Covered ~~----------------~----------------------------~ 12. Sponsoring Agency Name and Addre ..
Texas Department of Transportation Transportation Planning Division P. O. Box 5051 Austin, Texas 78763-5051 IS. Supplemenlary Noles
Final
14. Sponlaring Agency Code
Study conducted in cooperation with the U. S. Department of Transportation, Federal Highway Administration
Research Study Title: ''Fretting Fatigue in External Post-Tensioned Tendons" 16. Abstracl
External post-tensioning tendons are frequently used in the construction of multiple span box girder bridges. They occur particularly frequently in long bridges erected using span-by-span construction as in elevated urban freeways and over water viaducts. In addition, they have been successfully used in a number of bridge strengthening projects.
Since external tendons are physically connected to the concrete superstructure at only a few discrete locations, they act more as unbonded tendons than bonded tendons. The potential for fatigue distress in unbonded tendons is generally lower than in bonded tendons since the stress range in unbonded tendons is usually lower because of the long averaging length of free tendon. However, the external tendons usually have substantial angle changes concentrated over fairly short lengths at the deviators where the tendons are connected to the concrete sections. All of the basic requirements for fretting are present and accentuated at these deviators. There has been a concern that such potential for fretting might endanger the fatigue resistance of the tendon and cause premature failure.
The objectives of this study were to build and cyclically load tendons with concentrated angle changes representative of external tendons and typical deviator details. The specimens were to be examined for evidence of fretting fatigue. Recommendations for changes in design or construction techniques were to be made to reduce the potential for harmful fretting fatigue. No evidence of fretting fatigue worse than that found with internal post-tensioned tendons was found. A wide range of prestressed concrete fatigue applications was examined and a comprehensive design procedure for fatigue applications was suggested.
17. Key Words
pos t- tensioned tendons, pos t- tensioni,;g, multiple span box girder bridges, spanby-spa~ construction, concrete superstructure, bonded, external, deviators
18. Di llri bution Statemenl
No res tric tions. This document is available to the public through the National Technical Information Service, Springfield, Virginia 22161.
19. Securily Classif. (of thil report)
Ur,classified
20. Securi Iy Classd. (of thi I pagel
Unclassified
21. No. of Pagel 22. Price
102
Form DOT F 1700.7 (8-72) Reproduction of completed page authori zed
! ! i
FRETTING FATIGUE IN EXTERNAL POST-TENSIONED TENDONS
by
K. K. Ryals J. E. Breen
M. E. Kreger
Research Report 1211-1 F
Research Project 3-5-89/2-7277
Fretting Fatigue in External Post-Tensioned Tendons
conducted for the
Texas Department of Transportation
in cooperation with the
u.s. Department of Transportation Federal Highway Administration
by the
CENTER FOR TRANSPORTATION RESEARCH Bureau of Engineering Research
THE UNIVERSITY OF TEXAS AT AUSTIN
December 1992

NOT INTENDED FOR CONSTRUCTION,
PERMIT, OR BIDDING PURPOSES
John E. Breen (Texas No. 18479)
Michael E. Kreger (Texas No. 65541)
Research Supervisors
The contents of this report reflect the views of the authors, who are responsible for the facts and the accuracy of the data presented herein. The contents do not necessarily reflect the official views or policies of the Federal Highway Administration or the Texas Department of Transportation. This report does not constitute a standard, specification, or regulation.
There was no invention or discovery conceived or first actually reduced to practice in the course of or under this contract, including any art, method, process, machine, manufacture, design or composition of matter, or any new and useful improvement thereof, or any variety of plant which is or may be patentable under the patent laws of the United States of America or any foreign country.
11

PREFACE
This report is the final report of a multi-year research program, and summarizes an investigation which examined the potential for fretting fatigue in the deviator regions of external post-tensioned tendons such as those typically used in segmental box girder bridges erected by the span-by-span construction method. A series of realistic fatigue tests was used to document the potential for fretting fatigue and, particularly, the effect of construction tolerances and misalignment on such type failures. A thorough re-examination of fatigue data for a broad range of prestressed concrete tendon applications was made to develop consistent design recommendations for prestressed concrete including deviated external tendons.
This work was part of Research Project 3-5-89-1211, entitled "Fretting Fatigue in External Post-Tensioned Tendons." The research was conducted by the Phil M. Ferguson Structural Engineering Laboratory as part of the overall research program of the Center for Transportation Research of The University of Texas at Austin. The work was supported by the Texas Department of Transportation and the Federal Highway Administration under an agreement between The University of Texas at Austin and the Texas Department of Transportation.
Liaison with the Texas Department of Transportation was maintained through their technical coordinator, Mr. Brian Merrill. The overall construction, testing, and analysis of data was the direct responsibility of Ms. Karen K. Ryals, Assistant Research Engineer. Design of the equipment and the initial test specimen, as well as much of the literature review, was the responsibility of Mr. Cliff R. Hall, Assistant Research Engineer whose contributions the authors would especially like to recognize. The study was co-directed by Associate Professor Michael E. Kreger and Professor John E. Breen, who holds the Nasser 1. AI-Rashid Chair in Civil Engineering.
This final report is based primarily on the thesis of the senior author, Ms. Ryals.
iii

!!!!!!!!!!!!!!!!!!!"#$%!&'()!*)&+',)%!'-!$-.)-.$/-'++0!1+'-2!&'()!$-!.#)!/*$($-'+3!
44!5"6!7$1*'*0!8$($.$9'.$/-!")':!

SUMMARY
External post-tensioning tendons are frequently used in the construction of multiple-span box girder bridges. They occur particularly frequently in long bridges erected using span-byspan construction as in elevated urban freeways and over water viaducts. In addition they have been successfully used in a number of bridge strengthening projects.
Since external tendons are physically connected to the concrete superstructure at only a few discrete locations, they act more as unbonded tendons than bonded tendons. The potential for fatigue distress in unbonded tendons is generally lower than in bonded tendons since the stress range in unbonded tendons is usually lower because of the long averaging length of free tendon. However, the external tendons usually have substantial angle changes concentrated over fairly short lengths at the deviators where the tendons are connected to the concrete sections. All of the basic requirements for fretting are present and accentuated at these deviators. There has been a concern that such potential for fretting might endanger the fatigue resistance of the tendon and cause premature fail ure.
The objectives of this study were to build and cyclically load tendons with concentrated angle changes representative of external tendons and typical deviator details. The specimens were to be examined for evidence of fretting fatigue. Recommendations for changes in design or construction techniques were to be made to reduce the potential for harmful fretting fatigue.
Tests were run at a purposely elevated stress range (24 ksi) using typical details as well as misalignments representing typical noted field tolerances and a "worst case" scenario. No evidence of fretting fatigue worse than that found with internal post-tensioned tendons was found. A wide range of prestressed concrete fatigue applications was examined and a comprehensive design procedure for fatigue applications was suggested. This approach links the design approach for fatigue in prestressed concrete criteria to those proposed by AASHTO for fatigue in structural steel bridges. This has the advantage of allowing the designer to consider the class of the highway and the average daily truck traffic in determining the allowable cyclic stress range in the tendons for the various prestressing strand applications including pretensioning, internal post-tensioning and external post-tensioning.
v

!!!!!!!!!!!!!!!!!!!"#$%!&'()!*)&+',)%!'-!$-.)-.$/-'++0!1+'-2!&'()!$-!.#)!/*$($-'+3!
44!5"6!7$1*'*0!8$($.$9'.$/-!")':!

Il\1PLEMENTATION
The successful completion of this project is embodied in the finding that even with the worst case misalignment conditions likely to happen in field construction, the potential for fretting fatigue in external tendons in post-tensioned construction is not significantly higher than with internal tendons. No comprehensive test information on fatigue resistance for such applications has previously been reported although some questions have been raised regarding the possible harmful consequences of such fretting fatigue.
In addition to clearly showing that current design and construction procedures are generally acceptable and safe, the study recommendations synthesize the results of several earlier prestressed concrete fatigue studies and present a generalized fatigue design approach for strand tendons in pretensioned and post-tensioned concrete including internal and external tendons. This generalized approach is based on values typically used in fatigue design of structural steel under the AASHTO Bridge Design Specifications. It allows the designer to reflect the highway class and expected average daily truck traffic in the design for fatigue. The adoption of this procedure would provide a more rational and more flexible design approach and should result in both improved safety and economy. The conservatism of the current approach, which requires excessive amounts of prestressing to absolutely preclude cracking at service load levels, could be substantially reduced for many secondary structures such as rural overpasses and bridges on low volume roads with resultant savings in costs and reduction in congestion due to the reduced number of strands.
Vll

METRIC (SI*) CONVERSION FACTORS
APPROXIMATE CONVERSIONS TO SI UNITS APPROXIMATE CONVERSIONS FROM 51 UNITS
Symbol When You Know Multiply by To Find Symbol Symbol When You Know Multiply by To Find Symbol
LENGTH LENGTH
in inches 2.54 centimeters cm mm millimeters 0.039 inches In ft feet 0.3048 meters m m meters 3.28 feet ft yd yards 0.914 meters m m meters 1.09 yards yd mi miles 1.61 kilometers km km kilometers 0.621 miles ml
AREA
AREA in 2 mm2 milfimeters squared 0.0016 square inches
m2 meters squared 10.764 square feet ft2
m 2 meters squared 1.20 square yards yd 2
In 2 square inches 645.2 millimeters squared mm 2 km 2 kilometers squared 0.39 square miles mi 2 fl2 square feet 0.0929 meters squared m 2 ha hectares (10,000 m2) 2.53 acres ac yd2 square yards 0.836 meters squared m 2
mi2 square miles 2.59 kilometers squared km2 MASS (weight)
ac acres 0.395 hectares ha
g grams 0.0353 ounces oz
MASS (weight) kg kilograms 2205 pounds Ib Mg megagrams (1.000 kg) 1.103 short tons T
oz ounces 28.35 grams g VOLUME Ib pounds 0.454 kilograms kg
T short tons (2.000 Ib) 0.907 megagrams Mg mL millHiters 0.034 fluid ounces fl oz L HIers 0.264 gallons gal m3 meters cubed 35.315 cubic teet ft3
VOLUME m3 meters cubed 1.308 cubic yards yd3
fl oz mL TEMPERATURE (exact)
fluid ounces 29.57 milliliters gal gallons 3.785 liters L Celsius 915 (then Fahrenheit OF fl3 cubic feet 0.0326 meters CUbed m 3
temperature add 32) temperature yd 3 cubic yards 0.0765 meters cubed m 3
NOTE: Volumes greater than 1,000 L shall be shown in m3.
OF OF 32 98.6 212
40 0 ~ 00 ~1m 160 !2~~ TEMPERATURE (exact) I I I ' , , , ! , 'I! I ! ! ! !! ! ! I ! [ I I I I I I I I I
40 ·20 0 20 0 60 80 100
OF Fahrenheit 5/9 (after Celsius "C "C 37 "C
temperature subtracting 32) temperature These factors conform to the requirement of FHWA Order 5190.1A.
'* SI is the symbol for the International System of Measurements

TABLE OF CONTENTS
Page
CHAPTER 1 -- INTRODUCTION ...................................... 1 1.1 General .................................................. 1 1.2 Objectives ................................................. 3 1.3 Scope .................................................... 4
CHAPTER 2 -- BACKGROUND INFORMATION .......................... 5 2.1 Introduction ............................................... 5 2.2 Fatigue of Prestressed Concrete ................................ 5
2.2.1 General . . . . . . . . . . . . . . . . . . . . . . . . . . . . . . . . . . . . . . . . . . . . . 5 2.2.2 Fatigue of Pretensioned Concrete Beams . . . . . . . . . . . . . . . . . . . . 6 2.2.3 Fatigue of Post-Tensioned Concrete Beams ................. 7
2.2.3.1 Fretting Fatigue ................................ 9 2.2.3.2 Conclusions From Previous Research on Fatigue of
Post-Tensioned Concrete Beams ................... 10 2.3 Fatigue of External Tendons in Post-Tensioned Concrete ........... " 13
2.3.1 General ........................................... 13 2.3.2 Previous Studies of Externally Post-Tensioned Tendons ........ 13
CHAPTER 3 -- TEST PROGRAM ..................................... 17 3.1 Strand-in-Air Tests ......................................... 17 3.2 Fretting Fatigue Tests ...................................... , 18
3.2.1 Development of the Test Program ...................... " 18 3.2.2 Specimen Design ..................................... 21
Concrete Segment Design . . . . . . . . . . . . . . . . . . . . . . . . . . . .. 21 3.2.3 Materials . . . . . . . . . . . . . . . . . . . . . . . . . . . . . . . . . . . . . . . . . .. 22
3.2.3.1 Concrete .................................... 22 3.2.3.2 Prestressing Strand .. . . . . . . . . . . . . . . . . . . . . . . . . . .. 23 3.2.3.3 Passive Reinforcing ............................ 23 3.2.3.4 Post-Tensioning Duct ........................... 23 3.2.3.5 Grout . . . . . . . . . . . . . . . . . . . . . . . . . . . . . . . . . . . . . .. 24 3.2.3.6 Gripping System . . . . . . . . . . . . . . . . . . . . . . . . . . . . . .. 24
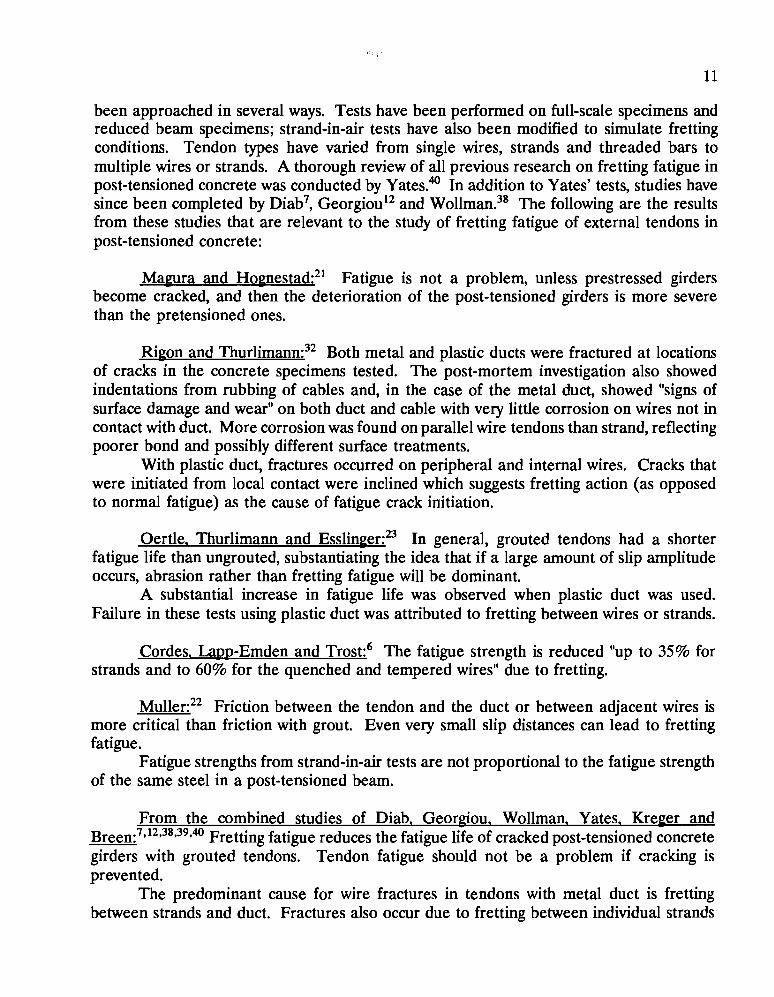
3.2.4 Fabrication ......................................... 24 3.2.4.1 Deviator Reinforcement ....................... " 24 3.2.4.2 Reinforcing Cage .............................. 25 3.2.4.3 Concrete Placing .............................. 25 3.2.4.4 Primary Wedges .............................. , 26 3.2.4.5 Post-Tensioning Procedure ....................... 26 3.2.4.6 Grouting Procedure ............................ 26
IX

3.2.5 Test Setup . . . . . . . . . . . . . . . . . . . . . . . . . . . . . . . . . . . . . . . . .. 27 3.2.5.1 Loading System ............................... 28 3.2.5.2 Closed-Loop System ............................ 28 3.2.5.3 Instrumentation ............................... 29
3.2.5.3.1 Strain Gages ........................... 29 3.2.5.3.2 Dial Gages ............................ 29
3.2.6 Test Procedure ...................................... 29 3.2.6.1 Cyclic Tests .................................. 29 3.2.6.2 Static Tests . . . . . . . . . . . . . . . . . . . . . . . . . . . . . . . . . .. 30 3.2.6.3 Post-Mortem Investigation ....................... 32
CHAPTER 4 -- DEVIATOR SPECIMEN TEST RESULTS ................... 33 4.1 General ................................................. 33
4.1.1 Data Collection . . . . . . . . . . . . . . . . . . . . . . . . . . . . . . . . . . . . .. 33 4.1.2 Determination of Stress Range .......................... 34 4.1.3 Determination of the Apparent Modulus ................... 35
4.2 Results of Deviator Specimen Tests . . . . . . . . . . . . . . . . . . . . . . . . . . . .. 37 4.2.1 Results of Test #1 .................................... 37
4.2.1.1 Variation of Strain ............................. 38 4.2.1.2 Tendon Strain Range ........................... 38 4.2.1.3 Segment Displacement ........ . . . . . . . . . . . . . . . . .. 39 4.2.1.4 Post-Mortem Investigation Results ................. 39
4.2.2 Results of Test #2 .................................... 43 4.2.2.1 Tendon Strain Range ........................... 43 4.2.2.2 Segment Displacement .. , . . . . . . . . . . . . . . . . . . . . . .. 44 4.2.2.3 Post-Mortem Investigation Results ................. 44 4.2.2.4 Repair of Deviator Cracking . . . . . . . . . . . . . . . . . . . . .. 46 4.2.2.5 Deviator Duct Cracking ......................... 51
4.2.3 Results of Test #3 . . . . . . . . . . . . . . . . . . . . . . . . . . . . . . . . . . .. 51 4.2.3.1 Tendon Strain Range ........................... 53 4.2.3.2 Segment Displacement ....... . . . . . . . . . . . . . . . . . .. 53 4.2.3.3 Post-Mortem Investigation Results ................. 54 4.2.3.4 Deviator Duct Cracking ......................... 54
CHAPTER 5 -- EVALUATION OF DEVIATOR FRETTING FATIGUE TEST RESULTS AND BASIS FOR DESIGN RECOMMENDATIONS ......... 59 5.1 Terminology ............................................. " 59
5.1.1 Terminology For the Deviator Fretting Fatigue Tests .......... 59 5.1.2 Comparison of Terminology For Related Tests .............. 63
5.2 Life of the Deviator Specimens ................................. 66 5.3 Comparison of the Fretting Fatigue Tests ........................ , 68 5.4 Design Recommendations .................................... 71 5.5 Summary ................................................. 75
x

CHAPTER 6 -- SUMMARY, CONCLUSIONS AND RECOMMENDATIONS .... 77 6.1 Summary ................................................ 77 6.2 Conclusions............................................... 77 6.3 Design Recommendations .................................... 78
BIBUOGRAPHY .................................................. 81
Xl

!!!!!!!!!!!!!!!!!!!"#$%!&'()!*)&+',)%!'-!$-.)-.$/-'++0!1+'-2!&'()!$-!.#)!/*$($-'+3!
44!5"6!7$1*'*0!8$($.$9'.$/-!")':!

Figure 1.1
Figure 2.1 Figure 2.2 Figure 2.3 Figure 2.4
Figure 2.5 Figure 2.6 Figure 2.7 Figure 2.8
Figure 2.9
Figure 2.10
Figure 3.1 Figure 3.2 Figure 3.3 Figure 3.4 Figure 3.5 Figure 3.6 Figure 3.7 Figure 3.8 Figure 3.9 Figure 3.10 Figure 3.11 Figure 3.12 Figure 3.13 Figure 3.14
Figure 3.15
Figure 3.16 Figure 4.1 Figure 4.2 Figure 4.3 Figure 4.4
LIST OF FIGURES
Page
Types of construction using prestressing tendons in box girders. (from Arrellaga3) ............................................ . Typical S-N plot. ........................................ . Stiffness history of girder tests?8 ............................ . Strand-in-air failure zone. (after Paulson26
) •••••••••••••••••••••
Fatigue life of rsretensioned girders, compared to Paulson's model. (after Overman 5 and Paulson26
) •••••••••••••••••••••••••••••
Current (1989) AASHTO design tables for structural steel. ........ . Schematic of the fretting mechanism.4o ••••••••••••••••••••••••
Effect of fretting on S-N curves.40 •••••••••••••••••••••••••••
Fatigue of post-tensioned girders with metal ducts, compared to Paulson's model. (after Wollmann38 and Paulson26) ••••••••••••••
Fatigue of post-tensioned girders with plastic ducts, compared to Paulson's model. (after Wollmann38 and Paulson26
) ••••••••••••••
Bugle shaped rigid metal deviator duct used in some French bridges. (after Powe1l29
) •••••••••••••••••••••••••••••••••••••••.•
Strand-in-air test setup. (after Halll3) ....................... . Double-chuck grip system for strand anchorage. (after Hall13
) ••••••
Strand-in-air test results. . ................................ . Comparison of suggested lower bound fatigue models. . .......... . Elevation of test setup. (after Hall13) ••••••••••••••••••••••••
Box-girder segment. (after Hall l3) .......................... . Test segment. (after Hall13
) •••••••••••••••••••••••••••••••
Duct layout in test segments. '" ........................... . Reinforcing cage in formwork. ............................. . Th · d 13 ree pIece copper we ge. ............... . . . . . . . . . . . . . . . . Grout injection detail. (after Hall l3) ........................ . Elevation of test setup. (after Hall13) ••••••••••••••••••••••••
Loading system. (after Hall l3) ............................. . Schematic of the closed-loop system and other instrumentation. (after Halll3) .............................................. . Unraveled wires at the deviator duct exit indicating wire breaks in the anchor head. . ......................................... . Removing the duct with the grouted tendon from the specimen. . ... . Strand arrangement in anchor heads. . ....................... . Strain gage readings for Test # 1 @ 80 kips applied load .......... . Strain gage readings for Test # 1 @ 98 kips applied load. . ........ . Strain range for Test # 1. ................................. .
Xlll
2 5 6 6
7 8
10 10
12
13
15 17 18 18 19 21 21 22 23 25 26 27 28 28
29
31 31 33 38 38 38

Figure 4.5 Figure 4.6 Figure 4.7 Figure 4.8
Figure 4.9
Figure 4.10
Figure 4.11
Figure 4.12
Figure 4.13 Figure 4.14 Figure 4.15 Figure 4.16 Figure 4.17 Figure 4.18 Figure 4.19 Figure 4.20 Figure 4.21 Figure 4.22 Figure 4.23 Figure 4.24
Figure 4.25 Figure 4.26 Figure 4.27 Figure 4.28 Figure 4.29 Figure 4.30 Figure 4.31 Figure 4.32 Figure 4.33 Figure 4.34
Figure 4.35 Figure 5.1 Figure 5.2 Figure 5.3
Figure 5.4
Strain range envelope for Test # 1. .......................... . Displacement of the segment during Test #1. ................. . Differential displacement of the segment during Test #1. ......... . Evidence of fretting damage to middle section of Test #1 deviator duct ................................................. . Evidence of fretting damage to inner section of the deviator duct in Test #1 .............................................. . Photograph of a Test #1 wire fracture with a fretting fatigue fracture surface ............................................... . Photograph of a Test # 1 wire fracture with a slightly angled fracture surface ............................................... . Photograph of a Test #1 wire fracture with a normal fatigue fracture surface ............................................... . Strain range for Test #2. . ................................ . Strain range envelope for Test #2 .......................... . Displacement of the segment during Test #2. . ................ . Differential displacement of the segment during Test #2 .......... . Wear due to fretting on the outer end of the Test #2 deviator duct. .. Overall view of the wear pattern on the Test #2 deviator ducts. . ... . Example of Test #2 fracture surfaces. . ...................... . Cracking at the dead end of the deviator in the Test #2 segment. .,. Cracking at the live end of the deviator in the Test #2 segment. ... . Vertical clamp on the dead end deviator of the Test #2 segment. .. . Rehabilitated live end deviator of the Test #2 segment. .......... . Horizontal clamp on Test #2 live end deviator viewed from underneath. . .......................................... . Spalling of the Test #2 dead end deviator ..................... . Average strain range for Test #3. . ......................... . Strain range for Test #3. . ................................ . Strain range envelope for Test #3 ........................... . Displacement of the segment during Test #3. . ................ . Differential displacement of the segment during Test #3 .......... . Wear due to fretting on the outer end of the Test #3 deviator duct. .. Overall wear pattern on the Test #3 deviator ducts .............. . Example of Test #3 fracture surfaces ........................ . End view of the cracking of the outside end of a Test #3 deviator duct. ................................................ . View of the underside of the cracked Test #3 deviator duct. ...... . Relative displacement versus log cycles for each test. ............ . Designation of the fourth wire fracture. . ..................... . Maximum static centerline deflection for Overman's Specimen C-16-NP-10.5-NO-0.58.25
••••••.•.•••.••••..••••..••••••••••••.
Crack width versus number of cycles for Yates' Specimen M-5-20-1.27.40 ............................................... .
XlV
38 39 39
40
40
41
41
42 43 44 44 44 45 45 46 48 48 49 49
50 51 52 53 53 53 53 54 55 55
56 56 60 62
63
64

Figure 5.5 Figure 5.6
Figure 5.7 Figure 5.8 Figure 5.9 Figure 5.10 Figure 5.11 Figure 5.12
Figure 5.13 Figure 5.14
Figure 5.15
Figure 5.16
Stiffness histories for Wollmann's Group M Specimens.38 ••••••••••
"First Observed Wire Fracture" and "Test Termination Fatigue Life" of deviator specimens compared to Paulson's model. .............. . Design life of deviator specimens compared to Paulson's model. .... . Stiffness history of girder tests.40
••.•••••••••••••••.•••••••••
Wear patterns and corrosion on the ducts ..................... . Shape of the tendon in the duct. ........................... . Schematic drawing of the wire fracture locations in each test. ...... . Fatigue life of pretensioned girders, compared to Paulson's model. (after Overman25 and Paulson26
) ••••••••••••••••••••••••••••
Current (1989) AASHTO design tables for structural steel. ....... . Fatigue of post-tensioned girders with metal ducts, compared to Paulson's model. (after Wollmann38 and Paulson26
) ••••••••••••••
Fatigue of post-tensioned girders with plastic ducts, compared to Paulson's model. (after Wollmann38 and Paulson26
) ••••••••••••••
"Design Fatigue Life" of deviator specimens compared to design models for other prestressing strand applications. . .............. .
xv
65
66 67 68 69 70 70
71 72
73
74
74

!!!!!!!!!!!!!!!!!!!"#$%!&'()!*)&+',)%!'-!$-.)-.$/-'++0!1+'-2!&'()!$-!.#)!/*$($-'+3!
44!5"6!7$1*'*0!8$($.$9'.$/-!")':!

Table 3.1 Table 3.2 Table 3.3 Table 4.1 Table 4.2 Table 4.3 Table 4.4 Table 4.5 Table 5.1 Table 5.2
Table 5.3
LIST OF TABLES
Page
Concrete Compressive Strength .....,...... . . . . , . . . . . . . . . . .. 23 Concrete Grout Compressive Strength ....................... , 24 Ram Control Unit Load Settings ....... . . . . . . . . . . . . . . . . . . . .. 30 Summary of Test Results ................................. , 35 Single-strand Modulus Test Results .......................... 36 Location and Description of Wire Fractures in Test #1 ........... 42 Location and Description of Wire Fractures in Test #2. . . . . . . . . . .. 47 Location and Description of Wire Fractures in Test #3. . . . . . . . . . .. 57 Terminology For Stages of the Specimens' Fatigue Life ........... 59 Number of Wire Fractures and Calculated "Design Fatigue Life" For Each Specimen ......................................... 62 Calculation of the "Design Fatigue Life" For Wollmann's Specimens . 65
XVII

1.1 General
CHAPfERl INTRODUCTION
Segmental post-tensioned box-girder construction has become a very popular choice for medium to long span concrete bridges in the United States and abroad.29 As the technology has developed, the trend is towards a combination of the conventional internal tendons with the more construction-friendly external tendons. Internal tendon construction indicates that all tendon ducts are embedded within the concrete section as opposed to external tendon construction in which the tendon ducts are only attached to the section at discrete points. Each type of construction is illustrated in Figure 1.1.
The earliest examples of prestressed bridges utilized external post-tensioning, but high losses combined with low strength steel caused these designs to be ineffective. After these failed attempts, attention turned to pretensioning and to post-tensioning with internal tendons, and it was not until the 1950's, almost 25 years later with the advent of higher strength steels, that external post-tensioning was again given consideration as a viable alternative and used in several successful bridges.29 Some of the most appealing advantages of external post-tensioning are:
• the ease of installation of the tendons as well as the possibility of future replacement; • unbonded tendons cause a lower service load stress range, reducing the fatigue potential; • reduced congestion in the concrete cross section which improves consolidation; • thinner web sections can be used and, therefore, lighter, cheaper sections; • time to assemble the reinforcing cages should be reduced; • rapid construction is possible using the span-by-span erection system.29
Likewise, internal post-tensioning has some advantages over external post-tensioning:
• a larger range of eccentricities which increases the efficiency of the section (smaller tendon forces are required to achieve the desired service load stresses and the larger effective depth requires a smaller tendon force to achieve the desired ultimate strength);
• bonding along the entire length leads to better ductility, large numbers of well distributed cracks at ultimate, and eliminates the vibration problem of long unbonded cables.29
• bonding along the entire length also leads to significantly higher ultimate tendon stres than unbonded tendons so that the ultimate moment capacity is significantly increased.
Each construction method has its advantages, and so it seems logical that a combination of the two will provide the best design.
1

2
diaphragm anchorage
a. System of internal tendons
external tendons in grouted polyethylene sheathing
b. System of external tendons
intcrnaltcndons through web ducts
deviation diaphragm
c. System of mixed tendons
diaphragm anchorage at pier segment
diaphragm anchorage at pier segment
external tendons in grouted polyethylene sheathing
Figure 1.1 Types of construction using prestressing tendons in box girders. (from Arrellaga 3)

3
While both technologies have been in use for the last half-century, internal posttensioning has been the preferred choice until recently and, therefore, has been the subject of more research. External post-tensioning, on the other hand, has had relatively little research. The growing use of externally post-tensioned box-girders in bridge structures necessitates research to gain a more thorough understanding of the behavior of the system.
The Long Key bridge, completed in 1980, was the first externally post-tensioned boxgirder bridge built in the United States.29 A section through the Long Key bridge, shown in Figure 1.1b, illustrates clearly the concept of external post-tensioning. The tendon must be held down at intermediate points along the span to achieve a draped profile. These hold down points, referred to as deviators, may be in the shape of a block as in the case of Long Key or in the shape of a rib or diaphragm as illustrated in Figure l.lc. Each deviator is a reinforced concrete projection cast monolithically with the girder section and contains one or more curved ducts. These rigid plastic or metal "deviator ducts" through which the tendons pass are the means by which the draped tendon profile is achieved. It is the interaction between the tendon, the deviator and the deviator duct that is the primary subject of this study.
The performance of an externally post-tensioned system is inextricably linked to the integrity of the deviators and end anchorages since the only positive connection of the external tendon to the concrete section occurs at these points. Research has been performed on the strength and detailing of the deviators,4 but the effect of the relatively pronounced angle change on the tendon in the deviator region under cyclic loading has not been thoroughly investigated. 13
Because the deviators are the only intermediate attachment points to the concrete section, they are locations of high local contact pressure on the tendon and an area of potential slip during cyclic loads -- conditions necessary for the process called "fretting" to occur. Previous research has shown that where the potential for fretting is present, the fatigue life of the system may be shortened.4o Therefore, since this detail has an inherent potential for fatigue degradation, studies were needed under cyclic loading to ensure the long life of the system.
This research program is basically a study to test and evaluate the influence of the deviator duct angle change, which is the major potential for fretting, on the fatigue life of the tendon.
1.2 Objectives
The objectives of this research are:
1) to build several external tendon specimens which pass through deviators which are representative of externally post-tensioned box-girders,
2) to load the tendons and deviators cyclically in a manner representative of severe bridge loading,

4
3) to examine the specimens posthumously for evidence of fretting fatigue, and
4) to draw conclusions from these tests and make recommendations for changes m construction techniques and/or areas of future study.
1.3 Scope
This report focuses on testing of three deviator specimens to study the effects of fretting fatigue on external post-tensioned tendons. Chapter 2 presents a brief background on fretting fatigue, previous research on fatigue of post-tensioned beams, and the fatigue problems to be expected in the external tendons. A summary of the limited research reported on fatigue in external tendons is also presented.
Chapter 3 covers the materials and fabrication of the deviator specimens, the test setup and testing procedure. The results of the deviator specimen tests are presented in Chapter 4, and these results are evaluated in Chapter 5. In addition, the basis for the design recommendations will be presented in Chapter 5. Finally, a summary of findings, conclusions, and recommendations for design are given in Chapter 6.

CHAPTER 2 BACKGROUND INFORMATION
2.1 Introduction
This chapter presents a brief summary of background information necessary in understanding the topic of fretting fatigue in externally post-tensioned box-girders. This includes an introduction to fatigue, results and conclusions from previous pretensioned and post-tensioned beam tests pertinent to external tendon construction, an introduction to fretting fatigue, and a literature review on fatigue of external tendons. The interested reader is referred to Yates40 for an extensive literature review of fretting fatigue and related previous research on fatigue of prestressed concrete, to Wollmann et al.39 for a comprehensive report on fretting fatigue in curved post-tensioned tendons, and to Powell et a1.29 for a survey of the state-of-the-art in external post-tensioning.
2.2 Fatigue of Prestressed Concrete
2.2.1 General. In his classic textbook on corrosion engineering, Fontanall defines fatigue as " ... the tendency of a metal to fracture under repeated cyclic stressing. Usually fatigue failures occur at stress levels below the yield point and after many cyclic applications of this stress." The fatigue mechanism begins with the initiation of a surface crack at a stress concentration under fluctuating tensile stresses and continues until the cross sectional area is reduced to the point where the ultimate strength is exceeded and rapid brittle fracture occurs. Figure 2.1 is a typical plot of fatigue strength (stress range, S) versus fatigue life (number of load cycles, N). These plots are typically referred to as S-N curves (or Wohler curves) and will typically be two straight lines if both ordinates are drawn to a logarithmic scale. In general, as the stress range increases, the growth rate of the crack increases. Therefore, the fatigue life, or number of cycles to fracture, decreases. The endurance limit is the maximum stress range for which the fatigue life is independent of the stress range.
The effects of fatigue are negligible if the service load is applied less than 20,000 times, as is the case in most building loads. Fatigue is always considered in the design of highway bridges which are expected to have in excess of 100,000 cycles of loading? For a prestressed girder used in the superstructure of a bridge, the axial
5
Endurance r Limit
Number of Cycles, N (log scale)
Figure 2.1 Typical S-N plot.

6
tensile stresses in the prestressing tendons will fluctuate continuously under the loads of heavy vehicular traffic. This fluctuation will usually be negligible if the girder remains uncracked under traffic. The fluctuation increases substantially for cracked sections. Cracking can be due to overloads, to concrete fatigue, or to environmental factors such as restrained temperature or shrinkage stresses.
2.2.2 Fatigue of Pretensioned Concrete Beams. Early research on fatigue of prestressed concrete was limited to pretensioned concrete. Many different
_--------!FUlpe ~ variables have been investigated in these - 0c:c:udDa at In
<adual Doboodlna (ll) IDaaI&ina Rate (ID) fatigue studies to determine their effect on InltIaI LoI5 of SdffneIis (I) the fatigue behavior of pretensioned
Number 01 c,deI, N
Figure 2.2 Stiffness history of girder tests.38
concrete. One of the most significant is the variation of stiffness with time?8 The stiffness history of a typical prestressed concrete girder subjected to cyclic loading
exhibits three distinct phases as shown in Figure 2.2. Phase I shows the initial loss of stiffness caused by the formation and propagation of cracks, leading to deterioration of bond between the steel and concrete. In Phase II, the deterioration of bond continues during the cycling loading until, finally in Phase III, the first wire breaks. The first break leads to higher stress in the remaining wires and subsequent fractures of the remaining wires take place at an increasing rate, leading to a large, rapid loss of stiffness.
The most important conclusion that has been drawn from these fatigue tests of pretensioned concrete beams is that if cracking of the beam occurs, the fatigue properties of the prestressing tendons can be used to predict the fatigue life of the beam.4o Therefore, fatigue tests performed on a single isolated strand in the relatively benign environment of air, known as "strand-in-air" tests, can be used to predict the fatigue life of a pretensioned concrete beam.
10 •
I uf
f I
10'
10·
Figure 2.3 Paulson26)
10 8 10' 10 7
ure, N (Log 01 Number 01 Cyclel)
Strand-in-air failure zone. (after
Figure 2.3 shows an S-N plot from the results of over 700 strand-in-air tests compiled by Paulson et al. 26 From this data he recommended a lower five percentile fracture design model for the fatigue life of prestressing strand (also shown in Figure 2.3) which has been subsequently corroborated?9 Paulson also suggested that a reasonable fatigue endurance limit based on extrapolation of the available data was 20 ksi. Yates40
initially proposed the idea of the shaded strand-in-air failure zone which, as shown,

encompasses most of the data reported by Paulson.
Tests have shown that the fatigue characteristics of strand are not altered substantially when the strands are integrated into a pretensioned concrete member.40 Figure 2.4 shows the results of pretensioned girder tests conducted by Overman2S along with those he collected from Rabbat, et al.,30 plotted to compare with the shaded strand-in-air failure region. The pretensioned girder data is in fairly close agreement with the model that Paulson recommended, except that Paulson's suggested endurance limit of 20 ksi does not agree with Overman's data;
I I I
100~ ________________________ ~
10 • 0YermIn .~et".
-- RunouI (No failure) t 4" MInImum 0VerINd dul1ng StItic Teat
10 I 10'
Ule, N (Log 01 Number 01 CydeI) 10 7
7
Figure 2.4 Fatigue life of pretensioned girders, compared to Paulson's model. (after Overman26
and Paulson26)
Overman recommends using Paulson's model with the 1977 AASHTO endurance limit for redundant load path steel structures (Category B) of 16 ksL 1,2S In the 1989 edition of AASHTO, the recommended endurance limit for Category B has remained 16 ksi, but the values for the allowable range of stress at 100,000 and 500,000 cycles have been increased. The current 1989 AASHTO design curve for Allowable Fatigue Stress Range (Category B for Redundant Load Path Structures), shown in the figure, fits Overman's data a bit more conservatively than Paulson's model and would be a desirable design recommendation for pretensioned girders. This is especially true because, just as used with the Post-Tensioning Institute28 cable stay fatigue design recommendations, use of the AASHTO Category B curve also would allow the designer to use an overall design philosophy relating desired life to class of highway and daily truck traffic. These provisions are summarized in the 1989 AASHTO design tables reproduced in Figure 2.5.
The fairly good agreement of the strand-in-air model with pretensioned girder tests nonetheless verifies the report postulated by Overman that the flexural failure of pretensioned concrete girders is primarily caused by brittle fatigue failure of prestressing steel, with no apparent fretting or corrosion fatigue. However, a careful distinction must be made between pre- and post-tensioned girders because in pretensioned girders the individual strands are isolated and completely surrounded by concrete. This is usually not the case in post-tensioned concrete.
2.2.3 Fatigue o/Post-Tensioned Concrete Beams. Test results indicate that the fatigue life of strands tested in a post-tensioned beam may be appreciably lower than the fatigue

8
TABLE l0.3.1A ADowabie Fadpe Stress Rqe
REDUNDANT LOAD PATH STRUCTURES·
Allowable Range of Stress. Fsr (ksi)"
Category (See Table 10.3.IB) For 100,000 Cycles For 500,000 Cycles For 2,000,000 Cycles For over 2,000,000 Cycles
A 63 37 24 24
B 49 29 18 16
B' 39 23 14.5 12
C 35.5 21 13 10
12 • D 28 16 10 7
E 22 13 8 4.5
E' 16 9.2 5.8 2.6
F 15 12 9 8
NONREDUNDANTLOADPATHSTRUCTURES
Allowable Range of Stress. Fsr (ksi) "
Category (See Table 10.3.IB) For 100,000 Cycles For 500,000 Cycles For 2,000,000 Cycles For over 2,000,000 Cycles
A 50 29 24 24
B 39 23 16 16
B' 31 18 11 11
C 28 16 10 9
12 • liD
D 22 13 8 5
E· 17 10 6 2.3
E' 12 7 4 J.3 F 12 9 7 6
_ Iypoe with nmlti·load ""tho who .... oingle fractwe in " member """"'" _ to tho ooUopoe. For example, "oimply .upponcd .ingIe 'poIl nmlti·bcom brid(IC or • nmlti-c_ eye bar tNM member boo I<duDdanI Iood ""tho. rn.. _ of.-. io dcfimd u tho a1JObroic dilJelalOC _ tho moximum .tftU II1II tho minimum .treaa. T .... iOl1 otftU io COIIIIidctal to ba~ tho _i", aI(ICbnUc oilll from ~iOQ .1JeIa.
"For _ ...... tifrcDor _Ido 011 &irdcr _be or ~. "PortioaI IcD&th _Idod ~r pia ..... bolI _ be .-I 011 ~ more ilion 0.8 iDcIa thick ror IKlrWdUDdaul load path .ttuctwa.
TABLE lO.3.2A Stress Cycles
MAIN (LONGITUDINAL) LOAD CARRYING MEMBERS
Type of Road Case ADTI a Truck Loading Lane Loading •
Freeways, Expressways, Major Highways, and Streets I 2,500 or more 2,000,000· 500,000 Freeways, Expressways, Major Highways, and Streets D less than 2,500 500,000 100,000
Other Highways and Streets not included in Case I or D m - 100,000 100,000
TRANSVERSE MEMBERS AND DEl' AILS SUBJECTED TO WHEEL LOADS
Type of Road Case ADTI" Truck Loading
Freeways, Expressways, Major Highways, and Streets I 2,500 or more over 2,000,000
Freeways, Expressways, Major Highways, and Streets D less than 2,500 2,000,000 Other Highways and Streets m - 500,000
"A",,_ Daily Truck Traffic (_ dimctiOl1). : ~tudinal memben obouId aIao be d!oclood ror truck loodin&. ,
"Membe ... bolI a100 be a.-UlI'tod ror &over 2 miIJicII9 ._ "Y"1eo pro:hxaI by pIaciD& •• ingIe tnICI< 011 tho bridF diolrilUod to tho aiJdo ...... ~ted ill Article 3.23.2 ror .... traffic _ to.Iiaa. The .... ill .leel &irdcr -"" aboJI _ ""oood 0.58 FyDt.,.C ror Ihia •• truck to.Iiaa.
Figure 2.5 Current (1989) AASHTO design tables for structural steel.

9
life of strands tested in air, unlike pretensioned beams.40 In both pre- and post-tensioned beams, many tests confirm the occurrence of debonding of prestressing tendons adjacent to flexural cracks, which then leads to slip of the tendon during cyclic loading. For a pretensioned beam, the individual strands are usually completely surrounded by concrete and not in contact with metallic ducts or other strands. Therefore, this debonding and slip leads to an increased stress range in the tendon at the crack and, eventually, a normal fatigue failure consistent with a strand-in-air test at that stress range. However, for a posttensioned beam, multiple strands are usually in contact within an individual tendon duct. The debonding again leads to slip but the slip leads to metal-to-metal rubbing between individual strands and/or between strands and the duct. In addition, the curved layout of the tendons in most post-tensioned beams creates high lateral pressure between the tendon and the duct and between individual strands. The combined action of the metal-to-metal rubbing and the high local contact pressure in a strand subject to fatigue can lead to abrasion of the contacting elements and accelerated formation and propagation of fatigue cracks in the tendon.40 This process is commonly referred to as "fretting fatigue."
2.2.3.1 Fretting Fatigue. Fretting, in general, describes corrosion occurring at contact areas between two materials in contact under a high lateral pressure subjected to minute slippage under repeated oscillations. II Though a corrosion product is not always present at the site, fretting refers to the surface damage caused. II The surface damage may be in the form of wear, abrasion and the initiation of fatigue cracks, all of which may result in a reduction in the fatigue resistance of the element. For post-tensioned concrete girders, this fretting process can cause a premature fatigue failure of the strand, and thus the girder.
Several theories have been proposed to explain the mechanism of fretting. With respect to post-tensioned concrete, a condensation of most of these theories include the following aspects:S,17,36
1. The rubbing action destroys the oxide film surface on the steel. 2. The exposed surface is susceptible to corrosion and cold-welding. 3. Additional slipping destroys the cold-welding bonds and damages the surface. 4. Cracks initiate due to a combination of the wear and abrasions and the surface
stresses resulting from the high local contact pressure, and the existing stresses in the material.
5. Additionally, loose particles are formed which oxidize and increase in hardness. These particles abrade the contacting surfaces as the materials continue to slip relative to each other. 18
A schematic of the fretting mechanism is illustrated in Figure 2.6. While fretting affects the initiation of the cracks in the post-tensioning strand, the propagation of the cracks depends primarily on the fluctuating stress applied, as in ordinary fatigue. Therefore, fracture will occur when the crack reaches its critical depth and unstable crack growth occurs causing brittle fracture in the material.

10
Normal Force, Q
Fixed Element
Q
Oxidized Fretting Debris
Figure 2.6 Schematic of the fretting mechanism.4O
Reduced life
Fretting Fan e of Thin mement
Number of Cycles, N (log scale)
Figure 2.7 Effect of fretting on S-N curves.4O
Figure 2.7 illustrates the detrimental effect that fretting has on the fatigue life of a specimen.40 This phenomenon is demonstrated by the shifts in the S-N curves of an element under normal fatigue to the S-N curves of the same elements subjected to fretting fatigue.
Much research has been conducted on fretting fatigue and the factors which influence its severity. While the studies have not been directly related, several of the variables are also important to the study of fretting fatigue of post-tensioned tendons. These are discussed below.
Stress Range: In fretting fatigue, an . increase in stress range causes a reduction in fatigue life just as it does in normal fatigue.
Slip Amplitude: Fretting fatigue life will decrease with increasing slip amplitude until an upper limit is reached where slippage is large enough that the surface cracks are worn away.I7 Fretting fatigue has been reported at almost immeasurably small slip amplitudes, so a lower limit of critical slip amplitude has not been established.4o
Lateral Pressure: An increase in lateral pressure has been found to increase the crack growth rate and reduce the fatigue life.s
Material Properties: Metal-to-metal rubbing has the most detrimental effect on posttensioned tendons, while metal-to-concrete (or grout) rubbing has little impact on fretting fatigue.38
It should be noted that while the effects of each factor can be evaluated in the laboratory in isolated variable studies, in an actual post-tensioned beam all of these factors occur in varying degrees that are difficult to separate or measure accurately.
2.2.3.2 Conclusions From Previous Research on Fatigue of Post-Tensioned Concrete Beams. The study of fretting fatigue of prestressing tendons in post-tensioned concrete has
11
been approached in several ways. Tests have been performed on full-scale specimens and reduced beam specimens; strand-in-air tests have also been modified to simulate fretting conditions. Tendon types have varied from single wires, strands and threaded bars to multiple wires or strands. A thorough review of all previous research on fretting fatigue in post-tensioned concrete was conducted by Yates.40 In addition to Yates' tests, studies have since been completed by Diab7, Georgiou 12 and Wollman.38 The following are the results from these studies that are relevant to the study of fretting fatigue of external tendons in post-tensioned concrete:
Magura and Hognestad:21 Fatigue is not a problem, unless prestressed girders become cracked, and then the deterioration of the post-tensioned girders is more severe than the pre tensioned ones.
Rigon and Thurlimann:32 Both metal and plastic ducts were fractured at locations of cracks in the concrete specimens tested. The post-mortem investigation also showed indentations from rubbing of cables and, in the case of the metal duct, showed "signs of surface damage and wear" on both duct and cable with very little corrosion on wires not in contact with duct. More corrosion was found on parallel wire tendons than strand, reflecting poorer bond and possibly different surface treatments.
With plastic duct, fractures occurred on peripheral and internal wires. Cracks that were initiated from local contact were inclined which suggests fretting action (as opposed to normal fatigue) as the cause of fatigue crack initiation.
Oertle. Thurlimann and Esslinger:23 In general, grouted tendons had a shorter fatigue life than ungrouted, substantiating the idea that if a large amount of slip amplitude occurs, abrasion rather than fretting fatigue will be dominant.
A substantial increase in fatigue life was observed when plastic duct was used. Failure in these tests using plastic duct was attributed to fretting between wires or strands.
Cordes. Lapp-Emden and Trost:6 The fatigue strength is reduced "up to 35% for strands and to 60% for the quenched and tempered wires" due to fretting.
Muller:22 Friction between the tendon and the duct or between adjacent wires is more critical than friction with grout. Even very small slip distances can lead to fretting fatigue.
Fatigue strengths from strand-in-air tests are not proportional to the fatigue strength of the same steel in a post-tensioned beam.
From the combined studies of Diab. Georgiou. Wollman. Yates. Kreger and Breen:7,12,38,39.40 Fretting fatigue reduces the fatigue life of cracked post-tensioned concrete girders with grouted tendons. Tendon fatigue should not be a problem if cracking is prevented.
The predominant cause for wire fractures in tendons with metal duct is fretting between strands and duct. Fractures also occur due to fretting between individual strands

12
of a tendon and individual wires of a strand, particularly in tendons with plastic duct. Fretting does not seem to be a problem between strands of the same layer. Twisting of the strands within the tendon may cause concentrated contact loads and lead to premature wire fractures.
Tendon stress range, contact load, and strand coating are important parameters in the fretting fatigue performance of a post-tensioning tendon. The larger the tendon stress range or local contact pressure is, the shorter the fatigue life is. Contact pressure is a function of many variables including radius of curvature of the duct, ratio of duct area to tendon area, and strand arrangement. By
I I J
100~ ________________________ -;
10 o GIrderT ... X RecIucIcI ae.n T ...
---+ Runoul (No f8IIure)
5+-~~~~ __ ~~~~ __ ~~~ 10 4 10 I 10 • 10 7
LIe, N (Log 01 Number 01 Cydee)
Figure 2.8 Fatigue of post-tensioned girders with metal ducts, compared to Paulson's model. (after WOllmann38 and Paulson26
,
increasing the radius of curvature or the ratio of duct area to tendon area the contact pressure will decrease and fatigue life will increase. Slip amplitude may be an important parameter but conclusive test results are not available. Plastic duct dramatically improves the fatigue behavior of single-strand tendons; the benefits of plastic duct for multistrand tendon are not as dramatic, perhaps due to stand-to-strand fretting.
Epoxy coated strands appeared to have an improved fatigue life over the uncoated tendons since the epoxy had to be worn away for fretting to occur.
In Figure 2.8, the data collected by Yates and Wollmann from fretting fatigue tests of post-tensioned beams with metal ducts is plotted along with the shaded region representing the strand-in-air failure zone.38,40 Nearly all of the data points fall below Paulson's model, indicating the detrimental effect of fretting fatigue in post-tensioned concrete.38 Most of the data points also fall below the 1989 AASHTO Category B design curve for Allowable Fatigue Stress Range for Redundant Load Path Structures (AASHTO B) which was recommended for design use with pretensioned girders. Previously, Yates and Wollmann each proposed a two-part fretting fatigue design model that predicts the life of strand-type tendons in metal ducts (as a function of the tendon stress and contact load) based on the 1983 edition AASHTO Band D curves. However, all of the data points except one lie above the 1989 AASHTO C design curve. This curve is slightly conservative at 2 million cycles, where the allowable stress range of 13 ksi is below the runout data points, and the curve is more conservative at the recommended endurance limit of 10 ksi. Overall, the fit of the AASHTO C curve is very acceptable.
Figure 2.9 presents the results of fretting fatigue tests with strand-type tendons in plastic ducts collected by Wollmann.38 The figure shows that, while the single-strand specimens exhibit a substantial improvement in fretting fatigue performance with the use of plastic duct, the trend is not apparent for multi-strand specimens, which had reduced

I I .8'
100~ ________________________ ~
10 o Multiple SInIncI Tendone In PIMIIc Ducta X Single SInIncI Tendone In PIMIIc Ducta
- Runoul (No failure)
106
10 • Ue. N (Log of Number of CycIeI)
10 7
Figure 2.9 Fatigue of post-tensioned girders with plastic ducts, compared to Paulson's model. (after Wollmann38 and Paulson26)
13
fatigue lives due to strand-to-strand fretting. All of the data falls well within the limits of the AASHTO C design curve.
2.3 Fatigue of External Tendons in Post-Tensioned Concrete
2.3.1 General. External tendons are subject to conditions that are both similar to and different from those conditions that internal tendons in post-tensioned concrete are subjected. Both types of tendons are subject to a cyclic stress range due to vehicle load applications when used in a bridge, though the stress range will generally be lower for an external
(unbonded) tendon. Both tendons may experience minute slipping when subject to these cyclic stresses; the internal tendon will slip if the girder is cracked and the external tendon will slip if the surrounding grout is cracked. The externally post-tensioned multi-strand tendon has a high contact pressure between the tendon and the duct (as well as between the strands within the tendon) at the deviator, just as the internally post-tensioned tendon has at its drape points.
The externally post-tensioned tendon undergoes a concentrated angle change at the deviator when using a duct with a small radius of curvature. This angle change produces a change in force in the tendon through friction between the tendon and the duct during the stressing procedure. This force transfer occurs over a short length with high lateral forces combining with the friction forces to induce high surface shear on the tendon at the contact points. As the system undergoes continuous fluctuations in loads, it is expected that the tendon will begin to experience minute immeasurable slippage in the deviator region. Under continued load fluctuations or under the influence of an overload, the grout is expected to deteriorate allowing additional slip to occur. The high lateral pressures and surface shears on the tendon, coupled with the potential for tendon slip, are the necessary conditions for fretting fatigue and a reduction in fatigue life. 13•19
2.3.2 Previous Studies of Externally Post-Tensioned Tendons. To date, there have been no studies reported on the potential for fretting fatigue reflecting the deviator details typically used in the United States for post-tensioning external tendons in segmental boxgirders. Several studies of other aspects of externally post-tensioned segmental box-girder bridges have been done. Most of these studies are analytical in nature and thus not of direct use in this study.

14
Two experimental studies were conducted at the University of Texas to determine the strength and ductility of a scale model of a three-span externally post-tensioned segmental box-girder by MacGregorl9,2o and Hindi. 14 In the first phase of testing, the external tendons were attached only at the ends and at a pair of deviators in each span. All tendons were pressure grouted. MacGregor measured the service load stress increases in the tendon at midspan as less than 2 ksi in all spans, both with dry joints and with epoxied joints. However, the service load levels were always less than the decompression load levels. Thus the dry joint span did not have any joint openings at this load level and behaved as an uncracked section. The epoxy joint spans were uncracked. MacGregor also found that after five consecutive load cycles the stress response remained constant indicating that the tendons did not slip at the deviators at service load levels. Under factored loads, tendon stress increases at midspan were measured to be less than 5 ksi in all spans and, again, the tendon did not appear to slip at the deviator. Slip was first observed at loads of approximately twice the factored design live load and substantial slip was noticed in all tendons at all locations for ultimate load levels, which suggests loss of bond between tendon and duct can occur due to a previous overload. 14
In further tests on MacGregor's three-span bridge model, Hindi l4 attached the tendon to the concrete section at a number of intermediate pass-through points as well as at the deviators. This additional bonding increased the ultimate strength and ductility of the model, but, in addition, it also increased the tendon stress range (in the severely cracked bridge from overload tests) at service loads from 2 ksi to nearly 4 ksi. This stress range is still well below the endurance limit for fatigue of prestressing strand, but it demonstrates the possibility that future design details may produce somewhat higher stress ranges in the tendon at service load conditions. 14
Almost twenty years earlier, a one-sixth-scale model of an internally post-tensioned segmental box-girder bridge was built at Ferguson Laboratory as a companion study to the construction of the first segmental box-girder bridge in the United States. From the data collected by Kashima, the model was uncracked at service load levels and the maximum service load stress range experienced by the internally post-tensioned tendons in the model was less than 3 ksi. 16 This is about the same as the 1-4 ksi stress ranges found to exist in externally post-tensioned box-girders by MacGregor and Hindi.
Experimental tests by Eibl and Voss were performed to study the effects of three different types of cable systems at the deviators under fatigue loading.8,9,lo Samples of each tendon type were cycled for 2.5 million load cycles with an amplitude of 35 N/mm2 (5 ksi) and a maximum stress of O.74u' Eibl and Voss reported the expected stress range in the tendon at service load conditions to be 15 N/mm2 (2.2 ksi)9 which agrees with MacGregor's findings. All cables performed satisfactorily and had no fretting fatigue problems. Unfortunately, the systems that were tested are not at all similar to the conventional system used in the United States. Two of the systems tested are protected from corrosion by wax and are therefore completely unbonded between anchorages; the third system is grouted with mortar but the strands are held apart within the duct and are, therefore, not in contact

15
with the duct or with each other. Because of these dissimilarities, the results from these tests can not be compared to tests using the conventional construction techniques employed in the United States. However, the techniques considered in these tests should be considered when discussing viable alternatives to the current methods if they are found to be economically comparable.
In her report on the state-of-the-art of external post-tensioning, Powell reports that research is ongoing at the laboratory at Saint-Remy-Les-Chevreuse in France to study the behavior of deviated tendons, including characteristics of the deviation (e.g. radius of curvature, deviation angle, duct type and size, etc.) as well as the nature of the tendon (e.g. number of strands and degree of entanglement} tendon protection and loading. 9
Meanwhile, the French have obviated many of the factors that might contribute to fretting fatigue of the tendon due to geometry errors of ducts in the deviator by
Figure 2.10 Bugle shaped rigid metal deviator duct used in some French bridges. (after Powell29
)
using a bugle shaped rigid metal duct in the deviators as shown in Figure 2.10. The radius of the flare is smaller than that required by the geometry of every deviator in the bridge. This simplifies fabrication and placement of the deviator ducts since the same configuration can be used in all deviators of the bridge.
To summarize, internal post-tensioned tendons have exhibited a reduction in fatigue life due to fretting fatigue because of the following factors: large contact stresses between the tendon and the duct (as well as between adjacent strands in the tendon), large local stress ranges in the tendon, and relative slip of the strands. External tendons also are subject to these same potential fretting fatigue initiators within the deviators, though the stress range in external tendons (after cracking of a girder) should be substantially lower than those of internal tendons. The similarities were strong enough to dictate that studies be carried out to determine how significant the potential for fretting fatigue is in typical external tendon deviator details. If the studies indicated a significant problem, additional tests were planned to evaluate the potential of various solutions for minimizing the problem.

!!!!!!!!!!!!!!!!!!!"#$%!&'()!*)&+',)%!'-!$-.)-.$/-'++0!1+'-2!&'()!$-!.#)!/*$($-'+3!
44!5"6!7$1*'*0!8$($.$9'.$/-!")':!

CHAPfER3 TEST PROGRAM
The details of the experimental test program are presented in this chapter. As a preliminary step in the program, strand-in-air tests were performed and these tests are presented first. The remainder of this chapter is devoted to the design, materials and fabrication of the deviator test specimens and to the test setup and testing procedure used to test these deviator specimens for fretting fatigue.
3.1 Strand-in-Air Tests
Strand-in-air fatigue tests were performed to determine the fatigue characteristics of the strand used for this test program and to develop a method to grip the strands in the tendon tests so that premature fatigue failures would not occur in the grips. The test setup is shown in Figure 3.1. It was originally developed for a cable stay fatigue study.26 The gage length of strand used in this test setup was approximately 53 inches. The closed-loop hydraulic servo-controlled system used to regulate loading was the same system that was used for the fretting fatigue tests and will be described in Section 3.2.4.2.
Several tests were run using Paulson's "double-chuck" grip metbod26
(aluminum foil with the primary wedges) with limited success. The first 15 tests were run at a 40 ksi stress range and only two of those successfully resulted in a wire fracture outside of the grip region. The next five tests were run at a 24 ksi stress range without any successful tests. Finally, Lamb's "double-chuck" grip method,18 which utilizes copper wedges as shown in Figure 3.2, was used for one test. This test was run at a stress range of 24 ksi and was finally declared a "runout" after 10 million cycles without a wire fracture.
Secondary Chuck
Primary Wedges Primary Chuck __ _
Interface DiSc---mJ
Pislon--"""
Center-Hole Ram
Extension Chair
load Cell
Interface Disc -~ •• r Primary Chuck
Primary Wedges Secondary Chuck
Strand
Figure 3.1 Strand-in-air test setup. (after Ha1l13)
17

18
Strand
Secondary Chuck (re-usable. spring loaded chuck)
Primary Chuck or
Multi- Slrand Anchor Head
Spring
Secondary Chuck Wedges (slandard)
Rubber Band
Primary Chuck Wedges (Copper)
Figure 3.2 Double-chuck grip system for strand anchorage. (after HaU13)
1 00 +-....................................... ---'-................. .......J._ ................. ~'----,
80
a Aluminum foil wnh steel wedges
• Copper wedges _ Runoul
Lile (number 01 cycles)
The results ofthe three strand-in-air tests which did not fail in the grip region are plotted in Figure 3.3 over a sketch of Paulson's typical strand-in-air failure zone26
(previously shown in Figure 2.3). As shown, both of the tests that were run at 40 ksi using Paulson's gripping system agree with the failure zone. The first test lasted approximately 250,000 cycles, which is near the lower limit of the predicted failure zone; the second test, which lasted nearly 5 million cycles, is slightly longer than the failure zone predi.cts. Both tests agree with Paulson's results showing that the strand used in the test program had typical fatigue characteristics. The third test shown is the one using the copper wedges as suggested by Lamb,18 which was run at a 24 ksi stress range. The length of the test, as plotted at 10 million cycles, falls just outside of Paulson's failure zone. However, this test was not stopped due to a wire fracture, but was deemed a runout after 10 million cycles in the interest of time. Therefore, no conclusion can be drawn about this test in relation to Paulson's failure zone except to say that it is at least as long as predicted.
Figure 3.3 Strand-in-air test results. Based on the success of the gripping
procedure used in the last strand-in-air test, an adaptation of Lamb's gripping method (using the copper wedges, but with a slightly different geometry) was chosen for use with the 12 strand tendon in the fretting fatigue tests.
3.2 Fretting Fatigue Tests
The primary focus of this study is the testing of the tendon and deviator specimens for evidence of fretting fatigue. The remainder of this chapter is a discussion of these tests including development of the test program, the specimen (its design, materials and fabrication), the test setup and the testing procedure.
3.2.1 Development of the Test Program. It was noted during MacGregor's20 study of a scale-model externally post-tensioned box-girder bridge that there is a tendency for the tendon to slip at the deviators due to an overload or cracking. Although MacGregor did

19
not conduct a fatigue study of the bridge, the limited number of cycles that were done in the course of his research verified this hyporeport. This led to the concern that the life of an externally post-tensioned girder might be shortened due to the deviator details. Specifically, it seemed that fatigue would be most critical at the sharp bends in the deviator; combining the high contact pressure with slip might lead to fretting which has been shown to shorten the fatigue life of metallic elements, such as strand. To investigate this possibility, tests were needed that would concentrate on the deviator region since other areas of the tendon (Le., the anchor zone and the free length) are not subject to these same factors. A test specimen was developed to include critical areas of the tendon and the deviator.
A previous research project was carried out by Powell29 and Beaupre4 in Ferguson Laboratory at the University of Texas to study the strength and behavior of external tendon deviators under static loading. Concrete buttresses were constructed specifically for this project to resist the high lateral forces needed to post-tension these deviator specimens. The Powell/Beaupre test setup was modified and used for the fretting fatigue tests described herein.
The guiding philosophy behind the design of the fretting fatigue deviator specimens was based on the premise that the best possible design would be a full-size deviator specimen which closely resembled field conditions. The variables considered include the geometric parameters (such as the number, size, angle and placement of the deviator ducts and the tendons), as well as the magnitude of the tendon stress range and the method of application of the load. Fortunately, Powell had collected much of the needed information about current construction practices for her study of the state-of-the-art of external posttensioning.29 Most of the specific design decisions will be explained more fully in the following sections on the specimen (its design, materials and fabrication), the test setup and the test procedure. But, these sections recount the test after it evolved into what is presented. The initial plan of attack was modified somewhat based on the results of each test.
The test program was originally planned to proceed as follows. The first step would be to test the first specimen at a 24 ksi stress range with a relatively large angle change in the tendon across the deviator. This stress range is above the endurance limit for the strand itself (Paulson's strand-in-air model and suggested 20 ksi endurance limit are shown in Figure 3.4) and is also significantly higher than the stress range expected in actual service conditions. Figure 3.4 Comparison of suggested lower bound
fatigue models.

20
As shown in Figure 3.4, previous research has demonstrated that a 24 ksi stress range should result in a life of at least 1.4 million cycles in strand-in-air tests (Paulson's model), 850,000 cycles in pretensioned girders and 200,000 cycles in internally post-tensioned girders. It is postulated that the comparison of the tendon life at a 24 ksi stress range for external tendons in a curved deviator with these lower bound lives of the other types of prestressed applications should indicate the severity of fretting in the external tendon deviators.
All of the other parameters were chosen to reflect actual field conditions except for the stress range. The initial value of the angle change of the tendon across the deviator was chosen to be 10 degrees (which is at the upper end of the range of these angles in the field) since the potential for fretting fatigue should be most critical at fairly sharp bends in deviators. This first test would bear out the severity of the fretting fatigue problem and would provide valuable information about the performance of the test setup for future tests which would, presumably, last much longer. The test would be stopped when a "significant" number of wire fractures had occurred. This number was arbitrarily set at 10 wires which is approximately 10% of the total number of wires in a twelve-strand tendon. Subsequent tests would be done at progressively lower stress ranges to bracket the stress range below which fretting fatigue did not occur. It was anticipated that the fretting phenomenon would be more severe than in internal tendon post-tensioned girders although the problem might occur only at stress ranges above those common in practice. Subsequent tests were planned to explore various design modifications to reduce or eliminate the problem. Finally, specimens with the recommended modifications would be tested with expected field misalignments, a recurrent problem reported in the literature. 29
The first test, Test #0, was cycled for over 800,000 cycles at a nominal 24 ksi stress range before a significant number of wires had visibly fractured. This value was very near the lower bound for pretensioned concrete and well above the lower bound for posttensioned concrete internal tendons. Therefore, it was indicated that the deviator had no adverse effect on the life of the specimen beyond that ordinarily expected for internal tendons. When the specimen was removed from the test setup, it was discovered that all of the wire fractures had occurred from fretting fatigue on the inner face of the anchor head near the grip region at the ends of the cable. This point was far outside of the deviator test segment. The results did indicate that fretting in the deviator region was not a serious problem but because of the grip region failures were inconclusive. Modifications were made to the setup to eliminate the fretting in the end anchor regions and Test #1 was started.
Test #1 was stopped after 2 million cycles with very few apparent fractures. However, when the specimen was removed from the test setup, it was discovered that additional wires had fractured inside the deviator specimen, increasing the total number of fractures to 14. Therefore, while the test was not "technically" a runout, at this unrealistically high stress range the longevity of the specimen indicated that fretting fatigue in typical deviators of external tendons would not be a problem under ordinary circumstances. Based on these first two tests, the direction of the project was changed to bypass further tests at lower stress ranges on "ideal" specimens. Instead, the next course of

._".-., L..-8I8I ~ : : :....-' no! Shown I .... Clarity I • I I • I I • I
: : : ConcraIe I • I I • I I • I
Figure 3.5 Elevation of test setup. (after Ha1113)
21
investigation was to examine the effects of unintentional duct misalignment that have been reported in the field.29 The tests again were begun at the high stress range of 24 ksi to define the extent of the problem. Based on the results of Test #2 which had a very severe misalignment along with the high stress range, a third test was done with a less severe misalignment to confirm the correlation between misalignment of the deviator duct and fatigue life of the specimen. Examination of the results of these tests indicated that further physical tests were unnecessary.
3.2.2 Specimen Design. The test specimen and the general loading system are shown in Figure 3.5. The specimen consists of the concrete segment (representing the deviator portion of a segmental box-girder bridge span), the tendon, and the gripping system. The segment was designed to include only a single tendon since all tendons in an actual bridge are isolated. They generally will experience about the same stress fluctuations and, therefore, are equally susceptible to fretting fatigue if it should occur. The gripping system used at the anchored ends of the sp~cimen is the "double-chuck" system described by Lamb IS
with some alterations of the exact dimensions of the wedges. This system is described in more detail in Section 3.2.3.6 and Section 3.2.4.4. The concrete segment is discussed in the following subsection.
Concrete Segment Design. The concrete segment used in this test was designed by Hall. 13 The design is representative of a section of a full-scale box-girder segment similar to the one pictured in Figure 3.6. The segment was designed to full-
Deviation poirus for extemalu:ndons
Figure 3.6 Box-girder segment. (after Hal113)

22
Cyclic Load
- -------
Section
scale but the geometry was modified for simplicity. As shown in Figure 3.7, the bottom flange and the web walls of the segment have thicknesses typical of actual box-girders, but the web walls are only a portion of the usual height and there is no top flange. In a standard bridge, the deflection due to a heavy vehicle crossing over the bridge would cause a stress fluctuation in the tendon as the deviator pulled down. Although the segment is not a complete full-size box-girder, it maintains this same load path when installed in the test setup as described later in Section 3.2.4.5.
13 Also noticeable in Figure 3.7 is Figure 3.7 Test segment. (after Hall )
the location of the deviator in the center of the box instead of adjacent to
each web as in a conventional externally post-tensioned box-girder. This use of symmetry greatly simplified the test set-up. In the longitudinal direction, two deviators that are typically separated by at least the length of one segment have been compressed together and are separated by only two feet. Including the two deviators produces more useful data and also provides symmetry that helps to simplify the test set-up. Descriptions and illustrations of the deviator and box segment reinforcement are included in more detail in Sections 3.2.4.1 and 3.2.4.2.
The length of the deviators vary in bridge spans, but are generally in the range of 1.5 to 3 feet long. Pres con Corporation donated several deviator ducts from an actual segmental bridge project to the laboratory. Each duct was approximately 27 inches long and therefore, the concrete segment was designed to use the duct that was available. This duct was prebent to various angles between 7 and 13 degrees, so the first specimen was designed to use the 13 degree duct with a 10 degree tendon deviation angle which provides for a typical 3 degree overbend.
3.2.3 Materials.
3.2.3.1 Concrete. The concrete for the segments was supplied by a commercial concrete supplier. A standard mix using a maximum aggregate size of 3/8 inch to provide a 28-day compressive strength of 5000 psi was ordered. Compression tests of 6.0 x 12.0 inch cylinders were performed to verify the actual concrete strength and are tabulated in Table 3.1.

Table 3.1 Concrete Compressive Strength
Specimen 7-Day 28-Day Compressive Compressive Strength (psi) Strength (psi)
1 6293 7046
2 4788 5327
3 5050 6200
23
3.2.3.2 Prestressing Strand. The post-tensioning tendon consisted of twelve 1/2 inch diameter, Grade 270 ksi (4u = 270 ksi), low relaxation seven wire strand. The spool of strand was donated by Florida Wire and Cable Company and complies with ASTM A416 specifications. The ultimate strength of the strand was determined by the supplier to be 43.7 kips (fult = 286 ksi) and the modulus of elasticity was determined by the supplier to be 29,100 ksi.
3.2.3.3 Passive Reinforcing. ASTM A615 Grade 60 reinforcing steel was supplied by a commercial steel fabricator pre bent to the dimensions requested.
3.2.3.4 Post-Tensioning Duct. Deviator ducts donated to the Ferguson Laboratory by Prescon Corporation were selected for use in this project. The ducts are 3 inch nominal standard galvanized metal pipe (3 inch inside diameter with a 0.25 inch wall thickness.) These ducts were precut to varying lengths of approximately 27 inches and prebent to various angles from 7 to 13 degrees. These ducts were left over from an actual bridge project and are representative of those used in other bridges where typical deviation angles can range from less than 1 degree to over 12 degrees. It is standard practice to use a duct that has an overbend of 2 to 3 degrees greater than the compatible tendon deviation angle. Therefore, the first concrete segment was designed to implement the 13 degree duct to be used with a 10 degree tendon deviation angle, thus providing a 3 degree overbend. Figure 3.8a shows the layout of the segment for Test #1.
Based on the results of the first successful test, a second test was planned in which the same 10 degree tendon deviation angle would be used but in conjunction with a deviator duct having a very small angle to evaluate the effect of severe fie1d tolerance errors. This duct, pre bent to only a 2
1" 2"
L)TIIIit.1
3" 3"
b.)TIllitI2
1" 2"
e.) Tlilitfl
Figure 3.8 Duct layout in test segments.

24
degree angle, was donated to the project by Ron Nichols Machinery who supply the duct for the San Antonio "Y" project. The pipe met the same specifications as that donated by Prescon. Based on the results of this second test, a third test was performed using a deviator duct angle between the previous two. This duct, prebent to a 7.5 degree angle, was taken from the batch donated by Prescon. The configurations of the segments with these ducts in place are also shown in Figure 3.8.
In addition to the deviator duct which encloses the strand as it passes through the deviator, polyethylene duct is used to encase the strand between the anchor head and the deviator and between deviators. The polyethylene duct is attached to the deviator duct using a flexible rubber sleeve and hose clamps. A supply of polyethylene duct, flexible rubber sleeves and hose clamps was donated to this project by Austin Bridge Company.
3.2.3.5 Grout. The cement grout mix was developed from the Post-Tensioning Institute's specification "Recommended Practice for Grouting of Post-Tensioned Prestressed Concrete,,27 as follows:
- 1 bag Portland Cement (94 lbs), Type I - 5 U.S. gallons water - 0.94 lbs Interplast-N expansion mixture (1 % of cement by weight)
The water-cement ratio for the mix design outlined above is 0.45 which is in accord with the maximum ratio of 0.45 recommended by the Post-Tensioning Institute and AASHTO. Tendon grouting procedures are outlined in Section 3.2.4.6 and grout strengths are given in Table 3.2.
3.2.3.6 Gripping System. The primary wedges were fabricated in the machine shop at Ferguson Laboratory by machining a 1 inch diameter copper rod purchased from a commercial metal distributor. The secondary grip was a standard reusable screw-back 1/2-inch chuck with wedges purchased from a commercial distributor of post-tensioning equipment.
Table 3.2 Concrete Grout Compressive Strength
I Specimen I 3-Day Compressive Strength (psi)
1 2966
2 3427
3 2469
3.2.4 Fabrication.
3.2.4.1 Deviator Reinforcement. The deviator was designed using Beaupre's suggested design for block deviators4 and the AASHTO Standard Specifications for Highway Bridges. 1
Extensive design calculations are presented by Hall. 13

25
Figure 3.9 Reinforcing cage in formwork.
3.2.4.2 Reinforcing Cage. All reinforcement was ASTM A615 Grade 60 and was delivered prebent to specified dimensions. The finished reinforcing cage sitting in the forms with the deviator duct in place is shown in Figure 3.9.
3.2.4.3 Concrete Placing. Concrete with a target 28 day compressive strength of 5000 psi and a maximum aggregate size of 3/8 inch was delivered from a local ready-mix supplier. The fresh concrete was placed directly from the truck into the forms. Consolidation of the concrete was achieved using 3/4 inch and 1 inch roundhead internal vibrators. As each segment was cast, 12 test cylinders were also fabricated. The exposed concrete of the specimen was finished using hand trowels.
Two hours after casting, the specimen was covered with wet burlap and enclosed in sheets of plastic. Moist curing was continued for four days and then the forms were removed. The test cylinders were cured in the same manner as the specimen. The concrete cylinders were tested under uniaxial compression at 7 and 28 days; these strengths were given in Table 3.1.
After removing the forms from the concrete segment, the polyethylene duct and flexible rubber sleeve were attached to the segment with hose clamps in preparation for grouting.
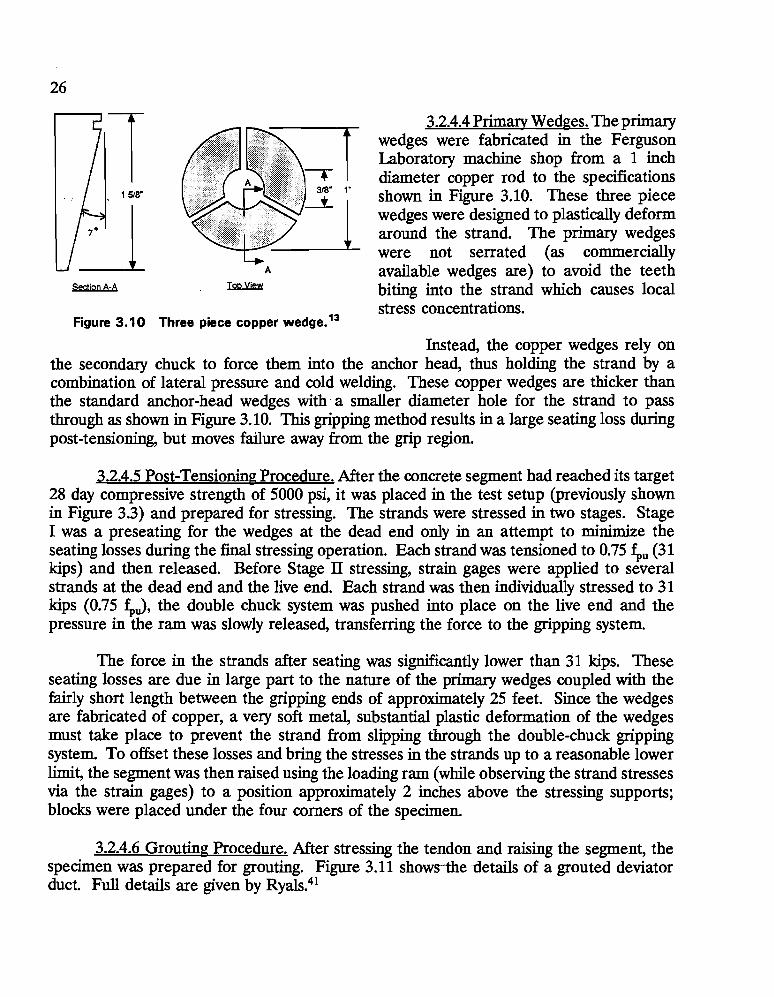
26
Section A-A
Figure 3.10 Three piece copper wedge.13
1"
3.2.4.4 Primary Wedges. The primary wedges were fabricated in the Ferguson Laboratory machine shop from a 1 inch diameter copper rod to the specifications shown in Figure 3.10. These three piece wedges were designed to plastically deform around the strand. The primary wedges were not serrated (as commercially available wedges are) to avoid the teeth biting into the strand which causes local stress concentrations.
Instead, the copper wedges rely on the secondary chuck to force them into the anchor head, thus holding the strand by a combination of lateral pressure and cold welding. These copper wedges are thicker than the standard anchor-head wedges with, a smaller diameter hole for the strand to pass through as shown in Figure 3.10. This gripping method results in a large seating loss during post-tensioning, but moves failure away from the grip region.
3.2.4.5 Post-Tensioning Procedure. After the concrete segment had reached its target 28 day compressive strength of 5000 psi, it was placed in the test setup (previously shown in Figure 3.3) and prepared for stressing. The strands were stressed in two stages. Stage I was a pres eating for the wedges at the dead end only in an attempt to minimize the seating losses during the final stressing operation. Each strand was tensioned to 0.75 £.,u (31 kips) and then released. Before Stage II stressing, strain gages were applied to several strands at the dead end and the live end. Each strand was then individually stressed to 31 kips (0.75 £.,J, the double chuck system was pushed into place on the live end and the pressure in the ram was slowly released, transferring the force to the gripping system.
The force in the strands after seating was significantly lower than 31 kips. These seating losses are due in large part to the nature of the primary wedges coupled with the fairly short length between the gripping ends of approximately 25 feet. Since the wedges are fabricated of copper, a very soft metal, substantial plastic deformation of the wedges must take place to prevent the strand from slipping through the double-chuck gripping system. To offset these losses and bring the stresses in the strands up to a reasonable lower limit, the segment was then raised using the loading ram (while observing the strand stresses via the strain gages) to a position approximately 2 inches above the stressing supports; blocks were placed under the four comers of the specimen.
3.2.4.6 Grouting Procedure. After stressing the tendon and raising the segment, the specimen was prepared for grouting. Figure 3.11 shows-thedetails of a grouted deviator duct. Full details are given by RyalS.41

27
Section A-A
Deviator Duct
Clear Plastic: Tubing
S1rancIs
End View Elevation
Figure 3.11 Grout injection detail. (after HaU'3,
The first grout batch was pumped through the specimen until it started to flow out of the dead end. When a steady stream. of grout was flowing, pumping was temporarily discontinued to allow the grout to thicken inside the deviator duct. After about 15 minutes, pumping was slowly resumed. The hose at the dead end was clamped as soon as grout was flowing out of the dead end and up the middle "standpipe." After one or two more strokes of grout, the live end was also clamped off. The "standpipe" was left open so that excess water could bleed off, then the grout in this tube would soon harden.
3.2.5 Test Setup. The main objective of the test program was to determine how the fatigue life of the tendon is affected by possible fretting conditions in the deviator. This was determined by cycling the entire segment vertically to cause a fluctuating axial stress range in the tendon which passed through the deviator, much like the conditions when a segment in a bridge deflects due to traffic loads. The number of cycles until wires within the tendon fractured were recorded. The fatigue life of the tendon (number of cycles to fracture) can then be compared to the fatigue life of typical strand under non-fretting conditions (strandin-air tests). Therefore, the most important data to be collected was the stress range of the tendon and the number of cycles to fracture. A schematic of the test setup is shown in Figure 3.12. The test setup was originally built by PoweU4 and the design was later modified by Hall13 for this test program. --- -- -

28
Nba
Hydro-Stone
._ .... ., LaI ..... ~
• : :,.....--- ncI Shown .... CIariIy
• I • I • • • • • ·
Figure 3.12 Elevation of test setup. (after Ha1l13)
Segment
3.2.5.1 Loading System. Figures 3.12,3.13, and 3.14 illustrate the loading system used for introducing fluctuating stresses into the tendon. Note that, due to the constraints of the test setup, the segment is inverted in the test setup.
3.2.5.2 Closed-Loop System. The primary test equipment used in the fatigue tests was a closed loop servo control system which is shown
1"ThickPlale schematically in Figure 3.13. A control unit was used to control the mean load and the stress range applied to the specimen as well as to record the number of load cycles. A load cell monitors the force exerted by the ram and continuously relays the information to the control unit which maintains the cycling between the predetermined loads, or shuts down the system and cycle counter if any preset limit is exceeded.
Figure 3.'3 loading system. (after Ha1l13)

I I I I I I I I I I I
I a Jill' :ml L ________ =a _ i i
o 0 a [)ala Display
Control Un.
Figure 3.14 Schematic of the closed-loop system and other instrumentation. (after Ha1l13)
3.2.5.3 Instrumentation.
29
3.2.5.3.1 Strain Gages. Electrical Resistance strain gages were applied to several individual strands on the dead end and live end of the specimen after preseating but prior to post-tensioning. These gages were applied outside of the deviator. Because the strands were stressed individually and tend to move relative to each other, some strain gages were damaged during the stressing operation. In addition, some gages were damaged during the test due to wires breaking.
During stressing, the strain gage readings were compared to the readings taken from a pressure gage that was connected directly to the stressing ram. Thus, the amount of friction loss across the deviator losses from wedge seating, and the actual stresses in the gaged strands after losses were known. The strain gages were also read periodically throughout the test.
3.2.5.3.2 Dial Gages. The stiffness of the deviator segment/strand system was measured qualitatively by measuring the height of the segment at the minimum and maximum stress during a static test using dial gages, located as shown in Figure 3.14.
3.2.6 Test Procedure.
3.2.6.1 Cyclic Tests. The fatigue test was started as soon as the cement grout in the deviators had reached sufficient strength (about 3 days). The specimen was first raised until the maximum tendon stress level was reached, then the specimen was lowered to the minimum stress level. In the first few cycles, the stress level exerted by the closed loop system via the centerhole ram was correlated with values obtained from the strain gages on

30
the tendon. Adjustments were made to the maximum and minimum load settings on the control unit such that the stress range that the tendon experienced would be 24 ksi. The segment was then moved to the mean stress level and the stress range was set on the control unit. The frequency was then adjusted to allow for the maximum cycles per second the system would allow (about 0.5 cycles per second). Once the system was running smoothly, the limits for the fail-safe mechanisms were set. The test could then be allowed to cycle continuously without the presence of the operator. Cyclic loading was continued for 2 million cycles (considered a "runout") or until a significant portion of the wires had fractured.
Table 3.3 Ram Control Unit Load Settings
Test Mean Load Minimum Maximum Load Range Load (kips) Load (kips) (kips) (kips)
1 89 18 80 98
2 88.25 19.5 78.5 98
3 90.5 25 78 103
All three tests were run at a nominal tendon stress range of 24 ksi. This high stress range was chosen because it is above the endurance limit for the strand-in-air tests Paulson26 evaluated and, therefore, fracture from fretting would be expected to occur at this level much more rapidly than it would in the stress range expected in an actual segmental box-girder (about 1-4 ksi). For each of the tests, (since the geometry of the deviator duct layout changed and the amount of prestress losses varied) the
loads that the ram cycled through to cause this 24 ksi stress range were different and had to be determined. Table 3.3 shows the settings that were used on the control unit.
3.2.6.2 Static Tests. A static test on the system was performed at a predetermined number of load cycles and also whenever the system was shut down by one of the fail-safe mechanisms. The test involves moving the specimen through a single cycle: raising and lowering the segment to the maximum and minimum applied loads, and recording the vertical displacement of the segment and the strain in each of the strain gages at each of these levels. By comparing these values to previous values recorded at the start of the dynamic testing, the change in specimen stiffness was determined. This change in stiffness reflects the number of fractured wires. Each time the system shut down or was stopped for a static test, the exposed portion of the tendon was inspected for wire breaks. This was difficult since most of the tendon was concealed within elements of the test setup. After some experience with the test, it was noted that the wires which broke within the segment would sometimes unravel toward the anchor head causing a "lump" along the length of the otherwise smooth tendon. In general, this was true only for the strands at the exterior of the bundle. In addition, if the break was close enough to the edge of the duct, the outside part of the wire would often unwind enough to be visible outside of the duct. Wires which broke in the anchor head would unravel toward the segment and be visible there. Figure

31
Figure 3.15 Unraveled wires at the deviator duct exit indicating wire breaks in the anchor head.
Figure 3.16 Removing the duct with the grouted tendon from the specimen.

32
3.15 shows several of the wires (from Test #0, the first unsuccessful test) which broke in the anchor head and unraveled to the outside of the segment. Each time a new wire break was observed, it was flagged if possible and noted along with the number of cycles up to that point.
3.2.6.3 Post-Mortem Investigation. After each test, a post-mortem investigation was conducted. First, the specimen was detensioned and removed from the test setup. The strands were then examined for fractures or signs of wear while still grouted in place in the deviator. Then, both deviator blocks were jackhammered open and the intact deviator duct with grouted tendon was removed as shown in Figure 3.16. The duct was cut open and the tendon was removed. Both the tendon and the duct were carefully inspected for signs of fretting.

CHAPfER4 DEVIATOR SPECIMEN TEST RESULTS
4.1 General
This chapter presents the results of the tests performed on the deviator specimens .
. 4.1.1 Data Collection. The specimen was cycled between a minimum and maximum applied load, P min and P max' that had been determined to cause the tendon to experience a nominal 24 ksi tensile stress range. Determination of the stress range will be discussed in the next section. During each test, three types of readings were taken: dial gage readings reflecting the displacement of the segment at P min and P max' strain gage readings at P min and P max' and the number of cycles each time the readings were taken. The data was taken periodically or whenever a limit was exceeded that shut the test down. Data reduction details are given by Ryals.41
After testing, each concrete segment was jack-hammered open and the deviator duct was removed. The duct was cut open and the grouted tendon was removed. The duct and each strand were examined for evidence of fretting and these observations were catalogued. The strands are identified by a number that refers to the order in which they were stressed. A key to the a.) Live End b.) Dead End numbering system is shown in Figure 4.1. Figure 4.1 Strand arrangement in anchor heads.
The results of the post-mortem investigations are summarized in tabular form for each test. Each break is identified by the number of the strand it occurred in and the longitudinal location relative to the outside end of the deviator duct. A description of the break is also given including the angle of the fracture surface, the amount of corrosion present, and the degree of wear andj or abrasion at the break. Those breaks that occurred due to fretting on the anchor head are listed but are not described since they are not of interest in this test.
For members subject to direct axial tension and, hence, pure fatigue, as in a strandin-air test, the principal stress is equal to the axial tensile stress in the member and the fracture surface will be perpendicular to the axis of the member. In fretting fatigue, where both axial tension and lateral forces exist, the axis of the principal tensile stress will be somewhat inclined depending on the relative magnitudes of the tensile and lateral forces. Therefore, in this study, the angle of the fracture surface can be taken to indicate the
33

34
absence or presence of a lateral pressure and, likewise, the absence or presence of fretting fatigue. The angle of the fracture surface was recorded as one of the following:
• "no angle" when it appeared generally perpendicular to the strand indicating a pure fatigue failure;
• "fretting" when the fracture surface was 30 degrees or more away from perpendicular indicating a substantial contact pressure causing a fretting fatigue failure; or
• "slight" when it was in between these two extremes, still indicating some influence of a lateral force and evidence of a fretting fatigue failure.
The difference between wear and abrasion is used in this table to distinguish the degree of deterioration at the location of the fracture initiation; wear is used to describe long or wide areas of erosion versus abrasion which is used to describe very localized nicks or scratches. It is not apparent if these small abrasions were the source of the fractures or a result of breaking. Almost all fractures originate at the outside face of a wire with a few exceptions which are noted.
The inside surface of each of the ducts had indentations at the contact points with the strands; some of the most severe indentations showed brownish discoloration due to corrosion. The same fretting damage was also evident at the corresponding locations on the strands. Most breaks did not occur from this contact but from contact with other strands. The wear patterns varied in each test and will be described further in the results section of each test.
4.1.2 Detennination of Stress Range. The specimen was cycled between a minimum and maximum applied load that had been determined to cause the tendon to experience a nominal 24 ksi stress range. The stress range is referred to as a "nominal" stress range for several reasons. First, as the specimen undergoes many cycles and wires within the tendon begin to fracture, the stress in the remaining wires must increase if the applied load remains constant. Initially, the stress range may truly be 24 ksi, but it will change as wires fracture and the stiffness of the specimen changes. Secondly, the stress range of the tendon is determined by reading strain gages attached to only a few wires of the tendon. Each strand may be stressed to a different level due to variations in losses. In addition, within each strand each wire may be stressed to a different level due to variations in the gripping system. Theoretically, this random sample of the strains should give a close approximation of the average strain but this is not assured. And finally, these few strain gage readings must be translated into stress readings using the appropriate modulus of elasticity. Determination of this "apparent" modulus will be discussed in the next section but is mentioned here in explanation of the difficulty in assessing the "true" stress range that the tendon is experiencing.
Given these limitations, the appropriate minimum and maximum applied loads were determined for each test as shown in Table 4.1. These applied loads varied in each test

35
Table 4.1 Summary of Test Results
Test Minimum Maximum Deviator Duct Cycles to Cycles to Total Number Anchor Applied Load Applied Load Angle First Break End of Test of Breaks Head
(kips) (kips) (degrees) Break
1 80 98 13 470380 2 x loes 15 2
2 78.5 98 2 297480 594840 17 1
3 78 103 7.5 120150 828500 13 4
because of the different configuration of the deviator duct in each test. Since the applied loads had to be reassessed at the beginning of each test, there is a period of uncertainty at the beginning of each test during which the exact stress range had not been determined. Therefore, the data taken during this period of uncertainty (i.e. the strain gage readings and dial gage readings) are not shown with the data for the final applied load range selected. Those cycles do, however, contribute to the fatigue degradation of the specimen and are included in the total number of cycles. This disparity will be addressed as the data from each test is presented.
4.1.3 Detennination of the Apparent Modulus. The range of cyclic stresses that the strands experienced was determined by using the strain gage readings taken during the first few cycles at various levels of applied load. To find the stress corresponding to the measured strains, it was necessary to establish the "apparent" modulus of elasticity of the strand used in this test. The term "apparent" is used here because it has been found that the modulus of elasticity that is determined using data from applied strain gages gives values for the modulus that are higher than the modulus determined by the manufacturer of the strand. This difference can be attributed to two primary factors.
First, each strain gage is applied to only one wire of the seven wire strand. While the gage may accurately measure the strain in this particular wire, the strain may vary in each of the seven wires due to the variation in gripping force during stressing. This factor has been found to be especially important during the initial stressing but it will have less impact at service loads after the gripping devices are properly seated.
The second factor is also a result of bonding the gage to a single exterior wire. The exterior wires are wound about the center wire along a helix and are, therefore, longer than the composite strand. The strain experienced by each outer wire at the known stress level will yield a modulus higher than for the composite strand. An excellent explanation of this phenomenon is presented by Arrellaga.3 The method employed by the manufacturer to determine the modulus measures the strain in the composite strand? Therefore, this

36
modulus is not compatible with the strain gages and the "apparent" modulus should be used in all data reduction processes that rely on the strain gage readings.
To determine the apparent modulus of elasticity for this experimental program, several sources of information were considered. The results from each of these is shown in Table 4.2. In each test, the modulus was determined by using linear regression to determine the slope of the best-fit line from the data collected.
Table 4.2 Single-strand Modulus Test Results
STRAND MODULUS TEST RESULTS
Number of Average Modulus Sets of DEMEC Average Modulus Strain Gages of Elasticity (ksi) Points of Elasticity (ksi)
GROUP 1 TEST 5S 6 31482 2 28794
TEST 6S 5 29637
TEST 7S 6 32707 2 31885
GROUP 2 TEST 1 2 30957
GROUP 3 TEST 1 12 31781
TEST 2 5 31535
TEST 3 3 32210
GROUP 4 TEST 1 2 28849 2 28446
TEST 2 2 29313 2 28236
A VERAGE OF ALL 43 31331 8 29340 TESTS
The data in Group 1 was collected for a different research project in which Arrellaga3 devised a method to accurately determine the strain in a tendon. Arrellaga used strand donated to this author's project to test his method on single-strand samples. His method involves forming two 6" long epoxy sleeves around the perimeter of the entire tendon. DEMEC points are epoxied to the sleeves 200 mm apart along the longitudinal axis of the tendon. The resulting moduli from his tests are listed in Group 1 of Table 4.2. He used both strain gages and the epoxy sleeve method on three samples of strand from this project. The samples were tested in a 60 kip load machine in a standard tension test setup. This data was provided to the author before testing of the deviator specimens began. The single test shown in Group 2 on another sample with two strain gages was done by the author to verify the results of the Group 1 tests.

37
As discussed earlier, an apparent modulus was needed to determine the stress range of the tendon during testing prior to stressing any deviator specimens, a value of 31,000 ksi was chosen for the apparent modulus of elasticity based on the data from Group 1 and Group 2.
During the stressing portion of each deviator specimen test, the strain gages were read at various levels of load applied via the stressing ram. This data from the strain gages on the live end was evaluated to verify the value chosen for the modulus. This data is shown as Group 3 in Table 4.2.
After the completion of the deviator specimen tests, two tests were performed by the author on single-strand samples using the same epoxy sleeve system used by Arrellaga for the tests in Group 1. These results are shown in Group 4. Strain gages were applied to only two wires on opposite sides of each strand sample in Group 4 while the Group 1 tests used a strain gage on each exterior wire.
All tests were averaged together as shown at the bottom of Table 4.2. The weighted average value for the modulus was very close to the value of 31,000 ksi originally chosen. Also shown is the weighted average value for the modulus from the DEMEC data points. This value is very close to the modulus provided by the strand manufacturer of 29,100 ksi and is lower than that predicted by the strain gages as expected.
4.2 Results of Deviator Specimen Tests
The results of the three successful deviator specimen tests are presented in the following sections. References have been made throughout this report to the first unsuccessful deviator specimen test performed, referred to as Test #0. The reason that this test was unsuccessful was that after a life of over 800,000 cycles, it was discovered that all 10 of the wires that had fractured had done so in the anchor head region of the test setup. This unsuccessful test led to changes in the stressing operation and in the gripping method that evolved into the methods described herein. Therefore, since Test #0 was conducted using different stressing and gripping methods, the data gathered during Test #0 is not presented along with the other three tests in this chapter.
4.2.1 Results of Test #1. In this first test specimen (shown in Fig. 3.8a), the deviator duct was overbent to 13 degrees to easily accommodate the tendon which enters the deviator segment at an angle of 10 degrees. This arrangement should represent "ideal" field conditions in which the tendon enters the specimen along a tangent with the duct, but the leading edge of the duct is overbent to avoid any abrupt angle changes.
As in all three of the tests, the applied loads were chosen to effect a 24 ksi stress range in the tendon. In this first test, the final applied loads were chosen within the first 5 cycles. Dial gage readings at both P max and P min were recorded periodically from this cycle

38
until the end of the test. The strain gages did not perform as consistently as the dial gages. Three of the original 24 strain gages applied were damaged during stressing. In addition, one gage failed after only 15,000 cycles and five more gages failed after approximately 300,000 cycles. One gage performed consistently throughout the test but was too different from the others to be considered valid. In all, fourteen of the twenty-four original gages were functional throughout the life of this specimen. In addition to mechanical difficulties with the strain gages, the first three readings of the dead end strain gages (@ P max = 98 kips) were inadvertently omitted.
4.2.1.1 Variation of Strain. Figures 4.2 and 4.3 show the strain gage readings taken throughout the life of test specimen #1 excluding those gages that appeared to malfunction.
7000 .-----------------,
6000
,:~~~~ 13000 12000
1000
Or-~-~-~-~-~-~
log Cycles
Figure 4.2 Strain gage readings for Test #1 @ 80 kips applied load.
I 1
7000~-------------------~
1000
O~~~~~~~~~~~~ 1
log Cycles
Figure 4.3 Strain gage readings for Test #1 @ 98 kips applied load.
4.2.1.2 Tendon Strain Range. Figure 4.4 shows the strain range that each strain gage experienced, i.e. the difference between the strain gage reading at P max and P min. The data points are shown to indicate the frequency of readings. Figure 4.5 shows that the data are initially evenly distributed around the Nominal Strain Range until approximately 1.2 million cycles when the strain ranges begin to increase sharply.
1200
1': ~ i ~ 600
j 400
I j
i 200 Ul 1 0
1
log Cycles log Cycles
Figure 4.4 Strain range for Test #1. Figure 4.5 Strain range envelope for Test #1.
39
4.2.1.3 Segment Displacement. The displacement of the segment measured relative to the first dial gage reading taken is shown in Figure 4.6. (For simplicity, the average of the two dial gages is shown.) The relative displacement is nearly constant until the abrupt discontinuity at about the same time that the first wire break was noted. The displacement then began to increase slightly until, at about 1.2 million cycles, wire breaks began to occur frequently and the relative displacement increased dramatically. Figure 4.7 shows the differential displacement throughout Test #1. After an initial decrease, the values from the two dial gages, though consistent with each other, are scattered around a value of about 0.7 inches.
~O~ ______________________ ~
j .... _ First Observed Wire Break@470,380cycles....: 1.6 ~ ,
J u ..... _i,!, J -~/:...----...-- ;.J t .8 ------;
80 kips , , ,
1 10 100 1000 10000 100000 1000000
log Cycles
Figure 4.6 Displacement of the segment during Test #1.
I .8
I .6 dial 8118" #2
.4
I .2
0 10 100 1000 10000 100000 1000000
log Cycles
Figure 4.7 Differential displacement of the segment during Test #1.
4.2.1.4 Post-Mortem Investigation Results. The post-mortem investigation of this specimen revealed extensive evidence of fretting between the tendon and the duct. The inside surface of the dead end and live end ducts were worn at the contact points with the strands. The middle third of both ducts had the deepest indentations as shown in Figure 4.8; these indentations were covered with brownish corrosion. The inner third of both ducts had shallow indentations with very little corrosion as shown in Figure 4.9, while the outer third had no damage at all. The same fretting damage was also evident at the corresponding locations on the strands. However, of the 13 wire fractures within the duct, only 5 of those appeared to have been on the side of the tendon in contact with the duct. The others were most likely initiated through contact with wires in adjacent strands.
An inventory of each of the wire fractures that occurred during Test # 1 was compiled including their location and a description of their fracture surface. As discussed earlier, the inclination of the fracture surface reveals whether or not a lateral force was acting when the wire fractured. Almost all of the fractures in Test #1 had a fracture surface that was slightly inclined and several were severely inclined. Only one wire had a fracture surface that was generally perpendicular to the wire axis. Examples of each are shown in Figures 4.10,4.11, and 4.12. The inventory of the wire fractures during Test #1 is shown in Table 4.3.

40
Figure 4.8 Evidence of fretting damage to middle section of Test #1 deviator duct.
Figure 4.9 Evidence of fretting damage to inner section of the deviator duct in Test #1.

41
Figure 4.10 Photograph of a Test #1 wire fracture with a fretting fatigue fracture surface.
Figure 4.11 Photograph of a Test #1 wire fracture with a slightly angled fracture surface.

42
Figure 4.12 Photograph of a Test #1 wire fracture with a normal fatigue fracture surface.
Table 4.3 Location and Description of Wire Fractures in Test #1
Strand # Break Location DETAll.S
DEAD END
5 1· inside duct slight angle; slight wear at origin of fracture; no corrosion
5 4" inside duct slight angle; tiny abrasion or damage at origin of fracture; no corrosion; evidence of fretting nearby
5 12" inside duct slight angle; some corrosion; slight wear
7 10" inside duct 2 adjacent wires; fretting fatigue fracture surfaces; both breaks originate at a worn spot; no
7 10" inside duct corrosion; the breaks were on the inside face of an outside strand; on the opposite side of the strand, it was obvious the strand was fretting against the duct although it didn't fracture there
3 3" inside duct 2 adjacent wires; slight angles; breaks originate at worn spots; slight corrosion at the breaks
3 5" inside duct
LIVE END
5&9 Anchor Head these wires broke due to fretting on the anchor head
3 12" inside duct obviously fretting fatigue fracture surface; corrosion and wear are evident; probably strand-to-strand since fracture was on inner face of an exterior strand
2 lh' inside duct slight angle; some corrosion; slight wear and a small nick at origin of fracture
7 7" inside duct slight angle; corrosion and wear are evident
1 12" inside duct no angle; standard fatigue fracture surface; slight corrosion; some wear and a small nick at origin of fracture
10 1" inside duct adjacent wires; both are classic fretting fatigue fracture surface with substantial corrosion and wear
10 1" inside duct at the origin of fracture
TOTAL NUMBER OF FRACTURES = 15

43
4.2.2 Results of Test #2. In Test #2 (shown in Fig. 3.8b), the deviator duct had a bend of only 2 degrees and was used with a tendon which enters the deviator segment at 10 degrees. This arrangement should simulate a ''worst case" scenario of actual field conditions in which the duct is unintentionally severely misaligned in the deviator or the situation when the wrong duct is used. The tendon, therefore, enters the specimen with a kink: since the leading edge of the duct is not overbent with respect to the tendon angle. The duct used in this test was somewhat longer than the duct in Tests #1 and #3; it protruded an additional inch beyond the face of the deviator.
As in all three of the tests, the applied loads were chosen to effect a 24 ksi stress range in the tendon; however, there is some uncertainty during the initial cycles of each test about the appropriate loads to apply. In Test #2, the specimen was cycled between the applied loads of 80 and 98 kips for the first 580 cycles. These applied loads induced an average strain range of 680 microstrain as opposed to 776 microstrain at the final applied loads of 78.5 and 98 kips. This is a 12% difference in the tendon strain. Fortunately, in both this test and Test #3, the initial strain range is below the final desired strain range and therefore would not overload the specimen. Although the extremely small number of cycles seems insignificant in light of the long lives of the specimens, they are included in the total number of cycles to failure, though it is not known how much those first cycles contributed to the degradation of the specimen. The data collected from the dial gages and the strain gages during this initial period is not shown with the final data. Data from both sources is shown beginning with readings at 580 cycles.
Six of the twelve strain gages originally applied were lost during stressing. Two additional strain gages were applied to one strand at this point. These two gages were only useful for strain range, not the absolute value of strain in the strand. One of the original gages and the two additional ones failed at about 200,000 cycles; another original gage failed at about 375,000 cycles. Thus, by the end of the test, only 4 of the original 12 gages were still active.
This high failure rate of the gages is partially related to a problem encountered with this particular specimen. At approximately 168,000 cycles, severe cracking was noted around the deviator pipe exit point on the dead end of the segment. At this point the test was stopped and measures were taken to effectively clamp together the segment to maintain the angle of the deviator pipe. The three strain gages that failed at this time were probably damaged while trying to fix the segment.
4.2.2.1 Tendon Strain Range. Figure 4.13 shows the strain range experienced by each strain gage. There is some variation between the gages, but they are consistently
1200 .-----------------.
;:;:; i i;~ :--- I lid""
O~~-_r-~-~--._~~ 1 10 100 1000 10000 100000 1000000
IogCycits
Figure 4.13 Strain range for Test #2.

44
f 1
I i Ul
1200
1000
800
800
400
200
0
NamiDaI. SUBin RaDsc - 24 bi
different. Figure 4.14 shows the trend of the data around the Nominal Strain Range. During roughly the first 100,000 cycles the strain ranges increase very slowly but are evenly distributed around the Nominal Strain Range. After this point, the ranges begin to increase at a much faster rate.
4.2.2.2 Segment Displacement. The relative displacement of the segment is shown
Figure 4.14 Strain range envelope for Test #2 in Figure 4.15. The displacement increases
100 1000 10000 100000 1000000 log Cycles
only slightly until, at about 273,000 cycles, it increases at a much faster rate. This point is only a few thousand cycles before the first wire break: was noted. After the first, a new break: was noted almost every time the setup shut down. This is reflected by the rapid increase in the relative displacement. Figure 4.16 shows that the differential displacement initially decreases, then begins to increase at a slow rate and then it peaks at that same transition point of about 270,000 cycles. After this, it is quite erratic but appears to be scattered about a value of .75 inches. The data from the two dial gages is quite consistent.
~0r-------------------~---' I Fa Observed W'~ Bralt @ 297,480 c:yc~ j 1.6 ,
J 12 ..... !
§" .8
o ~ .4
~ 10 100 1000 10000 100000 1000000
log Cycles
Figure 4.15 Displacement of the segment during Test #2.
dialpgc.1 1 =<:"",,0"
dialpgcl2
10 100 1000 10000 100000 1000000
IogCyclcs
Figure 4.16 Differential displacement of the segment during Test #2.
4.2.2.3 Post-Mortem Investigation Results. The post-mortem investigation of this specimen revealed some evidence of fretting between the tendon and the duct. The inside surface of the dead end and live end ducts were both worn at the contact points with the strands, but the pattern of wear in Test #2 was different from that found in Test #1. In this

45
Figure 4.17 Wear due to fretting on the outer end of the Test #2 deviator duct.
Figure 4.18 Overall view of the wear pattern on the Test #2 deviator ducts.

46
test, the outside third of both ducts had the deepest indentations, as shown in the photograph in Figure 4.17. The amount of wear diminished from one end to the other as shown in the overall photograph of both ducts in Figure 4.18. The middle third of both ducts had shallow indentations and the inner third had no damage at all. Wear due to fretting was also evident at the corresponding locations on the strands. However, neither the strands nor the duct had any visible signs of corrosion.
An inventory of each of the wire fractures that occurred during Test #2 was compiled including their location and a description of their fracture surfaces. Almost all of the fractures in Test #2 had a fracture surface that was slightly inclined, a few were severely inclined, and two had fracture surfaces that were generally perpendicular to the wire axis. A single strand with an example of each surface inclination is shown in Figure 4.19. The inventory of wire fractures is shown in Table 4.4. Of the 11 wire fractures within the duct, only 2 of those appeared to have been on the side of the tendon in contact with the duct. The others were most likely initiated through contact with wires in adjacent strands.
Figure 4.19 Example of Test #2 fracture surfaces.
4.2.2.4 Repair of Deviator Cracking. Some cracking of the concrete segment occurred around the deviator duct exit points during each of the three tests, however, the cracking that occurred early in Test #2 was far greater than the cracking during the entirety of the other tests. The cracking at the dead end of the segment (shown in Figure 4.20) was

47
Table 4.4 Location and Description of Wire Fractures in Test #2.
I Strand # I Break Location I DETAll..S I DEAD END
I S' outside duct slight angle; corrosion and wear evident; abrasion at initiation site; adjacent to other break in strand #1
I 6' outside duct no angle; no corrosion; no wear; small abrasion at initiation site of the break; this fracture appears to have been a result of adjacent wire break since it initiated on inside next to that wire
4 114' inside duct no angle; no corrosion; wear is evident
4 112 ' inside duct slight angle; slight corrosion; wear evident; initiated on inside face of wire, perhaps due to an adjacent break
4 I-Ih' inside duct fretting fatigue fracture surface; no corrosion or wear; tiny abrasion at initiation site
7 114' inside duct slight angle; no corrosion or wear; nick or abrasion at initiation site
7 2-~ " inside duct slight angle; no corrosion or wear; tiny abrasion at initiation site
2 3" inside duct slight angle; no corrosion or wear; tiny abrasion at initiation site
2 2" inside duct slight angle; no corrosion or wear; tiny abrasion at initiation site
10 I" inside duct slight angle; some corrosion; very small abrasion or damage at origin of fracture
3 0" slight angle; no corrosion; wear evident
LIVE END
9 Anchor Head this wire broke due to fretting on the anchor head
7 free length this wire fracture appeared to be due to pure fatigue between duct and
anchor head
I 2" inside duct slight angle; no corrosion; tiny abrasion at fracture origin
I 3" outside duct slight angle; slight corrosion; very small abrasion or damage at origin of fracture
3 0" fretting fatigue fracture surface; wear evident; no corrosion
5 I • outside duct slight angle; tiny abrasion at fracture origin; no corrosion
TOTAL NUMBER OF FRACfURES = 17
worse than the cracking at the live end (shown in Figure 4.21). This can be explained by the fact that the median stress in the tendon at the dead end tends to be higher than at the live end due to the higher seating losses occurring on the live end. The higher seating losses can be attributed to the friction across the deviator which keeps the dead end stresses high.
The test was stopped after 167,600 cycles so that repairs could be made to prevent further deterioration of the specimen, the concern being that the duct would deform itself enough to soften the intentional kink. In the field, these "self-correcting" measures might be welcome, but in the context of this study, it was desirable to maintain the same deviator duct angle throughout the test. Figure 4.22 shows the built-up section that was clamped

48
Figure 4.20 Cracking at the dead end of the deviator in the Test #2 segment.
Figure 4.21 Cracking at the live end of the deviator in the Test #2 segment.

49
Figure 4.22 Vertical clamp on the dead end deviator of the Test #2 segment.
Figure 4.23 Rehabilitated live end deviator of the Test #2 segment.

50
vertically against the bottom of the deviator on the dead end of the segment. Holes were drilled through the concrete segment on either side of the deviator and DYWIDAG prestressing rods were passed through the segment and through the built-up section. These rods were post-tensioned to effectively clamp the section together vertically. As Figure 4.22 shows, the cracks got wider after the vertical clamping force was applied. To avoid this on the live end, additional precautions were taken prior to the vertical post-tensioning. The repaired segment is shown in Figure 4.23.
The first stage of repair was to use a HILT! crack injection system to arrest the cracks. Several steps were involved in this process. First, clear plastic· ports were epoxied in strategic locations along the network of cracks. Several of these ports can be seen at the top of the segment in Figure 4.23. Epoxy was then applied liberally across the surface of the remaining exposed cracks. After all the topical epoxy had dried, a special crack injection epoxy was pumped into each of the ports, beginning with the port on the lowest crack. Pumping was continued into the first port until epoxy was observed leaking from one of the ports above. The injection hose was then clamped off at the first port and the procedure was repeated on each of the ports above.
The next step was to apply a horizontal clamp around the deviator just below the entrance and exit points of the deviator duct using two short pieces of tubular steel connected by I" diameter threaded rod. The horizontal clamp can be seen in the end view of the segment along with the vertical clamp in Figure 4.23. For clarity, a better view of the bottom of the segment with just the horizontal clamp is shown in Figure 4.24. Lastly, the
Figure 4.24 Horizontal clamp on Test #2 live end deviator viewed from underneath.

51
vertical clamp was post-tensioned into place. Each of the rehabilitative measures was successful based on the fact that the test continued for over 400,000 more cycles with only minimal additional cracking at each end.
After the test was completed, the vertical clamp was removed from the dead end of the segment and the concrete cover below the outer end of the duct fell off as shown in Figure 4.25.
Figure 4.25 Spalling of the Test #2 dead end deviator.
4.2.2.5 Deviator Duct Cracking. Slight cracking was observed in the outside ends of both deviator ducts in Test #2, due to high lateral pressure from the tendon. Photographs of this phenomenon will be shown with the Test #3 results where more extensive cracking occurred.
4.2.3 Results of Test #3. In Test #3 (shown in Fig. 3.8c), a deviator duct with a bend of 7.5 degrees was used in conjunction with the tendon which enters the deviator at 10 degrees. This arrangement should simulate "bad" but more realistic field conditions than those in Test #2. As before, it simulates conditions where the duct is unintentionally misaligned in the deviator or the situation when the wrong duct is used. The tendon will enter the duct at a kink since the leading edge of the duct is not overbent with respect to the tendon angle.
As in all three of the tests, the applied loads were chosen to effect a 24 ksi stress range in the tendon; however, just as in each of the previous tests, there is a period of

52
uncertainty at the beginning of this test during which the load range to be applied has not yet been established. In Test #3, the specimen was initially cycled between the applied loads of 78 and 98 kips for the first 1240 cycles (which corresponded to an average stress range of 15 ksi.) The applied loads were then changed to 78 and 103 kips (which corresponded to an average stress range of 22 ksi.) The stress range due to the initial applied loads is 30% less than that due to the final loads chosen; however, the duration of the application of the lower stress range was too short to affect the final results. As in Test #2, the total number of cycles will include those at the lower stress range but the data collected from the dial gages and the strain gages during this initial period is not shown with the final data. Data from the strain gages is shown beginning with readings at 1240 cycles; at the next reading, which was at 6010 cycles, the first set of dial gage readings were taken at the new applied loads.
It might appear that the initial stress range of 22 ksi being different from the 24 ksi stress range used in Tests #1 and #2 (a 10% difference) may present a problem for the purposes of future comparison of all three tests. Closer inspection of the data is required to discern that this is not the case. Figure 4.26 shows graphically that, after the first two readings at 1240 and 6010 cycles, the average of the strain ranges is within ..±.5% of the Nominal Strain Range for the next 30% of the test, i.e. the test setup had settled into a stress range of approximately 24 ksi as desired.
f 1200 within S'l' of N.s.R.
j 1000 I" ! "I
..... 800 hoo--~~.-:~===------r=-----1
j 800
S 400 NamiDal StmiD. Raage - 24 bi
t 200
~ 0 j---.....,.---,---,-----y-----i o 200000 400000 600000 800000 1000000
This graph is shown on a normal scale instead of a log scale so that the reader can grasp visually the length of the portion of the test being discussed. The log scale distorts the short period of Test #3 during which the average of the strain ranges is too far below the Nominal Strain Range.
Number of Cycles The dial gages were active Figure 4.26 Average strain range for Test #3. throughout the life of Test #3. The strain
gages were not quite as cooperative. Sixteen gages were applied originally; eight
on strands at the dead end and eight on strands at the live end. Of these, only four survived the stressing operation. Four additional gages were applied after stressing. As before, these gages were only helpful in determining the strain range, not the absolute level of strain. Another gage malfunctioned before the first cycle was completed, leaving seven active gages. Two of the new gages failed at about 500,000 cycles; at this time at least nine wire fractures had occurred. At the end of the test, five gages were still active. The severe cracking that occurred during Test #2 was not apparent in this test and cannot account for the high failure rate of the gages.

53
4.2.3.1 Tendon Strain Range. Figure 4.27 shows the strain range for each of the gages throughout Test #3. Figure 4.28 shows the trend of the data around the Nominal Strain Range. As discussed earlier, there was a long period of uncertainty at the beginning of this test and, therefore, the strain range data does not have the long, relatively flat portion that has been evident in the other two tests. It does have two distinct stages: the strain ranges are slowly increasing until about 250,000 cycles and after that, they are increasing at a faster rate.
1200r---------------------~ 1200r---------------------~
I':~--------.... BOO
J 400
I 200
NamiaaI Strain RaDge - 24 bi
Q~~--~--~--~--~--~ Or-~--_.--~--_.--._--~ 1 10 100 1000 10000 100000 1000000
log Cycles
Figure 4.27 Strain range for Test #3. Figure 4.28 Strain range envelope for Test #3.
4.2.3.2 Segment Displacement. The relative displacement of the segment throughout Test #3 is shown in Figure 4.29. The displacement increases only slightly until approximately 100,000 cycles, then it increases at a much faster rate, and then, in the last 100,000 cycles, it increases dramatically. Figure 4.30 shows the differential displacement which is increasing steadily at first, then at about 165,000 cycles becomes erratic while still tending to increase. Once again, the data from the two dial gages is consistent.
1 10 100 1000 10000 100000 1000000
logCyclcs
Figure 4.29 Displacement of the segment during Test #3.
1 10 100 1000 10000 100000 1000000
log Cycles
Figure 4.30 Differential displacement of the segment during Test #3.

54
4.2.3.3 Post-Mortem Investigation Results. The post-mortem investigation of the specimen revealed some evidence of fretting between the tendon and the duct. The inside surface of both the dead end and live end ducts was worn at the contact points with the strands. The pattern in Test #3 was similar to that found in Test #2 but different from that found in Test #1. In this test, similar to Test #2, the worst damage was at the outside end. The depth of the indentations decreased along the length of the duct. However, unlike Test #2, this duct had wear over the entire length. Wear due to fretting was also evident at the corresponding locations on the strands; however, the strands and the duct had very little corrosion. Figure 4.31 is a photograph of the inside of the outer portion of the duct. Figure 4.32 is an overall view of the wear pattern on both the live end and dead end ducts.
Figure 4.31 Wear due to fretting on the outer end of the Test #3 deviator duct.
Table 4.5 is an inventory of each of the wire fractures that occurred during Test #3 including their location and a description of their fracture surface. Almost all of the fractures within the duct in Test #3 had fretting fatigue fracture surfaces. Examples of the breaks that occurred on one strand are shown in Figure 4.33. Of the 9 wire fractures within the duct, only 4 of those appeared to have been on the side of the tendon in contact with the duct. The others were most likely initiated through contact with wires in adjacent strands.
4.2.3.4 Deviator Duct Cracking. Cracking was observed in the outside ends of both deviator ducts in Test #3 as shown in Figures 4.34 and 4.35. The cracking appeared to be a result of the high lateral pressure from the tendon.
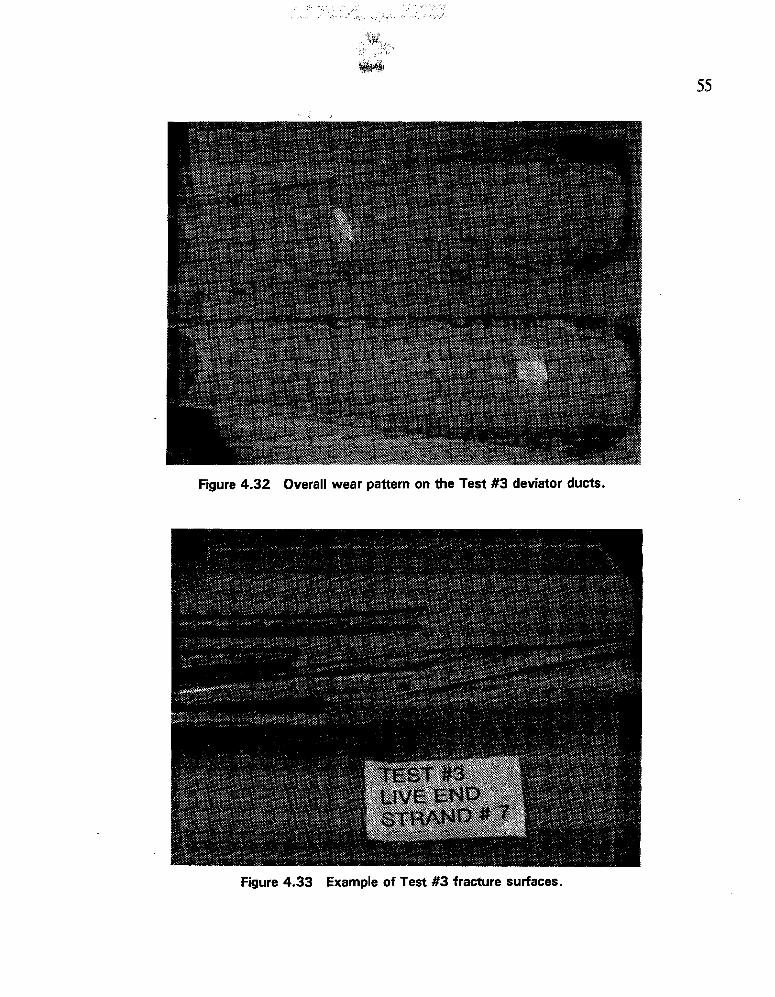
55
Figure 4.32 Overall wear pattern on the Test #3 deviator ducts.
Figure 4.33 Example of Test #3 fracture surfaces.

57
Table 4.5 Location and Description of Wire Fractures in Test #3.
Strand # Break Location DETAILS
DEAD END
7 I" inside duct no angle; some corrosion; wear evident; signs of fretting nearby on this wire and other adjacent wires
4 2" inside duct slight angle; some corrosion and wear
10 1" inside duct this wire was adjacent to the broken wire on strand #4; small abrasion or flaw at tip of fracture but no signs of corrosion; fracture surface not inclined
LIVE END
11 Anchor Head this wire broke due to fretting on the anchor head
11 Anchor Head this wire broke due to fretting on the anchor head
11 Anchor Head this wire broke due to fretting on the anchor head
11 Anchor Head this was the center wire of strand #11, therefore it either fretted on the anchor head or on adjacent broken wires
4 112" inside duct fretting fatigue fracture surface; wear and corrosion are evident; from the abrasions on the opposite side of this strand, it was obviously fretting against duct
10 112" inside duct fretting fatigue fracture surface; this wire was adjacent to the broken wire of strand #4; and also had some wear but no corrosion
7 0" fretting fatigue fracture surface all 4 of these wires
7 112" inside duct no angle on the fracture surface are adjacent to each other and have
7 I" inside duct fretting fatigue fracture surface; fracture initiated on inside of wire some wear but no
7 1" inside duct fretting fatigue fracture surface; this is the center wire of this strand corrosion
TOTAL NUMBER OF FRACTURES = 13

!!!!!!!!!!!!!!!!!!!"#$%!&'()!*)&+',)%!'-!$-.)-.$/-'++0!1+'-2!&'()!$-!.#)!/*$($-'+3!
44!5"6!7$1*'*0!8$($.$9'.$/-!")':!

CHAPfER5 EVALUATION OF DEVIATOR FRETIING FATIGUE TEST RESULTS
AND BASIS FOR DESIGN RECOMMENDATIONS
This chapter presents a comparison of the results of the three successful deviator fretting fatigue tests with each other as well as a comparison with results of tests of different prestressing strand applications. Finally, design recommendations will be made.
5.1 Terminology
Within the area of fatigue testing of different prestressing strand applications, there has not been a standardization of terms. This leads to confusion when comparing results from different experiments. To avoid this problem, the following section will define the terminology used in this discussion of results. Following that, this terminology will be compared to other terminology used in relevant research.
5.1.1 Terminology For the Deviator Fretting Fatigue Tests. In order to discuss the results of the deviator fretting fatigue tests, it is helpful to define a few frequently used terms. These terms are listed in Table 5.1, along with the physical significance of each term. They are arranged in the order of occurrence but are not discussed in that order. The "First Observed Wire Fracture" is the number of cycles when the first wire fracture was visibly or audibly observed. As the name states, this was when the first fracture was observed but may not be exactly when the actual first failure occurred. The "Test Termination Fatigue Table 5.1 Terminology For Stages of the Life" of the specimens was the point when Specimens' Fatigue Life
loading was discontinued. It was arbitrarily selected to be the number of cycles when ten wire fractures (12 percent of the wires) were believed to have occurred. Both of these points are difficult to establish precisely based only on visual inspection of the specimen. However, a plot of the stiffness of the specimen as a function of the number of load cycles should exhibit a perceptible change in slope at the time of the initial wire break. The stiffness of the specimens throughout the tests was not measured directly but the displacement of the segments (which indirectly reflects the stiffness of the specimens) was measured throughout the test. In addition, the shape
59
I TERMINOLOGY I "First observed wire fracture"
"Design fatigue life"
"Test termination fatigue life"
"Total fatigue life"
PHYSICAL SIGNIFICANCE
Number of cycles when the first kngWD wire fracture occurred.
Number of cycles when 5 % of the wires in the tendon had fractured.
Number of cycles when 12 % of the wires in the
tendon were suspected to have fractured.
Number of cycles when 100% of the wires in the
tendon had fractured.

60
2.0..--=~".".-_______ .......... -.. ,...,. TEST.1: ! 11.6 PiI!t ObsIncd Wh Break @ 471l,380 ey~
112 L9I
• JJi " .8 -- _w. i e 80. •
i':i .4
! o~~~~~~~~~
1 10 100 1000 10000 100000 1000000
logCyclcs
2.0 r=:::=-::::::---------...,.----, ...... TEST #2: i 11.6 PiI!t 0bsIncd Wh Break @ 297,480 ey~
JU .. ~ i " .8
1 10 100 1000 10000 100000 1000000
logCyclcs
1 10 100 1000 10000 100000 1000000
log Cycles
of the displacement versus number of load cycles curve should be essentially vertical when a substantial number of wires are fractured.
Figure 5.1 is a plot of the relative displacement of the concrete segments throughout the life of the tests which, as mentioned, reflects the stiffness of the specimens. The ''First Observed Wire Fracture" is labeled on the plot for each test and appears to coincide closely with a definite change in the slope of the curve in each case. Also evident in Figure 5.1 is the nearly vertical slope of each curve at the time the test was discontinued which confirms that the useful life of the test was at hand. At the rate at which wires were breaking, the number of cycles at which all of the wires would have fractured (or the "Total Fatigue Life") would be quite close to the "Test Termination Fatigue Ufe". Thus, the end of the test, or the "Test Termination Fatigue Life" of the specimens, is the best basis for comparing the three tests to each other in terms of their total fatigue life. However, neither the "Test Termination Fatigue Life" (which would be essentially a structural failure) nor the "First Observed Wire Fracture" (which will be shown to be far too conservative) is a good choice for the "Design Fatigue Life" of an externally post-tensioned girder.
The fatigue life of specimens in strandFigure 5.1 Relative displacement versus log in-air tests is generally taken to be equal to the cycles for each test. number of cycles when the first wire fractures,
which is a loss of approximately 14 percent of the total strand area for a single seven-wire strand. However, in a typical twelve-strand tendon, the first wire fracture is only about 1 percent of the tendon area. Therefore, it seems far too conservative to designate the ''First Observed Wire Fracture" as the basis for the "Design Fatigue life" of an external tendon, especially given the fact that one or two wire fractures can occur during the stressing of a tendon in the field. However, in the testing of multiple-strand cable-stays, the Post-Tensioning Institute's (PTI) present "Recommendations for Stay Cable Design and Testing" include the following requirement for acceptance testing of multi-strand stay cables:

"During testing, not more than two percent of the number of individual wires may fail. ,,28
61
If this limitation were implemented in laboratory testing and field applications of externally post-tensioned tendons, a maximum of two percent of the wires fractured would correspond to 1.68 wires for a twelve-strand tendon. This means that no more than one wire fracture during testing is acceptable according to PTI recommendations. Again, this is not a practical limitation for field applications. The PTI Committee for Cable Stays has recognized that the present criterion is too conservative for small cables and is presently considering relaxing the two percent limit on wire fractures in fatigue tests for acceptance of cable stay systems. One proposal is to use "two percent but not less than four wires." This would correspond to four allowable wire fractures in a twelve-strand tendon. This seems acceptable from a stressing standpoint and should not be associated with excessive deflections. Therefore, for the purposes of the discussion of these deviator fretting fatigue tests, since the four wire fracture would govern, the number of cycles at which the fourth wire fractured in this twelve strand tendon will be referred to as the "Design Fatigue Life" of the specimen.
In these deviator fretting fatigue tests, it was difficult to determine exactly when each fracture occurred. Often the test would stop cycling for no apparent reason and a visual inspection of the specimen would not reveal any new breaks. In some cases, the wire
,- fracture that caused the testing to stop would later unwind (and thus become apparent) after the specimen was restarted and had cycled for a while. Other times, no corresponding break became evident. For these reasons, an alternative method was needed to approximate the number of cycles until the fourth wire fracture occurred.
As mentioned, the most conservative estimate of the "Design Fatigue Life" would be the "First Observed Wire Fracture". A practical estimate of the end of the useful life would be the fracture of about 12 percent of the wires (the ''Test Termination Fatigue Life" corresponding to 10 wire fractures in this twelve-strand tendon). The least conservative estimate of the "Design Fatigue Life" would be the fracture of every wire (the theoretical "Total Fatigue Life"). It was felt that the best estimate of the "Design Fatigue Life" would be somewhere between the first two benchmarks, the 'First Observed Wire Fracture" and the "Test Termination Fatigue Life." Designating 2 percent of the wires fractured but not less than four wires (the fourth wire fracture, in this case) as the indicator of the "Design Fatigue Life" entails making a reasonable determination of the number of cycles until that fracture occurred. As shown in Figure 5.1 (and in the magnified view of the end of Test #3 in Figure 5.2), the number of cycles between fractures decreased dramatically toward the end of the fatigue life of the specimen, but the exact rate differs with each specimen and can not be determined precisely from the data collected. After testing was completed, a post-mortem investigation was done on each specimen and the actual number of wire fractures was discovered.

62
2.0 ..... -----------first 0bserIed WIre FI'8Ctlre" 120.150 cycles,
-Test Termination Fatigue LIfe"
828.500 13 /cycles
100000 2r1I,238 1000000 log Cycles
A conservative approach to estimating the number of cycles until the fourth wire fractured, which would certainly underestimate the number of cycles, would be to assume that the fractures occurred at even intervals from the first wire fracture until the test termination. If, as shown in Fig. 5.2 for Test #3 for instance, 13 fractures occurred between 120,150 cycles and 828,500 cycles, this interval can be divided into 12 equal intervals of approximately 59,000 cycles. At this rate, the fourth fracture would have occurred after approximately 300,000 cycles. An example of this approach and the result for Test #3 is shown in Figure 5.2, and appears quite reasonable.
Figure 5.2 fracture.
Similar calculations can be performed for each test to find a reasonable lower bound estimate of the "Design Fatigue Life" of each
specimen. The results of these calculations of the "Design Fatigue Life" of each specimen are presented in Table 5.2.
Designation of the fourth wire
Note that, although the intention was that each test would be terminated after approximately 10 wire fractures, in each test the final number of wire fractures varied. However, as noted earlier, by the end of the test, the fractures occurred more frequently, and so the points occurred quite close to each other. This makes comparison between specimens based on the "Test Termination Fatigue life" valid. Also, in each test, the percent of the total number of wires fractured is close enough to the percent loss in a single wire fracture of a single strand to compare the "Test Termination Fatigue Life" to Paulson's model for the fatigue life of strand.
Table 5.2 Number of Wire Fractures and Calculated "Design Fatigue Life" For Each Specimen
Test Number of % of Total Fractures -First "Design "Test Termination # Wire Number of Inside Observed Wire Fatigue Life" Fatigue Life"
Fractures Wires Deviator Fracture" (cycles) (cycles) Fractured (cycles)
1 15 18 13 I 470,380 798,158 2 x 1()6
2 17 20 13 297,480 353,235 594,840
3 13 15 9 120,150 29 828,500

63
5.1.2 Comparison of Tenninology For Related Tests. As previously mentioned, in strand-in-air tests of single strands (such as the group of data reported by Paulson and shown in Figure 2.3), the number of cycles until the first wire fracture is usually considered the "Fatigue life" of the specimen. For a single strand, this first wire fracture constitutes a loss of about 14 percent of the strand area. No distinction is made between the "First Observed Wire Fracture" and the "Test Termination Fatigue Life" since the test is usually terminated after the initial wire fracture in single strand-in-air tests, and therefore, this same point is also the "Design Fatigue Life." To compare test results of multiple strand applications (to determine whether the incorporation of a strand into a girder or stay cable causes a reduction in the fatigue life of the strand) on the same basis as that used by Paulson, the 14 percent area reduction would be usefully approximated by the "Test Termination Fatigue Life." This may be a good basis for comparing experimental results.
In formulating design recommendations, Paulson suggests the application of his fatigue model for predicting the fatigue life of single strands and recommends its use unchanged in the design of suspension and stay cables and in the design of uncracked, pretensioned concrete girders. However, most practical applications using prestressing strand require use of a fairly large number of strands. In general, a 14 percent loss of total strand area in a girder or stay would be considered very unacceptable. Therefore, for most multiple strand applications, it would be inappropriate to use Paulson's model as a design guide. For each application, an acceptable percent of wire fractures must be established and tests done to identify the number of cycles at each stress range that the application can sustain.
Usually, detection of individual wire fractures in a girder test is not possible, so various investigators have used different measures for reporting the useful fatigue life of strands in girders. Overman studied the fatigue behavior of pretensioned concrete girders with multiple strands.2S Figure 5.3 shows the maximum centerline deflection throughout the test of a typical specimen. As the curve shows, the specimen's deflection remained stable throughout most of the test and then rapidly increased from 0.9 inches at 480,000 cycles to 1.70 inches at 578,000 cycles. The first wire
'"'" 2.(] .-----___________ .-----. i First Obsened Wue Fracture @ 540,000 cy
1.6
j " ~ .8
S .4.fl-m-~ .g ~ 0 i---T"'"""-.,----,-----.---,--'""--r----'
10 100 1000 10000 100000 1000000
log Cycles
breaks were heard at 540,000 cycles (as noted on the figure) and were visible at 578,000 cycles when severe concrete spalling occurred. The specimen was subsequently loaded to failure with an ultimate centerline deflection of 4.8 inches. The post-mortem investigation revealed that thirty-three wire fatigue fractures had occurred in the sixteen-strand specimen. Overman states that "Failure was defined as the point that fatigue testing was stopped, which was characterized by a drastic increase in centerline deflection at the Figure 5.3 Maximum static centerline deflection for
Overman's Specimen C-16-NP-1 O.5-NO-O.58. 2S

64
maximum static load ... often accompanied by massive concrete spalling and audible wire breaks." Therefore, he declared failure of this specimen at 578,000 cycles.25 Overman later refers to this failure point as the "Fatigue ute" of the girder and observes that "Because failure is by brittle fatigue fracture of prestressing steel with no apparent fretting or corrosion fatigue, it seems logical that fatigue results for individual strands could be used to predict fatigue lives of pretensioned concrete members." This would only be true if the "Design Fatigue ute" of the member is chosen to be when 14 percent of the tendon wires have fractured. In the case of Overman's tests, each specimen tested exhibited the same sudden deterioration, indicating that the number of cycles until the first wire fractured was nearly the same as the end of the useful fatigue life of the specimen. Or, in the terminology used for the deviator fretting fatigue tests, the "First Observed Wire Fracture" is very nearly the same as the 'Test Termination Fatigue Ufe" and, therefore, the same as the "Design Fatigue Ufe." This is similar to the strand-in-air tests where the single term "Fatigue Life" indicates all three points. This is very different from the deviator fretting fatigue tests where there was gradual deterioration even before the first wire fracture and then an increasing rate of deterioration over a longer time interval. In Overman's tests, such a short interval between the first wire fracture and the end of the fatigue life, makes the determination of the "Design Fatigue Ufe" (as performed for the deviator fretting fatigue tests) unnecessary. Because of the sudden deterioration, it is appropriate to compare the "Fatigue Uves" of these pretensioned beams with either Paulson's strand model or the results of the present series.
Yates investigated the behavior of fourteen reduced beam specimens post-tensioned with a single strand tendon.40 Yates found that the fatigue behavior of all the beam specimens tested was similar: after an initial deterioration in stiffness, there was a long relatively stable period with no additional loss in stiffness until the first wire break, after which a dramatic decrease in stiffness occurred. Yates measured crack width (as shown in Figure 5.4) as well as displacement as the indicators of stiffness. Cycling was continued in several of the tests until the second wire break, but in each of the tests the number of cycles until the first wire fracture was considered the "Fatigue ute" of the specimen. Again, since
~o.-______________________ ~ First Observed 'Wire Fracture @ 1,270,000 eyel
I :::
the deterioration is so rapid, the "Fatigue Life" is essentially equal to the "Design Fatigue Ufe." For this reason, it is appropriate to compare the lives of the specimens to Paulson's strand-in-air fatigue model and to make suggestions for design models based on the "Fatigue Life" of the specimens. Based on his own tests and results of previous tests, Yates suggested a fretting fatigue design model that predicts
o~--~--r---~--~--~--~ 10 100 1000 10000 100000 1000000 the life of strand-type tendons in metal
ducts as a function of the tendon stress range and the contact load between the
Figure 5.4 Crack width versus number of cycles tendon and duct. for Yates' Specimen M-5-20-1.27.4fJ
log Cycles

65
Wollmann extended the research to the behavior of reduced beam specimens post-
.3r-----------------------------------------~ -e- "6-1-40-0.10
--- "6-2-30-0.49
tensioned with a multi-strand .2:i -- .. 6·3-20-(0.62)
tendon.38 Wollmann found a _ ~
difference in the stiffness ~ .2
-- "6-5-20-1.02
® u
histories for single strand and .§. multi-strand reduced beams. For :s .15
the multi-strand reduced beams j with a six- strand tendon, the ~ first wire fracture reduced the . ~ .1
tendon cross-section by only 2.5 percent and, therefore, the decrease in stiffness was more gradual, as shown in Figure 5.5.
o+---~------------~------------------~--------------~ Still, the transition from the stable phase with fairly constant
o 500000 1000000 1500000
Number of Cycles
s ti ffn e sst 0 the rap i d Figure 5.5 Stiffness histories for Wollmann's Group M deterioration of the tendon never Specimens.38
required more than 100,000 cycles. Since the test setup was not sensitive enough to detect single wire fractures, Wollmann designated the approximate onset of the transition curve as the "Effective Fatigue Life" of the specimens. As shown in Figure 5.5, the onset of the curve was fairly obvious, and though Wollmann did not report the first observed wire fracture, it can be assumed to be the previous point. The total number of wire fractures were reported and can be used to calculate the "Design Fatigue Ufe" using the approach described for the deviator fretting fatigue tests. Table 5.3 includes a list of the results of these c3.Iculations.
The calculations for Test #2 are not listed because, as the curve for that test shows, the data point chosen as the "Effective Fatigue Life" was recorded nearly 400,000 cycles after the previous data point. It was felt that this curve was not well-defined enough to make a reasonable estimate of the "Design Fatigue Life." In the other cases, the reasonably close correlation of the calculated "Design Fatigue Life" with the point chosen as the
Table 5.3 Calculation of the "Design Fatigue Life" For Wollmann's Specimens
TEST # Established Quantities Approximated Quantities
Number of Wire "Effective First Wire Test "Design Fatigue Fractures Fatigue Life" Fracture Termination Life"
1 9 100,000 50,000 165,000 93,125
3 12 620,000 461,500 750,000 540,200
5 15 1,020,000 1,020,000 1,200,000 1,059,000

66
"Effective Fatigue Life" indicates that these points are essentially the same. Therefore, it is appropriate to use the "Effective Fatigue life" of the specimens in Wollmann's tests as a basis for design models. Based on his own tests and the database compiled by Yates, Wollmann suggested a different fretting fatigue design model that predicts the life of strandtype tendons in metal ducts as a function of the tendon stress range and the contact load between the tendon and duct.
To summarize, it is important to clearly understand the terminology used in any test. Especially in fatigue tests, since there has not been a standardization of terminology, it is imperative that comparisons between tests be based on data taken at comparable points in the life of the test. In strand-in-air tests, tests on pretensioned beams, and tests on monostrand post-tensioned reduced beam specimens, the deterioration of the specimen is very rapid. Therefore, there is no need to differentiate between different phases of the end of the fatigue life. In tests on deviator fretting fatigue specimens and tests on multi-strand post-tensioned reduced beam specimens, the deterioration is not as rapid after the initial wire fracture. Therefore, care must be taken to differentiate the different stages of deterioration for purposes of comparison and developing design models.
5.2 Life of the Deviator Specimens
In design provisions for structural members subjected to fatigue loadings, lower bound Wohler (or S-N) curves are frequently used as the basis for design models. In Figure 5.6, two points during the fatigue life of each of the three successful deviator fretting fatigue tests are plotted for comparison with Paulson's lower bound strand-in-air mode126 and with the shaded area representing the strand-in-air failure zone.40
100~ ________________________________________________ ~
10
10 4
D "First Observed Wire Fracture" o -Teat Termination Fatfgue life"
Testt1: 10" tendon ang!e, 13· deviator duct anQle Test t2: 10" tendon angle; 2" devialDr duct angle Test «3: 10" tendon angle, 7.IJ· devialor duct angle
10' 10 • life, N (Log of Number of Cycles)
10 1
Figure 5.6 "First Observed Wire Fracture" and "Test Termination Fatigue Life" of deviator specimens compared to Paulson's model.
The first of the two points shown for each test is a square representing the "First Observed Wire Fracture," which corresponds to a 1 percent reduction in the strand area. It would be improper to compare this point to the life predicted by Paulson's model for which the fatigue life was determined by one wire fracture out of seven. The second point shown for each test is a circle representing the ''Test Termination Fatigue Life." This point generally corresponds to the same area reduction as occurs during the single wire fracture of a strand-in-air test and therefore can be compared to Paulson's strand model to determine if incorporation of the strand into an externally post-tensioned girder

67
shortens the fatigue life of the strand. As shown, the ''Test Termination Fatigue Life" of the Test #1 specimen (which had an 18 percent loss of strand area) exceeded the number of cycles predicted by Paulson's model for the fatigue life of a strand tested in air by more than 500,000 cycles. This indicates that the incorporation of a group of strands into the tendon of an externally post-tensioned girder with a properly aligned deviator duct does not appreciably shorten their fatigue life if the 14 percent reduction in area is acceptable. However, in fairness it should be pointed out that not much data was available to Paulson for stress ranges under 30 ksi.
The results of the calculations of the "Design Fatigue Life" of each specimen
100~ ________________________ ~
0: co
10 .& "DesIgn Fallgue Ule"
o "FIrst 0bseIved WIre Fracture" o "Test Tenninallon Fallgue Ule"
10 5 10' 10 7
Ule, N (Log of NulMer' of CycIe6)
were presented in Table 5.2, and are plotted as triangles in Figure 5.7 for comparison with Paulson's lower bound strand-in-air mode126 and with the shaded area representing the strand-in-air failure zone.40 The "Design Fatigue Life" of the Test #1 specimen (in which the arrangement of the deviator duct reflects "ideal" field conditions) is much less than the life of a strand tested in air at the same stress range as predicted by Paulson's model. Therefore, Paulson's strand model would not be an appropriate design guide for externally post-tensioned girders at this stress range. The "Design Fatigue Life" of Figure 5.7 Design life of deviator specimens the other two deviator specimens are compared to Paulson's model.
substantially less than predicted by Paulson's strand-in-air model. The Test #2 specimen, which had the most severe misalignment of the deviator duct (2 degree duct angle with a 10 degree tendon angle) representing the "worst case" scenario of field conditions, had the shortest "Test Termination Fatigue Life," as expected, but had a slightly longer "Design Fatigue Life" than the Test #3 specimen. The Test #3 specimen, which had a moderate misalignment of the deviator duct (7.5 degree duct angle with a 10 degree tendon angle) representing ''bad'' field conditions, had a fatigue life between the other two, and the shortest "Design Fatigue Life." The length of the lives will be discussed further in the next section. Though the lives of both specimens were clearly shortened (when compared to the Test #1 specimen) due to the deleterious effects of duct misalignment, the lives were still exceptionally long given the unrealistically high stress range. Design recommendations for externally post-tensioned girders based on these results will be presented at the end of this chapter, along with a summary of the design recommendations made in this report for other prestressed applications.

68
5.3 Comparison of the Fretting Fatigue Tests
Comparing the three deviator fretting fatigue tests reveals the effect that misalignment of the deviator duct has on the fatigue life of the specimens. The end of each test was declared whenever 10 strands had visibly or audibly fractured. It is interesting to note that, in each test, the post-mortem investigation of the specimen revealed that more wire fractures had occurred than suspected. In fact, Test #1 was declared a runout after cycling for 2 million cycles with very few known wire fractures until, during the post-mortem investigation, the specimen was cut open and several additional wire fractures were discovered. The final number of fractures in each test varied as listed in Table 5.2. Also listed in Table 5.2 was the "Test Termination Fatigue Life" of each specimen. If each test had run until the exact same number of wire fractures occurred, the ''Test Termination Fatigue Life" of the Test #1 and Test #3 specimens would have been even longer when compared to Test #2 (which had the most fractures). As previously reported, at the end of each specimen's life, the wire fractures occurred more frequently. This was depicted graphically in Figure 5.1. Near the end of each test, the relationship between displacement and number of cycles became increasingly exponential. Therefore, the lives recorded in Table 5.2 are a reasonable approximation of what would be expected had each test continued until exactly the same number of wires fractured.
The general shape of these graphs is very similar to the shape of the graph previously shown in Figure 2.2 (shown again here as Figure 5.8) which illustrates
__ --------]Fatigue Fractures the stiffness history of a typical Occuring at an pretensioned concrete girder subjected to
Gradual Debonding (U) Increasing Rate (ID)
Number of Cyda, N
Figure 5.8 Stiffness history of girder tests.40
cyclic loading. The initial portion of the fretting fatigue test graphs are not as well defined as this idealization (for the reasons explained in Section 4.1.2) but the graph of Test #1 does have a few early data points
that exhibit the initial loss of stiffness depicted in Phase I. All three tests have enough data points throughout the rest of the test to establish a very well-defined pattern that closely resembles the gradual debonding of Phase II and the increasing rate of fractures of Phase ID.
Also indicated in Figure 5.1 was the number of cycles at which the first break was observed. In each test, there is a decrease in the number of cycles until this first fracture was observed. It seems logical that the first fracture would occur the latest in Test # 1 because of the "ideal" conditions which should cause the minimum amount of fretting. However, following that logic would lead to the conclusion that the earliest observed wire fracture should have occurred during Test #2 (which had the ''worst case" conditions for fretting and should have had the worst fretting damage), but this was not the case. It seems that either the first fracture should have occurred earlier in Test #2 or later in Test #3 or

69
that the logic is wrong. There are several possible scenarios that could create this apparent discrepancy.
First, as the tests progressed and the researchers became more experienced, indications of breaks became more apparent and were possibly recognized earlier in subsequent tests. Secondly, during Test #3 four wires of the same strand fractured at the same location due to fretting on the anchor head. This unusually high concentration of fractures of one strand in the anchor head seems to indicate that this strand was twisted in a way that would cause unusually high lateral pressure and the high number of anchor head fractures. These wires may have fractured earlier than those due to fretting inside the deviator.
One possible explanation for a delayed observation of the first wire fracture in Test #2 could be that the first wires to fracture in Test #2 were possibly those farther inside that could not unwind and, therefore, could not be seen. Also, because the duct in Test #2 was longer than the ducts in the other two specimens, it was able to bend slightly (as the cracked concrete of specimen #2 indicates) and by bending, soften the kink. A longer duct is proposed by Powe1l29 as a preventative measure against fretting fatigue. To prevent cracking in the third specimen, additional reinforcing was used in the segment near the end of the deviator duct. Very little cracking occurred in Test #3.
And finally, it is possible that the first wire fractures did occur when they were observed and that the order of first fractures does not follow the pattern proposed. One possible reason for a variation of when the first break occurred in each test could be a function of the so-called "length effect." Any prestressing strand inherently has flaws. Their distribution may not be uniform throughout the reel. There is a possibility that, although the contact pressure was over a shorter length (and therefore was higher) in Test #2 than in Test #3, there were more flawS in the longer region of contact pressure in Test #3. The wear patterns on the ducts, as shown schematically in Figure 5.9, show the longer region of high contact pressure. The thickness of the lines in the figure indicate the relative depths of the abrasions. As shown in the figure, the abrasions on the Test #3 duct were deeper and more prevalent than those on the Test #2 duct. Brownish corrosion was evident around some of the abrasions. The location and degree of corrosion are represented with shading. The degree and pattern of the wear are clearly a result of the configuration of the duct and tendon within the deviator.
L Test 11: 10" 18ndon angle, 13° duct angle
---------------=------ :.: --------~ :.: ---------..---------- ::;
h. Test #2: 10" 18ndon angle, 2" ductangle
c. Testt3: 10" 18ndon angle, 7~· duct angle
Figure 5.9 Wear patterns and corrosion on the ducts.

70
a. Test #1
b. Testt#2
Figure 5.10 is an approximation of the shape of the stressed tendon across the two adjacent ducts in each of the tests. Because of the overbend in the Test #1 duct, the tendon was not in contact in the outside portion of the duct. This agrees with the wear pattern. In Tests #2 and #3, there was a kink at the leading edge of the duct (at both the dead and live ends) and, therefore, the wear is heavier at the outer ends. The location of the wire fractures should also indicate the areas of highest contact pressure.
Figure 5.10 Shape of the tendon in the duct.
Figure 5.11 shows the number and location of wire fractures within each specimen, excluding those in the anchor head or far outside of the deviator duct. Of the 13 fractures within the duct of the Test #1 specimen, 9 breaks were 3 inches or more inside from the end of the duct. dead
end
I
T
I
live • end
ix)QO( RX i ~ x tr' When the fractures occur, the two : I I Test#1 i segments of the wire often separate, and
~~:-----+---+----+--+---X)OO(+. ----;~ the segment closer to the anchor head will I ... Test #2 often unwind. Apparently, fractures that
__ -+-_-.111___..1 are far inside the grouted duct cavity were 1 Test#3 - It I not able to unwind and could not be : observed from outside. The two segments
Figure 5.11 Schematic drawing of the wire fracture locations (x) in each test. may separate by one to three inches after
the fracture. The location marked is the location of the inner portion since it seems
less likely to unwind. In Test #1, the locus of the wire fractures is nearer the middle of the deviator duct which is consistent with the geometry of the duct/tendon arrangement and the wear pattern. In Tests #2 and #3 the concentration of fractures is much closer to the outside edges of the ducts where the kink in the strand occurred.
To summarize, it is clear that the fatigue degradation of the Test #2 and Test #3 specimens was far worse than the Test # 1 specimen. The only intentional variation in the tests was the geometry of the deviator duct. In Test #3, the duct was misaligned to represent a ''bad'' field configuration. In Test #2, the duct was slightly longer than in the other two tests and was misaligned to represent a "worst case" field configuration. The result of these alterations was a premature "First Observed Wire Fracture" and an early ''Test Termination Fatigue Life" leading to a considerably shortened "Design Fatigue Life"

71
of the Test #2 and #3 specimens compared to the Test #1 specimen. Ibis shortened life can be attributed to increased fretting as a result of the increased contact pressure at the imposed kink. Evidence of the fretting patterns can be seen by examining the wear patterns on the ducts and the locations of the wire fractures.
5.4 Design Recommendations
It is clear that if prestressed girders remain uncracked, strand fatigue will not be a problem. Should the girders crack due to any cause, fatigue should be considered using an estimate of stress range computed for a cracked section and with appreciable allowances for prestress losses. This will give credible maximum stress ranges for fatigue when design level live loads are considered.
In order to determine a realistic lower bound 'fatigue model for individual strand, Paulson compiled the results of over 700 strand-in-air tests.26 From this data, he
100~ ________________________ ~
a: UJ
• Overman • RabbaI, et 81. 10
-- Runout (No failure) :.... t 4% Mlnlroom Overload during StatIc Test
10 5 10' Ule, N (Log 01 Number 01 Cycles)
Figure 5.12 Fatigue life of pretensioned girders, compared to Paulson's model. (after Overman25
and Paulson26)
recommended a lower five percentile fracture design model with a fatigue endurance limit of 20 ksi for the fatigue life of prestressing strand as shown in Figure 5.12. Yates40 initially proposed the idea of the shaded strand-in-air failure zone (also shown in Figure 5.12) which encompasses most of the data reported by Paulson.26 In addition, Figure 5.12 shows the results of pretensioned girder tests conducted by Overman9 along with those he collected from Rabbat, et al.,30 plotted to compare with the shaded strand-in-air failure region. The pre tensioned girder data is in fairly close agreement with the model that Paulson recommended. These test results show that the lower bound of the fatigue characteristics of strand are not altered substantially when the strands are integrated into a pretensioned concrete member.40 However, the current 1989 AASHTO design curve for Allowable Fatigue Stress Range (Category B for Redundant Load Path Structures), shown in the figure, fits Overman's data more conservatively than Paulson's model and is recommended for design of pretensioned girders.
The AASHTO provisions for Allowable Fatigue Stress Range and Stress Cycles (based on expected daily traffic and lane loadings) are reproduced in Figure 5.13. These provisions were originally established for the fatigue design of structural steel weldments and are used as follows:

72
TABLE l0.3.1A Allowable Fatigue Stress Range
REDUNDANT LOAD PATH STRUCTURES • Allowable Range of Stress. FST (ksi) "
Category (See Table 10.3.1B) For 100,000 Cycles For 500,000 Cycles For 2,000,000 Cycles For over 2,000,000 Cycles
A 63 37 24 24
B 49 29 18 16
B' 39 23 14.5 12
C 35.5 21 13 10 12 b
D 28 16 10 7
E 22 13 8 4.5
E' 16 9.2 5.8 2.6
F 15 12 9 8
NONREDUNDANtLOADPATHSTRUCTURES
Allowable Range of Stress. FST (ksi) " .~
Category (See Table 10.3.1B) For 100,000 Cycles For 500,000 Cycles For 2,000,000 Cycles For over 2,000,000 Cycles
A 50 29 24 24
B 39 23 16 16
B' 31 18 11 11
C 28 16 10 9 12 b lib
D 22 13 8 5 Ee 17 10 6 2.3
E' 12 7 4 1.3
F 12 9 7 6 *StN:ture typos with multi-lead paths whore a .~ Iiuturc in a momber _ lead to tbo ooUapae. For """"'Pie, a .imply oupponcd I~ _ multi-beam l>ridF or a multi-e_ eye bar ...... member bas J<dUDdalll Icod paths.
"Tho nIIIF of._ is definocl as tbo algcm;e diffc....,. ~ tbo IIlIIlUmum ._ mil tbo minimum .-.. T ... i""._ is """"idem! to have tbo oppooilc algcm;c Ii", ftOlD OOIDpIaI&iOll slte88.
"For _ stiff"",r _Ids COl girder -= or 1IaDp.
"Paniall<:nglh _Idod OOYCr pia .... shall DOt be used "" flazIp mote than 0.8 incbco lhiclr for DOIII'CCIuadaDt lead path sln>:t\lrc8.
TABLE lO.3.2A Stress Cycles
MAIN (LONGITUDINAL) LOAD CARRYING MEMBERS
Type of Road Case ADIT" Truck Loading Lane Loading •
Freeways, Expressways, Major Highways, and Streets I 2,500 or more 2,000,OOOc 500,000
Freeways, Expressways, Major Highways, and Streets II less than 2,500 500,000 100,000
Other Highways and Streets not included in Case I or II m - 100,000 100,000
TRANSVERSE MEMBERS AND DET All.S SUBJECTED TO WHEEL LOADS
Type of Road Case ADIT" Truck Loading
Freeways, Expressways, Major Highways, and Streets I 2,500 or more over 2,000,000
Freeways, Expressways, Major Highways, and Streets II less than 2,500 2,000,000
Other Highways and Streets m - 500,000 'Average Daily Truclr Traffic (ODe ~).
bLcmgjtudiml members sbcuId aJso be cbocbld for ItUOk loadinJ.
"Members shall aJso be inveetiprecl for Saver 2 miIIioa9 .\rcu _Ice producod by placing a .~ truck "" Ibo bridge clialributecl to tbo girders .. dceipllocl in Arti ... 3.23.2 for ODe
traffic !aDO Ioodin&. Tho _ in s"",1 p.der -= shall DOt exaoed 0.58 FyDo,.C for !his .~ truck Ioodin&.
Figure 5_13 Current (1989) AASHTO design tables for structural steel.

The average daily truck traffic or equivalent lane loading determines the required fatigue life of the weldment detail being designed. With the known stress range at the location of the proposed weld and based on the class of structure, the type of loading, and the type of member, an appropriate weldmentdetail can be chosen from an extensive list. Alternatively, an existing weld detail can be analyzed to determine its Allowable Fatigue Stress Range, or, if that is known, to determine its expected service life.
73
While the originators of these provisions probably never envisioned their use in fatigue design of prestressed concrete, the procedure is quite usefuL These curves are especially practical to use in applications of prestressing strand such as girders or cable stays because of the association with the Average Daily Truck Traffic. To apply the AASHTO B curve in the design of pretensioned girders, the only additional information needed would be either the anticipated traffic loadings (from which the allowable fatigue stress range could be determined) or the anticipated fatigue stress range (and then the life expectancy could be determined.) Using cracked section theory and appreciable allowances for prestress losses, the stress ranges to be expected in the girders under specified loadings could be computed for comparison.
The Post-Tensioning Institute has also recommended the use of several of the AASHTO curves for the fatigue design of stay cables.28 The curve used is a function of whether the load path is redundant or non-redundant and the type of stay cable (parallel strand, parallel wire, or bar). Similarly, a careful distinction must be made when applying the AASHTO design curves to pretensioned and post-tensioned girders because in pretensioned girders the individual strands are isolated and completely surrounded by concrete. This is usually not the case in post-tensioned concrete.
The data collected by Yates and Wollmann from fretting fatigue tests of post-tensioned beams with metal ducts is plotted in Figure 5.14 and compared with the shaded region representing the strandin-air failure zone. Nearly all of the data points fall below Paulson's model, indicating the detrimental effect of fretting fatigue in internally post-tensioned concrete girders?9 Most of the data points also fall below the AASHTO Category B design curve that was recommended for design use with pretensioned girders. However, all the points except one lie above the 1989 AASHTO C design curve. This curve is slightly conservative at 2 million cycles, where the allowable stress range of 13 ksi
100~ ________________________ ~
o GlrderTests 10: X Reduced Beam Tests
r - Runout (No faliURI) [
10 5 10 8
LIfe, N (Log of Number of Cycles)
Figure 5.14 Fatigue of post-tensioned girders with metal ducts, compared to Paulson's model. (after Wollmann38 and Paulson26
)

74
100~~ ____________________________ -,
C!-
ol II:
fQ
.; "" c:
'" a: :s I!! (ij
j
10 (J MUlllpIe Strand Tendonl In PlastIc Duc:t8 X Single Strand TendOB$ In PlastIc Duc:t&
...... Runout (No failure)
10' 10 I LIe, N (Log of Number of CydeI)
Figure 5.15 Fatigue of post-tensioned girders with plastic ducts, compared to Paulson'S model. (after Wollmann38 and Paulson26
)
100·~ __________________________________________ ~
AASHTO D
est #1: 10" tendon angle, 13· deviator duct anQle est #2: 10" tendon angle; 2" deviator duct angle est #3: 1 0" tendon angle, 7.s" deviator duct angle
10 5 10' ute, N (Log of Number of Cycles)
Figure 5.16 "Design Fatigue Life" of deviator specimens compared to design models for other prestressing strand applications.
is below the ronout data points, and the curve is more conservative at the recommended endurance limit of 10 ksi.
Figure 5.15 presents the results of fretting fatigue tests with strand-type tendons in plastic ducts collected by Wollmann.38 The figure shows that, while the single-strand specimens exhibit a substantial improvement in fretting fatigue performance with the use of plastic duct, the trend is not apparent for multi-strand specimens, which had reduced fatigue lives due to strand-to-strand fretting. All of the data fall well within the limits of the AASHTO C design curve. Overall, the fit of the AASHTO C curve is very acceptable for internally post-tensioned beams with metal or plastic deviator ducts. Externally post-tensioned girders, on the other hand, have very different details and should not be automatically lumped together with internally post-tensioned girders. The present series of tests investigated this issue.
In Figure 5.16, the "Design Fatigue Life" of each of the three successful deviator specimens (representing a portion of an externally post-tensioned box-girder) are plotted for comparison with Paulson's lower bound strand-in-air mode126 and with the shaded area representing the strand-inair failure zone.40 Also shown for comparison are the design models recommended earlier in this report for
pretensioned girders (AASHTO B) and for internally post-tensioned girders (AASHTO C). The AASHTO D curve is also shown for comparison. As shown, the "Design Fatigue Life" of the Test #1 specimen (reflecting "ideal" field conditions) is slightly less than predicted by the AASHTO B design model, while the design lives of the Test #3 specimen (reflecting "bad" field conditions) and the Test #2 specimen (reflecting ''worst-case'' field conditions) are clustered tightly on either side of the AASHTO C design model.

75
Based on the "ideal" case, it might appear to be appropriate for such applications to recommend the use of the current 1989 AASHTO Category B design curve (AASHTO B). However, in reality field conditions are not always ideal; field engineers have related incidents in which a tendon was inadvertently threaded through the wrong deviator duct or a duct was installed backwards in the precast segment. While the most severe misalignments can be detected during stressing, more subtle misalignments would be harder to detect and should be accounted for by recommending a conservative design guide, particularly when it will not unduly penalize normal applications. As previously discussed, this test was run at an unrealistically high stress range of 24 ksi in an effort to highlight the severity of the fretting fatigue problem. However, in normal applications, the stress range of an externally post-tensioned tendon in a segmental box-girder is expected to be less than 4 ksi. This stress range is well below the 10 ksi endurance limit suggested by the AASHTO C design curve. Therefore, the current 1989 AASHTO Category C design curve for Allowable Fatigue Stress Range for Redundant Load Path Structures (AASHTO C), shown in Figure 5.16, is recommended for use in the design of both internally and externally posttensioned girders.
5.5 Summary
Although most of the wire fractures in each deviator fretting fatigue specimen were due to fretting fatigue, obviously shortening their lives, it can be concluded that fretting fatigue of the tendon within a properly-positioned deviator duct subject to realistic service stress ranges will not cause a premature failure of an externally post-tensioned box-girder.

!!!!!!!!!!!!!!!!!!!"#$%!&'()!*)&+',)%!'-!$-.)-.$/-'++0!1+'-2!&'()!$-!.#)!/*$($-'+3!
44!5"6!7$1*'*0!8$($.$9'.$/-!")':!

CHAPTER 6 SUMMARY, CONCLUSIONS AND RECO:MMENDATIONS
6.1 Summary
The growing use of externally post-tensioned segmental box-girder construction in the United States and abroad has necessitated research to verify prevailing design practices. One of the most important features of externally post-tensioned girders is the deviator detail. Its proper design is inherent to the integrity of the entire bridge. Research has been performed on the strength and detailing of the deviators, but the effect of the relatively pronounced angle change on the tendon in the deviator region under cyclic loading had not yet been thoroughly investigated. Because the deviators are the only intermediate attachment points to the concrete section, they are locations of high local contact pressure on the tendon and an area of potential slip during cyclic loads -- conditions necessary for the process called "fretting" to occur. Previous research has shown that where the potential for fretting is present, the fatigue life of the system may be shortened. Therefore, with this detail's inherent potential for fatigue degradation, studies were needed to investigate the behavior of the tendon under cyclic loading at the deviator to ensure the long life of the system.
This report documents the construction and testing of three deviator specimens which are representative of externally post-tensioned segmental box-girders. The first specimen (representing "ideal" field conditions) was tested at an unrealistically high stress range (24 ksi), as compared to actual box-girder bridge conditions, in an effort to highlight the detrimental effects of fretting fatigue. The specimen performed better than expected, thus precluding the need to test another "ideal" specimen at a lower, more realistic stress range. Next, the focus of the research turned to the common but potentially dangerous situation of misalignment of the deviator duct.
Two segments with different degrees of misalignment of the deviator duct (ranging from ''bad'' to "worst-case") were constructed and tested at the same unrealistically high stress range (24 ksi). Finally, a post-mortem examination of the specimens was conducted to reveal any evidence of fretting fatigue.
6.2 Conclusions
The following conclusions are based on the results of the three successful deviator fretting fatigue tests presented in this report.
1. Fretting occurred in all three externally post-tensioned deviator specimens.
77

78
2. Fretting was much worse in the deviator specimens with duct misalignment, probably as a result of higher contact pressure.
3. The majority of the fretting fatigue wire fractures were caused by strand-to-strand fretting or fretting between wires of the same strand rather than strand-to-duct fretting. This may be because the duct material is considerably softer than the strand material and the duct wears more easily thus relieving local pressures.
4. The "Test Termination Fatigue Life" of all of the deviator specimens was surprisingly long, indicating that fretting fatigue is not a major issue in externally post-tensioned girders.
5. The "Design Fatigue Life" of post-tensioned girders with multi-strand tendons should be based on the number of cycles at which 2 percent of the total number of wires (but not less than 4 wires) have fractured.
6. The "Design Fatigue Life" determined for the "ideal" specimen-was more than double the "Design Fatigue Life" determined for each of the two specimens with misaligned deviator ducts.
7. The deterioration of specimens reported in the literature after initial wire fracture has been extremely rapid for single strand-in-air specimens, pretensioned girder specimens, and internally post-tensioned monostrand girder specimens. In contrast, the deteriorations of internally post-tensioned multiple strand girder specimens and the externally post-tensioned multiple strand deviator specimens tested in this study were much more gradual after the first wire fracture. The rate of deterioration continued to increase until the test was terminated.
6.3 Design Recommendations
Currently there are no code provisions for the fatigue design of pre tensioned or posttensioned girders. In keeping with the precedent set by the Post-Tensioning Institute's current "Recommendations for Stay Cable Design and Testing", the following design recommendations are made:
1. Fatigue design for prestressed concrete bridges should utilize the AASHTO design curves for Allowable Fatigue Stress Range. Such an approach allows the designer to use an overall design philosophy relating desired life to class of highway and daily truck traffic.
2. Fatigue design of prestressed girders should be based on stress ranges calculated assuming cracked sections and realistic, appreciable prestress losses.

79
3. The fatigue design of pretensioned concrete girders should be in accordance with the current 1989 AASHTO design curve for Allowable Fatigue Stress Range for Category B for Redundant Load Path Structures.
4. The fatigue design of internally post-tensioned concrete girders with metal or plastic deviator ducts should be in accordance with the current 1989 AASHTO design curve for Allowable Fatigue Stress Range for Category C for Redundant Load Path Structures.
5. The fatigue design of externally post-tensioned concrete girders should be in accordance with the current 1989 AASHTO design curve for Allowable Fatigue Stress Range for Category C for Redundant Load Path Structures.
The Category C fatigue limit should be used with caution for externally prestressed structures with stress ranges approaching or exceeding 10 ksi.
In addition to the specific code provision recommendations, use of the bugle-shaped rigid-metal deviator duct previously shown in Figure 2.10 should be encouraged to avoid the deleterious effects and retrofit costs of deviator duct misalignment.

!!!!!!!!!!!!!!!!!!!"#$%!&'()!*)&+',)%!'-!$-.)-.$/-'++0!1+'-2!&'()!$-!.#)!/*$($-'+3!
44!5"6!7$1*'*0!8$($.$9'.$/-!")':!

BmLIOGRAPHY
1. American Association of State Highway and Transportation Officials (AASHTO), Standard Specifications for Highway Bridges, Fourteenth Edition, Washington D.C., 1989.
2. American Institute of Steel Construction, Manual of Steel Construction Load and Resistance Factor Design, First Edition, USA, 1986.
3. Arrellaga, J.A, "Instrumentation Systems for Post-Tensioned Segmental Box Girder ridges," Unpublished M.S. Thesis, The University of Texas at Austin, December 1991.
4. Beaupre, R.J., Powell, L.c., Breen, J.E., and Kreger, M.E., "Deviation Saddle Behavior and Design for Externally Post-Tensioned Bridges," The University of Texas at Austin, Center for Transportation Research, Research Report 365-2, July 1988.
5. Bill, R.C., "Review of Factors that Influence Fretting Wear," Materials Evaluation Under Fretting Conditions, ASTM STP 780, American Society for Testing and Materials, 1982, pp. 165-182.
6. Cordes, H., and Lapp-Emden, H., "Untersuchung zur Dauerfestigkeit von Spanngliedern flir die besonderen Bedingungen der teilweisen Vorspannung (Investigation of the Fatigue Strength of Tendons in Partially Prestressed Concrete Structures)," Report 18/84, Institut flir Massivbau, Technical University Aachen, June 1984.
7. Diab, J.G., "Fatigue Tests of Post-Tensioned Concrete Girders," Unpublished M.S. Thesis, The University of Texas at Austin, December 1988.
8. Eibl, J., and Voss, W.,"Zwei Autobahnbrucken mit externer Vorspannung (Two Motorway Bridges with External Prestressing)," Beton und Stahlbetonbau (84), 1989, Heft 11.
9. Eibl, J., "Externally Prestressed Bridges," External Prestressing in Bridges, ACI SP-120, 1990, pp. 375-387.
10. Eibl, J., "On Some External Prestressed Bridges in Germany," Federation Internationale De La Precontrainte, Eleventh Congress, Hamburg, 1990.
11. Fontana, M.G., Corrosion Engineering, McGraw-Hill, Inc., New York, Third Edition, 1986, pp. 105-109, pp. 139-142.
81

82
12. Georgio, T., "Fretting Fatigue in Post-Tensioned Concrete Girders," Unpublished M.S. Thesis, The University of Texas at Austin, December 1988.
13. Hall, C. R., "Development of Test Apparatus for Examining the Fretting Fatigue Potential of Post-Tensioned, External Tendons in Box-Girder Deviator Ducts," Unpublished M.S. Thesis, The University of Texas at Austin, December 1988.
14. Hindi, A, "Enhancing the Strength and Ductility of Post-Tensioned Segmental BoxGirder Bridges," PhD Dissertation The University of Texas at Austin, December 1990.
15. Jartoux, P., LaCroix, R., "Development of External Prestressing, Evolution of the Technique," Federation Internationale De LaPrecontrainte, 11th Congress, Hamburg, 1990.
16. Kashima, S., "Construction and Load Tests of a Segmental Precast Box Girder Bridge Model," PhD. Dissertation, The University of Texas at Austin, January 1974.
17. Krueger, F.E., "Fretting Failures," Metals Handbook, Vol. 10, American Society for Metals, 8th Edition, pp. 154-160.
18. Lamb, J.L., and Frank, KH., "Development of a Simple Fatigue Resistant Stay Cable Anchorage," The University of Texas at Austin, Center for Transportation Research, Research Report 384-1F, November 1985.
19. MacGregor, R.J.G., "Evaluation of Strength and Ductility of a Three-Span Externally Post-Tensioned Box Girder Bridge Model," PhD. Dissertation, The University of Texas at Austin, August 1989.
20. MacGregor, R.J.G., Kreger, M.E., and Breen, J.E., "Strength and Ductility of a Three-Span Externally Post-Tensioned Segmental Box Girder Bridge Model," External Prestressing in Bridges, ACI SP-120, 1990, pp.315-338.
21. Magura, D.D., and Hognestad, E., "Tests of Partially Prestressed Concrete Girders," ASCE Proceedings, Vol.92, ST.1, February 1966, p.327-350.
22. Milller, H.H., "Fatigue Strength of Prestressing Tendons," Betonwerk und Fertigteiltechnik, December 1986, pp. 804-808.
23. Oertle, J., Thiirlimann, B., and Esslinger, V., "Versuche zur Reibermiidung einbetonierter Spannkabel (Fretting Fatigue Tests of Post-Tensioning Tendons)," Institut fUr Baustatik und Konstruktion, Em Zurich (Swiss Federal Institute of Technology), Report 8101-2, October 1987.
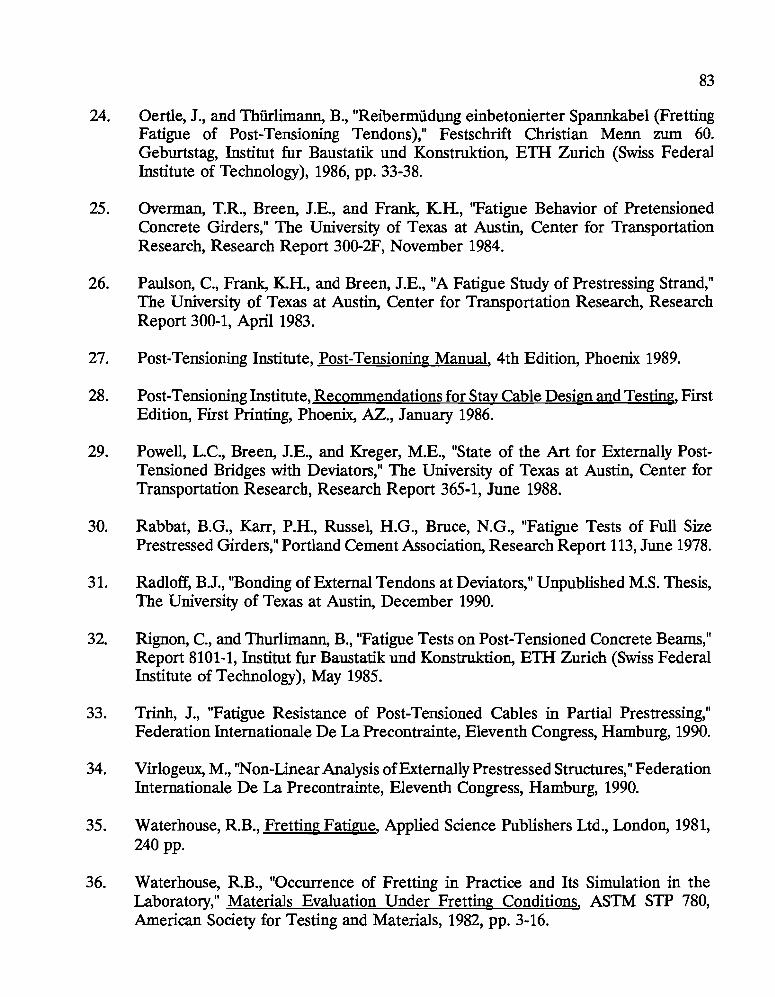
83
24. Oertle, J., and Thiirlimann, B., "Reibermiidung einbetonierter Spannkabel (Fretting Fatigue of Post-Tensioning Tendons)," Festschrift Christian Menn zum 60. Geburtstag, Institut fur Baustatik und Konstruktion, ETH Zurich (Swiss Federal Institute of Technology), 1986, pp. 33-38.
25. Overman, T.R., Breen, J.E., and Frank, KH., "Fatigue Behavior of Pretensioned Concrete Girders," The University of Texas at Austin, Center for Transportation Research, Research Report 300-2F, November 1984.
26. Paulson, C., Frank, KH., and Breen, J.E., "A Fatigue Study of Prestressing Strand," The University of Texas at Austin, Center for Transportation Research, Research Report 300-1, Apri11983.
27. Post-Tensioning Institute, Post-Tensioning Manual, 4th Edition, Phoenix 1989.
28. Post-Tensioning Institute, Recommendations for Stay Cable Design and Testing, First Edition, First Printing, Phoenix, AZ., January 1986.
29. Powell, L.C., Breen, J.E., and Kreger, M.E., "State of the Art for Externally PostTensioned Bridges with Deviators," The University of Texas at Austin, Center for Transportation Research, Research Report 365-1, June 1988.
30. Rabbat, B.G., Karr, P.H., Russel, H.G., Bruce, N.G., "Fatigue Tests of Full Size Prestressed Girders," Portland Cement Association, Research Report 113, June 1978.
31. Radloff, B.J., "Bonding of External Tendons at Deviators," Unpublished M.S. Thesis, The University of Texas at Austin, December 1990.
32. Rignon, c., and Thurlimann, B., "Fatigue Tests on Post-Tensioned Concrete Beams," Report 8101-1, Institut fur Baustatik und Konstruktion, ETH Zurich (Swiss Federal Institute of Technology), May 1985.
33. Trinh, J., "Fatigue Resistance of Post-Tensioned Cables in Partial Prestressing," Federation Internationale De La Precontrainte, Eleventh Congress, Hamburg, 1990.
34. Virlogeux, M., "Non-Linear Analysis of Externally Prestressed Structures," Federation Internationale De La Precontrainte, Eleventh Congress, Hamburg, 1990.
35. Waterhouse, R.B., Fretting Fatigue, Applied Science Publishers Ltd., London, 1981, 240 pp.
36. Waterhouse, R.B., "Occurrence of Fretting in Practice and Its Simulation in the Laboratory," Materials Evaluation Under Fretting Conditions, ASTM STP 780, American Society for Testing and Materials, 1982, pp. 3-16.

84
37. Wharton, M.H., Taylor, D.E., and Waterhouse, R.B., "Metallurgical Factors in the Fretting Fatigue Behavior of 70/30 Brass and 0.7% Carbon Steel," Wear, Vol. 23, 1973, p. 251.
38. Wollman, G.P., "Fretting Fatigue of Multiple Strand Tendons in Post-Tensioned Concrete Beams," Unpublished M.S. Thesis, The University of Texas at Austin, December 1988.
39. Wollman, G.P., Yates, D.L., Breen, J.E., and Kreger, M.E., "Fretting Fatigue in PostTensioned Concrete," The University of Texas at Austin, Center for Transportation Research, Research Report 465-2F, November 1988.
40. Yates, D.L., "A Study of Fretting Fatigue in Post-Tensioned Concrete Beams," Unpublished M.S. Thesis, The University of Texas at Austin, December 1987.
41. Ryals, K K, "Fretting Fatigue of Tendons in Deviator Ducts of Externally PostTensioned Segmental Box-Girders," Unpublished M. S. Tbesis, The University of Texas at Austin, August 1992.