Embed Size (px)
Citation preview

Replaceable Unbonded Tendons for
Post-Tensioned Bridges
Task 1-Support for Mockup Injection
Interim Report January 2015 Principal investigator:
H. R. Hamilton Co-Principal investigator:
J. A. Rice Research assistants:
Rahul Bhatia Natassia Brenkus Department of Civil and Coastal Engineering University of Florida P.O. Box 116580 Gainesville, Florida 32611 Sponsor: Florida Department of Transportation (FDOT) Will Potter, P.E. –Project Manager Rick W. Vallier, P.E. –Project Manager Contract: UF Project No. 000112216 & 000112218 FDOT Contract No. BDV31-977-15
University of FloridaEngineering School of Sustainable Infrastructure and Environment
Department of Civil and Coastal Engineering
BDV-31-977-15 Page ii
Executive Summary
This report covers the research conducted for Task 1 of the “Replaceable Unbonded
Tendons for Post-Tensioned Bridges” FDOT Project BDV31-977-15. Three mockup 19 strand
PT tendons (200-ft long) were injected with three different heated, pliable fillers. This report
documents the process and results of the testing. Preliminary testing was also conducted on a
small scale setup to evaluate individual components to be used in the full scale mockup, to
ensure the safety of the laboratory staff during the full scale mockup injections, and acclimate the
staff to the new procedure and equipment in a smaller, more controlled setup.
During injection the temperature and pressure of the filler material was monitored along
the length of the tendon during and immediately following injection. Clear pipe windows were
placed along the length to allow visual observation of the injection process. Short sections of
duct were removed one day after the injection at critical locations to determine presence and
characteristics of voids.
The target injection rate range was 50-80 ft/min. The average injection rate for
Visconorust, VZ inject and Cirinject CP was 49 ft/min, 75 ft/min and 62 ft/min respectively.
Injection rate for Visconorust and Cirinject CP were close to the target injection rate, while the
VZ inject rate was higher.
Injection rates and venting procedures were varied among the three mockups, primarily
in an effort to determine the most suitable approach. In spite of the variation of procedures, all
of the strands in each of the three specimens were well-coated with filler material even though
the first two tendons injected contained a void at the top of the duct cross section in the parabolic
portion of the mockup. These voids were thought to be the result of inadequate venting
procedures and not the PT system or individual filler products used. At the completion of these
mockup tests, no cause to restrict use of any of the PT systems or filler products was found.
BDV-31-977-15 Page iii
Table of Contents
Executive Summary ...................................................................................................................................... ii Table of Contents ......................................................................................................................................... iii List of Figures .............................................................................................................................................. iv List of Tables ............................................................................................................................................... vi 1 Introduction.............................................................................................................................................. 1 2 Research Approach and Test Purpose ..................................................................................................... 2 3 Pliable Filler Material Selection .............................................................................................................. 3 4 Test Set-up Design and Construction ...................................................................................................... 5
4.1 Tendon Design ............................................................................................................................. 5 4.2 Tendon Details ............................................................................................................................. 6
4.2.1 Anchorage ............................................................................................................................... 6 4.2.2 Duct ......................................................................................................................................... 7 4.2.3 Injection ports ........................................................................................................................ 11
4.3 Tendon Support Frame and Deviators ....................................................................................... 12 4.4 Tendon Fabrication and Stressing ............................................................................................. 14 4.5 Injection equipment ................................................................................................................... 22 4.6 Pliable filler preparation ............................................................................................................ 23
5 Instrumentation and Data Acquisition ................................................................................................... 25 5.1 Instrumentation plan .................................................................................................................. 25
5.1.1 Pressure Transducers ............................................................................................................. 27 5.1.2 Thermocouples ...................................................................................................................... 27 5.1.3 Volume Calculation .............................................................................................................. 29 5.1.4 Gravity Deviator Displacement ............................................................................................. 29
5.2 Data Acquisition ........................................................................................................................ 29 6 Small Specimen Component Tests ........................................................................................................ 31 7 Injections ............................................................................................................................................... 35
7.1 Cirinject CP ............................................................................................................................... 35 7.1.1 Injection Process ................................................................................................................... 35 7.1.2 Observations .......................................................................................................................... 36
7.2 Visconorust ................................................................................................................................ 37 7.2.1 Injection Process ................................................................................................................... 38 7.2.2 Observations .......................................................................................................................... 38
7.3 VZ Inject .................................................................................................................................... 39 7.3.1 Injection Process ................................................................................................................... 39 7.3.2 Observations .......................................................................................................................... 40
8 Results and Discussion .......................................................................................................................... 41 8.1 Post-Injection Inspection ........................................................................................................... 41
8.1.1 Cirinject CP ........................................................................................................................... 42 8.1.2 Visconorust ........................................................................................................................... 49 8.1.3 VZ Inject ............................................................................................................................... 55
8.2 Injection pressure ....................................................................................................................... 60 8.3 Temperature ............................................................................................................................... 62 8.4 Injection Rate ............................................................................................................................. 65 8.5 Relative Fill ............................................................................................................................... 67
9 Summary ................................................................................................................................................ 69 10 References.............................................................................................................................................. 70 11 Appendix-A ........................................................................................................................................... 95
BDV-31-977-15 Page iv
List of Figures
Figure 1—Tendon profile for the mockup testing on unbonded tendons ..................................................... 6 Figure 2—Anchor block placed on the frame ............................................................................................... 7 Figure 3—Clear window locations on tendon ............................................................................................ 10 Figure 4—Typical mechanical coupler ....................................................................................................... 10 Figure 5—Injection ports (a) DSI (b) VSL (c) Freyssinet .......................................................................... 11 Figure 6—Injection through duct ................................................................................................................ 11 Figure 7—Plan and elevation of the foundation plan ................................................................................. 12 Figure 8—Mockup support system including (a) anchorage frame (b) middle frame (c) supports between
frames, and (d) gravity deviators ........................................................................................................ 13 Figure 9—(a) McElroy HDPE fusion machine (b) Duct fusion in progress ............................................... 15 Figure 10—HDPE duct on the support frame after welding ....................................................................... 16 Figure 11—HDPE duct connected to the anchor block at the east end ...................................................... 16 Figure 12—Clear windows in duct ............................................................................................................. 16 Figure 13—West end connected to the anchor block ................................................................................. 17 Figure 14—Strand installation using Model 00143604/2 strand pusher from PAUL Maschinenfabrik
GmbH & Co ....................................................................................................................................... 18 Figure 15—Bullet on the head of the strand during pushing ...................................................................... 18 Figure 16—Wedge plate installation .......................................................................................................... 19 Figure 17—Wedge plate installed on anchor .............................................................................................. 19 Figure 18—Monostrand hydraulic jack and pump used to stress strands ................................................... 20 Figure 19—Deviators suspended by tendon after stressing ........................................................................ 20 Figure 20—Strand tails cutting in operation ............................................................................................... 21 Figure 21—Grout pump (Schwager Davis Inc.) ......................................................................................... 22 Figure 22—Viking pump used for filler injection ...................................................................................... 23 Figure 23—(a) Barrel heater position on barrel (b) heaters covered with insulation blanket ..................... 23 Figure 24—(a) Transfer of filler from one barrel to another barrel (b) Filler being stirred ........................ 24 Figure 25—Instrumentation plan for full scale mockup ............................................................................. 26 Figure 26—Instrumentation orientation on the tendon ............................................................................... 26 Figure 27—Typical pipe saddle (Ford Meter Box)..................................................................................... 26 Figure 28—Typical transducer installed on the tendon (Make: Omega) .................................................... 27 Figure 29—Thermocouple probe to measure filler temperature (a) with both thermocouple and surface
probe installed on the duct (b) top internal orientation (c) bottom orientation and (d) side orientation ............................................................................................................................................................ 28
Figure 30—Schematic of instrumentation plan .......................................................................................... 29 Figure 31—Data acquisition trailer ............................................................................................................. 30 Figure 32—Typical small scale test setup .................................................................................................. 31 Figure 33—Typical small scale test specimen ............................................................................................ 32 Figure 34—Deformation in the duct due to high pressure .......................................................................... 34 Figure 35—Schematic of set up for Cirinject CP and VZ Inject specimens ............................................... 35 Figure 36—Schematic of set up for Visconorust injection ......................................................................... 37 Figure 37—Inspection port (IP) locations on tendon .................................................................................. 41 Figure 38—Duct internal pressure during Cirinject CP injection ............................................................... 61 Figure 39—Variation in duct internal pressure during Visconorust injection ............................................ 61 Figure 40—Duct internal pressure during VZ-inject injection ................................................................... 62 Figure 41—Filler temperature in duct during Cirinject injection ............................................................... 63 Figure 42—Filler temperature in duct during Visconorust injection .......................................................... 63 Figure 43—Filler temperature in duct during VZ-inject injection .............................................................. 64 Figure 44—Injection rate during Visconorust injection ............................................................................. 65 Figure 45—Injection rate during VZ inject injection ................................................................................. 65

BDV-31-977-15 Page v
Figure 46—Injection rate during Cirinject CP injection ............................................................................. 66 Figure 49—Surface temperature of the duct during Cirinject CP injection ................................................ 66 Figure 47—Surface temperature of the duct during Visconorust injection ................................................ 67 Figure 48—Surface temperature of the duct during VZ-inject injection .................................................... 67
BDV-31-977-15 Page vi
List of Tables
Table 1—Properties of different injection material for mockup test ............................................................ 4 Table 2—ETA table for HDPE smooth pipe selection (ETA 06/226 2012) ................................................. 8 Table 3—Size of HDPE duct based on various specifications ..................................................................... 8 Table 4—Cell classification for HDPE duct (ASTM 3350, 2012) ............................................................... 9 Table 5—Small scale test specimens and components tested ..................................................................... 32 Table 6—Post-injection inspection of Cirinject CP .................................................................................... 42 Table 7—Post-injection inspection of Visconorust .................................................................................... 49 Table 8—Post-injection inspection of VZ inject ........................................................................................ 55 Table 9—Comparison of theoretical and injected volume for the mockup ................................................ 68
BDV-31-977-15 Page 1
1 Introduction
This report covers the research conducted for Task 1 of the “Replaceable Unbonded
Tendons for Post-Tensioned Bridges” FDOT Project BDV31-977-15. Three mockup 19 strand
PT tendons (200 ft long) were injected with three different heated, pliable fillers. This report
documents the process and results of the testing. Preliminary testing was also conducted on a
small scale setup to evaluate individual components to be used in the full scale mockup, to
ensure the safety of the laboratory staff during the full scale mockup injections, and acclimate the
staff to the new procedure and equipment in a smaller, more controlled setup.
During injection the temperature and pressure of the filler material was monitored along
the length of the tendon during and immediately following injection. Clear pipe windows were
placed along the length to allow visual observation of the injection process. Short sections of
duct were removed one day after the injection at critical locations to determine if voids formed
and there extent.
BDV-31-977-15 Page 2
2 Research Approach and Test Purpose
This portion of the research project was intended to help us become familiar with the
heating and injection process used for injecting a flexible filler. Three different commercially
available materials were selected for use not with the intent to test the material, but rather to use
different materials to test the approach. Consequently, the differences in behavior between the
three tests are likely due to the injection procedures rather than the material properties.
The objective of this research was to investigate the constructability of unbonded post-
tensioned bridge tendons injected with pliable filler. The testing focused on tendon and duct
detailing, filler material preparation and injection, injection process and equipment, and injection
and venting procedures. The results are intended to provide background and information on this
process and to assist in the preparation of material and construction specifications.
BDV-31-977-15 Page 3
3 Pliable Filler Material Selection
A search for commercially available filler materials was conducted to aid in the selection
of the materials to be used in mockup testing. Alternatives were evaluated based on their
conformance to either PTI-ACI specification (PTI 2006) or EOTA specifications (ETAG013
2002). Samples of each of the filler materials were collected, along with their MSDS (material
safety data sheet). Although the primary aim of the mockup testing was to evaluate
constructability, the use of multiple specimens provided the opportunity to test several different
materials. While the selection of a single material would have eliminated the variation in results
due to product, it was decided that the knowledge gained by using several different materials
outweighed the need to control variables.
Visconorust-2090-P, Cirinject CP, and Nontribos VZ Inject were chosen for the three
mockup specimens primarily due to the fact that all three have been used as PT tendon filler.
Sanchem NO-OX-ID-NG was selected for use in small specimen component testing.
Visconorust-2090-P and Sanchem NO-OX-ID-NG are currently used in PT tendons in the
construction of nuclear containment structures in the U.S. and abroad. Both Cirinject CP and
Nontribos VZ Inject have been used in post-tensioned tendons in Europe for more than 30 years.
Table 1 outlines the physical and chemical properties of each of the selected fillers as provided
by the manufacturer.
Properties that are important to the injection of these materials are drop melting point,
congealing point, density, and viscosity. ETA associates congealing point only with the wax and
not with grease. This property is particularly important since it signifies the temperature at
which the wax hardens, forming a plug and interrupting the injection. Density and viscosity of
these materials were used in selection of the pump and preparing the heat transfer model, while
copper corrosion test and salt spray test are important to corrosion protection.
BDV-31-977-15 Page 4
Table 1—Properties of different injection material for mockup test
Physical Properties Sanchem (NO-OX-ID-NG )
Sonneborn (Visconorust-2090-P)
Gähringer (Nontribos VZ Inject)
Civetea (Cirinject
CP) Density (g/cm3) — 750-870 — 880 Specific Gravity
@60° F 0.88-0.95 0.88-0.94 — —
Drop melting point °C
135-155 35-80 80 65/75
Congealing Point °F (°C)
— 135 (57) 68 —
Cone Penetration @ 77° F (1/10
mm)
160-250 170-200 85 65-115
Flash Point °F (°C) 420 (215) 420 (215) >536 (280) >392 (200) Viscosity @ 210°
F (mm2/sec) — 5-30 20-25 17-22
Solubility in water Insoluble Insoluble Insoluble Insoluble Salt spray test (168
hours @ 35° C No corrosion — — No
corrosion Copper corrosion — — No
corrosion No
corrosion Chemical Properties
NO-OX-ID-NG (Sanchem)
Visconorust-2090-P Nontribos VZ Inject
Cirinject CP
Water soluble chlorides
<5 ppm 2 ppm 40 ppm —
Water soluble Nitrates
— 4 ppm 10 ppm —
Water soluble Sulfides
<2 ppm 2 ppm 10 ppm —

BDV-31-977-15 Page 5
4 Test Set-up Design and Construction
This chapter summarizes the design and construction of the mockup post-tensioning
tendon specimens. Three 200-ft long specimens were fabricated with a profile that simulated
both internal and external tendons. In addition, the tendons were lightly stressed to ensure that
the strand bundle was oriented in the duct in a similar manner to a fully stressed tendon in the
field. Duct, strand, filler material, and anchorage details are also discussed. Finally, design and
detailing of the mockup support frame is summarized.
4.1 Tendon Design Figure 1 illustrates the profile of the mockup tendon, which was designed to simulate the
geometry of a post-tensioned tendon in a bridge. The overall length of the tendon was 200 ft with
the profile symmetrical about the mid-length of the tendon. Two profiles were incorporated into
the tendon: The external tendon profile included a draped tendon at ends (~30 ft) and straight
tendon (~40 ft) in the middle. The parabolic profile (~60 ft) at mid-length mimicked the internal
tendon profile in a girder bridge with drop-in spans. Deviators were placed at four locations to
hold the tendon geometry. HDPE duct of 4 in. diameter with 19-0.6 in. prestressing strands
formed the tendon. Anchors from FDOT approved post-tensioning equipment suppliers were
used at each end of the tendon.
The tendon was designed to follow the profile shown in Figure 1 by inducing sufficient
prestressing force on the anchors. The weight of each “gravity” deviator was 0.6 kips, while the
collective weight of the tendon (including weight of strands, duct and pliable filler) was
approximately 19 plf. This approach was intended to draw the strand bundle toward the top of
the duct in the external profile and the bottom of the duct in the internal profile.
BDV-31-977-15 Page 6
Figure 1—Tendon profile for the mockup testing on unbonded tendons
4.2 Tendon Details
4.2.1 Anchorage Three mockup tests were conducted with three anchorages from the Florida Department
of Transportation’s list of approved devices:
1. Freyssinet USA, model no. 19C15
2. V Structural LLC (VSL), model no. ECI 6-19
3. DYWIDAG System International (DSI), model no. 68 19 248
Each anchorage was modified by welding an outer steel pipe to its anchor casting, which
was subsequently filled with grout to provide confinement to the inner steel pipe/plastic trumpet
seam of the anchors. The length of this outer steel pipe was such that it covered the trumpet and a
part of the inner steel pipe, which coupled the trumpet to the HDPE duct. Anchor blocks were
then cast around the anchorages. The inner steel pipe was connected to HDPE duct using a
ductile iron pipe coupling. See Appendix A for fabrication and construction details.
BDV-31-977-15 Page 7
Figure 2—Anchor block placed on the frame
4.2.2 Duct The minimum internal area of duct required by FDOT specifications is 2.5 times the
cross-sectional area of the prestressing steel (960-2.2.1.4 (c)). This also meets PTI Specification
(2006) requirements for either pulling or pushing strand into the duct. For the mockup specimen,
19 0.6-in. diameter strands is 4.12 in2 which requires a minimum theoretical duct diameter of
3.62 in. The smallest available diameter of HDPE pipe that provides sufficient cross-sectional
area was 4 in. (specified outer diameter of 4.5 in.), which was chosen for use in the mockup. The
wall thickness for DR17 pipe is 0.264 in., which meets the minimum wall thickness of 0.12 in.
specified in the FDOT standard.
Because flexible fillers are not currently used in the U.S., specifications for selection of
HDPE to accommodate higher temperatures were not available. According to EN standards,
however, the wall thickness of the duct is governed by the material rating (PE), Dimensional
ratio (SDR), nominal class of the duct (PN) and the size of the duct (Table 2). EN does not
specify the maximum SDR value, but rather specifies minimum nominal class of the duct for
injection of filler with temperatures above 60° C. Available HDPE specifications are compared
in Table 3.
BDV-31-977-15 Page 8
Table 2—ETA table for HDPE smooth pipe selection (ETA 06/226 2012)
Table 3—Size of HDPE duct based on various specifications
Specification Internal Diameter (in.) Thickness (in.) Outer Diameter (in.)
FDOT 3.62 0.24 3.86 PTI 3.62 0.24 3.86 EN 3.97 0.265 4.5
HDPE duct material is characterized in ASTM 3350 by cell classification (Table 4). The
cell classification has six numbers followed by a letter; the number signifies the value of the
particular property (density, melt index, flexural modulus, tensile strength, crack growth and
hydrostatic strength) from 1 to 6 while the letter signifies color and UV stabilization of the
material. FDOT, in their specifications for external tendon, specifies maximum cell
classification of 344464C (FDOT 2013). ASTM 3350, however, has recently been updated and
the new cell classification has been introduced based on the new HDPE material. This material
has a cell classification of 445574C. HDPE manufacturers no longer use the old HDPE material
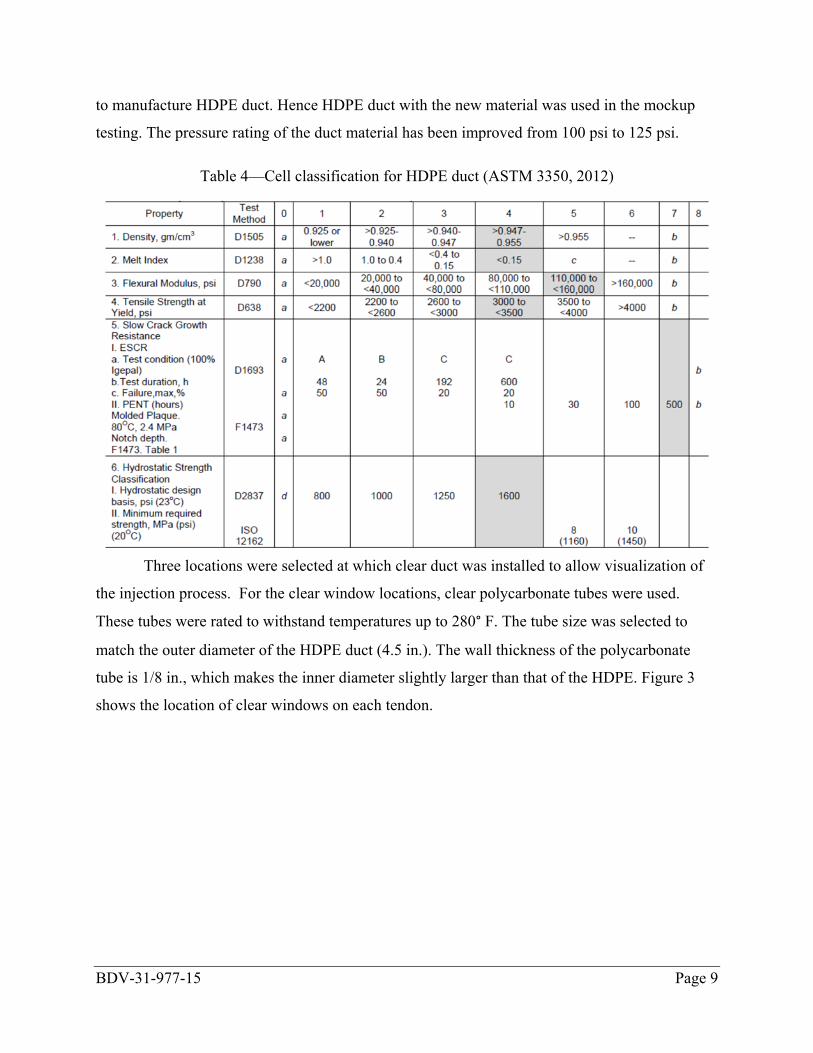
BDV-31-977-15 Page 9
to manufacture HDPE duct. Hence HDPE duct with the new material was used in the mockup
testing. The pressure rating of the duct material has been improved from 100 psi to 125 psi.
Table 4—Cell classification for HDPE duct (ASTM 3350, 2012)
Three locations were selected at which clear duct was installed to allow visualization of
the injection process. For the clear window locations, clear polycarbonate tubes were used.
These tubes were rated to withstand temperatures up to 280° F. The tube size was selected to
match the outer diameter of the HDPE duct (4.5 in.). The wall thickness of the polycarbonate
tube is 1/8 in., which makes the inner diameter slightly larger than that of the HDPE. Figure 3
shows the location of clear windows on each tendon.
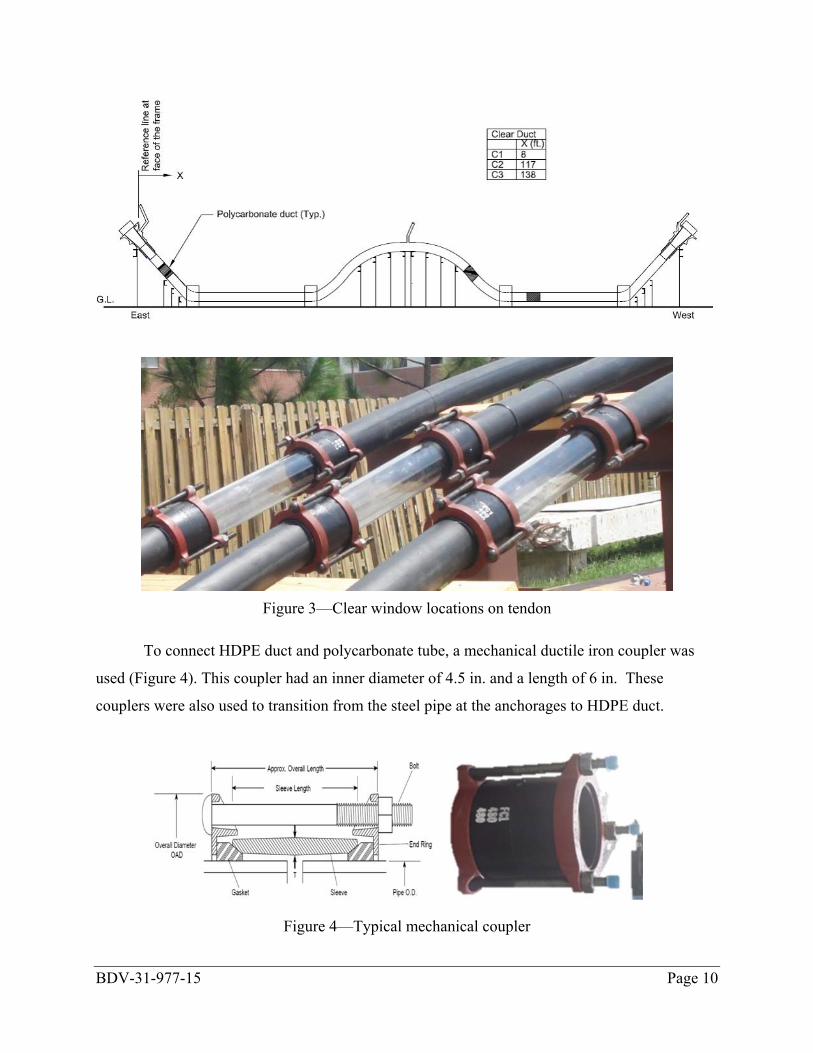
BDV-31-977-15 Page 10
Figure 3—Clear window locations on tendon
To connect HDPE duct and polycarbonate tube, a mechanical ductile iron coupler was
used (Figure 4). This coupler had an inner diameter of 4.5 in. and a length of 6 in. These
couplers were also used to transition from the steel pipe at the anchorages to HDPE duct.
Figure 4—Typical mechanical coupler
BDV-31-977-15 Page 11
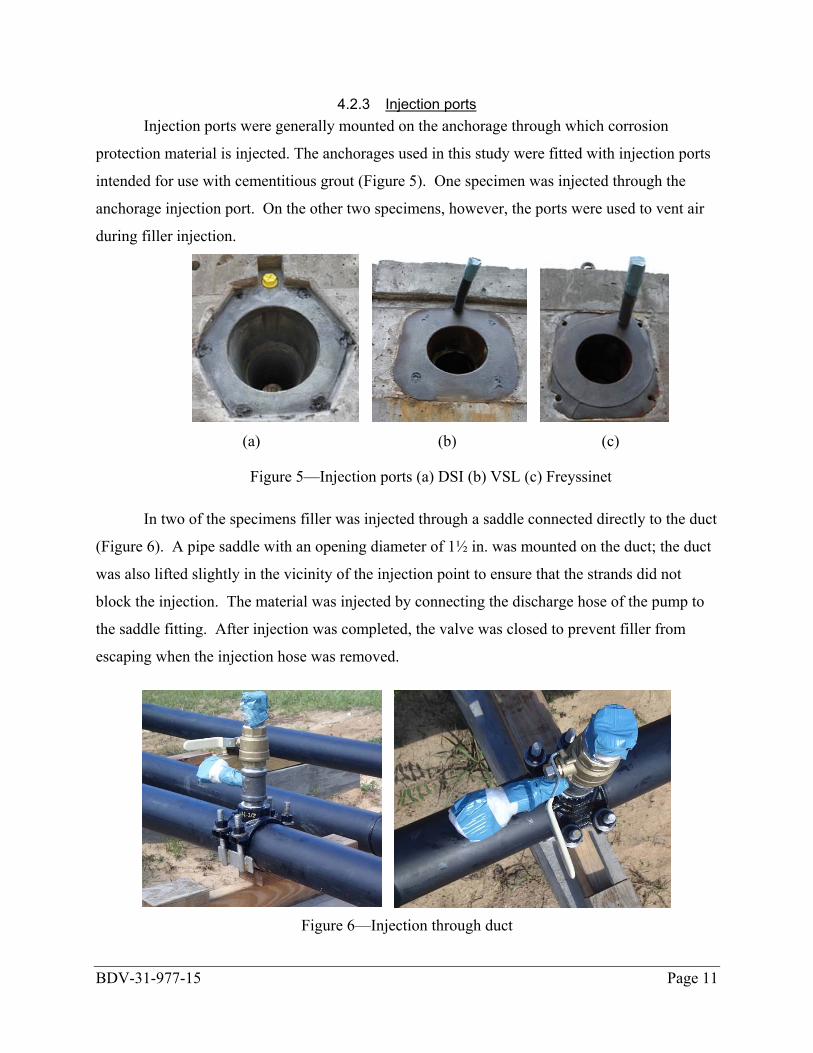
4.2.3 Injection ports Injection ports were generally mounted on the anchorage through which corrosion
protection material is injected. The anchorages used in this study were fitted with injection ports
intended for use with cementitious grout (Figure 5). One specimen was injected through the
anchorage injection port. On the other two specimens, however, the ports were used to vent air
during filler injection.
(a) (b) (c)
Figure 5—Injection ports (a) DSI (b) VSL (c) Freyssinet
In two of the specimens filler was injected through a saddle connected directly to the duct
(Figure 6). A pipe saddle with an opening diameter of 1½ in. was mounted on the duct; the duct
was also lifted slightly in the vicinity of the injection point to ensure that the strands did not
block the injection. The material was injected by connecting the discharge hose of the pump to
the saddle fitting. After injection was completed, the valve was closed to prevent filler from
escaping when the injection hose was removed.
Figure 6—Injection through duct
BDV-31-977-15 Page 12
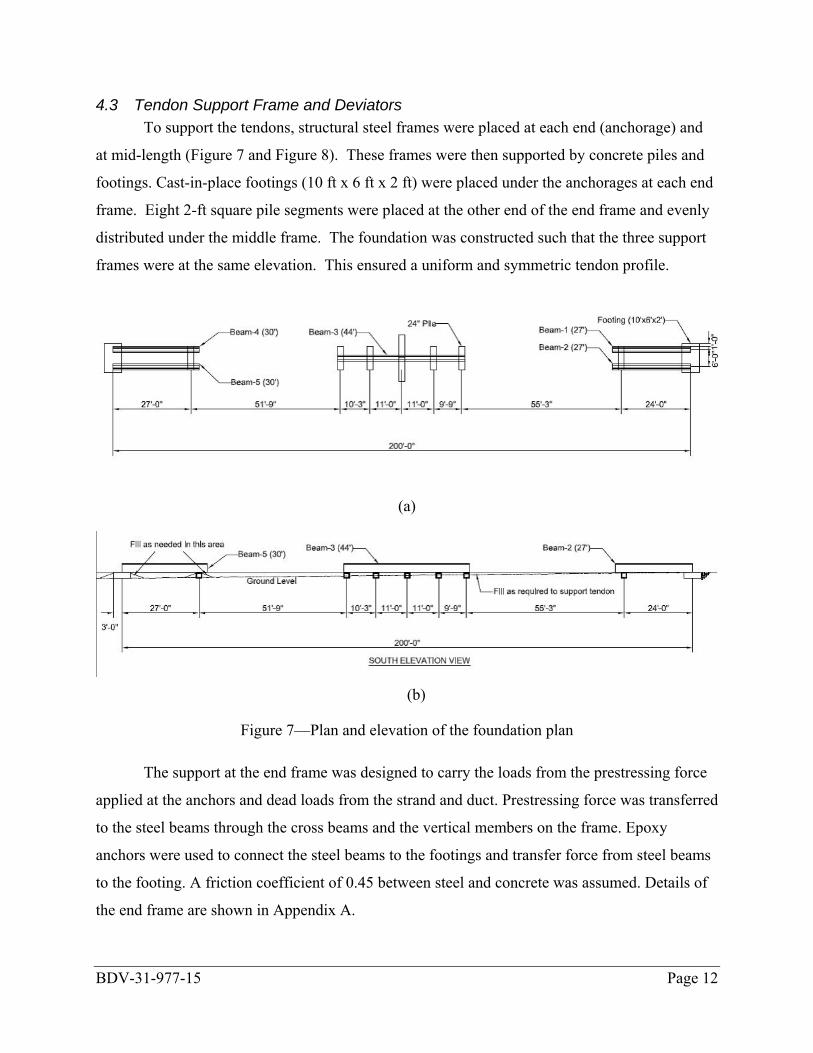
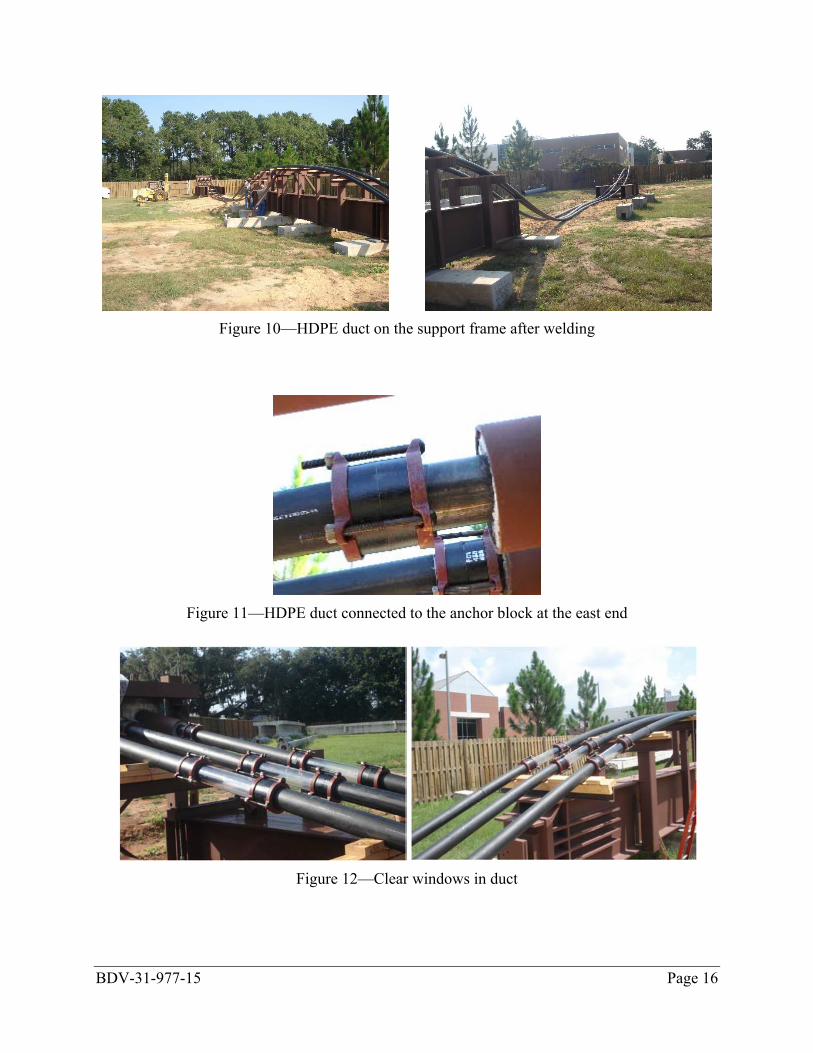
4.3 Tendon Support Frame and Deviators To support the tendons, structural steel frames were placed at each end (anchorage) and
at mid-length (Figure 7 and Figure 8). These frames were then supported by concrete piles and
footings. Cast-in-place footings (10 ft x 6 ft x 2 ft) were placed under the anchorages at each end
frame. Eight 2-ft square pile segments were placed at the other end of the end frame and evenly
distributed under the middle frame. The foundation was constructed such that the three support
frames were at the same elevation. This ensured a uniform and symmetric tendon profile.
(a)
(b)
Figure 7—Plan and elevation of the foundation plan
The support at the end frame was designed to carry the loads from the prestressing force
applied at the anchors and dead loads from the strand and duct. Prestressing force was transferred
to the steel beams through the cross beams and the vertical members on the frame. Epoxy
anchors were used to connect the steel beams to the footings and transfer force from steel beams
to the footing. A friction coefficient of 0.45 between steel and concrete was assumed. Details of
the end frame are shown in Appendix A.
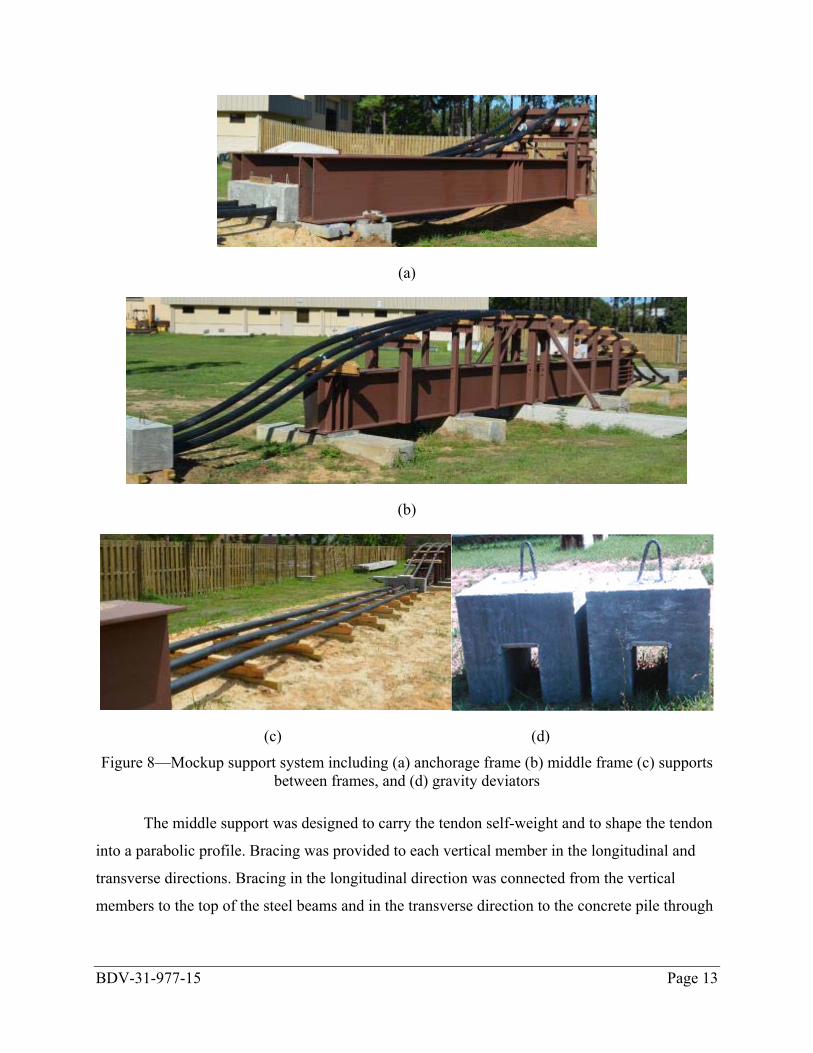
BDV-31-977-15 Page 13
(a)
(b)
(c) (d) Figure 8—Mockup support system including (a) anchorage frame (b) middle frame (c) supports
between frames, and (d) gravity deviators
The middle support was designed to carry the tendon self-weight and to shape the tendon
into a parabolic profile. Bracing was provided to each vertical member in the longitudinal and
transverse directions. Bracing in the longitudinal direction was connected from the vertical
members to the top of the steel beams and in the transverse direction to the concrete pile through
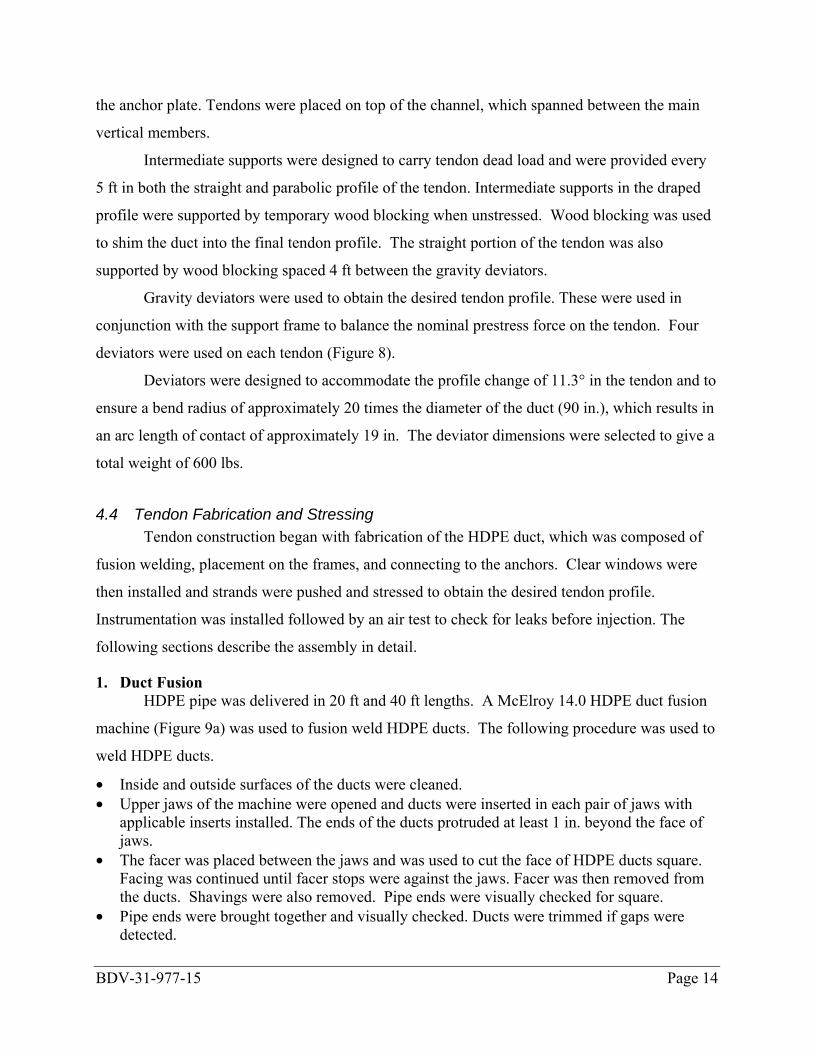
BDV-31-977-15 Page 14
the anchor plate. Tendons were placed on top of the channel, which spanned between the main
vertical members.
Intermediate supports were designed to carry tendon dead load and were provided every
5 ft in both the straight and parabolic profile of the tendon. Intermediate supports in the draped
profile were supported by temporary wood blocking when unstressed. Wood blocking was used
to shim the duct into the final tendon profile. The straight portion of the tendon was also
supported by wood blocking spaced 4 ft between the gravity deviators.
Gravity deviators were used to obtain the desired tendon profile. These were used in
conjunction with the support frame to balance the nominal prestress force on the tendon. Four
deviators were used on each tendon (Figure 8).
Deviators were designed to accommodate the profile change of 11.3° in the tendon and to
ensure a bend radius of approximately 20 times the diameter of the duct (90 in.), which results in
an arc length of contact of approximately 19 in. The deviator dimensions were selected to give a
total weight of 600 lbs.
4.4 Tendon Fabrication and Stressing Tendon construction began with fabrication of the HDPE duct, which was composed of
fusion welding, placement on the frames, and connecting to the anchors. Clear windows were
then installed and strands were pushed and stressed to obtain the desired tendon profile.
Instrumentation was installed followed by an air test to check for leaks before injection. The
following sections describe the assembly in detail.
1. Duct Fusion HDPE pipe was delivered in 20 ft and 40 ft lengths. A McElroy 14.0 HDPE duct fusion
machine (Figure 9a) was used to fusion weld HDPE ducts. The following procedure was used to
weld HDPE ducts.
• Inside and outside surfaces of the ducts were cleaned. • Upper jaws of the machine were opened and ducts were inserted in each pair of jaws with
applicable inserts installed. The ends of the ducts protruded at least 1 in. beyond the face of jaws.
• The facer was placed between the jaws and was used to cut the face of HDPE ducts square. Facing was continued until facer stops were against the jaws. Facer was then removed from the ducts. Shavings were also removed. Pipe ends were visually checked for square.
• Pipe ends were brought together and visually checked. Ducts were trimmed if gaps were detected.
BDV-31-977-15 Page 15
• Heaters, which were kept in the heating machines, were periodically checked for the optimum temperature for butt weld fusion (425° F).
• Heaters were placed in position between the pipe ends, the pipe or fitting ends were brought into full contact with the heater to ensure proper seating. The locking cam was raised into the engaged position during the heating cycle. Proper contact was maintained without force, while a bead of molten polyethylene developed between the heater and the pipe or fitting ends. Heating was continued until the minimum melt bead size (3/16 in. for 4 in. duct) had developed.
• The ends of the ducts were pushed together join the beads. The force was maintained for about 3 min. and then removed. The optimal interfacial pressure to join beads is 75 psi. The required torque reading corresponding to this pressure for 4 in. duct size was 25 ft-lb.
• The cam was unlocked and unscrewed to open the clamps. Pipe was pulled through machine, and prepared for fusing the next joint. Joint was inspected and checked for any high/low or misalignment. The process was repeated if the joint was not properly fused.
(a) (b) Figure 9—(a) McElroy HDPE fusion machine (b) Duct fusion in progress
2. Duct placement The total length of welded duct was approximately 230 ft. Ducts was placed on the
support frame using a fork lift (Figure 10).
3. Deviator block installation Each deviator block was placed at the specified locations. Each tendon had 4 deviator
blocks; a total of 12 blocks were installed.
4. Duct connection to anchors at east end The east end of the HDPE duct was connected to the anchorage pipe using the coupler
(Figure 11).
5. Duct window installation Clear window locations were marked and HDPE duct was cut and removed at these
locations (Figure 12). Clear windows were precut in 2-ft lengths and installed with couplers.
BDV-31-977-15 Page 16
Figure 10—HDPE duct on the support frame after welding
Figure 11—HDPE duct connected to the anchor block at the east end
Figure 12—Clear windows in duct
BDV-31-977-15 Page 17
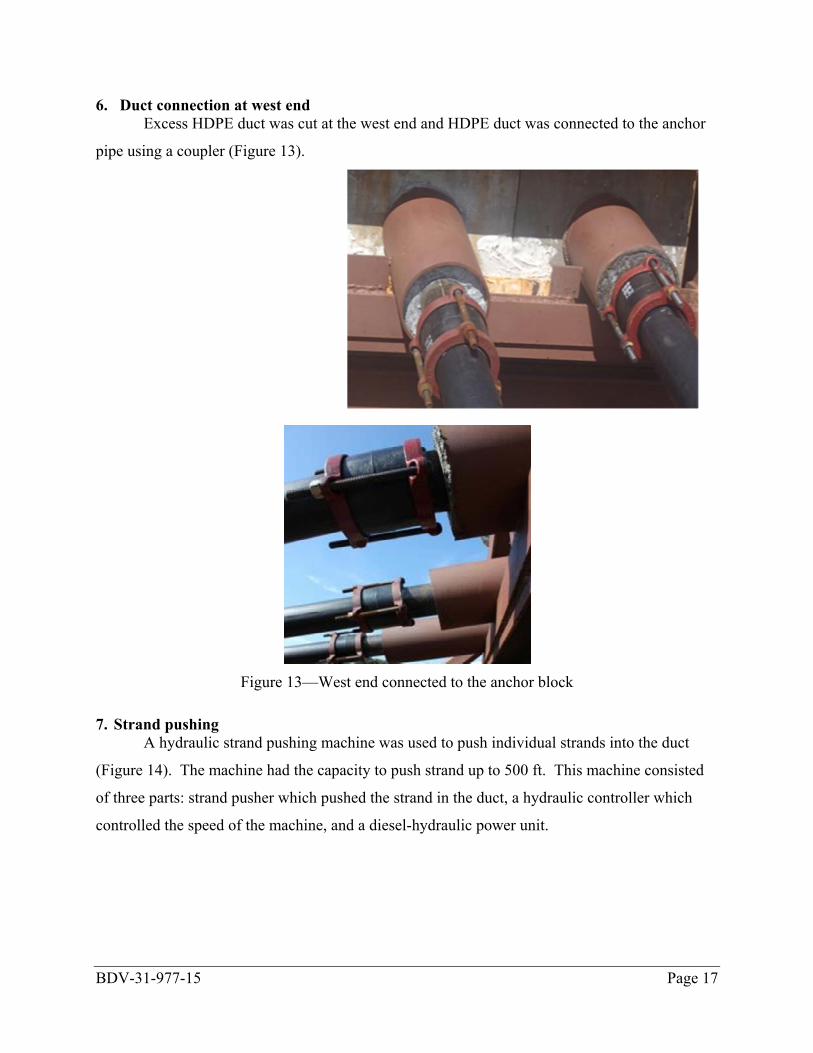
6. Duct connection at west end Excess HDPE duct was cut at the west end and HDPE duct was connected to the anchor
pipe using a coupler (Figure 13).
Figure 13—West end connected to the anchor block
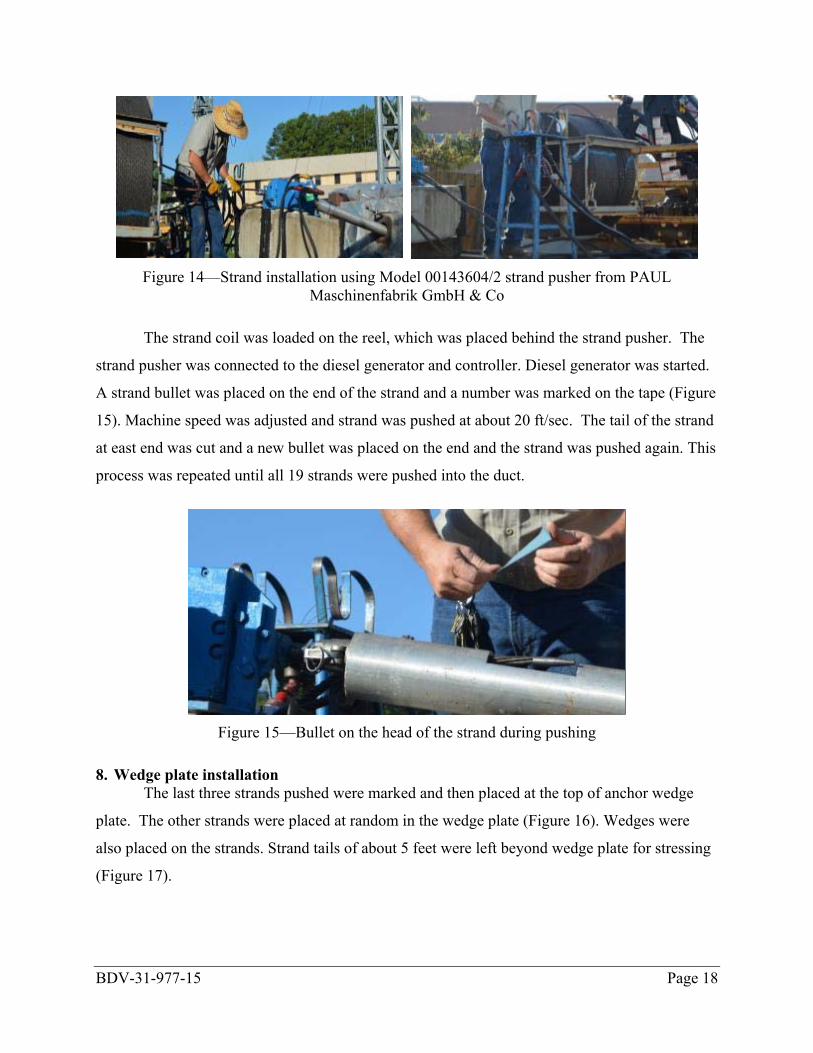
7. Strand pushing A hydraulic strand pushing machine was used to push individual strands into the duct
(Figure 14). The machine had the capacity to push strand up to 500 ft. This machine consisted
of three parts: strand pusher which pushed the strand in the duct, a hydraulic controller which
controlled the speed of the machine, and a diesel-hydraulic power unit.
BDV-31-977-15 Page 18
Figure 14—Strand installation using Model 00143604/2 strand pusher from PAUL
Maschinenfabrik GmbH & Co
The strand coil was loaded on the reel, which was placed behind the strand pusher. The
strand pusher was connected to the diesel generator and controller. Diesel generator was started.
A strand bullet was placed on the end of the strand and a number was marked on the tape (Figure
15). Machine speed was adjusted and strand was pushed at about 20 ft/sec. The tail of the strand
at east end was cut and a new bullet was placed on the end and the strand was pushed again. This
process was repeated until all 19 strands were pushed into the duct.
Figure 15—Bullet on the head of the strand during pushing
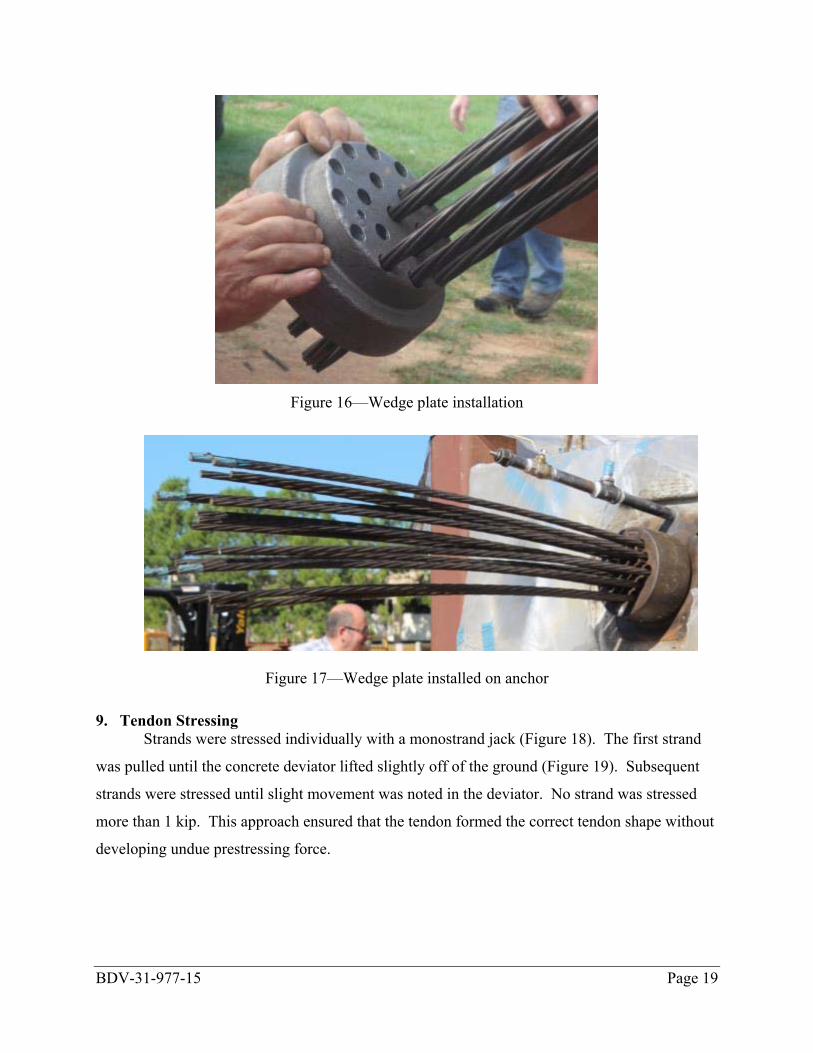
8. Wedge plate installation The last three strands pushed were marked and then placed at the top of anchor wedge
plate. The other strands were placed at random in the wedge plate (Figure 16). Wedges were
also placed on the strands. Strand tails of about 5 feet were left beyond wedge plate for stressing
(Figure 17).
BDV-31-977-15 Page 19
Figure 16—Wedge plate installation
Figure 17—Wedge plate installed on anchor
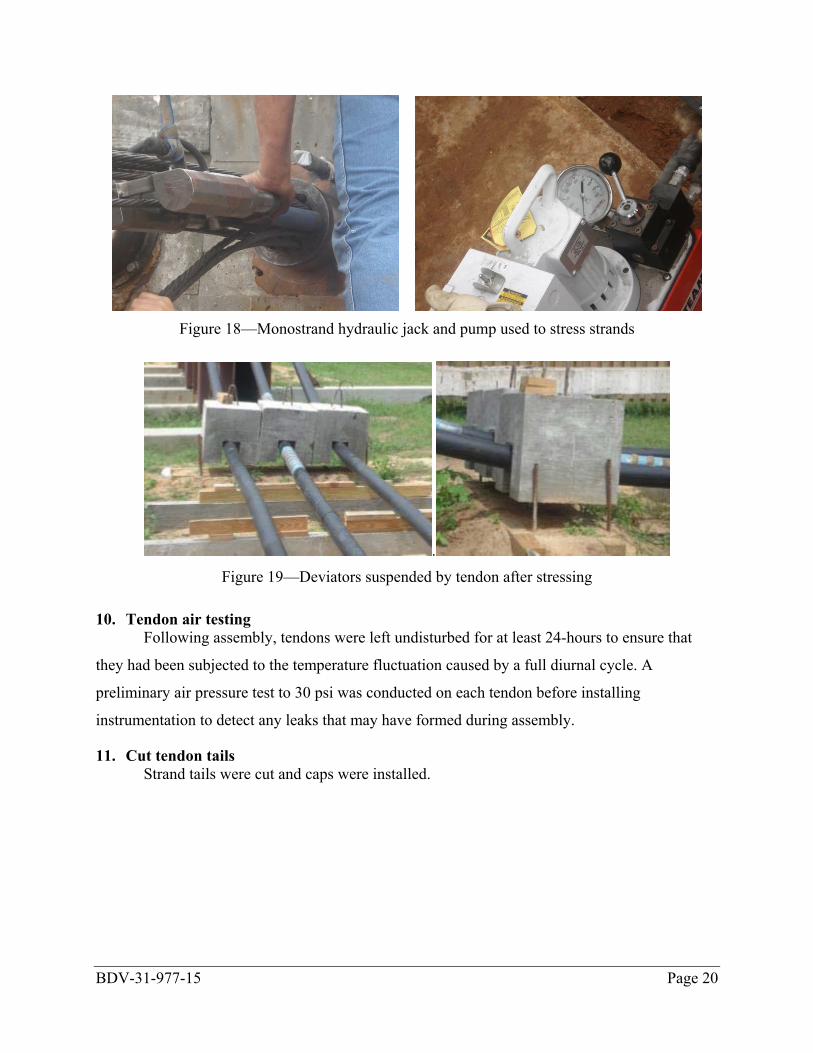
9. Tendon Stressing Strands were stressed individually with a monostrand jack (Figure 18). The first strand
was pulled until the concrete deviator lifted slightly off of the ground (Figure 19). Subsequent
strands were stressed until slight movement was noted in the deviator. No strand was stressed
more than 1 kip. This approach ensured that the tendon formed the correct tendon shape without
developing undue prestressing force.
BDV-31-977-15 Page 20
Figure 18—Monostrand hydraulic jack and pump used to stress strands
. Figure 19—Deviators suspended by tendon after stressing
10. Tendon air testing Following assembly, tendons were left undisturbed for at least 24-hours to ensure that
they had been subjected to the temperature fluctuation caused by a full diurnal cycle. A
preliminary air pressure test to 30 psi was conducted on each tendon before installing
instrumentation to detect any leaks that may have formed during assembly.
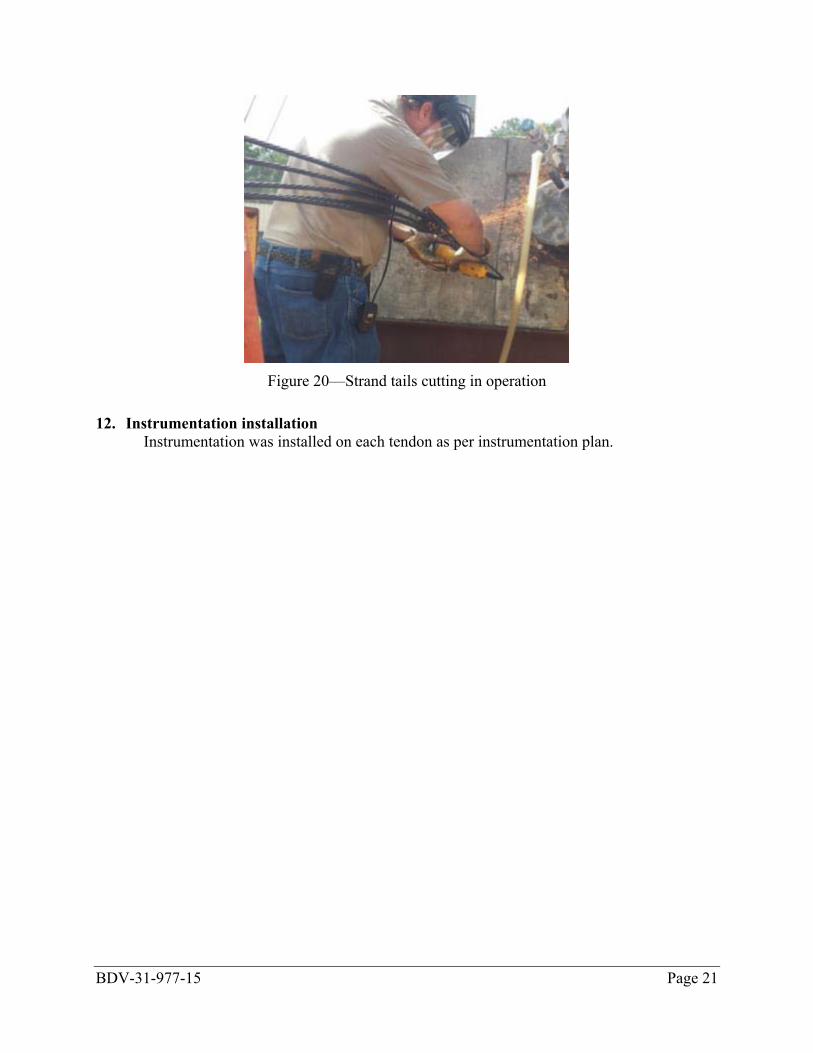
11. Cut tendon tails Strand tails were cut and caps were installed.
BDV-31-977-15 Page 21
Figure 20—Strand tails cutting in operation
12. Instrumentation installation Instrumentation was installed on each tendon as per instrumentation plan.
BDV-31-977-15 Page 22
13. Pre injection test Each tendon was air tested by pressurizing to 50 psi and then checked for potential leaks.
Generally, the pressure decrease was approximately 1 to 2 psi per minute.
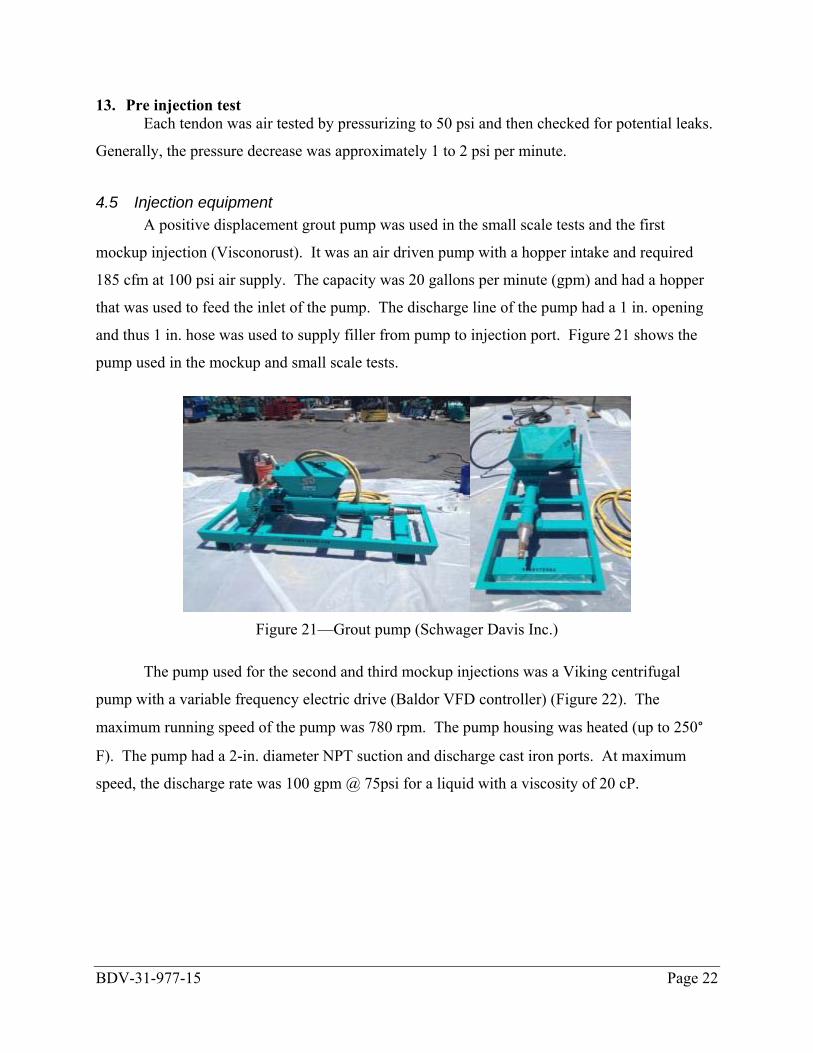
4.5 Injection equipment A positive displacement grout pump was used in the small scale tests and the first
mockup injection (Visconorust). It was an air driven pump with a hopper intake and required
185 cfm at 100 psi air supply. The capacity was 20 gallons per minute (gpm) and had a hopper
that was used to feed the inlet of the pump. The discharge line of the pump had a 1 in. opening
and thus 1 in. hose was used to supply filler from pump to injection port. Figure 21 shows the
pump used in the mockup and small scale tests.
Figure 21—Grout pump (Schwager Davis Inc.)
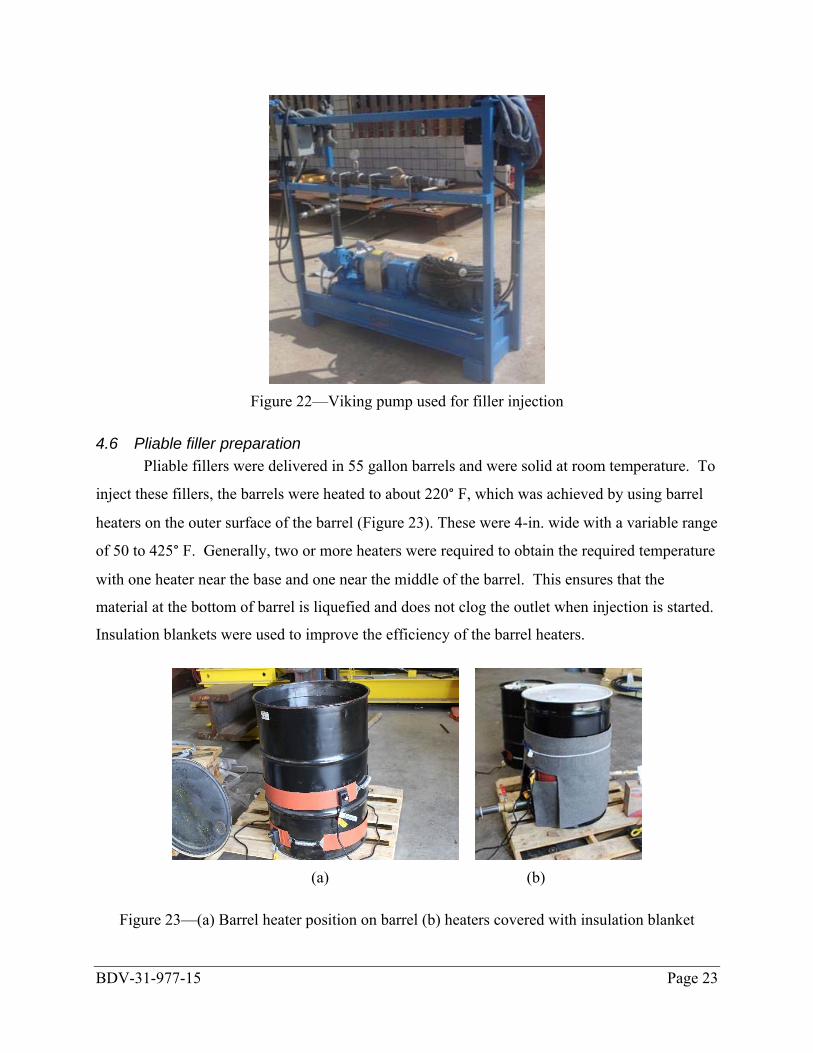
The pump used for the second and third mockup injections was a Viking centrifugal
pump with a variable frequency electric drive (Baldor VFD controller) (Figure 22). The
maximum running speed of the pump was 780 rpm. The pump housing was heated (up to 250°
F). The pump had a 2-in. diameter NPT suction and discharge cast iron ports. At maximum
speed, the discharge rate was 100 gpm @ 75psi for a liquid with a viscosity of 20 cP.
BDV-31-977-15 Page 23
Figure 22—Viking pump used for filler injection
4.6 Pliable filler preparation Pliable fillers were delivered in 55 gallon barrels and were solid at room temperature. To
inject these fillers, the barrels were heated to about 220° F, which was achieved by using barrel
heaters on the outer surface of the barrel (Figure 23). These were 4-in. wide with a variable range
of 50 to 425° F. Generally, two or more heaters were required to obtain the required temperature
with one heater near the base and one near the middle of the barrel. This ensures that the
material at the bottom of barrel is liquefied and does not clog the outlet when injection is started.
Insulation blankets were used to improve the efficiency of the barrel heaters.
(a) (b)
Figure 23—(a) Barrel heater position on barrel (b) heaters covered with insulation blanket
BDV-31-977-15 Page 24
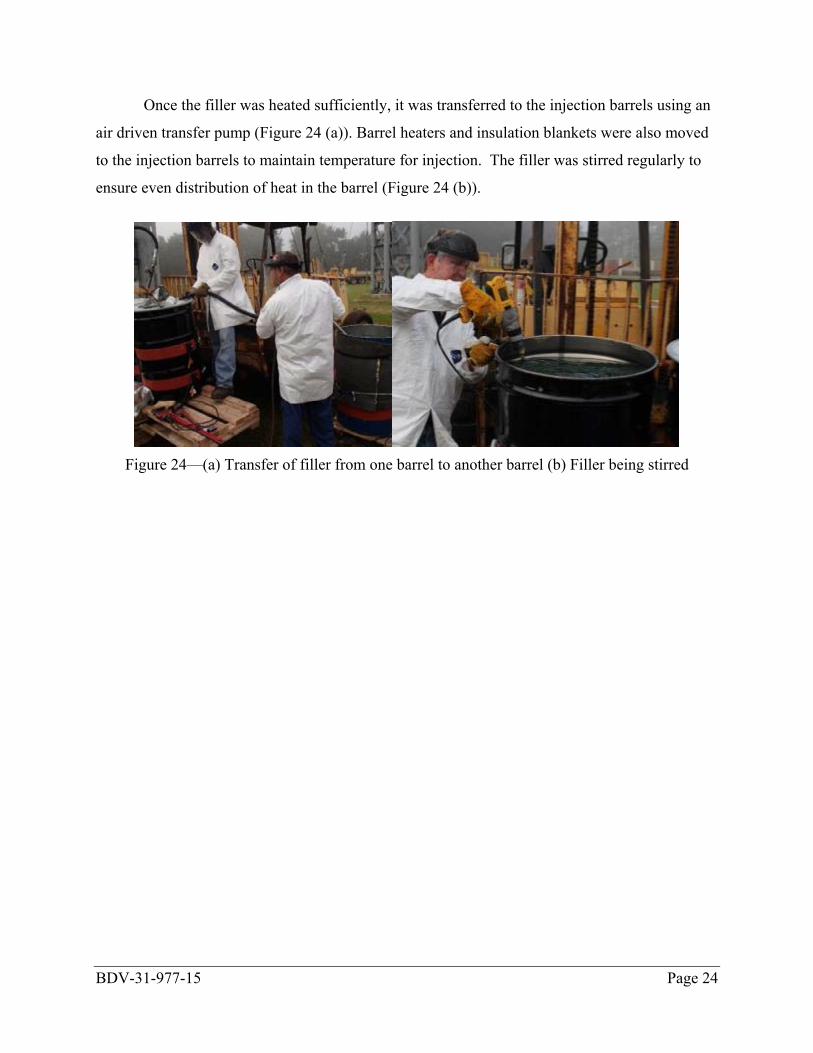
Once the filler was heated sufficiently, it was transferred to the injection barrels using an
air driven transfer pump (Figure 24 (a)). Barrel heaters and insulation blankets were also moved
to the injection barrels to maintain temperature for injection. The filler was stirred regularly to
ensure even distribution of heat in the barrel (Figure 24 (b)).
Figure 24—(a) Transfer of filler from one barrel to another barrel (b) Filler being stirred
BDV-31-977-15 Page 25
5 Instrumentation and Data Acquisition
Mockup instrumentation was used to measure filler pressure and temperature inside the
duct; additional thermocouples measured surface temperature of the duct along the length of the
tendon. In addition, rate of injection of pliable fillers was monitored to confirm the volume input
and compare it with the theoretical volume of the duct. The following section details the
instrumentation plan and type of instruments used in the full scale mockup on pliable fillers.
5.1 Instrumentation plan
Figure 25 shows the locations of pressure transducers and thermocouples along the length of the tendon; also shown is the thermocouple orientation within the cross section.
Figure 26 shows installed instrumentation. Seven pressure transducers and seven internal
thermocouples were installed on each specimen. Additionally, seven surface mounted
thermocouples were installed adjacent to the thermocouples. Thermocouples were used to
measure the temperature of the filler inside the duct while surface mount thermocouples were
used to measure the outside temperature of the duct.
Thermocouples and pressure transducers were oriented to avoid contact with the strand
bundle to minimize the effect of the strands on their measurements (Figure 25). Instruments in
the draped profile (P1, T1, ST1, P7, T7 and ST7) were installed at the bottom, in the straight
profile (P2, P5, P6, T2, T5, T6, ST2, ST5 and ST6) were installed on the side (90 degrees) and in
the parabolic profile (P3, P4, T3, T4, ST3 and ST4) were installed at the top. The orientation of
the thermocouples (T2 and T5) and surface mount thermocouples (ST2 and ST5) were adjusted
to the top for the VZ inject and Cirinject CP injection.
Pipe saddles were used to mount pressure transducers and thermocouples on the duct
(Figure 27). The following section describes the type of instrumentation used in the mockup
tests.
BDV-31-977-15 Page 26
Figure 25—Instrumentation plan for full scale mockup
Figure 26—Instrumentation orientation on the tendon
Figure 27—Typical pipe saddle (Ford Meter Box)
BDV-31-977-15 Page 27
5.1.1 Pressure Transducers Pressure transducers were used to measure the pressure inside the duct during and after
injection of pliable fillers. Pressure transducers were selected based on an anticipated injection
pressure of 75 psi and a maximum temperature of 220° F (105° C). Omega PX209-015G5V
pressure transducers were used, which had operating temperature from -65°F (-54°C) to 250°F
(121° C) and operating pressure up to 300 psi. The transducer’s response time of 2 ms allowed
quick measurement of the pressure. Transducers were installed on the duct using a pipe saddle
(Figure 27) with ¾ in. NPT opening. A ¾ in. male to ¼ in. female adapter was used to connect
transducer and saddle. Figure 28 shows a typical pressure transducer.
Figure 28—Typical transducer installed on the tendon (Make: Omega)
5.1.2 Thermocouples Temperature was measured along the length of the tendon. Thermocouples were used
internally to measure filler temperature while surface mounted thermocouples were used to
measure the surface temperature of the duct; both types were monitored during and after
injection. Type K thermocouples were selected based on the anticipated injection temperature of
220° F (105° C). Omega thermocouple part no. TJ36-CASS-116G-6-SMPW-M was chosen to
measure the filler temperature. A compression fitting was needed to obtain a pressure-tight seal
around the probe.
BDV-31-977-15 Page 28
Fluke 80-pk-11 flexible cuff type K thermo probes were used to measure the duct surface
temperature. Thermocouples and surface probes were connected to the data acquisition station
with type K thermocouple wires. Thermocouples and surface probes were set for a temperature
range of 0° to 320° F while the ambient temperature range was set to 0° to 150° F for full scale
mockup.
(a) (b)
(c) (d)
Figure 29—Thermocouple probe to measure filler temperature (a) with both thermocouple and surface probe installed on the duct (b) top internal orientation (c) bottom orientation and (d) side
orientation
BDV-31-977-15 Page 29
5.1.3 Volume Calculation Volume of injected material for each test was determined by measuring the depth of
pliable filler in the barrels before and after the test. Pliable filler depths collected in the buckets
through vent during the mockup were also measured. The volume of pliable filler collected in
buckets was then deducted from the volume of pliable filler in the barrels to give the net volume
of filler in the mockup. This volume was then compared to the theoretically computed pliable
filler volume and percent gain/loss was calculated.
5.1.4 Gravity Deviator Displacement Gravity deviators displaced upwards when the tendon was stressed. To ensure that the
tendon did not elongate or shorten excessively due to diurnal temperature variations, the vertical
position of the deviators was monitored over a period of 24 hours. No significant movement was
noted in any of the deviators during this period.
5.2 Data Acquisition The data acquisition system (DAQ) was centrally located along the length of the mockup
to ensure the best access and visibility during injection. Data were recorded at a frequency of 10
Hz during injection. After injection, data were recorded for 24 hours at 15 minute intervals.
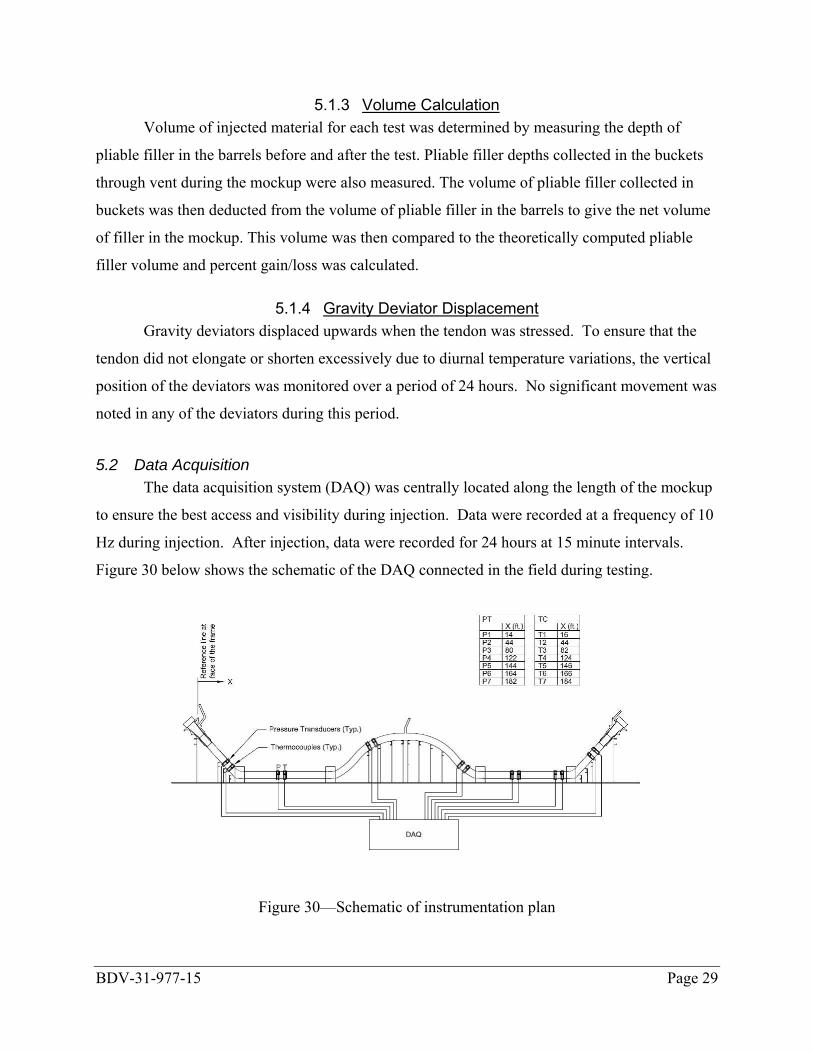
Figure 30 below shows the schematic of the DAQ connected in the field during testing.
Figure 30—Schematic of instrumentation plan
BDV-31-977-15 Page 30
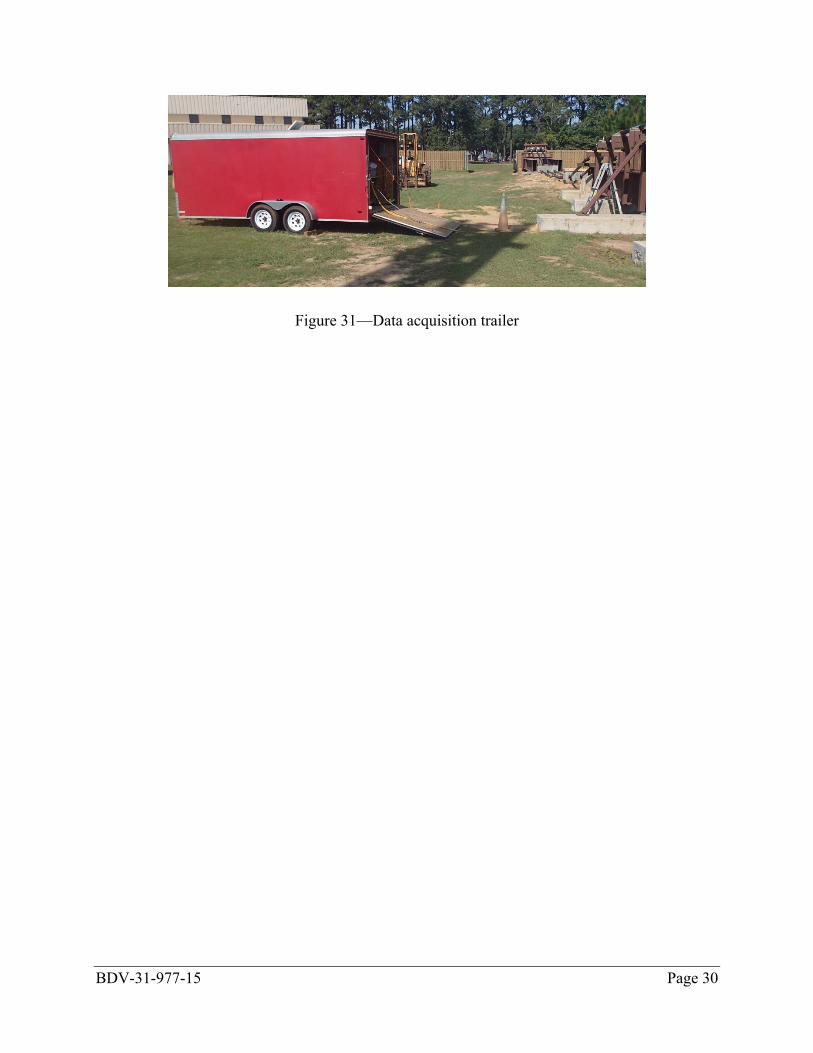
Figure 31—Data acquisition trailer
BDV-31-977-15 Page 31
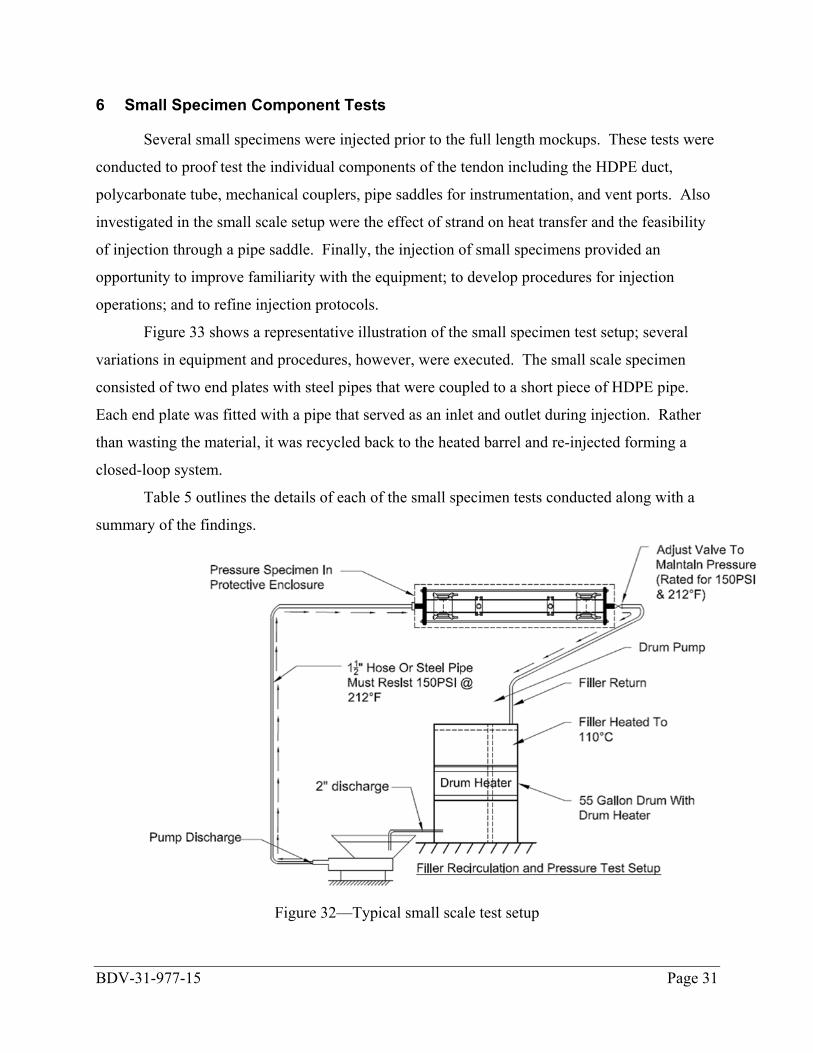
6 Small Specimen Component Tests
Several small specimens were injected prior to the full length mockups. These tests were
conducted to proof test the individual components of the tendon including the HDPE duct,
polycarbonate tube, mechanical couplers, pipe saddles for instrumentation, and vent ports. Also
investigated in the small scale setup were the effect of strand on heat transfer and the feasibility
of injection through a pipe saddle. Finally, the injection of small specimens provided an
opportunity to improve familiarity with the equipment; to develop procedures for injection
operations; and to refine injection protocols.
Figure 33 shows a representative illustration of the small specimen test setup; several
variations in equipment and procedures, however, were executed. The small scale specimen
consisted of two end plates with steel pipes that were coupled to a short piece of HDPE pipe.
Each end plate was fitted with a pipe that served as an inlet and outlet during injection. Rather
than wasting the material, it was recycled back to the heated barrel and re-injected forming a
closed-loop system.
Table 5 outlines the details of each of the small specimen tests conducted along with a
summary of the findings.
Figure 32—Typical small scale test setup
BDV-31-977-15 Page 32
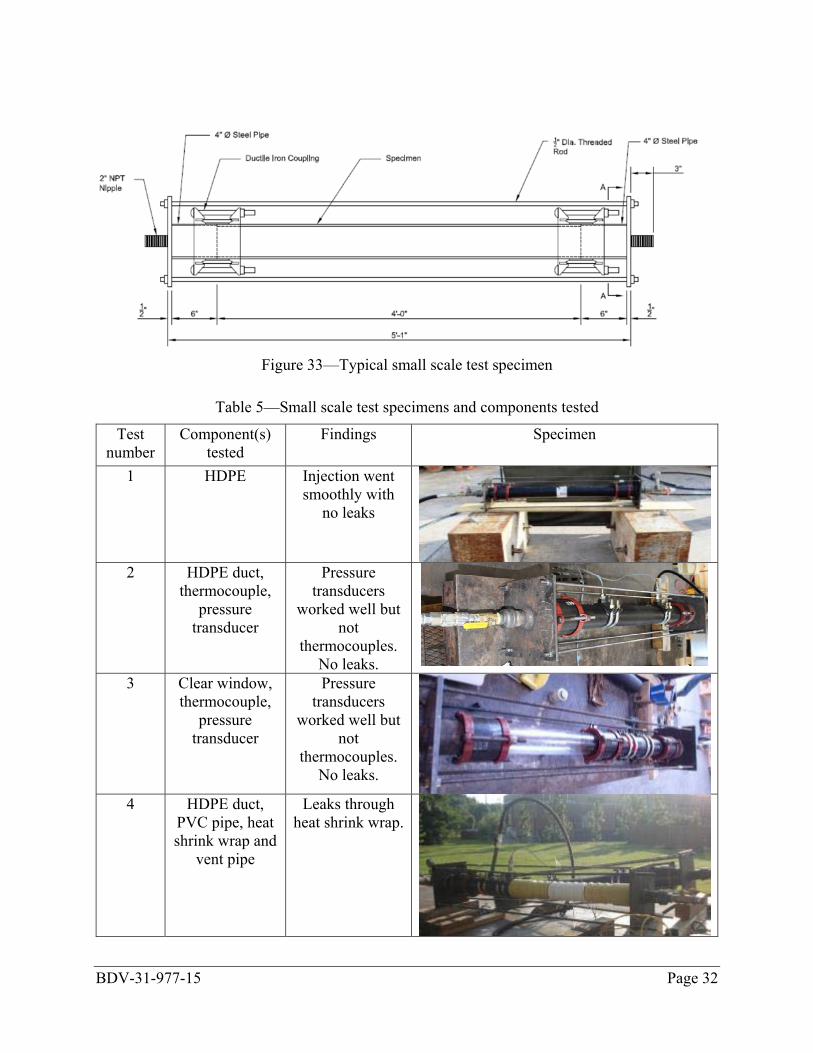
Figure 33—Typical small scale test specimen
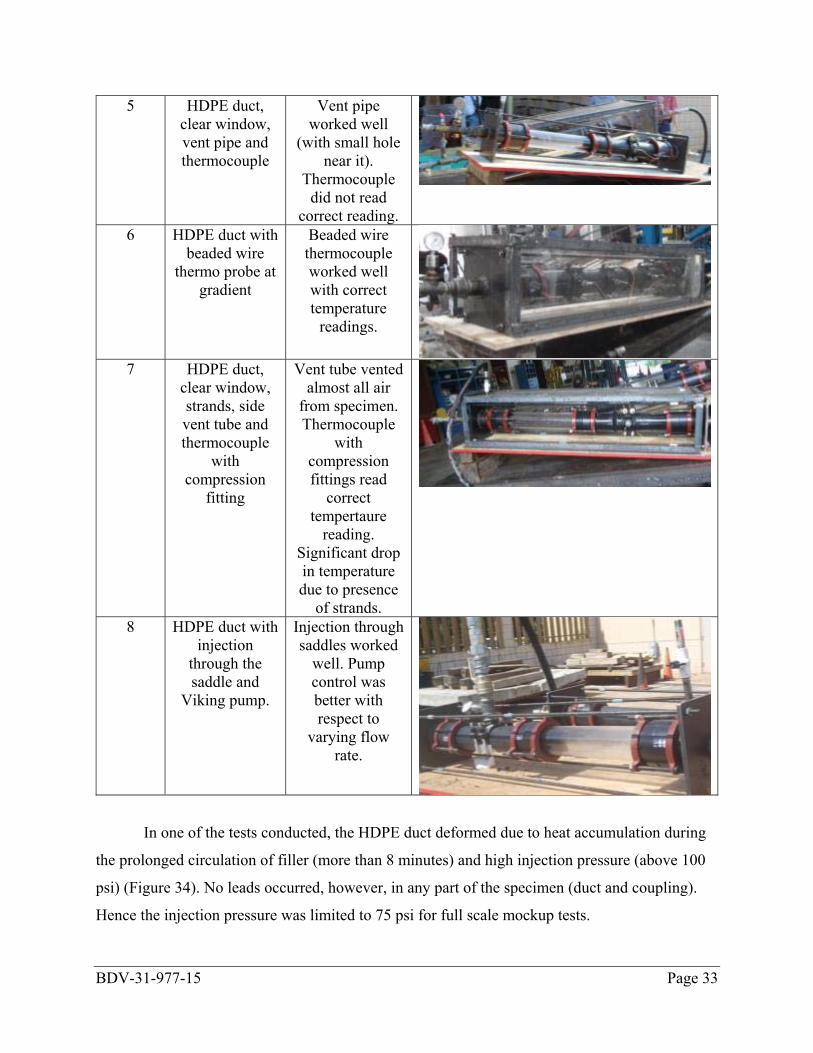
Table 5—Small scale test specimens and components tested
Test number
Component(s) tested
Findings Specimen
1 HDPE Injection went smoothly with
no leaks
2 HDPE duct, thermocouple,
pressure transducer
Pressure transducers
worked well but not
thermocouples. No leaks.
3 Clear window, thermocouple,
pressure transducer
Pressure transducers
worked well but not
thermocouples. No leaks.
4 HDPE duct, PVC pipe, heat shrink wrap and
vent pipe
Leaks through heat shrink wrap.
BDV-31-977-15 Page 33
5 HDPE duct, clear window, vent pipe and thermocouple
Vent pipe worked well
(with small hole near it).
Thermocouple did not read
correct reading. 6 HDPE duct with
beaded wire thermo probe at
gradient
Beaded wire thermocouple worked well with correct temperature
readings.
7 HDPE duct, clear window, strands, side vent tube and thermocouple
with compression
fitting
Vent tube vented almost all air
from specimen. Thermocouple
with compression fittings read
correct tempertaure
reading. Significant drop in temperature due to presence
of strands. 8 HDPE duct with
injection through the saddle and
Viking pump.
Injection through saddles worked
well. Pump control was better with respect to
varying flow rate.
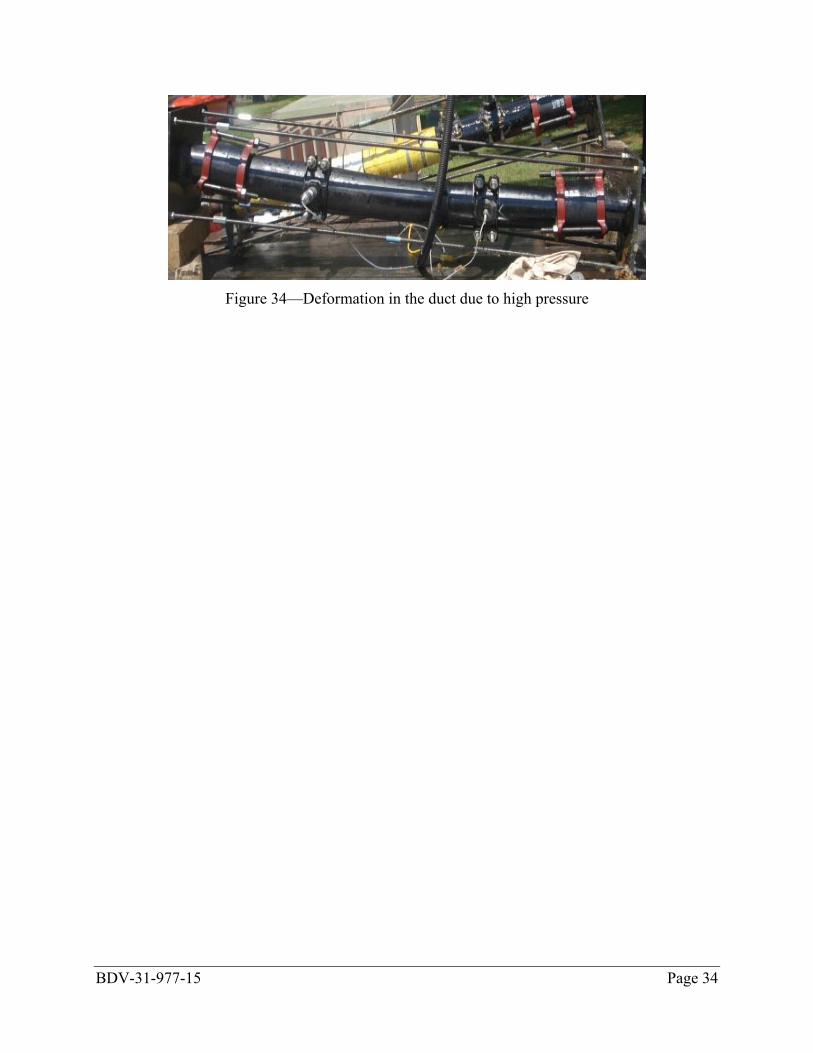
In one of the tests conducted, the HDPE duct deformed due to heat accumulation during
the prolonged circulation of filler (more than 8 minutes) and high injection pressure (above 100
psi) (Figure 34). No leads occurred, however, in any part of the specimen (duct and coupling).
Hence the injection pressure was limited to 75 psi for full scale mockup tests.
BDV-31-977-15 Page 34
Figure 34—Deformation in the duct due to high pressure
BDV-31-977-15 Page 35
7 Injections
Three tendons were injected using three different materials. This chapter describes the
process used to perform the injection and observations made during injection.
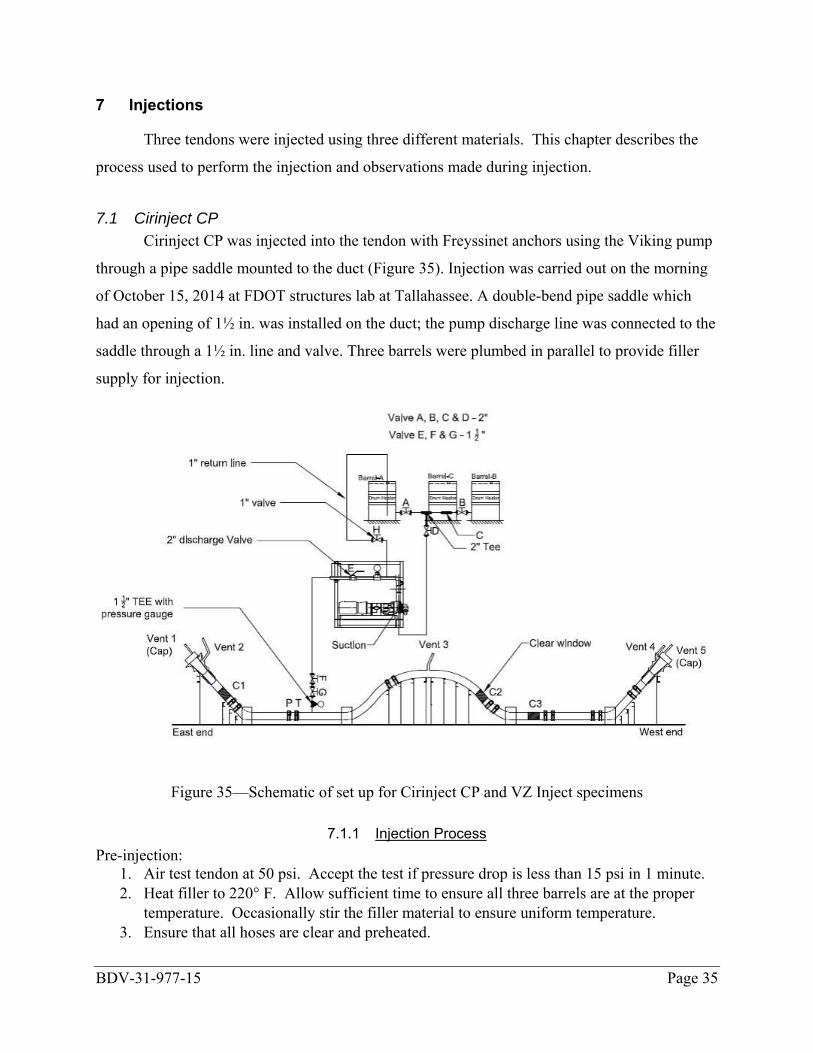
7.1 Cirinject CP Cirinject CP was injected into the tendon with Freyssinet anchors using the Viking pump
through a pipe saddle mounted to the duct (Figure 35). Injection was carried out on the morning
of October 15, 2014 at FDOT structures lab at Tallahassee. A double-bend pipe saddle which
had an opening of 1½ in. was installed on the duct; the pump discharge line was connected to the
saddle through a 1½ in. line and valve. Three barrels were plumbed in parallel to provide filler
supply for injection.
Figure 35—Schematic of set up for Cirinject CP and VZ Inject specimens
7.1.1 Injection Process Pre-injection:
1. Air test tendon at 50 psi. Accept the test if pressure drop is less than 15 psi in 1 minute. 2. Heat filler to 220° F. Allow sufficient time to ensure all three barrels are at the proper
temperature. Occasionally stir the filler material to ensure uniform temperature. 3. Ensure that all hoses are clear and preheated.
BDV-31-977-15 Page 36
4. Position personnel at all vents with buckets and wet towels. Personnel should be visible to the pump operator.
5. Position video cameras and LED lights at each of the windows to record injection.
Injection: 1. Position drums on pallet and place adjacent to suction line of pump. 2. Connect the 1in. return line to the barrel and connect 1.5 in. discharge line to the pump.
Leave the outlet end of the discharge line open. Injection will occur at the location shown in the figure.
3. Preheat the pump to 250° F. 4. Ensure vents at the east anchor (vent 1 and 2), middle frame (vent 3) and at the west
anchor (vent 4 and 5) are open. 5. Open valves A, B, C, D and F. Before connecting the discharge line to the inlet valve G,
start the pump and discharge 2 gallons into a clean container. Close valve F after discharge.
6. Start data acquisition system and begin video recording. Periodically record IR measurements of filler in barrel and at discharge locations. Gather small samples of filler from the inlet and outlet locations for testing.
7. Connect discharge line to inlet valve (valve G). 8. Open discharge line valve E and F and throttle pump to keep injection pressure less than
75 psi. Inject filler continuously at approximately 40 gpm. Allow filler to discharge from vents (vents 1, 2, 3, 4, and 5). Observe filler during discharge and close valve when all free air is discharged and consistent filler is exiting. Discharge approximately 3 gallons at each vent to get the consistent filler without any air. At anchorages close the anchorage vent first and then close anchor cap vent to ensure proper filling of anchor cap. Once vents at the east anchorage are closed, slow down filler injection at 30 gpm. Once vents at west end are closed, close valve F. Wait for 30 seconds to check if any entrapped air is present in the tendon. If air is present, open valve F and vent 3 (possibly vent 1 and 2 as well) and inject filler at approximately 20 gpm. Close vent(s) when consistent filler is exiting from the vent.
9. Increase the pressure in the tendon for 1 minute at very low flow rate (about 5 gpm) and stop injection at pressure 30 psi above the injection pressure. Close inlet valve (valve G) and stop pump.
10. Disconnect discharge line at valve G and reverse pump to pull filler from injection hose and deliver back into drum. Disconnect hoses and clean.
7.1.2 Observations • Pressure drop in pre-injection air test was 2 psi in 1 minute. • The overall injection process went smoothly with no leaks observed in the tendon. • Duration of injection (From the pump start to pump stop including hold time during
injection) was 5 minutes 17 seconds. • The pump was running at varying flow rates (20-40 gpm). • Injection pressure was held less than 75 psi. • Temperature of the filler at the start of the test was 225º F in all the barrels.
BDV-31-977-15 Page 37
• Ambient temperature at the start of the test was 67° F. • Filler from vent 1 exited first with very small quantity of air. Vent 1 was closed but vent 2
was open as filler was not exiting from that. Both vents were closed when good flow was observed.
• Vent-3 subsequently started discharging filler. At this same time, Barrel A was observed to have a blockage. Pumping was paused while blockage was removed from discharge line of barrel.
• Pumping was resumed. Vent 3 was closed as filler started discharging. • Vent 4 and 5 were closed following filler discharge that was clear of air. Valve F was also
closed to stop injecting filler in the tendon. Air bubbles were observed at window 2 travelling towards the middle vent.
• Injection was resumed to remove the air from the tendon. Flow was slowed to 20 gpm and the middle vent was opened simultaneously to remove the air. When vent 3 started discharging filler (no air), vent 3 was closed. Injection continued for approximately one minute at 4 gpm to increase the pressure. Pumping was stopped at 45 psi.
• No air travelled towards the east end (observed at window 1).
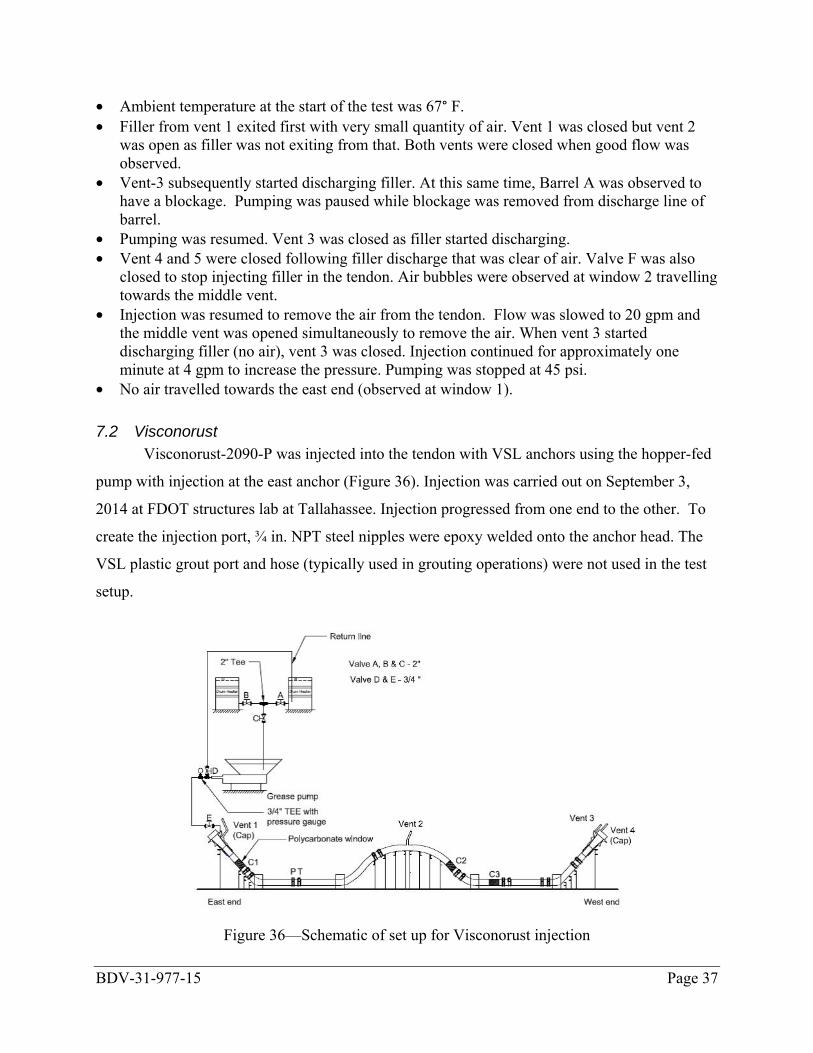
7.2 Visconorust Visconorust-2090-P was injected into the tendon with VSL anchors using the hopper-fed
pump with injection at the east anchor (Figure 36). Injection was carried out on September 3,
2014 at FDOT structures lab at Tallahassee. Injection progressed from one end to the other. To
create the injection port, ¾ in. NPT steel nipples were epoxy welded onto the anchor head. The
VSL plastic grout port and hose (typically used in grouting operations) were not used in the test
setup.
Figure 36—Schematic of set up for Visconorust injection
BDV-31-977-15 Page 38
7.2.1 Injection Process Pre-injection:
1. Air test tendon at 50 psi. Accept the test if pressure drop is less than 15 psi in 1 minute. 2. Heat filler to 220° F. Allow sufficient time to ensure both barrels are at the proper
temperature. Occasionally stir the filler material to ensure uniform temperature. 3. Ensure that all hoses are clear and preheated. 4. Position personnel at all vents with buckets and wet towels. Personnel should be visible
to the pump operator. 5. Position video cameras at each of the windows to record injection.
Injection: 1. Position barrels to discharge directly into the pump hopper. Discharge port should be
positioned to discharge below the surface of the filler to reduce foaming. 2. Connect hoses from pump to injection port on the anchor and a return line from pump to
the barrel. Injection will occur at the east end of the test setup. 3. Ensure vents at the inlet anchor (vent 1), middle frame (vent 2) and at the opposite anchor
(vent 3 and 4) are open. 4. Open valves A, C, and D. Close valves B and E and allow filler circulate through first
barrel. Close valve A and open valve B to ensure the flow from second barrel. Once filler starts flowing from second barrel, close Valve C and open Valve A.
5. Start data acquisition system recording data. 6. Open valve C and E. Throttle flow using valve D to control injection pressure. Pressure
should remain less than 75 psi. 7. Pump filler continuously. Discharge filler until clear of air at vent 2, 3, and 4. Close
outlets in sequential order as they discharge. At outlet anchorage close the anchorage outlet first and then close anchor cap outlet to ensure proper filling of anchor cap. Inlet anchor cap outlet (vent 1) follows the same procedure; however, if it discharges early due to location, then possibly close off the vent and reopen (burp) it near the end of the injection process. Once all outlets are closed, increase pressure within duct to 30 psi and close valve E.
8. All pressure and temperature measurements should be recorded electronically during filler injection. Periodically record IR measurements of filler in barrel and at discharge locations. Gather small samples of filler from the inlet and outlet locations for review.
9. Clean up: Stop transfer of filler from drum to hopper. Restart pump and run until pump is empty. Disconnect hoses and empty those into barrel if filler still liquid.
7.2.2 Observations • Pressure drop in pre-injection air test was 1-2 psi in 1 minute. • The overall injection process went smoothly with no leaks observed • Duration of the injection (From the pump start to pump stop including hold time during
injection) was 5 minutes 10 seconds. The process was slower than expected as the pump was not running at its full flow rate (20 gpm).
• Temperature of the filler in the hopper during the circulation was 230° F. • Ambient temperature at the start of the injection was 81° F.
BDV-31-977-15 Page 39
• Filler from vent 1 discharged initially with excessive air, followed by vent 2, 3, and 4. Discharged filler was collected in buckets for later volume measurement.
• Air was seen travelling through window 2. Air bubbles were due to incomplete venting at vent 2 location.
• A line of foam could be seen through the window 1. Some foam was injected as the hopper was near empty, which was likely due to drawing air into the intake at the hopper.
7.3 VZ Inject NONTRIBOS VZ inject was injected into the tendon with DSI anchors using the Viking
pump through a pipe saddle mounted to the duct in a similar manner as for Cirinject CP
specimen (Figure 35). Injection was carried out on the morning of October 8, 2014 at FDOT
structures lab at Tallahassee.
7.3.1 Injection Process Pre-injection:
1. Air test tendon at 50 psi. Accept the test if pressure drop is less than 15 psi in 1 minute. 2. Heat filler to 220° F. Allow sufficient time to ensure all 3 barrels are at the proper
temperature. Occasionally stir the filler material to ensure uniform temperature. 3. Ensure that all hoses are clear and preheated. 4. Position personnel at all vents with buckets and wet towels. Personnel should be visible
to the pump operator. 5. Position video cameras and LED lights at each of the windows to record injection.
Injection: 1. Position drums on pallet and place adjacent to suction line of pump. 2. Connect the 1 in. return line to the barrel and connect 1.5 in. discharge line to the pump.
Leave the outlet end of the discharge line open. Injection will occur at the location shown in the figure.
3. Ensure vent 1, 2, 4, and 5 are open. Vent vent 3 should be closed. 4. Preheat the pump to 250° F. 5. Open valves A, B, C, and E. Before connecting the discharge line to valve F, start the
pump and discharge 2 gallons into a clean container. Close valve E after discharge. 6. Start data acquisition system and begin video recording. Periodically record IR
measurements of filler in barrel and at discharge locations. Gather small samples of filler from the inlet and outlet locations for review.
7. Connect hose to valve F. Open discharge line valve E and F and throttle pump to control pressure. Do not exceed 75 psi. Operate transfer pump as needed to move filler from Barrel C to Barrel B.
8. Inject filler continuously at approximately 60 gpm. Allow filler to discharge from vents 1, 2, 4, and 5. Observe filler during discharge and close valve when all free air is discharged and consistent filler is exiting. At anchorages close the anchorage vent first
BDV-31-977-15 Page 40
and then close anchor cap vent to ensure proper filling of anchor cap. Once anchorage vents are closed open vent 3 and discharge until consistent filler is exiting. Close vent 3.
9. Once all valves are closed increase pressure 30 psi. Close valve F and stop pump. 10. Disconnect discharge line at valve F and reverse pump to pull filler from injection hose
and deliver back into drum. Disconnect hoses and clean.
7.3.2 Observations • Pressure drop in pre-injection air test was 3-4 psi in 1 minute. • The overall injection process went smooth with no leaks in the tendon. • Duration of injection (From the pump start to pump stop including hold time during
injection) was 3 minutes 29 seconds. • The filler pump was run at varying flow rates (40-60 gpm) keeping injection pressure less
than 75 psi. • Temperature of the filler at the start of the test was 230º F in all the barrels. • Ambient temperature at the start of the injection was 72° F. • Temperature of the discharge line of the pump through infra-red gun was 118° F. • Filler from vent 1 and 2 exited first with considerable amounts of air. Both vents were closed
when good flow was noted visually. Vent 4 and 5 started discharging filler subsequently. • Vent 3 was then opened which discharged filler with considerable amounts of air. Vent 3 was
closed when good flow came out of it. At this time pumping was stopped and window 1 and 2 were checked for potential air bubbles.
• Window 1 showed air travelling towards the east anchor. Pumping was started again to burp the air at the East end. Vent 2 was reopened and burped until good flow of filler was discharged. Pumping was then terminated.
BDV-31-977-15 Page 41
8 Results and Discussion
8.1 Post-Injection Inspection At approximately 24 hours following injection the tendon was inspected. Fifteen
inspection ports (IP) were prepared, at which the duct was cut open to inspect the relative fill of
the pliable fillers, filler cover of the strands, and void presence, if any. Each inspection port
opening was formed by cutting and removing the top half of the HDPE duct over a length of
approximately 2 ft; IP15, however, was made on the bottom half of the duct. Clear windows,
vents and caps were also inspected for the relative fill. Figure 37 shows the location of the
inspection ports (IP) along the length of the tendon. Inspection observations for each tendon are
summarized in the following sections.
Figure 37—Inspection port (IP) locations on tendon
BDV-31-977-15 Page 42
8.1.1 Cirinject CP
Table 6—Post-injection inspection of Cirinject CP
Inspection port
Distance from
east end
Strand location
Comments
IP01 1 Bottom No voids visible. Strands completely coated with filler.
IP02 27 Top No voids visible. Strands completely coated with filler.
IP03 31 No inspection due to instrumentation IP04 55 Top No voids visible. Strands completely coated with filler.
BDV-31-977-15 Page 43
IP05 67 Top No voids visible. Strands coated with filler.
IP06 71 Top No voids visible. Strands completely coated with filler.
IP07 92 Bottom No voids visible. Strands completely coated with filler. Small
bubbles on the top of the filler.
IP08 97 Bottom No voids visible. Strands completely coated with filler.
BDV-31-977-15 Page 44
IP09 100 Bottom No voids visible. Strands completely coated with filler.
IP10 125 Top No voids visible. Strands completely coated with filler.
IP11 129 Top No voids visible. Strands completely coated with filler. Small
bubbles on east side of the inspection port.
IP12 145 Top No voids visible. Strands completely coated with filler.
Bubbles on the top of the filler.
BDV-31-977-15 Page 45
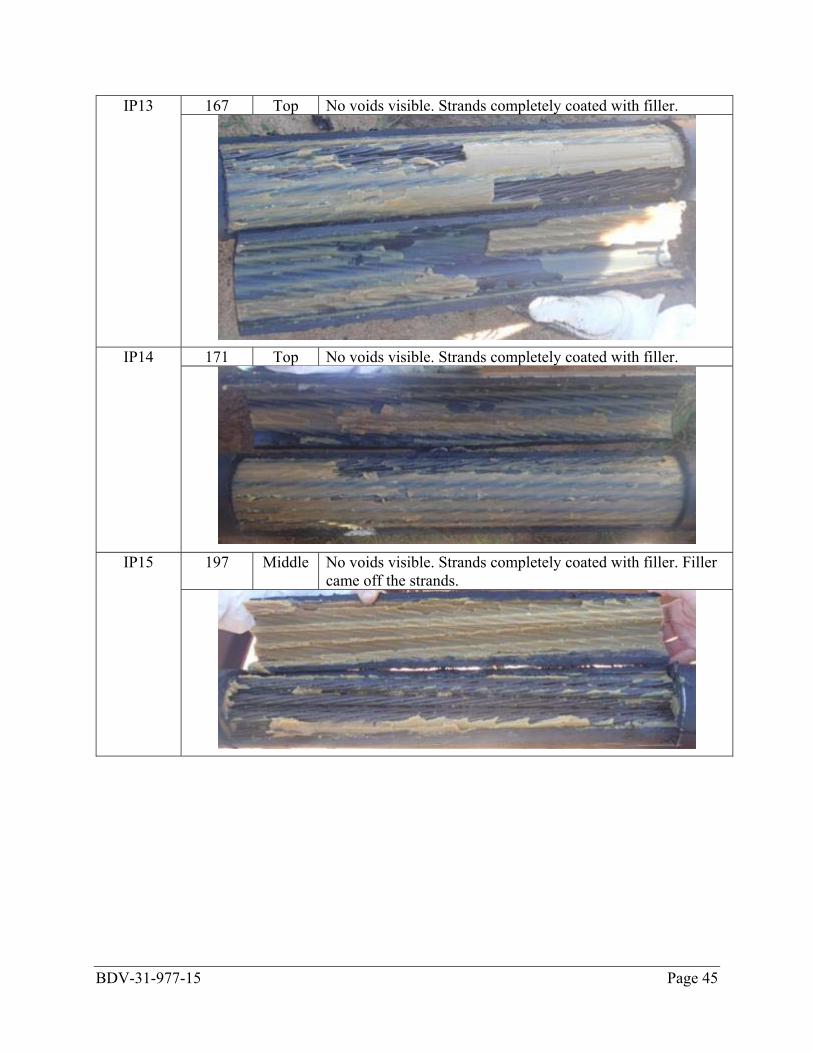
IP13 167 Top No voids visible. Strands completely coated with filler.
IP14 171 Top No voids visible. Strands completely coated with filler.
IP15 197 Middle No voids visible. Strands completely coated with filler. Filler
came off the strands.
BDV-31-977-15 Page 46
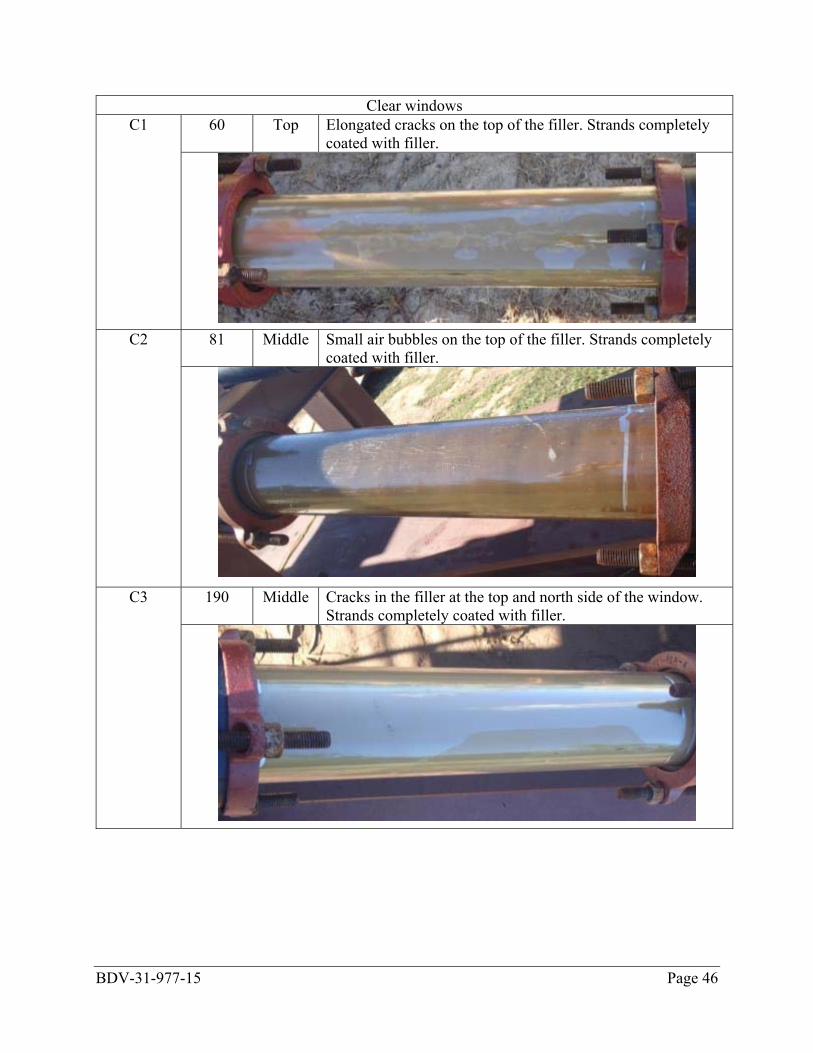
Clear windows C1 60 Top Elongated cracks on the top of the filler. Strands completely
coated with filler.
C2 81 Middle Small air bubbles on the top of the filler. Strands completely
coated with filler.
C3 190 Middle Cracks in the filler at the top and north side of the window.
Strands completely coated with filler.
BDV-31-977-15 Page 47
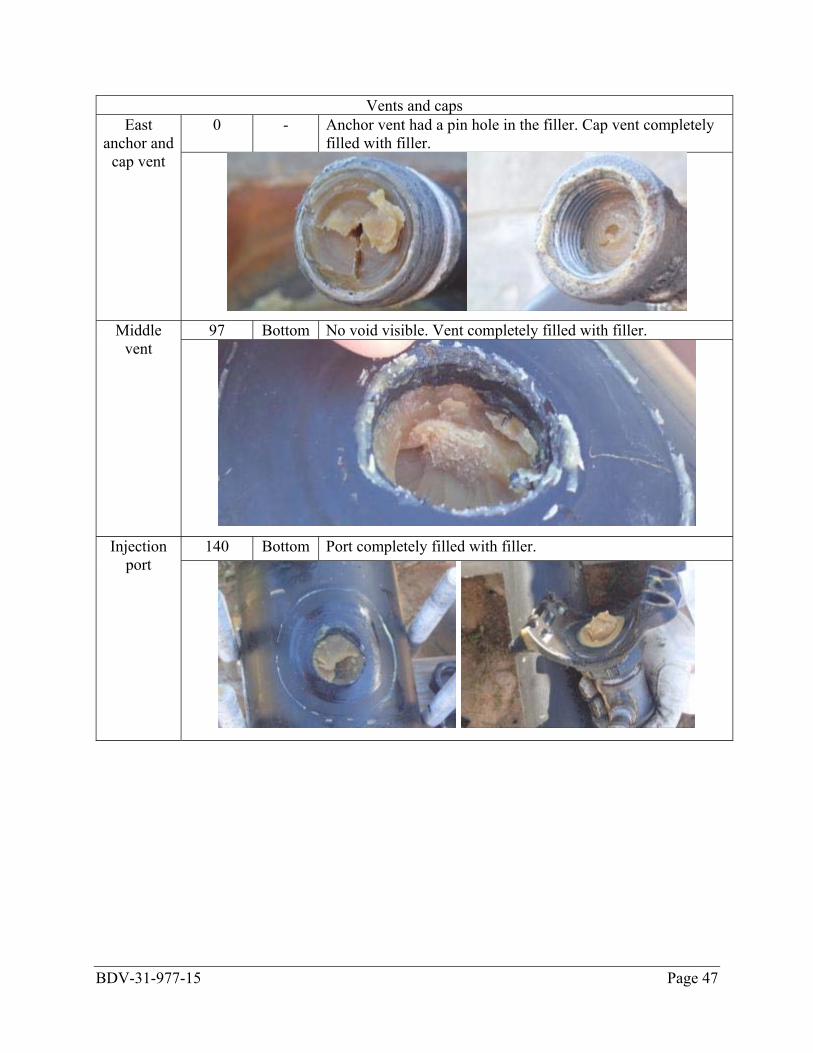
Vents and caps East
anchor and cap vent
0 - Anchor vent had a pin hole in the filler. Cap vent completely filled with filler.
Middle
vent 97 Bottom No void visible. Vent completely filled with filler.
Injection
port 140 Bottom Port completely filled with filler.
BDV-31-977-15 Page 48
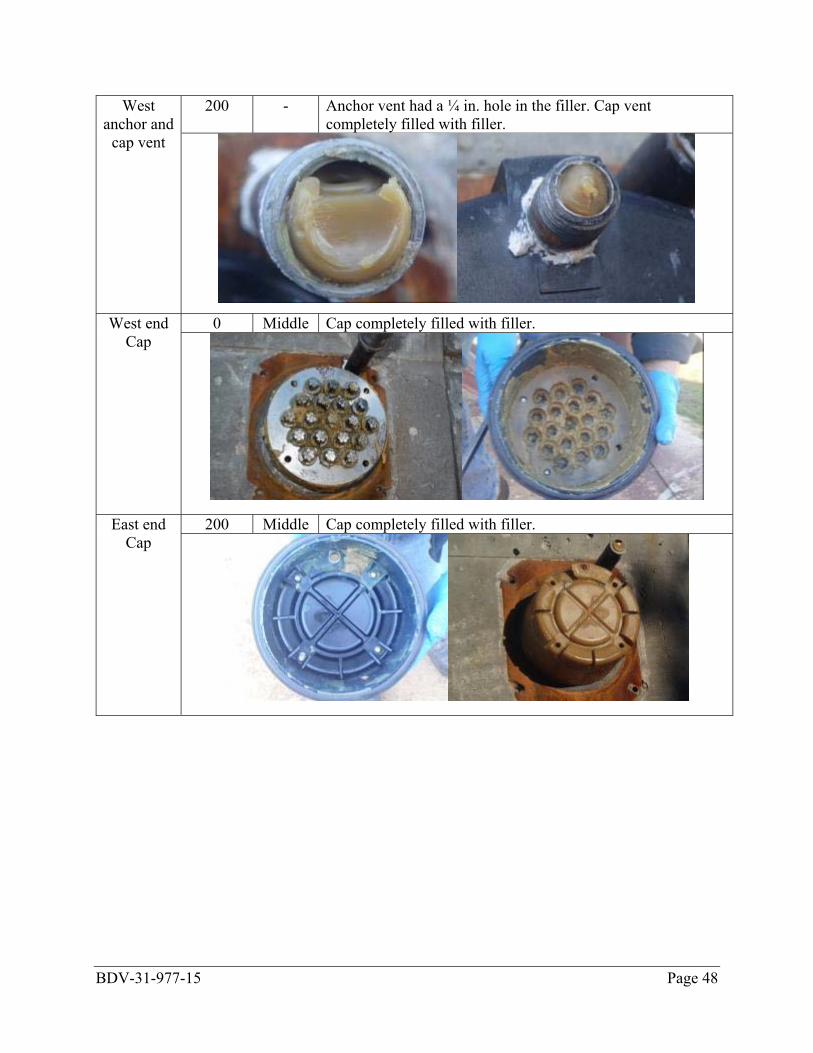
West anchor and
cap vent
200 - Anchor vent had a ¼ in. hole in the filler. Cap vent completely filled with filler.
West end
Cap 0 Middle Cap completely filled with filler.
East end Cap
200 Middle Cap completely filled with filler.
BDV-31-977-15 Page 49
8.1.2 Visconorust
Table 7—Post-injection inspection of Visconorust
Inspection port
Location (ft)
Strand location
Comments
IP01 1 Top No voids visible. Visible strands completely coated with filler.
IP02 27 Top No voids visible. Visible strands coated with filler.
IP03 31 No inspection due to instrumentation. IP04 55 Bottom No voids visible. Visible strands completely coated with
filler.
IP05 67 Top No voids visible. Strands coated with filler.
BDV-31-977-15 Page 50
IP06 71 Top Dry stand at some locations and some voids. Strands mostly coated with filler.
IP07 92 Bottom Void at the top on east side ¼ in. deep. Strands completely coated with filler.
IP08 97 Bottom Void at the top. 1 ¼ in. on west side, 7/8 in. on east side.
Void through to IP-7. Strands completely coated with filler.
BDV-31-977-15 Page 51
IP09 100 Bottom No voids visible. Strands completely coated with filler.
IP10 125 Top No voids visible. Strands completely coated with filler.
IP11 129 Top No voids visible. Strands completely coated with filler.
IP12 145 Middle No voids visible. Strands completely coated with filler.
BDV-31-977-15 Page 52
IP13 167 Top No voids visible. Strands completely coated with filler.
IP14 171 Top Foam/bubble at the top of the filler. Strands coated with
filler.
IP15 197 Top Foam/bubble at the top of the filler. Strands coated with
filler.
C1 60 Top Elongated void at the top of the filler. Strands completely
coated with filler.
BDV-31-977-15 Page 53
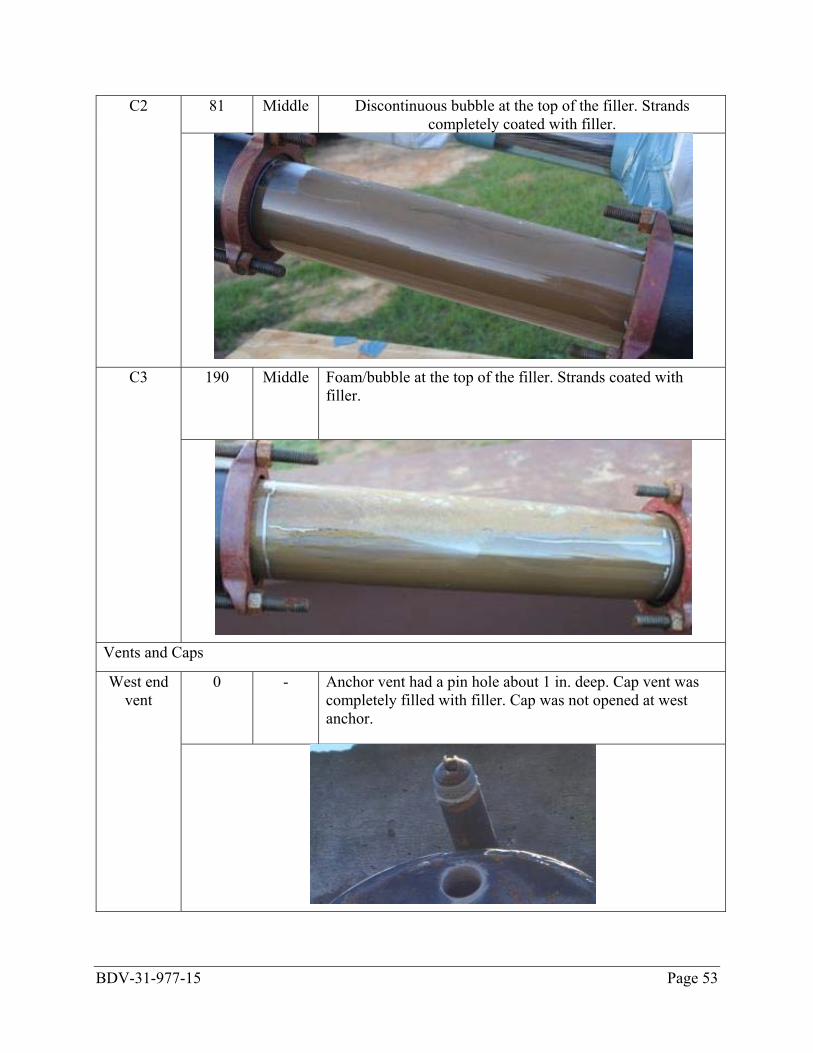
C2 81 Middle Discontinuous bubble at the top of the filler. Strands completely coated with filler.
C3 190 Middle Foam/bubble at the top of the filler. Strands coated with
filler.
Vents and Caps
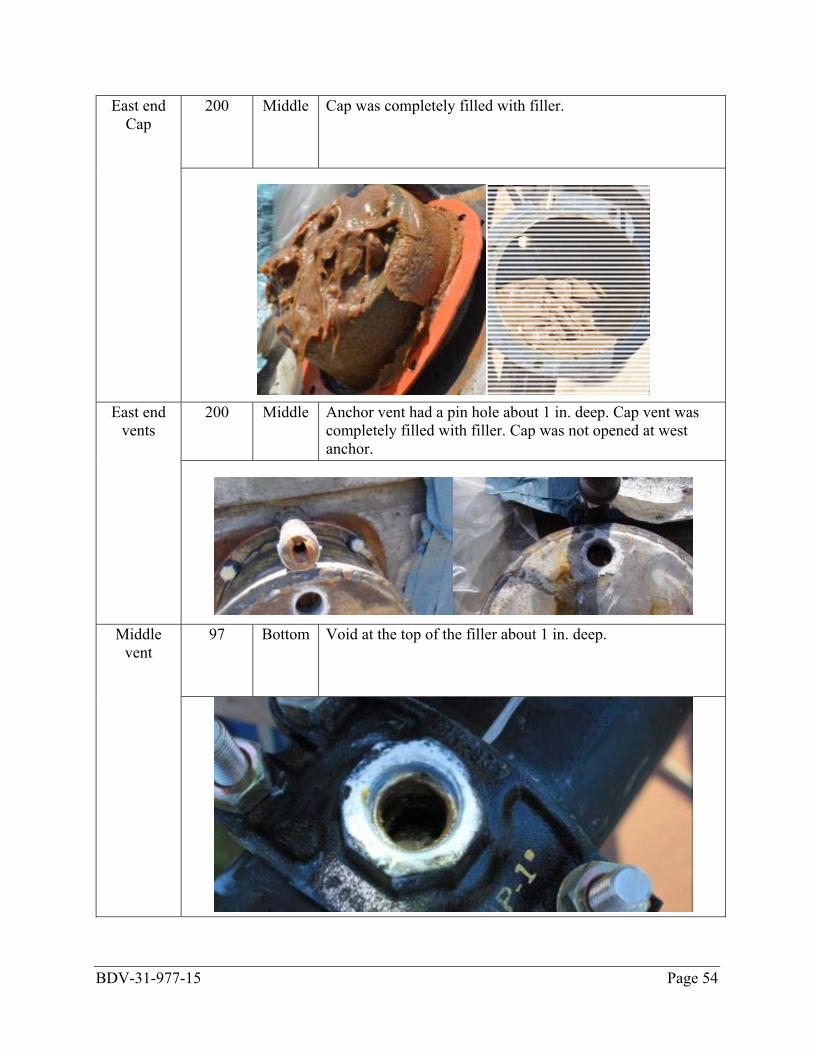
West end vent
0 - Anchor vent had a pin hole about 1 in. deep. Cap vent was completely filled with filler. Cap was not opened at west anchor.
BDV-31-977-15 Page 54
East end Cap
200 Middle Cap was completely filled with filler.
East end
vents 200 Middle Anchor vent had a pin hole about 1 in. deep. Cap vent was
completely filled with filler. Cap was not opened at west anchor.
Middle
vent 97 Bottom Void at the top of the filler about 1 in. deep.
BDV-31-977-15 Page 55
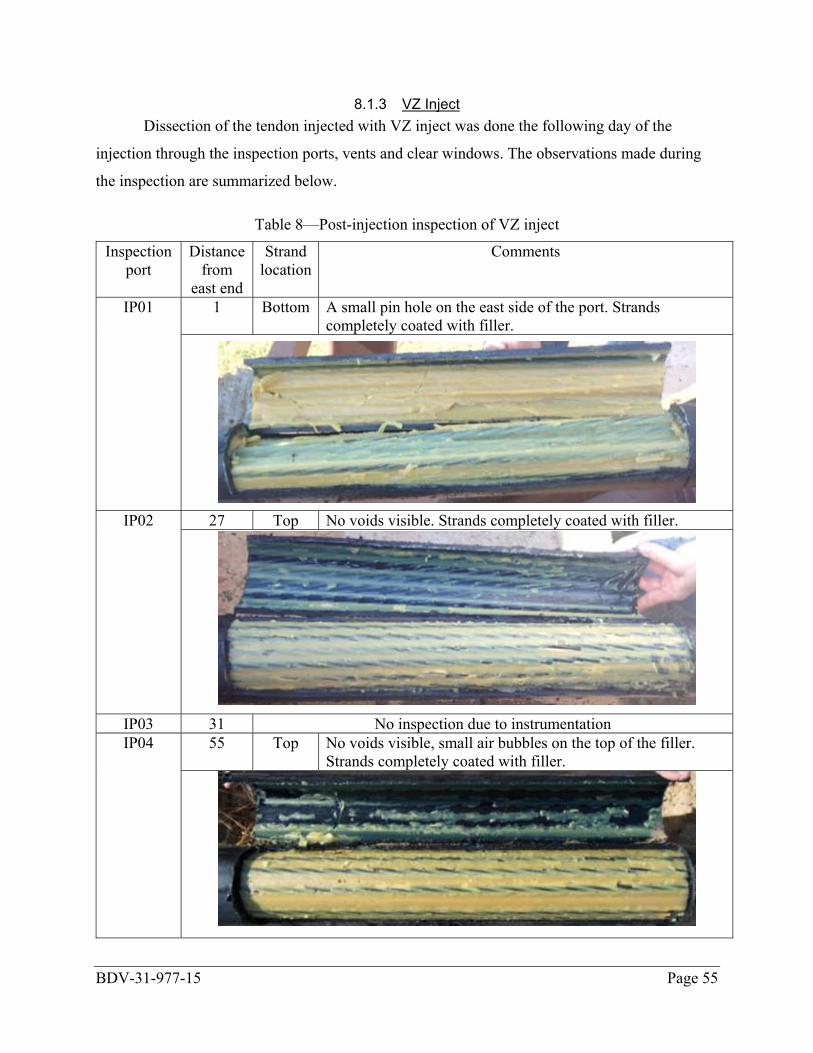
8.1.3 VZ Inject Dissection of the tendon injected with VZ inject was done the following day of the
injection through the inspection ports, vents and clear windows. The observations made during
the inspection are summarized below.
Table 8—Post-injection inspection of VZ inject
Inspection port
Distance from
east end
Strand location
Comments
IP01 1 Bottom A small pin hole on the east side of the port. Strands completely coated with filler.
IP02 27 Top No voids visible. Strands completely coated with filler.
IP03 31 No inspection due to instrumentation IP04 55 Top No voids visible, small air bubbles on the top of the filler.
Strands completely coated with filler.
BDV-31-977-15 Page 56
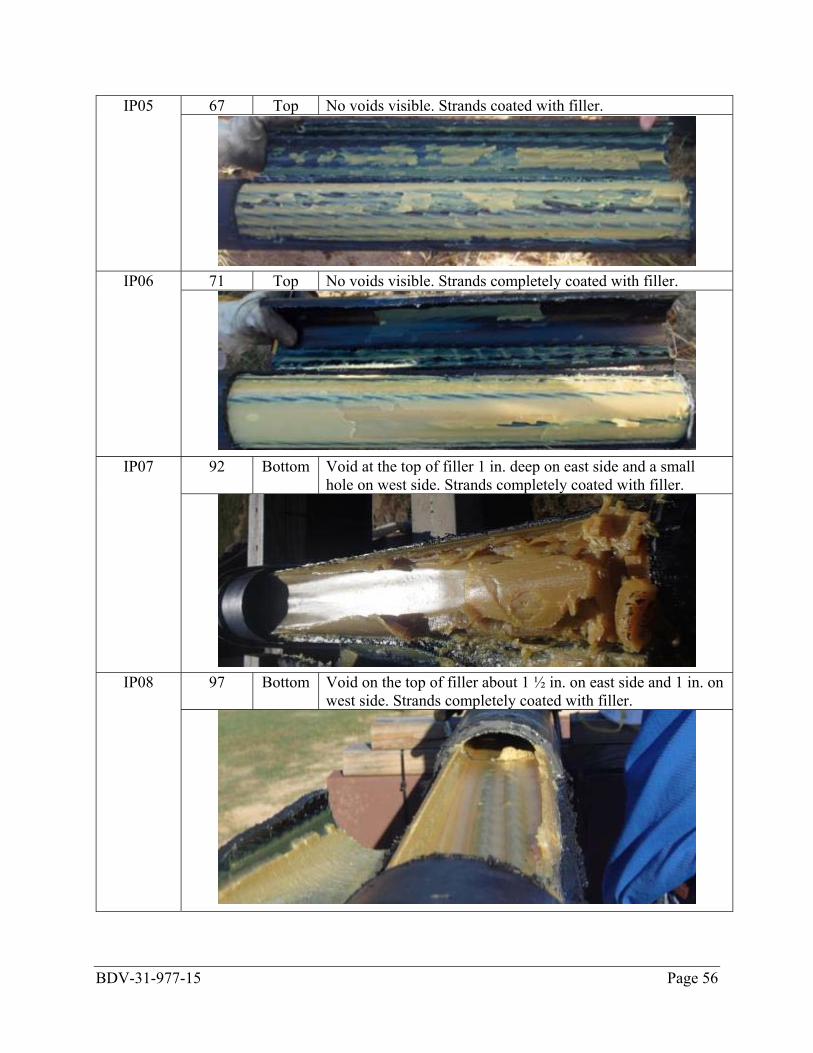
IP05 67 Top No voids visible. Strands coated with filler.
IP06 71 Top No voids visible. Strands completely coated with filler.
IP07 92 Bottom Void at the top of filler 1 in. deep on east side and a small
hole on west side. Strands completely coated with filler.
IP08 97 Bottom Void on the top of filler about 1 ½ in. on east side and 1 in. on
west side. Strands completely coated with filler.
BDV-31-977-15 Page 57
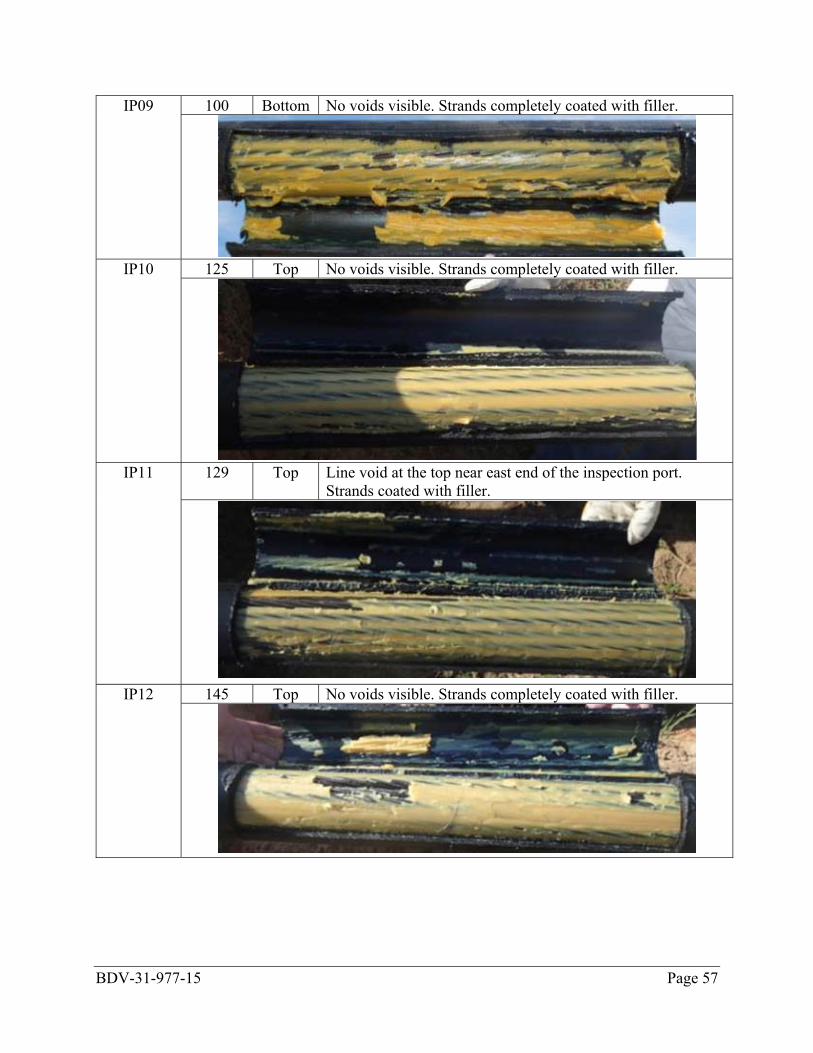
IP09 100 Bottom No voids visible. Strands completely coated with filler.
IP10 125 Top No voids visible. Strands completely coated with filler.
IP11 129 Top Line void at the top near east end of the inspection port. Strands coated with filler.
IP12 145 Top No voids visible. Strands completely coated with filler.
BDV-31-977-15 Page 58
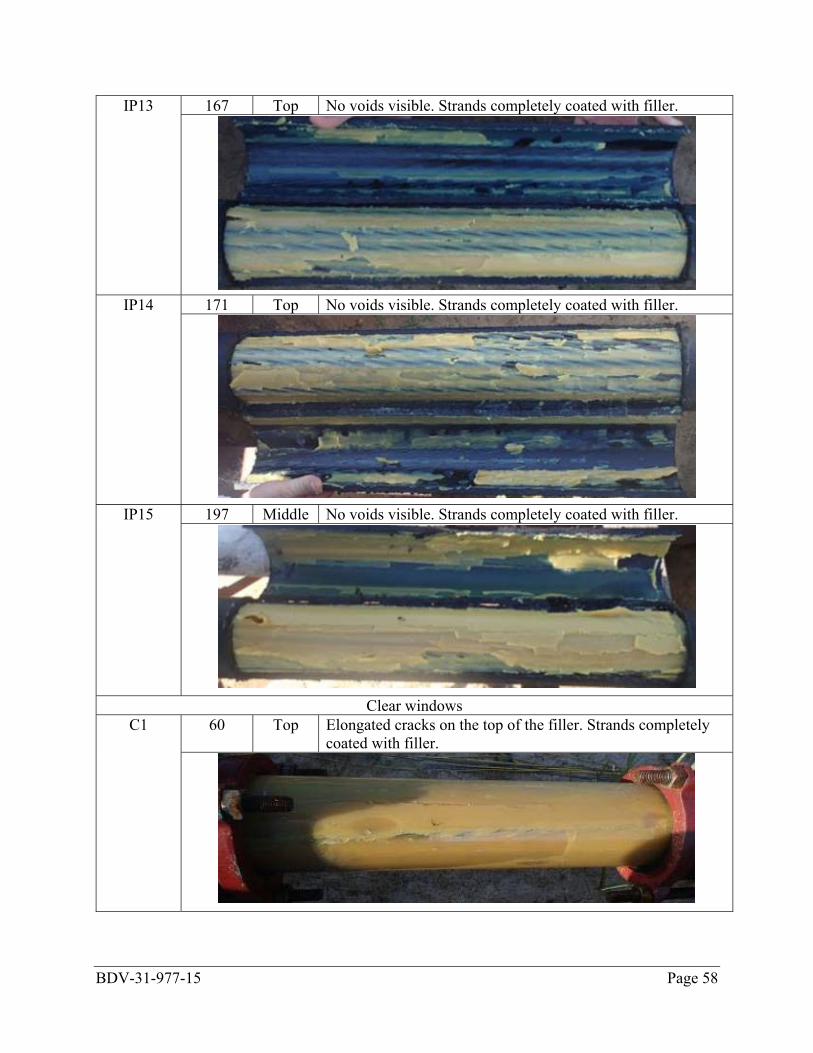
IP13 167 Top No voids visible. Strands completely coated with filler.
IP14 171 Top No voids visible. Strands completely coated with filler.
IP15 197 Middle No voids visible. Strands completely coated with filler.
Clear windows
C1 60 Top Elongated cracks on the top of the filler. Strands completely coated with filler.
BDV-31-977-15 Page 59
C2 81 Middle Cracks on the south side of the window. Strands completely coated with filler.
C3 190 Middle Cracks in the filler at the top of the window. Strands
completely coated with filler.
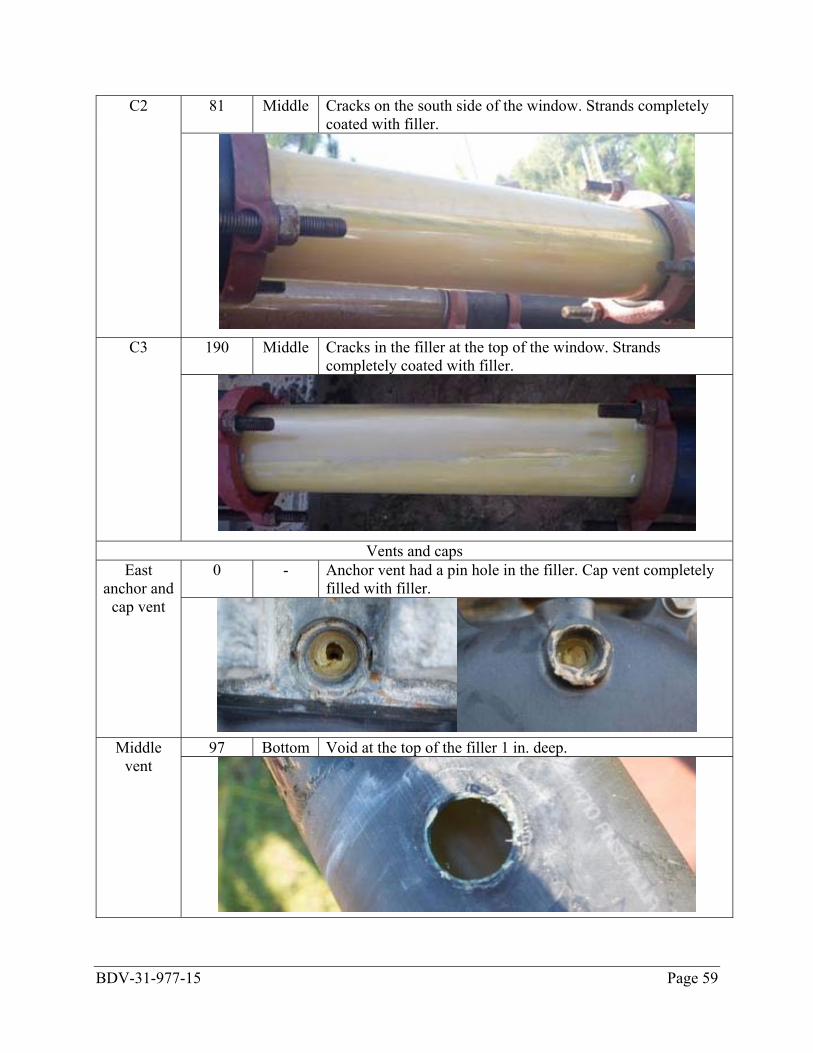
Vents and caps
East anchor and
cap vent
0 - Anchor vent had a pin hole in the filler. Cap vent completely filled with filler.
Middle
vent 97 Bottom Void at the top of the filler 1 in. deep.
BDV-31-977-15 Page 60
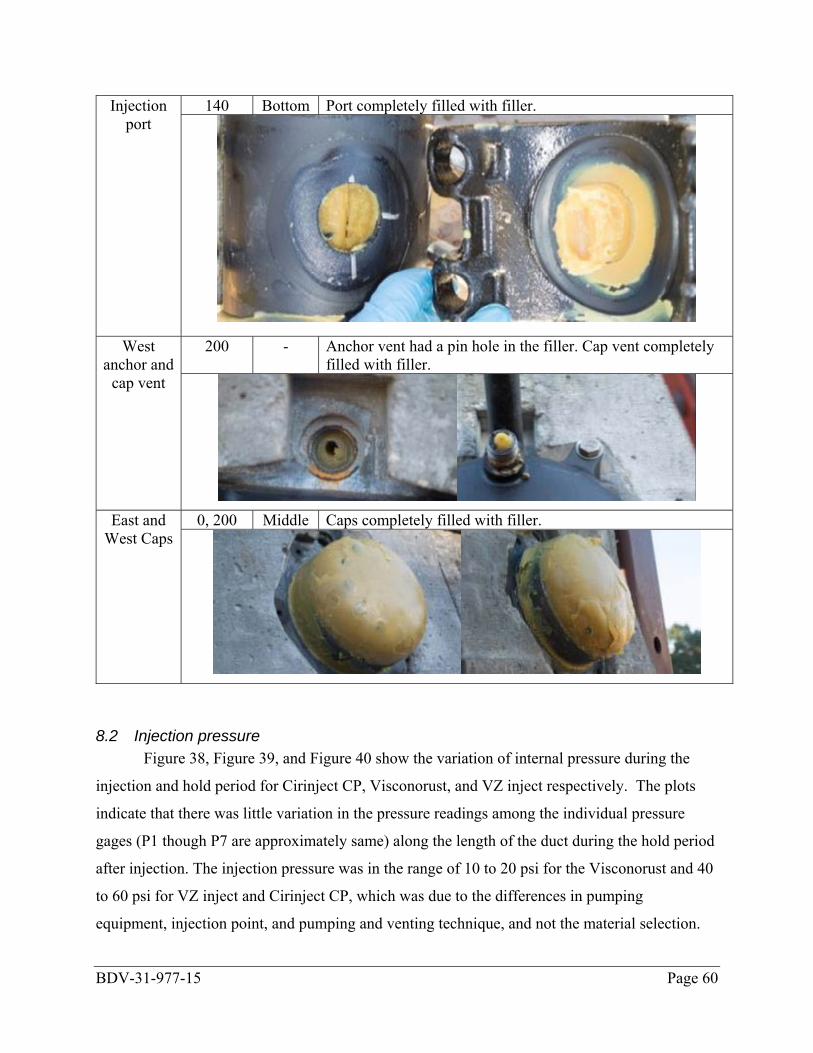
Injection port
140 Bottom Port completely filled with filler.
West anchor and
cap vent
200 - Anchor vent had a pin hole in the filler. Cap vent completely filled with filler.
East and
West Caps 0, 200 Middle Caps completely filled with filler.
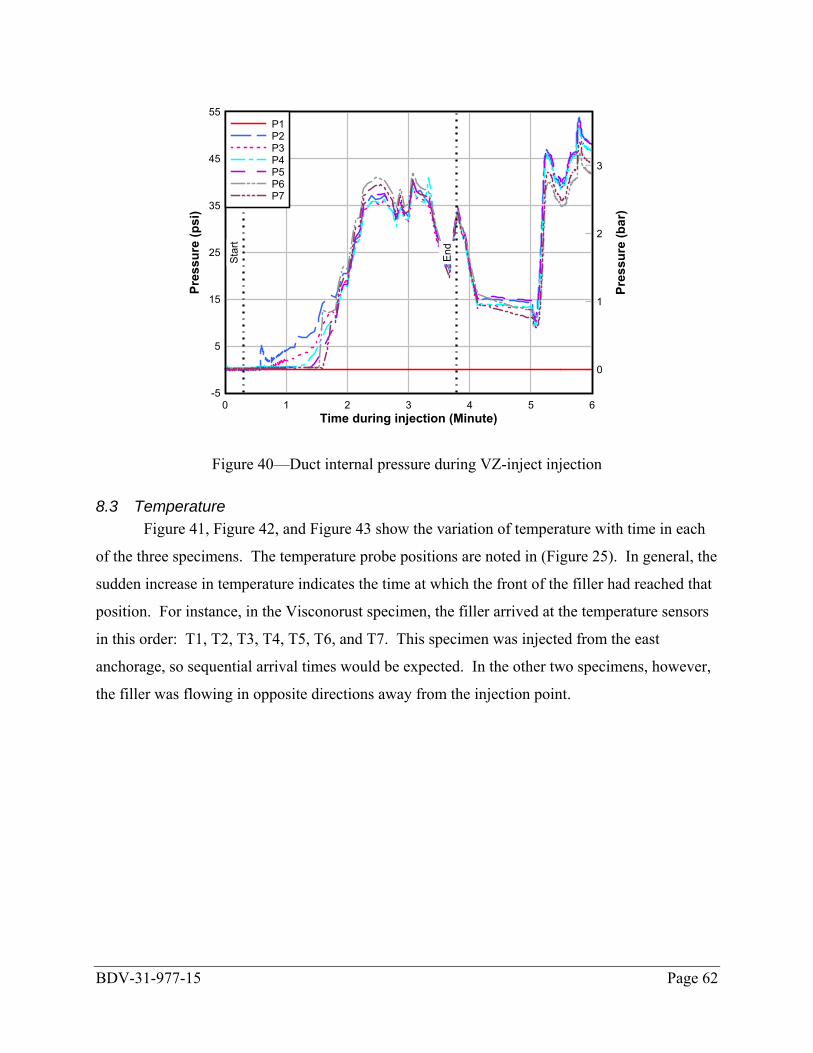
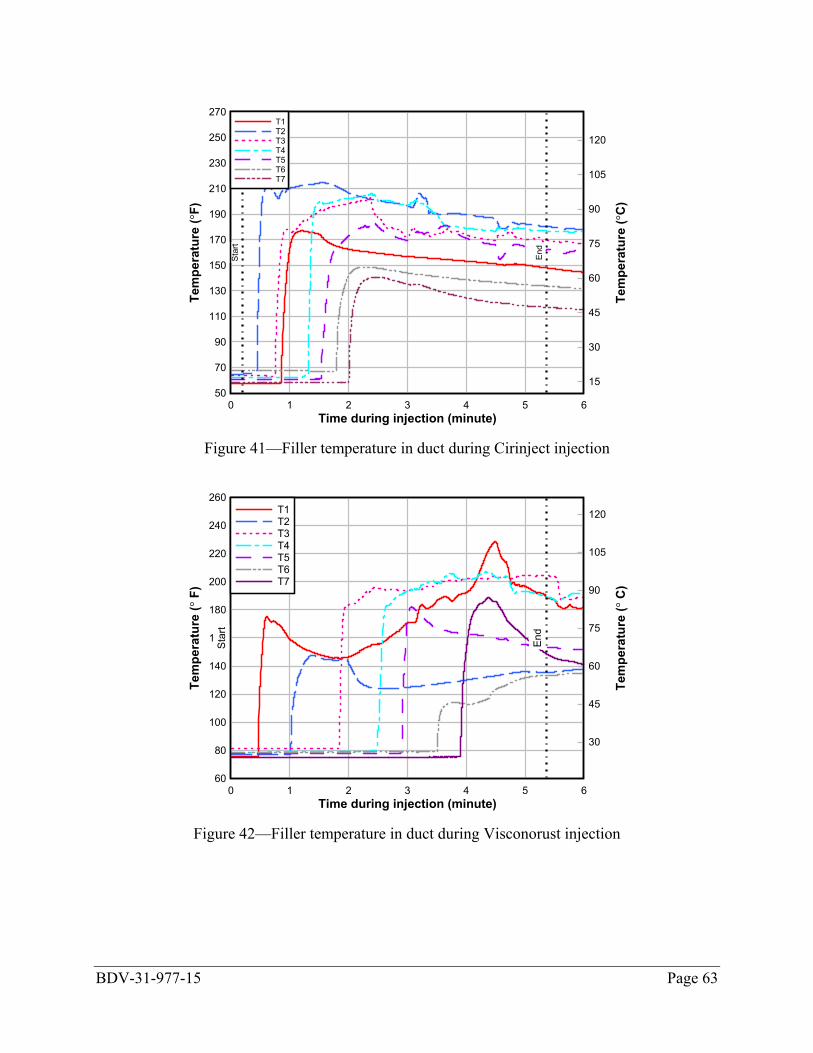
8.2 Injection pressure Figure 38, Figure 39, and Figure 40 show the variation of internal pressure during the
injection and hold period for Cirinject CP, Visconorust, and VZ inject respectively. The plots
indicate that there was little variation in the pressure readings among the individual pressure
gages (P1 though P7 are approximately same) along the length of the duct during the hold period
after injection. The injection pressure was in the range of 10 to 20 psi for the Visconorust and 40
to 60 psi for VZ inject and Cirinject CP, which was due to the differences in pumping
equipment, injection point, and pumping and venting technique, and not the material selection.
BDV-31-977-15 Page 61
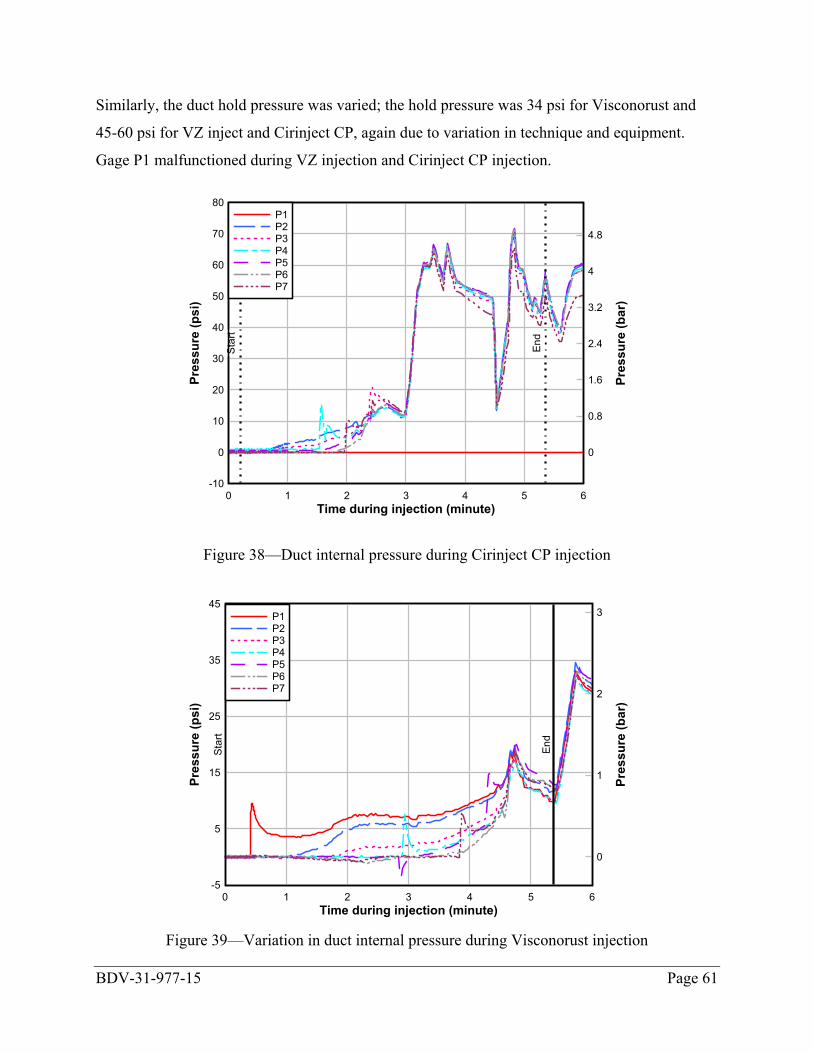
Similarly, the duct hold pressure was varied; the hold pressure was 34 psi for Visconorust and
45-60 psi for VZ inject and Cirinject CP, again due to variation in technique and equipment.
Gage P1 malfunctioned during VZ injection and Cirinject CP injection.
Figure 38—Duct internal pressure during Cirinject CP injection
Figure 39—Variation in duct internal pressure during Visconorust injection
Time during injection (minute)
Pres
sure
(psi
)
Pres
sure
(bar
)
0 1 2 3 4 5 6-10
0
10
20
30
40
50
60
70
80
0
0.8
1.6
2.4
3.2
4
4.8St
art
End
P1P2P3P4P5P6P7
Time during injection (minute)
Pres
sure
(psi
)
Pres
sure
(bar
)
0 1 2 3 4 5 6-5
5
15
25
35
45
0
1
2
3
Star
t
End
P1P2P3P4P5P6P7
BDV-31-977-15 Page 62
Figure 40—Duct internal pressure during VZ-inject injection
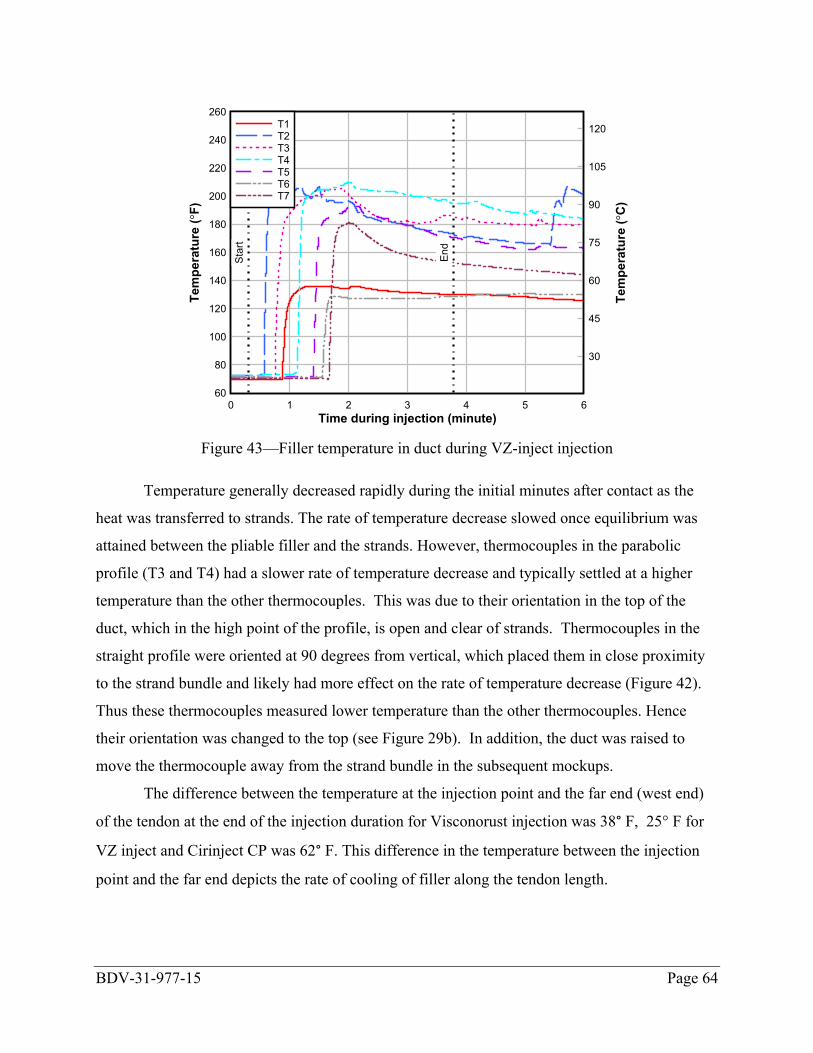
8.3 Temperature Figure 41, Figure 42, and Figure 43 show the variation of temperature with time in each
of the three specimens. The temperature probe positions are noted in (Figure 25). In general, the
sudden increase in temperature indicates the time at which the front of the filler had reached that
position. For instance, in the Visconorust specimen, the filler arrived at the temperature sensors
in this order: T1, T2, T3, T4, T5, T6, and T7. This specimen was injected from the east
anchorage, so sequential arrival times would be expected. In the other two specimens, however,
the filler was flowing in opposite directions away from the injection point.
Time during injection (Minute)
Pres
sure
(psi
)
Pres
sure
(bar
)
0 1 2 3 4 5 6-5
5
15
25
35
45
55
0
1
2
3
Star
t
End
P1P2P3P4P5P6P7
BDV-31-977-15 Page 63
Figure 41—Filler temperature in duct during Cirinject injection
Figure 42—Filler temperature in duct during Visconorust injection
Time during injection (minute)
Tem
pera
ture
(°F)
Tem
pera
ture
(°C
)
0 1 2 3 4 5 650
70
90
110
130
150
170
190
210
230
250
270
15
30
45
60
75
90
105
120
Star
t
End
T1T2T3T4T5T6T7
Time during injection (minute)
Tem
pera
ture
(° F
)
Tem
pera
ture
(° C
)
0 1 2 3 4 5 660
80
100
120
140
160
180
200
220
240
260
30
45
60
75
90
105
120
Star
t
End
T1T2T3T4T5T6T7
BDV-31-977-15 Page 64
Figure 43—Filler temperature in duct during VZ-inject injection
Temperature generally decreased rapidly during the initial minutes after contact as the
heat was transferred to strands. The rate of temperature decrease slowed once equilibrium was
attained between the pliable filler and the strands. However, thermocouples in the parabolic
profile (T3 and T4) had a slower rate of temperature decrease and typically settled at a higher
temperature than the other thermocouples. This was due to their orientation in the top of the
duct, which in the high point of the profile, is open and clear of strands. Thermocouples in the
straight profile were oriented at 90 degrees from vertical, which placed them in close proximity
to the strand bundle and likely had more effect on the rate of temperature decrease (Figure 42).
Thus these thermocouples measured lower temperature than the other thermocouples. Hence
their orientation was changed to the top (see Figure 29b). In addition, the duct was raised to
move the thermocouple away from the strand bundle in the subsequent mockups.
The difference between the temperature at the injection point and the far end (west end)
of the tendon at the end of the injection duration for Visconorust injection was 38° F, 25° F for
VZ inject and Cirinject CP was 62° F. This difference in the temperature between the injection
point and the far end depicts the rate of cooling of filler along the tendon length.
Time during injection (minute)
Tem
pera
ture
(°F)
Tem
pera
ture
(°C
)
0 1 2 3 4 5 660
80
100
120
140
160
180
200
220
240
260
30
45
60
75
90
105
120
Star
t
End
T1T2T3T4T5T6T7
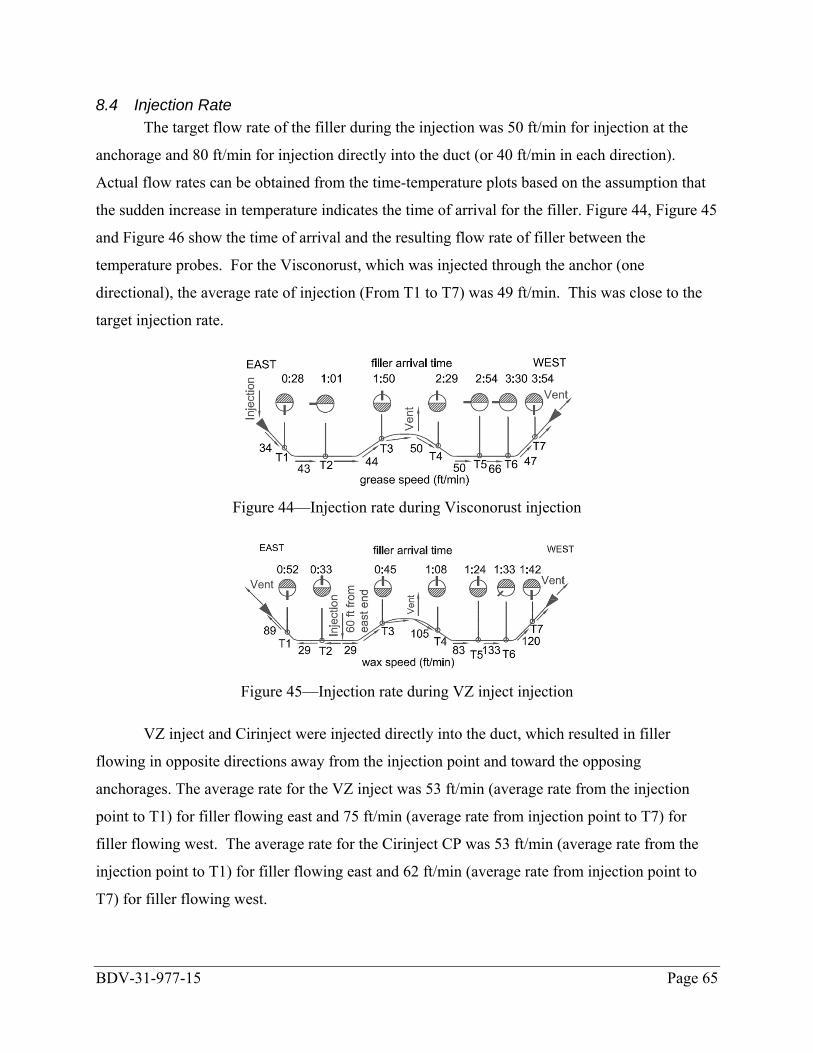
BDV-31-977-15 Page 65
8.4 Injection Rate The target flow rate of the filler during the injection was 50 ft/min for injection at the
anchorage and 80 ft/min for injection directly into the duct (or 40 ft/min in each direction).
Actual flow rates can be obtained from the time-temperature plots based on the assumption that
the sudden increase in temperature indicates the time of arrival for the filler. Figure 44, Figure 45
and Figure 46 show the time of arrival and the resulting flow rate of filler between the
temperature probes. For the Visconorust, which was injected through the anchor (one
directional), the average rate of injection (From T1 to T7) was 49 ft/min. This was close to the
target injection rate.
Figure 44—Injection rate during Visconorust injection
Figure 45—Injection rate during VZ inject injection
VZ inject and Cirinject were injected directly into the duct, which resulted in filler
flowing in opposite directions away from the injection point and toward the opposing
anchorages. The average rate for the VZ inject was 53 ft/min (average rate from the injection
point to T1) for filler flowing east and 75 ft/min (average rate from injection point to T7) for
filler flowing west. The average rate for the Cirinject CP was 53 ft/min (average rate from the
injection point to T1) for filler flowing east and 62 ft/min (average rate from injection point to
T7) for filler flowing west.
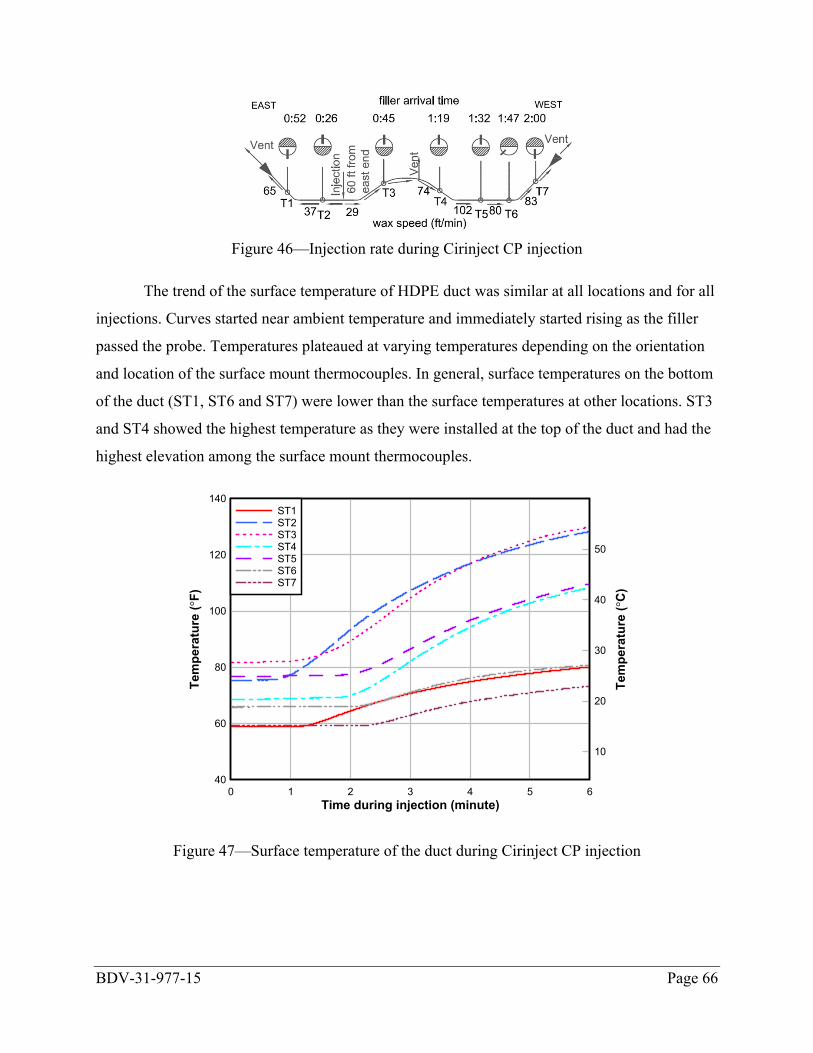
BDV-31-977-15 Page 66
Figure 46—Injection rate during Cirinject CP injection
The trend of the surface temperature of HDPE duct was similar at all locations and for all
injections. Curves started near ambient temperature and immediately started rising as the filler
passed the probe. Temperatures plateaued at varying temperatures depending on the orientation
and location of the surface mount thermocouples. In general, surface temperatures on the bottom
of the duct (ST1, ST6 and ST7) were lower than the surface temperatures at other locations. ST3
and ST4 showed the highest temperature as they were installed at the top of the duct and had the
highest elevation among the surface mount thermocouples.
Figure 47—Surface temperature of the duct during Cirinject CP injection
Time during injection (minute)
Tem
pera
ture
(°F)
Tem
pera
ture
(°C
)
0 1 2 3 4 5 640
60
80
100
120
140
10
20
30
40
50
ST1ST2ST3ST4ST5ST6ST7
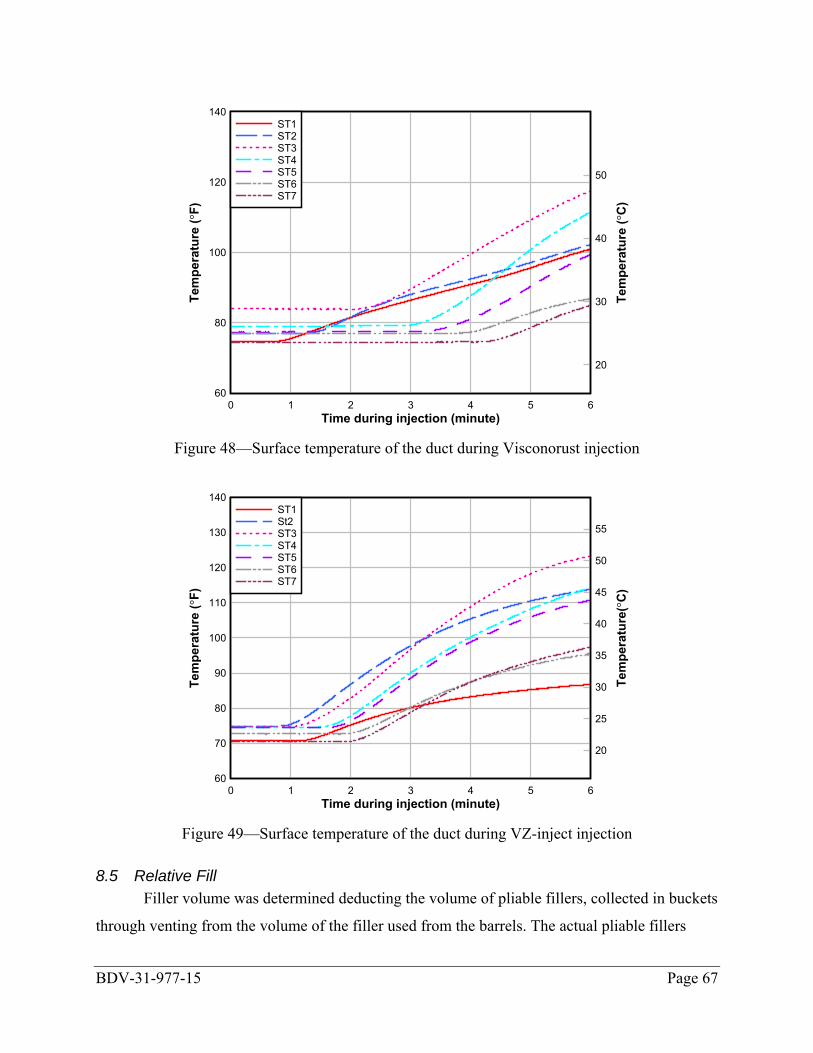
BDV-31-977-15 Page 67
Figure 48—Surface temperature of the duct during Visconorust injection
Figure 49—Surface temperature of the duct during VZ-inject injection
8.5 Relative Fill Filler volume was determined deducting the volume of pliable fillers, collected in buckets
through venting from the volume of the filler used from the barrels. The actual pliable fillers
Time during injection (minute)
Tem
pera
ture
(°F)
Tem
pera
ture
(°C
)
0 1 2 3 4 5 660
80
100
120
140
20
30
40
50
ST1ST2ST3ST4ST5ST6ST7
Time during injection (minute)
Tem
pera
ture
(°F)
Tem
pera
ture
(°C
)
0 1 2 3 4 5 660
70
80
90
100
110
120
130
140
20
25
30
35
40
45
50
55
ST1St2ST3ST4ST5ST6ST7
BDV-31-977-15 Page 68
volume pumped during the injection for all three tendons are shown in Tables below. The
theoretical volume of the pliable filler in the tendon was 96.4 gallons considering 10% of the
volume loss in pumping and change in volume due to temperature.
Table 9—Comparison of theoretical and injected volume for the mockup
Filler material Theoretical volume (gallons)
Injected volume (Gallons)
Percent difference (%)
Visconorust-2090-P 96.4 91.38 (5.21) VZ inject 96.4 95.76 (0.66)
Cirinject CP 96.4 98.75 2.44
BDV-31-977-15 Page 69
9 Summary
In fulfillment of Task 1 for this research project, three alternative filler materials were
selected and tested in a 200 ft mockup tendon to test for constructability and to understand the
nuances of handling and injecting pliable fillers. The tendons were composed of 19 0.6-in.
diameter prestressing strands that were lightly prestressed to ensure that the strands and duct
were positioned as they would be in a fully stressed PT tendon. Temperature and pressure were
measured during and after injection to track the behavior of the materials. The following are
preliminary observations:
• The target injection rate range was 50-80 ft/min. The average injection rate for
Visconorust, VZ inject and Cirinject CP was 49 ft/min, 75 ft/min and 62 ft/min
respectively. Injection rate for Visconorust and Cirinject CP were close to the target
injection rate, while the VZ inject rate was higher.
• Injection rates and venting procedures were varied among the three mockups, primarily
in an effort to determine the most suitable approach. In spite of the variation of
procedures, all of the strands in each of the three specimens were well-coated with filler
material even though the first two tendons injected contained a void at the top of the duct
cross section in the parabolic portion of the mockup. These voids were thought to be the
result of inadequate venting procedures and not the PT system or individual filler
products used. At the completion of these mockup tests, no cause to restrict use of any of
the PT systems or filler products was found.

BDV-31-977-15 Page 70
10 References
American Society for Testing and Materials (ASTM) D 3350, (2012), “Standard specification for
polyethylene plastics pipe and fittings materials”, Pg 2.
Blanchard, B. (2010), “Segmental Bridges – It’s a Construction Technique with Design
Implications: From the Florida Department of Transportation’s Perspective.”
(Presentation)
BS/EN 12201, (2003), “Plastics piping systems for water supply –Polyethylene (PE) – Part 1:
General”.
BS/EN 12201, (2003), “Plastics piping systems for water supply –Polyethylene (PE) – Part 2:
Pipes”.
DYWIDAG SYSTEM INTERNATIONAL (DSI), (2007), “External 19-0.6” MA system 100
assembly drawing”, Drawing: MA 68 19 013.
ETA-06/0226 EOTA (2012), “Post-tensioning kit for prestressing of structures”, 37-38.
ETAG 013 (2002), “Guideline for European Technical Approval of Post-tensioning Kits for
Prestressing of Structures”. European Organisation for Technical Approvals.
FDOT Standard Specification for Road and Bridge Construction, (2013), “Post-tensioning
components”, Rev. 1-1-13.
FHWA International Technology Exchange Program, (2001), “Performance of concrete
segmental and cable-stayed bridges in Europe”.
Freyssinet Prestressing, (2010), “The system of the inventor of prestressed concrete”, pp 8.
Institut français des sciences et technologies des transports, de l'aménagement et des réseaux
(IFSTTAR), 2013, “Wax injection, from a process point of view”, Presentation.
Post-Tensioning Institute (PTI) (2006). “Post-tensioning Manual 6th Edition” pp 59.

BDV-31-977-15 Page 71
V Structural LLC (VSL), (2004), “ECI 6-19 external tendon with bonded anchorage overall
assembly”, Drawing: A153.
VSL International Ltd. (2008), “External Post-tensioning - Design considerations and examples
from the past”.
BDV-31-977-15 Page 95
11 Appendix-A
BDV-31-977-15 Page 96
BDV-31-977-15 Page 97
BDV-31-977-15 Page 98
BDV-31-977-15 Page 99
BDV-31-977-15 Page 100
BDV-31-977-15 Page 101
BDV-31-977-15 Page 102
BDV-31-977-15 Page 103
BDV-31-977-15 Page 104
BDV-31-977-15 Page 105
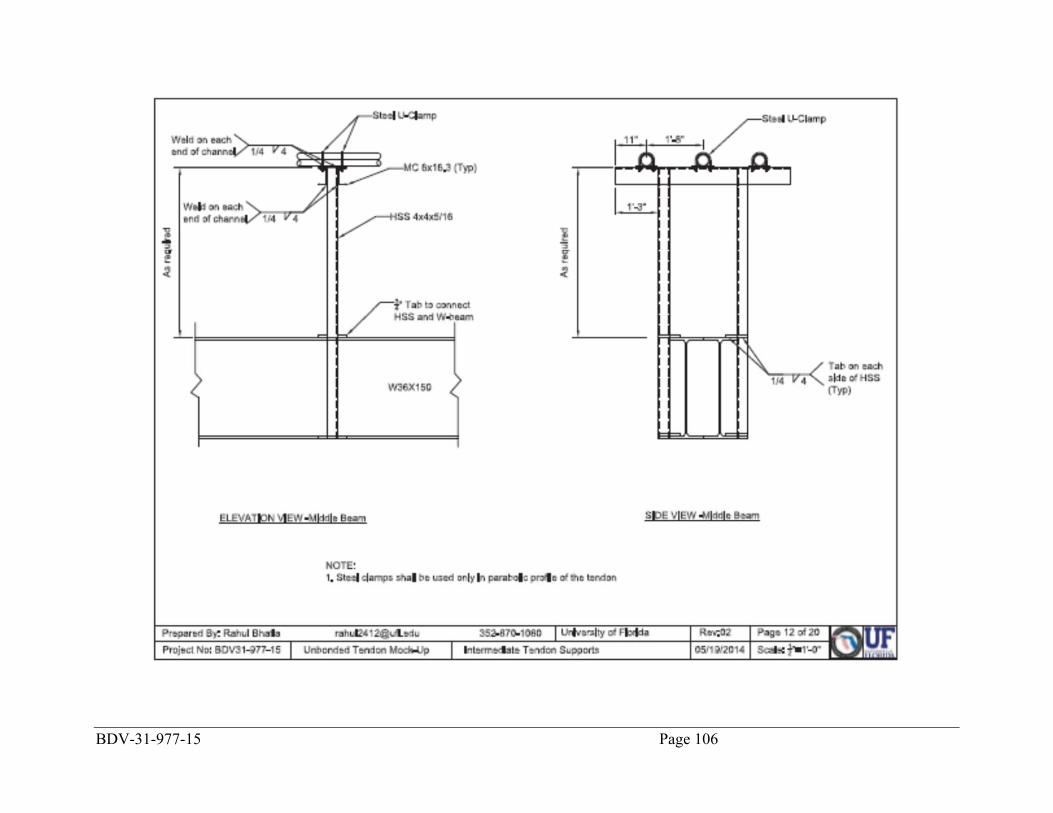
BDV-31-977-15 Page 106
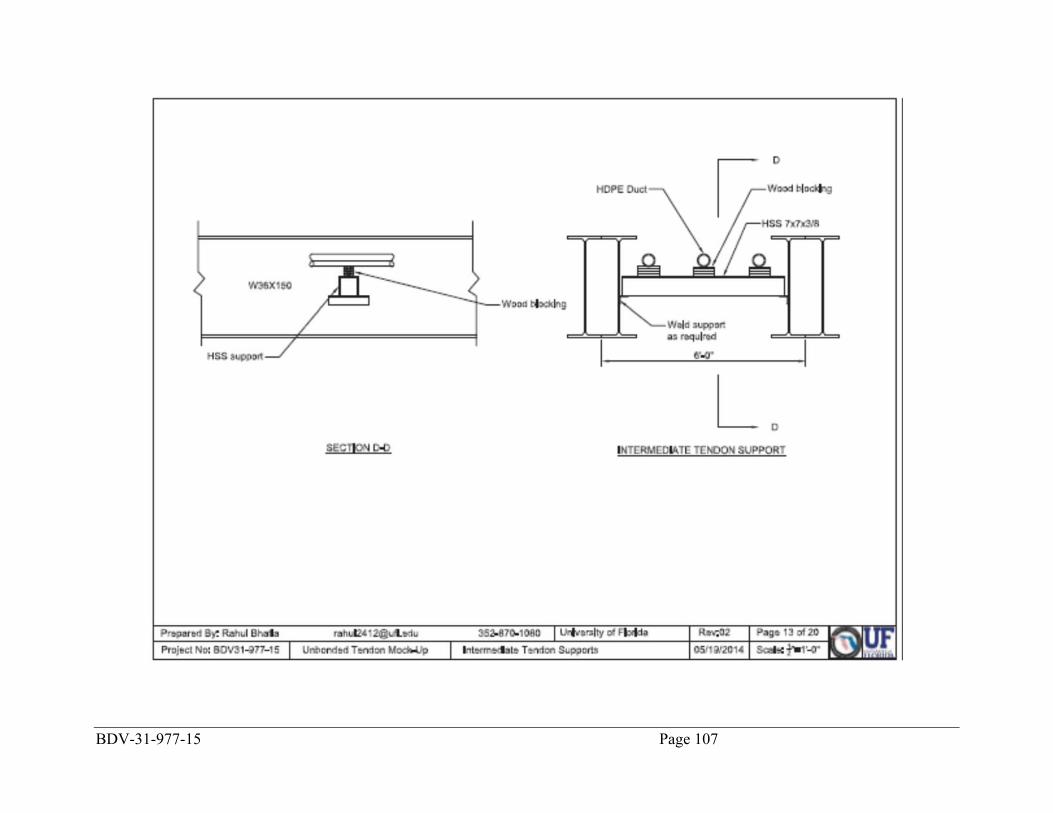
BDV-31-977-15 Page 107
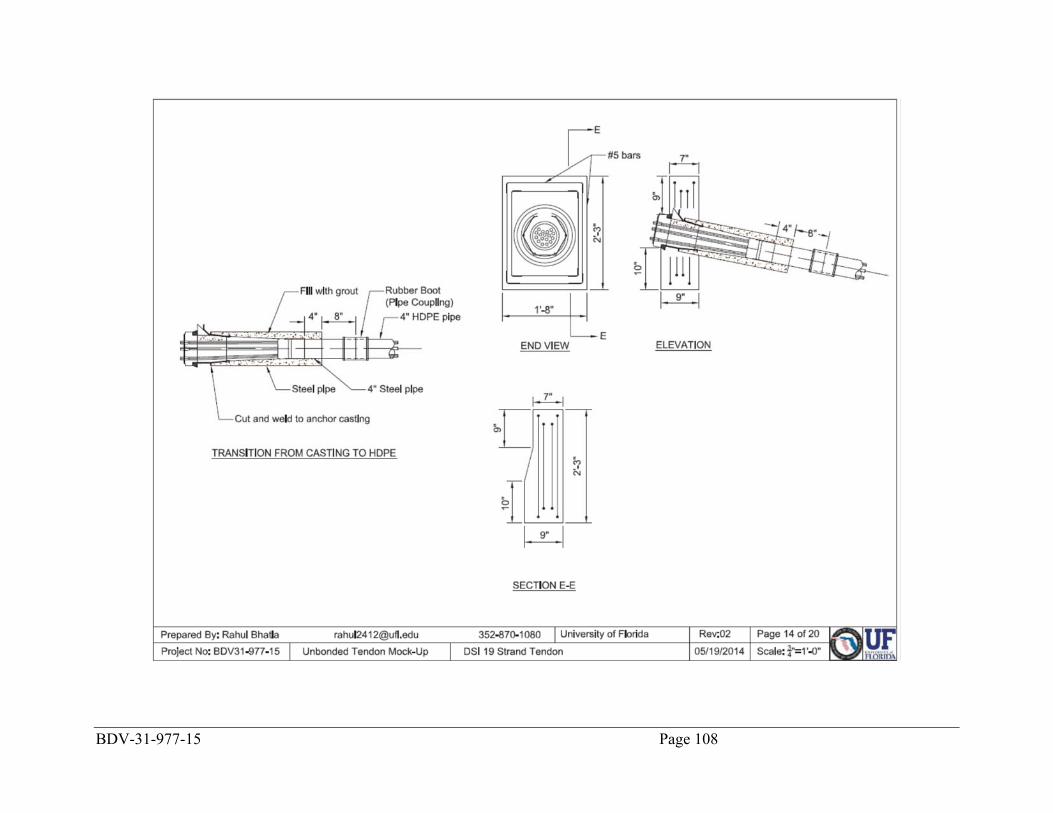
BDV-31-977-15 Page 108
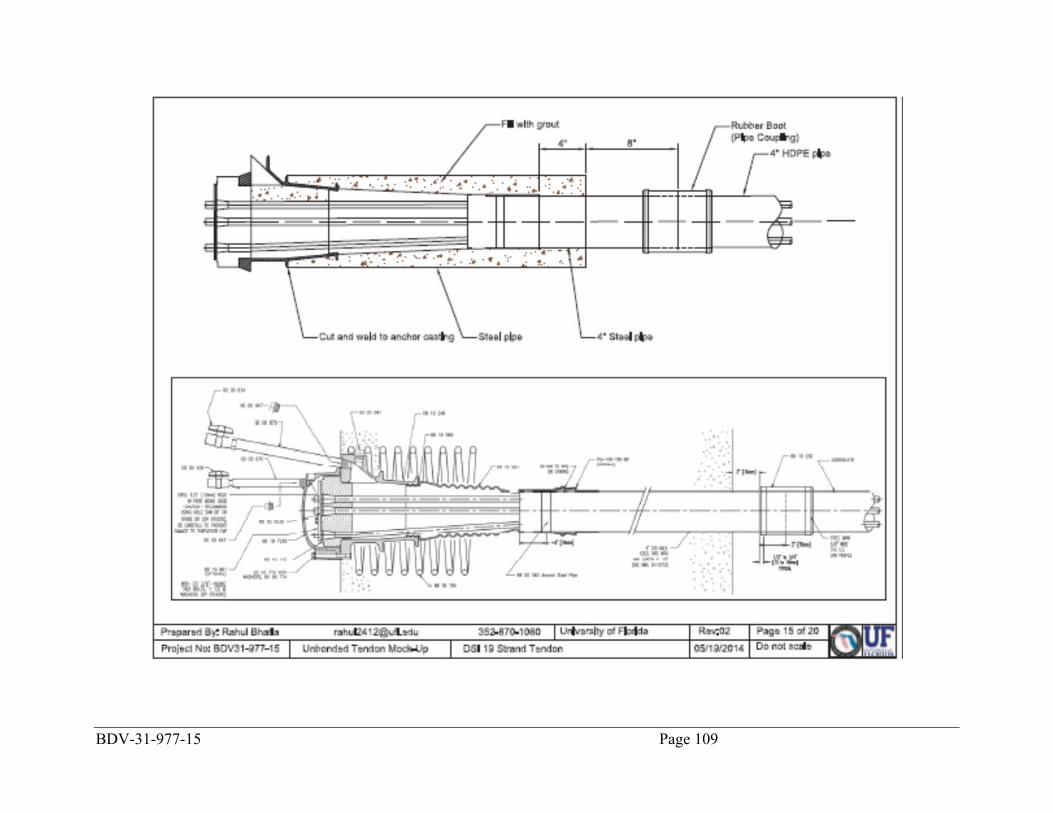
BDV-31-977-15 Page 109
BDV-31-977-15 Page 110
BDV-31-977-15 Page 111
BDV-31-977-15 Page 112
BDV-31-977-15 Page 113
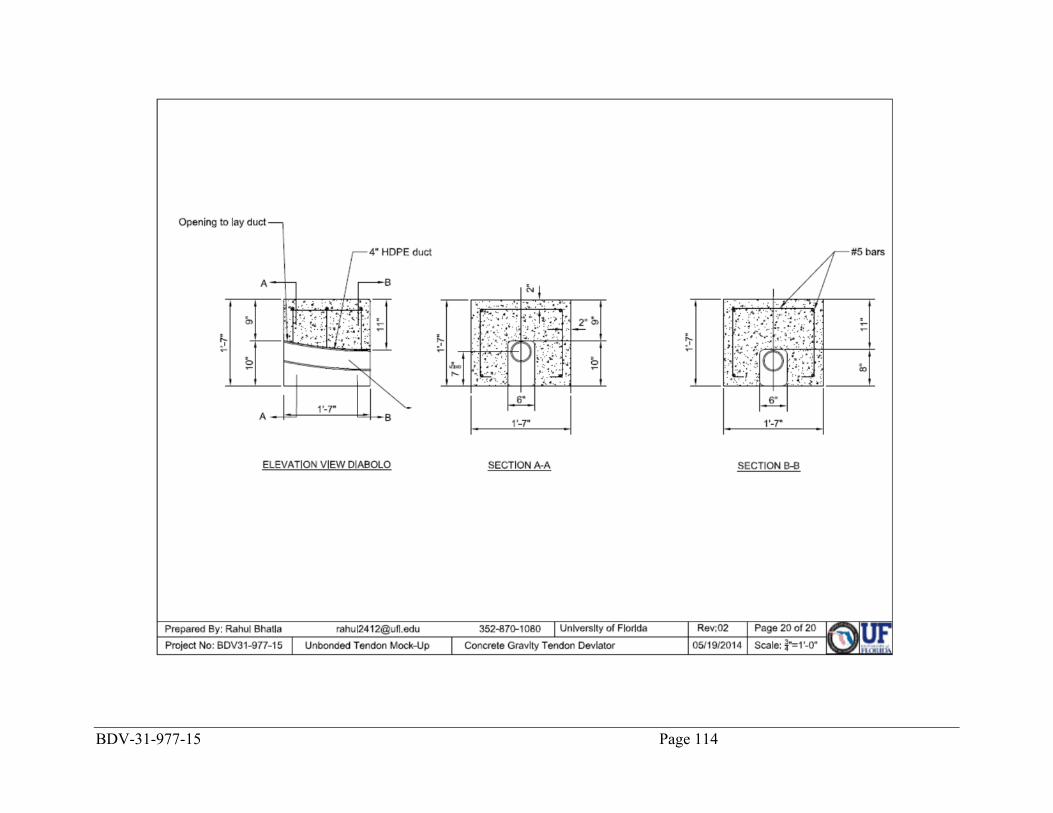
BDV-31-977-15 Page 114