Embed Size (px)
Citation preview

Freight Benefit/Cost Study
Capturing the Full benefits of Freight Transportation Improvements: A Non-Technical Review of Linkages and the Benefit-Cost Analysis
Framework
(Final Report)
Presented to:
Federal Highway Administration Office of Freight Management and Operations
Attn: Ms. Kate Quinn
Presented by the AECOM Team:
ICF Consulting HLB Decision Economics
Louis Berger Group
May 11, 2001

FHWA’s Freight BCA Study Non-Technical Description of the BCA Framework May 11, 2001
TABLE OF CONTENTS
1. INTRODUCTION...................................................................................................... 1
2. ILLUSTRATION OF LINKAGES............................................................................ 6
2.1 The Business World’s View of Logistics: Trends and Developments .............. 6
2.2 Case Histories of Logistics Reorganizations....................................................... 8 2.2.1 Polaroid ........................................................................................................... 8 2.2.2 Dell Computer................................................................................................. 9 2.2.3 Ford Motor Company ................................................................................... 10
2.3 Summary.............................................................................................................. 13
3. FRAMEWORK FOR ECONOMIC ANALYSIS .................................................... 14
4. ESTIMATING QUANTITATIVE VALUES FOR BENEFITS ............................ 20
5. SUMMARY AND NEXT STEPS ............................................................................ 23
APPENDIX A: MORE ON CONSUMERS’ SURPLUS................................................ 25
AECOM Team: ICF Consulting, HLB Decision Economics, Louis Berger Group i
FHWA’s Freight BCA Study Non-Technical Description of the BCA Framework May 11, 2001
LIST OF EXHIBITS
Exhibit 1: Transportation and the Economy.................................................................. 1 Exhibit 2: How do Firms React to Improvements in Freight Transportation?.......... 4 Exhibit 3: Demand Curve for Transportation ............................................................. 17 Exhibit 4: Consumer Surplus for Transportation ....................................................... 26
AECOM Team: ICF Consulting, HLB Decision Economics, Louis Berger Group ii

FHWA’s Freight BCA Study Non-Technical Description of the BCA Framework May 11, 2001
LIST OF TABLES
Table 1: Effects of Improved Freight Transportation................................................. 15
AECOM Team: ICF Consulting, HLB Decision Economics, Louis Berger Group iii

FHWA’s Freight BCA Study Non-Technical Description of the BCA Framework May 11, 2001
1. INTRODUCTION
Transportation policy and planning is not as robust as it should be in relation to the
freight sector. The Federal Highway Administration’s policy and planning institutions
and tools do not appropriately recognize how and why infrastructure design and capacity
problems drive down the productivity of freight transportation and drive up the cost of
industrial production. Likewise, FHWA cannot anticipate readily how infrastructure
improvements would make freight carriers, their industrial customers, and the economy
at large better off. With a significant portion of the focus of transportation policy and
planning shifting to freight-related matters, filling the planning gap is essential.
Improvements in freight carriage can be expected to have important economic effects.
Lower costs or better service, or both, in freight movement have a positive effect on all
firms engaged in production, distribution, trade and/or retail sale of physical goods.
Reducing per-mile cost of goods carriage means that any production or distribution
facility can serve a wider market area, with potential gains from scale efficiencies. It also
means a factory can draw supplies from a wider area with potential gains in terms of the
cost and/or quality of parts and materials coming to the factory.
Beyond lower dollar costs to
shippers, reductions in transit
time and/or increases in
schedule reliability will also
have significant impacts.
These gains in terms of time
allow firms to manage their
inventories and supply chains
more efficiently. Increased
reliability, for example,
reduces the requirement for
“buffer” stocks, inventory
Exhibit 1: Transportation and the Economy
Efficient Transportation Infrastructure Investment
Increased Transportation Capacity, Effi ency, ciReliability, and Level of Service
Transportation Cost Transit Time Savings Business Expansi on(Relocation an Savings (Reliability Improvement) dRestructuring)
Increased Productivity
Increased Competitiveness
Increased Economic Growth
AECOM Team: ICF Consulting, HLB Decision Economics, Louis Berger Group 1

FHWA’s Freight BCA Study Non-Technical Description of the BCA Framework May 11, 2001
held to protect against delivery failure. Lower transit times reduce some costs, e.g.,
drivers’ wages for a given trip length. Further, as with lower dollar costs, less time for a
move extends the “reach” of a factory or warehouse.
In these several ways, freight improvements can spread reductions in cost and gains in
productivity through all the economic sectors that produce or distribute goods (see
Exhibit 1). Improvement in highway-freight carriage is one of the ways that government
can make a truly valuable contribution to the efficiency of the American economy. While
this may seem obvious, the impacts of freight-transportation improvements have been
neglected, or been given scant attention, both in the scholarly literature on social benefits
of highway improvements and in more general discussion.
Regardless of what scholars are writing about, managers of businesses are paying ever
closer attention to efficiency in goods movement and tighter control of inventory and the
whole supply chain. Logistics costs comprise transportation costs, costs of owning and
operating warehouses, ordering costs, and carrying costs of inventory (principally interest
and insurance). In recent years, trucking costs have been falling and reliability has been
improving. Businesses have tended to respond by buying more transportation and using it
to reduce the other components of logistics costs, e.g., through fewer warehouses or
lower inventories. As we shall see, the tendency of managers to respond in this way to
lower costs and/or improved quality of freight transportation is a fundamental source of
benefits from improvements in freight carriage.
The programs of FHWA can contribute to improvements in goods movement in several
ways. Clearly, highway investments that increase capacity and/or speed and reduce
crashes will improve the performance of trucks. Improvements in intermodal connections
will also have an effect. Intelligent Transportation System improvements can be
particularly important, especially when they reduce incident-based congestion. It is clear
that FHWA has a considerable capacity to bring about improvement in highway freight-
carriage. It is entirely appropriate, then, that FHWA seek to measure the benefits
generated by such improvements.
AECOM Team: ICF Consulting, HLB Decision Economics, Louis Berger Group 2

FHWA’s Freight BCA Study Non-Technical Description of the BCA Framework May 11, 2001
The most significant effort to date to study effects of highway improvement on costs and
productivity of U.S. businesses is the work by Professor Ishaq Nadiri of New York
University, sponsored by FHWA. Nadiri’s work showed those effects to be significant.
But his analysis is concerned with the impact of all highway improvements (on a fairly
high-level system) on all businesses. It is not focused on freight movement as such.
Freight carriage is clearly one of the effects that Nadiri captures, but not the only one,
since improvements in highway passenger travel also have effects on business
performance. In any event, Nadiri’s work does not provide a basis for estimating benefits
of future improvements in highway freight-movement. An entirely different approach is
needed, one founded on the precepts of benefit-cost analysis, which is designed to
estimate benefits of proposed investments.
A number of benefit-cost models have been developed for evaluation of highway
investments, but none of them accords proper treatment to the benefits of freight
improvements. In general, the sponsors and authors of these models have been heavily
focused on user benefits for highway passengers and truck operators and have not given
thorough consideration to the economics of freight movement. In the standard models,
the treatment of trucks is parallel to that of passenger cars. Benefits are reckoned on the
basis of reduced travel time, reduced operating costs, and reduced costs from accidents.
Where cost of travel time for a car is based on value of time for the occupants, cost of
travel time for a truck is based on drivers’ wages. In other words, the benefit valuation is
based entirely on reduction in cost to the owner of the truck—in the freight context, the
benefits estimated are the benefits to the carrier. But any effects on the owner of the
cargo—the shipper—are not explicit or may not be fully accounted for in this approach.
Not treating the effects of road improvement on the owners of the cargo moving over the
road is a major omission. Valuing a reduction in truck travel time (referred to as “transit
time” for freight) only by the saving in drivers’ wages implicitly assumes there is no
benefit to the shipper from getting goods to their destination more quickly. Yet it clearly
must make at least some difference to the shipper if cargo is delivered earlier than it
otherwise would be. This would mean, for example, that a larger number of warehouses
could be reached in a day’s drive from a factory, and a larger number of customers could
AECOM Team: ICF Consulting, HLB Decision Economics, Louis Berger Group 3

FHWA’s Freight BCA Study Non-Technical Description of the BCA Framework May 11, 2001
be reached in a day’s drive from a warehouse. As we have already noted, these
extensions of the reach of a manufacturing or stocking facility can lead to gains from
scale efficiencies and, possibly, provide opportunities for reducing total inventory.
Improvements in reliability
can have effects similar to
those of transit-time
reductions and also allow
tighter control of delivery
schedules and inventories all
along the supply chain.
Reliability effects are usually
thought to be stronger than
transit-time effects alone,
Exhibit 2: How do Firms React to Improvements in Freight Transportation?
Improvement in Industry Industrial sNetwork Investment in Reorganization
Connectivity nd Advanced and Enhance aDensity
dProductivity Logistics
Firms reduce stocking points, increase JIT processes, and increase shipping distances
Firms react to reduced late-shipping-delays, valued highly by shippers, by investing more in logistics
Inter-industry trading patterns are affected
according to previous work done by HLB Decision Economics.1 We can include both
effects in the overall term, “time-cost reduction.” When time-cost reductions are strong
enough, they can lead to additional efficiency gains through the “reorganization effect.”
The reorganization effect occurs when a firm’s managers decide that time-cost
reductions, and other savings from freight improvements, are sufficient to increase length
of haul and reduce the number of the firm’s warehouses (see Exhibit 2). In this way, a
firm takes advantage of reduced freight costs to realize scale economies in its warehouses
and reduce inventory. The firm spends more on freight carriage, but the result is a
reduction in total logistics costs. The objective of this study is to capture the benefits of
freight improvements in the standard benefit-cost methodology. The insights discussed
above provide the basis for an analytic framework that can bring the full benefits of
freight improvements into the benefit-cost calculation.
This paper presents the conceptual framework that has been developed for this purpose.
We can build on the conceptual framework to develop a method that is analytically
robust, will yield useful, quantitative results, and will stand up under critical economic
AECOM Team: ICF Consulting, HLB Decision Economics, Louis Berger Group 4

FHWA’s Freight BCA Study Non-Technical Description of the BCA Framework May 11, 2001
review. The material in this paper is presented in five sections—this introduction and four
following sections:
• Section 2: Illustration of Linkages—This section explains and discusses business
managers’ increasing focus on reducing logistics costs while improving service to
customers. Three case histories are presented that provide some insight on the ways in
which businesses reorganize their logistics operations.
• Section 3: Framework for Economic Analysis—Here we present the economic
concepts that will be used to estimate benefits of freight improvements and shows
how those concepts provide a usable framework for the analysis. The concepts are
defined and explained so as to be accessible to non-economists.
• Section 4: Estimating Quantitative Values for Benefits—In this section, we set out the
approach, and related economic concepts, that will allow us to use the framework to
develop quantitative values for benefits of freight improvements. The material is
presented in a manner that makes it understandable for non-economists.
• Section 5: Summary and Next Steps—This section summarizes the analytical
framework and the quantitative approach and identifies the next steps the study team
must take to develop valid, usable estimates of benefits of freight-transportation
improvements.
1 NCHRP 2-17(4) “Measuring the Relationship between Freight Transportation and industry Productivity”, Final Report, HLB Decision Economics Inc., June 1995.
AECOM Team: ICF Consulting, HLB Decision Economics, Louis Berger Group 5

FHWA’s Freight BCA Study Non-Technical Description of the BCA Framework May 11, 2001
2. ILLUSTRATION OF LINKAGES
The purpose of this section is to provide the reader with some specific examples of the
things businesses do when they reorganize and restructure their logistics operations and
the kinds of savings and other benefits that they realize. In the first part we give some
sense of the evolution of business thinking about logistics over the last few decades; in
the next part we offer three short case histories of logistics reorganization carried out by
major corporations: Polaroid Camera, Dell Computer, and Ford Motor Company.
2.1 The Business World’s View of Logistics: Trends and Developments
Since the end of World War II, American businesses have given ever closer attention to
reducing costs and improving performance of their logistics operations. Freight carriage,
inventories, warehouses, and related facilities and operations have come under intense
scrutiny as managers have realized both the potential for savings and for improved
service to customers.
In the 1960s, for example, air lines promoted air freight on the basis of savings that
shippers of high-value merchandise could achieve through reductions in inventory,
warehousing, and materials-handling costs by switching from ground modes to more
expensive, but much faster, air transport. Many shippers found that, in fact, they could
spend more on transportation but achieve a reduction in total logistics costs. Essentially,
they found that the money spent for reduced transit time and increased reliability was
returned to them in lower costs for the other elements of their logistics operations.
Reduction in time costs also provided benefits for customers and expanded sales for
businesses. Markets for perishables such as fresh fruits, vegetables, and cut flowers were
hugely expanded as air transport extended the reach of producers and distributors of these
goods.
Throughout the 1960s business managers and analysts spoke of “physical distribution”
when referring to the logistics operations and facilities that supported the movement of
finished goods along the chain from manufacturers to wholesalers to retailers. Inbound
AECOM Team: ICF Consulting, HLB Decision Economics, Louis Berger Group 6

FHWA’s Freight BCA Study Non-Technical Description of the BCA Framework May 11, 2001
movement of materials and components was seen as a separate subject and was refereed
to in the literature as “physical supply.” This curious distinction vanished in the 1970s,
and all of these activities and issues came under the single label of “logistics,”
presumably borrowed from military parlance.
Concern with finding the least-cost combination of logistics components has long since
spread beyond the distribution of perishable and other very high-value merchandise to
virtually all physical products that must be stored and shipped. The concept of trading
expenditure for increased speed and reliability against expenditure for inventory levels,
number and size of warehouses, and related costs has been well established for some
time. Exploiting reductions in time cost to achieve lower total logistics costs and
improved customer service is the essence of the business response to freight improvement
that we need to examine in this study.
In general, freight transportation costs have been declining in real terms because of
deregulation and the trucking-industry changes it spurred and because of technology and
infrastructure improvements. At the same time, inventory and warehousing costs have
been increasing. The distinct trend has been to spend more on transportation and realize
offsetting reductions in other logistics costs. As transportation costs have decreased
relative to inventory and warehousing costs it has become common place to substitute
transportation for inventory and warehousing to reduce total logistics costs. One result
has been a decline in logistics costs as a relative share of the total costs of business.
Businesses are particularly aware of highway improvements that reduce transit time and
increase reliability. Among other things, increased reliability reduces the amount of
inventory that must be maintained as a buffer against the risk of late or missed deliveries.
Decreases in transit time allow for greater productivity of drivers and extend the reach of
a factory or warehouse. The effective market reach of a warehouse, for example, is often
defined by the round trip that can be completed in one day (in ten hours or less under
current maximum hours of service rules). Decreases in transit time enable greater
distances to be covered and/or more stops to be made, enlarging the market served by the
warehouse. While we write here in terms of distinct effects of speed increases and
AECOM Team: ICF Consulting, HLB Decision Economics, Louis Berger Group 7

FHWA’s Freight BCA Study Non-Technical Description of the BCA Framework May 11, 2001
reliability increases, there is some evidence that business managers view these in a
combined way. A speed increase is of limited value, for example, if reliability is low.
In thinking about business reactions to freight improvements, it is important to bear in
mind that there is a distinct element of “lumpiness” in the ways that firms can respond.
Changing the number, size, and location of warehouses, for example, cannot be done in a
gradual and continuous fashion. Such actions may require major investments; businesses’
discretion in making changes may also be time constrained by factors such as the terms
of leases. Thus, business responses may lag well behind freight improvements in time. It
is also the case that there will be a minimum gain, or threshold, in terms of cost reduction
and time improvement that managers must see before they make major responses to a
freight improvement.
2.2 Case Histories of Logistics Reorganizations
2.2.1 Polaroid
In the late 1980s Polaroid decided to centralize its European inventories by substituting
transportation for warehousing; a large number of warehouses were closed. Estimated
annual gross savings were $6.9 million, broken down as follows:
1. warehousing personnel—$2.5 million;
2. inventory carrying costs—$2.2 million;
3. warehouse rental costs—$1.0 million;
4. facilities and offices—$0.6 million;
5. internal transportation between dealers and subsidiaries—$0.5 million; and
6. insurance premiums—$0.1 million.
Net annual savings were $6.3 million after subtracting $0.6 million per year for increased
costs resulting from computer system maintenance and increased warehouse personnel at
headquarters. A capital investment of $3.0 million for new computer equipment was
required.
AECOM Team: ICF Consulting, HLB Decision Economics, Louis Berger Group 8

FHWA’s Freight BCA Study Non-Technical Description of the BCA Framework May 11, 2001
Besides these savings that Polaroid could quantify, there were other gains that were not
measured. Prior to centralizing inventory, 69 percent of orders could not be filled at the
location that received them, so that items were backordered until they could be filled
from other locations. This required significant internal transportation among dealers and
subsidiaries to reposition inventory. Polaroid also achieved unspecified freight cost
savings based on volume discounts for consolidated (truckload) shipments to centralized
warehouses as well as reduced freight rates that reflected truck cost savings from
reduction of border crossing inefficiencies.
2.2.2 Dell Computer
In 1996 Dell Computer launched its “on-line” store. Customers were able to choose their
own computer configurations and to receive 24-hour support on line. When an on-line
order is received, the configuration of the desired computer is immediately transmitted to
the manufacturing group. Using a specification sheet the order is broken down to
individual components. Components are either ordered for just-in-time (JIT) delivery on
very short notice or drawn from relatively small stocks that are replenished on a JIT
basis. The computer is assembled by a production team and then shifted to software
loading where it is tested for between four to eight hours. The entire process from receipt
of order to shipping requires about 36 hours. Dell would not be able to achieve this
combination of rapid response and low level of inventory without a very high level of
freight service from United Parcel Service (UPS) under a comprehensive contract
covering all inbound movements of parts, in addition to a sophisticated, computer-based
communications system.
The on-line store concept was a revolutionary precedent for the computer industry that
had been dominated by manufacturers with complex supply chains and relatively large
inventories of parts and computers. By building to order and outsourcing most
components, Dell gained a major cost advantage by greatly reducing parts inventories
and virtually eliminating stocks of finished machines. Dell effectively became little more
than an assembly and shipping company.
AECOM Team: ICF Consulting, HLB Decision Economics, Louis Berger Group 9

FHWA’s Freight BCA Study Non-Technical Description of the BCA Framework May 11, 2001
The JIT system for parts delivery allows Dell to reduce inventory of components from an
industry norm of 75 to 100 days to 6.6 days. Suppliers are integrated into Dell’s on-line
ordering and procurement system resulting in a span of fifteen minutes for most suppliers
between receipt of order and shipment to Dell’s assembly plant. Shippers of monitors, for
example, receive an e-mail giving the day a customer’s order is to be shipped, and the
monitor is delivered on that day. Dell estimates that they save $30 per monitor by
virtually eliminating inventory.
Dell’s build-to-order approach is of particular significance in an industry characterized by
continuous innovation and introduction of new products. Since prices of components
decline rapidly in response to continuous innovation, Dell derives a cost advantage from
the fact that most components are not bought until an order is received.
The Dell JIT system of procurement and on-line ordering typifies the virtual substitution
of transportation and communications for inventory. It would not be possible without the
availability of very high-quality freight transportation services.
2.2.3 Ford Motor Company
Ford presents another example of using communication and transportation improvements
to establish closer links to the customer and reduce inventory. The transportation-
improvement stimulus came from cost and service gains realized from sharply increased
use of rail service. Railroads went from moving very few new vehicles from assembly
plants to a dominant share (over 80 percent) of this market. For example, in 1980
railroads handled 342,000 carloads of vehicles compared to 609,000 carloads in 1990.
Since 1990 annual movements of finished vehicles have increased to nearly 900,000.
This is a case in which a shipper reorganized its logistics to exploit fully the financial
advantages of a low-cost mode while improving service to customers.
Several trends have favored increased use of rail movements of finished automobiles and
light trucks in the U.S.
• Domestic vehicle production has grown largely as a result of foreign transplants and
resulting decreases in imports with a more recent shift to exports.
AECOM Team: ICF Consulting, HLB Decision Economics, Louis Berger Group 10

FHWA’s Freight BCA Study Non-Technical Description of the BCA Framework May 11, 2001
• The mixture of new vehicles shipped has changed in the direction of more light
trucks, which tends to favor rail for shipments from factories because the cubic-space
requirements of light trucks and sport utility recreational vehicles are better met by
rail cars.
• North American assembly plants, with the exception of recent rail served expansions
in Mexico, have remained relatively concentrated in the Midwest and southern
Ontario at rail-competitive distances from major coastal markets.
The Big Three did not respond to the service characteristics of rail shipment in any
substantial way until 1997. Commencing in 1997 both Ford and GM announced
sweeping changes in how new vehicles were to be distributed from assembly plants to
domestic markets. Ford moved to implement a “regional mixing center” concept.
The stated reasons for the changes in distribution of finished automobiles were to reduce
the costs of inventories and transportation and improve services and sales to dealers and
customers. Ford was seeking to reduce order delivery time for new vehicles from 72 days
to 30 days by 1997 and then to 15 days by 1999. Chrysler has announced similar
objectives to deliver all orders within 28 days and sold orders within 16 days. GM has
already established 24-hour delivery for its Cadillac line by creating ten regional
distribution centers from which dealer orders can be filled in 24 hours.
Ford has created four national mixing centers at Chicago; Shelbyville, Kentucky; Kansas
City, Missouri; and Fostoria, Ohio. Ford has an exclusive contract with Norfolk Southern
Railway under which NS constructs and operates these sites. Each mixing center
performs the function of a logistics distribution center by creating an assortment of
vehicles that can be shipped to dealers in full rail cars or trucks to destination markets.
The mixing centers replace a push distribution system in which dealer orders for different
lines of vehicles were accumulated at particular assembly plants until a sufficient quantity
existed to fill an entire rail car (ten to twenty vehicles, depending on size) or truck (five to
ten vehicles, depending on size) for shipment to the local market. Instead of waiting for
sufficient dealer orders to fill rail cars and trucks, each assembly plant will make daily
shipments to the mixing centers. The mixing centers will receive shipments from
AECOM Team: ICF Consulting, HLB Decision Economics, Louis Berger Group 11

FHWA’s Freight BCA Study Non-Technical Description of the BCA Framework May 11, 2001
different assembly plants. Rail cars and trucks will be unloaded and reloaded with a
unique assortment for destination markets, reflecting orders by local area dealers.
Vehicles will normally be held at the mixing center only as long as necessary for
transloading. It is estimated that vehicles will be received at the mixing centers, unloaded,
reloaded and shipped within eight to 24 hours.
The properties acquired for the Ford mixing centers range in size from 300 to 700 acres.
The actual property to be used for automobile distribution will vary from 125 to 180
acres, averaging about 150 acres. The remaining acreage will be held as a combination of
buffer or for other developments. It is anticipated that other manufacturers will also use
the mixing centers as one mechanism to lower throughput costs. In some instances the
development costs have been substantial. For example, NS has purchased nearly 700
acres at Shelbyville, KY to develop a 125-acre mixing facility for Ford. Ideally, about
300 to 400 acres would have been acquired but several large parcels had to be acquired in
their entirety, necessitating a total land acquisition expense of nearly $10 million. The
Shelbyville center has parking spaces for nearly 3,000 vehicles and employs nearly 200
persons. The Ford distribution center concept has been adopted to achieve economies of
transportation time by maximizing trainload and truckload movements of vehicles from
all plants to the centers and from centers to local markets.
The four Ford mixing centers will handle over 3.2 million new vehicles a year. The
mixing center concept also appears to have achieved substantial transportation cost
savings for Ford. Exclusive rail access to each center was put out for competitive bid
among three railroads. NS was the low bidder and serves all four sites. As a result NS can
expect to handle almost all of Ford’s business in these markets albeit at a substantial
discount.
Through a major restructuring of its logistics operations and facilities, Ford was able both
to reduce transportation costs and inventory costs while improving service to its
customers.
AECOM Team: ICF Consulting, HLB Decision Economics, Louis Berger Group 12

FHWA’s Freight BCA Study Non-Technical Description of the BCA Framework May 11, 2001
2.3 Summary
Two of these cases, Polaroid and Dell, illustrate a point that is at the heart of our
analytical framework—that businesses will increase expenditure on freight
transportation, buy more freight service, and thereby achieve a reduction in total logistics
costs because of savings in inventory and warehouses. And this is done in ways that
improve customer service. Ford found savings in both freight costs and other logistics
costs. The auto maker responded to the stimulus of improved rail service by switching to
a lower-priced mode and using it more efficiently to cut inventory costs and reduce the
time required to respond to customers’ orders. Perhaps the central point is that real-world
firms are alert for opportunities to improve theirs logistics systems and will act when they
find the price and quality of transportation makes it feasible to do so.
In the following section, we see how this readiness to respond to better transportation can
be expressed in formal economic logic and how the degree of business response becomes
the keystone of our analytic framework.
AECOM Team: ICF Consulting, HLB Decision Economics, Louis Berger Group 13
FHWA’s Freight BCA Study Non-Technical Description of the BCA Framework May 11, 2001
3. FRAMEWORK FOR ECONOMIC ANALYSIS
Standard approaches to highway benefit-cost analysis do not include the full stream of
benefits specific to freight carriage (e.g., benefits stemming from business reorganization
effects). A standard analysis of a highway investment takes account of benefits to
immediate highway users: time savings, reduction in operating costs, and reduction in
accident costs. Benefits from savings in truck travel time are calculated with an estimate
of the average wage of the drivers. In the context of freight benefits, these are benefits to
the owner of the truck (the carrier), but they do not include benefits to the owner of cargo
(the shipper).
Costs of truck operation do not, however, provide a sufficient means of estimating the
value of time in freight carriage; the impact on the shipper must be included as well. In
industries with relatively high logistics costs, the greater share of gains from freight
improvement may well go to the shipper rather than the carrier. Time-cost reductions—
reductions in transit time and increases in reliability—have substantial value for shippers.
These values need to be estimated and added to the benefits treated in the standard
analysis in a manner that appropriately deals with potential double counting issues.
But that is, by no means, the whole story of bringing freight into the benefit-cost
framework. There are significant effects of freight improvements beyond the immediate
cost reductions for carriers and shippers. Improvements in the freight-movement system
may allow companies to change their modes of operation in ways that lead to further
gains in productivity. In a paper written over thirty years ago, Herbert Mohring and
Harold Williamson referred to this as the “reorganization effect.” Improved
transportation may let firms realize economies of density or scale, for example, by
building bigger plants, warehouses, or stores, because a single facility can serve, or draw
supplies from, a larger area owing to better transportation.
Much of a firm’s response to transportation-cost reduction will be reorganization of its
logistics. It will respond to the lower costs by moving goods longer distances, using
fewer warehouses, and carrying less inventory for a given level of sales. It will buy more
AECOM Team: ICF Consulting, HLB Decision Economics, Louis Berger Group 14

FHWA’s Freight BCA Study Non-Technical Description of the BCA Framework May 11, 2001
transportation and realize gains from improved logistics. But firms can make other
changes in the ways they do things; lower costs might lead to product improvements, for
example. We need to be clear about the different kinds of effects that may flow from
freight-transportation improvement; they have to be treated differently in the analysis.
The following classification scheme is helpful.
Table 1: Effects of Improved Freight Transportation First-order Benefits Immediate cost reductions to carriers and shippers, including gains to
shippers from reduced transit times2 and increased reliability. Second-order Benefits Reorganization-effect gains from improvements in logistics3. Quantity of
firms’ outputs changes; quality of output does not change. Third-order Benefits Gains from additional reorganization effects such as improved products,
new products, or some other change. Other Effects Effects that are not considered as benefits according to the strict rules of
benefit-cost analysis, but may still be of considerable interest to policy-makers. These could include, among other things, increases in regional employment or increases in rate of growth of regional income.
The first part of the Freight BCA Study is concerned with the first and second-order
benefits of improved freight transportation. At this stage, we are, thus, concerned with
immediate cost reductions, including time-cost reductions for shippers, and with
reorganization-effect improvements in logistics. The challenge is to bring the first and
second-order benefits together in such a way that they are fully counted, but nothing is
counted twice.
In the first-order case, nothing changes for shippers except the cost of freight movement
(including time cost). They continue to ship the same volume of goods the same distance
between the same points. Their costs are less, but they make no response to the cost
reduction other than to keep the extra income thus realized. In order to estimate the first-
2 Carrier effects include reduced vehicle operating times and reduced costs through optimal routing
and fleet configuration. Transit times may affect shipper in-transit costs such as for spoilage, and
scheduling costs such as for inter-modal transfer delays and port clearance. These effects are non-
linear and may vary by commodity and mode of transport.
3 Improvements include rationalized inventory, stock location, network, and service levels for
shippers.
AECOM Team: ICF Consulting, HLB Decision Economics, Louis Berger Group 15

FHWA’s Freight BCA Study Non-Technical Description of the BCA Framework May 11, 2001
order benefits, it is necessary to find the value of the time-cost reductions and then add
this amount to those that are calculated in a standard analysis—reductions in operating
costs, cost savings from reductions in accidents, and drivers’ wages—all assuming no
change in volumes or distances shipped.
In the second-order case, firms respond to the cost reduction. They may reduce prices to
gain additional revenue by selling more goods; they may ship longer distances; they may
close some warehouses; they may do some combinations of these things; or they may do
something else altogether. The first-order case, taken by itself, is an unrealistic scenario.
In the real world, a firm would make some kind of response to any noticeable cost
reduction. We make the conceptual separation between the first and second-order cases
because it helps us follow the path of causality and because it helps us fit these
phenomena into the economic concepts of supply and demand. Cost reductions of a
certain magnitude occur; firms respond in ways that lead to both greater output and lower
cost per unit of output.
We look at demand for freight carriage from the viewpoint of the consumer of freight
transportation, i.e., the shipper. A shipper’s response to the change in freight-movement
cost is determined by the conditions of its demand for freight transportation. A shipper’s
demand for freight transportation reflects both the market’s demand for the firm’s
products and the way in which it uses freight transportation as an input to its production
and/or distribution processes.
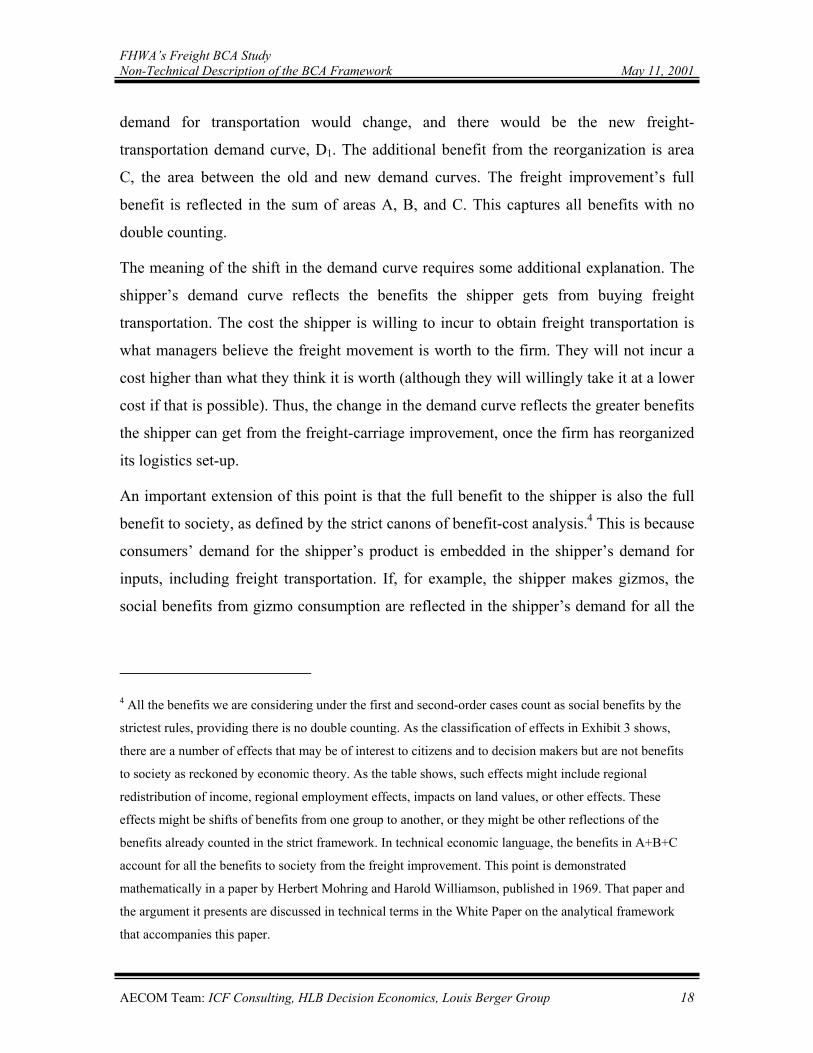
The conditions of demand are embedded in a curve or equation called a “demand curve.”
In our context, the curve shows the amount of freight transportation a firm will buy at
various levels of freight cost, including time costs. The demand curve in Exhibit 4 takes
two forms, D0 and D1. D0 shows the firm’s demand for freight transportation before the
improvement takes place. The new curve, D1, shows the change in demand that follows
the improvement. But the change in demand is not immediate; it reflects a firm’s
response to the cost reduction, a response that will occur over some considerable period
of time
AECOM Team: ICF Consulting, HLB Decision Economics, Louis Berger Group 16

FHWA’s Freight BCA Study Non-Technical Description of the BCA Framework May 11, 2001
AB C
Cost perVehicle Mile
Vehicle Milesper Year
C0
C1
VM0 VM1 VM2
D0
D1
Exhibit 3: Demand Curve for Transportation
Recall that a shipper’s demand for freight transportation reflects both the market’s
demand for the firm’s products and the way it uses freight transportation as an input. The
market demand for the products is not affected by the freight improvement, nor, at the
first instance, is the way the firm uses freight transportation. The way a shipper uses
freight transportation refers to its basic logistical arrangements, especially number and
location of warehouses. The shipper’s reaction to the cost reduction can be thought of as
occurring in three phases, as illustrated in Exhibit 3.
Exhibit 3 shows the cost reduction from C0 to C1 on the vertical axis. In the very short
run, the shipper makes no response and continues to buy the same number of vehicle
miles of freight, VM0. The benefit to the shipper is the area A, the cost reduction with the
existing volume of freight. In the next phase of response, the shipper takes advantage of
the lower cost and buys more freight movement, VM1. This adds the area B to the
benefit. But this still reflects the shipper’s original demand curve, D0. The shipper has not
made any changes in the firm’s basic logistical arrangements.
But, after managers have had time to consider the cost reduction, they may, as already
noted, make changes in their basic logistical arrangements. This is when the shipper’s
AECOM Team: ICF Consulting, HLB Decision Economics, Louis Berger Group 17
FHWA’s Freight BCA Study Non-Technical Description of the BCA Framework May 11, 2001
demand for transportation would change, and there would be the new freight-
transportation demand curve, D1. The additional benefit from the reorganization is area
C, the area between the old and new demand curves. The freight improvement’s full
benefit is reflected in the sum of areas A, B, and C. This captures all benefits with no
double counting.
The meaning of the shift in the demand curve requires some additional explanation. The
shipper’s demand curve reflects the benefits the shipper gets from buying freight
transportation. The cost the shipper is willing to incur to obtain freight transportation is
what managers believe the freight movement is worth to the firm. They will not incur a
cost higher than what they think it is worth (although they will willingly take it at a lower
cost if that is possible). Thus, the change in the demand curve reflects the greater benefits
the shipper can get from the freight-carriage improvement, once the firm has reorganized
its logistics set-up.
An important extension of this point is that the full benefit to the shipper is also the full
benefit to society, as defined by the strict canons of benefit-cost analysis.4 This is because
consumers’ demand for the shipper’s product is embedded in the shipper’s demand for
inputs, including freight transportation. If, for example, the shipper makes gizmos, the
social benefits from gizmo consumption are reflected in the shipper’s demand for all the
4 All the benefits we are considering under the first and second-order cases count as social benefits by the
strictest rules, providing there is no double counting. As the classification of effects in Exhibit 3 shows,
there are a number of effects that may be of interest to citizens and to decision makers but are not benefits
to society as reckoned by economic theory. As the table shows, such effects might include regional
redistribution of income, regional employment effects, impacts on land values, or other effects. These
effects might be shifts of benefits from one group to another, or they might be other reflections of the
benefits already counted in the strict framework. In technical economic language, the benefits in A+B+C
account for all the benefits to society from the freight improvement. This point is demonstrated
mathematically in a paper by Herbert Mohring and Harold Williamson, published in 1969. That paper and
the argument it presents are discussed in technical terms in the White Paper on the analytical framework
that accompanies this paper.
AECOM Team: ICF Consulting, HLB Decision Economics, Louis Berger Group 18

FHWA’s Freight BCA Study Non-Technical Description of the BCA Framework May 11, 2001
inputs necessary to make gizmos.5 Whatever benefits are realized by gizmo consumers
are captured in the gains to the shipper, as measured by the combination of the reduction
in costs (area A) and the increase in the shipper’s consumer surplus (areas B and C).6
(Please note that what is being measured here is not the increase in the shipper’s profits.
That is something different.)
Note that most of the discussion here is in terms of one firm buying freight carriage. The
economic concepts set out here will apply with equal validity to many firms—all the
firms, for example, affected by a freight-transportation improvement. We have developed
a sound conceptual framework for the Freight BCA. We need a method for estimating the
actual values that go with these theoretical constructs.
5 When we refer to “social benefits” here, it should be understood that we refer to the gross benefits of the
freight improvement without subtracting costs to arrive at a net figure. Our underlying theoretical argument
says there are no external benefits, all benefits are captured in the shippers’ demand curves. When, in a
later stage, we address costs, we will definitely find external costs that have to be added to the calculation.
6 The economic concept of consumers’ surplus reflects the fact that the total amount consumers pay for a
particular good or service is less than what that good or service is actually worth to them. Different people
will place a different value on a good. But, generally speaking, sellers are unable to discriminate among
buyers according to their different values. The price prevailing in a market reflects the value placed on a
good by that consumer (or consumers) who, among those who are buying, places the least value on that
good, the “marginal consumer.” Others buying would be willing to pay more. For these consumers, there is
a surplus, the difference between the price they pay and the actual value to them. See Appendix A for more
on consumers’ surplus.
AECOM Team: ICF Consulting, HLB Decision Economics, Louis Berger Group 19

FHWA’s Freight BCA Study Non-Technical Description of the BCA Framework May 11, 2001
4. ESTIMATING QUANTITATIVE VALUES FOR BENEFITS
In the previous section, we explained that the shift in a shipper’s demand for freight
transportation would be the conceptual basis for estimating the benefits from a freight
improvement. With the theoretical foundation in place, we turn to the problem of
estimating actual values. It is one thing to build a framework of abstract reasoning on a
demand curve as a theoretical construct; it is quite another thing to develop an empirical
estimate of a demand curve or of a shift in a demand curve.
The approach that we have chosen to this empirical problem is based on a mathematical
relationship that economists call “elasticity” of demand. If you know the price at which a
good or service is actually being sold, and the quantity that is being sold at that price, and
you know the elasticity of demand, then you have a great deal of information about the
demand curve. For our purposes, elasticity of demand has two virtues: it provides useful
information on demand, and therefore on benefits; and it may be feasible to estimate it.
Elasticity may be thought of as a measure of responsiveness. Elasticity of demand has to
do with the response of demand for a good to a change in the price of that good (or
service)—more precisely, it is a relationship between a change in price and the associated
change in quantity sold.7 Elasticity may be applied to other economic phenomena.
Economists often investigate elasticity of costs, for example, with respect to other
variables that may be of interest.
For our purpose of benefits estimation, we are concerned with the elasticity of demand
for freight transportation with respect to the cost of freight transportation, cost including
time costs. (The full mathematical argument in support of this point is set out in the
White Paper, and there is no need to repeat it here.) The value of this elasticity can be
known from the values of two other, related elasticities. One is about how shippers’
7 An elasticity is a ratio of percentages. In general, one speaks of the elasticity of y with respect to x when
one is interested in the response of y to a change in x. The elasticity is the ratio of the percentage change in
y to the percentage change in x.
AECOM Team: ICF Consulting, HLB Decision Economics, Louis Berger Group 20

FHWA’s Freight BCA Study Non-Technical Description of the BCA Framework May 11, 2001
demand for freight transportation responds to changes in time costs—elasticity of
demand with respect to time costs. The other is about how shippers’ logistics costs
respond to changes in time costs—elasticity of logistics costs with respect to time costs.8
Intuitively, it seems reasonable that the response of shippers’ demand and shippers’
logistics costs to changes in time costs should be key factors in estimating benefits, and
the mathematical argument in the White Paper demonstrates this point. Further, there is
some prior experience in trying to estimate elasticity of cost with respect to time cost. As
part of work done under NCHRP 2-17(4) [2], HLB Decision Economics developed a
method for estimating the elasticity of logistics costs with respect to time costs. It appears
feasible that the same method could be used for estimating elasticity of demand for
freight transportation with respect to time costs.
The method used in 2-17(4) [2] was essentially one of very detailed interviews with
representatives of a number of firms, the representatives being executives with close
knowledge of their firms’ logistics arrangements and likely investment strategies in the
face of falling costs of freight carriage. The degree of time cost reductionreduction in
transit time and gain in reliabilityrequired to cause a firm to make the investments
required to reduce the number of its warehouses and increase their size is the most critical
piece of information required for estimating both elasticity of logistics costs and elasticity
of freight-transport demand with respect to time costs. Obtaining this information in
sufficient detail and for a large enough sample of firms is probably the most challenging
task confronting the team as we move forward into the data-gathering effort.
A number of other data items are also essential for this effort. The following is a partial
enumeration of the most important information needs.
• Direct time-cost savings, from transit-time savings and increased reliability, due to
highway improvements, and indirect savings from logistics reorganization effects;
• The threshold of time-cost savings at which reorganization would occur;
8 “Time cost,” as used here, is a composite value reflecting both transit time and reliability. A decrease in
transit time is a decrease in time cost. An increase in reliability is also a decrease in time cost.
AECOM Team: ICF Consulting, HLB Decision Economics, Louis Berger Group 21

FHWA’s Freight BCA Study Non-Technical Description of the BCA Framework May 11, 2001
• The elasticity of logistics costs with respect to time-cost savings (derived from the
above two items);
• Current level of firms’ demand for freight transportation and elasticity of freight-
transportation demand with respect to time-cost savings (also closely related to the
first two items);
• Volume of freight traffic and product movement across transportation links by
commodity and market; and
• Average travel time and variability following highway improvements, or other policy
actions, for various transportation network links and nodes—other policy actions
could include such changes as relaxed weight or height restrictions, port clearance
characteristics, or the like.
Much of these data would be initially collected at the level of individual firms and then
aggregated by type of industry. As noted above, the information would be obtained in
detailed interviews with executives of firms that buy freight transportation, executives
closely acquainted with logistics operations and strategy and likely investment strategy
for achieving increased savings through improved logistics. This line of research would
be based on sophisticated interview techniques and employ what are known as stated-
preference methods. Stated preference involves designing interviews so as to elicit
quantitative information from respondents on choices they would make when confronted
with various changes in their business environments.
What we sketch out here is the overall strategy in terms of the kind of information needed
and the general approach to obtaining it. Working out the details of the information-
gathering process is the next major step for the study team, and it will be a challenging
task. It will be necessary to find a substantial number of business executives who are
willing to participate in the study and willing to share some detailed information on their
firms’ business operations.
AECOM Team: ICF Consulting, HLB Decision Economics, Louis Berger Group 22

FHWA’s Freight BCA Study Non-Technical Description of the BCA Framework May 11, 2001
5. SUMMARY AND NEXT STEPS
To recapitulate, the approach to estimating benefits of freight-transportation
improvements depends on determining the value of those improvements to the businesses
that buy freight-transport services, businesses engaged in the production, distribution,
and/or retail sale of physical goods. The earlier work of Herbert Mohring has
demonstrated, to the satisfaction of the economics profession, that the full benefit to
society from improved freight movement can be estimated on the basis of the reduced
costs to these businesses and their responses to those cost reductions. This is because the
benefits that businesses get from better freight transportation reflect the benefits to their
customers as well as to themselves.
Setting aside the technical jargon of economics, we see that the gains to shippers and
their customers are what we need to measure to estimate the benefits from freight
improvement. These gains take the form of immediate cost reductions from the freight
improvement and subsequent gains from logistics reorganization. Some of the cost
reductions achieved in this manner are passed through to the shippers’ customers with
some resulting increase in output. These are the sources of benefits.
Much of this discussion of our approach to estimating benefits has centered on the
economic concept of elasticity. Again, however, we can set economic jargon aside and
say that the key to measuring gains from freight improvement is in measuring the degree
or the intensity of shippers’ responses to freight improvements, particularly their
responses to time saving and enhanced reliability. The technical economic arguments
make this point with mathematics, but it is intuitively clearthe degree of businesses’
response to freight improvements shows how much those improvements mean to shippers
and their customers.
What this tells us is that the approach we have developed is both intuitively satisfying
and supported by mathematical reasoning. The task now before us is to learn enough
about businesses' responses to freight improvements so that we can develop accurate
estimates of benefits. This task is challenging but certainly achievable. Two large pieces
AECOM Team: ICF Consulting, HLB Decision Economics, Louis Berger Group 23

FHWA’s Freight BCA Study Non-Technical Description of the BCA Framework May 11, 2001
of the work will be: (1) establishing the necessary contacts; and (2) designing the
interviews and developing the related stated-preference techniques that will elicit the
information required for the study.
Establishing the necessary contacts is not just a matter of finding a sufficient number of
firms that are willing to participate in the study. It will also be necessary to identify “key
informants,” managers and analysts who are closely acquainted with their firms’ logistics
operations and strategic thinking about improving logistics.
The required stated-preference toolsinterview designs, focus-group structures, and the
likewill have to be developed in a way that keeps the whole process focused on the key
parameters necessary to estimate benefits in dollar terms.
In carrying out these tasks, we remain mindful that others have conducted investigations
in this area, and we will use their work to supplement and support our efforts to the
maximum feasible extent. In particular, this means gleaning the literature for quantitative
work that is directly relevant to this inquiry and developing, where feasible, numbers that
reflect the consensus of previous work. In technical terms, this is called “meta analysis”:
a process of surveying individual quantitative studies and combining their independent
estimates into a single estimate that is a useful synthesis of the various studies.
By assiduously working along all of these paths, we expect to develop an analytical
apparatus that will yield useful, albeit approximate, estimates of the benefits of freight
transportation.
AECOM Team: ICF Consulting, HLB Decision Economics, Louis Berger Group 24

FHWA’s Freight BCA Study Non-Technical Description of the BCA Framework May 11, 2001
APPENDIX A: MORE ON CONSUMERS’ SURPLUS
In competitive markets, the intersection of the supply and demand curves for some
commodity—say gizmos—determines both its market price and the quantity that is
transferred from seller to buyer during some time period. A gizmo’s price is the
additional or marginal cost to some firm in producing what is, in a sense, the last gizmo
manufactured today. The price is simultaneously the value its buyer attaches to today’s
last gizmo. If its price were just a tiny bit higher, this last buyer would not have taken
today’s last gizmo. Similarly, if its price were just a tiny bit lower, its producer would not
have manufactured today’s last gizmo. Put differently, the market price of today’s last
gizmo is the price at which its producer would be indifferent between manufacturing and
not manufacturing it and, simultaneously, its buyer would be indifferent between buying
and not buying it.
As commonly drawn, supply and demand curves respectively slope upward and
downward from left to right. If this characteristic applies in the gizmo market, then, apart
from the last gizmo, each of today’s gizmos is valued by its buyer at more than its price
and costs its seller less than its price. The difference between what a buyer would just be
willing to pay for a gizmo and its actual price is commonly termed a “consumers’ (or
consumers or consumer’s) surplus.” Similarly, the difference between the market price of
a gizmo and its marginal cost to a seller is commonly termed a “producers’ (or producer
or producer’s) surplus.” Economists commonly view the sum of the consumer and
producer surpluses from, for example, today’s gizmo sales as an important measure of the
gizmo market’s contribution to social welfare.
The vertically shaded area to the left of demand curve D1 in Exhibit 4 is the increase in
surplus associated with first-order benefits—the cost reductions to shippers and carriers
including those to shippers that result from reduced average travel times and the reduced
variability of the difference between actual and average travel times. The horizontally
shaded area to the left of demand curve D2 and above the price at which D2 and the new
supply curve intersect is consumer-surplus benefits. They are associated with the logistic
reorganization that curve D2 summarizes. The part of this area to the left of demand
AECOM Team: ICF Consulting, HLB Decision Economics, Louis Berger Group 25

FHWA’s Freight BCA Study Non-Technical Description of the BCA Framework May 11, 2001
curve D1 is benefits associated with the pre-improvement level of transportation services.
The triangular area to the left of D1 is benefits associated with the increased
transportation intensity to which the improvement gives rise.
Cost perVehicle Mile
Vehicle Milesper Year
C0
C1
VM0 VM1 VM2
D1
D2
Exhibit 4: Consumer Surplus for Transportation
AECOM Team: ICF Consulting, HLB Decision Economics, Louis Berger Group 26