Embed Size (px)
Citation preview
Virginia Statewide Multimodal Freight Study, Phase I
Executive Summary
Prepared forVirginia Department of TransportationMultimodal Transportation Planning Office
Submitted byCambridge Systematics, Inc.
In association withFitzgerald and Halliday, Inc.Global Insight, Inc.Jacobs EngineersMoffatt and Nichol, Inc.PB Americas, Inc.
FFiinnaall

Virginia Statewide Multimodal Freight Study, Phase I
ES-1
Executive Summary
���� Why a Statewide Multimodal Freight Study?
Virginia was founded as a trading colony, and freight movement remains a critical part of the Commonwealth’s economy. The movement of freight – raw materials, intermediate products, and finished goods – currently supports over 350 billion dollars of Virginia’s Gross State Product annually. To accommodate the movement of freight, Virginia hosts one of the nation’s leading seaports, two national freight railroads and numerous local and regional railroads, four major cargo airports, and some of the nation’s most heavily used truck corridors.
Over the next two decades, the forecast is for significant growth in the demand for freight movement into, out of, within, and through Virginia. Some of the Commonwealth’s freight infrastructure is well-positioned to accommodate this growth. But much of its infrastructure will be challenged – from normal wear and tear, from growth in the amount, type, and location of freight movement, from increased passenger traffic over shared highways and rail corridors, and from environmental pressures associated with higher freight volumes and/or denser settlement patterns in and around major freight facilities and corridors. Almost 80% of Virginia’s freight tonnage has an origin or a destination in another state – including 40% which is simply passing through Virginia on its way to and from other states – so growth and freight improvements in other states, or the lack thereof, could profoundly affect conditions in Virginia.
In meeting these challenges – as with all its transportation and public policy challenges – Virginia faces the critical problem of how to meet the greatest need, and derive the greatest public benefit, from constrained funding.
The opportunity before the Commonwealth is to make freight investments that generate significant public benefits and offer a positive return on public investment for the Commonwealth’s economy, transportation system, and environment. Efficient freight movement means lower costs for industries and businesses that depend on freight transportation, helping them (and Virginia’s economy) grow and prosper, and making Virginia a more attractive place to do business. In turn, lower costs of transporting goods to market also benefits Virginia’s consumers, in the form of lower prices. Taking a “systems approach” to freight movement – guiding it to the corridors, transportation modes, and travel time periods where the transportation system can provide the most capacity with the least cost and least environmental impact – can help offset the negative consequences of freight activities. Freight mobility improvements benefit passengers, and vice versa, because much of Virginia’s transportation system is shared between them.
Virginia Statewide Multimodal Freight Study, Phase I
ES-2
Over the past decade, Virginia has emerged as a national leader in addressing freight issues. Virginia has made, and continues to make, significant investments in its ability to move freight -- by truck, rail, water, air and “intermodally” among and between these modes. There are many studies, plans and programs underway to improve Virginia’s interstate and state highways, its ports and marine terminals, its freight rail corridors and terminals, and its airports. Freight has been addressed by each of Virginia’s modal transportation agencies, through multimodal planning activities, and by several of Virginia’s Metropolitan Planning Organizations. These efforts address not only public projects within Virginia, but also public projects involving partnerships with other states, as well as partnerships with the private sector stakeholders that benefit directly from freight system improvements.
To build on and supplement these efforts, to place them within a larger multimodal investment context, and to establish a guiding framework for near-term and long-range freight policy and investment strategies, the Commonwealth of Virginia has undertaken the Virginia Statewide Multimodal Freight Study. The Study is designed to:
• Compile available freight information – which exists in multiple places, from multiple sources – and fill in gaps, to tell the story of the Virginia’s entire intermodal freight transportation system.
• Identify current needs and projected future needs for each mode, for the system as a whole, and for designated multimodal corridors and subregions of critical interest.
• Develop an understanding of the contributions that freight makes to Virginia’s economy, clearly understand the benefits and costs of improving – or failing to improve – Virginia’s freight transportation system, and create a “return on investment” framework for decision-making.
• Form substantial, implementable recommendations and solutions for Commonwealth planning and programming.
• Address the critical roles that other levels of government and the private sector can and must play.
• Be grounded in a comprehensive outreach effort that reaches a full range of public and private stakeholders.
Phase I of the study, which is documented in this Report, primarily addressed tasks related to outreach, data collection, baseline forecasting, system inventory/analysis, and freight improvement opportunities. Phase II will develop analysis tools, analyze corridor and regional freight needs and alternatives, and evaluate infrastructure and policy alternatives based on public benefits and return on investment to the Commonwealth.

Virginia Statewide Multimodal Freight Study, Phase I
ES-3
���� Freight Movement and the Virginia Economy
As of 2006, Virginia was home to 7.6 million residents, making it the 12th most populous State in the country. Virginia’s economy employed 3.7 million people in 2006, accounting for 2.8 percent of all US jobs. In 2005, the total output of Virginia’s economy was around $658 billion. (Output is a measure of the total value of goods and services). For the same period, Virginia’s gross state product (or GSP) was $352 billion. (GSP is a measure of the total value added to goods and services because of Virginia activity.) Virginia accounts for almost three percent of the entire US economy. If Virginia were a country, its economy would be equivalent in size to Sweden’s or Turkey’s, ranking as the 21st largest in the world.
Today, around 50% of Virginia’s output, 28% of its gross state product, and 34% of its employment, is from freight-related industries that depend heavily on the movement of raw materials, intermediate goods, and/or finished products.
Figure ES-1. Freight-Related Industry Contributions to Virginia’s Economy (2005)
50% of Output 28% of GSP 34% of Employment
Many different Virginia industries and businesses rely heavily on the efficient movement of goods. Producing industries like agriculture depend on freight movement to move farm products from fields to processing plants to wholesalers to retail outlets, in Virginia and throughout the US and the world. Other producing industries, like transportation equipment manufacturers, also depend on freight movement to bring them the intermediate products – rolled or fabricated steel, tires, engine parts, etc. – they need to assemble their finished products. Wholesale and warehouse/distribution industries serve as the bridge between producers and consumers, making sure that needed goods are transported where – and when – they are needed. Finally, consumers of all kinds – from shoppers at grocery stores to power plants – rely on freight movement to deliver the goods and materials to the final point of sale or point of use. These freight-related businesses and industries generally fall into three “clusters”:
• The goods movement cluster includes industries and businesses that provide freight transportation services – such as truckers, railroads, marine shipping and air cargo
Non-FreightFreight
Non-Freight
Freight
Non-Freight
Freight
Virginia Statewide Multimodal Freight Study, Phase I
ES-4
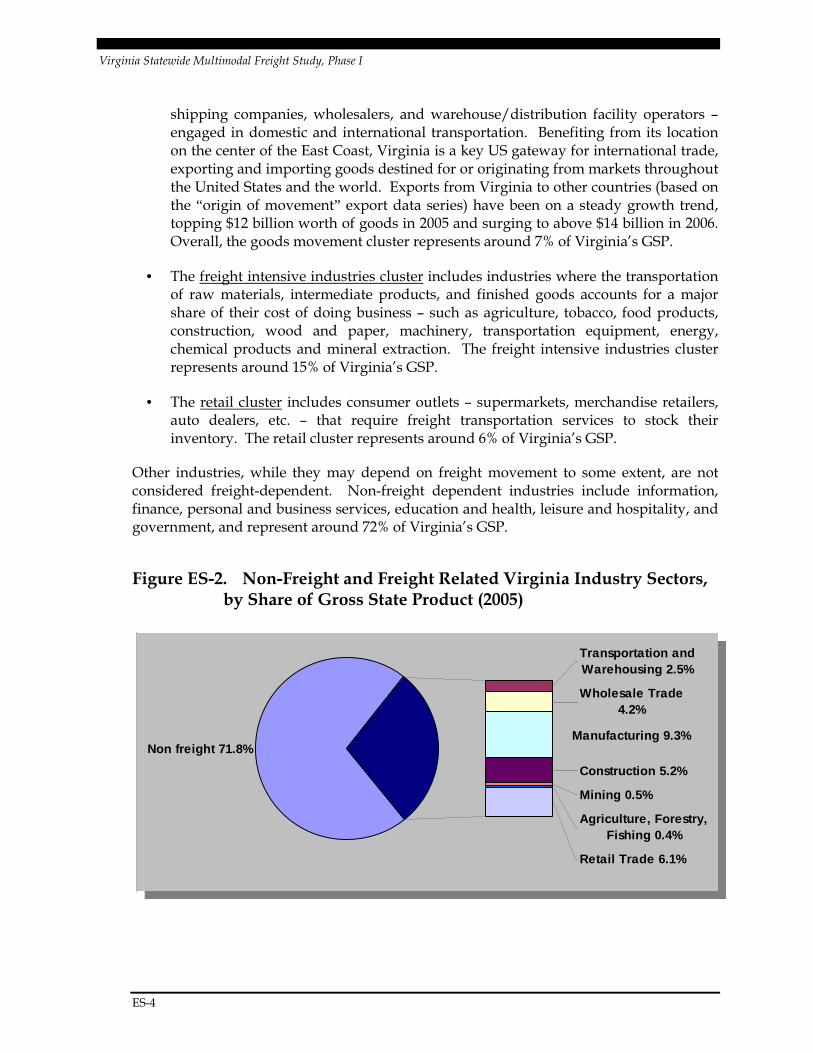
shipping companies, wholesalers, and warehouse/distribution facility operators – engaged in domestic and international transportation. Benefiting from its location on the center of the East Coast, Virginia is a key US gateway for international trade, exporting and importing goods destined for or originating from markets throughout the United States and the world. Exports from Virginia to other countries (based on the “origin of movement” export data series) have been on a steady growth trend, topping $12 billion worth of goods in 2005 and surging to above $14 billion in 2006. Overall, the goods movement cluster represents around 7% of Virginia’s GSP.
• The freight intensive industries cluster includes industries where the transportation of raw materials, intermediate products, and finished goods accounts for a major share of their cost of doing business – such as agriculture, tobacco, food products, construction, wood and paper, machinery, transportation equipment, energy, chemical products and mineral extraction. The freight intensive industries cluster represents around 15% of Virginia’s GSP.
• The retail cluster includes consumer outlets – supermarkets, merchandise retailers, auto dealers, etc. – that require freight transportation services to stock their inventory. The retail cluster represents around 6% of Virginia’s GSP.
Other industries, while they may depend on freight movement to some extent, are not considered freight-dependent. Non-freight dependent industries include information, finance, personal and business services, education and health, leisure and hospitality, and government, and represent around 72% of Virginia’s GSP.
Figure ES-2. Non-Freight and Freight Related Virginia Industry Sectors, by Share of Gross State Product (2005)
Non freight 71.8%
Transportation and Warehousing 2.5%
Wholesale Trade 4.2%
Manufacturing 9.3%
Construction 5.2%
Mining 0.5%
Agriculture, Forestry, Fishing 0.4%
Retail Trade 6.1%
Non freight 71.8%
Transportation and Warehousing 2.5%
Wholesale Trade 4.2%
Manufacturing 9.3%
Construction 5.2%
Mining 0.5%
Agriculture, Forestry, Fishing 0.4%
Retail Trade 6.1%
Virginia Statewide Multimodal Freight Study, Phase I
ES-5
Virginia’s population and economy are growing. The Virginia Employment Commission forecasts that Virginia population will increase 30% by the year 2030. Economic forecasts prepared by Global Insight Inc. as part of this study suggest that through the year 2035, freight industry output will increase 100%, freight industry GSP will increase 70%, and freight related employment will increase 20%. (The forecasts assume increasing productivity per freight industry employee.)
The non-freight sectors of Virginia’s economy will grow even faster, consistent with overall US trends, but even so, these forecasts point out that we will not be a 100% service economy. Today, even with rapid industrialization in China and other countries, and much attention paid to the outsourcing of US manufacturing, the US remains the world’s leading manufacturing economy on a dollar value basis. The US, and Virginia, will continue to move raw materials, intermediate products, and finished goods – and the need for freight movement services will grow, not diminish, as Virginia’s population grows and its economy expands.
���� Freight Demand and Projections
Understanding the volume and the value of freight demand is critical to addressing freight movement challenges and identifying opportunities. There are many different freight data sources and measures; each provides valuable information and comes with its own unique set of limitations.
One of the most comprehensive data sources available is a commercial data product known as TRANSEARCH, which incorporates a mix of public sector data (for rail, air, and water movements) and proprietary data (from trucking companies and logistics services) . Transearch provides estimates of freight tonnage and units moving between different geographic areas (counties, business economic areas, and states), by different transportation modes (truck, rail, water, and air), distinguished by commodity type. Virginia owns several years of TRANSEARCH data, the most recent being year 2004, with forecasts to year 2035. In Phase I of this study, TRANSEARCH Was supplemented by adding international waterborne data, and in Phase II further enhancements will be made.
According to available data, in 2004, Virginia’s multimodal transportation system handled around 915 million tons of freight worth more than $2.1 trillion dollars. This includes freight associated with trucking, rail, air, domestic water, and international water; also it includes freight moving inbound to, outbound from, within, and through the Commonwealth. On the basis of tonnage, trucking handled around 74%, followed by rail at 20%, water at 6%, and air at less than 1%. On the basis of value, trucking handled around 94%, rail handled around 4%, and air and water handled around 2%.
Interpreting these numbers, it is important to remember that much of Virginia’s freight is handled by different transportation modes, or handled multiple times, on its end-to-end journey from origin to destination, and the data counts each different “leg” of the end to end trip separately. For example, most waterborne commodities and nearly all airborne

Virginia Statewide Multimodal Freight Study, Phase I
ES-6
commodities generate corresponding truck moves – so a large part of the trucking numbers are due to the support they provide for other transportation modes. Also, tonnage and value measures do not reflect the fact that air, water, and rail tend to specialize in longer-distance freight movement, while a large part of trucking is shorter-distance local service.
Figure ES-3. Virginia Freight Tonnage and Value by Mode (2004)
Tonnage by Mode Value by Mode
Figure ES-4. Virginia Freight Tonnage by Direction and Type (2004)
Truck74.2%
Rail19.9%
Int'l Water3.7%
Air0.1%
Domestic Water2.1%
Truck94.4%
Int'l Water1.8%
Domestic Water0.1%
Rail3.5%
Air0.2%
Inbound21%
Outbound17%
Internal21%
Through41%

Virginia Statewide Multimodal Freight Study, Phase I
ES-7
Virginia’s geography places it at the center of the Mid-Atlantic corridor, and positions it at a major “crossroads” for goods moving between the west/southeast/south and the northeastern US. Around 40% of Virginia’s freight tonnage is pass-through tonnage, moving to and from other states without being handled in Virginia, and most of this is moved by truck. (Through trucking is discussed in more detail later in this Report.)
The remaining 60% of Virginia’s freight tonnage is split more or less evenly between inbound tonnage (from other states or countries to Virginia), outbound tonnage (from Virginia to other states or countries), and internal (moving from one part of Virginia to another). The leading states sending tonnage to and receiving tonnage from Virginia are located in the northeast, southeast, and midwest, but cargo also moves to and from states west of the Mississippi (Louisiana and Texas) as well as Canada and Mexico. By tonnage, about half of Virginia’s public and private terminal trade is with Europe and the Mediterranean; nearly 20% is with the east coast of Central and South America; about 10% is with the Far East; and around 20% is with all other parts of the world. By value, and by container trade, the Far East represents a substantially larger share of trade, and anticipated strong growth in this trade is a critical factor for Virginia.
Figure ES-5. Virginia Inbound and Outbound Freight Tonnage (2004)
Virginia Statewide Multimodal Freight Study, Phase I
ES-8
Virginia’s transportation network and services must accommodate the mobility, logistics, and consumer needs of an increasing number of residents, workers, visitors, retirees, and businesses, and do so reliably, safely, and efficiently. Growth in population and economic drivers will lead to a greater demand for goods and more congested highways and airports. State, national, and global economic growth will put additional pressures on Virginia’s railroads and ports to accommodate the increases in freight volumes that will accompany the mounting needs of businesses and consumer markets as well as increasing world trade.
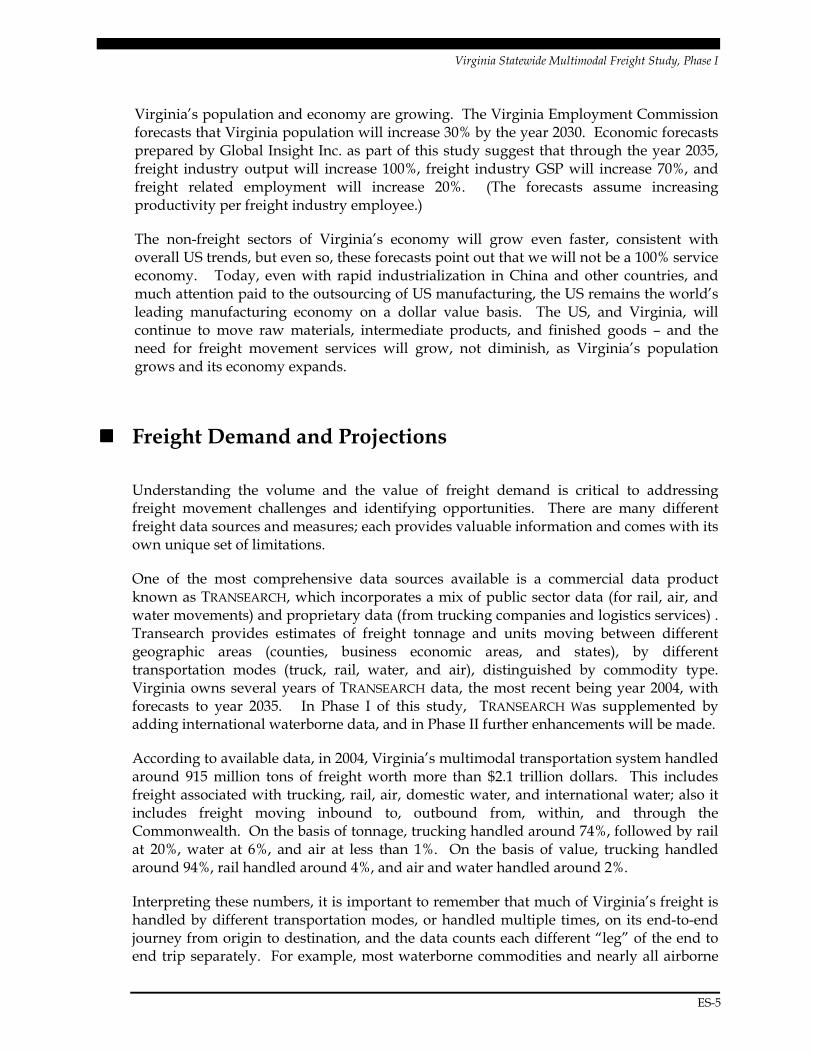
Nationally, domestic freight tonnage – that is, tonnage moving between two points in the United States, including movements to and from international gateways (seaports, airports, and border crossings) – is expected to nearly double by 2035 based on the Federal Highway Administration’s (FHWA’s) recent Freight Analysis Framework-2 (FAF-2) release. International container traffic, which is a relatively low share of total system tonnage but a more significant share of its value, is expected to triple by 2035.
Virginia projections for the year 2035 were developed from the Transearch database and additional analysis of international waterborne traffic patterns. Total tonnage is projected to grow from 915 million tons to more than 1,950 million tons – an increase of 113%. The fastest growth is for international container and air cargo trades, each anticipated to increase more than 200%. Trucking, rail, domestic water, and non-containerized international water, which handle the great majority of total tonnage, are anticipated to increase at rates between 100% and 115%.
Figure ES-6. Projected Growth in Virginia Freight Tonnage (2004-2035)
115%102% 102%
226%
100%
210%
113%
0%
50%
100%
150%
200%
250%
Truck Rail DomesticWater
Int'l Container Int'l Non-Container
Air Total
115%102% 102%
226%
100%
210%
113%
0%
50%
100%
150%
200%
250%
Truck Rail DomesticWater
Int'l Container Int'l Non-Container
Air Total
Virginia Statewide Multimodal Freight Study, Phase I
ES-9
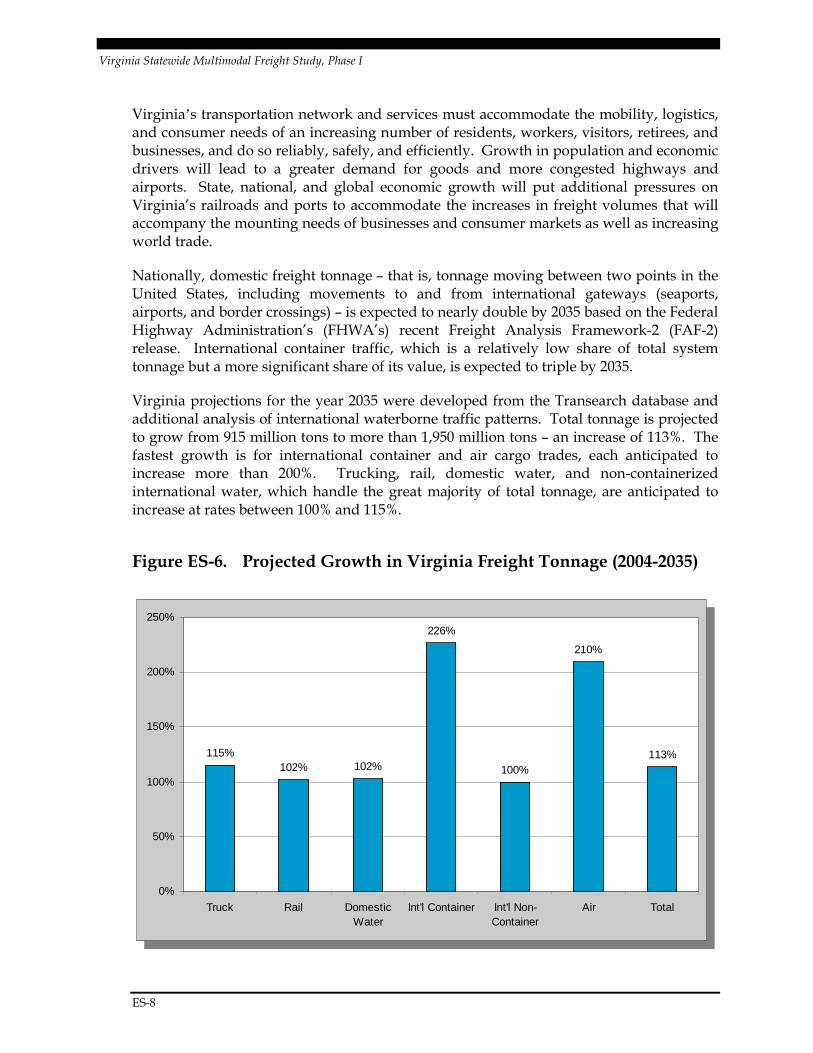
Projected growth in Virginia freight tonnage is generally proportional to projected growth in the freight output of Virginia industries over the same period. However, the mix of commodities that make up this tonnage is likely to shift significantly. In 2004, the leading commodities by weight were non-metallic minerals (industrial minerals other than metals or fuels), coal, “secondary traffic” (a class representing a mix of commodities that typically move in containers or dry van trucks and involve warehouse and distribution activities), clay/concrete, glass/stone, and so on. By 2035, secondary traffic is expected to become the Commonwealth’s leading commodity by tonnage, overtaking non-metallic minerals.
Figure ES.7 Virginia’s Top Commodities by Weight, 2004 and 2035
Note: Due to limitations in the data, this figure does not include waste shipments by truck and international waterborne commodities. These limitations will be addressed in Phase II. Through traffic was deliberately excluded in order to focus on commodities that are directly linked to Virginia’s economy.
Secondary traffic is already the Commonwealth’s leading commodity by value, and will retain this position through 2035. The next leading commodities on the basis of value include electrical equipment, transportation equipment, machinery, and other groupings.
0 50 100 150 200 250
All Others
Transportation Equipment - 37
Waste or Scrap Materials - 40
Chemicals or Allied Products - 28
Lumber or Wood Products - 24
Food or Kindred Products - 20
Petroleum or Coal Products - 29
Clay, Concrete, Glass, Stone - 32
Coal - 11
Secondary Traffic - 50
Nonmetallic Minerals - 14
Tons (in Millions)
2004 Tons 2035 Tons
Virginia Statewide Multimodal Freight Study, Phase I
ES-10
���� Virginia’s Multimodal Freight Transportation System
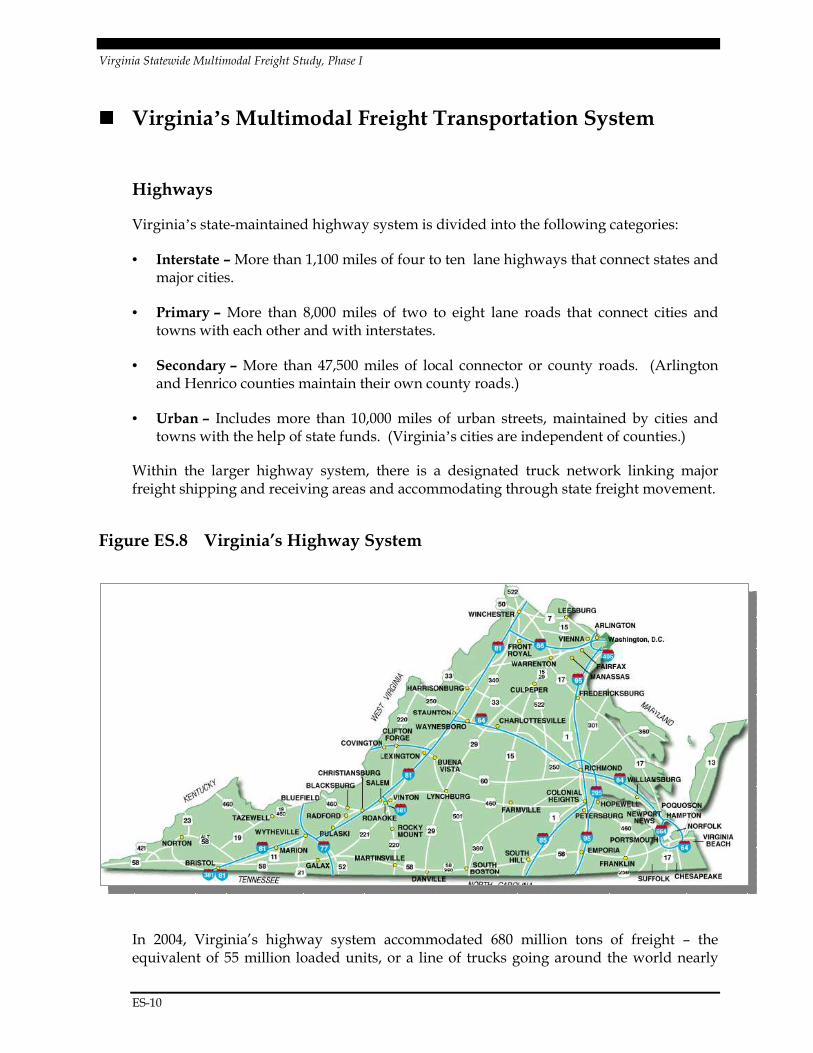
Highways
Virginia’s state-maintained highway system is divided into the following categories:
• Interstate – More than 1,100 miles of four to ten lane highways that connect states and major cities.
• Primary – More than 8,000 miles of two to eight lane roads that connect cities and towns with each other and with interstates.
• Secondary – More than 47,500 miles of local connector or county roads. (Arlington and Henrico counties maintain their own county roads.)
• Urban – Includes more than 10,000 miles of urban streets, maintained by cities and towns with the help of state funds. (Virginia’s cities are independent of counties.)
Within the larger highway system, there is a designated truck network linking major freight shipping and receiving areas and accommodating through state freight movement.
Figure ES.8 Virginia’s Highway System
In 2004, Virginia’s highway system accommodated 680 million tons of freight – the equivalent of 55 million loaded units, or a line of trucks going around the world nearly
Virginia Statewide Multimodal Freight Study, Phase I
ES-11
thirty times – moving more than 200 billion ton-miles. (A ton-mile is one ton of freight moving a distance of one mile.)
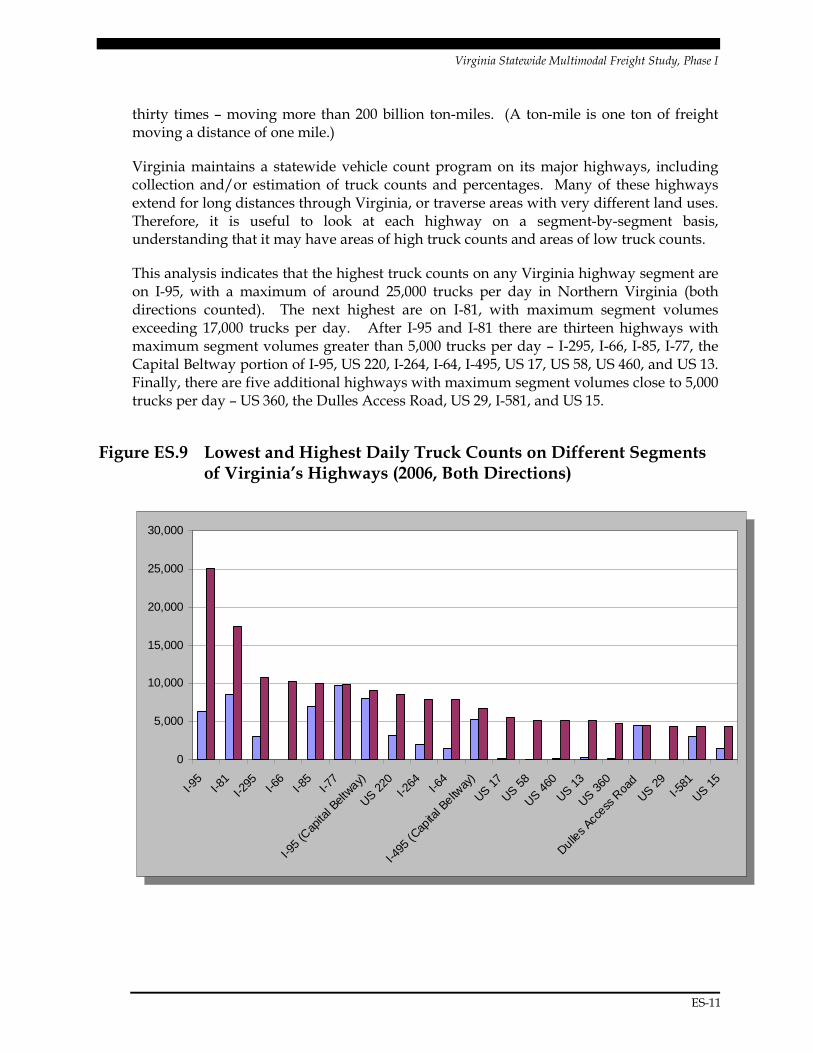
Virginia maintains a statewide vehicle count program on its major highways, including collection and/or estimation of truck counts and percentages. Many of these highways extend for long distances through Virginia, or traverse areas with very different land uses. Therefore, it is useful to look at each highway on a segment-by-segment basis, understanding that it may have areas of high truck counts and areas of low truck counts.
This analysis indicates that the highest truck counts on any Virginia highway segment are on I-95, with a maximum of around 25,000 trucks per day in Northern Virginia (both directions counted). The next highest are on I-81, with maximum segment volumes exceeding 17,000 trucks per day. After I-95 and I-81 there are thirteen highways with maximum segment volumes greater than 5,000 trucks per day – I-295, I-66, I-85, I-77, the Capital Beltway portion of I-95, US 220, I-264, I-64, I-495, US 17, US 58, US 460, and US 13. Finally, there are five additional highways with maximum segment volumes close to 5,000 trucks per day – US 360, the Dulles Access Road, US 29, I-581, and US 15.
Figure ES.9 Lowest and Highest Daily Truck Counts on Different Segments of Virginia’s Highways (2006, Both Directions)
0
5,000
10,000
15,000
20,000
25,000
30,000
I-95
I-81
I-295 I-6
6I-8
5I-7
7
I-95
(Cap
ital B
eltway)
US 220
I-264 I-6
4
I-495
(Cap
ital B
eltway
)
US 17
US 58
US 460
US 13
US 360
Dulles A
ccess
Roa
d
US 29
I-581
US 15
0
5,000
10,000
15,000
20,000
25,000
30,000
I-95
I-81
I-295 I-6
6I-8
5I-7
7
I-95
(Cap
ital B
eltway)
US 220
I-264 I-6
4
I-495
(Cap
ital B
eltway
)
US 17
US 58
US 460
US 13
US 360
Dulles A
ccess
Roa
d
US 29
I-581
US 15
Virginia Statewide Multimodal Freight Study, Phase I
ES-12
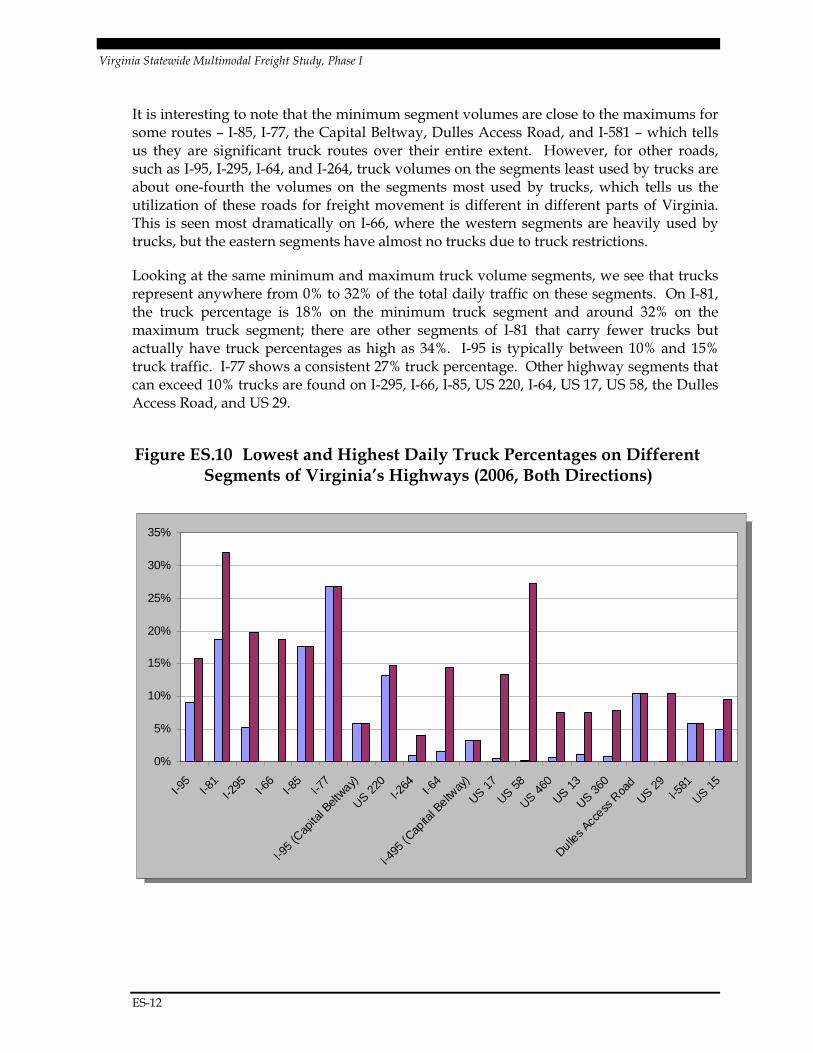
It is interesting to note that the minimum segment volumes are close to the maximums for some routes – I-85, I-77, the Capital Beltway, Dulles Access Road, and I-581 – which tells us they are significant truck routes over their entire extent. However, for other roads, such as I-95, I-295, I-64, and I-264, truck volumes on the segments least used by trucks are about one-fourth the volumes on the segments most used by trucks, which tells us the utilization of these roads for freight movement is different in different parts of Virginia. This is seen most dramatically on I-66, where the western segments are heavily used by trucks, but the eastern segments have almost no trucks due to truck restrictions.
Looking at the same minimum and maximum truck volume segments, we see that trucks represent anywhere from 0% to 32% of the total daily traffic on these segments. On I-81, the truck percentage is 18% on the minimum truck segment and around 32% on the maximum truck segment; there are other segments of I-81 that carry fewer trucks but actually have truck percentages as high as 34%. I-95 is typically between 10% and 15% truck traffic. I-77 shows a consistent 27% truck percentage. Other highway segments that can exceed 10% trucks are found on I-295, I-66, I-85, US 220, I-64, US 17, US 58, the Dulles Access Road, and US 29.
Figure ES.10 Lowest and Highest Daily Truck Percentages on Different Segments of Virginia’s Highways (2006, Both Directions)
0%
5%
10%
15%
20%
25%
30%
35%
I-95
I-81
I-295 I-6
6I-8
5I-7
7
I-95
(Cap
ital B
eltway)
US 220
I-264 I-6
4
I-495
(Cap
ital B
eltway
)
US 17
US 58
US 460
US 13
US 360
Dulles A
ccess
Roa
d
US 29
I-581
US 15
0%
5%
10%
15%
20%
25%
30%
35%
I-95
I-81
I-295 I-6
6I-8
5I-7
7
I-95
(Cap
ital B
eltway)
US 220
I-264 I-6
4
I-495
(Cap
ital B
eltway
)
US 17
US 58
US 460
US 13
US 360
Dulles A
ccess
Roa
d
US 29
I-581
US 15
Virginia Statewide Multimodal Freight Study, Phase I
ES-13
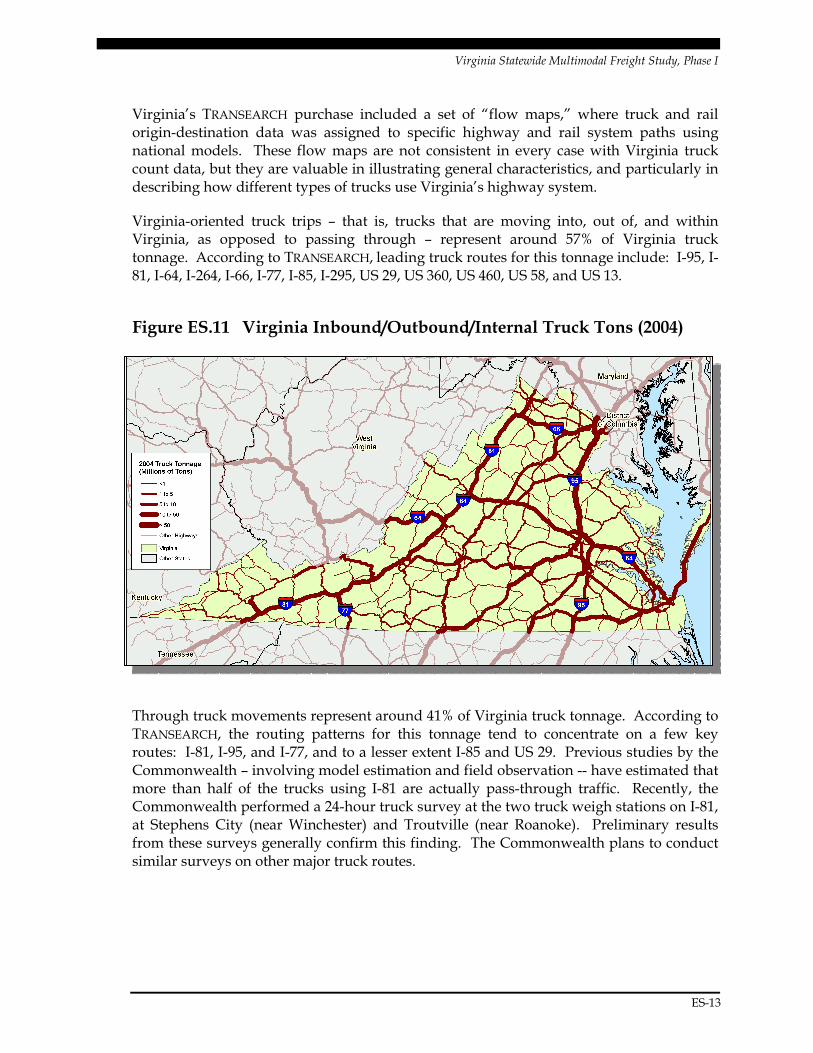
Virginia’s TRANSEARCH purchase included a set of “flow maps,” where truck and rail origin-destination data was assigned to specific highway and rail system paths using national models. These flow maps are not consistent in every case with Virginia truck count data, but they are valuable in illustrating general characteristics, and particularly in describing how different types of trucks use Virginia’s highway system.
Virginia-oriented truck trips – that is, trucks that are moving into, out of, and within Virginia, as opposed to passing through – represent around 57% of Virginia truck tonnage. According to TRANSEARCH, leading truck routes for this tonnage include: I-95, I-81, I-64, I-264, I-66, I-77, I-85, I-295, US 29, US 360, US 460, US 58, and US 13.
Figure ES.11 Virginia Inbound/Outbound/Internal Truck Tons (2004)
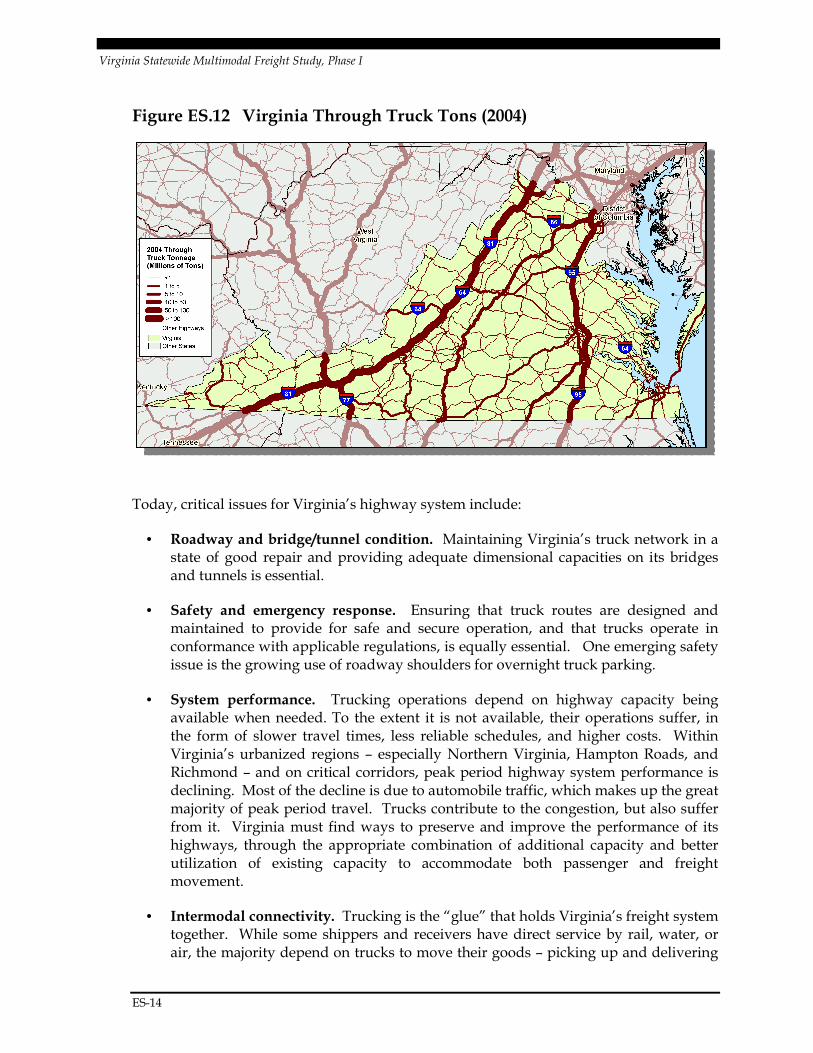
Through truck movements represent around 41% of Virginia truck tonnage. According to TRANSEARCH, the routing patterns for this tonnage tend to concentrate on a few key routes: I-81, I-95, and I-77, and to a lesser extent I-85 and US 29. Previous studies by the Commonwealth – involving model estimation and field observation -- have estimated that more than half of the trucks using I-81 are actually pass-through traffic. Recently, the Commonwealth performed a 24-hour truck survey at the two truck weigh stations on I-81, at Stephens City (near Winchester) and Troutville (near Roanoke). Preliminary results from these surveys generally confirm this finding. The Commonwealth plans to conduct similar surveys on other major truck routes.
Virginia Statewide Multimodal Freight Study, Phase I
ES-14
Figure ES.12 Virginia Through Truck Tons (2004)
Today, critical issues for Virginia’s highway system include:
• Roadway and bridge/tunnel condition. Maintaining Virginia’s truck network in a state of good repair and providing adequate dimensional capacities on its bridges and tunnels is essential.
• Safety and emergency response. Ensuring that truck routes are designed and maintained to provide for safe and secure operation, and that trucks operate in conformance with applicable regulations, is equally essential. One emerging safety issue is the growing use of roadway shoulders for overnight truck parking.
• System performance. Trucking operations depend on highway capacity being available when needed. To the extent it is not available, their operations suffer, in the form of slower travel times, less reliable schedules, and higher costs. Within Virginia’s urbanized regions – especially Northern Virginia, Hampton Roads, and Richmond – and on critical corridors, peak period highway system performance is declining. Most of the decline is due to automobile traffic, which makes up the great majority of peak period travel. Trucks contribute to the congestion, but also suffer from it. Virginia must find ways to preserve and improve the performance of its highways, through the appropriate combination of additional capacity and better utilization of existing capacity to accommodate both passenger and freight movement.
• Intermodal connectivity. Trucking is the “glue” that holds Virginia’s freight system together. While some shippers and receivers have direct service by rail, water, or air, the majority depend on trucks to move their goods – picking up and delivering
Virginia Statewide Multimodal Freight Study, Phase I
ES-15
to rail terminals, seaports, or airports, moving to and from warehouse and distribution centers, or delivering door-to-door. Any deficiencies in Virginia’s trucking system will have a direct ripple effect on other transportation modes, and throughout its economy as a whole.
• Environment. With increased trucking and increased population, the potential negative effects of freight activities are magnified. Factors such as truck emissions, fuel consumption, noise, and land use conflicts must be considered in freight system planning and regulation.
• Industry support and partnership. The trucking industry faces issues of driver attraction and retention, and the Commonwealth could be a partner in providing education and training. Similarly, there may be opportunities for the Commonwealth to expand the types of system information it provides to truckers – and for truckers, in turn, to provide more information on travel patterns and other issues back to the Commonwealth.
• Time shifting. In the off-peak periods, much of Virginia’s highway system has excess capacity, apart from work zone related delays. Many long-haul truckers whose schedules allow them to travel through Virginia’s congested urban areas at night will do so. Perhaps more truck travel could occur at night, and perhaps some shorter-haul activity could also occur at night. However, much of the short-haul activity will continue to occur in daylight hours for several reasons: that is when most businesses are open, businesses are located in neighborhoods where off-peak/overnight deliveries would be disruptive, people do not want to receive deliveries at their homes at 3 AM, and truck driver availability. Strategies to encourage greater use of off-peak highway capacity are an important opportunity, but must address not only the truckers, but also consider businesses and neighborhoods.
• Mode shifting. The Commonwealth has been active in exploring the potential to shift long-haul truck traffic to rail, to the extent this may prove feasible. Several background studies addressing I-81 have been performed, and another addressing truck-rail diversion is currently underway. The Commonwealth has also participated with its I-95 Corridor Coalition partners on the Mid-Atlantic Rail Operations Study, which considers diversion potential on both I-95 and I-81 routings. These opportunities hold promise, and determining the real benefits and associated costs is important to develop a basis for public investment decisions. Mode-shifting also applies to passengers – more transit use means fewer cars, which means more highway capacity is available for trucks.
• Funding. Given that Virginia’s funding for needed transportation improvements is highly constrained, and given that the private sector is a direct financial beneficiary of freight improvements, it stands to reason that partnership opportunities – where a portion of the private sector benefit is captured to support needed improvements – should be carefully considered. There is also a need to demonstrate a public sector benefit associated with investments in private sector infrastructure. Ensuring that
Virginia Statewide Multimodal Freight Study, Phase I
ES-16
pass-through traffic, which impacts the Commonwealth in terms of wear and tear on roads, etc., contributes its fair share to Virginia is a concern.
By 2035, the critical issue is: given the significant issues we face today, and the projected growth in population and non-freight travel, how will Virginia deal with a projected doubling of truck tonnage?
Railroads
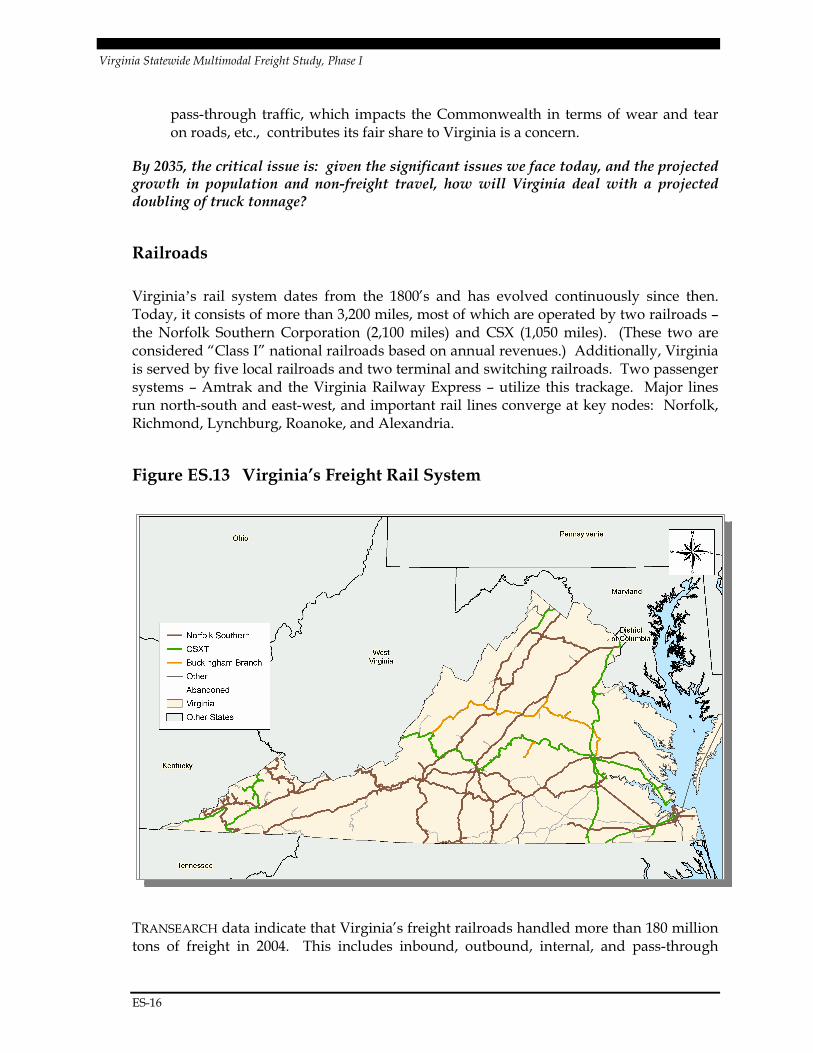
Virginia’s rail system dates from the 1800’s and has evolved continuously since then. Today, it consists of more than 3,200 miles, most of which are operated by two railroads – the Norfolk Southern Corporation (2,100 miles) and CSX (1,050 miles). (These two are considered “Class I” national railroads based on annual revenues.) Additionally, Virginia is served by five local railroads and two terminal and switching railroads. Two passenger systems – Amtrak and the Virginia Railway Express – utilize this trackage. Major lines run north-south and east-west, and important rail lines converge at key nodes: Norfolk, Richmond, Lynchburg, Roanoke, and Alexandria.
Figure ES.13 Virginia’s Freight Rail System
TRANSEARCH data indicate that Virginia’s freight railroads handled more than 180 million tons of freight in 2004. This includes inbound, outbound, internal, and pass-through
Virginia Statewide Multimodal Freight Study, Phase I
ES-17
shipments. According to the most recent data available (year 2005), Virginia’s railroads originated over 66 million tons of freight and terminated almost 50 million tons of freight. In 2005, almost 60% of rail tonnage originated and terminated in Virginia was coal.
Freight railroads offer different types of services, and they use different types of equipment in each of these services.
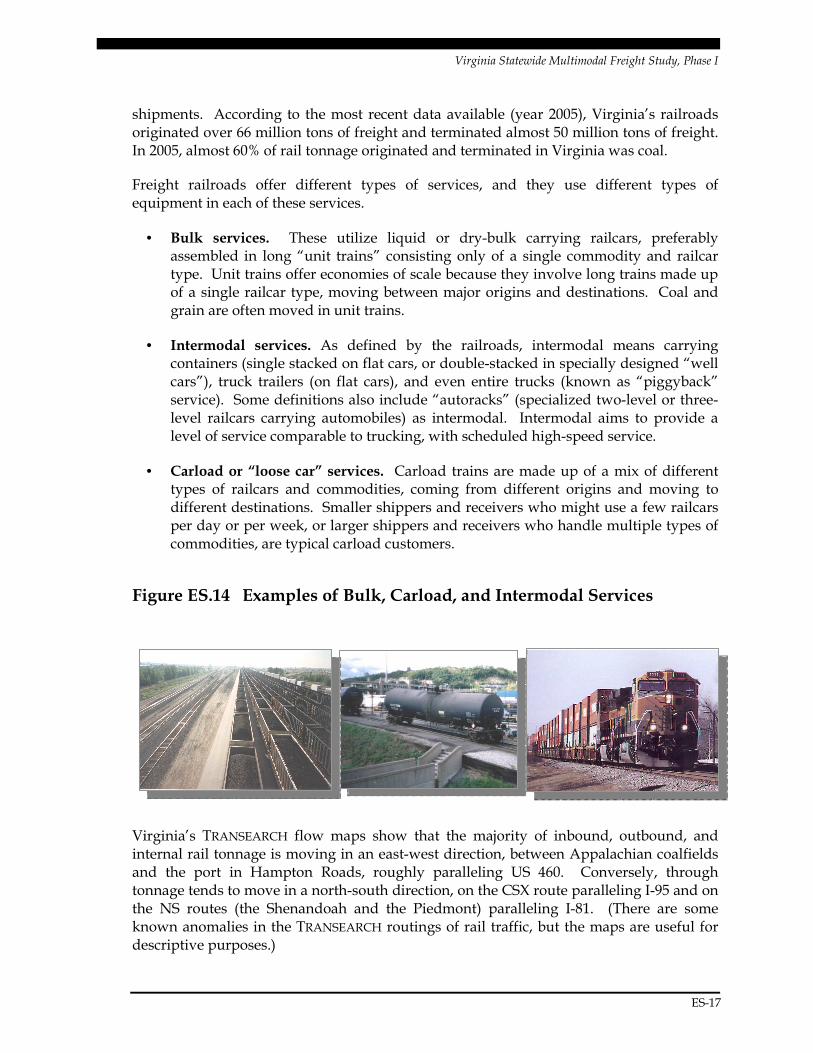
• Bulk services. These utilize liquid or dry-bulk carrying railcars, preferably assembled in long “unit trains” consisting only of a single commodity and railcar type. Unit trains offer economies of scale because they involve long trains made up of a single railcar type, moving between major origins and destinations. Coal and grain are often moved in unit trains.
• Intermodal services. As defined by the railroads, intermodal means carrying containers (single stacked on flat cars, or double-stacked in specially designed “well cars”), truck trailers (on flat cars), and even entire trucks (known as “piggyback” service). Some definitions also include “autoracks” (specialized two-level or three-level railcars carrying automobiles) as intermodal. Intermodal aims to provide a level of service comparable to trucking, with scheduled high-speed service.
• Carload or “loose car” services. Carload trains are made up of a mix of different types of railcars and commodities, coming from different origins and moving to different destinations. Smaller shippers and receivers who might use a few railcars per day or per week, or larger shippers and receivers who handle multiple types of commodities, are typical carload customers.
Figure ES.14 Examples of Bulk, Carload, and Intermodal Services
Virginia’s TRANSEARCH flow maps show that the majority of inbound, outbound, and internal rail tonnage is moving in an east-west direction, between Appalachian coalfields and the port in Hampton Roads, roughly paralleling US 460. Conversely, through tonnage tends to move in a north-south direction, on the CSX route paralleling I-95 and on the NS routes (the Shenandoah and the Piedmont) paralleling I-81. (There are some known anomalies in the TRANSEARCH routings of rail traffic, but the maps are useful for descriptive purposes.)

Virginia Statewide Multimodal Freight Study, Phase I
ES-18
Figure ES.15 Virginia Inbound/Outbound/Internal Rail Tons (2004)
Figure ES.16 Virginia Through Rail Tons (2004)
Virginia Statewide Multimodal Freight Study, Phase I
ES-19
Today, critical issues for Virginia’s freight rail system include:
• Safety and security, particularly for at-grade road-rail crossings.
• System preservation. Without railroads, Virginia’s truck tonnage would increase dramatically, and businesses that depend on rail would close their doors – so even though it is almost entirely in private hands, the Commonwealth’s rail system is one of its primary transportation and economic assets.
• System modernization and capacity improvements. Over the past two decades, the nation’s rail system has transformed much of its 19th century infrastructure to serve 21st century markets, with tracks and bridges that accommodate heavier railcars, and with improved double-stack intermodal corridors and railyards. Most of these investments have come from the rail companies themselves.
• Public-private partnership opportunities. There are some types of railroad improvement projects where public partnership may be appropriate. Generally, these are cases where the cost exceeds the investment ability of the railroad, and where the project generates a positive return to the public in the form of transportation, economic, and/or environmental benefits. Virginia is currently partnering with Norfolk Southern to develop the Heartland Corridor, which will upgrade an historic coal line between Hampton Roads and Columbus, Ohio to enable double stack intermodal service. Other opportunities to upgrade rail lines paralleling I-81 and I-95 are under discussion.
• Shortline assistance. As the nation’s rail system has evolved, many of its “last mile” connections to end users have moved from the Class I railroads to the shortlines, and in some cases these shortlines require public support for needed improvements. Virginia is meeting some of these needs through its Rail Enhancement Fund.
• Port accessibility and service. With strong anticipated growth in the movement of international shipping containers and other commodities through Virginia’s ports, maintaining and improving rail service for marine terminals is critical. There are several projects advancing in this area.
• Passenger operations. In Virginia, passenger and freight rail service operate over the same tracks, potentially restricting the capacity of both. Virginia’s freight rail system must accommodate growing levels of utilization by passenger rail service, safely and reliably.
• Multistate coordination. Most rail freight travels long distances (e.g., greater than 500 miles), usually traversing multiple state lines. The success or failure of rail investments in Virginia may depend on corresponding investments in other states.
By 2035, the critical issue is: how can Virginia’s rail system be preserved and upgraded to handle a projected doubling of tonnage, while also potentially relieving pressure on the highway system by diverting truck traffic to rail?
Virginia Statewide Multimodal Freight Study, Phase I
ES-20
Ports
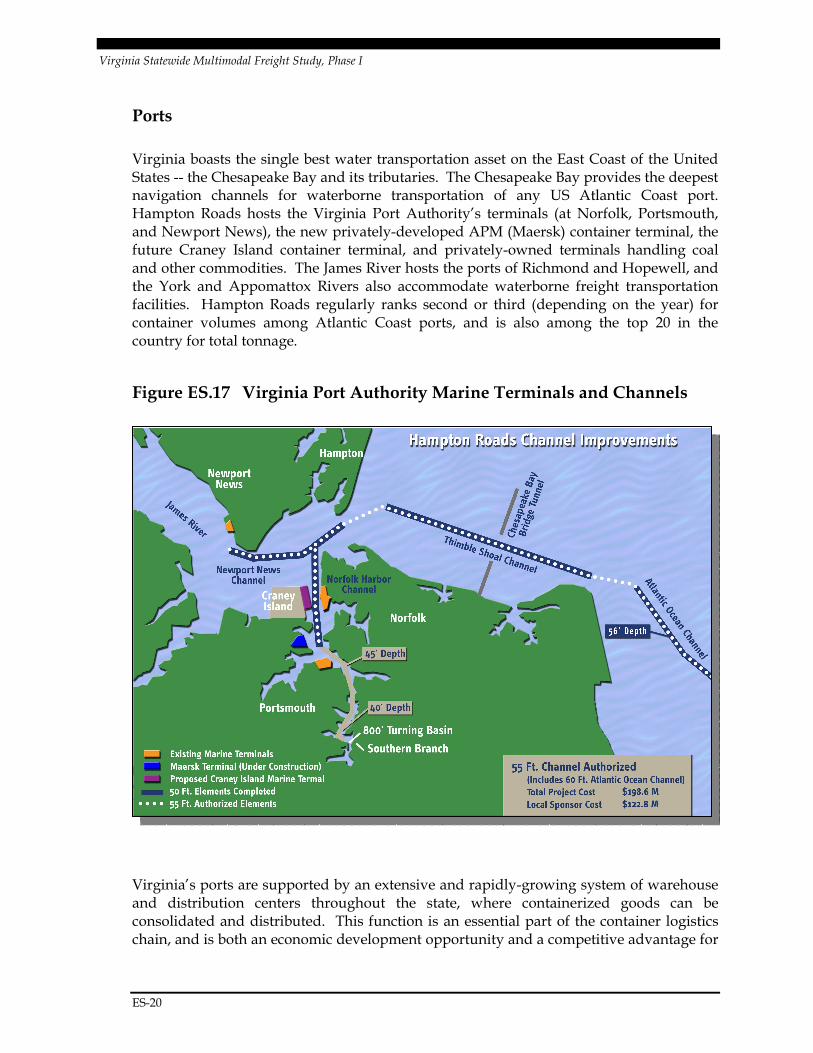
Virginia boasts the single best water transportation asset on the East Coast of the United States -- the Chesapeake Bay and its tributaries. The Chesapeake Bay provides the deepest navigation channels for waterborne transportation of any US Atlantic Coast port. Hampton Roads hosts the Virginia Port Authority’s terminals (at Norfolk, Portsmouth, and Newport News), the new privately-developed APM (Maersk) container terminal, the future Craney Island container terminal, and privately-owned terminals handling coal and other commodities. The James River hosts the ports of Richmond and Hopewell, and the York and Appomattox Rivers also accommodate waterborne freight transportation facilities. Hampton Roads regularly ranks second or third (depending on the year) for container volumes among Atlantic Coast ports, and is also among the top 20 in the country for total tonnage.
Figure ES.17 Virginia Port Authority Marine Terminals and Channels
Virginia’s ports are supported by an extensive and rapidly-growing system of warehouse and distribution centers throughout the state, where containerized goods can be consolidated and distributed. This function is an essential part of the container logistics chain, and is both an economic development opportunity and a competitive advantage for

Virginia Statewide Multimodal Freight Study, Phase I
ES-21
Virginia. Additionally, the Virginia Port Authority operates an “Inland Port” – supporting the truck and rail interchange of goods – at Front Royal.
Figure ES.18 Virginia Distribution Centers and Square Footage
Today, the most significant port issues are:
• Safety and security. VPA and other US ports are operating under heightened security procedures to ensure the safety and security of containers and other cargo.
• Improving facilities to accommodate anticipated growth. Port improvements tend to have very long lead times, especially if they involve channel deepening or landfill. Growth in international containers is conservatively forecast to triple over the next 30 years, and more aggressive forecasts envision VPA container traffic quadrupling. At the same time, international non-container traffic and domestic waterborne traffic is forecast to grow at a pace similar to truck and rail.
• Preserving and upgrading the quality of landside access, by truck and rail, to existing and planned future marine terminals.
• Planning for the additional warehouse and distribution facilities that will be needed to support container growth.
• “Marine Highway” initiatives that could potentially shift truck traffic to barges.
Virginia Statewide Multimodal Freight Study, Phase I
ES-22
Through 2035, the critical issue is: how can Virginia best handle a tripling (or quadrupling) of container traffic, and a doubling of other tonnage, by improving port facilities and operations, while ensuring adequate landside access, safety and security, and environmental quality?
Airports
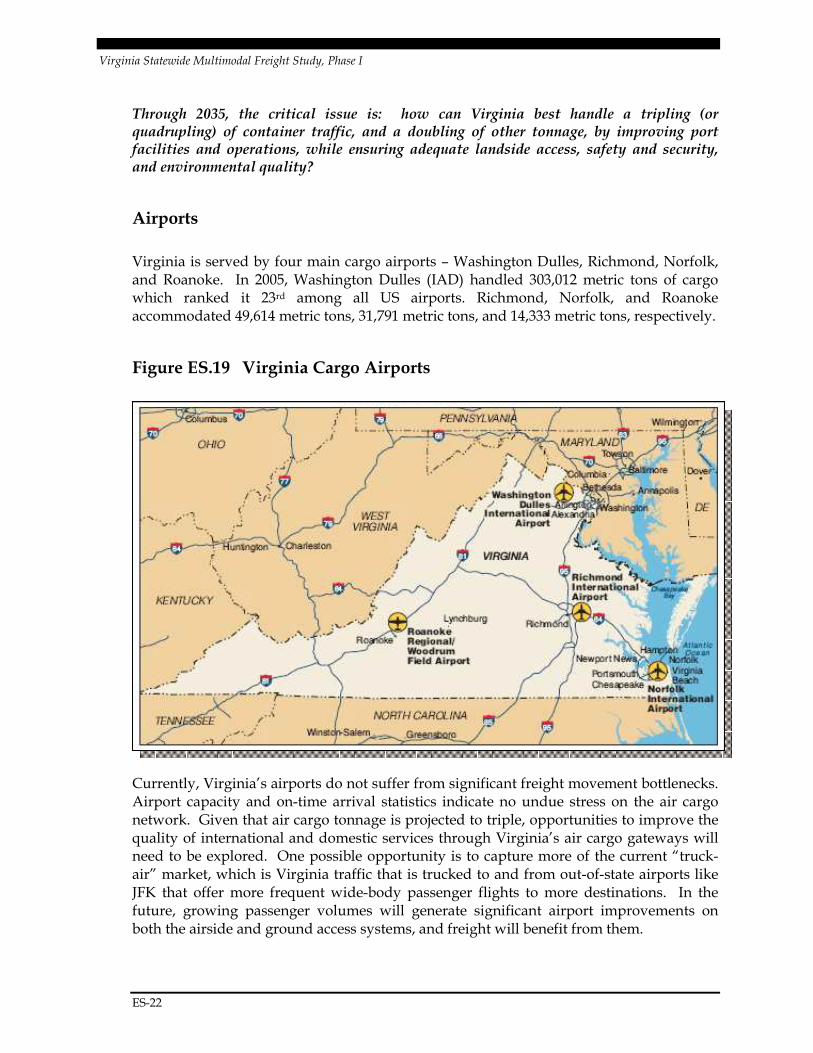
Virginia is served by four main cargo airports – Washington Dulles, Richmond, Norfolk, and Roanoke. In 2005, Washington Dulles (IAD) handled 303,012 metric tons of cargo which ranked it 23rd among all US airports. Richmond, Norfolk, and Roanoke accommodated 49,614 metric tons, 31,791 metric tons, and 14,333 metric tons, respectively.
Figure ES.19 Virginia Cargo Airports
Currently, Virginia’s airports do not suffer from significant freight movement bottlenecks. Airport capacity and on-time arrival statistics indicate no undue stress on the air cargo network. Given that air cargo tonnage is projected to triple, opportunities to improve the quality of international and domestic services through Virginia’s air cargo gateways will need to be explored. One possible opportunity is to capture more of the current “truck-air” market, which is Virginia traffic that is trucked to and from out-of-state airports like JFK that offer more frequent wide-body passenger flights to more destinations. In the future, growing passenger volumes will generate significant airport improvements on both the airside and ground access systems, and freight will benefit from them.
Virginia Statewide Multimodal Freight Study, Phase I
ES-23
Through 2035, the critical issue is: how can Virginia best handle a tripling of air cargo traffic, within the context of growing passenger demand through Virginia’s airports?
���� Stakeholder Input
Stakeholders across Virginia have a vital interest in the Commonwealth’s freight transportation system. Over 180 stakeholders, representing a wide range of firms and organizations within Virginia, participated in a phone interview process. Manufacturing firms accounted for most of the interviewees, followed by distribution firms (trucking firms, wholesalers, etc.), and an assortment of retail, mining, agricultural, and other firms. Firms of all sizes were included, with 68 percent of interviewees representing firms with less than 250 employees and 11 percent representing firms with more than 1,000 employees.
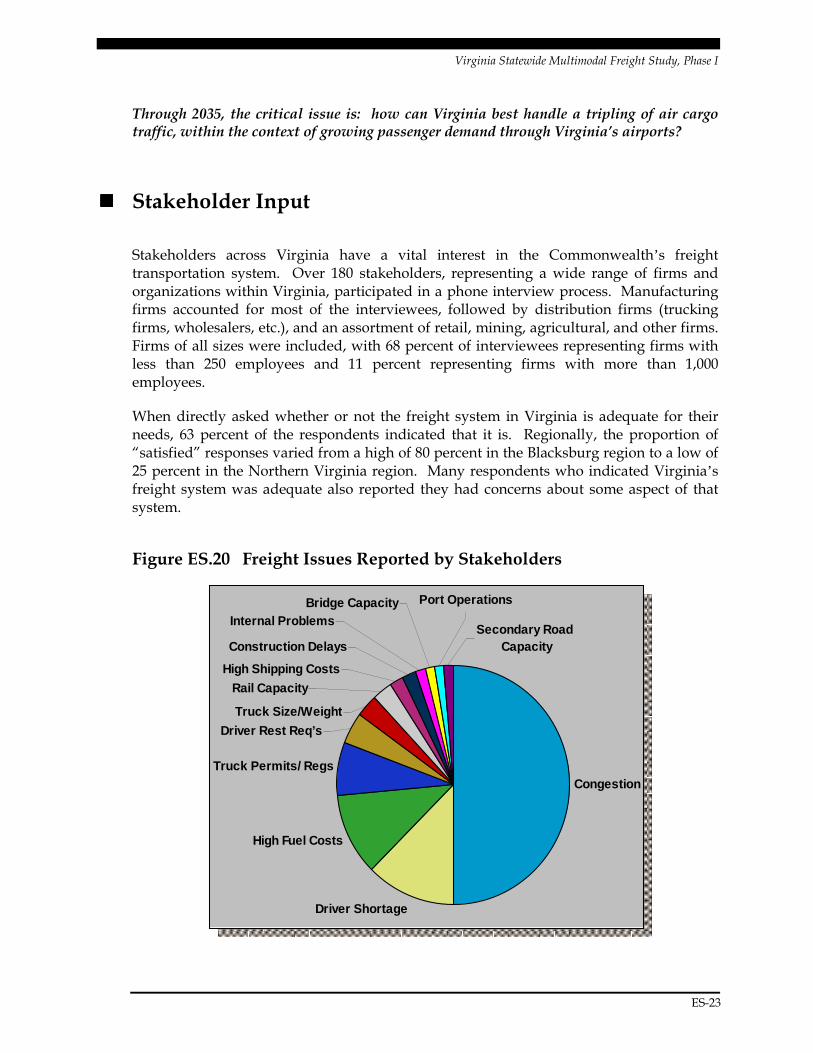
When directly asked whether or not the freight system in Virginia is adequate for their needs, 63 percent of the respondents indicated that it is. Regionally, the proportion of “satisfied” responses varied from a high of 80 percent in the Blacksburg region to a low of 25 percent in the Northern Virginia region. Many respondents who indicated Virginia’s freight system was adequate also reported they had concerns about some aspect of that system.
Figure ES.20 Freight Issues Reported by Stakeholders
Congestion
Driver Shortage
High Fuel Costs
Truck Permits/ Regs
Truck Size/Weight
High Shipping Costs
Construction DelaysSecondary Road
Capacity
Port OperationsBridge Capacity
Driver Rest Req’s
Rail Capacity
Internal Problems
Virginia Statewide Multimodal Freight Study, Phase I
ES-24
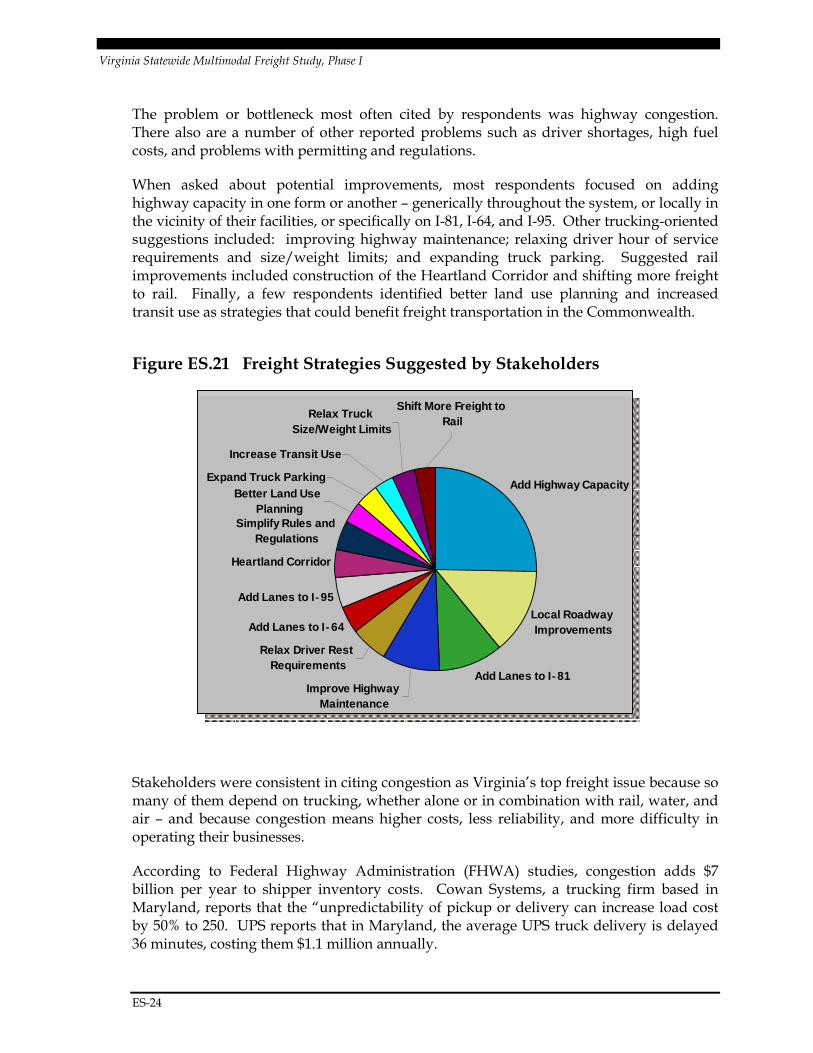
The problem or bottleneck most often cited by respondents was highway congestion. There also are a number of other reported problems such as driver shortages, high fuel costs, and problems with permitting and regulations.
When asked about potential improvements, most respondents focused on adding highway capacity in one form or another – generically throughout the system, or locally in the vicinity of their facilities, or specifically on I-81, I-64, and I-95. Other trucking-oriented suggestions included: improving highway maintenance; relaxing driver hour of service requirements and size/weight limits; and expanding truck parking. Suggested rail improvements included construction of the Heartland Corridor and shifting more freight to rail. Finally, a few respondents identified better land use planning and increased transit use as strategies that could benefit freight transportation in the Commonwealth.
Figure ES.21 Freight Strategies Suggested by Stakeholders
Stakeholders were consistent in citing congestion as Virginia’s top freight issue because so many of them depend on trucking, whether alone or in combination with rail, water, and air – and because congestion means higher costs, less reliability, and more difficulty in operating their businesses.
According to Federal Highway Administration (FHWA) studies, congestion adds $7 billion per year to shipper inventory costs. Cowan Systems, a trucking firm based in Maryland, reports that the “unpredictability of pickup or delivery can increase load cost by 50% to 250. UPS reports that in Maryland, the average UPS truck delivery is delayed 36 minutes, costing them $1.1 million annually.
Add Highway Capacity
Local Roadway Improvements
Add Lanes to I ‑‑‑‑81Improve Highway
Maintenance
Relax Driver Rest Requirements
Add Lanes to I ‑‑‑‑64
Add Lanes to I ‑‑‑‑95
Heartland Corridor
Shift More Freight to Rail
Relax Truck Size/Weight Limits
Increase Transit Use
Expand Truck ParkingBetter Land Use
PlanningSimplify Rules and
Regulations
Virginia Statewide Multimodal Freight Study, Phase I
ES-25
Based on FHWA’s Highway Economic Requirements System (HERS) model for Virginia, in 2005, trucks on Virginia’s roads experienced an estimated 8.4 million hours of delay versus free flow conditions, with an equivalent cost of $278 million. The HERS model suggests that with average annual roadway maintenance and improvement expenditures of $2.7 billion per year – close to what Virginia currently spends -- Virginia truck delay could increase to 14.0 million hours in year 2035, with an equivalent cost of $466 million in current dollars.
���� Multimodal Needs and Planned Improvements
Multimodal Needs
Virginia’s freight transportation system is performing, overall, at a level sufficiently high to support the Commonwealth’s vibrant economy, and to accommodate high levels of global trade as well as pass-through traffic. The critical challenge will be to address current deficiencies, and to maintain and improve levels of performance in the face of projected growth in freight volumes, and to ensure that Virginia’s producers and consumers continue to benefit from safe, secure, and efficient freight movement.
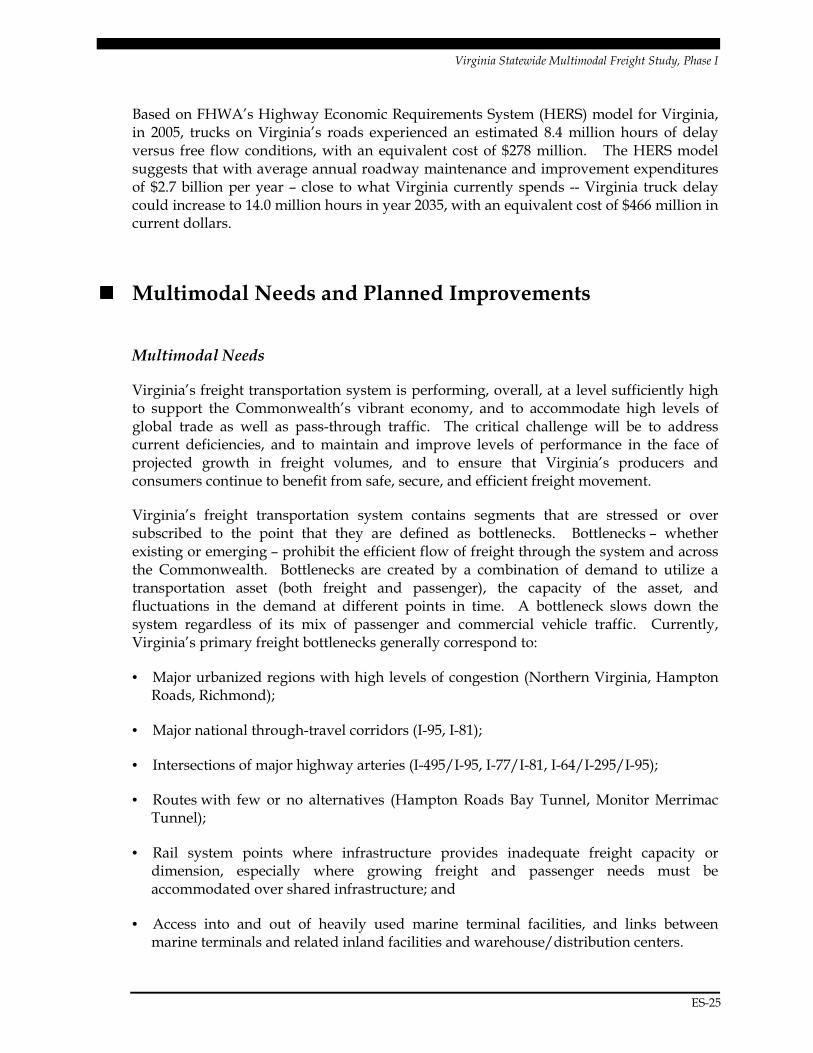
Virginia’s freight transportation system contains segments that are stressed or over subscribed to the point that they are defined as bottlenecks. Bottlenecks – whether existing or emerging – prohibit the efficient flow of freight through the system and across the Commonwealth. Bottlenecks are created by a combination of demand to utilize a transportation asset (both freight and passenger), the capacity of the asset, and fluctuations in the demand at different points in time. A bottleneck slows down the system regardless of its mix of passenger and commercial vehicle traffic. Currently, Virginia’s primary freight bottlenecks generally correspond to:
• Major urbanized regions with high levels of congestion (Northern Virginia, Hampton Roads, Richmond);
• Major national through-travel corridors (I-95, I-81);
• Intersections of major highway arteries (I-495/I-95, I-77/I-81, I-64/I-295/I-95);
• Routes with few or no alternatives (Hampton Roads Bay Tunnel, Monitor Merrimac Tunnel);
• Rail system points where infrastructure provides inadequate freight capacity or dimension, especially where growing freight and passenger needs must be accommodated over shared infrastructure; and
• Access into and out of heavily used marine terminal facilities, and links between marine terminals and related inland facilities and warehouse/distribution centers.
Virginia Statewide Multimodal Freight Study, Phase I
ES-26
Figure ES.22 Selected Virginia Freight Bottlenecks
The Commonwealth has a wide range of initiatives underway that will address freight bottlenecks. Some are freight oriented, while others benefit both freight and passengers. Some focus on a single mode, while others are based on the concept of multimodal and cross-modal benefit.
Highway Improvements
Much of Virginia’s transportation planning energy and funding is focused on highway issues and solutions. Key projects and initiatives include: the I-81 Near-Term Safety Improvements and Corridor Improvement Study; the I-81 Freight Rail Study (which explores the potential to divert trucks to rail); various I-95/I-395/Capitol Beltway improvement projects including HOT (high occupancy toll) lanes and toll lanes; I-66 Improvements; Route 460 Location Study; I-64 Improvements; potential Hampton Roads Third Crossing; I-564 Port Connector; and the Route 29 Corridor Study Phases II and III.
Other opportunities and innovative strategies may include: truck toll lanes; congestion pricing; expanded use of HOT (high occupancy toll) lanes; time shifting strategies to encourage off-peak highway use for both freight and passengers; truck parking improvements; advanced truck information systems; and truck-to-rail modal diversion opportunities, to the extent feasible.
Virginia Statewide Multimodal Freight Study, Phase I
ES-27
Rail Improvements
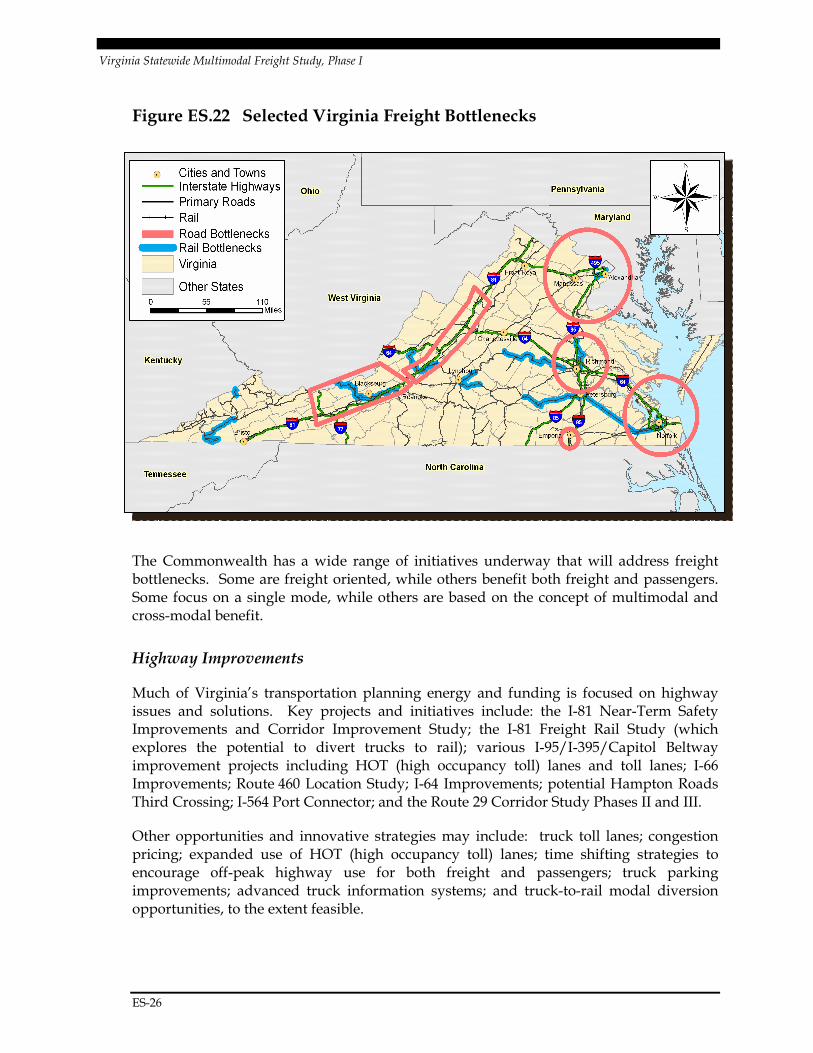
Today, at the system level, there are numerous rail chokepoints throughout the Commonwealth. Typical chokepoints include limited height and weight capability, insufficient mainline capacity, at-grade highway crossings, conflicts with passenger trains, and insufficient yard capacity. In 2004, the Virginia State Rail Plan (VSRP) identified a series of high-priority initiatives, including: the NS Heartland Corridor line between Hampton Roads and Columbus, Ohio; I-664/SR 164 Median Rail (providing service to the Virginia Port Authority’s planned container terminal at Craney Island); upgrades to the CSX mainline line paralleling I-95 between Richmond and Washington, DC; and development of the NS corridors paralleling I-81 for high-speed intermodal service.
Figure ES.23 Virginia State Rail Plan Initiatives and Studies
In addition to the Virginia State Rail Plan initiatives, other projects are being advanced through the Virginia Rail Enhancement Fund, a special fund dedicated for rail system improvements, including: Virginia’s contribution to the Heartland Corridor; acquisition of the Commonwealth Railway as part of the I-64/Route 664 Median Rail project; APM (Maersk) Terminals Rail Yard Expansion; and other projects. Other opportunities and innovative strategies may include: multistate rail funding compacts for projects with multistate benefits; advanced rail technologies; Intermodal Logistics Center development; utilization of short haul rail; development of improved north-south rail markets and services; and the potential for competitive Class I rail access to port facilities.
Virginia Statewide Multimodal Freight Study, Phase I
ES-28
Port Improvements
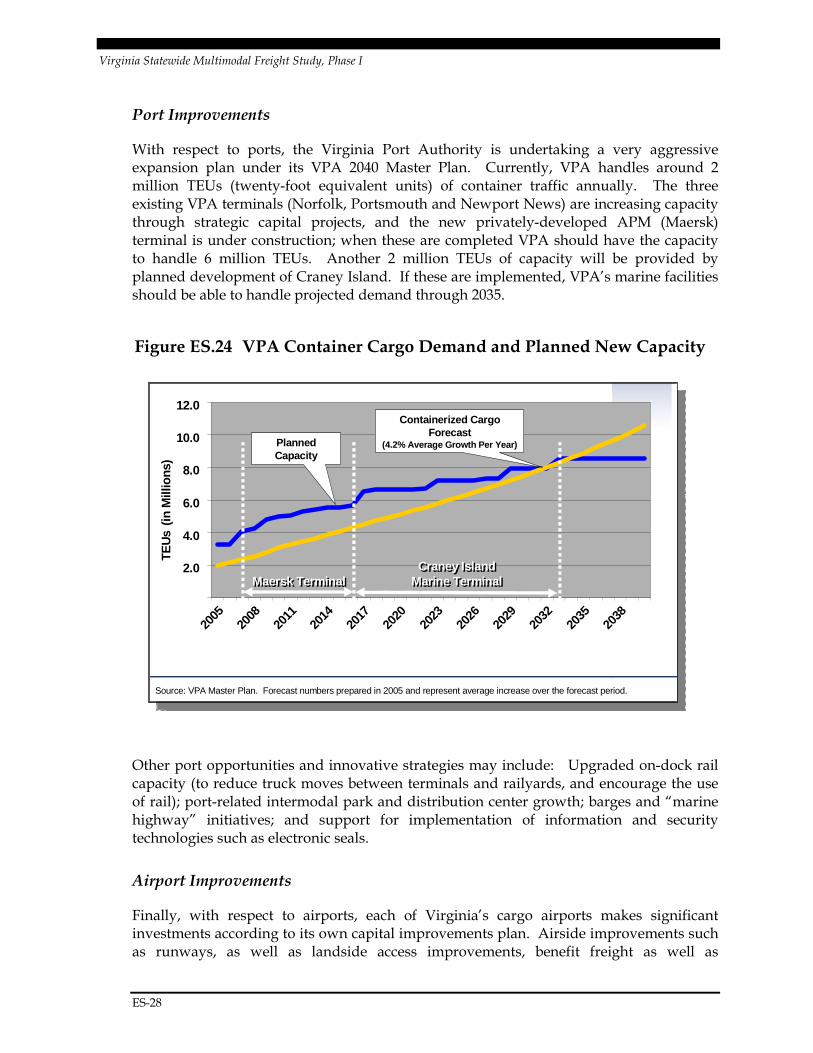
With respect to ports, the Virginia Port Authority is undertaking a very aggressive expansion plan under its VPA 2040 Master Plan. Currently, VPA handles around 2 million TEUs (twenty-foot equivalent units) of container traffic annually. The three existing VPA terminals (Norfolk, Portsmouth and Newport News) are increasing capacity through strategic capital projects, and the new privately-developed APM (Maersk) terminal is under construction; when these are completed VPA should have the capacity to handle 6 million TEUs. Another 2 million TEUs of capacity will be provided by planned development of Craney Island. If these are implemented, VPA’s marine facilities should be able to handle projected demand through 2035.
Figure ES.24 VPA Container Cargo Demand and Planned New Capacity
Other port opportunities and innovative strategies may include: Upgraded on-dock rail capacity (to reduce truck moves between terminals and railyards, and encourage the use of rail); port-related intermodal park and distribution center growth; barges and “marine highway” initiatives; and support for implementation of information and security technologies such as electronic seals.
Airport Improvements
Finally, with respect to airports, each of Virginia’s cargo airports makes significant investments according to its own capital improvements plan. Airside improvements such as runways, as well as landside access improvements, benefit freight as well as
Source: VPA Master Plan. Forecast numbers prepared in 2005 and represent average increase over the forecast period.
2.0
4.0
6.0
8.0
10.0
12.0
2005
2008
2011
2014
2017
2020
2023
2026
2029
2032
2035
2038
TEU
s(in
Mill
ions
)
Containerized Cargo Forecast
(4.2% Average Growth Per Year)Planned Capacity
Maersk Terminal Maersk Terminal Craney Island
Marine TerminalCraney Island
Marine Terminal
Virginia Statewide Multimodal Freight Study, Phase I
ES-29
passengers. At Dulles, extension of Metro to Dulles Airport will free up capacity on the existing two-lane toll road for use by autos and trucks.
This study did not identify significant air cargo bottlenecks. However, positive opportunities for Virginia airports to be more competitive with out-of-state airports for international services, as well as the potential for increased domestic cargo service from existing and additional airports, should continue to be explored.
Taking a Multimodal Approach
Virginia’s public transportation agencies, communities, and private stakeholders already have done extensive work in identifying and advancing freight-supporting infrastructure projects. Phase II of the Statewide Multimodal Freight Study aims to evaluate these projects and identify additional opportunities. Freight advocates would like to see all freight-benefiting projects advanced as soon as practical, but it must be recognized that progress on many – if not most – will depend on the identification of new revenues, and the timetable for accomplishing this is far from certain. In the meantime, due to funding limitations, project opportunities will need to be carefully prioritized and trade-offs evaluated, to obtain the greatest public benefit for the least public cost.
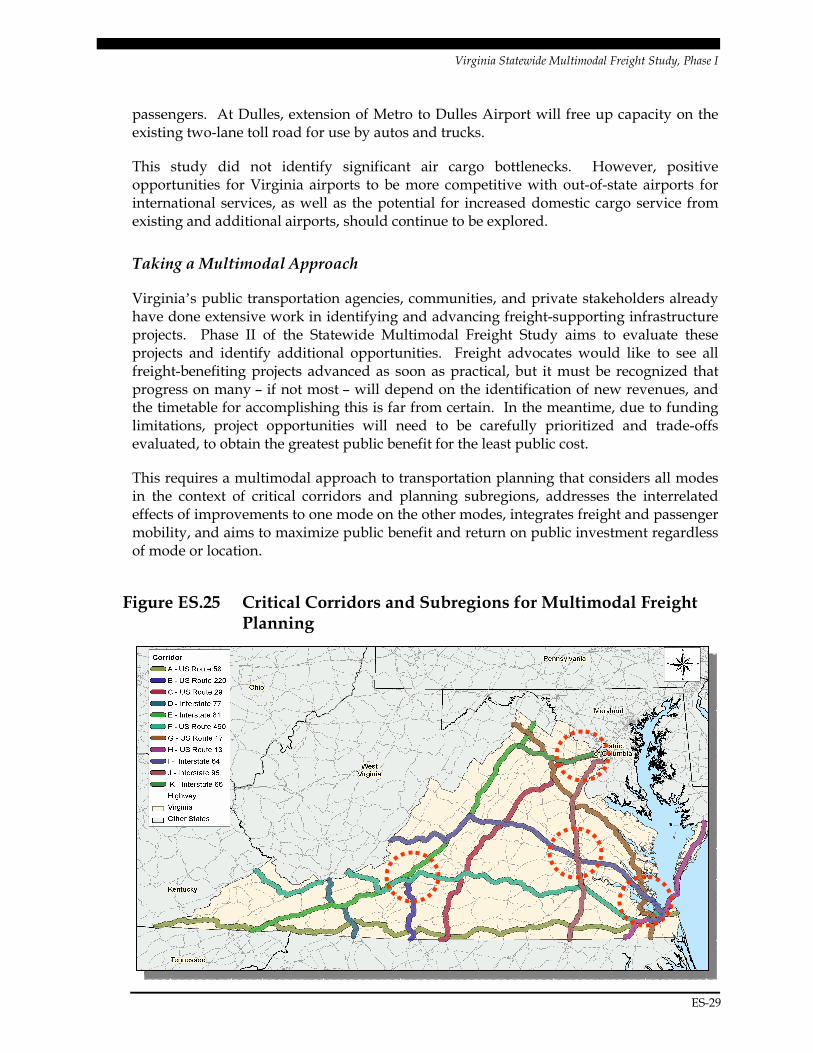
This requires a multimodal approach to transportation planning that considers all modes in the context of critical corridors and planning subregions, addresses the interrelated effects of improvements to one mode on the other modes, integrates freight and passenger mobility, and aims to maximize public benefit and return on public investment regardless of mode or location.
Figure ES.25 Critical Corridors and Subregions for Multimodal Freight Planning
Virginia Statewide Multimodal Freight Study, Phase I
ES-30
���� Conclusions and Next Steps
Phase I of the Virginia Statewide Multimodal Freight Study was designed primarily to collect data, inventory conditions and needs, and draw general conclusions. These conclusions include the following:.
• Maintaining and improving freight system performance – in terms of travel time, cost, reliability, capacity, safety, and security -- will enhance Virginia’s competitiveness and attractiveness as a business economic location, as a preferred gateway for global trade, and as one of the nation’s most attractive places to live and work.
• Currently, Virginia’s freight system is generally performing at a high level, but it faces increasing pressure to maintain performance and keep pace with growing demand.
• Virginia has significant freight needs, with significant costs, and very constrained funding for improvements. It is critical to make the most efficient use of Commonwealth resources, public-private partnership opportunities, and innovation. This requires a multimodal approach to freight transportation planning and programming, supported by the best available data and analytical tools, and informed by meaningful input from public and private interests.
• The next step is to develop freight policy and infrastructure recommendations, along with the transportation and economic analyses necessary to support them.
Phase II of the Virginia Statewide Multimodal Freight Study is envisioned to have five major components:
• Data and analytical tools development, addressing both freight transportation system modeling and economic cost-benefit analysis.
• Freight project planning for critical corridors and subregions, including freight planning analyses, including identification and analysis of recommended multimodal projects.
• Statewide policy analysis, addressing program-level impacts, regulation, funding and other priority issues, with identification of recommended approaches.
• Expanded public and stakeholder outreach, to obtain input and feedback on potential strategies and recommendations.
• Institutional and organizational recommendations to help the Commonwealth best approach freight challenges in the coming years, through performance-based freight planning.
Finally, Phase II should address a series of difficult but important questions:
Virginia Statewide Multimodal Freight Study, Phase I
ES-31
• Given Virginia’s projected freight needs, and given the improvements that are already in the planning stages, is it enough? Or will there still be critical deficiencies?
• What are the economic and transportation infrastructure costs to Virginia of these deficiencies? Conversely, what are the economic benefits of addressing them?
• What additional improvements – whether infrastructure, policy, or institutional – will be needed to meet Virginia’s emerging and future needs? How will critical corridors and regions be affected? What are the key scenarios and variables for growth, the environment, and other critical factors?
• How will needed improvements be funded? What are the fair and appropriate contributions of governments, and of the private sector?
• How should the Commonwealth approach freight planning on a consistent institutional basis, with its public and private sector partners, in Virginia and other states?


![Multimodal Movement of Freight - Transportation.org · Multimodal Movement of Freight 2017 SCORT Annual Meeting Oakland, CA [Insert RR Graphic] Stephen O’Connor. FRA – Office](https://img.dokumen.tips/doc/110x75/5edc3e73ad6a402d6666d4a2/multimodal-movement-of-freight-multimodal-movement-of-freight-2017-scort-annual.jpg)