Embed Size (px)
Citation preview

. 1-1
Central Florida Regional Freight Mobility Study
reportfinal
prepared for
MetroPlan Orlando
FDOT District 5, Lake‐Sumter MPO, Space Coast TPO, and Volusia TPO
prepared by
Cambridge Systematics, Inc.
with
HDR Engineering, Inc. Canin Associates Aviation Analytics


Central Florida Regional Freight Mobility Study Final Report
Cambridge Systematics, Inc. i
Table of Contents
1.0 Introduction ......................................................................................................... 1‐1 1.1 Why is Goods Movement Important to the Region? .......................................... 1‐1 1.2 Why Develop a Regional Freight and Goods Movement Plan? .......................... 1‐1 1.3 How Was the Plan Developed? ........................................................................... 1‐2
2.0 The Region’s Economy in Motion ......................................................................... 2‐1 2.1 Economic Overview of the Study Area ............................................................... 2‐1 2.2 Linking the Economy to the Freight and Goods Moving in the Region .............. 2‐2 2.2 Regional Freight System Profile .......................................................................... 2‐6 2.3 Freight Transportation and Logistics Patterns of Key Industries ........................ 2‐11 2.4 Summary of Current Regional Freight and Goods Movement Analysis ............. 2‐13
3.0 Future Freight Demand and Economic Opportunities ........................................... 3‐1 3.1 Forecast of Future Freight and Goods Movement ............................................. 3‐1 3.2 Future Economic Opportunities .......................................................................... 3‐7
4.0 Regional Freight Needs and Deficiencies ............................................................... 4‐1 4.1 System Capacity .................................................................................................. 4‐1 4.2 Land Use Conflicts ............................................................................................... 4‐4 4.3 Safety .................................................................................................................. 4‐4 4.4 Community and Environmental Impacts ............................................................ 4‐6 4.5 Regional Approach to Addressing Freight Needs ............................................... 4‐6
5.0 Regional Solutions and Recommendations ........................................................... 5‐1 5.1 Overview ............................................................................................................. 5‐1 5.2 Infrastructure Solutions and Recommendations ................................................ 5‐3 5.3 Operational Solutions and Recommendations ................................................... 5‐13 5.4 Institutional Solutions and Recommendations ................................................... 5‐14


Central Florida Regional Freight Mobility Study Final Report
Cambridge Systematics, Inc. iii
List of Tables
2.1 Florida and East Central Region Population ............................................................... 2‐1
2.2 Inbound, Outbound, and Intracounty Freight Flows by County 2010; Tons in Thousands ............................................................................................ 2‐5
5.1 Regional Freight System Infrastructure Solutions and Recommendations ................ 5‐4
List of Figures
2.1 Central Florida Freight Study Multimodal Freight Transportation Network .............. 2‐7
2.2 Average Annual Daily Truck Traffic (AADTT); 2011 .................................................... 2‐9
2.3 Industrial Employment Locations; All Sectors ............................................................ 2‐12
3.1 Future Regional Freight Flows .................................................................................... 3‐3
3.2 Forecasted 2040 Truck Volumes ................................................................................ 3‐4
3.2 Inbound, Outbound, Intracounty, and Through Freight Tonnage by County; 2010 to 2040 ............................................................................................................... 3‐6
4.1 Regional Priority Freight Subsystem ........................................................................... 4‐2
4.2 Commercial Vehicle Crash Locations on State Roads 2006 to 2010 ............................................................................................................... 4‐5
5.1 Recommendation Development Process ................................................................... 5‐2
5.2 Performance Measure Framework ............................................................................. 5‐16


Central Florida Regional Freight Mobility Study Final Report
Cambridge Systematics, Inc. 1-1
1.0 Introduction
1.1 Why is Goods Movement Important to the Region?
The Central Florida region, which includes Orange, Osceola, Seminole, Lake, Sumter, Brevard, and Volusia Counties, is home to vibrant and growing population and local and regionally significant businesses supported by an expanding multimodal transportation system. Identifying and implementing improvements to accommodate increasing demand for freight and goods movement in the Central Florida region is critical to the region’s economic vitality and quality of life. The Central Florida region’s economy relies, in large part, on its transportation assets such as the region’s interstate and state highways, Class I and regional railroads, deep water ports, and international airports. This is reflected by the fact that a significant share of the region’s employment is in industries that depend upon the freight industry, including:1
31,785 transportation and warehousing jobs in 2011;
6,344 air transportation‐related jobs in 2011;
201.4 million tons of freight moved to, from, through, and within Central Florida;
$2.3 billion in transportation and warehousing value‐added; and
For every million tons of freight moved in Central Florida, 155 direct transportation jobs and $7 million in direct income is created.
1.2 Why Develop a Regional Freight and Goods Movement Plan?
Developing a regional goods movement plan is critical to the region and its citizens due to the role of freight in the following policy areas:
Economic Competitiveness – Freight movement is important to the economy because the higher the cost of moving goods, the higher the cost of doing business and the higher the cost of living in the region. A higher cost of living impacts the region’s ability to attract and retain jobs in the region.
Regional Mobility – Significant portions of the region’s primary freeways and major arterials operate near capacity, leading to significant congestion and delay. Freight is a contributing
1 Figures are for 2010 from the U.S. Bureau of Labor Statistics, State and Area Employment Annual Averages.

Central Florida Regional Freight Mobility Study Final Report
1-2 Cambridge Systematics, Inc.
factor and it is projected that for every 100 trucks on the region’s roads today, there will be up to 160 trucks in 2035.2
Air Quality – The freight sector is associated nationally with increasing pollution, especially emissions of criteria pollutants (and is a particularly significant source of NOx and particulate matter (PM) due to the prevalence of diesel engines), air toxics, and greenhouse gases. This includes emissions from both mobile sources such as trucks, and stationary sources such as rail yards. Emissions from the movement of freight can have serious impacts on public health, environmental and the region’s economy.
Safety – Safety concerns arise from several sources, including trucks and passenger vehicles sharing the same roadways, passenger and freight trains sharing same rail tracks, at‐grade rail crossings and the transport of hazardous materials. Understanding the risks associated with goods movement is the first step in mitigating those risks.
Community Impacts – Freight transportation and facilities give rise to other negative community impacts if not properly planned, including noise, light and pollution, excessive vibration, and wear and tear on roadways. Disadvantaged persons such as low income, minority and low income often are more adversely impacted by freight transportation activities because they are more likely to live in close proximity to freight intensive facilities and industries.
1.3 How Was the Plan Developed?
The steps for developing the regional freight and goods movement plan include identifying the key elements of the region’s freight transportation system, estimating the current and future level of freight flows, assessing existing and future conditions, and developing recommendations. In addition to data collection and analysis, each of steps included private and public sector stakeholder input in the form of interviews, meetings and surveys. A series of technical reports were develop around these steps and as described below.
Current Regional Freight and Goods Flow Profile. The freight and goods moving into, out of, and through the region are analyzed and documented for the base year of 2010. The analysis examined what type of commodities are moving, how they moving and where they are moving. The flows are documented for the region as a whole and for individual counties.
Regional Freight and Goods Movement Facilities Profile. An inventory and assessment of the highway, rail, air, water, and space transportation system in the seven‐county study region is conducted. In addition, freight‐supported land use that supports users of that system are documented and described and a regional priority freight subsystem is identified.
2 Regional Freight and Goods Movement Facilities Profile, Central Florida Regional Goods Movement Study.

Central Florida Regional Freight Mobility Study Final Report
. 1-3
Future Regional Freight and Goods Flow Profile. The amount of goods and freight moving in the region is expected to increase as the region grows. Two alternative forecasts based on two different forecasts of national and statewide freight flows of regional freight and goods movement in 2035 were developed and documented. The forecasts documented what type of commodities will be moving, how they will be moving and where they will be moving in 2035. The forecasts are presented for the region as a whole and the for individual counties.
Regional Freight and Goods Movement Needs Assessment. The focus on those of regional significance (as opposed to local) and include mobility needs, community impact mitigation needs, and regulatory and institutional bottlenecks. The challenges range from significant delay on the road and rail systems, deficient intermodal connectors, interchange bottlenecks, significant safety concerns, air quality concerns, and significant community impacts.
Regional Freight and Goods Movement Recommendations. The recommendations are grouped into three categories; physical infrastructure, operations, and institutional recommendations are developed using public and private sector input, data analysis and modeling, best practices and ground observations. A screening process based on the plan goal and objectives leads to a final set of short‐term, medium‐term, and long‐term recommendations.
This final report draws from this set of technical reports and is organized as follows:
Section 2.0 provides a profile of relationship between current regional freight and goods movement and the region’s economy;
Section 3.0 discusses future freight flows and economic opportunities;
Section 4.0 summarizes current and future needs and deficiencies; and
Section 5.0 puts forth short‐, medium‐, and long‐term solutions and recommendations.

Central Florida Regional Freight Mobility Study Final Report
Cambridge Systematics, Inc. 2-1
2.0 The Region’s Economy in Motion
2.1 Economic Overview of the Study Area
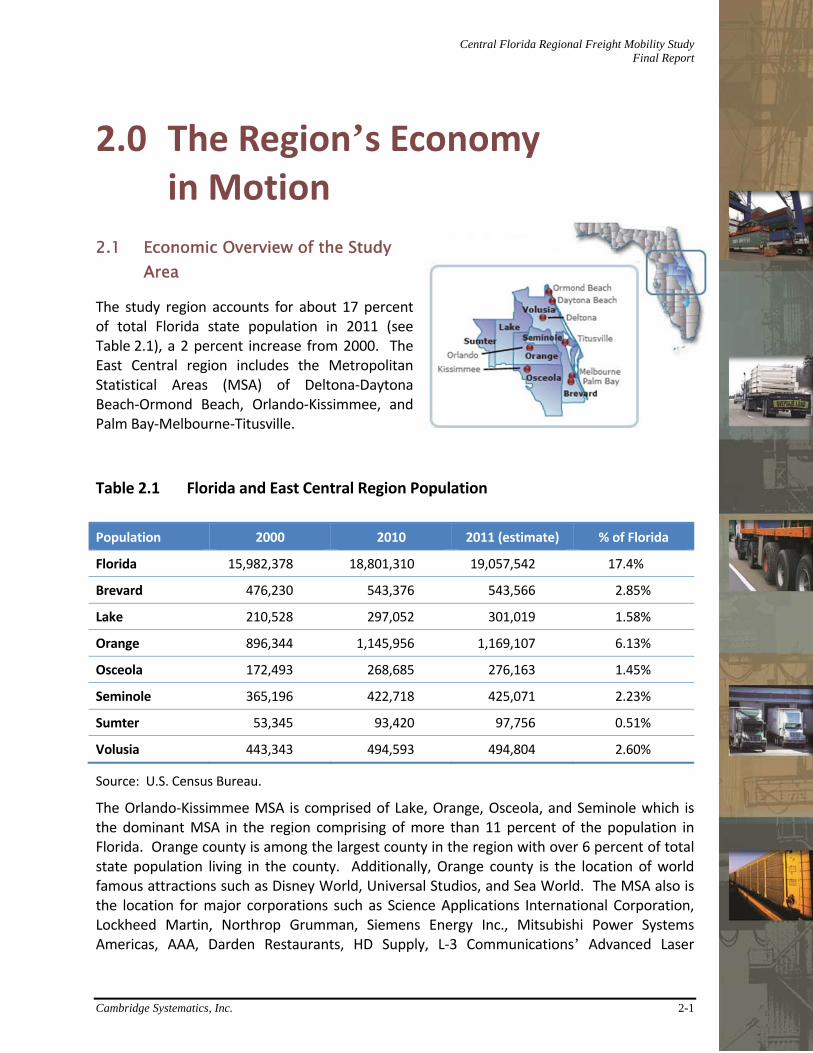
The study region accounts for about 17 percent of total Florida state population in 2011 (see Table 2.1), a 2 percent increase from 2000. The East Central region includes the Metropolitan Statistical Areas (MSA) of Deltona‐Daytona Beach‐Ormond Beach, Orlando‐Kissimmee, and Palm Bay‐Melbourne‐Titusville.
Table 2.1 Florida and East Central Region Population
Population 2000 2010 2011 (estimate) % of Florida
Florida 15,982,378 18,801,310 19,057,542 17.4%
Brevard 476,230 543,376 543,566 2.85%
Lake 210,528 297,052 301,019 1.58%
Orange 896,344 1,145,956 1,169,107 6.13%
Osceola 172,493 268,685 276,163 1.45%
Seminole 365,196 422,718 425,071 2.23%
Sumter 53,345 93,420 97,756 0.51%
Volusia 443,343 494,593 494,804 2.60%
Source: U.S. Census Bureau.
The Orlando‐Kissimmee MSA is comprised of Lake, Orange, Osceola, and Seminole which is the dominant MSA in the region comprising of more than 11 percent of the population in Florida. Orange county is among the largest county in the region with over 6 percent of total state population living in the county. Additionally, Orange county is the location of world famous attractions such as Disney World, Universal Studios, and Sea World. The MSA also is the location for major corporations such as Science Applications International Corporation, Lockheed Martin, Northrop Grumman, Siemens Energy Inc., Mitsubishi Power Systems Americas, AAA, Darden Restaurants, HD Supply, L‐3 Communications’ Advanced Laser

Central Florida Regional Freight Mobility Study Final Report
2-2 Cambridge Systematics, Inc.
Systems Technology, Electronic Arts’ Tiburon Studios, Ruth’s Chris Steak House, the Amateur Athletic Union, and international simulation companies Adacel and Indra Systems’ U.S. operations to name a few.3
Volusia county is the sole county in the Deltona‐Daytona Beach‐Ormond Beach MSA which consists of over 2.6 percent of population in the State. This region is known for their manufacturing base supporting more than 430 manufacturing companies with production focusing on medical related products, automotive components, aviation, and marine recreational products. Among the leading manufacturers are Covidien (formerly Tyco Kendal Healthcare), Florida Manufacturing, Ocean Design/Teledyne, Boston Whaler, Brunswick Corporation’s Government and Commercial Division, Sparton Electronics Corporation, Gambro Renal Products, Hawaiian Tropics, and Raydon Corporation.4
Palm Bay‐Melbourne‐Titusville MSA includes Brevard county and is known as the Space Coast with NASA’s John F. Kennedy Space Center as the primary spaceport. In addition, the region houses the Naval Ordnance Test Unit and the 45th Space Wing which includes Patrick Air Force Base, Cape Canaveral Air Force Station, Florida instrumentation stations, and the island stations of the Eastern Range. In support of the Space Coast, Brevard county is home to several high‐tech companies such as Harris Corporation, Northrop Grumman, United Space Alliance, and Boeing.5
These counties in the East Central region accommodate several industries that are dependent upon transportation to move goods and people into, out of, and around the region, including:
Transportation and warehousing;
Food production and distribution;
Convention and tourism;
Construction; and
Spaceport operations and high‐tech manufacturing.
2.2 Linking the Economy to the Freight and Goods Moving in the Region
Goods movement is a derived demand meaning that freight volumes grow as population, income, and employment grow. For example, as population grows, so does the demand for housing and construction supplies. In addition, more people means demand for more food,
3 All information provided by www.eflorida.com.
4 Ibid.
5 Ibid.

Central Florida Regional Freight Mobility Study Final Report
Cambridge Systematics, Inc. 2-3
clothing and other consumer goods. As wages or income increase, people demand more and higher value consumer goods. Finally, employment growth means business expansion and relocation which means business inputs and finished goods have to be shipped. In summary, freight only moves if residents or businesses demand those goods. The more residents and businesses in the regions, the greater the demand for freight and goods to be moved on the region’s transportation system.
Because of the relationship between the freight movement and the economy, the region’s freight story can be told by linking the goods moving in the region to the region’s economy.
A summary of key linkages are presented below.
Nearly 202 million tons of imports, exports, intraregional, and through freight moved over the Central Florida study region’s transportation network in 2010. Nineteen percent of this traffic were imports consisting of finished consumer goods for the region’s residents and tourists as well as supplies for local manufacturers and businesses; 11 percent were exports from the region’s which represent an inflow of revenue into the region; 10 percent were goods moving within the region representing local business to business sales, and 60 percent passed through region, much of it on its way to or from one of the State’s many seaports.
When measured by weight, 95 percent of the regional freight moved by truck, 4 percent rail, 1 percent water, and less than 1 percent air in 2010. This is not surprising given that trucks provide the greatest flexibility and reliability, both of which are critical in the movement most demanded by the region’s key industries which include tourism, construction and manufacturing. These industries generate significant amounts of higher value, time‐sensitive consumer goods and manufacturing and construction inputs
Orange County is the largest economy (both in terms of population and employment) in the region and thus the largest generator and receiver of freight within the region. It accounted for more than 45 percent of all inbound tonnage and over 40 percent of all outbound tonnage in 2010. Brevard County accounted for 23 percent of all outbound tonnage.

Central Florida Regional Freight Mobility Study Final Report
2-4 Cambridge Systematics, Inc.
Truck Flows
In 2010, over 191 million tons of freight was hauled by truck over the region’s roadway infrastructure.
Fifteen percent of this traffic was imported, 12 percent was exported, 11 percent was intraregional, and 62 percent was moving through the region (i.e., had both an origin and a destination outside of the study area).
Rail Flows
In 2010, more than 9 million tons of inbound, outbound, and intraregional freight was hauled by rail over the region’s rail network. Ninety‐five percent of this traffic was inbound or imported, and 5 percent was outbound or exported. A large percentage of the goods using rail are construction related material, thus the imbalance of inbound tonnage relative to outbound volumes.
By weight, the rail freight was 92 percent carload, and 8 percent intermodal. By number of railcars, 62 percent was carload, and 38 percent was intermodal.
Matching Commodities to Industries
The top three commodity groups moving inbound, outbound and intraregionally in 2010 are nonmetallic ores and minerals, clay, concrete, glass and stone products, and warehoused goods (defined here as freight flows to and from distribution centers or via intermodal facilities and typically represents consumer goods). Together they account for more 70 percent of total commodities by weight. These goods correspond to the fact that the region’s economy is driven by population and tourism growth.
Both of these factors give rise to construction activities and the demand for consumer goods. Thus, the faster population grows, the more freight there will be moving in the region.
In 2010, the top truck commodity was nonmetallic ores and minerals, which accounted for 30 percent of total truck tonnage. Clay, concrete, glass and stone products were second (25 percent of total truck tonnage), and warehoused goods (19 percent of total truck tonnage) was third.
In 2010, the top rail commodity was nonmetallic ores and minerals, which accounted for 47 percent of the region’s total rail tonnage (i.e., sum of inbound and outbound rail tonnage).

Central Florida Regional Freight Mobility Study Final Report
Cambridge Systematics, Inc. 2-5
Coal was second (25 percent of total rail tonnage), and food and kindred products were third (6 percent of total rail tonnage).
Top Trading Partners
The top three trading partners of the study region – Miami‐Dade County, Marion County, and Polk County – account for about 28 percent of total inbound and outbound freight flows by weight. The region’s economy is closely linked to these regions, with Miami‐Dade often driving demand for Central Florida goods and services while the study region’s economy and freight demand drives development in Polk and Marion Counties.
To better understand which portions of the Central Florida study region are impacted by which types of freight movement, county‐level freight profiles were developed. Table 2.2 shows 2010 freight tonnage for inbound, outbound, and intracounty movements for each of the seven counties in the study region. Orange County is the jurisdiction with the highest level of freight accounting for 40 percent of the freight tonnage moving into, out of and within the region. Brevard County with Port Canaveral follows, accounting for 20 percent of the freight activity inbound, outbound and intraregionally.
Table 2.2 Inbound, Outbound, and Intracounty Freight Flows by County 2010; Tons in Thousands
Direction Brevard Lake Orange Osceola Seminole Sumter Volusia
Inbound 7,292 5,611 23,920 2,598 8,474 1,079 3,907
Outbound 10,422 4,777 12,104 458 2,074 5,009 3,388
Intracounty 1,388 832 2,584 12 171 3 471
Total 19,101 11,221 38,608 3,068 10,719 6,091 7,766
Source: 2010 FDOT Trade and Logistics dataset and 2009 full Surface Transportation Board (STB) Waybill dataset.

Central Florida Regional Freight Mobility Study Final Report
2-6 Cambridge Systematics, Inc.
2.2 Regional Freight System Profile
The Central Florida regional multimodal freight transportation system that keeps the region’s economy moving is comprised of:
More than 17,900 centerline miles of roadways of which approximately 520 miles are interstates or other toll expressways and approximately 1,094 miles are principal arterials carrying nearly 200 million tons of goods annually. Trucks hauling goods share these roadways with commuters as well as tourists and other visitors to the region.
A Class I railroad – CSX – operating 2,800 miles (1,508 route miles) of track in Florida and carrying more than 9 million tons of local freight annually; the Florida East Coast Railway (FEC), a Class 2 railroad that operates approximately 115 miles of track within the study area and interchanges with both CSX and Norfolk Southern Railway (NS) in Jacksonville; and the Florida Central Railroad (FCEN), a Class 3 railroad that operates approximately 66 miles of track in the study area and interchanges with CSX in Orlando.
One deepwater port, Port Canaveral, which handles more than 3‐million tons of freight annually plus Space Florida, a major spaceport on the east coast
Air cargo facilities at Orlando International Airport (MCO), Orlando‐Sanford International, Melbourne International, and Daytona Beach International that handle more than 190,000 tons of domestic and international air freight annually.
The efficient movement of goods depends on a well functioning transportation infrastructure. Businesses and customers depend on trucks and highways, railroads and airplanes to connect them to markets and grow the regional economy. Inventorying the freight transportation system in Central Florida and identifying areas of strength and weakness will help planners develop and maintain a system to support economic development. Figure 2.1 displays the Region’s multimodal goods movement system.

Central Florida Regional Freight Mobility Study Final Report
Cambridge Systematics, Inc. 2-7
Figure 2.1 Central Florida Freight Study Multimodal Freight Transportation Network
Source: FDOT.

Central Florida Regional Freight Mobility Study Final Report
2-8 Cambridge Systematics, Inc.
Four main modes of transportation: trucks, trains, ships, and airplanes are available to freight users in Central Florida.6 These transportation modes utilize the existing freight infrastructure, including the region’s highways, rail network, airports, seaports, and support facilities (such as truck to rail transloading facilities and freight‐oriented land use). Shippers and receivers generally decide on the appropriate mode to use with consideration for time, cost, convenience and flexibility, and reliability. While some modes have advantages for cost because of the high volume of commodities that can be carried by a single vehicle (i.e., rail or ship) tradeoffs may come in the timeliness of delivery and lack of flexibility at the receiving end. Alternatively, other modes (such as airplanes) may carry much lower volumes of goods on each flight but are much more likely to be able to assure timely delivery at much higher costs.
Generally the most flexible mode of freight transport in the United States, trucks are the dominant mode in Central Florida. Shippers can utilize trucks not only for short, medium, and long‐haul truck trips, but also to provide the “last mile” link in the transportation chain, connecting commodities carried by other modes from intermediate destinations, such as seaports or rail terminals, warehouses, distribution centers, or manufacturing plants to their final destinations.
Highways – Truck movement in Central Florida relies on the interstate system, state and U.S. highways, and local roadways. Freight trucks utilize the entire roadway system, whether it is providing access to residential areas for garbage collection or local warehousing and distribution functions. The highway network plays a critical role connecting Central Florida’s businesses and consumers. In 2010, 191 million tons or 95 percent of the total freight tonnage moving into, out of, within and through the region was transported by truck. The current designated SIS highway network carries 55 percent of total traffic and more than 70 percent of all truck traffic and the study area’s roadway system experiences
traffic volumes (including trucks) in excess of 98 million vehicle miles per day. The major truck corridors in the region include I‐4, the Florida Turnpike, north‐corridors I‐75 and I‐95, and east‐west corridors SR 528 and SR 408, all carrying in excess of 10,000 trucks per day on many segments (Figure 2.2).
6 Although Spaceport is discussed in this report as a separate mode (within the seaports section), the discussion is mostly focused on the landside transportation connections to support space travel as opposed to the freight operations of space vehicles themselves.

Central Florida Regional Freight Mobility Study Final Report
Cambridge Systematics, Inc. 2-9
Figure 2.2 Average Annual Daily Truck Traffic (AADTT) 2011
Source: FDOT.

Central Florida Regional Freight Mobility Study Final Report
2-10 Cambridge Systematics, Inc.
Rail – Central Florida has a freight rail network comprised of Class I (CSX), Class II (FEC), and Class III (Florida Central) railroads. Only the existing CSX A‐line and the Florida Central line services the urban population center of the region. Rail carries about 9 million tons of freight annually within the region (close to 5 percent of the total freight tonnage).
Air – The region’s air cargo airports, including Orlando MCO, Orlando Sanford International, Melbourne International Airport in Brevard County, and Daytona Beach International collectively have 18 on‐airport cargo buildings with over 800,700 square feet of space for sort and consolidation activity. These airports handle more than 190,000 tons of domestic and international air freight annually, most of it loaded in the bellies of passenger carriers. The most prominent airport for air cargo in the region, Orlando MCO reported service by 27 separate airlines, connecting directly with 84 domestic destinations and 33 international destinations in 2011.
Seaports and Spaceport – Port Canaveral, the regions’ only Seaport, largely deals in bulk and breakbulk cargo, with just a small proportion of containers. In 2010, the Port handled about 3.2 million tons of bulk and breakbulk cargo, with over 60 percent accounted for by petroleum products.7 International waterborne freight through Port Canaveral accounts for about 1 percent of the total freight tonnage moving through the Central Florida region. Central Florida businesses also are served by several alternative seaports, including Jacksonville, Tampa, Miami, Port Everglades, and the Port of Savannah in Georgia. Space Florida, one of the premier spaceports in the United States, hosts dozens of space launch activities annually for NASA, as well as private companies, United Launch Alliance and SpaceX, among others at the Kennedy Space Center, Cape Canaveral Air Force Station, and Space Florida Spaceport.
Freight‐Dependent Land Use – Freight‐dependent land uses are defined in this study as those that support businesses whose operations include a major role for the movement of goods on the regional transportation system. This might denote land accommodating manufacturing activities, warehousing and distribution, or power generation (industrial land uses); or might include the extraction of gravel or petroleum products (mining land uses) and use of the transportation system to move those products to market. In Central Florida, with a major economic focus on the services industry, freight‐dependent land uses also might include accommodating retail and office uses (which would include, for example, deliveries of consumer products to hotels, resorts, or large regional shopping centers). Within the seven county study region are over 100,000 acres of industrial, retail/office, and mining land. Within the industrial category, the most commonly recognized freight‐dependent land use, there are several industrial land clusters in the seven county study area, including the Landstreet area west of Orlando International Airport, Silver Star Road and the Lockhart area (U.S. 441 and SR 414) in Orange County, and the area adjacent to Melbourne International Airport in Brevard County.
7 Port web site.

Central Florida Regional Freight Mobility Study Final Report
Cambridge Systematics, Inc. 2-11
2.3 Freight Transportation and Logistics Patterns of Key Industries
Profiling the logistics patterns of key industries can help establish the freight transportation needs of a region’s key industries, and how their operations impact the transportation system. The transportation infrastructure in Central Florida supports the regional economy by providing a means for goods to be brought into the region for consumption by regional users and goods produced by the region’s businesses to be transported out, providing revenue to support local and regional businesses. Understanding the transportation linkages between Central Florida and outside areas can provide insight into individual firm’s operations, as well as strengths and weaknesses in a regional economy and logistics system and business and economic trends, such as clusters of national and international growth and national transportation facilities that may have a competitive advantage to serve certain industries. Some key industries in Central Florida that can help illuminate these linkages and trends in Central Florida include the following:
Transportation and Warehousing (developed based on interviews with Service Trucking, Rooms to Go, Publix, Sysco, Carroll Fulmer Logistics, Saddle Creek Logistics, Lowes, and FedEx Freight);
Food Production and Distribution (developed based on interviews with Florida’s Natural Orange Juice, CKS Plastics, Service Trucking, Publix, and Sysco);
Convention and Tourism – Hotels (developed based on interviews with Disney, the Orange County Convention Center, GES, the Hyatt Regency Grand Cypress, Sysco, the Amway Center, and waste collectors: Waste Management and Waste Pro);
Construction (developed based on interviews with Florida Rock and Cemex); and
Spaceport Operations and High‐Tech Manufacturing (developed based on interviews with Spaceport, SpaceEx, FedEx Freight, and Freight Forwarders).
Traditionally, industrial activity with jobs in sectors, including manufacturing, warehousing and distribution, and construction activities, is the primary driver of goods movement activity. There are several major clusters of industrial employment within Central Florida, including the City of Orlando; the MCO airport area; near Sanford in Seminole County; near Deland and Daytona Beach in Volusia County; and smaller pockets in the Leesburg, Kissimmee, and Melbourne areas. Figure 4.1 displays the agglomeration of industrial employment within the study area by number of jobs.

Central Florida Regional Freight Mobility Study Final Report
2-12 Cambridge Systematics, Inc.
Figure 2.3 Industrial Employment Locations All Sectors
Source: InfoGroup Data provided by FDOT.
Note: Business locations with only one employee were omitted for map clarity. Due to the methods for collecting the data, all business locations may not be shown.

Central Florida Regional Freight Mobility Study Final Report
Cambridge Systematics, Inc. 2-13
2.4 Summary of Current Regional Freight and Goods Movement Analysis
Based on the modal evaluation, several key initial findings emerge, which will help to inform the needs assessment and future evaluation of freight facilities.
Highway
The current designated SIS system carries 55 percent of total traffic and more than 70 percent of all truck traffic on the State Highway System, almost all rail freight, 89 percent of all interregional rail and bus passengers, more than 99 percent of all commercial air passengers and cargo, and virtually all waterborne freight and cruise passengers.
The region is served by more than 17,900 centerline miles of roadways of which approximately 520 miles are interstates or other toll expressways and approximately 1,094 miles are principal arterials. The roadway system experiences traffic volumes (including trucks) in excess of 98 million vehicle miles per day.
In 2010, 191 million tons or 95 percent of the total freight tonnage moving into, out of, within and through the region is transported by truck. Of that share 62 percent is through traffic, 15 percent is inbound and 12 percent and 11 percent respectively is outbound and intraregional traffic.
Based on volume, the leading regional truck commodities are nonmetallic minerals, clay, concrete, glass and stone, and warehoused (i.e., consumer) goods accounting for nearly three quarters of the total truck tonnage. Food and petroleum products also play a major role, accounting for an additional 15 percent.
Overall the trucking community reports good operating conditions on the region’s major highway facilities however, some operational constraints or bottlenecks were reported, including short‐entrance ramps onto interstates which create merging hazards; excessive merging and weaving required along major freeways; insufficient turning radii on major arterials; numerous at‐grade crossings on major freight corridors; and lack of sufficient staging areas in and around freight terminals.
According to data from FDOT, the following state road segments have poor pavement conditions: I‐95 from SR 46 to SR 528 in Brevard County and U.S. 17‐92 from I‐4 Ramps to CR 4047 (Marsh Road) in Volusia County, however, the segment of I‐95 from SR 46 to SR 528 has programmed improvements to widen the freeway.
The number of “functionally obsolete” or “structurally deficient” structures (such as bridges) in the study area is approximately 10 percent of all structures in Brevard, Orange, Osceola and Seminole counties and approximately 20 percent of all structures for Lake, Sumter and Volusia counties. Up to half of all “functionally obsolete” or “structurally deficient” structures in the study area may be restrictive to some truck movements.

Central Florida Regional Freight Mobility Study Final Report
2-14 Cambridge Systematics, Inc.
A review of the crash history for a five‐year period between 2006 and 20108 for all roads in the study area reveals that the number of truck‐involved crashes in 2010 are approximately 36 percent less than in 2006, compared to a reduction of 4 percent for all crashes. The greatest concentration of crashes involving trucks occurs in the following areas: U.S. 17‐92/441 between SR 50 and Orange/Osceola County Line and SR 423 (John Young Pkwy) between SR 50 and SR 408.
Overwhelmingly, the major capacity concern for shippers and carriers of freight in the region is Interstate 4. Many users choose to avoid I‐4 except in the early morning hours and use toll roads with transponder‐equipped vehicles to get around the region.
Rail
Central Florida has a freight rail network comprised of Class I (CSX), Class II (FEC), and Class III (Florida Central) railroads. Only the existing CSX A‐line and the Florida Central line services the urban population center of the region. Operational changes are expected to occur in the near future with a portion of the current rail freight traffic rerouted to the CSX S‐line and a relocated rail terminal facility in Winter Haven, Florida (from Taft) as a result of initiation of the SunRail passenger service on the CSX A‐line. Currently, there are approximately 15‐20 trains per day operating on the CSX A‐line, including Amtrak passenger trains.
Previous studies reported that approximately 42 percent of the truck traffic in/out of the CSXT Taft facility was destined for the study area market with additional truck traffic passing through the study area. Consequently, it is expected that the relocation of the rail terminal facility will require longer truck trips on some of the study area’s major highway freight corridors.
Within Florida, FEC annually moves approximately 30 million tons of freight, including 100,000 carloads of aggregate from its rock distribution centers in Miami, Fort Pierce, Cocoa, Daytona, St. Augustine, and Jacksonville, as well as 170,000 new automobiles from its Miami automobile facility. Other important commodities moved by the FEC include: lumber, cement, chemicals, paper products, food products (including orange juice and pulp), primary metal products, machinery, bulk freight, and farm products.
Several stakeholders indicate reliability concerns with rail and many users utilize trucks that could otherwise utilize rail. One of the major obstacles to making rail freight more competitive with highway modes is the lack of any significant backhaul out of Florida.
8 FLHSMV Traffic Crash Statistics Report 2010.

Central Florida Regional Freight Mobility Study Final Report
Cambridge Systematics, Inc. 2-15
Air
The region’s air cargo airports, including Orlando MCO, Orlando Sanford International, Melbourne International Airport in Brevard County, and Daytona Beach International collectively have 18 on‐airport cargo buildings with over 800,700 square feet of space for sort and consolidation activity. These airports handle more than 190,000 tons of domestic and international air freight annually, most of it loaded in the bellies of passenger carriers.
The most prominent airport for air cargo in the region, Orlando MCO reported 27 separate airlines, providing direct service to 84 domestic destinations and 33 international destinations in 2011. MCO currently is targeting Asian and Middle‐Eastern markets for direct service, and is directly marketing to several carriers, including: China Air, ANA, Japan Airlines, China Eastern, Cathay Pacific, Air China, Qatar Airways, and Emirates.
Air cargo demand in the region is adequately met by current infrastructure capacity. Access to the airports is reported to be very good to excellent, particularly when compared to competing gateway airports, Atlanta‐Hartsfield International and Miami International. Some freight forwarders serving the airports report issues arising once drivers leave the immediate Airport environs, including: eastbound access to I‐4 via Tradeport Drive and Taft Vineland Road, at‐grade railroad crossings near the airport, congestion at the SR 528 toll both near the junction of SR 436, and the lack of an interchange between the SR 417 Beltway and the Florida Turnpike.
Freight Forwarder traffic originating or terminating in study area is often transited to Atlanta‐Hartsfield International and Miami International Airport versus the region’s airports due to several factors, including: greater range of destinations, frequency, and capacity at the competing airports, block space arrangements with carriers (i.e., guaranteed pre‐purchased space on aircraft), greater concentration of support services, and less seasonality/fluctuations of lift capacity.
Seaports and Spaceport
Port Canaveral, the regions’ only Seaport, largely deals in bulk and breakbulk cargo, with just a small proportion of containers. In 2010, the Port handled about 3.2 million tons of bulk and breakbulk cargo, with over 60 percent accounted for by petroleum products.9 International waterborne freight through Port Canaveral accounts for about 1 percent of the total freight tonnage moving through the Central Florida region.
The Port is actively working to diversify its business, from expanding bulk facilities (i.e., a recently opened petroleum tank farm) to exploring opportunities for expanding its
9 Port web site.
Central Florida Regional Freight Mobility Study Final Report
2-16 Cambridge Systematics, Inc.
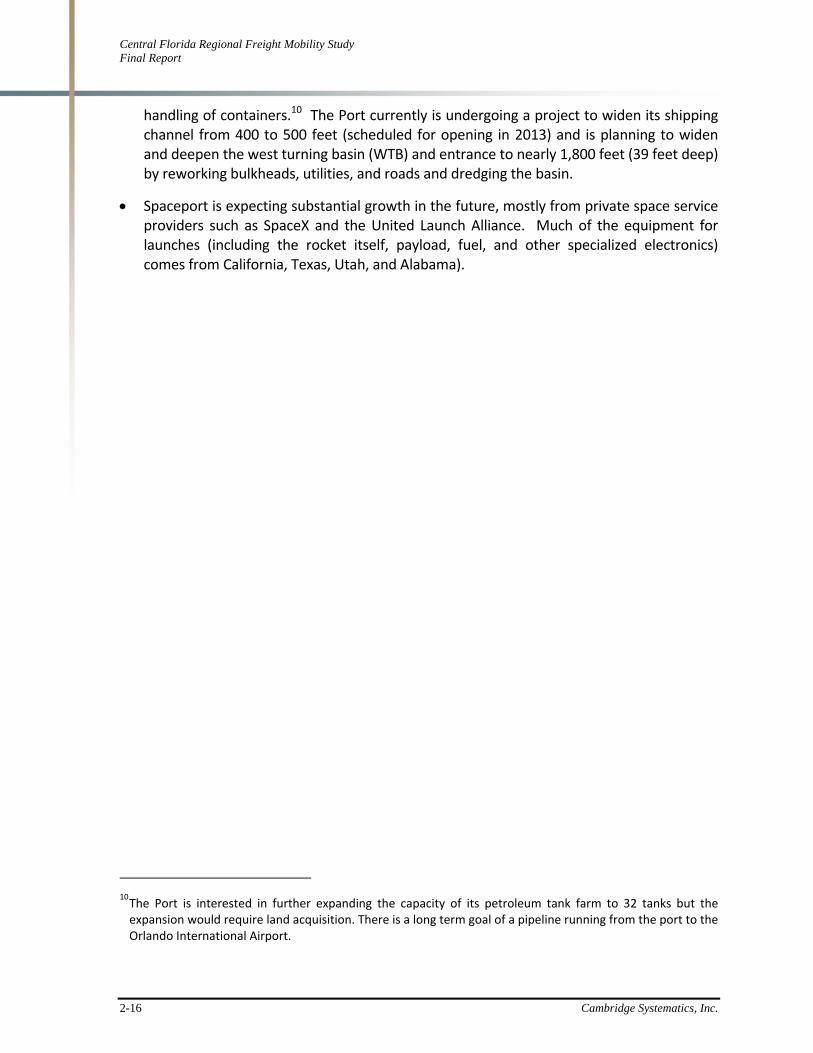
handling of containers.10 The Port currently is undergoing a project to widen its shipping channel from 400 to 500 feet (scheduled for opening in 2013) and is planning to widen and deepen the west turning basin (WTB) and entrance to nearly 1,800 feet (39 feet deep) by reworking bulkheads, utilities, and roads and dredging the basin.
Spaceport is expecting substantial growth in the future, mostly from private space service providers such as SpaceX and the United Launch Alliance. Much of the equipment for launches (including the rocket itself, payload, fuel, and other specialized electronics) comes from California, Texas, Utah, and Alabama).
10 The Port is interested in further expanding the capacity of its petroleum tank farm to 32 tanks but the expansion would require land acquisition. There is a long term goal of a pipeline running from the port to the Orlando International Airport.

Central Florida Regional Freight Mobility Study Final Report
Cambridge Systematics, Inc. 3-1
3.0 Future Freight Demand and Economic Opportunities
3.1 Forecast of Future Freight and Goods Movement
Freight demand is influenced by numerous factors, many of which are subject to change substantially over relatively short periods of times. These factors can be broadly grouped into the following categories:
Economic structure;
Industry supply chains and logistics;
Transportation infrastructure; and
Public policy, regulation, and governance.
An understanding of how the above factors impact freight demand is critical to understanding freight demand in a region and developing freight forecasts for planning purposes. While all of the factors will influence overall freight volumes and patterns, the factors most significantly impacting freight volumes in the Central Florida region are presented below.
Economic Factors Influencing Freight Demand
Freight demand is directly and positively related with the type and amount of economic activity in a region. The amount and type of goods production and consumption in an area and the relationship between producers, consumers, and intermediate suppliers impact the volume and spatial distribution of freight flows. The following components of the economy have the greatest influence on freight demand:
Types of industries;
Personal consumption;
Trade patterns; and
Economic geography or land use.
Global Trade Trends
Trade activity is a critical component of the economic structure of the region and can be divided into three broad categories – international, domestic, and local. Each of these trade categories have distinct freight demand characteristics in terms of the origin‐destination (O‐D)

Central Florida Regional Freight Mobility Study Final Report
3-2 Cambridge Systematics, Inc.
patterns of shipments, commodities handled, modes used, types of facilities used, length of haul, size of shipments, and time dependencies. For example, local trade in the region is dominated by trucking compared to international shipments, which depend heavily on marine, rail, and pipeline activity in addition to trucking.
The deepwater ports serving the region make the region a global gateway and opportunities exist for the region to expand its role in the global marketplace. However, positioning to take advantage of these opportunities requires an understanding of the global trade trends most likely to have the greatest impact on the region. These include the expansion of the Panama Canal and NAFTA and other trade agreements, especially with Central and South American countries.
Expansion of the Panama Canal, will allow it to maintain and even enhance its market share for trade between Asia and the United States. This expansion, scheduled for completion by 2014, will offer opportunities for the intermodal transportation system in the Central Florida region by accelerating growth at the region’s deepwater ports. In the short term, these impacts will be felt most heavily on and around the State’s largest container port.
While the widening of the Panama Canal offers opportunity to significantly increase the region’s role as a national gateway, there are some challenges. First, there are incentives for the west coast ports and railroads to compete heavily to prevent the diversion of traffic through the Canal. They have made significant investments in the facilities serving these trade flows and long‐term return depends on maintaining market share and volumes. They will compete by lowering prices and improving service.
Second, several east coast and other gulf coast and Caribbean ports and railroads are making significant investment to capture traffic that is diverted through the Canal and many of these ports are closer to large population centers on the east coast and the county’s midsection. In reality, the largest ships transversing the Canal will only call on a few number of ports regardless of the number of ports physically able to accommodate the vessels, and these decisions will be made by the steamship liners based on overall economic efficiency and profitability.
Regional Freight Forecasts
In 2010, 201 million tons of freight moved into, out of, within, or through the study region. By 2040 these flows are expected to grow within 35 to 61 percent amounting to 271 million and 325 million tons respectively. Inbound flows, at 38 million tons in 2010, are expected to grow 33 to 50 percent by 2040 to 50 million tons (conservative scenario) and 57 million tons (optimistic scenario) respectively. Twenty‐three million tons traveled outbound in 2010. These shipments are expected to increase 42 to 46 percent over the next 30 years to the 33 million to 34 million tons range. Intraregional freight was 21 million tons in 2010 and the 2040 projections estimate a modest increase of 1 to 12 percent (21 million to 23 million tons). Through freight in expected to increase from 120 million tons in 2010 to within the range of 164 million and 215 million tons over the next 30 years (see Figure 3.1).

Central Florida Regional Freight Mobility Study Final Report
Cambridge Systematics, Inc. 3-3
Figure 3.1 Future Regional Freight Flows
Source: CS analysis of the Florida Trade and Logistics Study data (Forecast 1) and the FHWA FAF 3
data (Forecast 2).
A summary of key findings and trends in the future regional commodity flow profile are presented below.
Commodity Flow Summary
Nearly 202 million tons of inbound, outbound, intraregional, and through freight moved over the Central Florida study region’s transportation network in 2010. Nineteen percent of this traffic was inbound, 11 percent was outbound, 10 percent was intraregional, and 60 percent was through traffic.
By 2040, inbound, outbound, intraregional and through freight is expected to increase to the range of 271 million to 325 million tons – a 35 to 61 percent increase respectively.
In 2040, the freight transportation mode split is expected to be 96 percent of the regional freight moved by truck, 3 percent rail, and 1 percent water via Port Canaveral.
Truck Flows
By 2040, inbound, outbound, intraregional, and through truck freight is expected to grow to 260 to 311 million tons, a 36 to 63 percent increase respectively depending on the low and high‐forecast scenario.
Forecast 1, the updated Trade and Logistics forecast, projects that by 2040 16 percent of the truck traffic will be inbound, 13 percent outbound, 9 percent intraregional, and 63 percent through traffic.
19% 19% 18%10%
8% 6%11%12% 10%
60%
61%
66%
0
50
100
150
200
250
300
350
2010 2040 (Forecast 1) 2040 (Forecast 2)
Tons (in Millions)
Inbound Intraregional Outbound Through

Central Florida Regional Freight Mobility Study Final Report
3-4 Cambridge Systematics, Inc.
Forecast 2, the FAF‐based forecast, projects that by 2040, 15 percent of the truck traffic will be inbound, 10 percent outbound, 7 percent intraregional, and 69 percent through traffic.
Figure 3.2 Forecasted 2040 Truck Volumes
Central Florida Regional Freight Mobility Study Final Report
Cambridge Systematics, Inc. 3-5
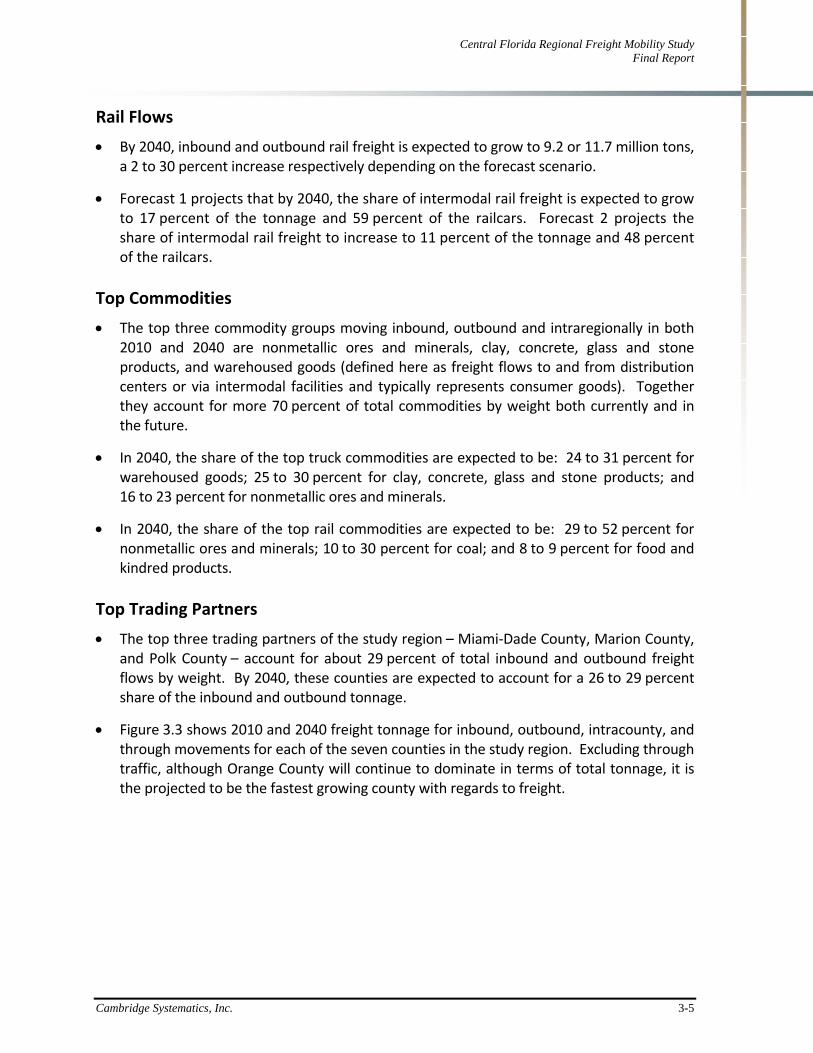
Rail Flows
By 2040, inbound and outbound rail freight is expected to grow to 9.2 or 11.7 million tons, a 2 to 30 percent increase respectively depending on the forecast scenario.
Forecast 1 projects that by 2040, the share of intermodal rail freight is expected to grow to 17 percent of the tonnage and 59 percent of the railcars. Forecast 2 projects the share of intermodal rail freight to increase to 11 percent of the tonnage and 48 percent of the railcars.
Top Commodities
The top three commodity groups moving inbound, outbound and intraregionally in both 2010 and 2040 are nonmetallic ores and minerals, clay, concrete, glass and stone products, and warehoused goods (defined here as freight flows to and from distribution centers or via intermodal facilities and typically represents consumer goods). Together they account for more 70 percent of total commodities by weight both currently and in the future.
In 2040, the share of the top truck commodities are expected to be: 24 to 31 percent for warehoused goods; 25 to 30 percent for clay, concrete, glass and stone products; and 16 to 23 percent for nonmetallic ores and minerals.
In 2040, the share of the top rail commodities are expected to be: 29 to 52 percent for nonmetallic ores and minerals; 10 to 30 percent for coal; and 8 to 9 percent for food and kindred products.
Top Trading Partners
The top three trading partners of the study region – Miami‐Dade County, Marion County, and Polk County – account for about 29 percent of total inbound and outbound freight flows by weight. By 2040, these counties are expected to account for a 26 to 29 percent share of the inbound and outbound tonnage.
Figure 3.3 shows 2010 and 2040 freight tonnage for inbound, outbound, intracounty, and through movements for each of the seven counties in the study region. Excluding through traffic, although Orange County will continue to dominate in terms of total tonnage, it is the projected to be the fastest growing county with regards to freight.

Central Florida Regional Freight Mobility Study Final Report
3-6 Cambridge Systematics, Inc.
Figure 3.2 Inbound, Outbound, Intracounty, and Through Freight Tonnage by County 2010 to 2040
Source: 2010 FDOT Trade and Logistics data, 2009 Full Surface Transportation Board (STB) Waybill data, 2040 Trade and Logistics New Forecast (Forecast 1) processed by Cambridge Systematics, and 2040 FAF3‐Based Forecast (Forecast 2) processed by Cambridge Systematics.
0
50,000
100,000
150,000
200,000
250,000
Brevard Lake Orange Osceola Seminole Sumter Volusia
Tons (in Thousands)
2010 2040 (Forecast 1) 2040 (Forecast 2)
Central Florida Regional Freight Mobility Study Final Report
Cambridge Systematics, Inc. 3-7
3.2 Future Economic Opportunities
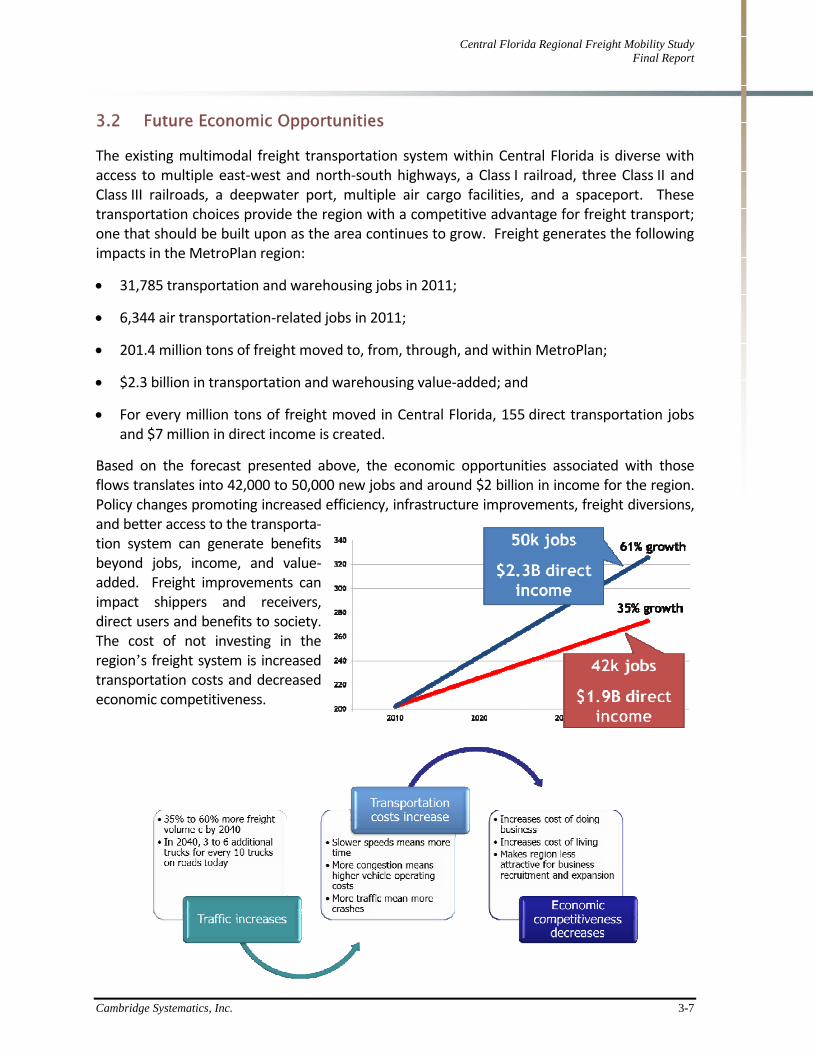
The existing multimodal freight transportation system within Central Florida is diverse with access to multiple east‐west and north‐south highways, a Class I railroad, three Class II and Class III railroads, a deepwater port, multiple air cargo facilities, and a spaceport. These transportation choices provide the region with a competitive advantage for freight transport; one that should be built upon as the area continues to grow. Freight generates the following impacts in the MetroPlan region:
31,785 transportation and warehousing jobs in 2011;
6,344 air transportation‐related jobs in 2011;
201.4 million tons of freight moved to, from, through, and within MetroPlan;
$2.3 billion in transportation and warehousing value‐added; and
For every million tons of freight moved in Central Florida, 155 direct transportation jobs and $7 million in direct income is created.
Based on the forecast presented above, the economic opportunities associated with those flows translates into 42,000 to 50,000 new jobs and around $2 billion in income for the region. Policy changes promoting increased efficiency, infrastructure improvements, freight diversions, and better access to the transporta‐tion system can generate benefits beyond jobs, income, and value‐added. Freight improvements can impact shippers and receivers, direct users and benefits to society. The cost of not investing in the region’s freight system is increased transportation costs and decreased economic competitiveness.

Central Florida Regional Freight Mobility Study Final Report
Cambridge Systematics, Inc. 4-1
4.0 Regional Freight Needs and Deficiencies
Current and future freight mobility needs were identified based on data, technical analysis, and stakeholder input presented above and in previous technical reports. The needs presented here are focused on those of regional concern and on the regional freight system identified presented in Figure 4.1 and in general represent systemic needs. Systemic needs can be defined as universal or general mobility issues that are broader in nature and may reflect infrastructure, operational, institutional and/or regulatory deficiencies or inefficiencies. Often, but not always, addressing systemic needs requires significant investment in terms of infrastructure and money and/or innovative solutions. The systemic needs for current and future freight mobility in the Central Florida region have been organized around four key issues, including:
System capacity;
Freight Land Use Opportunities and Conflicts;
Safety; and
Community and Environmental Impacts.
4.1 System Capacity
Congestion and resulting capacity deficiency were identified as a significant concern on the major interstates and freight routes. The ultimate goal of this plan is not to identify projects that simply add additional capacity, but rather identify a combination of solutions that maximize the velocity or throughput of the region’s multimodal transportation system. The first step in the process is understanding what is causing congestion since it is not always simply too much volume. The research conducted and documented as part of this needs assessment and in previous reports for this effort revealed three root causes of congestion, existing and projected.
First, there are physical infrastructure constraints on existing freight‐significant roadways. These range from the need for new capacity addition to operational improvements, including infrastructure management and business practices and institutional bottlenecks.
Second, there are new growth patterns emerging that impact freight travel patterns currently and especially in the future. These include robust population growth in the counties surrounding the City of Orlando and Orange County; investment in intermodal and inland port facilities in Winter Haven and potentially Sumter County; and expansions of the regional port

Central Florida Regional Freight Mobility Study Final Report
4-2 Cambridge Systematics, Inc.
facilities such as Port Canaveral and Citrus County. While the existing system provides some connectivity between these regions, it does not necessarily do so in the most direct manner, leading to spillover congestion issues to other parts of the region.
Figure 4.1 Regional Priority Freight Subsystem
Source: Consultant analysis and stakeholder input

Central Florida Regional Freight Mobility Study Final Report
Cambridge Systematics, Inc. 4-3
Third, to date the region’s congestion issues have by in large been addressed through single mode solutions without accounting for spillover impacts across modes. With the addition of SunRail, the interaction of the two surface transportation systems (highway and rail) is going to increase, potentially resulting in chokepoints.
These three root causes of congestion impact freight travel throughout the region giving rise to significant needs on critical components of the region’s freight system intermodal connectors and key freight arterial routes; interchanges at primary routes and freight generators; and at‐grade rail crossings.
Need for Regional Freight Subsystem
A designated regional freight subsystem or roadway truck route system is instrumental in supporting the efficient and reliable movement of freight. Commercial vehicles rely on properly engineered and constructed roads to move through the region to deliver freight in a timely and safe manner. Identifying, designating and designing truck routes can be an important component of freight mobility and mitigation of freight‐passenger conflicts. Designated truck routes should consist of the following:
Targeted design standards: Truck routes provide a means for targeting truck supporting design standards and policies towards for specific corridors rather than across‐the board
Cost effectiveness: Improving roads to accommodate larger trucks requires significant investment. Designated routes provide a means to more rationally allocate resources to specific corridors with higher benefits. Truck routes also allow favorable opportunities to implement the use of ITS systems and other technology based solutions..
Safety: Improving design standards and segregating freight traffic along specific corridors also would reduce operating incompatibilities and diminish the incidence of accidents.
Productivity: Improving truck operations within trade corridors leads to increased productivity, lower truck operating costs, and improved reliability.

Central Florida Regional Freight Mobility Study Final Report
4-4 Cambridge Systematics, Inc.
4.2 Land Use Conflicts
Given the desire for industrial, warehouse, and distribution activities and associated economic opportunities to continue to grow in the Central Florida region it is important for municipalities, counties, and the region to plan for these activities. Moreover, it is important for those who shape urban design through municipal and regional policies and plans to provide guidance for accommodating these activities. When structured appropriately, such guidance can help reduce the sprawl of freight activities by developing goods and trade‐related distribution facilities within existing transportation corridors and zones. This can also help ensure a balance between the movement of people and the movement of goods across key corridors in the region and create an environment that enhances economic competitiveness and sustainability. Two key areas of concern with regards to land use conflicts impacting freight mobility are encroachment of traditionally industrial areas and protecting and preserving areas for future freight intensive use.
4.3 Safety
Safety is always a focus of both planning organizations and private sector freight stakeholders. Carriers wish to operate effectively and efficiently and maintain high‐safety standards. Any breach in safety standards place carriers in a vulnerable position and at high risk to be liable for damage endured as result of a driver’s negligence. Accidents lead to high‐insurance premiums as well as potential settlements which raise costs tremendously. Therefore the freight industry has a vested interest in ensuring the region’s infrastructure is conducive for safe travel for all motorists.
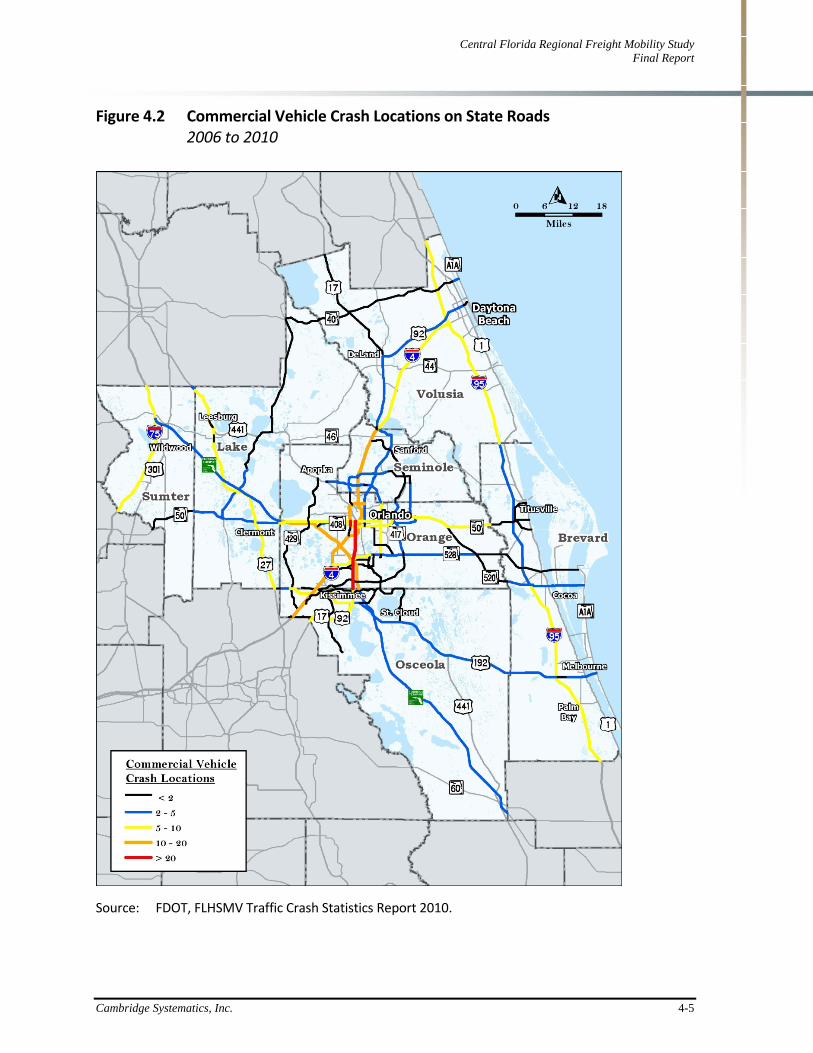
Locations on the state highway network that have relatively high‐truck‐crash rates are shown in Figure 4.2 which displays the cumulative number of truck‐involved crashes from the years 2006 through 2010 per every 0.1 mile roadway segment. Roadway segments with more than 20 truck‐involved crashes are highlighted in red. The greatest concentration of crashes involving trucks has occurred in the following areas:
U.S. 17‐92/441 between SR 50 and Orange/Osceola County Line; and
SR 423 (John Young Pkwy) between SR 50 and SR 408.
Central Florida Regional Freight Mobility Study Final Report
Cambridge Systematics, Inc. 4-5
Figure 4.2 Commercial Vehicle Crash Locations on State Roads 2006 to 2010
Source: FDOT, FLHSMV Traffic Crash Statistics Report 2010.
Central Florida Regional Freight Mobility Study Final Report
4-6 Cambridge Systematics, Inc.
4.4 Community and Environmental Impacts
Goods movement is essential to supporting the region’s economy and quality of life. However, growth in goods movement activities (from manufacturing to truck traffic) also gives rise to negative community impacts. In addition to safety (discussed above), freight activities can contribute to poor air quality and excessive noise and vibration along significant goods movement corridors. As population continues to grow and expand outside the urban core so will commercial centers, leading to more widespread dispersion of freight‐intensive impacts such as truck traffic.
4.5 Regional Approach to Addressing Freight Needs
The freight mobility needs assessment revealed many needs across a wide spectrum of issues and potential responses. While there is much diversity among the categories of needs, ranging from new capacity to improved operations to integrated land‐use, there is one common theme – the need for a regional approach to freight mobility and all the planning factors that impact the freight subsystem. Because of the interstate and intraregional nature of freight movement, bottlenecks or inefficiencies in one local community impacts freight mobility throughout the seven‐county region. Therefore, ensuring the efficiency of freight mobility throughout the region necessitates addressing the needs and issues at a regional as opposed to local level. However, many of the specific issues enumerated above are the domain of local governments and not subject to regional approval. While this may limit the role that the MPOs and TPOs can play in implementing responses, it does not eliminate the possibility to influence the outcomes. Given the role of MPOs, TPOs, and the FDOT District as regional planning bodies, they has access to resources to assist local governments in developing and implementing local plans. It is through these resources that regional planning agencies can influence and promote planning to accommodate and enhances freight mobility.

Central Florida Regional Freight Mobility Study Final Report
Cambridge Systematics, Inc. 5-1
5.0 Regional Solutions and Recommendations
5.1 Overview
The assessment of the current and future situation revealed three primary categories of needs and deficiencies: 1) capacity and congestion; 2) community impacts, including air quality and safety; and 3) institutional and regulatory bottlenecks. This report presents solutions to address the needs. Addressing the needs and deficiencies will require multifaceted solutions that include physical infrastructure, operational and institutional recommendations.
Physical infrastructure refers to investment in improving and/or expanding the transportation system such as roadways, rail and ports. The improvements may include new facilities, capacity enhancements or reconstruction to existing facilities, reconstruction and maintenance activities such as repaving.
Operational solutions focus on improving the efficiency and velocity or throughput of the existing system. Examples include improving signage and wayfinding programs, synchronizing traffic signals to maximize traffic flows, altering the time of day traffic is on the roadways to make better use of the infrastructure throughout the day by moving operations to night time and providing real‐time traffic data and information to dispatchers and drivers.
Institutional solutions focus on policies, regulations and governance issues that give rise to unintended impacts on goods movement and the communities impacted by those movements. Institutional bottlenecks arise from industry regulations such as truck size and weight and drivers’ hours of service rules; local, regional and state governance over publicly owned assets such as roadways leads to local officials having total responsibility (including funding requirements) for local roads that may have a regional, state or even national role in terms of the freight movement; and public policies such as how projects are selected and prioritized in the regional, state, and Federal planning processes.
The development of recommendations has been an ongoing process starting with the early stakeholder interviews. A systematic process for identifying, organizing and

Central Florida Regional Freight Mobility Study Final Report
5-2 Cambridge Systematics, Inc.
screening recommendations was employed. Figure 5.1 displays the framework for developing recommendations.
Figure 5.1 Recommendation Development Process
Source: Cambridge Systematics, Inc.

Central Florida Regional Freight Mobility Study Final Report
Cambridge Systematics, Inc. 5-3
5.2 Infrastructure Solutions and Recommendations
This needs assessment process identified more than 50 locations important to the movement of freight and goods throughout the region with over 150 specific bottlenecks or future needs. Following identification of needs on the regional freight highway subsystem, the review process for each location included ground observation, examination of GIS data for both existing and future conditions, level of service analysis for existing and future conditions, and GPS truck delay data. Stakeholder interview responses were considered as part of the recommendations development process. A complete list of identified improvements categorized as near‐, medium‐, and long‐term is provided in Table 5.1.

Central Florida Regional Freight Mobility Study Final Report
5-4 Cambridge Systematics, Inc.
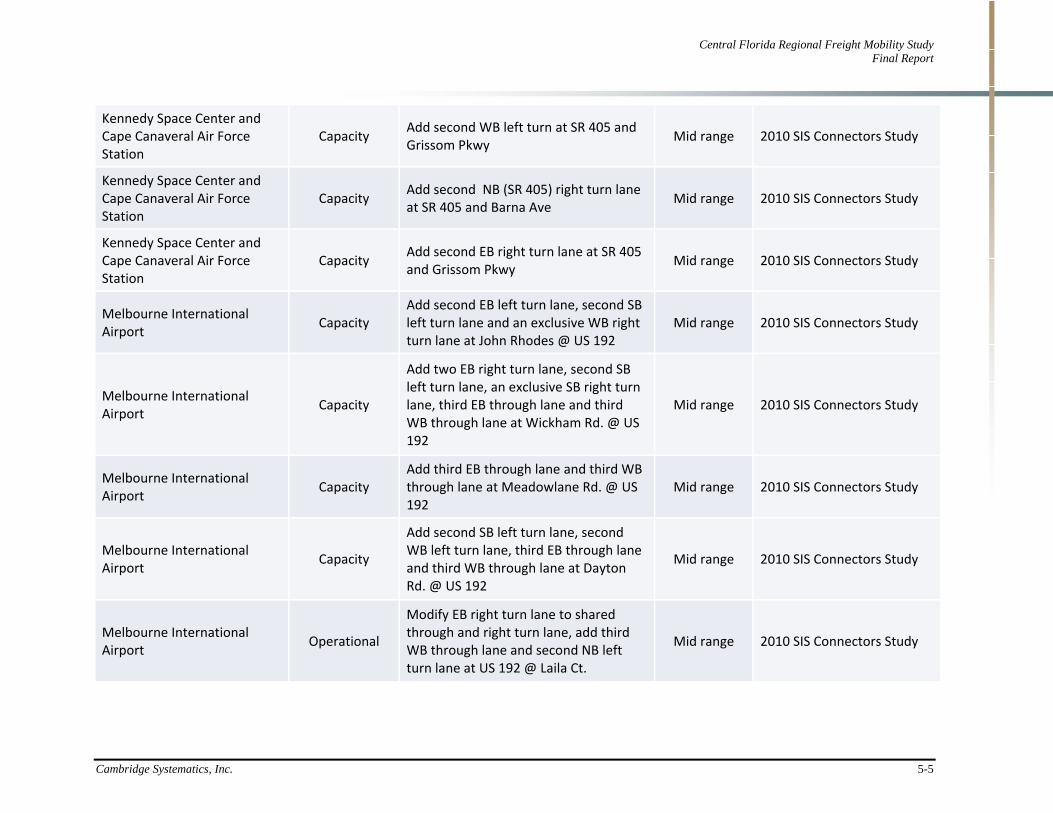
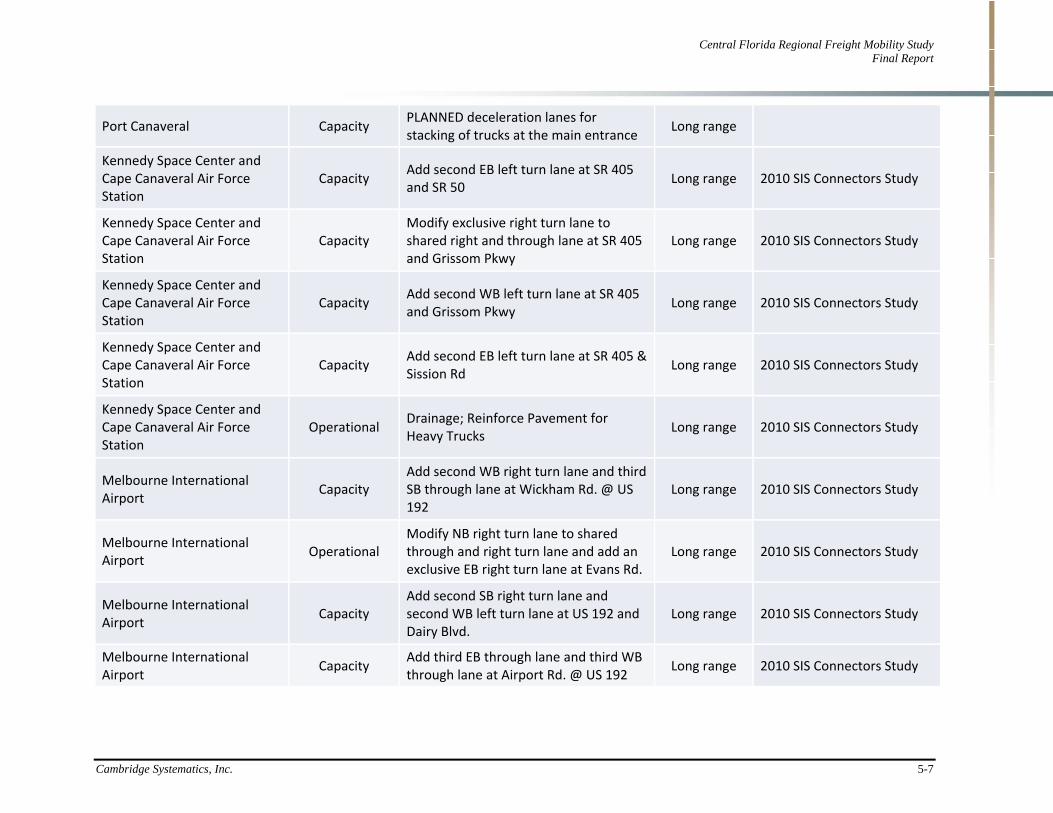
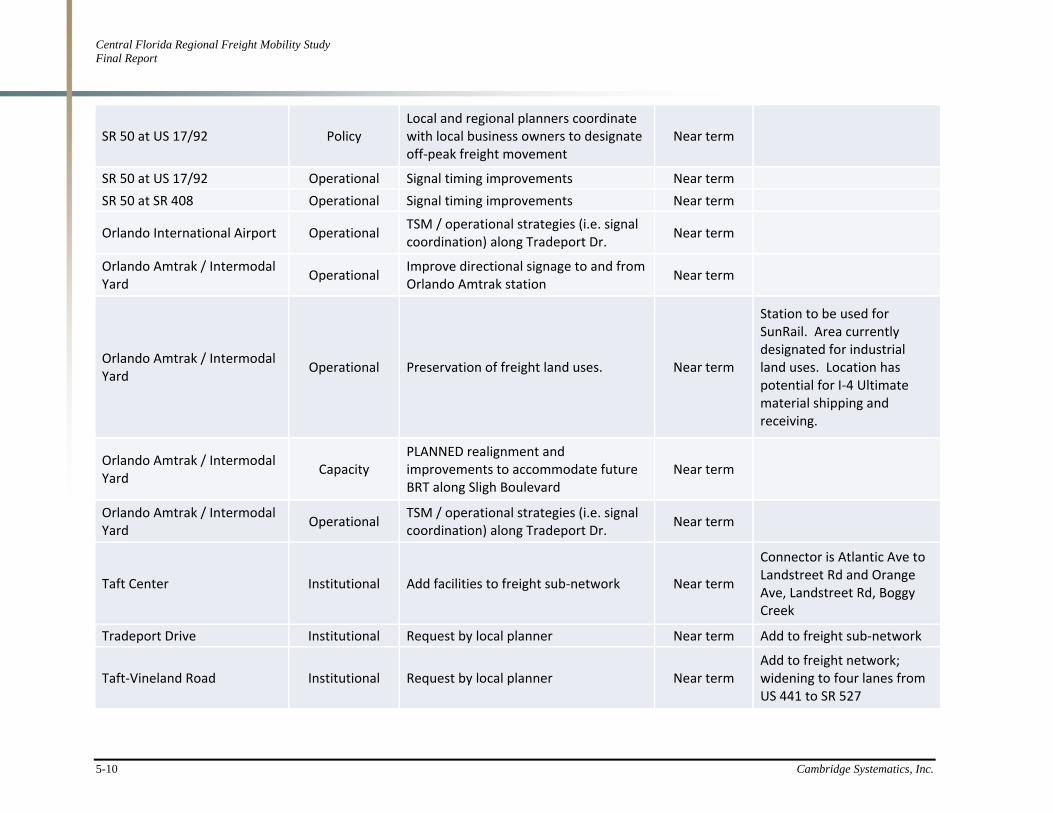
Table 5.1 Regional Freight System Infrastructure Solutions and Recommendations
Location/Roadway Improvement
Type Improvement Details Timing Notes
Brevard County
Kennedy Space Center and Cape Canaveral Air Force Station
Capacity Add second NB left turn at SR 405 and Grissom Pkwy
Near term 2010 SIS Connectors Study
Kennedy Space Center and Cape Canaveral Air Force Station
Operational
Provide DMS/VMS signs at SR 405 @ SR 407 and SR 50 @ I‐95 ramps to provide information on traffic during space shuttle launch
Near term 2010 SIS Connectors Study
Melbourne International Airport
Capacity Add an exclusive SB left turn lane at John Rhodes @ US 192
Near term 2010 SIS Connectors Study
Melbourne International Airport
Capacity Add second NB left turn lane at Wickham Rd. @ US 192
Near term 2010 SIS Connectors Study
Melbourne International Airport
Capacity Add second SB right turn at Evans Rd. @ US 192
Near term 2010 SIS Connectors Study
Titusville Intermodal Center Institutional‐ Add Golden Knight and Teko Rd to freight sub‐network
Near term
Banana River Drive Policy Enforce truck routes Near term
Banana River Drive Operational Traffic calming improvements Near term
Viera Blvd Operational Conduct detailed study to analyze options for Viera Blvd/US 1 intersection
Near term
Ellis Road Institutional Request by local planner Near term Add to freight sub‐network
SR 405 (NASA Causeway) Institutional Request by local planner Near term Add to freight sub‐network
Central Florida Regional Freight Mobility Study Final Report
Cambridge Systematics, Inc. 5-5
Kennedy Space Center and Cape Canaveral Air Force Station
Capacity Add second WB left turn at SR 405 and Grissom Pkwy
Mid range 2010 SIS Connectors Study
Kennedy Space Center and Cape Canaveral Air Force Station
Capacity Add second NB (SR 405) right turn lane at SR 405 and Barna Ave
Mid range 2010 SIS Connectors Study
Kennedy Space Center and Cape Canaveral Air Force Station
Capacity Add second EB right turn lane at SR 405 and Grissom Pkwy
Mid range 2010 SIS Connectors Study
Melbourne International Airport
Capacity Add second EB left turn lane, second SB left turn lane and an exclusive WB right turn lane at John Rhodes @ US 192
Mid range 2010 SIS Connectors Study
Melbourne International Airport
Capacity
Add two EB right turn lane, second SB left turn lane, an exclusive SB right turn lane, third EB through lane and third WB through lane at Wickham Rd. @ US 192
Mid range 2010 SIS Connectors Study
Melbourne International Airport
Capacity Add third EB through lane and third WB through lane at Meadowlane Rd. @ US 192
Mid range 2010 SIS Connectors Study
Melbourne International Airport
Capacity
Add second SB left turn lane, second WB left turn lane, third EB through lane and third WB through lane at Dayton Rd. @ US 192
Mid range 2010 SIS Connectors Study
Melbourne International Airport
Operational
Modify EB right turn lane to shared through and right turn lane, add third WB through lane and second NB left turn lane at US 192 @ Laila Ct.
Mid range 2010 SIS Connectors Study

Central Florida Regional Freight Mobility Study Final Report
5-6 Cambridge Systematics, Inc.
Melbourne International Airport
Capacity
Add second SB left turn lane, second WB left turn lane, second NB left turn lane, third EB through lane and third WB through lane at Evans Rd. @ US 192
Mid range 2010 SIS Connectors Study
Melbourne International Airport
Operational Modify EB and WB right turn lane to shared through and right turn lane at US 192 @ Melbourne Sq. Mall
Mid range 2010 SIS Connectors Study
Melbourne International Airport
Capacity
Add second EB left turn lane, third EB through lane and third WB through lane at Dairy Rd. @ US 192Add second EB left turn lane and second SB right turn lane at Airport Blvd. @ US 192
Mid range 2010 SIS Connectors Study
Melbourne International Airport
Capacity
Add an exclusive EB right turn lane, an exclusive SB right turn lane and an exclusive WB right turn lane at Airport Blvd. @ Hibiscus Blvd.
Mid range 2010 SIS Connectors Study
Melbourne International Airport
Capacity
Add an exclusive NB right turn lane and an exclusive WB right turn lane and modify the SB right turn lane to shared through and right turn lane at Airport Blvd. @ Nasa Blvd.
Mid range 2010 SIS Connectors Study
Port Canaveral Capacity PLANNED Additional WB dedicated through lane on SR 401 for spaceport departing traffic
Long range
Port Canaveral Operational
PLANNED median improvements to clearly delineate truck merging and acceleration lanes for entering WB heavy trucks
Long range
Port Canaveral Capacity PLANNED relocation of Grouper Rd Long range
Central Florida Regional Freight Mobility Study Final Report
Cambridge Systematics, Inc. 5-7
Port Canaveral Capacity PLANNED deceleration lanes for stacking of trucks at the main entrance
Long range
Kennedy Space Center and Cape Canaveral Air Force Station
Capacity Add second EB left turn lane at SR 405 and SR 50
Long range 2010 SIS Connectors Study
Kennedy Space Center and Cape Canaveral Air Force Station
Capacity Modify exclusive right turn lane to shared right and through lane at SR 405 and Grissom Pkwy
Long range 2010 SIS Connectors Study
Kennedy Space Center and Cape Canaveral Air Force Station
Capacity Add second WB left turn lane at SR 405 and Grissom Pkwy
Long range 2010 SIS Connectors Study
Kennedy Space Center and Cape Canaveral Air Force Station
Capacity Add second EB left turn lane at SR 405 & Sission Rd
Long range 2010 SIS Connectors Study
Kennedy Space Center and Cape Canaveral Air Force Station
Operational Drainage; Reinforce Pavement for Heavy Trucks
Long range 2010 SIS Connectors Study
Melbourne International Airport
Capacity Add second WB right turn lane and third SB through lane at Wickham Rd. @ US 192
Long range 2010 SIS Connectors Study
Melbourne International Airport
Operational Modify NB right turn lane to shared through and right turn lane and add an exclusive EB right turn lane at Evans Rd.
Long range 2010 SIS Connectors Study
Melbourne International Airport
Capacity Add second SB right turn lane and second WB left turn lane at US 192 and Dairy Blvd.
Long range 2010 SIS Connectors Study
Melbourne International Airport
Capacity Add third EB through lane and third WB through lane at Airport Rd. @ US 192
Long range 2010 SIS Connectors Study

Central Florida Regional Freight Mobility Study Final Report
5-8 Cambridge Systematics, Inc.
Melbourne International Airport
Capacity Add an exclusive SB right turn lane at Airport Blvd @ Nasa Blvd
Long range 2010 SIS Connectors Study
Melbourne International Airport
Capacity PLANNED widening from 4 lanes to 6 lanes in 2020 on US 192 from Airport Blvd to I‐95
Long range
Melbourne International Airport
Capacity
PLANNED improvements along new alignment (St. Johns Heritage Pkwy) west of I‐95 broken into 3 segments (City funded, County funded, FDOT funded)
Long range
Melbourne International Airport
Capacity PLANNED interchange at Ellis Rd Long range
City Point Reload Center Operational Maintain good serviceability along Industrial Rd
Long range
Connector is Industrial Rd; Roadways connecting to and near site are in good condition
Viera Blvd Capacity Left and right turn fly‐overs from Viera Blvd to US 1
Long range
SR 520 Capacity ‐‐‐ Long range Since buildout, SR 520 may become more attractive to freight movement
Lake County
Leesburg Municipal Airport Operational SR 44 ‐TSM / operational strategies (i.e. signal coordination)
Near term
Leesburg Municipal Airport Operational US 27 ‐ TSM / operational strategies (i.e. signal coordination)
Near term
Hancock Extension/Turkey Farm Road
Policy Potential conflicts with the projected model truck trips with existing LU
Near term

Central Florida Regional Freight Mobility Study Final Report
Cambridge Systematics, Inc. 5-9
Hancock Extension/Turkey Farm Road
Policy Consider policy controls to mitigate potential conflicts between freight movement and existing LU.
Near term
Duda Rd, CR 48, CR 448 Policy Identify preferred freight route and generate list of improvements for that specific route
Near term
New Turnpike Interchange/Hancock Extension (Mannelo Interchange)
Capacity Interchange and connecting roadway are funded
Near term
CR 474 Institutional Request by local planners Near term Add to freight sub‐network
Wekiva Pkwy (Section 2c) Institutional Request by local planners Near term Add to freight sub‐network; design/construction underway
Leesburg Municipal Airport ‐‐‐ Asset preservation. Maintain good service conditions for freight and non‐freight uses.
Long range Facilities in good condition both operationally and physically.
Hancock Extension/Turkey Farm Road
Capacity PLANNED new interchange at Turnpike anticipated to pull a lot of truck traffic off SR 50
Long range
Hancock Extension/Turkey Farm Road
Capacity PLANNED Hancock realignment at SR 50 (Existing Turkey Lake will be cul‐de‐sac‐ed) Realignment planned to be 4L
Long range
Orange County
US 17/92 near Florida's Turnpike
Operational Signal timing improvements Near term
US 17/92 near Florida's Turnpike
Operational Access management Near term
Central Florida Regional Freight Mobility Study Final Report
5-10 Cambridge Systematics, Inc.
SR 50 at US 17/92 Policy Local and regional planners coordinate with local business owners to designate off‐peak freight movement
Near term
SR 50 at US 17/92 Operational Signal timing improvements Near term
SR 50 at SR 408 Operational Signal timing improvements Near term
Orlando International Airport Operational TSM / operational strategies (i.e. signal coordination) along Tradeport Dr.
Near term
Orlando Amtrak / Intermodal Yard
Operational Improve directional signage to and from Orlando Amtrak station
Near term
Orlando Amtrak / Intermodal Yard
Operational Preservation of freight land uses. Near term
Station to be used for SunRail. Area currently designated for industrial land uses. Location has potential for I‐4 Ultimate material shipping and receiving.
Orlando Amtrak / Intermodal Yard
Capacity PLANNED realignment and improvements to accommodate future BRT along Sligh Boulevard
Near term
Orlando Amtrak / Intermodal Yard
Operational TSM / operational strategies (i.e. signal coordination) along Tradeport Dr.
Near term
Taft Center Institutional Add facilities to freight sub‐network Near term
Connector is Atlantic Ave to Landstreet Rd and Orange Ave, Landstreet Rd, Boggy Creek
Tradeport Drive Institutional Request by local planner Near term Add to freight sub‐network
Taft‐Vineland Road Institutional Request by local planner Near term Add to freight network; widening to four lanes from US 441 to SR 527

Central Florida Regional Freight Mobility Study Final Report
Cambridge Systematics, Inc. 5-11
Landstreet Road Institutional Request by local planner Near term Add to freight sub‐network
Central Florida Pkwy Policy Enforce weight restrictions Near term
Google screen capture shows truck violations; Only weight‐restricted roadway in Orange County.
Central Florida Pkwy Operational Move weight restriction signage to before bridge allowing heavy trucks the opportunity to turn off the road
Near term
SR 15 (Narcoossee Rd, Hoffner Ave, Conway Rd)
Institutional Request by local planner Near term Add to freight sub‐network
Taft Vineland Road Institutional Request by local planner Near term Add to freight sub‐network
US 17/92 near Florida's Turnpike
Capacity Develop alternative routes to OBT including new roadway connections to west of Turnpike (i.e. Landstreet)
Mid range
SR 50 at US 17/92 Operational Reconstruct intersection plateau Mid range
Orlando International Airport Capacity Add an exclusive NB right‐turn lane on Tradeport Dr at Boggy Creek Rd and Tradeport Dr.
Mid range 2010 SIS Connectors Study
Orlando Amtrak / Intermodal Yard
Capacity Add an exclusive NB right‐turn at Division and Columbia St.
Mid range 2010 SIS Connectors Study
Orlando Amtrak / Intermodal Yard
Capacity Add an exclusive WB right‐turn at Division and Columbia St.
Mid range 2010 SIS Connectors Study
US 17/92 near Florida's Turnpike
Capacity PLANNED improvements/roadway widening's throughout interchange area
Long range
Interstate 4 at SR 408 Capacity Design‐build project underway for I‐4 Ultimate improvements
Long range
Edgewater Drive Capacity Widening and turn lanes Long range Serves Silver Star freight village

Central Florida Regional Freight Mobility Study Final Report
5-12 Cambridge Systematics, Inc.
John Young Parkway (SR 423) Capacity Widening from SR 50 to Shader Road Long range On priority list for County but Construction not funded
SR 50 at SR 408 Capacity PLANNED improvements/widening (western widening near Dean Rd currently underway)
Long range Recent interchange improvements have also address the issue
Orlando International Airport ‐‐‐ PLANNED development of east airfield. Long range
Orlando International Airport Capacity
PLANNED Passenger Rail service from SR 528 to Terminal (All Aboard Florida Proposal) along Jeff Fuqua Blvd from airport to SR 528
Long range
Orlando International Airport Capacity PLANNED widening from 4 lanes to 6 lanes in 2020 on Tradeport Dr from airport to SR 528
Long range 2010 SIS Connectors Study
Orlando International Airport Capacity Add second EB through lane on Boggy Creek Rd at Tradeport Dr. and Boggy Creek Rd.
Long range 2010 SIS Connectors Study
Orlando International Airport Capacity Add second WB through lane on Boggy Creek Rd at Tradeport Dr. and Boggy Creek Rd.
Long range 2010 SIS Connectors Study
Orlando Amtrak / Intermodal Yard
Capacity Add an exclusive NB right‐turn lane for EB off‐ramp.
Long range 2010 SIS Connectors Study
Orlando Amtrak / Intermodal Yard
Operational Signalize Division Ave. and Columbia St. (if warranted)
Long range
Orlando Amtrak / Intermodal Yard
Capacity Kaley Ave from Division Ave to I‐4 ‐ Widen from 4 lanes to 6 lanes
Long range
Orlando Amtrak / Intermodal Yard
Capacity PLANNED widening from 2 lanes to 4 lanes in 2020 on Division Ave from Columbia St to Kaley Ave
Long range

Central Florida Regional Freight Mobility Study Final Report
Cambridge Systematics, Inc. 5-13
Taft Center Operational Preserve service to the freight yard (service will be shifting to S Line)
Long range
Taft Center Capacity
PLANNED area improvements anticipated to pull non‐freight traffic thereby preserving the good service of the facility
Long range
Innovation Way Corridor Capacity Model shows significant truck volumes Long range Emerging area for development
Innovation Way Corridor Policy Freight use may be incompatible with existing residential LU on existing western portion of roadway
Long range Emerging area for development
Boggy Creek Rd Capacity
PLANNED improvement identified by County: Widening segments from South Access Road to Weatherbee Road and Osceola County Line to GreeneWay to four lanes
Long range
No funding available/identified; Analysis from this report plus stakeholder input pushes a need for the improvement. Funding continues to be an issue.
Osecola County
US 192 at US 17/92 Operational Traffic management strategies Near term
Kissimmee Gateway Airport Operational Add a signal at Hoagland Blvd. and 5th St. intersection (if warranted)
Near term 2010 SIS Connectors Study
Kissimmee Gateway Airport Operational Modify EB shared through and right turn lane to exclusive through and right turn lanes at US 192 and Thacker Rd
Near term 2010 SIS Connectors Study
Kissimmee Gateway Airport Capacity Add second NB left turn lane at Thacker Avenue and US 192
Near term 2010 SIS Connectors Study
CR 531/CR 471 Institutional Request by local planners Near term Add to freight sub‐network

Central Florida Regional Freight Mobility Study Final Report
5-14 Cambridge Systematics, Inc.
Kissimmee Gateway Airport Capacity Add second EB left turn lane and second WB left‐turn lane at Thacker Avenue and US 192
Mid range 2010 SIS Connectors Study
Kissimmee Gateway Airport Capacity Add third WB left turn lane at Osceola Pkwy and Michigan Ave
Mid range 2010 SIS Connectors Study
Kissimmee Gateway Airport Capacity Add second NB through lane at Osceola Pkwy. and Michigan Ave
Mid range 2010 SIS Connectors Study
US 17/92 at Poinciana Blvd Capacity PLANNED 17/92 widening to 6L Long range
US 192 at US 17/92 Capacity Address capacity constraints by focusing on mass tourist transportation options (i.e. streetcar/trolley)
Long range
US 192 near Florida's Turnpike
Capacity PLANNED roadway widening Long range
Kissimmee Gateway Airport Capacity PLANNED areawide improvements Long range
Kissimmee Gateway Airport Capacity
Add second WB left‐turn at US 192 and Hoagland Blvd Modify SB right turn lane at US 192 and Thacker Rd. to shared right and through lane
Long range 2010 SIS Connectors Study
Kissimmee Gateway Airport Capacity Add third NB left turn lane at Osceola Pkwy. and Michigan Ave
Long range 2010 SIS Connectors Study
Kissimmee Gateway Airport Capacity Widen Hoagland Blvd from airport to US 17/92 from 2/4 lanes to 6 lanes
Long range
Kissimmee Gateway Airport Capacity Realign Hoagland Blvd Long range
Seminole County
CSX Transflow Bulk Facility Institutional Add Airport Blvd, Jewitt, MLK to freight sub‐system
Near term
CSX Transflow Bulk Facility Operational Pavement resurfacing on Persimmon Ave. from SR 46 to Amtrak Tracks
Near term 2010 SIS Connectors Study
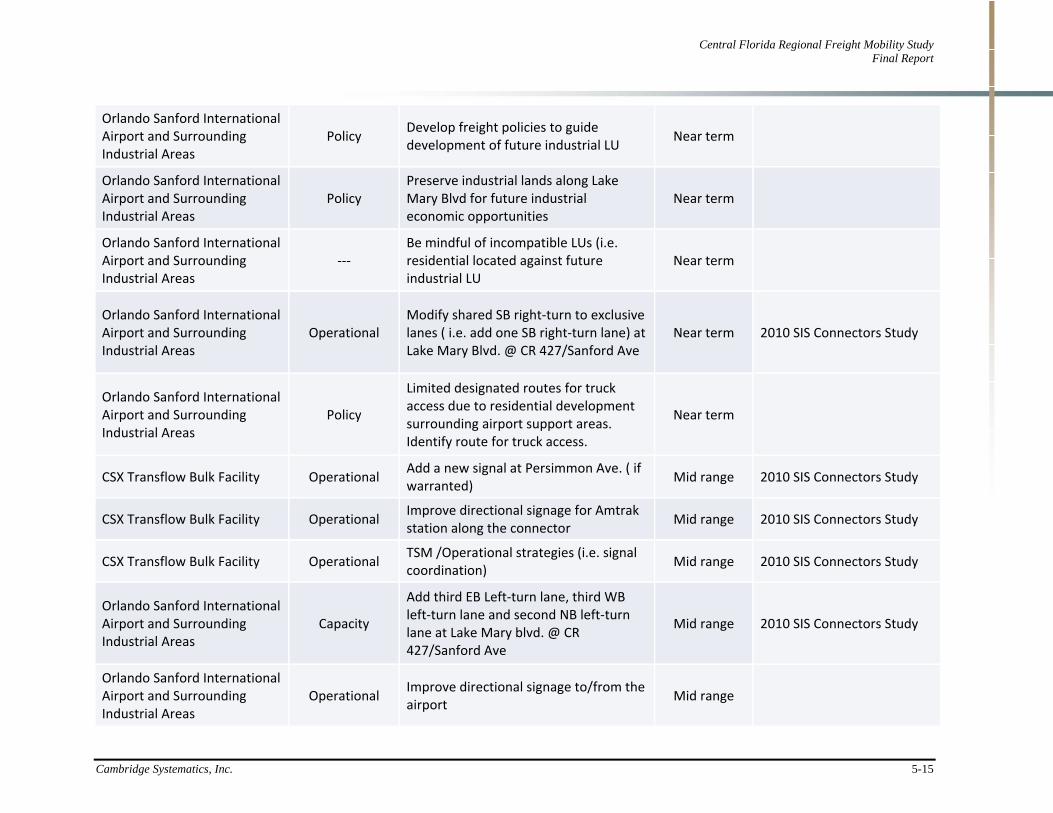
Central Florida Regional Freight Mobility Study Final Report
Cambridge Systematics, Inc. 5-15
Orlando Sanford International Airport and Surrounding Industrial Areas
Policy Develop freight policies to guide development of future industrial LU
Near term
Orlando Sanford International Airport and Surrounding Industrial Areas
Policy Preserve industrial lands along Lake Mary Blvd for future industrial economic opportunities
Near term
Orlando Sanford International Airport and Surrounding Industrial Areas
‐‐‐ Be mindful of incompatible LUs (i.e. residential located against future industrial LU
Near term
Orlando Sanford International Airport and Surrounding Industrial Areas
Operational Modify shared SB right‐turn to exclusive lanes ( i.e. add one SB right‐turn lane) at Lake Mary Blvd. @ CR 427/Sanford Ave
Near term 2010 SIS Connectors Study
Orlando Sanford International Airport and Surrounding Industrial Areas
Policy
Limited designated routes for truck access due to residential development surrounding airport support areas. Identify route for truck access.
Near term
CSX Transflow Bulk Facility Operational Add a new signal at Persimmon Ave. ( if warranted)
Mid range 2010 SIS Connectors Study
CSX Transflow Bulk Facility Operational Improve directional signage for Amtrak station along the connector
Mid range 2010 SIS Connectors Study
CSX Transflow Bulk Facility Operational TSM /Operational strategies (i.e. signal coordination)
Mid range 2010 SIS Connectors Study
Orlando Sanford International Airport and Surrounding Industrial Areas
Capacity
Add third EB Left‐turn lane, third WB left‐turn lane and second NB left‐turn lane at Lake Mary blvd. @ CR 427/Sanford Ave
Mid range 2010 SIS Connectors Study
Orlando Sanford International Airport and Surrounding Industrial Areas
Operational Improve directional signage to/from the airport
Mid range
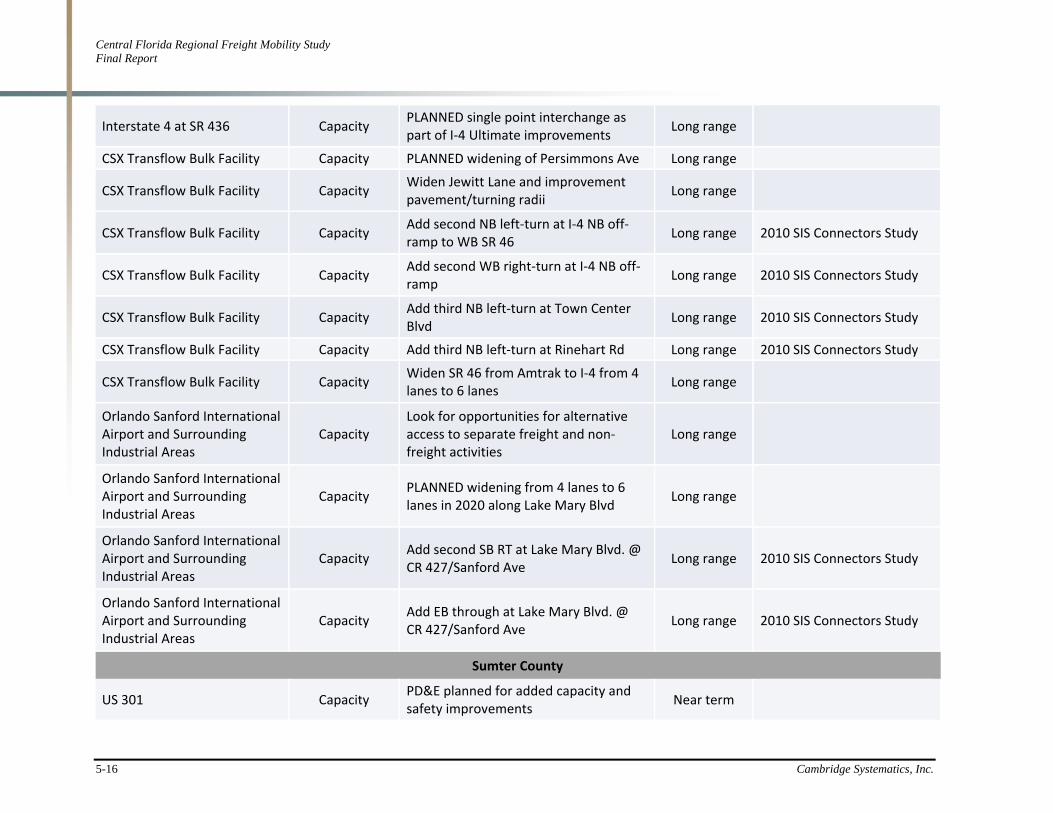
Central Florida Regional Freight Mobility Study Final Report
5-16 Cambridge Systematics, Inc.
Interstate 4 at SR 436 Capacity PLANNED single point interchange as part of I‐4 Ultimate improvements
Long range
CSX Transflow Bulk Facility Capacity PLANNED widening of Persimmons Ave Long range
CSX Transflow Bulk Facility Capacity Widen Jewitt Lane and improvement pavement/turning radii
Long range
CSX Transflow Bulk Facility Capacity Add second NB left‐turn at I‐4 NB off‐ramp to WB SR 46
Long range 2010 SIS Connectors Study
CSX Transflow Bulk Facility Capacity Add second WB right‐turn at I‐4 NB off‐ramp
Long range 2010 SIS Connectors Study
CSX Transflow Bulk Facility Capacity Add third NB left‐turn at Town Center Blvd
Long range 2010 SIS Connectors Study
CSX Transflow Bulk Facility Capacity Add third NB left‐turn at Rinehart Rd Long range 2010 SIS Connectors Study
CSX Transflow Bulk Facility Capacity Widen SR 46 from Amtrak to I‐4 from 4 lanes to 6 lanes
Long range
Orlando Sanford International Airport and Surrounding Industrial Areas
Capacity Look for opportunities for alternative access to separate freight and non‐freight activities
Long range
Orlando Sanford International Airport and Surrounding Industrial Areas
Capacity PLANNED widening from 4 lanes to 6 lanes in 2020 along Lake Mary Blvd
Long range
Orlando Sanford International Airport and Surrounding Industrial Areas
Capacity Add second SB RT at Lake Mary Blvd. @ CR 427/Sanford Ave
Long range 2010 SIS Connectors Study
Orlando Sanford International Airport and Surrounding Industrial Areas
Capacity Add EB through at Lake Mary Blvd. @ CR 427/Sanford Ave
Long range 2010 SIS Connectors Study
Sumter County
US 301 Capacity PD&E planned for added capacity and safety improvements
Near term

Central Florida Regional Freight Mobility Study Final Report
Cambridge Systematics, Inc. 5-17
CR 673 Institutional Request by local planners Near term Add to freight sub‐network
CR 476 Institutional Request by local planners Near term Add to freight sub‐network
CR 470 Capacity Forecast of future truck traffic indicates a need for capacity improvements
Long range Widening not needed until 3 DRIs come online
US 301 Capacity Overall traffic projections indicate a need for capacity improvements
Long range
Martin Luther King Jr. Blvd (DeLand)
Institutional Request by local planners Near term Add to freight sub‐network

Central Florida Regional Goods Movement Study Final Report
5-18 Cambridge Systematics, Inc.
5.3 Operational Solutions and Recommendations
Input from both private and public sector stakeholders indicated that operational solutions should receive some priority. Operational improvements represent a critical element of the freight mobility strategy by making it is possible to get more use out of the existing regional infrastructure by increasing system efficiency. This strategy is important considering the financial constraints facing the region, with operational improvements being relatively lower cost with shorter implementation timeframes. Operational strategies can be divided into two primary categories – public sector improvements and private sector initiatives. Key operational solutions and recommendations in addition to those noted for specific roadway facilities in the previous section are discussed below.
Recommendation: Prepare a Regional Truck Route Map and Identify Freight Facilities Signage Improvements.
Truck routing strategies and restrictions vary by local jurisdictions. Some cities and counties have an extensive truck route system which others have limited guidance to the trucking industry on preferred routing. It is recommended that the Central Florida region prepare a Regional Truck Route Map with the priority freight highway subsystem noted as the preferred routing. The map would inform transportation providers and carriers of regional truck routes and restrictions. Many truck drivers are not from the region and, given the turnover rate in the industry, a number are first‐time visitors. Drivers unfamiliar with the region depend on signage to direct them to designated truck routes and pick‐up and deliveries. Insufficient or ineffective signage leads to time delays for drivers and increases VMT and VHT as drivers search for destinations.
Recommendation: Implement a Freight‐User Communications Program.
Increasing the use of the highway system information outputs from regional traffic management centers (RTMC) has wide appeal among public and private sector stakeholders. Better utilization of real‐time traffic incident and delay‐related information by the private sector is a tremendous opportunity. Both officials at FDOT and select private sector freight stakeholders have expressed interest in developing freight specific programs. The District 5 RTMC is co‐located with the Florida Highway Patrol Troop D Headquarters and the FDOT District 5 Orlando Urban Office at 133 South Semoran Boulevard, Orlando, Florida. This RTMC is the regional hub for the Central Florida Intelligent Transportation Systems (ITS). This system includes the operation of hundreds of closed‐circuit television cameras, dynamic message signs, and vehicle detector sensors on I‐4, I‐95, and other arterial state roads via the extensive fiber optic network. A program that encourages directly sharing information between RTMC staff and dispatchers for major regional freight carriers and shippers and focuses on all the stakeholder‐identified freight significant roadways is recommended. These contacts would share information on crashes, construction and general congestion for dispatchers to pass on to truck drivers in addition to making the data

Central Florida Regional Freight Mobility Study Final Report
Cambridge Systematics, Inc. 5-19
available on the 511 system via a freight specific page. Centralizing communication through dispatchers increases system efficiency and effectiveness.
Recommendation: Implement an Off‐Peak Delivery Pilot Program Promoting Off‐Peak Freight Operations in Key Commercial Areas.
Building on the success of similar programs by private sector shippers in other metro regions throughout the country, a program should be implemented to encourage off‐peak deliveries. Close coordination between the region’s MPO, TPO, and FDOT staff and local communities is needed to identify commercial or industrial areas willing to participate in and help lead the program. A potential proposal is to focus on commercial corridors such the heavily commercialized sections of SR 50 identified in the top truck delay bottlenecks discussed above or major facilities like Orlando Health(which currently is being examined as a pilot under the FHWA FRATIS program). Upon completion of a pilot program, the effectiveness and usefulness of strategies can be assessed and potentially applied to other areas. Business districts and corridors with dense retail and commercial and freight loading and unloading activity and that have relatively low proximity to residential areas should be given priority consideration.
5.4 Institutional Solutions and Recommendations
A comprehensive approach to goods movement requires a regional approach to planning, public awareness of the challenges and benefits of freight movement, and a planning process that institutionalizes freight needs. The following recommendations address the institutional and policy aspects necessary to promote freight mobility while mitigating negative impacts.
Recommendation: Develop a Performance‐Based Process for Implementing and Funding Investments in the Freight System.
Perhaps the biggest challenge facing the region is funding the necessary freight system improvements. The fact that a significant portion of the benefits from the recommended improvements will flow outside the region or to the private sector suggests that a funding program based on the allocation of benefits received is desirable. The first step in accomplishing a benefit or performance‐based funding system is to establish a framework for quantifying and allocating the benefits. The framework must be transparent and replicable while not being resource prohibitive. It will require cooperation between the public and private sectors as well as among different levels of governments. For example, because the region plays a significant role in freight flows statewide, the framework should account for benefits that accrue to the state to position the region for Federal and state funding.
The criteria developed as part of the current study include factors that account for mobility, economic, environmental, safety and community impact benefits. While these follow the goals laid out in FDOT’s statewide long range plan, the specific measures used differ.

Central Florida Regional Goods Movement Study Final Report
5-20 Cambridge Systematics, Inc.
FDOT is in the process of completing its project prioritization framework for the statewide freight study. Staff for the region’s MPOs, TPOs, local government and FDOT District 5 should participate in these discussions and share the criteria developed as part of the current effort. In the end, the region’s framework needs to combine regional and statewide goals and objectives.
Recommendation: Provide Local Government Freight‐Related Training and Capacity Building.
The limited exposure of governmental planning staff regarding freight planning principles is a challenge for the region. It is recommended that the MPOs and TPOs continue to train regional transportation planning staff on freight planning basics. This training should include providing access and notification to national resources available through programs such as NCFRP, FHWA Freight Office research and SHRP; resources available from FDOT; courses and workshops available through NHI, I‐95 Freight Academy and FDOT’s newly established freight academy; and freight specific conferences and events. Staff that will be charged with managing and overseeing regional plans and studies should have a working knowledge of freight transportation needs and requirements. This can be accomplished by conducting and/or sponsoring required freight planning training sessions and workshops.
Recommendation: Incorporate Freight‐Specific Measures into Project Prioritization Procedures.
It is recommended that the region’s MPOs and TPOs integrate freight and goods movement into the planning process by incorporating freight specific project criteria into the project selection and prioritization process. The purpose of this is not to give freight special consideration but rather to evaluate all projects for their impact on freight so that projects improving both passenger and goods mobility will receive additional support. Figure 5.2 and the descriptions below illustrate the concepts as they relate to freight mobility.
Regional Indicator: A high‐level indicator that reflects a characteristic of a region or of a region’s transportation system that gives a quick glance look for nontechnical people of what is happening, usually over time. In Figure 4.1, the indicator is some measure of economic contribution of the freight sector to the region’s economy, perhaps measured through economic input‐output models or as number of freight‐related jobs in the region. Often, but not always, a regional indicator might not be under the control or direct influence of transportation agencies.
Goals: Goals are fairly amorphous statements that indicate a desired end state or characteristic of a system. Thus, in Figure 4.1, the goal is to have the transportation system provide for efficient freight movement (it does not yet say how this would be done).
Objectives: Objectives are more specific statements of how a plan will achieve the goal. In Figure 4.1, one way of having the transportation system contribute to more efficient freight

Central Florida Regional Freight Mobility Study Final Report
Cambridge Systematics, Inc. 5-21
movement would be to reduce the number of congested bottlenecks on a predefined freight strategic network. Usually, there are several objectives associated with a goal.
Key Performance Measure: Performance measures are system‐ or network‐level measures that indicate how your transportation plan is performing overall as compared to a small set of measures. Thus, you might have anywhere from 10 to 12 performance measures that are critical for decision‐making. In Figure 4.1’s case, the system performance measure is “average travel time for freight movement on the strategic freight network.” This measure allows someone to determine the effectiveness of a system plan in the context of this specific objective.
Project Evaluation Criteria: Evaluation criteria relate directly to the evaluation of alternatives and scenarios. These criteria are often numerous and relate to a variety of issues that might be relevant to a particular alternative. Thus, in Exhibit 2.1, we have several criteria shown that are not exactly the same as the system performance measure, but which feed directly into understanding the impacts of alternatives and/or scenarios. They are called “criteria” because they are supposed to help you decide which of the alternatives being considered as the best.
Figure 5.2 Performance Measure Framework
Goals
Objectives
Key Performance
Measures
Project Evaluation
Criteria
Regional Indicators
Targets
Measure of economic contribution of freight to region
The transportation system should provide for efficient freight movement
(Usually several objectives) –Reduce number of congested highway bottlenecks on strategic freight network
Average travel time for freight movement on strategic freight network
Average travel time for specific O‐Ds should not be greater than 5% over base case
Average travel time
Reliability
VHT/VMT for commercial vehicles
% congested freight miles

Central Florida Regional Goods Movement Study Final Report
5-22 Cambridge Systematics, Inc.
Recommendation: Develop an Ongoing Regional Freight Program.
Successful implementation of goods movement strategies will require ongoing coordination and management. The establishment of a Regional Freight Program between Central Florida’s MPOs, TPOs and District office could provide such functions.
Like Central Florida, many peer regions have conducted an in‐depth analysis of regional freight demand, needs and deficiencies. They developed a list of recommendations and an implementation plan. However, the key to moving from study to action in these regions was the formalization of a freight program. While many aspects of freight programs vary depending on regional priorities and characteristics, there were three important elements that are common across the most notable programs:
An effective Regional Freight Advisory Council;
An ongoing regional freight data program; and
Freight representation in all transportation planning activities.
Regional Freight Advisory Council
A regional freight advisory committee can be an invaluable tool in ensuring that freight transportation needs and requirements are met while also reducing the negative impacts, including safety, emissions, noise, and other neighborhood impacts. A freight advisory council is normally comprised of key private and public sector stakeholders with a working knowledge of
Notable Impacts of Freight Advisory Councils
Delaware Valley Goods Movement Task Force supports freight mobility improvements in 9 counties, 4 cities, and 353 municipalities in Pennsylvania and New Jersey. In 2003, the FAC influenced decision‐makers to obligate approximately $3 million from Congestion Mitigation and Air Quality funds for freight projects, including an automated marine terminal gate, truck rest facility, idling equipment, rail line extension, and transload and cross‐dock facilities.
Baltimore, MARYLAND Freight Movement Task Force focuses on improving communications among public and private sector freight stakeholders; identifying short‐term impediments to and recommending improvements for the efficient, effective, environmentally sensitive, and safe movement of freight; and providing input into the allocation of long‐term transportation resources for freight. Some of its major accomplishments include the completion of a Truck Parking Study along the I‐95 corridor in the Baltimore region, development of a new truck traffic‐forecasting model, placement of new signage along major freight routes, and intersection improvements to help mitigate freight bottlenecks in the Baltimore region.
Source: FHWA Engaging the Private Sector in Freight Planning.

Central Florida Regional Freight Mobility Study Final Report
Cambridge Systematics, Inc. 5-23
the region’s freight transportation system and requirements. Example of potential private sector members include representatives from the region’s railroads, Publix distribution, Saddle Creek Logistics, Florida’s Natural Cooperative, FedEx Freight, UPS, Freeman Company, Waste Management, and Florida Trucking Association.
The freight advisory council assembled for the current effort lays the foundation for an effective freight group. It is recommended that membership of this group be expanded to include some of the private sector stakeholders interviewed as part of this study. In addition, the involvement of this group in the transportation planning process could be continued by seeking input from the group regarding not only freight projects but the impact of all projects on the freight community.
Freight Data Program
One of the biggest challenges with freight planning is the data requirements and sources are very different than that of passenger planning. To fully integrate freight into the planning process, MPOs and TPOs need a continuous freight data collection program. Much like passenger travel, models and forecasts need to be updated on a regular basis and the data necessary to do those updates for freight are not readily available. A comprehensive data set for the freight subsystem and freight related land use has been developed and delivered as part of the current effort. The region should develop a plan for maintaining and updating the data by assigning roles and responsibilities for gathering, submitting and housing the data set. In addition to the data collected and submitted for the current effort, FDOT has recently obtained a comprehensive set of commodity flow data and forecasts at the state and county level for sharing with the MPOs and Districts.
Integration of Freight into Regional Planning
The Central Florida region is increasingly reliant on freight transportation to support local economic development. Public transportation agencies are being challenged to support modern business supply‐chain management through investments and policy actions affecting transportation service providers across all modes. To help the region’s businesses succeed in the global trade environment, public sector agencies responsible for transportation planning must foster integrated modal systems by supplying infrastructure that can support responsive, reliable transport for goods and people. There has been growing interest and understanding among state and local governments, as well as the greater business community regarding the impact of freight movements on economic vitality, and the consequences of inadequate or unreliable transportation systems. However, due to a multiplicity of issues and barriers, state and local transportation agencies have struggled to identify, incorporate, and implement freight supportive projects into their planning and project implementation programs.
Central Florida Regional Goods Movement Study Final Report
5-24 Cambridge Systematics, Inc.
Steps the region’s MPOs, TPOs, and FDOT district staff can take to integrate freight into it planning activities include:
Engaging a freight stakeholder (or member from the freight advisory council) on all major project advisory committees and technical coordinating committees;
Incorporating freight specific criteria for project evaluation for alternatives analysis and recommendation screening;
Reaching out to freight stakeholders as part of the public involvement process;
Evaluate impact of all projects on freight movement as well as passenger mobility;
Increase freight planning training for all project managers;
Develop freight performance measures to monitor progress; and
Implement ongoing outreach activities to elected officials and the general public on freight transportation needs and impacts.