Embed Size (px)
Citation preview

Draft Anchorage Freight
Mobility Study
ANCHORAGE, AK
June 2017
Prepared for:
Anchorage Metropolitan Area Transportation
Solutions
Prepared by:
HDR
Solstice Consulting
RSG
CPCS

This page intentionally left blank.

Contents 1. Introduction .......................................................................................................................................... 1
Why is AMATS developing a FMS?............................................................................................................ 2
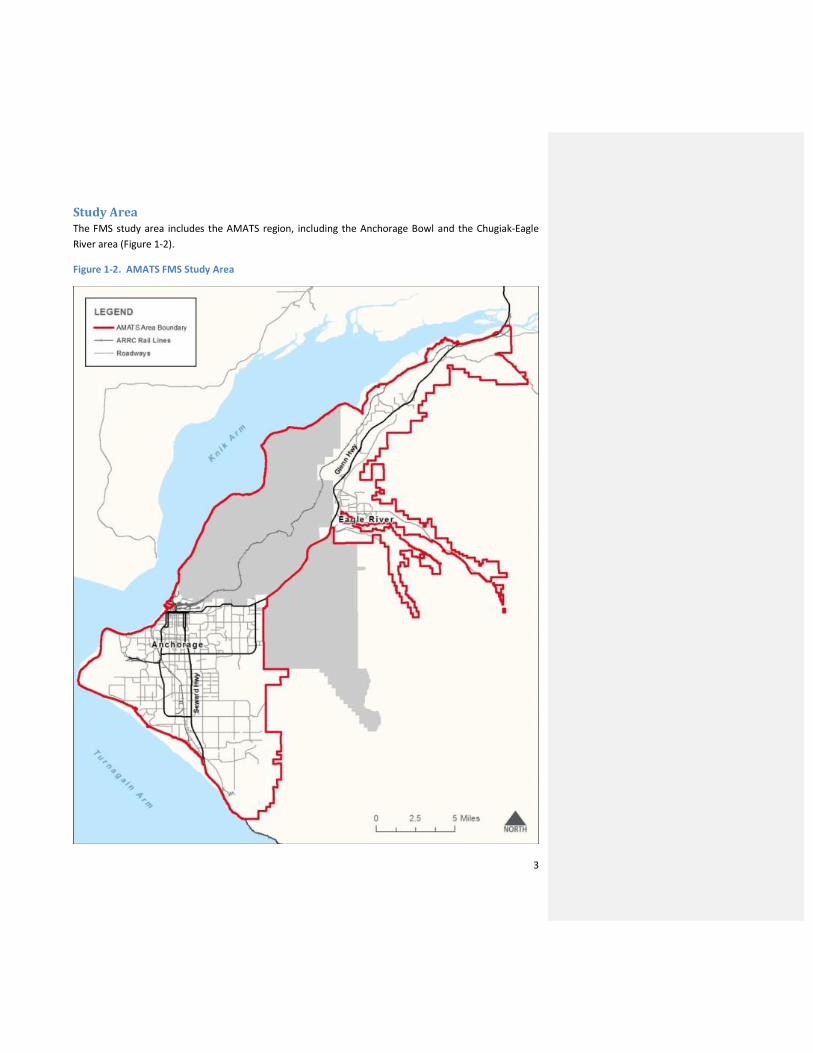
Study Area ................................................................................................................................................. 3
FMS Planning Process ............................................................................................................................... 4
Organization of the AMATS FMS Draft Plan ............................................................................................. 5
2. Stakeholder Involvement Process ......................................................................................................... 7
Freight Advisory Committee (FAC)............................................................................................................ 7
Phase 1: Information Gathering/Stakeholder Interviews ......................................................................... 7
Phase 2: Public Review of the draft FMS .................................................................................................. 8
3. Vision, Goals, and Objectives ................................................................................................................ 9
Vision Statement ....................................................................................................................................... 9
Goal 1 - Provide a freight transportation system that moves goods safely and securely throughout
the community; improves access; provides mobility; and supports a thriving, sustainable, broad-
based economy. .................................................................................................................................. 10
Goal 2 - Develop an efficient freight transportation network that considers the cost of building,
operating, and maintaining the system; the equity of all users; public health impacts; community
values; and social justice. .................................................................................................................... 10
Goal 3 - Incorporate technology and best management practices that allow for improved freight
movement in the Anchorage region. .................................................................................................. 10
Goal 4 - Integrate freight needs and financing into transportation project prioritization processes
for the region. ..................................................................................................................................... 11
Goal 5 - Develop a multimodal freight system that includes effective public and stakeholder
partnerships to leverage opportunities and resources. ..................................................................... 11
Relationship between FMS and MTP Goals ............................................................................................ 11
4. Freight Planning Best Practices ........................................................................................................... 13
Use Innovative Stakeholder Engagement ............................................................................................... 14
Engage the Private Sector ....................................................................................................................... 15
Define Freight Issues and Challenges ..................................................................................................... 15
Identify Root Causes of Freight Problems............................................................................................... 16
Manage and Address Land Use Compatibilities ..................................................................................... 17

Use Pilot Schemes to Test Solutions ....................................................................................................... 17
Include Transportation Demand Management (TDM) in the Freight Planning Process ........................ 18
Use Performance Measures .................................................................................................................... 18
5. Freight Profile ...................................................................................................................................... 20
Highway................................................................................................................................................... 21
Air ............................................................................................................................................................ 24
Rail........................................................................................................................................................... 25
Waterborne Freight and Cargo ............................................................................................................... 28
Pipeline ................................................................................................................................................... 30
6. Freight Flows ....................................................................................................................................... 32
7. Local and Regional Freight Issues and Trends .................................................................................... 35
Local Industries and Employment ........................................................................................................... 35
Land Uses ................................................................................................................................................ 37
Bottlenecks, Level of Service, and Capacity ............................................................................................ 40
Water .................................................................................................................................................. 41
Air ........................................................................................................................................................ 41
Highway ............................................................................................................................................... 41
Rail ....................................................................................................................................................... 45
Pipeline................................................................................................................................................ 45
Safety and Security Issues ....................................................................................................................... 45
Water .................................................................................................................................................. 45
Air ........................................................................................................................................................ 46
Highway ............................................................................................................................................... 46
Rail ....................................................................................................................................................... 48
Pipeline................................................................................................................................................ 48
Autonomous Vehicles ......................................................................................................................... 49
E-Commerce ........................................................................................................................................ 49
8. Freight System Strengths, Weaknesses, Opportunities, and Threats (SWOT) ................................... 50
9. Performance Management Framework and Measures ...................................................................... 52
Performance Management Framework ................................................................................................. 52
Implement Best Practices and Standards in Performance Measurement .......................................... 53
Reflect AMATS FMS Vision, Goals and, Objectives ............................................................................. 54

Consider Existing Performance Measure Approaches at AMATS and State Levels ............................ 54
Meet MAP-21 / FAST Act Requirements ............................................................................................. 54
Performance Measures ........................................................................................................................... 54
Safety Measure ................................................................................................................................... 54
Freight System Optimization Measures .............................................................................................. 55
Environmental Measures .................................................................................................................... 56
10. Recommendations .......................................................................................................................... 57
Project and Policy Screening Criteria and Scoring .................................................................................. 57
Recommendations for Immediate, Mid-Term, and Long-Term Implementation ................................... 61
Freight Projects ................................................................................................................................... 61
Freight Policies .................................................................................................................................... 69
11. Implementation Strategy ................................................................................................................ 75
Funding ................................................................................................................................................... 75
Federal ................................................................................................................................................ 75
State .................................................................................................................................................... 76
Local .................................................................................................................................................... 76
Other ................................................................................................................................................... 76
Education ................................................................................................................................................ 77
Workforce Education Program ........................................................................................................... 77
Community Education ......................................................................................................................... 77
Agency Education ................................................................................................................................ 78
Industry Education .............................................................................................................................. 78
Planning .................................................................................................................................................. 79
Incorporate FMS into MTP .................................................................................................................. 79
On-going Identification of Freight-Specific Projects and Policies ....................................................... 80
Commitment to Continuing Coordination with Key Freight Modes ................................................... 80
Implement Recommended Short-Term Freight Policies..................................................................... 80
12. Conclusion ....................................................................................................................................... 78
References .................................................................................................................................................. 79
Figures Figure 1-1. AMATS Population and Jobs Growth from 2015 to 2040 ........................................................ 2
Figure 1-2. AMATS FMS Study Area ........................................................................................................... 3
Figure 1-3. Summary of Planning Process .................................................................................................. 5
Figure 4-1. Metropolitan Freight Planning Best Practices Concepts ........................................................ 13
Figure 4-2. Stakeholder Engagement Process Guidelines for Freight Planning ....................................... 14
Figure 4-3. Tasks Involved in Determining Root Causes to Freight Issues ............................................... 17
Figure 4-4. Example Transportation Demand Management Strategies used in Metropolitan Freight
Planning ................................................................................................................................. 18
Figure 5-1. AMATS 2015 Multimodal Freight Transportation Network .................................................... 20
Figure 5-2. 2015 AMATS Primary Highway Facilities Moving Trucks ........................................................ 23
Figure 5-3. Cargo Movements by Direction at TSAIA, 2014-2015 ............................................................ 25
Figure 5-4. Freight Commodity Tonnage moved by the ARRC, 2011-2015 in Thousands of Tons ........... 26
Figure 5-5. Alaska Railroad Facilities in AMATS Region ............................................................................ 27
Figure 5-6. Port of Anchorage Tonnage, 2006-2013 ................................................................................. 29
Figure 5-7. AMATS Study Area Pipeline Facilities ..................................................................................... 31
Figure 6-1. Alaska’s 2012 Statewide Commodity Flows (Weight) by Mode – Domestic/Import/Export . 32
Figure 7-1. Anchorage Employment Levels for 2004, 2009, and 2014 ..................................................... 36
Figure 7-2. Land Use in the Anchorage Bowl ............................................................................................ 38
Figure 7-3. Land Use in Chugiak-Eagle River ............................................................................................. 39
Figure 7-4. Land Use Policy Map, Anchorage 2020: Anchorage Bowl Comprehensive Plan .................... 40
Figure 7-5. AMATS Freight Movement Problem Areas ............................................................................ 44
Figure 7-6 Commercial Vehicle Crashes, 2009-2014 ................................................................................ 47
Figure 8-1. Anchorage Freight Mobility SWOT Analysis Elements ........................................................... 50
Figure 9-1. Components of FMS Performance Management Framework ............................................... 53
Figure 10-1. Screening Process .................................................................................................................. 57
Figure 11-1. Infographic used by the City of Seattle to educate residents about freight ......................... 78
Figure 11-2. Planning framework ............................................................................................................... 79
Figure 11-3. Proposed Regional Truck Route Network .............................................................................. 76
Tables
Table 3-1. Relationship between the FMS and Interim 2035 MTP Goals ................................................. 12
Table 5-1 Average Daily Truck Counts, 2014 ............................................................................................ 22
Table 5-2. TSAIA Air Cargo by International and Domestic Share, 2015 ................................................... 24
Table 5-3. Port of Anchorage Tonnage Trends by Commodity 2006-2015 ............................................... 29
Table 6-1. 2012 Alaska Statewide Commodity Flows by Mode (Thousands of Tons) .............................. 33
Table 7-1. AMATS Region Employment Growth Estimates by Industry, 2013-2040 ................................ 36
Table 7-2. DOT&PF Reportable and Non-Reportable Commercial Vehicle Crash Data Summaries for the
MOA, 2009-2014 .................................................................................................................... 47

Table 8-1. AMATS Region’s Key Freight-Related Strengths, Weaknesses, Opportunities, and Threats .. 51
Table 9-1. AMATS FMS Performance Measures ...................................................................................... 55
Table 10-1. AMATS FMS Project and Policy Screening Criteria and Values ............................................... 59
Table 10-2. Immediate (0-10 Years) Freight Projects Identified for Implementation ............................... 62
Table 10-3. Mid-Term (11-15 Years) Freight Projects Identified for Implementation ............................... 66
Table 10-4. Long-Term (16+ Years) Freight Projects Identified for Implementation ................................. 68
Table 10-5. Immediate (0-10 Years) Freight Policies Identified for Implementation ................................ 72
Table 10-6. Mid-Term (11-15 Years) Freight Policies Identified for Implementation ................................ 74
Table 10-7. Long-Term (16+ Years) Freight Policies Identified for Implementation .................................. 74
Appendices
A - Best Practices White Paper
B - Freight Mobility Profile
C - Freight Inventory
D - Freight Issues & Trends White Paper
E - Forecasts
F – Freight Analysis
G - Performance Measures Framework and Performance Measures White Paper

Acronyms and Abbreviations
3C Comprehensive, Cooperative, and Continuing
AADT Annual Average Daily Traffic
AADTT Annual Average Daily Truck Traffic
AAFES Army and Air Force Exchange Service
ADA Americans with Disabilities Act
AMATS Anchorage Metropolitan Area Transportation Solutions
APMP Anchorage Port Modernization Project
ARDSA Anchorage Roads and Drainage Service Area
ARFF Aircraft Rescue and Fire Fighting
ARRC Alaska Railroad Corporation
ATA Alaska Trucking Association
CBD Central Business District
CMP Congestion Management Process
DOT U.S. Department of Transportation
DOT&PF Alaska Department of Transportation and Public Facilities
EAFB Elmendorf Air Force Base
EPM Electrical Preventative Maintenance
FAA Federal Aviation Administration
FAC Freight Advisory Committee
FAF-4 Freight Analysis Framework, Version 4
FARS Fatality Analysis Reporting System
FAST Fixing America’s Surface Transportation Act
FASTLANE Fostering Advancements in Shipping and Transportation for the Long-Term Achievement
of National Efficiencies
FHWA Federal Highway Administration
FMS Freight Mobility Study
FRSA Federal Railroad Safety Act
GO General Obligation
HPMS Highway Performance Monitoring System
HSIP Highway Safety Improvement Program
JBER Joint Base Elmendorf-Richardson
KISS Keeping It Short and Simple
MOA Municipality of Anchorage
MPO Metropolitan Planning Organization
MTP Metropolitan Transportation Plan
NCFRP National Cooperative Freight Research Program
NFPA National Fire Protection Association
NHFN National Highway Freight Network
NHFP National Highway Freight Program

NHS National Highway System
NHTSA National Highway Traffic Safety Administration
NPRM Notice of Proposed Rulemaking
P3 Public-private Partnership
PHMSA Pipeline and Hazardous Materials Safety Administration
POA Port of Anchorage
RI95 Truck Travel Time Reliability Index
SMART Specific, Measurable, Attainable, Realistic, and Timely
STRAHNET Strategic Highway Network
SWOT Strengths, Weaknesses, Opportunities, and Threats
TAC Technical Advisory Committee
TAPS Trans-Alaska Pipeline System
TDM Transportation Demand Management
TIWC Transportation Worker Identification Card
TOC Traffic Operations Center
TOFC Trailer on Flat Car
TRB Transportation Research Board
TSA Transportation Security Administration
TSAIA Ted Stevens Anchorage International Airport
TTTI Truck Travel Time Index
VMT Vehicle Miles Traveled

1
1. Introduction Every day, products and goods move into, out of, and around Anchorage. The freight transportation
business sector moves goods, employs workers, generates revenue, and consumes materials and
services produced by other sectors of the economy. Almost all of the goods purchased by Anchorage
residents and the entire region are transported here by some combination of ship, barge, plane, train,
and truck. In order to maintain the region’s high quality of life and to support long-term economic
growth and activity, this goods movement process uses an essential, yet outdated multimodal freight
transportation system.
Anchorage’s growth and development is shaped by its
prime geographic location at the crossroads of important
transportation connectors. Originally established as a rail
construction port site near Ship Creek, Anchorage quickly
grew during the early development of the Alaska Railroad
between 1915 and 1923.
Due to its strategic military location, the U.S. Government
established Fort Richardson in 1938 and Elmendorf Air
Force Base (EAFB) in 1940. Anchorage’s unique position
between Asia and Europe made both installations critical
outposts for the United States. Military presence and
resource development would eventually propel Anchorage
into the 21st century, helping grow important water and air
transport routes that would connect the city and Alaska to
various intra-state and inter-state United States markets.
Further, the construction of the Port of Anchorage’s (POA)
ocean terminal in 1961 provided important transportation
infrastructure for the city and the state. The POA would play
a critical role both after the devastating 1964 Good Friday Earthquake as the only surviving marine port
in Southcentral Alaska, and during the expansion of the Trans-Alaska Pipeline System (TAPS) when a
large influx of pipeline workers moved to Anchorage and other parts of the state, increasing the demand
for goods.
Currently, Anchorage relies heavily on highway, barge, rail, and air transportation to move freight. In
contrast to many other regions in the United States, there is a higher concentration of air and barge
traffic to and from Anchorage and other Alaskan communities due to the lack of road surface developed
across the state. Transportation facilities built early in the 20th century continue to play an ongoing role
in providing services to Alaskan communities and will do so into the future.
Also, as the “air crossroads to the world,” approximately 95 percent of the world’s industrial population
is within 9 hours of Anchorage by air. The city serves as a trans-shipment center between North
America, Europe, and Asia. The Ted Stevens Anchorage International Airport (TSAIA) facilities have
Anchorage – “Air Crossroads of the World”

2
grown extensively to accommodate for shipping companies that make critical refueling stops in
Anchorage while moving goods across the globe.
As Alaska’s largest metropolitan area, Anchorage
provides critical services for major international and
domestic trade. Anchorage’s role in the movement of
freight is critical in the city’s and region’s ability to
grow. Future economic development of the city, the
region, and the state will remain defined by freight
infrastructure and mobility opportunities.
Why is AMATS developing a FMS?
According to the U.S. Census, Anchorage population
grew from 226,338 in 1990 to 291,826 in 2010, roughly equating to 1.4 percent annual population
growth (Figure 1-1). With this population growth, there is also an increase in local jobs and consumer
spending. Evaluating freight movement and mobility is critical to Anchorage’s future increased demand
for freighting various goods for a growing population. More efficient multimodal transportation mobility
and intermodal freight movements and connections will mean consumers will receive goods faster and
at potentially lower costs.
Figure 1-1. AMATS Population and Jobs Growth from 2015 to 2040
Source: RSG, 2016
The Anchorage Metropolitan Area Transportation Solutions (AMATS) crafted the Anchorage Freight
Mobility Study (FMS) to prepare for future growth within the AMATS area and in surrounding
communities that depend on Anchorage’s multimodal freight transportation network to deliver
important goods. Development of the FMS will allow AMATS to:
• Better understand existing and projected regional freight flows, issues, concerns, and needs;
• Identify relevant infrastructure improvements and policy changes to improve freight mobility in
the region; and
• Create a multimodal transportation network that allows freight to operate and move efficiently
across and between each mode.
What is Freight Mobility?
Freight mobility refers to moving
goods from one place to another by
any mode (including truck, plane,
train, pipeline, and/or ship). It is the
process by which goods move from
origins to final destinations.
3
Study Area
The FMS study area includes the AMATS region, including the Anchorage Bowl and the Chugiak-Eagle
River area (Figure 1-2).
Figure 1-2. AMATS FMS Study Area
4
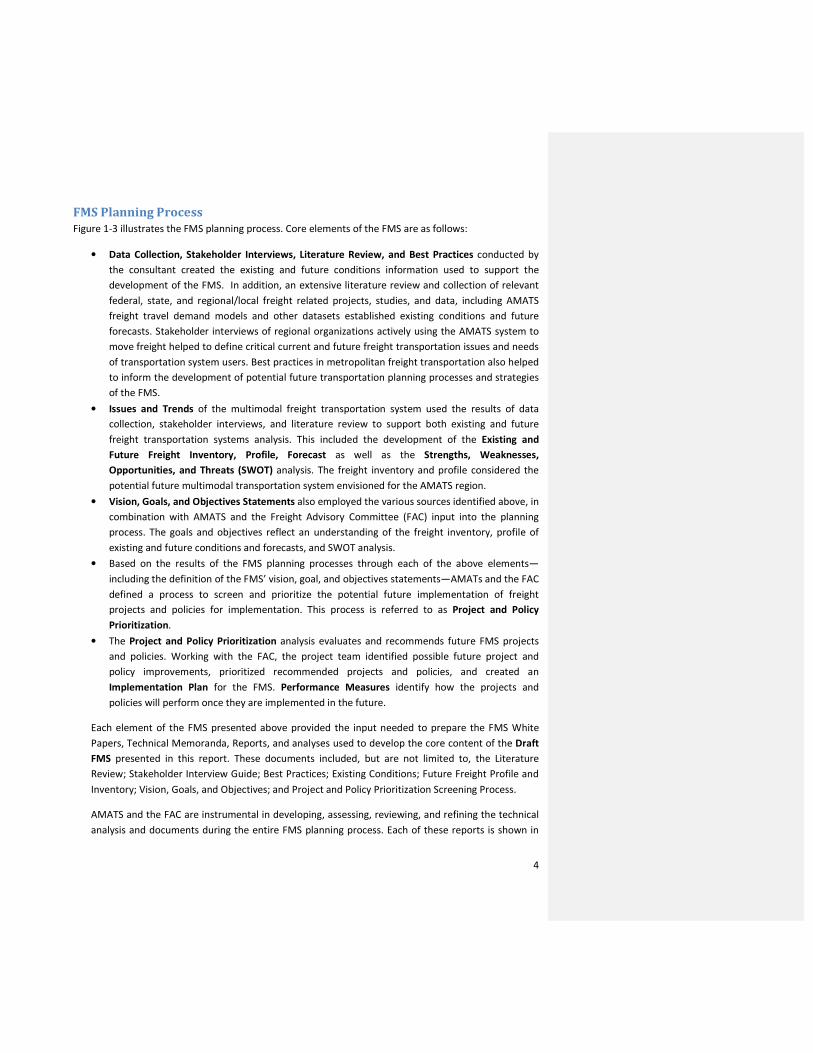
FMS Planning Process
Figure 1-3 illustrates the FMS planning process. Core elements of the FMS are as follows:
• Data Collection, Stakeholder Interviews, Literature Review, and Best Practices conducted by
the consultant created the existing and future conditions information used to support the
development of the FMS. In addition, an extensive literature review and collection of relevant
federal, state, and regional/local freight related projects, studies, and data, including AMATS
freight travel demand models and other datasets established existing conditions and future
forecasts. Stakeholder interviews of regional organizations actively using the AMATS system to
move freight helped to define critical current and future freight transportation issues and needs
of transportation system users. Best practices in metropolitan freight transportation also helped
to inform the development of potential future transportation planning processes and strategies
of the FMS.
• Issues and Trends of the multimodal freight transportation system used the results of data
collection, stakeholder interviews, and literature review to support both existing and future
freight transportation systems analysis. This included the development of the Existing and
Future Freight Inventory, Profile, Forecast as well as the Strengths, Weaknesses,
Opportunities, and Threats (SWOT) analysis. The freight inventory and profile considered the
potential future multimodal transportation system envisioned for the AMATS region.
• Vision, Goals, and Objectives Statements also employed the various sources identified above, in
combination with AMATS and the Freight Advisory Committee (FAC) input into the planning
process. The goals and objectives reflect an understanding of the freight inventory, profile of
existing and future conditions and forecasts, and SWOT analysis.
• Based on the results of the FMS planning processes through each of the above elements—
including the definition of the FMS’ vision, goal, and objectives statements—AMATs and the FAC
defined a process to screen and prioritize the potential future implementation of freight
projects and policies for implementation. This process is referred to as Project and Policy
Prioritization.
• The Project and Policy Prioritization analysis evaluates and recommends future FMS projects
and policies. Working with the FAC, the project team identified possible future project and
policy improvements, prioritized recommended projects and policies, and created an
Implementation Plan for the FMS. Performance Measures identify how the projects and
policies will perform once they are implemented in the future.
Each element of the FMS presented above provided the input needed to prepare the FMS White
Papers, Technical Memoranda, Reports, and analyses used to develop the core content of the Draft
FMS presented in this report. These documents included, but are not limited to, the Literature
Review; Stakeholder Interview Guide; Best Practices; Existing Conditions; Future Freight Profile and
Inventory; Vision, Goals, and Objectives; and Project and Policy Prioritization Screening Process.
AMATS and the FAC are instrumental in developing, assessing, reviewing, and refining the technical
analysis and documents during the entire FMS planning process. Each of these reports is shown in

5
the Technical Appendices associated with the Draft FMS and can be reviewed to understand the full
detail of the analysis conducted in support of this study.
Figure 1-3. Summary of Planning Process
Organization of the AMATS FMS Draft Plan
The FMS is organized into 11 chapters:
• Chapter 1, Introduction, provides a brief historical context for the FMS study area and an
overview of the report.
• Chapter 2, Stakeholder Involvement Process, describes the process for gathering comments
and input from the public, FAC, government agencies, and freight-oriented businesses to
support the FMS.
• Chapter 3, Vision, Goals, and Objectives, describes the specific process used to identify the
vision, goals, and objectives of the FMS.
• Chapter 4, Freight Planning Best Practices, describes existing successful freight planning
processes that can be applied to the AMATS FMS.
• Chapter 5, Freight Profile, describes AMATS existing freight conditions analysis for all
transportation modes, including highway, water, air, rail, truck, and pipe.
• Chapter 6, Freight Flows, describes the movement of goods in the context of the state and
AMATS region as well as the inter-relationship of various freight transportation modes.
6
• Chapter 7, Local and Regional Freight Issues and Trends, describes Anchorage’s economic,
employment, and population forecasts as well as how these trends affect freight supply and
demand.
• Chapter 8, Freight System Strengths, Weaknesses, Opportunities, and Threats (SWOT),
describes this analysis, with the goal of identifying more effective future freight programming
for the FMS.
• Chapter 9, Performance Management Framework and Measures, describes the freight
planning performance measures that are recommended to monitor the impacts of the
recommended projects after future implementation.
• Chapter 10, Recommendations, describes the screening process and criteria for determining
immediate, mid-term, and long-term project and policy recommendations for the FMS.
• Chapter 11, Implementation Strategy, describes the potential funding sources available for
freight-related transportation projects as well as a timeline for implementing the top priority
projects.
• Chapter 12, Next Steps describes how the plan can be actively used and the potential
opportunities for sharing information about freight and goods movement in other planning
processes.

7
2. Stakeholder Involvement Process Understanding the AMATS region’s freight mobility
issues and needs is critical in the development of the
FMS. To understand these issues and needs, two
phases of outreach gained further input from the
AMATS FAC. The first phase engaged freight
stakeholders, and the second phase engaged the
freight community and the general public.
Freight Advisory Committee (FAC)
AMATS convened their existing FAC to provide the AMATS Technical and Policy Committee with insight
on freight issues affecting the region. The FAC consists of representatives from TSAIA; POA; Alaska
Trucking Association (ATA); the Alaska Railroad Corporation (ARRC); Joint Base Elmendorf-Richardson
(JBER), Alaska Department of Transportation & Public Facilities (DOT&PF), Commercial Vehicle
Enforcement Division; and trucking and other freight related companies. The FAC provides an
opportunity for various stakeholders to participate as active listeners and commentators in regional
freight planning, and act as personal bridges between the potential projects and policies and their
organizations. The FAC met multiple times during the FMS schedule and provided an important forum
for developing many of the core elements of the FMS. FAC members provided critical input in helping
AMATS maintain strong connections and communications with key freight stakeholders across the
region. Equally, the annual Freight Forum hosted by the FAC offered additional opportunities for input
on the FMS by many private and public stakeholders.
Phase 1: Information Gathering/Stakeholder Interviews
To learn more about stakeholder needs throughout the AMATS area, the consultant conducted a series
of stakeholder interviews to support the FMS. The stakeholders represented diverse users of the freight
network’s highway, aviation, marine, and rail services network. These groups use the freight network
most frequently and are most impacted by any changes to the existing and potential future freight
system in the AMATS region. The goal of the stakeholder interviews not only solicited input on existing
freight conditions and needed improvements for the future, but also publicized the development of the
FMS.
All stakeholders interviewed during the FMS process represented public and private organizations
responsible for moving commodities and goods for transport. The majority of these goods included
general merchandise, coal, cement, chemicals, lumber products, and containers. Freight stakeholders
believed that oil prices and economic conditions greatly influence freight opportunities in Anchorage
and the state.
Further, stakeholders expressed concern over various safety issues and bottlenecks within the AMATS
region. Stakeholders identified specific issues, some of which are presented below, as well as indicated
the following types of strategies they thought could help improve the existing freight network within the
AMATS region:
Who is a stakeholder?
A stakeholder is an individual or group
of people that is affected by, or who
can affect, a project's outcome.
8
• Raise awareness about the importance of moving freight safely and efficiently;
• Identify more efficient transportation routes:
o Ensure freight can move more efficiently into and out of key areas (e.g., POA, shopping
centers, etc.)
o Improve intermodal connectivity, especially better access to the POA and TSAIA
o Improve last mile connectors to commercial/industrial destinations, as well as
residential areas
o Reduce congestion by identifying freight strategies to help facilitate these
improvements;
• Consider formal, designated freight corridors and ensure they are designed for freight by
accommodating trucks and/or providing separation of freight from other users;
• Develop a better understanding of the interaction between land use and freight movement by
maintaining industrial/commercial zones near the TSAIA and POA as well as ensuring
preservation of these land uses (i.e., do not convert to other uses such as residential zoning);
and
• Work toward resolving existing and potential land use conflicts such as developing noise
compatible land uses near industrial areas, preserving right-of-way, and changing land uses to
be compatible with freight movement.
Interviewed participants identified the Anchorage Port Modernization Project (APMP) as the main
priority project in the AMATS region. Other major projects identified included improving access to major
industrial and commercial areas such as the Tikahtnu Commons Shopping Center, POA, TSAIA’s North
and South airparks, and the industrial zone surrounding 92nd Avenue.
Phase 2: Public Review of the draft FMS
Comments received during the public review of this Draft FMS Report will be used to develop a Final
FMS that will be submitted to the AMATS Technical and Policy Committees for review and adoption.
9
3. Vision, Goals, and Objectives To provide a clear direction for the FMS, a refined vision statement, with associated goals and
objectives, became the guidepost to develop and implement the plan. The vision, goals, and objectives
spearheaded by input from the AMATS FAC, also used best practices, and included a literature review of
several regional plans and studies. Equally, the stakeholder interview process also provided additional
direction from various freight user groups to support the development of vision, goals, and objectives.
Vision Statement
The vision statement provides a definitive direction for the FMS and provides an aspirational description
of what the plan aims to accomplish over the long term. Effective vision statements define the core
ideals of any given project’s purpose. This statement also provides guidance about what freight mobility
in Anchorage should look like in the future and provides the long-term perspective needed to make
decisions on freight related issues as they arise.
The FMS vision statement is as follows:
“Anchorage has a highly mobile, safe, and efficient freight delivery
system that provides safe, cost effective, sustainable, secure, and
reliable freight mobility; and supports job creation, economic
growth, and promotes improved quality of life for the area’s
residents.”
This vision is accomplished by implementing the plan’s goals and objectives. While the vision describes
the end result, the goals and objectives are intended to work together to describe how to achieve the
vision. Goals provide the FMS with more specific elements of the overall vision; describe what the region
wants to achieve with the plan; and provide ways to measure the expectations of the plan related to
time, quantity, or quality. Goals are generally agreeable to most people. Objectives are then used to
quantify and clarify the goals and represent specific actions to be taken to achieve the goals.
AMATS and the FAC identified the goals and objectives
of the FMS, and linked them with the goals and
objectives of the Interim 2035 AMATS Metropolitan
Transportation Plan (MTP). The FMS goals, and
associated objectives for each goal, are presented
below.
Objectives should be:
� Realistic and achievable
� As simple and understandable as
possible
� Measurable
� Practical and applicable

10
Goal 1 - Provide a freight transportation system that moves goods safely and securely
throughout the community; improves access; provides mobility; and supports a thriving,
sustainable, broad-based economy.
Objectives for Goal 1:
• Minimize conflicts between freight, transit, and passenger vehicles and non-motorized travelers
to reduce vehicle, pedestrian, and bicyclist crashes and reduce and/or eliminate road versus rail
conflicts.
• Identify short-term and low cost freight infrastructure improvement strategies.
• Monitor system performance and make progress toward meeting performance targets.
• Optimize the transportation system to meet the needs of the POA, TSAIA, ARRC, JBER,
employment centers, and industrial and commercial areas.
• Develop alternative multimodal access strategies to support major freight hubs and improve
first/last mile connectivity between freight modes and major generators.
• Define transportation links with freight investment(s) and economic activity.
• Promote better integration of transportation and land use, and target
redevelopment/development in locations that are well-located and well-served by freight
infrastructure.
• Promote development of an effective roadway network (including a road hierarchy) that meets
capacity needs and is designed to enhance freight mobility while reducing infrastructure
impediments and bottlenecks.
• Provide transportation choices and improve system connectivity for all freight modes while
improving intermodal system linkages and interactions between modes.
Goal 2 - Develop an efficient freight transportation network that considers the cost of
building, operating, and maintaining the system; the equity of all users; public health
impacts; community values; and social justice.
Objectives for Goal 2:
• Consider the life-cycle costs and return on investment of projects when evaluating and selecting
them.
• Identify policies and initiatives to support an efficient freight network and corridor(s)
• Minimize adverse impacts on the community, such as neighborhood through-traffic movements;
noise, air, and light pollution; and impacts to the natural environment such as water resources,
fish habitat, watersheds and wetlands, and parklands.
• Design and landscape roads to maintain and enhance the attractiveness of neighborhoods, open
spaces, and commercial corridors and centers.
• Use context-sensitive strategies, especially to support the development of mixed-use centers
(e.g., town centers, employment centers, and redevelopment areas) and transit-supportive
corridors with more pedestrian-, bicycle-, and transit-oriented street environments while
recognizing the need to move freight into and throughout the community.
Goal 3 - Incorporate technology and best management practices that allow for improved
freight movement in the Anchorage region.
Objectives for Goal 3:
• Develop a multimodal freight system that incorporates advanced technology.

11
• Incorporate freight technology trends into the region’s transportation planning process.
• Use technology, when appropriate, to develop an efficient multimodal system.
• Integrate/implement Intelligent Transportation Systems while partnering with federal, state,
municipal, and local agencies to optimize technologies.
Goal 4 - Integrate freight needs and financing into transportation project prioritization
processes for the region.
Objectives for Goal 4:
• Develop a reliable funding source for multimodal freight projects.
• Refine freight project prioritization process.
• Increase consideration of freight infrastructure needs in the MTP project prioritization process.
• Improve forecasting techniques and long-term needs assessment.
• Consider all potential funding mechanisms and increase use of innovative funding strategies.
• Educate key stakeholders and the public about the cost and benefit to constructing and
maintaining freight infrastructure.
• Collaborate and coordinate with key stakeholders regarding project planning and delivery.
• Invest in freight projects that enhance global competitiveness, freight mobility and reliability,
and economic activity.
• Improve project delivery and implementation processes and scheduling.
Goal 5 - Develop a multimodal freight system that includes effective public and stakeholder
partnerships to leverage opportunities and resources.
Objectives for Goal 5:
• Continue working with the FAC to help define freight-oriented policy.
• Provide additional opportunities for collaboration and information sharing with the private
sector/businesses (freight community).
• Advocate for establishing and supporting public-private partnerships where they make sense.
• Continue to improve interagency relationships to better coordinate freight system regulation.
• Encourage development and sharing of freight expertise and knowledge within and across all
agencies and among elected officials.
Relationship between FMS and MTP Goals
The AMATS MTP is one of the primary tools that will be used to implement the project and policy
recommendations presented in the FMS. The FMS goals and objectives are intended to align with the
Interim 2035 MTP, so that AMATS and its partners will be able to work with and integrate both plans to
develop a long-term, multimodal transportation system that meets the needs of all users, including
freight users, in the region. Table 3-1 shows the relationship of the FMS goals to the 2035 MTP goals
most recently confirmed in the Interim 2035 MTP by AMATS in early 2016.

12
Table 3-1. Relationship between the FMS and Interim 2035 MTP Goals
AMATS FMS Goals
Goal 1 - : Provide a freight transportation system that moves goods safely and securely throughout the community; improves access; provides mobility; and supports a thriving, sustainable, broad-based economy.
Goal 2 - Develop an efficient freight transportation network that considers the cost of building, operating, and maintaining the system; the equity of all users; public health impacts; community values; and social justice
Goal 3 - Incorporate technology and best management practices that allow for improved freight movement in the Anchorage region.
Goal 4 - Integrate freight needs and financing into transportation project prioritization processes for the region.
Goal 5 - Develop a multimodal freight system that includes effective public and stakeholder partnerships to leverage opportunities and resources.
Inte
rim
20
35
Go
als
Goal 1 - Ensure development of a balanced transportation network for people, goods, and services that provides an acceptable level of service, maximizes safety, minimizes environmental impacts, provides a variety of transportation choices, and supports planned land use patterns.
X X X
Goal 2 - Provide a transportation system that moves people and goods safely and securely throughout the community.
X X
Goal 3 - Develop an attractive and efficient transportation network that considers the cost of building, operating, and maintaining the system; the equity of all users; public health impacts; community values; and social justice.
X X
Goal 4 - Develop a transportation system that supports a thriving, sustainable, broad-based economy by locating and using transportation infrastructure and facilities to enhance community development.
X
Goal 5 - Establish community connectivity with safe, convenient, year-round automobile and non automobile travel routes within and between neighborhoods, commercial centers, and public facilities.
X X
Goal 6 - Improve access to goods, jobs, services, housing, and other destinations while providing mobility for people and goods in a safe, affordable, efficient, and convenient manner.
X X
Goal 7 - Provide a transportation system that provides viable transportation choices among various modes.
X X X
13
4. Freight Planning Best Practices Freight transportation planning and policy “best practices” used in in the United States provides
strategies and policies that are designed to move freight as efficiently as possible in and around
metropolitan areas. In the FMS planning process, several “best practices,” as defined in transportation
research for metropolitan freight planning helped to develop the FMS recommendations. A thorough
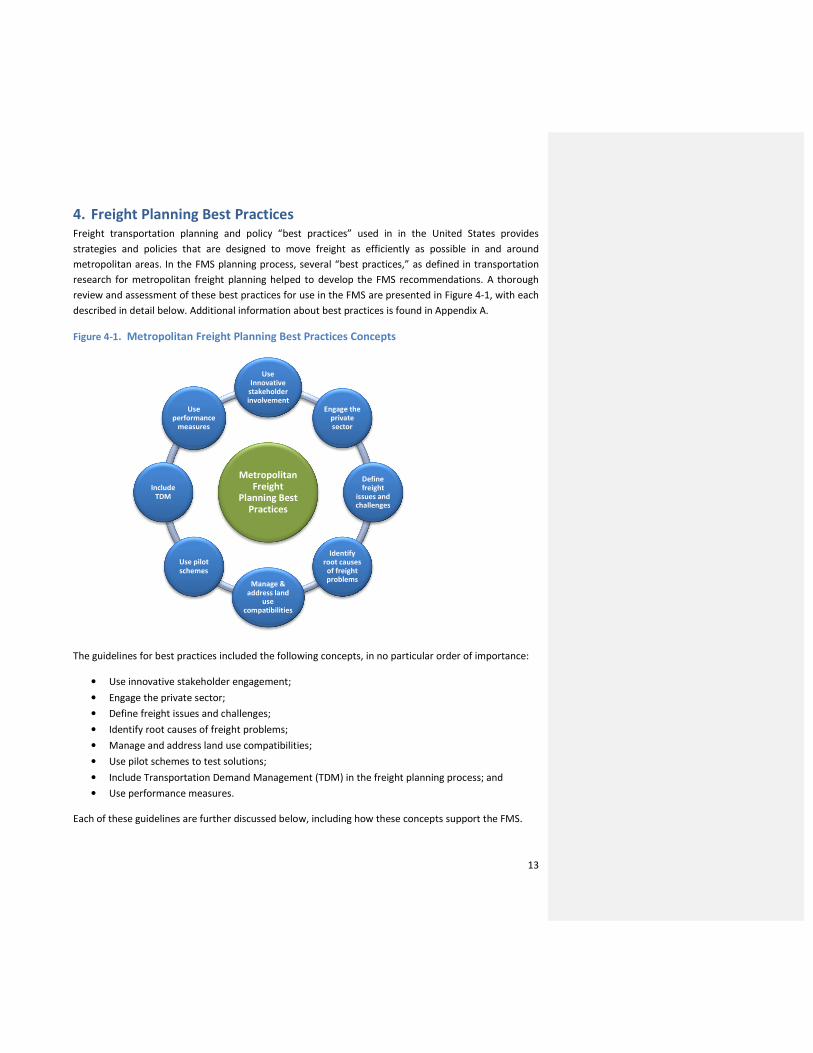
review and assessment of these best practices for use in the FMS are presented in Figure 4-1, with each
described in detail below. Additional information about best practices is found in Appendix A.
Figure 4-1. Metropolitan Freight Planning Best Practices Concepts
The guidelines for best practices included the following concepts, in no particular order of importance:
• Use innovative stakeholder engagement;
• Engage the private sector;
• Define freight issues and challenges;
• Identify root causes of freight problems;
• Manage and address land use compatibilities;
• Use pilot schemes to test solutions;
• Include Transportation Demand Management (TDM) in the freight planning process; and
• Use performance measures.
Each of these guidelines are further discussed below, including how these concepts support the FMS.
Metropolitan Freight
Planning Best Practices
Use Innovative
stakeholder involvement
Engage the private sector
Define freight
issues and challenges
Identify root causes
of freight problems
Manage & address land
use compatibilities
Use pilot schemes
Include TDM
Use performance
measures

14
Use Innovative Stakeholder Engagement
To address goods movement issues within a region, a proactive method for forming partnerships with
freight stakeholders in both the private and public sectors is to actively involve them in the metropolitan
planning process (Figure 4-2). Many of these partnerships are already established and defined across
different levels of government and include neighboring jurisdictions. This includes partnerships among
governments—municipal, regional, state, and federal—and inter-organizational partnerships that work
toward common goals. Collaboration between different groups is essential to achieving planning and
implementation goals.
Figure 4-2. Stakeholder Engagement Process Guidelines for Freight Planning
Critical to the success of metropolitan freight planning initiatives is to gain the support and to build
continued consensus with stakeholders. With early involvement and consensus-building at the
development stages of a freight planning program such as the AMATS FMS, the less likely conflict will
occur in the future. For example, when freight stakeholders are negatively impacted or inconvenienced
by the freight planning process, timely engagement can help them understand the purpose and benefits
of freight planning to their operations. The AMATS FAC, which includes members of the public and
private sectors, are and remain closely involved in the development of the FMS, providing input and
recommendations throughout the planning process. Stakeholders, through the use of in-person
interviews, provided additional input into the FMS planning process on how the existing freight network
is working, what inefficiencies may happen, and what additional opportunities could improve the
current system.
Designate a “freight person” at theregional agency to become the focalpoint of communications betweenthe public and private sectors
Establish a “Freight AdvisoryCommittee” (FAC) to become a forumfor discussing freight issues withpublic and private sector members
Establish a “Technical AdvisoryCommittee” (TAC) for public-sectorstaff from various agencies tocontribute to more harmonizedpolicy development that considerslocal and regional freight issues
Educate elected officials aboutfreight so they can integrate freightinto broad transportation planningprocesses and explain its importanceto the public
Best Practices for Stakeholder Engagement

15
Engage the Private Sector
It is important to engage the private sector in the freight planning process because they are involved in
different aspects of freight acquisition and distribution in any given region. The private sector in freight
planning includes all types of business sizes (small, medium, large) as well as a range of vehicle types
(e.g., delivery vans, small trucks, and large trucks) and
various freight modes (e.g., truck, rail, and air). The
objectives of involving the private sector in
metropolitan freight planning are different from
those of the public sector because private companies
are interested in revenue and profit levels, while
public agencies are interested in increasing economic
benefits for society as a whole (and their regions) and
reducing negative externalities.
By addressing freight mobility issues for the private
sector, the general public will benefit from improved efficiencies and increased economic activity.
Nationally, while not typically involved in transportation policy development, private sector
organizations and companies are increasingly more engaged in the region because they offer innovative
ideas and solutions for freight delivery and can recognize regulations that have a detrimental impact on
their operations. Because private companies are actively involved in moving and receiving freight on a
day-to-day basis, they are also able to pinpoint key infrastructure bottlenecks and other road
impediments that occur on the network. In Anchorage, there are several representatives from the
private sector on the FAC.
As presented in Chapter 2, a series of stakeholder interviews supported the AMATS FMS in identifying
the concerns and needs of various regional freight stakeholders, both the public and private sector. The
interviews provided great insight into existing freight challenges and conditions in the AMATS region
while helping to determine local freight operator issues and requirements to implement a more efficient
freight system. The process allowed private trucking companies and organizations an opportunity to
provide input in the freight planning process for the FMS and learn more about potential ways to
communicate with the FAC and AMATS about freight system decisions and routes.
Define Freight Issues and Challenges
Stakeholders and AMATS FAC members helped to
define the key freight issues and challenges facing the
region. There are many competing issues and if the
focus on the freight planning process is too broad, then
an overly complicated planning process will result and
potentially spread agency resources too thin. If the
focus is too narrow, then some important items could
be left out of the planning process. By defining specific
freight issues and challenges, the FMS can help increase
Steps to Defining Freight
Issues:
� Create potential short-
, medium-, and long-term
project and policy portfolios;
� Determine a prioritization process;
and
� Evaluate potential funding sources.

16
the visibility of these problems and guide the direction of freight planning in the process. Creating a
“Freight Portfolio” with a short-, medium-, and long-term inventory of specific problems and associated
solutions (e.g., strategies, projects, and policies) will help with funding projects and incrementally draft
policies that may be used to push for change.
Also, this prioritization process may determine which portions of the freight system are most critical to
freight mobility and the region’s economic competitiveness. As identified during the development of the
FMS, freight issues and challenges are validated by using existing literature, data, and stakeholder
interviews as well as documenting the AMATS FAC concerns. Identifying and defining these issues, as
synthesized in Chapter 5, guided the future recommendations for projects and policies in the FMS
planning process.
Identify Root Causes of Freight Problems
To notice and understand the reason for freight issues and problems, as well as address the root causes
of these problems, is a critical factor in the development of freight plans. For example, truck idling is
often caused by the inability or unwillingness of businesses (receivers) to accept deliveries. This type of
truck idling in the vicinity of large buildings is frequently aggravated by delivery-time restrictions that
shorten the period when deliveries are made (Transportation Research Board [TRB], 2015:7). These
constraints and restrictions result in roadway bottlenecks, delays, and congestion, as well as increased
emissions. Therefore, grasping the impacts of freight congestion on roadways that are traced to delivery
truck idling (as the root cause) is a key policy discussion in the freight planning process. This example,
among many others, requires further evaluation and examination that will assist agencies to outline and
address these freight issues and the accompanying potential mitigation strategies.
As shown in Figure 4-3, a variety of work can be undertaken to recognize important root causes in
regional freight issues. Because individuals and groups interact with and use the freight system
differently, stakeholder outreach is essential. Continued and ongoing stakeholder outreach is valuable
because it provides additional information on the freight system characteristics important to users and
supplements the data collection process. Agency participation also helps pinpoint freight problems and
concerns; it is imperative for agencies to work with each other, stakeholders, and the public to find and
proposide solutions to freight problems. Assessment of the stakeholder outreach information, agency
input, and the data collected can then be linked to identify the root causes of any current and on-going
freight problems.
In the AMATS FMS planning process, some root causes for freight issues are identified by system users.
The FMS stakeholder interviews provided specific background information that guided and determined
such root causes. For example, the Municipality of Anchorage’s (MOA) noise ordinance may conflict with
traffic management. Gravel operations must be finished by 10pm, resulting in ARRC blocking C Street
near 68th Avenue during heavy commuter periods so gravel operations can be completed by 10pm to
comply with local ordinances.
The identification process aids in establishing the root cause to any given problem or impact. As a result,
the issue can also support and provide a wide range of potential solutions.

17
Figure 4-3. Tasks Involved in Determining Root Causes to Freight Issues
Manage and Address Land Use Compatibilities
Logistics-oriented facilities often require large parcels of land and access to the freight transportation
network. Various agencies in the United States and Canada have advanced land use and development
regulations along with guidance that supports appropriate buffer zones between logistics-intensive land
uses and other, incompatible land uses (to these logistics-oriented facilities) such as residential or
commercial mixed-use. To optimize the use and location of appropriate transportation facilities, these
agencies also designed logistics-oriented businesses that clustered near intermodal connectors and
services. Ensuring that policies are in place to cluster freight transportation facilities will help increase
the efficiency of the freight transportation system while limiting the other land use disturbances.
Moreover, stakeholders regularly stressed preserving existing and future commercial and industrial sites
in Anchorage; especially those areas that are accessible between major freight generators such as TSAIA
and POA. However, other encroaching land uses can result in potential land use conflicts such as noise
compatibility and right-of-way issues while also increasing the potential for safety problems (e.g.,
slowing down ARRC freight trains allows pedestrians to cross tracks).
Use Pilot Schemes to Test Solutions
When there is high certainty that the benefits from a possible solution to freight access, safety concerns,
etc. outweigh the negative costs, then public-sector changes that may affect freight activity should be
implemented. For instance, pilot projects could allow public agencies to adjust (or cancel) the initiative
based on stakeholder impact and other data analysis. Next, once the freight project and policy
recommendations are implemented through the FMS planning process, then promising pilot schemes
can be analyzed and determined. Examples of viable pilot projects include a cargo bicycle delivery
program and an off hours freight delivery program.
Determining Root Causes
Stakeholder Outreach
Assessment and
Analysis
Data Collection
Agency Participation

18
Include Transportation Demand Management (TDM) in the Freight Planning
Process
TDM is typically associated with addressing policy objectives such as energy conservation,
environmental protection, shifting commuters to alternative modes (e.g., transit, rideshare, and
walking), and passenger travel congestion reduction. Historically, TDM policies have focused on personal
travel, including “smarter” or “more efficient” transportation system projects specific to commuter
ridesharing, telecommuting, and trip reductions. Increasingly, however, public agencies at the federal,
state, and local levels are trying to apply TDM to goods movement and freight policy.
During the development of the AMATS FMS, freight stakeholders and the public expressed the need for
specific freight route designations/corridors/districts within the region and the creation of policies to
ensure that these routes increase not only the efficiency of freight transportation, but also enhance
public safety. Other quality of life issues such as reducing the amount of time freight vehicles spend
idling and emitting pollutants at intersections, especially during heavy commuter periods can also be
improved through such policies. Figure 4-4 illustrates various TDM policies that are currently being
implemented to support metropolitan freight transportation systems.
Figure 4-4. Example Transportation Demand Management Strategies used in Metropolitan Freight
Planning
Use Performance Measures
Performance measures are a part of the standard planning process for states and regions in the United
States, and are growing in use over the past two decades or more. Measures gauge the degree to which
goals and objectives are achieved, and are linked directly to the vision, goals, and objectives on long-
range transportation planning and metropolitan freight planning. MAP-21 (and now the Fixing America’s
Surface Transportation, or “FAST,” Act) requires undertaking systematic performance measurements to
determine the impacts of the strategies, programs, and funding used to address freight issues in the
planning process. Performance measures (e.g., safety, parking, use of alternative fuels, and reliability)
Organize regional delivery systems so fewer vehicle
trips are needed to distribute goods
Create pricing and tax policies that encourage
efficient freight transport.
Change freight delivery times to reduce congestion
Use smaller vehicles and human-powered transport
especially for distribution in urban areas
Transportation Demand
Management Strategies

19
should be directly related to a single objective, easily quantifiable, and able to measure the entire range
of levels of achievement (e.g., using a scale, not just “achieved” or “not achieved”). Because
performance measures evaluate how conditions that can affect system performance, these metrics
provide early warning signs to freight problems that may need to be addressed and planned for in the
future. Performance measures are significant to the freight planning process. In the development of the
AMATS FMS, the project team reviewed literature and gathered data from local agencies and
stakeholders to determine relevant and suitable freight performance measures. Detailed performance
measures and specialized data supporting the AMATS FMS are presented later in Chapter 6.
20
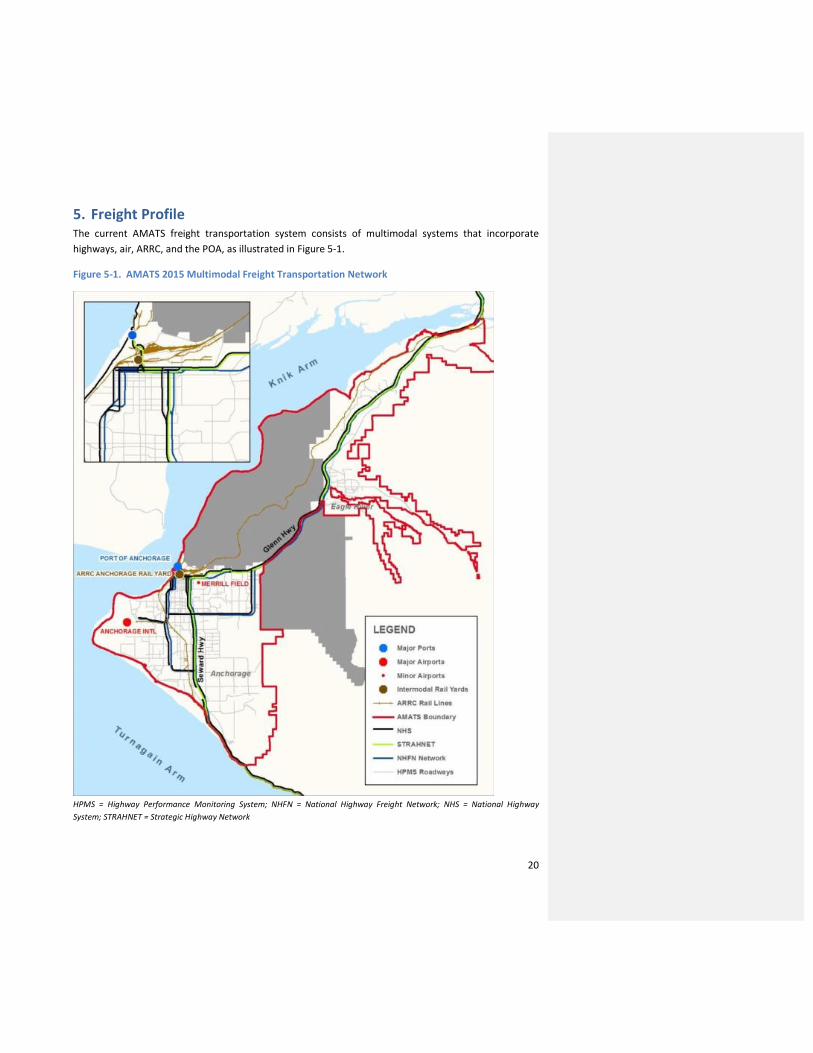
5. Freight Profile The current AMATS freight transportation system consists of multimodal systems that incorporate
highways, air, ARRC, and the POA, as illustrated in Figure 5-1.
Figure 5-1. AMATS 2015 Multimodal Freight Transportation Network
HPMS = Highway Performance Monitoring System; NHFN = National Highway Freight Network; NHS = National Highway
System; STRAHNET = Strategic Highway Network
21
Over time and in response to many regional demands, including steady population growth, the
Anchorage freight transportation network also expanded. Equally, with a heavy concentration of
transport-dependent industries that rely on Anchorage’s freight network to move bulk goods such as
petroleum, heavy equipment, and seafood this required an efficient and interconnected freight
network. In order to continue to evolve and provide a solid foundation to Anchorage’s long-term
economic well-being, the freight network must respond to these and any market changes. See Chapter 7
of this report for a detailed discussion of Anchorage’s population, employment, and industry trends. The
following section presents the existing (2015) and anticipated 2035 freight networks (including potential
freight system improvements) by mode as well as the system’s relation to the AMATS economy.
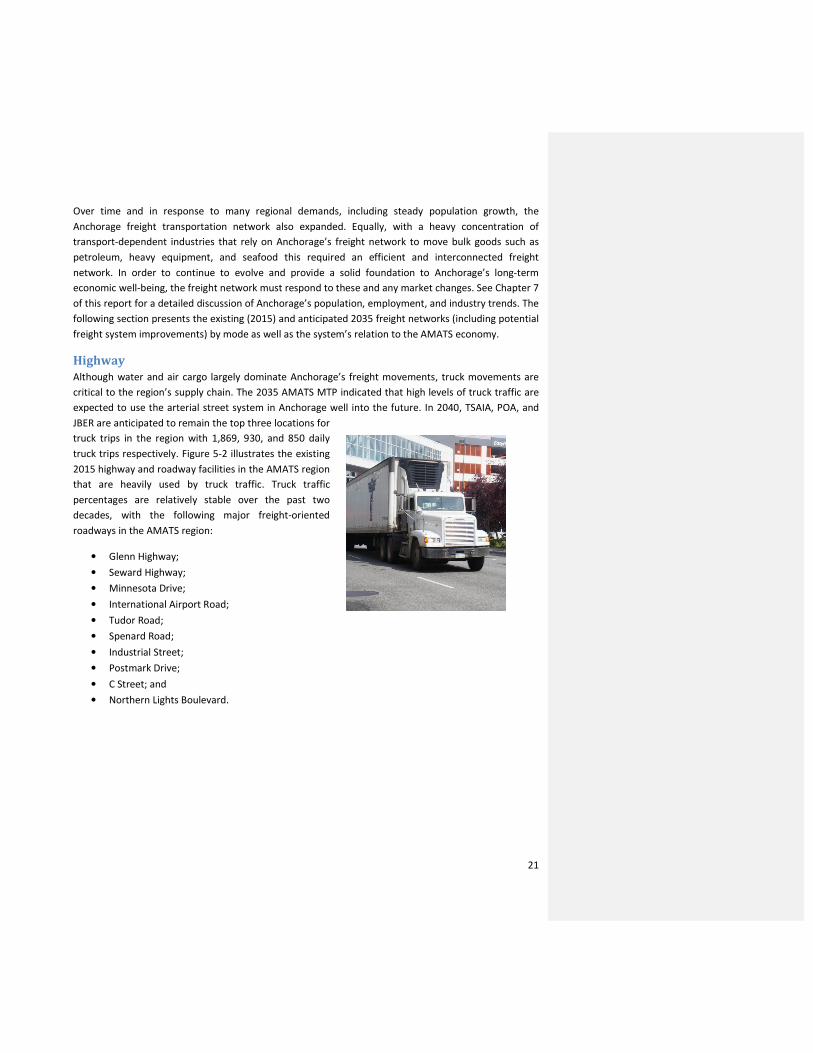
Highway
Although water and air cargo largely dominate Anchorage’s freight movements, truck movements are
critical to the region’s supply chain. The 2035 AMATS MTP indicated that high levels of truck traffic are
expected to use the arterial street system in Anchorage well into the future. In 2040, TSAIA, POA, and
JBER are anticipated to remain the top three locations for
truck trips in the region with 1,869, 930, and 850 daily
truck trips respectively. Figure 5-2 illustrates the existing
2015 highway and roadway facilities in the AMATS region
that are heavily used by truck traffic. Truck traffic
percentages are relatively stable over the past two
decades, with the following major freight-oriented
roadways in the AMATS region:
• Glenn Highway;
• Seward Highway;
• Minnesota Drive;
• International Airport Road;
• Tudor Road;
• Spenard Road;
• Industrial Street;
• Postmark Drive;
• C Street; and
• Northern Lights Boulevard.

22
Table 5-1 Average Daily Truck Counts, 2014
Location Single AADTT Combination AADTT %AADT
Alyeska Highway, Girdwood 291 38 11%
De Armoun Road, Anchorage 568 32 11%
Old Seward Highway, Anchorage 332 97 5%
O'Malley Road, Anchorage 534 251 7%
Rabbit Creek Road, Anchorage 317 46 5%
Hillside Drive, Anchorage 120 16 6%
Elmore Road, Anchorage 670 612 10%
Jewel Lake Road, Anchorage 458 44 4%
International Airport Road,
Anchorage
602 48 5%
Minnesota Drive, Anchorage 932 539 4%
Wisconsin Street, Anchorage 748 145 9%
3rd Avenue, Anchorage 892 399 12%
Debarr Road, Anchorage 314 24 2%
Providence Drive, Anchorage 96 23 3%
Eagle River Road, Eagle River 170 85 7%
The POA generates significant amounts of truck traffic that use downtown streets due to the limited and
lack of access to the highway system. Freight traffic problems and issues result at the C Street/Port and
Ocean Dock Road intersection because it is the single, primary access point for trucks traveling to and
from the Port. Roads critical to the distribution of goods to and from the POA include the Glenn
Highway, Seward Highway, International Airport Road, Minnesota Drive, C Street, and Tudor Road as
well as Reeve Boulevard, Post Road, and Whitney Road. Ships arrive at the Port on Sundays and
Tuesdays, rendering these days of the week as some of the heaviest for truck traffic in the AMATS
region.
In general, trucks use Postmark Drive to access TSAIA cargo facilities. Other common truck routes to and
from TSAIA include Minnesota Drive, Raspberry Road, Jewel Lake Road, Northern Lights Boulevard, and
Spenard Road.

23
Figure 5-2. 2015 AMATS Primary Highway Facilities Moving Trucks
When traffic incidents or accidents occur, the 2035 AMATS MTP documented the lack of alternative
routing to the Glenn Highway. Non-recurring delay caused by incidents/accidents on the
highway/roadway network is an ongoing concern for trucks moving through the region. However, there

24
remains a need for a parallel or redundant highway facility that provides an alternative to the Glenn
Highway and also a contingency plan for incident management in the event of a major emergency. The
use of military frontage roads is an applicable implementation strategy to provide this redundancy;
there are agreements in place with JBER to use their road system should the frontage roads be needed.
Air
Alaska’s transportation system is unique in the United States because the state lacks an extensive
highway/roadway system. As a result, Alaskans rely more heavily on air traffic to move goods and
passengers than the Lower 48 States. Figure 5-1 shows the primary airport facilities in the AMATS
region.
TSAIA, the primary airport facility in the AMATS
region, is a 4,612-acre complex owned and
operated by the State of Alaska. TSAIA and
associated entities employ over 15,500 people
in Anchorage and offers three runways as well
as a variety of surrounding industrial parcels
that benefit from excellent airport access. With
sufficient storage and movement space to
accommodate current levels of freight-oriented
air and truck traffic, the North Airpark offers
many amenities. More than 265 businesses/agencies currently lease space at TSAIA. The existing facility
also offers potential for onsite industrial development to facilitate easy transfer to planes.
TSAIA is also a critical through-point/fueling station and crew stop for international air traffic.
Approximately three-quarters of TSAIA cargo includes in-transit international movements, meaning that
carriers stop through TSAIA to refuel while on international trips. TSAIA pumps over 2 million gallons of
fuel onsite each day (DOT&PF, 2015). TSAIA ranks fifth in international airports for worldwide cargo
throughput, and imports from Asia account for a significant amount of this inbound cargo (MOA and
URS Corporation, 2012). In 2014, TSAIA ranked second in the nation for all-cargo weight landed (Federal
Aviation Administration [FAA], 2015. Table 5-2 illustrates the number of cargo flights and shows these
shares by direction.
Table 5-2. TSAIA Air Cargo by International and Domestic Share, 2015
Direction International Domestic Total International
% of Total
Flights
Domestic
% of Total
Flights
Enplaned 1,864 769,522 771,385 0% 13%
Deplaned 2,927 661,767 664,695 0% 11%
In-Transit 4,310,040 54,450 4,364,490 74% 1%

25
Total Flights 4,314,831 1,485,739 5,800,570 -- --
Approximately 10 percent of freight entering the Anchorage region arrives via TSAIA. Air cargo inbound
to TSAIA is often “express” cargo, indicating high-priority commodities such as electronics and
pharmaceuticals. Commodities that arrive at TSAIA commonly move via truck to distribution centers on
dedicated truck routes. Most of the remaining cargo includes domestic movements, either loading or
unloading at TSAIA. Major cargo carriers at TSAIA include UPS and FedEx. For in-transit cargo, Polar Air
Cargo Worldwide, Inc., and Cathay Pacific Airways move the most freight by weight through TSAIA
(Figure 5-3).
Figure 5-3. Cargo Movements by Direction at TSAIA, 2014-2015
In addition to TSAIA, Merrill Field is a regional airport located
just south of the POA and ARRC Rail Yard in downtown
Anchorage. Due to its smaller size, Merrill Field experiences
limited freight air traffic, with FAA reporting less than 1,000
cargo tons moving through the airport each year.
Rail
As the only railroad provider in Anchorage (Figure 5-5), ARRC
operates more than 650 miles of passenger and freight rail
throughout the state. In 2015, ARRC reported that more
than 10,000 loads of container freight moved in and out of
Anchorage. ARRC moves a substantial volume of container traffic to Anchorage from Whittier but also
moves a large volume of intermodal traffic originating in Anchorage to Fairbanks. The AMATS 2035 MTP
states that the majority of commodities moved via rail consisted of ‘gravel,’ ‘coal,’ ‘petroleum,’ ‘military
shipments,’ and ‘general cargo containers.’ ARRC reported that the main rail traffic in Anchorage
included petroleum trains between Fairbanks and Anchorage (a 356-mile distance) and gravel trains
-
500,000
1,000,000
1,500,000
2,000,000
2,500,000
3,000,000
3,500,000
4,000,000
4,500,000
5,000,000
Enplaned Deplaned In-Transit
2014 2015
Po
un
ds
(00
0s)

26
between the Matanuska-Susitna Valley and Anchorage (a 40-mile distance). Export coal primary moves
via ARRC lines between Healy, Seward, and Fairbanks (ARRC, 2015). In 2015, the ARRC moved
approximately 4,285 million tons of freight of which 381 million tons is petroleum, 900 million tons is
coal1, and 123 million tons is intermodal (HDR, Inc. with CDM Smith, 2015). Figure 5-4 summarizes
freight tonnage moved by the ARRC statewide between 2011 and 2015.
Figure 5-4. Freight Commodity Tonnage moved by the ARRC, 2011-2015 in Thousands of Tons
1 The market for coal exported from Alaska declined in recent years due to low coal prices. In September 2016, the
ARRC closed their Seward Coal Loading Facility and there are no current plans to re-open this facility. This is not
anticipated to have a significant impact on freight movement in Anchorage.

27
Figure 5-5. Alaska Railroad Facilities in AMATS Region
ARRC also owns and operates a rail yard north of downtown Anchorage to the northeast of TSAIA that
functions as a distribution hub to other modes and facilities, including the POA and TSAIA. This facility
offers connectivity between truck, rail, and water cargo. The rail yard connects to Seward in the south

28
and Fairbanks in the north via Class II railroad lines. ARRC does not connect to any other rail lines in
North America except by rail barge.
Figure 5-5 also illustrates all ARRC crossings within the AMATS study area. ARRC tracks include 63 at-
grade rail crossings in Anchorage. The majority of these crossings exist near the POA in Ship Creek,
adjacent to TSAIA facilities, and along the industrial land use areas located in the middle of and in South
Anchorage (Arctic Boulevard, Dimond Boulevard). Eleven crossings lack sign or signal controls, eight
crossings have signals or signage, and the remaining crossings are unspecified. There is no publicly
available data to assess existing conditions and the level of safety of the ARRC’s tracks, facilities, and
bridges. ARRC deals with the common issue of property owners building too close to the ARRC right-of-
way as well as the rail tracks.
Waterborne Freight and Cargo
Waterborne freight is an essential component of
Anchorage’s economy and multimodal freight
transportation network. The POA is the primary
shipping port and accounts for the majority of freight
shipped to and from Anchorage by water. Waterborne
freight is also the dominant mode for transporting
goods to many communities throughout the state that are inaccessible by roadway. The POA is a critical
transportation hub for Anchorage and the rest of the state, with goods arriving for transport to other
communities.
The POA is the only major port that exists in the AMATS FMS study area. The MOA owns the POA, which
is a self-supporting enterprise department that operates using revenue and grant funding. The POA is a
major transportation infrastructure asset to the regional economy. Fifty-five percent of the waterborne
freight, and 90 percent of all refined petroleum products that enter the State through Alaska’s Railbelt
region, arrive via the POA. Fifty percent of all waterborne freight that enters Alaska crosses the POA
docks annually, as does 32 percent of all refined petroleum used state-wide. Approximately 12 percent
of the freight that arrives through the POA moves north to Fairbanks via rail, and another 12 to 15
percent of the total moves via truck to other destinations outside Anchorage. The POA also plays an
instrumental role in the distribution of cargo to rural communities throughout the state. Over 350
communities rely on cargo shipped to the POA, which is then distributed via barge to those communities
that lack highway and railway connections.
Figure 5-6 summarizes the tonnage moved through the POA 2006 to 2015. The data in Table 5-3 provided by
the Port of Anchorage shows tonnage specific to the POA and shows shifts in commodities at the Port from
2006 to 2013.

29
Figure 5-6. Port of Anchorage Tonnage, 2006-2013
Table 5-3. Port of Anchorage Tonnage Trends by Commodity 2006-2015
2015 2014 2013 2012 2011 2010 2009 2008 2007 2006
Dry Bulk Goods 126,737 140,684 119,271 119,939 118,280 109,228 81,494 116,789 124,089 134,921
Petroleum,
NOS (vessel
fueling)
7,013 2,031 2,615 1,454 2,052 1,660 2,032 2,648 2,618 2,888
Vans/Flats/
Containers 1,681,222 1,811,136 1,742,704 1,658,813 1,705,176 1,736,943 1,713,086 1,831,816 1,785,518 1,722,499
Vehicles* 0 0 0 0 864 0 1,473 10,725 5,381 1,158
Petroleum,
Shoreside 368,294 916,050 952,631 1,046,636 1,376,909 1,192,705 1,426,711 1,830,848 1,698,581 1,421,133
Petroleum, Rail
Rack 0 0 0 0 0 0 0 0 0 76,266
Petroleum,
Bulk- Dockside 1,592,317 580,343 586,041 829,900 931,931 922,426 573,352 577,236 699,727 968,684
Total 3,775,584 3,450,243 3,403,261 3,656,741 4,135,211 3,962,962 3,798,148 4,370,061 4,315,913 4,327,549
*Note: Since 2011, vehicles are reported as part of the vans/flats/containers category.
0 500,000 1,000,000 1,500,000 2,000,000 2,500,000 3,000,000 3,500,000
2013
2012
2011
2010
2009
2008
2007
2006
DOMESTIC FOREIGN

30
The existing facilities at the POA
include three general cargo
terminals; two bulk petroleum
product terminals; cement off-
loading facilities; an on-dock public
transportation shed; rail mounted
electric container cranes; a bulk
petroleum valve yard; and
intermodal exchange infrastructure
to transition goods to rail, road, and
air modes. Current on-site issues
noted by the POA include annual
dock pile repairs, concerns with
storm drain integrity (which can
cause localized flooding and
potholes), inadequate emergency
back-up power, silting at the Tote
terminal, and outstanding erosion at
the Ship Creek Boat Launch. The 55-
year-old POA is undergoing a
modernization effort (referred to as the APMP) with a variety of improvement projects that will update
and renovate the facility to current maritime commerce standards, provide seismic resilience, and
ensure a capability to parallel the region’s expected population growth.
Pipeline
The AMATS study area contains two major pipeline facilities (Figure 5-7). First, the Nikiski Alaska Pipeline
carries liquefied natural gas from the ARRC Anchorage Rail Yard to the west. The Beluga Gas Pipeline is
the second major pipeline carrying natural gas through JBER to the Knik River, parallel to the Glenn
Highway. Other pipelines in the Anchorage area include a Tesoro pipeline that connects Tesoro’s Nikiski
refinery to TSAIA and POA, a pipeline between the POA and TSAIA, and a JP-8 fuel pipeline between the
POA and JBER. No significant pipeline incidents in the past decade (Pipeline and Hazardous Materials
Safety Administration [PHMSA], 2016) are reported. Pipeline infrastructure in the AMATS FMS study
area is currently sufficient, and there are no major capacity or safety concerns anticipated over the next
two decades.
POA’s Freight Interchange System
Source: http://www.portofanc.com/wp-content/uploads/sunny_day.jpg

31
Figure 5-7. AMATS Study Area Pipeline Facilities

32
6. Freight Flows Freight or commodity flows are used to examine the level of demand upon various multimodal freight
transportation network elements. Freight flows provide insights about key trade and market
relationships for a state or region. One primary source of freight flow information for this analysis is the
Federal Highway Administration’s (FHWA) Freight Analysis Framework, version 4 (FAF-4). This data is
derived from the Commodity Flow Survey conducted every 5 years by the U.S. Census Bureau and
Federal Bureau of Transportation Statistics.
Freight is currently shipped to and from Anchorage via water, air, highway, rail, and pipeline. In total,
transport by water dominates the freight movements to and from Anchorage as well as to and from the
State of Alaska. As shown in Figure 6-1, nearly half of the total goods (by weight) traveling to and from
the state are transported by water (43 percent), with other total goods movements include 29 percent
by truck, 16 percent by pipeline, 6 percent by rail, 3 percent by air, and 3 percent by multiple
modes/mail.
Figure 6-1. Alaska’s 2012 Statewide Commodity Flows (Weight) by Mode – Domestic/Import/Export
Truck
29%
Rail
6%
Water
43%
Air
(include
truck-air)
3%
Multiple
modes &
3%
Pipeline
16%
TOTAL
Truck
30%
Rail
5%
Water
46%
Air
(include
truck-air)
0%
Multiple
modes &
2%
Pipeline
17%
DOMESTIC
Truck
26%
Rail
8%
Water
17%
Air
(include
truck-air)
30%
Multiple
modes &
6%
Pipeline
13%
IMPORT
Truck
28%
Rail
17%Water
11%
Air
(include
truck-air)
15%
Multiple
modes &
24%
Pipeline
5%
EXPORT
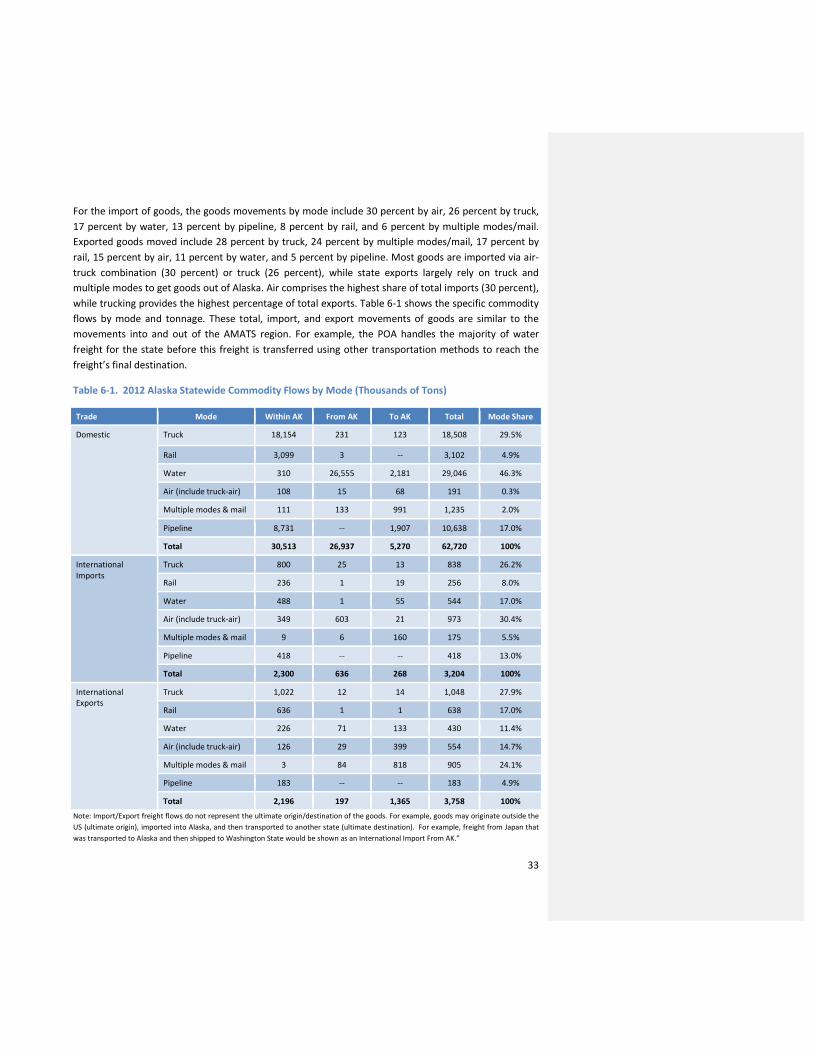
33
For the import of goods, the goods movements by mode include 30 percent by air, 26 percent by truck,
17 percent by water, 13 percent by pipeline, 8 percent by rail, and 6 percent by multiple modes/mail.
Exported goods moved include 28 percent by truck, 24 percent by multiple modes/mail, 17 percent by
rail, 15 percent by air, 11 percent by water, and 5 percent by pipeline. Most goods are imported via air-
truck combination (30 percent) or truck (26 percent), while state exports largely rely on truck and
multiple modes to get goods out of Alaska. Air comprises the highest share of total imports (30 percent),
while trucking provides the highest percentage of total exports. Table 6-1 shows the specific commodity
flows by mode and tonnage. These total, import, and export movements of goods are similar to the
movements into and out of the AMATS region. For example, the POA handles the majority of water
freight for the state before this freight is transferred using other transportation methods to reach the
freight’s final destination.
Table 6-1. 2012 Alaska Statewide Commodity Flows by Mode (Thousands of Tons)
Trade Mode Within AK From AK To AK Total Mode Share
Domestic Truck 18,154 231 123 18,508 29.5%
Rail 3,099 3 -- 3,102 4.9%
Water 310 26,555 2,181 29,046 46.3%
Air (include truck-air) 108 15 68 191 0.3%
Multiple modes & mail 111 133 991 1,235 2.0%
Pipeline 8,731 -- 1,907 10,638 17.0%
Total 30,513 26,937 5,270 62,720 100%
International
Imports
Truck 800 25 13 838 26.2%
Rail 236 1 19 256 8.0%
Water 488 1 55 544 17.0%
Air (include truck-air) 349 603 21 973 30.4%
Multiple modes & mail 9 6 160 175 5.5%
Pipeline 418 -- -- 418 13.0%
Total 2,300 636 268 3,204 100%
International
Exports
Truck 1,022 12 14 1,048 27.9%
Rail 636 1 1 638 17.0%
Water 226 71 133 430 11.4%
Air (include truck-air) 126 29 399 554 14.7%
Multiple modes & mail 3 84 818 905 24.1%
Pipeline 183 -- -- 183 4.9%
Total 2,196 197 1,365 3,758 100%
Note: Import/Export freight flows do not represent the ultimate origin/destination of the goods. For example, goods may originate outside the
US (ultimate origin), imported into Alaska, and then transported to another state (ultimate destination). For example, freight from Japan that
was transported to Alaska and then shipped to Washington State would be shown as an International Import From AK.”

34
Most bulk goods require an intermodal freight network to go from its origin to destination point. The
majority of consumer goods arrive in Anchorage via the POA. Subsequently, goods are transported from
water modes to air, truck, or rail. A strong intermodal freight network in Anchorage promotes efficient
freight movement while also lowering costs for moving goods for both the public and private sectors.
The intermodal freight network is critical for the AMATS region and Alaska, since there is not an
extensive road system. Goods are often moved from one transport mode to another because existing
infrastructure constraints may make using other transport methods (e.g., water or air) more efficient.
The adaptability, capacity, and capability of the freight network relies heavily on the successful “lifts”
(the transfer of goods from one mode to another) between various transportation modes. The goal of
carriers is to reduce the number of “lifts” required for goods delivery. As more “lifts” incur more costs.
Often, cargo is sent to other surrounding communities and may require transfer from one cargo carrier
to another via water, or other, modes. Goods transported between the POA and TSAIA via truck or are
transferred to railroad. Transfers should be fast and efficient. To help with the movement of freighted
goods, shipping containers may have specific dimensional guidelines so the containers can be easily
moved from barging to rail or trucking equipment. Intermodal efficiency saves cargo companies money
in the long term, reduces energy costs, and increases profitability for various freight forwarders and
their clients.

35
7. Local and Regional Freight Issues and Trends Local and regional freight issues and trends are presented in this section, summarizing local industries,
employment, and land uses. Issues and forecasts for the transportation network related to bottlenecks,
levels of service (LOS), capacity and well as safety and security for each transportation mode are also
described in this section.
Local Industries and Employment
Freight movement is directly tied to the economic well-being of a given region, and the AMATS region is
no exception. Local industries drive the freight market with considerable impacts on commodity
movements within, to, from, and through the AMATS region. According to the 2010 Census, Anchorage
includes over 291,000 inhabitants and over 107,000 households; it is the largest municipality in Alaska
and is a strong economic driver for the entire state (U.S. Census Bureau, 2016). Major industries in
Anchorage between 2004 and 2014 included mining, quarrying, oil/gas extraction as well as
transportation and warehousing.
Anchorage employment levels have increased for many industries; such as health care/social assistance,
accommodation/food services, and retail trade between 2004 and 2014 (Figure 7-1). Table 7-1 shows
the steady boost in growth (an expected 21 percent increase in employment regionally) of these
employment sectors expected from 2013 to 2040, which will impact the needs of the future multimodal
freight transportation system in the AMATS region. For example, retail trade requires facilities and
establishments with the ability to handle and receive large commodity shipments for distribution.

36
Figure 7-1. Anchorage Employment Levels for 2004, 2009, and 2014
Source: Bureau of Labor Statistics Quarterly Census of Employment and Wages, n.d.
Table 7-1. AMATS Region Employment Growth Estimates by Industry, 2013-2040
Employment Category 2013 2040 %Change
Natural Resources Employment (NAICS 11, 21) 4,651 5,182 11%
Wholesale Trade, Manufacturing and Utilities Employment (NAICS
22,31,32,33,42) 8,415 10,434 24%
Construction Employment (NAICS 23) 13,306 14,723 11%
Retail Trade Employment (NAICS 44, 45) 23,315 28,372 22%
Transportation & Warehousing Employment (NAICS 48, 49) 12,983 15,146 17%
FIRE, Professional Services and Other Employment (NAICS 51-56, 81) 61,014 72,562 19%
Educational Services Employment (NAICS 61) 2,784 4,121 48%
Health Care & Social Assistance Employment (NAICS 62) 25,928 36,402 40%
Accommodation, Food Services, & Entertainment Employment (NAICS
71, 72) 20,063 26,648 33%
Government Employment (NAICS 92) 25,599 25,890 1%
Total Employment 198,058 239,541 21%
Source: Bureau of Labor Statistics Quarterly Census of Employment and Wages, n.d.
As shown in Table 7-1, employment sectors with the highest anticipated growth rates to 2040 include
education; health care; and accommodations, food services, and entertainment. The overall regional
growth rate is expected to rise approximately 21 percent. Further, even moderate growth in each of
0
5000
10000
15000
20000
25000
Ag
ricu
ltu
re
Min
ing
/Ext
ract
ion
Uti
litie
s
Co
nst
ruct
ion
Ma
nu
fact
uri
ng
Wh
ole
sale
Tra
de
Re
tail
Tra
de
Pro
fess
ion
al/
Te
ch S
erv
ice
s
Ma
na
ge
me
nt
Ad
min
/Wa
ste
Se
rvic
es
Ed
uca
tio
na
l Se
rvic
es
He
alt
h C
are
/So
cia
l…
Tra
nsp
ort
ati
on
/Wa
reh
ou
…
Info
rma
tio
n
Fin
an
ce/I
nsu
ran
ce
Re
al
Est
ate
/Re
nta
l/Le
asi
ng
Art
s/R
ecr
ea
tio
n
Acc
om
mo
da
tio
n/F
oo
d…
Oth
er
Se
rvic
es
(exc
ep
t P
A)
Un
cla
ssif
ied
2004 2009 2014

37
these sectors will markedly affect the future of freight movement and demand in the region,
necessitating a need for freight infrastructure and appropriate facilities.
Land Uses
The AMATS FMS study area contains multiple land uses that consequently determine freight movements
and transportation system accessibility. Freight-generating land uses are typically found in parts of the
city zoned as industrial or commercial. Figure 7-2 and Figure 7-3 illustrate land uses in the Anchorage
Bowl and Chugiak-Eagle River, respectively. The far northeast region in the Anchorage Bowl shows
industrial areas located within vacant parcels (Figure 7-2). Other industrial facilities are located adjacent
to the Old Glenn Highway. The Anchorage Regional Landfill encompasses an extensive industrial parcel
in the southern portion of the Chugiak-Eagle River area near JBER (Figure 7-3). This facility is the only
major landfill in the AMATS region and can potentially attract significant truckloads of scrap and waste.
There are currently significant levels of industrial activity along the ARRC rail line as well as adjacent to
TSAIA. Figure 7-4 illustrates the Anchorage Bowl Comprehensive Plan’s Land Use Policy Map2.
In the future, clustering industrial land uses will potentially allow Anchorage to maximize the efficiency
of the freight transportation network. The close proximity of TSAIA, POA, and ARRC facilities to each
other improves freight performance, productivity and helps to facilitate efficient shipping and receiving
times for freight-oriented businesses. Ancillary benefits include lower vehicle miles of travel on
roadways between facilities and distribution centers. Industrial land uses also provide direct
employment as well as indirect employment driven by the economic activity of the jobs.
2 The Municipality of Anchorage is currently developing the Anchorage 2040 Land Use Plan Map. The map is a
supplement to the Anchorage 2020: Anchorage Bowl Comprehensive Plan that helps achieve its goals over the
next 20 years.
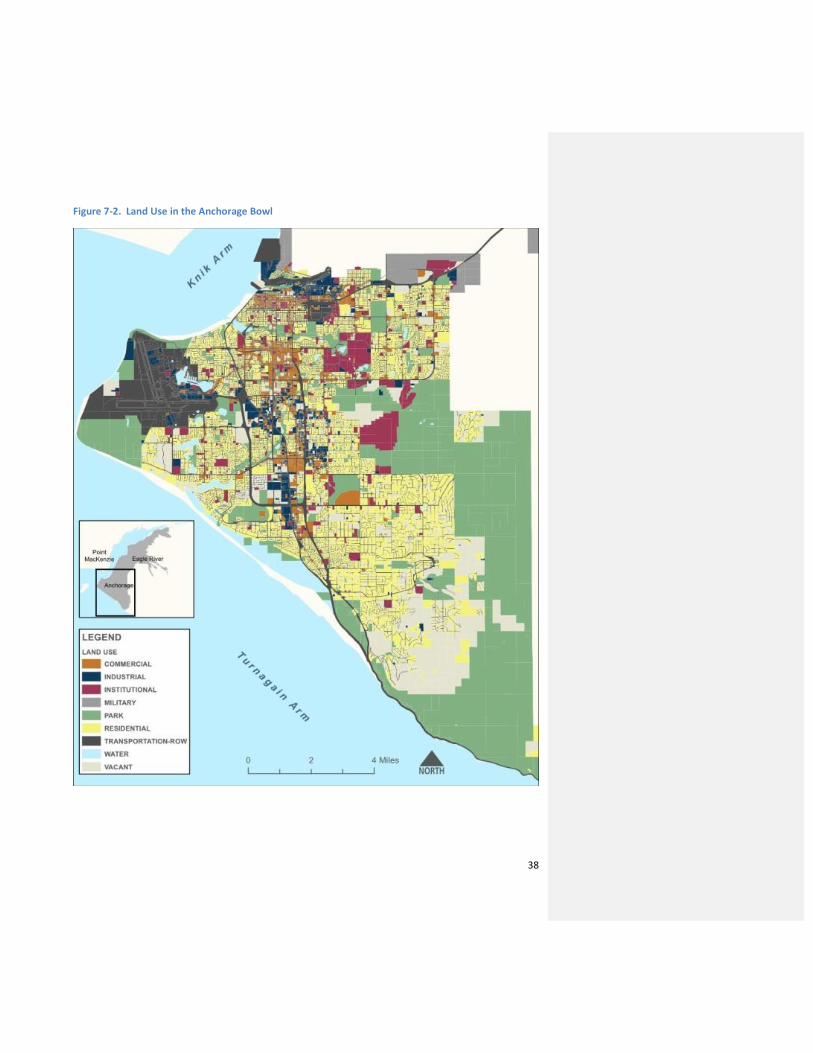
38
Figure 7-2. Land Use in the Anchorage Bowl

39
Figure 7-3. Land Use in Chugiak-Eagle River

40
Figure 7-4. Land Use Policy Map, Anchorage 2020: Anchorage Bowl Comprehensive Plan
Source: MOA, 2001:50
Bottlenecks, Level of Service, and Capacity
Bottlenecks can occur anywhere on the freight system, including congestion choke points along heavily-
traveled corridors, intermodal transfer locations, or last-mile of delivery. Bottlenecks may be the result
of limited transportation capacity on the freight system and may also stem from operational issues
unrelated to infrastructure. Because bottlenecks constrain on-time delivery, any type of bottlenecks

41
present major threats to the efficiency and resiliency of the multimodal freight transportation system.
At the POA, for example, current bottlenecks result from infrastructure-related deficiencies. The
ongoing APMP will address various infrastructure needs and provide solutions to existing problems.
Present and potential future bottleneck and capacity issues are shown below for each transportation
mode in the AMATS region.
Water
Although the POA plays a critical role in providing goods for Anchorage and the rest of the state, it needs
a number of critical future projects to ensure resiliency, reduce bottlenecks, and to advance operations
to current industry standards and efficiencies. Ongoing bottlenecks and capacity issues within the POA
are a result of existing infrastructure-related deficiencies. Severely corroding wharf piles over 40 years
old continue to serve the POA. To address a need for additional storage, the POA recently expanded
their petroleum storage capacity to 3.4 million barrels. Approximately one-third of all refined petroleum
products used in Alaska come through the POA’s valve yard and over the dock (McDowell Group,
2016:9). Since it opened in 1961, the majority of the POA’s marine terminal infrastructure lacks
improvements and updates. This weakness in the freight transportation system can have significant
repercussions should an emergency (i.e., earthquakes, or extreme weather changes) impact these
facilities.
Most of the infrastructure age and maintenance issues that can cause freight delays and bottlenecks will
be addressed through the APMP. This modernization effort will help improve resiliency of port
operations in the event of threatening hazards and will optimize the facilities so that the POA can
accommodate future growth and market needs for the entire state. The APMP will also reinforce safety
and reliability, and ensure cost-effective operations with energy-savings technology. The modernization
effort will support larger container vessels with new ship-to-shore cranes. Improvements will include
increased intermodal access that will also help to prevent delays moving freight into and out of the POA.
Air
TSAIA is undergoing a variety of upgrades to address current bottlenecks and operational issues. These
include utility repairs, improved access to hangers, airfield taxi area widening, airfield pavement
reconstruction, and parking area reconstruction. Improvements made to airfield taxi and runway
pavements are being designed to address dimensional concerns and to meet Aircraft Design group VI
Standards. In terms of intermodal movements at TSAIA, the Air Cargo Related Economic Development
Opportunity Assessment (GLDPartners, 2014) identified limited direct cargo movements between air and
rail modes within Alaska. This report cited air connectivity to other modes as of great concern for future
freight movements in the state and the AMATS region, as increased connectivity would allow for more
efficient freight movement (GLDPartners, 2014).
Highway
During the freight stakeholder interview process conducted in support of the AMATS FMS, stakeholders
raised a number of important issues, including roadway bottlenecks, poor signal timing, challenging
intersection geometry, undersized loading areas, insufficient visibility at intersections due to vegetation
growth or changes in roadway elevation, and narrow travel lanes. Through the stakeholder engagement

42
process, stakeholders identified potential improvements for regional roadway and intersection locations
to potentially increase the efficiency for freight movements, improve safety, and reduce congestion on
the transportation system. These improvement areas/issues are discussed below.
Traffic Signal/Intersection Geometry Issues
• Raspberry Road and Airpark Place;
• C Street and International Airport Road;
• Hoyt Street (Costco access) and Debarr Road;
• Boundary Avenue to Glenn Highway;
• C Street and Ocean Dock Road; and
• King Street and Dimond Boulevard.
Grade-Separated Road/Rail Crossing Issues
• C Street and 68th Street Rail Crossing3.
Port Access Issues
• C Street and POA – 3rd and 4th Avenues.
General Issues
Freight stakeholders also identified the following potential improvement projects for consideration:
• Develop infrastructure that can accommodate a 53-foot-long trailer. Existing road infrastructure
in the AMATS region is constructed and built to accommodate 40-foot-long trucks, and
designing and implementing future roads for larger vehicles should be considered for
prospective projects.
• Work toward resolving existing and potential land use issues such as noise compatibility near
industrial areas.
• Consider designing specifically-used freight corridors and work with freight stakeholders to
determine whether to implement certain street-scape methods that are designed to improve
safety and efficiency of freight movements (e.g., less trees that block truck traffic views, larger
road right-of-ways, and placement of traffic-calming techniques).
• Roadway medians can limit a truck’s ability to turn, especially during the winter months.
• The potential construction of the Knik Arm Crossing would support efficient freight mobility on
the highway system by providing alternative road and bridge access to the Matanuska-Susitna
Borough and potentially reduce truck traffic movements on the Glenn Highway, the only existing
route between the MOA and communities north of Anchorage.
In addition to the list of stakeholder issues identified above, the MOA pinpointed a series of “problem
locations” for freight movement in the Anchorage Bowl in 2009. Of these locations, 19 of the 27
problem locations identified (Figure 7-5) still need to be resolved, including:
3 This crossing causes delays to roadway traffic due the crossing being blocked for several minutes to
accommodate unloading of gravel cars. DOT&PF identified this location as needing capacity improvements for
several years.

43
1. Ocean Dock Road access and crossing from POA to Terminal Road;
2. Ocean Dock Road and Terminal Road intersection;
3. Ocean Dock Road alignment near POA entrance;
4. North C Street and Ocean Dock Road intersection (multiple railroad crossings);
5. Whitney Road (size, turning movements, no shoulders, trail/pedestrian/fishing concerns);
6. School bus storage area (use not ideally suited, some compatibility concerns);
7. 3rd Avenue and Ingra/Gambell improvements (connects to the Ship Creek/POA area);
8. Industrial area circulation and access concerns;
12. Postmark Drive and Point Woronzof Road/West Northern Lights Boulevard intersection (stop
signs, tight intersections, left and right turns);
15. Lake Otis Pkwy: Debarr Road to Northern Lights Boulevard (capacity concerns/4-lane transition
to 3 lanes at Chester Creek);
16. C Street: Tudor Road to 36th Avenue, northbound (capacity concerns);
18. C Street at International Airport Road intersection (turning movements);
21. New Seward Highway at O'Malley Road interchange;
22. King Street at Dimond Boulevard intersection (turning movements);
24. Access off the Glenn Highway from Muldoon Road (capacity development for freight);
25. Tudor Road and Minnesota Drive intersection;
26. International Airport Road extension to the New Seward Highway; and
27. Tikhatnu Commons (Best Buy/Kohl's/Lowes) and Muldoon Post Gate (access improvements).

44
Figure 7-5. AMATS Freight Movement Problem Areas
Note: Problem areas with an X over the number indicate the problem is resolved since 2009.

45
Rail
Rail cargo bottlenecks may be operational or infrastructural. Operational concerns exist at the POA and
other intermodal centers in the region, where cargo movement relies on tight schedules. For example,
the ARRC tracks function as the loading area when freight exits the POA via rail. This loading process
creates delays based on scheduling and loading crew member availability. Additionally, ARRC noted that
the most significant delays to their operations are related to truck traffic through downtown Anchorage
during the commuter rush hour. Currently, delays in truck arrival time affect loading and departure
times and are expected to continue into the future. Railroad project improvements and expansions may
also impede other freight movements. For example, there are a number of at-grade crossings in the
AMATS region that not only affect the safety of the overall transportation system, but also constrain the
efficiency of freight rail operations. Additional bottlenecks include a lack of mainline crossovers north of the
Anchorage yard, the size and location of the existing intermodal facility, the C-street crossing at the south
end of the Anchorage Yard, and East of the Depot.
Pipeline
There is no current or expected future bottleneck, level of service, and/or capacity issue in the pipeline
network.
Safety and Security Issues
Safety and security issues are becoming more prominent in regional freight mobility. Freight involves
large-scale shipments using various modes of the region’s transportation system. Safety is paramount to
ensure that large containers or vessels of costly and/or potentially hazardous materials arrive at their
destinations on time and intact. Security is also a major concern as these shipments cross international
and state borders, each with different regulations and protocols. Safety and security issues are
presented by transportation mode below.
Water
Current security measures at the POA are in full compliance with 2014 Maritime Transportation Security
Act standards. The POA implemented a port-wide security
plan shortly after 9/11 that remains in place today. The
POA security screening facility provides security training
for all staff. Additionally, any person entering the POA
must present a government photo identification card to
enter. Staff members are also required to have a
“proximity access card” and “Transportation Worker
Identification Card (TWIC).” These access precautions
serve to protect the POA on a daily basis.
In addition, the POA contracted with a local corporation
to perform all security services, which averages 20 armed officers. The Department of Homeland
Security identified the POA as a regionally significant facility, and designated it as a second tier port
facility (POA, 2016). This designation enhances the POA’s chances of success when applying for federal
security grants.

46
Air
TSAIA maintains compliance with Transportation Security Administration (TSA) standards and includes a
U.S. Customs security on site. TSAIA also keeps Aircraft Rescue and Fire Fighting (ARFF) services on site
per FAA requirements. In the recent past, no major facility or security related incidents are recorded at
the TSAIA. Also, TSAIA recently contracted with an energy firm to implement an Electrical Preventative
Maintenance (EPM) and National Fire Protection Association (NFPA) 70E Compliance Program. This
program includes a review of TSAIA’s electrical distribution systems, incident energy analysis, arc flash
hazard assessments, schedule maintenance, airport staff training, and energy-related incidents to
enhance safety measures at the airport (Lantz, 2015). In the event of a major emergency, JBER’s air
facilities offer an alternative to TSAIA. For example, during the 1964 earthquake, Elmendorf Airfield
continued to move freight while TSAIA could not move cargo.
Highway
DOT&PF conducts inspections on commercial vehicles for safety, size, and weight. These inspections
occur at weigh stations, selected roadside locations, terminals, and when vehicles are stopped. To keep
records of these inspections, the commercial vehicle enforcement officers utilize Aspen inspection
reporting software. In addition to inspections, DOT&PF supports a cooperative industry and public
education awareness program to ensure that both drivers and other road users understand risks and
responsibilities associated with commercial vehicle navigation (DOT&PF, 2013). In terms of vehicle
security, systems and technology vary by carrier.
Furthermore, the Fatality Analysis Reporting System (FARS) summarizes motor vehicle crashes resulting
in fatal injury data by year. Additionally, the National Highway Traffic Safety Administration (NHTSA)’s
Alaska Crash Map shows the geographic locations of these incidents in the region with a user-friendly
online interface. This online map is used as the basis for obtaining and linking case numbers to the
vehicle type information for this analysis. In 2012 and 2013 respectively, there is one fatality by each
year involving trucks. Table 7-2 shows the crash history on the MOA’s transportation system from 2009
to 2014 for all commercial vehicles. Source: DOT&PF, 2016.
Figure 7-6 shows all of the commercial vehicle crashes on one map to illustrate consistent areas of crash
incidents. Non-federally reportable crashes are the least impactful and generally occur on lower speed
roadways. Crashes that result in towing, injuries, or fatalities generally occur on higher speed facilities.
Crashes are more prevalent in denser areas. Research indicates car drivers are at-fault for approximately
75% of the fatal car-truck crashes. As crash severity decreases, the fault is more equally split between
car and truck drivers (ATA, 2013).
Commented [CL1]: ADD TO REFERENCES
http://www.trucking.org/ATA%20Docs/News%20and%20Informati
on/Reports%20Trends%20and%20Statistics/02%2012%2013%20--
%20FINAL%202013%20Car-Truck%20Fault%20Paper.pdf

47
Table 7-2. DOT&PF Reportable and Non-Reportable Commercial Vehicle Crash Data Summaries for
the MOA, 2009-2014
Crash Type 2009 2010 2011 2012 2013 2014
Non-federally
Reported
119 111 126 37 23 77
Resulted in Tow 14 18 9 7 26 25
Resulting in Injury 8 13 10 4 5 6
Resulting in Fatality 0 0 0 1 1 2
Total 141 142 145 49 55 110
Source: DOT&PF, 2016.
Figure 7-6 Commercial Vehicle Crashes, 2009-2014
Source: DOT&PF, 2016.

48
Rail
The Rail Safety Improvement Act of 2008 improves railroad safety. Provisions of the Act include the
implementation of positive train control, authorization of appropriations for safety grants to be
administered by the US Department of Transportation, and amending the hours of service for
employees.
ARRC reports that their annual movement of materials such as petroleum, gravel, and coal via railcar
removes over 300,000 dump and tank trucks from the road each year in Alaska, with an estimated
reduction of vehicle miles traveled of 34.7 million miles. The movement of these goods from truck to rail
helps to provide a more secure environment on the region’s fixed rail guideway.
The 2035 AMATS MTP identified crossings of concern due to higher traffic volumes in the following
locations:
• C Street;
• Arctic Boulevard/Dowling Road4; and
• International Airport Road/Jewel Lake Road.
To increase awareness of the importance of right-of-way for rail-side protection, ARRC used six-foot-tall
blue posts in 200-foot increments to delineate the right-of-way boundary through Anchorage. ARRC
installed the markers in 2011, and they run from Potter north to Elmendorf. ARRC is considering
expanding the area these markers cover, noting that right-of-way is a common problem where property
owners build too close to the track.
Pipeline
Pipelines require extensive maintenance and
security due to the volatile nature of the contents
carried. The Pipeline and Hazardous Materials
Safety Administration (PHMSA) regulates national
pipeline safety and security. PHMSA supports the
enforcement of the Pipeline Safety Act of 2011 and
the HAZMAT Safety Improvement Act of 2012.
PHMSA reports no significant pipeline incidents in
the past decade within the Anchorage region
(PHSMA, 2016). No extraordinary safety or security
concerns related to pipeline infrastructure exist in
Anchorage.
4 The Arctic Boulevard/Dowling Road crossing was improved as part of the West Dowling Road Extension project
and should no longer be considered an at-grade crossing of concern.
49
Autonomous Vehicles
New and emerging technology related to autonomous vehicles can potentially improve safety. Technology
allows vehicles to identify situations such as approaching a slower moving vehicle, land departures, etc. and
react faster than a human driver can. Application of this technology may reduce severe accidents. However, it
is estimated to cost around $25,000 per truck to outfit it with this type of technology. The actual costs vary
depending on the technology installed. As use of this technology becomes more wide-spread, it is likely that
the costs would then decrease.
The use of autonomous vehicles could have many freight mobility benefits (ATRI, 2016). They could help
address driver shortage issues. Using autonomous vehicles for long distance trips would allow the industry to
keep drivers for the more complex local pick up and deliveries. Autonomous vehicles may also reduce the
cost of freight; while a truck sits idle during mandatory rest periods, autonomous vehicles could continue to
operate reducing the time it takes to transport goods. This could also have land use impacts; if trucks are able
to operate more hours, then the need for truck parking is changed. Other potential benefits include reduced
congestion and fuel consumption as vehicles operate more efficiently than human drivers, and less crashes.
E-Commerce
The growth of e-commerce significantly impacts freight mobility. E-commerce dramatically changed the
way people shop and how retailers transport their goods to their customers. In general, distribution
centers have moved closer to their customers which allow goods to get to customers quicker and
reduces trip length. Due to Anchorage’s location and relatively small customer base, the number of
distribution centers is likely to remain the same or have little increase. However, the amount of e-
commerce related freight is rising and to expected to continue. Due to TSAIA’s strategic location, it is
anticipated to act as the primary hub for freight moving by air between North America and Asia.
The bigger impact is likely to be associated with the number of parcel trucks on road to transport
packages to the consumer. As e-commerce expands, people’s shopping patterns will continue to change
and adapt. People will shop less in traditional brick and mortar stores and do more shopping online,
relying on companies like UPS, FedEx, and the United States Postal Service to deliver their goods. As the
number of packages increase, companies need to increase the number of delivery trucks to handle the
demand. E-commerce is also altering freight mobility patterns. Historically, freight is delivered to
traditional stores and the consumer is responsible for transporting goods between the store and their
home or business. With less shopping occurring in stores, the amount of freight mobility to traditional
retail may decline. With e-commerce, FedEx, UPS, etc., now see more activity in residential areas instead
of the traditional commercial areas such as downtown.
Commented [CL2]: Identifying Autonomous Vehicle
Technology
Impacts on the Trucking Industry
November 2016
ATRI
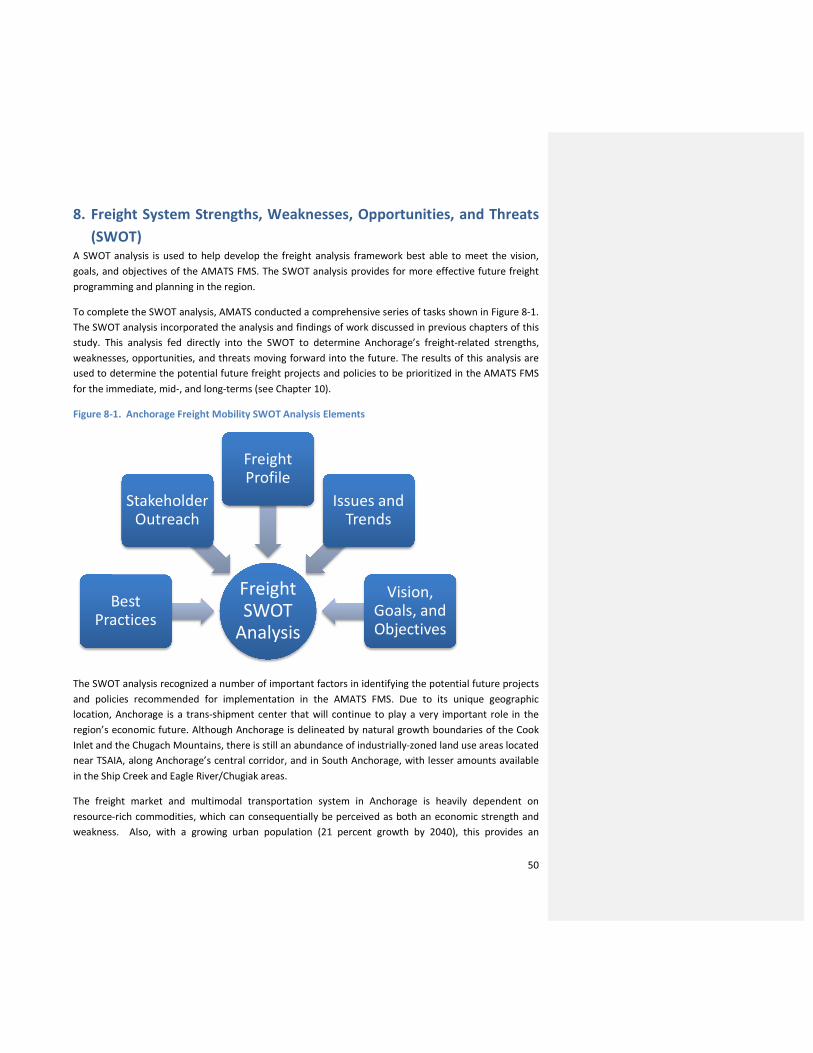
50
8. Freight System Strengths, Weaknesses, Opportunities, and Threats
(SWOT) A SWOT analysis is used to help develop the freight analysis framework best able to meet the vision,
goals, and objectives of the AMATS FMS. The SWOT analysis provides for more effective future freight
programming and planning in the region.
To complete the SWOT analysis, AMATS conducted a comprehensive series of tasks shown in Figure 8-1.
The SWOT analysis incorporated the analysis and findings of work discussed in previous chapters of this
study. This analysis fed directly into the SWOT to determine Anchorage’s freight-related strengths,
weaknesses, opportunities, and threats moving forward into the future. The results of this analysis are
used to determine the potential future freight projects and policies to be prioritized in the AMATS FMS
for the immediate, mid-, and long-terms (see Chapter 10).
Figure 8-1. Anchorage Freight Mobility SWOT Analysis Elements
The SWOT analysis recognized a number of important factors in identifying the potential future projects
and policies recommended for implementation in the AMATS FMS. Due to its unique geographic
location, Anchorage is a trans-shipment center that will continue to play a very important role in the
region’s economic future. Although Anchorage is delineated by natural growth boundaries of the Cook
Inlet and the Chugach Mountains, there is still an abundance of industrially-zoned land use areas located
near TSAIA, along Anchorage’s central corridor, and in South Anchorage, with lesser amounts available
in the Ship Creek and Eagle River/Chugiak areas.
The freight market and multimodal transportation system in Anchorage is heavily dependent on
resource-rich commodities, which can consequentially be perceived as both an economic strength and
weakness. Also, with a growing urban population (21 percent growth by 2040), this provides an
Freight SWOT
Analysis
Best Practices
Stakeholder Outreach
Freight Profile
Issues and Trends
Vision, Goals, and Objectives

51
opportunity to define freight improvement strategies. As more employment and industry growth results
from the expected population increases, this, in turn, drives up the demand for various goods in the
local economy and thereby creates more freight activity.
More importantly, a potential threat to the AMATS multimodal freight network is the lack of multiple
access points and redundancies for specific modes in the region. For example, the POA is suffering from
a number of capacity issues and is in the process of “modernizing” its facilities (APMP). Having
emergency or backup operations for delivering goods beyond one route will be important into the
future, especially when Anchorage and the rest of the state remain remote from other immediate
markets. Regular deliveries for fuel, food, and other consumer goods could potentially deteriorate if a
major natural disaster occurs in the region.
The key themes and issues identified in the SWOT analysis are highlighted in Table 8-1.
Table 8-1. AMATS Region’s Key Freight-Related Strengths, Weaknesses, Opportunities, and Threats
Strengths Weaknesses
• Energy-resource driven economy
• Workable intermodal freight network between the
POA, TSAIA and ARRC
• Freight network provided for local, regional, state,
and international level for the trans-shipment of
goods
• Actively-involved FAC
• Lack of efficient freight-connecting routes between
the Port and TSAIA
• Poor connections between Glenn Highway and
Seward Highway which causes bottlenecks
• Volatility and changing trends in energy markets
• Natural growth boundaries for Anchorage Bowl
Opportunities Threats
• Freight stakeholder involvement in the long-range
freight planning process
• Increased role of TSAIA in international trans-
shipment markets
• Outreach and education to increase public awareness
of transportation and industrial-related jobs and
businesses to the economy
• Growing urban population with diverse need for
commodities
• POA Modernization efforts can increase freight intake
• Abundance of industrially-zone land uses
• Oil and gas boom/bust economy
• Land use conflicts between industrial right-of-way
and neighboring uses.
• Encroachment of ARRC ROW
• Lack of redundancy in intermodal freight networks
which can be threatened by potential natural
hazards (i.e., POA and TSAIA, singular road access
in and out of Anchorage)
• Lack of funding to complete APMP before either an
actual disaster event occurs, or age drives
infrastructure out of service.
52
9. Performance Management Framework and Measures Transportation planning, policy, and programming decision-making processes involve several steps, one
of which is defining performance analysis frameworks to assess future planned changes or activities of
any given system. This analysis, often referred to as Performance-based planning or Performance
measurement, will become an integral part of state and metropolitan transportation system planning
over the past two decades or more. For many years, AMATS actively engaged these types of processes in
support of the MTP and the recently completed CMP and Status of the System Report. AMATS’ previous
efforts to design and apply performance measures and analysis processes further informed the
framework developed for the FMS, with the AMATS FMS Vision, Goals, and Objectives used as the
framework’s foundation.
In support of the FMS, AMATS developed this framework to monitor the performance of FMS freight-
related goals and objectives that also closely align with the Interim 2035 MTP’s freight-related goals and
objectives. The framework also meets federal guidance set forth in MAP-21 and the FAST Act.
Additionally, a key feature of MAP-21 is the establishment of performance and outcome-based
programs, with the objective being for regions to invest in projects that collectively make progress
toward national goals. The FAST Act, established in December 2015, suggests that fundamental sections
pertaining to performance measurement have not materially changed from MAP-21. Among other
system elements, the final performance measure Notice of Proposed Rulemaking (NPRM; published
April 22, 2016) also recommends a series of specific measures for the performance of freight
movements on the Interstate system.
Moreover, the establishment of this process will help determine whether freight projects and policies
developed as a result of the AMATS FMS will be successful once implemented. AMATS could then
quantify the success of any given freight project on the overall transportation system. Measures built
into the framework are intended to monitor and identify improved transportation system performance
resulting from implemented projects and document the level of accomplishment to the goals and
objectives established for the FMS. This process permits and creates accountability for projects and aids
in understanding and identifying the necessary components of a successful project. By developing a
proper framework and measures, the AMATS FAC and other AMATS committees and groups will be able
to detect whether freight policies or programs need additional modifications and improvements once
they are implemented and operating. Continuous follow-up by AMATS and the FAC will be important to
this program’s implementation success.
Performance Management Framework
The framework assesses performance and implementation of the recommendations of the FMS to
reflect and take into consideration the factors shown in Figure 9-1, each of which is presented below.
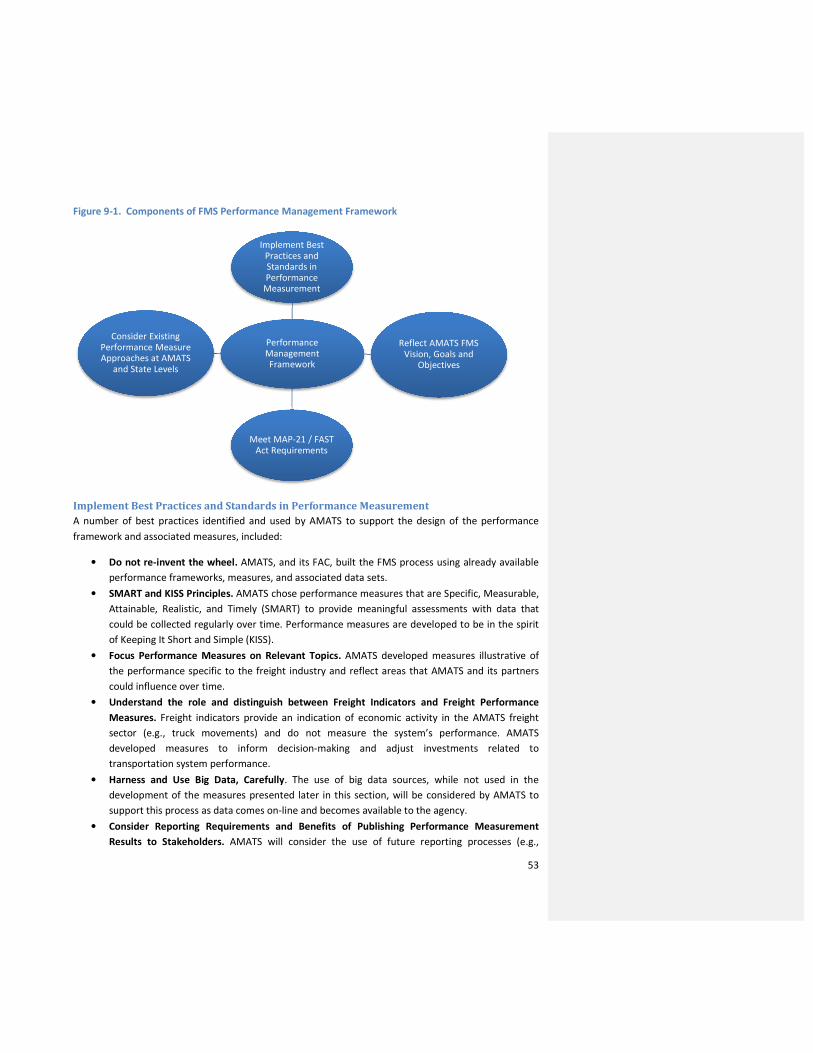
53
Figure 9-1. Components of FMS Performance Management Framework
Implement Best Practices and Standards in Performance Measurement
A number of best practices identified and used by AMATS to support the design of the performance
framework and associated measures, included:
• Do not re-invent the wheel. AMATS, and its FAC, built the FMS process using already available
performance frameworks, measures, and associated data sets.
• SMART and KISS Principles. AMATS chose performance measures that are Specific, Measurable,
Attainable, Realistic, and Timely (SMART) to provide meaningful assessments with data that
could be collected regularly over time. Performance measures are developed to be in the spirit
of Keeping It Short and Simple (KISS).
• Focus Performance Measures on Relevant Topics. AMATS developed measures illustrative of
the performance specific to the freight industry and reflect areas that AMATS and its partners
could influence over time.
• Understand the role and distinguish between Freight Indicators and Freight Performance
Measures. Freight indicators provide an indication of economic activity in the AMATS freight
sector (e.g., truck movements) and do not measure the system’s performance. AMATS
developed measures to inform decision-making and adjust investments related to
transportation system performance.
• Harness and Use Big Data, Carefully. The use of big data sources, while not used in the
development of the measures presented later in this section, will be considered by AMATS to
support this process as data comes on-line and becomes available to the agency.
• Consider Reporting Requirements and Benefits of Publishing Performance Measurement
Results to Stakeholders. AMATS will consider the use of future reporting processes (e.g.,
Performance Management Framework
Meet MAP-21 / FAST Act Requirements
Reflect AMATS FMS Vision, Goals and
Objectives
Consider Existing Performance Measure Approaches at AMATS
and State Levels
Implement Best Practices and Standards in Performance
Measurement
54
Dashboards) as they have with the Congestion Management Plan and other plans to present
FMS performance measures for display to agency decision-makers and stakeholders.
Reflect AMATS FMS Vision, Goals and, Objectives
The vision, goals, and objectives for the AMATS FMS are the starting point for developing the freight-
specific performance measures and freight elements of the updated MTP.
Consider Existing Performance Measure Approaches at AMATS and State Levels
The AMATS FMS performance framework takes into consideration key AMATS and statewide processes
already in-place or underway. These included relevant measures established in the AMATS 2035 MTP,
the Anchorage CMP, and DOT&PF’s Let’s Keep Alaska Moving Plan 2036 (anticipated for release later in
2016).
Meet MAP-21 / FAST Act Requirements
The AMATS FMS performance framework considered the performance measurement requirements of
MAP-21 and the FAST Act, including relevant measures identified for the Highway Safety Improvement
Program, National Highway Performance Program (e.g., for pavement and bridge), System Performance
Analysis, National Freight Movements, and Congestion Mitigation and Air Quality Program. For example,
these measures include safety, injury/fatality, and truck reliability index.
Performance Measures
This section presents the recommended set of performance measures, data, and approaches for
measuring, monitoring, and reporting performance of freight-focused activities for the AMATS FMS. The
measures described in Table 9-1 reflect the goals and objectives defined for the FMS, MAP-21,
Anchorage CMP, and DOT&PF approaches. The measures can also be practically measured, updated,
and tracked on an on-going basis. Equally, the measures can be designed to provide insight about the
performance of the freight system specifically, as opposed to the transportation system generally. Brief
descriptions of each measure are shown below.
Safety Measure
Truck safety is a common concern because of the size, weight, and reduced handling characteristics of
trucks compared to automobiles and other vehicles on the road. This safety measure links with the FMS
Objective: minimize conflicts between freight and passenger vehicles and non-motorized travelers.
Truck Crash Injury/Fatality Index: Fatality and Serious Injury Crash Rate per 100 Million
Vehicle Miles Traveled (VMT)
The recommended performance measures calculates the number of vehicle crashes (fatalities, injuries)
involving trucks per 100 million vehicle VMT.5
5 This performance measure uses VMT for all vehicles types in its calculation. The project team is not aware of a
VMT measurement available exclusively for commercial VMT, which would be a preferable choice.
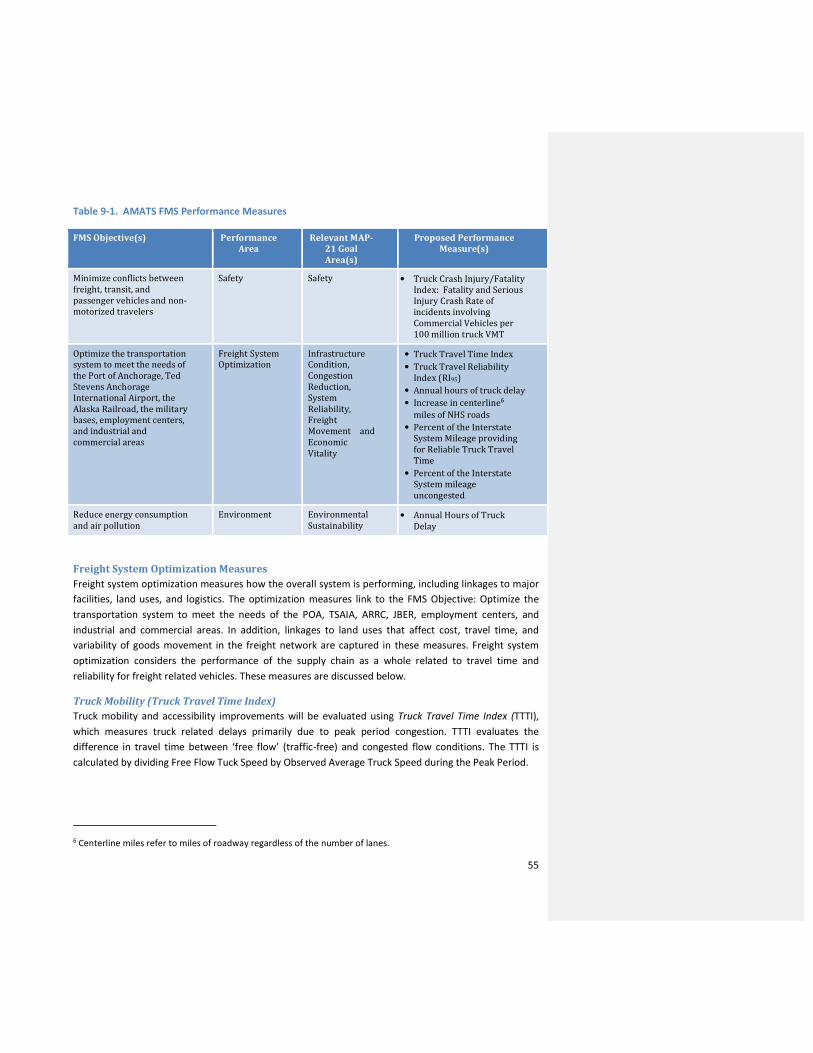
55
Table 9-1. AMATS FMS Performance Measures
FMS Objective(s) Performance
Area
Relevant MAP-
21 Goal
Area(s)
Proposed Performance
Measure(s)
Minimize conflicts between
freight, transit, and
passenger vehicles and non-
motorized travelers
Safety Safety • Truck Crash Injury/Fatality
Index: Fatality and Serious
Injury Crash Rate of
incidents involving
Commercial Vehicles per
100 million truck VMT
Optimize the transportation
system to meet the needs of
the Port of Anchorage, Ted
Stevens Anchorage
International Airport, the
Alaska Railroad, the military
bases, employment centers,
and industrial and
commercial areas
Freight System
Optimization
Infrastructure
Condition,
Congestion
Reduction,
System
Reliability,
Freight
Movement and
Economic
Vitality
• Truck Travel Time Index
• Truck Travel Reliability
Index (RI95)
• Annual hours of truck delay
• Increase in centerline6
miles of NHS roads
• Percent of the Interstate
System Mileage providing
for Reliable Truck Travel
Time
• Percent of the Interstate
System mileage
uncongested
Reduce energy consumption
and air pollution
Environment Environmental
Sustainability • Annual Hours of Truck
Delay
Freight System Optimization Measures
Freight system optimization measures how the overall system is performing, including linkages to major
facilities, land uses, and logistics. The optimization measures link to the FMS Objective: Optimize the
transportation system to meet the needs of the POA, TSAIA, ARRC, JBER, employment centers, and
industrial and commercial areas. In addition, linkages to land uses that affect cost, travel time, and
variability of goods movement in the freight network are captured in these measures. Freight system
optimization considers the performance of the supply chain as a whole related to travel time and
reliability for freight related vehicles. These measures are discussed below.
Truck Mobility (Truck Travel Time Index)
Truck mobility and accessibility improvements will be evaluated using Truck Travel Time Index (TTTI),
which measures truck related delays primarily due to peak period congestion. TTTI evaluates the
difference in travel time between ‘free flow’ (traffic-free) and congested flow conditions. The TTTI is
calculated by dividing Free Flow Tuck Speed by Observed Average Truck Speed during the Peak Period.
6 Centerline miles refer to miles of roadway regardless of the number of lanes.
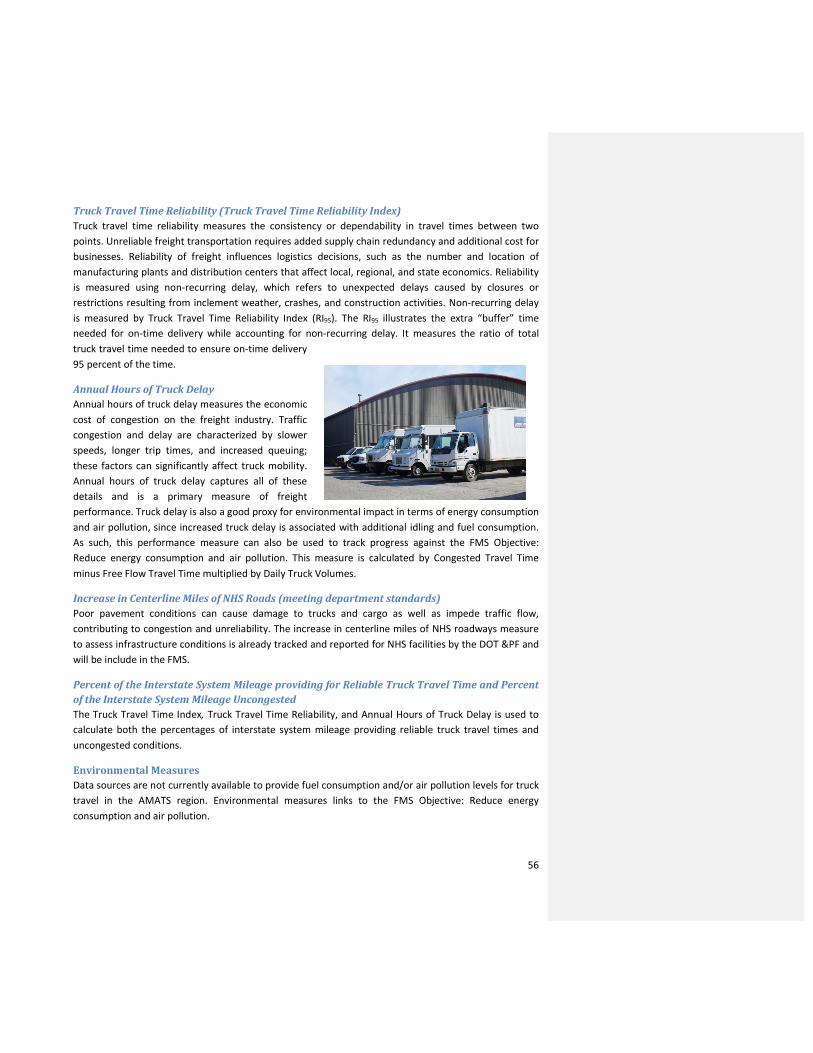
56
Truck Travel Time Reliability (Truck Travel Time Reliability Index)
Truck travel time reliability measures the consistency or dependability in travel times between two
points. Unreliable freight transportation requires added supply chain redundancy and additional cost for
businesses. Reliability of freight influences logistics decisions, such as the number and location of
manufacturing plants and distribution centers that affect local, regional, and state economics. Reliability
is measured using non-recurring delay, which refers to unexpected delays caused by closures or
restrictions resulting from inclement weather, crashes, and construction activities. Non-recurring delay
is measured by Truck Travel Time Reliability Index (RI95). The RI95 illustrates the extra “buffer” time
needed for on-time delivery while accounting for non-recurring delay. It measures the ratio of total
truck travel time needed to ensure on-time delivery
95 percent of the time.
Annual Hours of Truck Delay
Annual hours of truck delay measures the economic
cost of congestion on the freight industry. Traffic
congestion and delay are characterized by slower
speeds, longer trip times, and increased queuing;
these factors can significantly affect truck mobility.
Annual hours of truck delay captures all of these
details and is a primary measure of freight
performance. Truck delay is also a good proxy for environmental impact in terms of energy consumption
and air pollution, since increased truck delay is associated with additional idling and fuel consumption.
As such, this performance measure can also be used to track progress against the FMS Objective:
Reduce energy consumption and air pollution. This measure is calculated by Congested Travel Time
minus Free Flow Travel Time multiplied by Daily Truck Volumes.
Increase in Centerline Miles of NHS Roads (meeting department standards)
Poor pavement conditions can cause damage to trucks and cargo as well as impede traffic flow,
contributing to congestion and unreliability. The increase in centerline miles of NHS roadways measure
to assess infrastructure conditions is already tracked and reported for NHS facilities by the DOT &PF and
will be include in the FMS.
Percent of the Interstate System Mileage providing for Reliable Truck Travel Time and Percent
of the Interstate System Mileage Uncongested
The Truck Travel Time Index, Truck Travel Time Reliability, and Annual Hours of Truck Delay is used to
calculate both the percentages of interstate system mileage providing reliable truck travel times and
uncongested conditions.
Environmental Measures
Data sources are not currently available to provide fuel consumption and/or air pollution levels for truck
travel in the AMATS region. Environmental measures links to the FMS Objective: Reduce energy
consumption and air pollution.

57
Annual Hours of Truck Delay
Due to data availability issues, it is recommended that the Annual Hours of Truck Delay be used as a
proxy for energy consumption and air pollution. As noted above, truck delays result in higher fuel
consumption and associated pollution as a result of idling and unnecessary time on the road, all else
being equal.
10. Recommendations This section presents the freight infrastructure projects and policies recommended for implementation
in the AMATS FMS. Based on the analysis and primary inputs prepared as part of the FMS, freight
projects and policies are identified, screened and assessed, and recommended for future
implementation. This analysis is not fiscally constrained. Rather, it encourages the identification of the
freight infrastructure projects and policies that provide the AMATS region with the highest level of
increased transportation system performance regardless of cost. This process is also intended to
identify the freight projects and policies for screening in the upcoming AMATS MTP, which will be
developed using financially constrained methods. It relied on the FMS’ literature review of plans,
studies, and databases; assessment of local and regional freight issues and trends; and stakeholder
interviews; and development of the overall freight profile for the AMATS region, including vision, goals,
and objectives; freight system inventories; and SWOT analysis.
With AMATS and the FAC working
together to create a collaborative
screening process (see Figure 10-1),
the future potential project and policy
recommendations that support the
FMS became apparent through this
selection effort. Recommendations for
immediate, mid-term, and long-term
projects and policies are determined
based on the goals developed, SWOT
analysis, and other freight trends and
technical studies.
Project and Policy Screening Criteria and Scoring
Various sources provided the freight project and policy descriptions during the AMATS FMS planning
process, which included identified projects and policies contained in the AMATS 2035 MTP, AMATS TIP,
other regional and local plans, and new freight projects and policies recognized by the FAC and
stakeholders. AMATS and the FAC developed the following screening criteria to assess each project and
policy implementation potential by immediate (0-10 years), mid-term (11- 15 years), and long-term (16+
years) timing/need.
Figure 10-1. Screening Process

58
• Project Readiness – Evaluates the existing project status and how close it is to being
implemented. Lower scores are awarded to projects that have yet to be evaluated (e.g.,
feasibility/planning, environmental, program phases) while higher scores are awarded to
projects that are farther along in the environmental clearance and project programming
processes.
• Timing of Need – Considers the timing for project/policy completion, depending on whether it is
a near, medium or long-term need. Timing would be assessed if a project is needed to meet
existing or future needs. Lower scores are awarded to projects or policies that will be completed
to meet medium or long-term needs (11-20 years), while higher scores are awarded to projects
that will be completed to meet more immediate needs (within the next 2 to 10 years).
• New or Existing Project/Revision of Existing or New Policy – Measures if the project or policy is
new, documented in other plans, or is a refinement of an existing policy or project under
development. Lower scores are awarded to projects or policies that are new ideas or concepts
that have yet to be fully evaluated, while higher scores are awarded to projects or policies that
are actively being implemented.
• Regional Significance – Identifies geographic areas impacted by the project or policy. Lower
scores reflect projects or policies that are narrow or localized with limited regional impact, while
higher scores are awarded to projects or policies that provide significant regional impact in
Southcentral Alaska.
• Number of Freight Modes – Identifies the number of freight modes that would be benefitted by
the project or policy. Lower scores are awarded to projects or policies that address the mobility
needs of one (or less) freight mode, while higher scores are awarded to projects or policies that
address the mobility needs of three or more freight modes.
• Safety – Measures if the project or policy is needed to address a documented safety concern.
Lower scores represent projects or policies that are not being implemented to address
documented safety needs, while higher score represent projects or policies that are being
developed to address documented safety needs.
• Residential Neighborhood Impact – Evaluates the potential of a project or policy to create
unwanted neighborhood impacts such as increased noise or traffic levels, etc. Lower scores are
awarded to projects or policies that do not reduce or address neighborhood impacts, while the
higher scores represent projects or policies that do not cause any impacts or reduce existing
impacts.
• Goal 1 - Evaluates if the project/policy is consistent with Goal 1: Provide a freight transportation
system that moves goods safely and securely throughout the community; improves access;
provides mobility; and supports a thriving, sustainable, broad-based economy.
• Goal 2 - Evaluates if the project/policy is consistent with Goal 2: Develop an efficient freight
transportation network that considers the cost of building, operating, and maintaining the
system; the equity of all users; public health impacts; community values; and social justice.
• Goal 3 - Evaluates if the project/policy is consistent with Goal 3: Incorporate technology and
best management practices that allow for improved freight movement in the Anchorage region.

59
• Goal 4 - Evaluates if the project/policy is consistent with Goal 4:- Integrate freight needs and
financing into transportation project prioritization processes for the region.
• Goal 5 - Evaluates if the project/policy is consistent with Goal 5: Develop a multimodal freight
system that includes effective public and stakeholder partnerships to leverage opportunities and
resources.
Table 10-1 shows the project and policy screening criteria and scoring process used in the AMATS FMS.
The logic used to assess both freight projects and policies contained in the screening process included:
• ○ =1 pts;
• ◒ = 3 pts; and
• ● = 5 pts.
The lowest possible score for projects is 12 and the highest possible score is 60, while policies scored
between 11 (lowest) and 55 (highest) because the Project Readiness criterion is not evaluated.
Table 10-1. AMATS FMS Project and Policy Screening Criteria and Values
Criteria Rational Potential Benefit
Low Moderate High
Project Readiness
(Project only)
Existing status of
project ○
(No work started)
◒
(Some work
completed)
●
(Substantial work
completed)
Timing of Need
(project needs to
be completed in
this time frame)
When project is
needed to
improve the
freight mobility
system
○
(Long-term need
(16+ years))
◒
(Medium-term need
[11-15 years])
●
(Immediate-term need
[within 0-10 years])
New or Existing
Project/Revision of
Existing or New
Policy
Ease of
integration ○
(New idea/concept)
◒
(In existing plans or
revision of existing
policy)
●
(Implementation of
project or policy
actively being worked
on)
Regional
Significance
Geographic area
impacted ○
(Localized
improvement such
as an intersection
improvement)
◒
(AMATS area)
●
(Southcentral Alaska
and greater)

60
Criteria Rational Potential Benefit
Low Moderate High
Number of Freight
Modes (road, rail,
aviation, port,
pipeline)
Number of
modes benefited ○
(1 mode)
◒
(2 modes)
●
(3 or more modes)
Safety Potential to
address
documented
safety need
○
(No safety need
Identified)
◒
(Safety need
documented, but
project does not
address it)
●
(Project addresses
documented safety
need)
Residential
Neighborhood
Impact
Potential to
create unwanted
neighborhood
impact (noise,
traffic, visual,
etc.)
○
(Adversely affects
neighborhood[s])
◒
(Includes some
adverse impacts to
neighborhood[s])
●
(No/reduced adverse
impacts to
neighborhood[s])
Goal 1 Consistency with
Goal 1 ○
(Low consistency)
◒
(Moderate
consistency)
●
(High consistency)
Goal 2 Consistency with
Goal 2 ○
(Low consistency)
◒
(Moderate
consistency)
●
(High consistency)
Goal 3 Consistency with
Goal 3 ○
(Low consistency)
◒
(Moderate
consistency)
●
(High consistency)
Goal 4 Consistency with
Goal 4 ○
(Low consistency)
◒
(Moderate
consistency)
●
(High consistency)
Goal 5 Consistency with
Goal 5 ○
(Low consistency)
◒
(Moderate
consistency)
●
(High consistency)

61
Recommendations for Immediate, Mid-Term, and Long-Term Implementation
Freight Projects
Applying the criteria and scoring process described above, freight projects have assigned scores from
high to low based on implementation needs to support the FMS and enhance the AMATS freight
transportation network. The distinction between high, medium, and low priority projects for
implementation is based on the total scores computed for each project after screening. In this
analysis, the total points possible for each project ranged from 12 to 60, with scores of 34 or less
considered low priority projects, 35 to 38 considered medium priority projects, and 39 and above
considered high priority projects. Using these scores by implementation priority, the freight projects
are allocated by immediate (0-10 years), mid-term (11-15 years), and long-term (16+ years)
implementation schedules based on the “Timing of Need” criteria in the screening process. Table 10-2,

62
Table 10-3, and Table 10-4 present the Immediate, Mid-Term, and Long-Term Freight Projects for
Implementation by low, medium, and high priority.
Table 10-2. Immediate (0-10 Years) Freight Projects Identified for Implementation
Potential Project Description 2035 MTP
Project
Number1
Level of
Priority
Project
Status
Immediate Freight Projects with High Implementation Needs
Anchorage Port
Modernization
Project
Complete the APMP
(http://www.portofanc.com/modernization-
project/)
High Phase I -
Permitting
Improved TSAIA
Access – North
Improve freight access from TSAIA’s North
Airpark to Minnesota Drive.
High
Improved TSAIA
Access – South
Improve freight access from TSAIA’s South
Airpark to Minnesota Drive; includes
intersection improvements at Raspberry Drive
and Sand Lake Road.
High
Seward Highway -
O’Malley Road to
Dimond Boulevard
Reconstruct and widen from 4 to 6 lanes;
includes reconstruction of Dimond Boulevard
interchange.
107 High Design
Seward Highway
Improvements
(Midtown
Congestion Relief-
Seward Highway to
Glenn Highway
Connection Phase II)
Reconstruct the Seward Highway as a
depressed freeway; includes interchanges at
Northern Lights and Benson Boulevards and
the reconstruction of the Old Seward Highway
from 33rd to 20th Avenue.
114 High
Old Glenn Highway
(Artillery Road)
Northbound Off-
ramp to Eagle River
Road (Eagle River)
Eliminates existing weaving section between
the existing Old Glenn Highway (Artillery Road)
interchange northbound ramp terminal and
the Eagle River Road intersection on the Old
Glenn Highway; provides additional capacity to
a heavy demand movement.
127 High
Improved Access
from the POA
Additional/improved connections to the Ship
Creek and POA area.
High
Tudor Road/
Minnesota Drive
Intersection
Intersection reconstruction to address
pavement condition and rutting.
High
Muldoon Road
Interchange
Reconstruct interchange to include ramps and
Muldoon Road bridge and improve access to
Tikahtnu Commons.
106 High Under
Construction

63
Potential Project Description 2035 MTP
Project
Number1
Level of
Priority
Project
Status
Whitney Road
Upgrade
Upgrade to address size, turning movements,
lack of shoulders, and trail and pedestrian
concerns. Address safety concerns associated
with the Whitney and Post road intersection
(intersection geometry and conflicts with
pedestrians).
Low
Immediate Freight Projects with Medium Implementation Needs
C Street at
International Airport
Road Intersection
Intersection improvements to address turning
movement concerns.
Med
King Street at
Dimond Boulevard
Intersection
Intersection improvements to address turning
movement concerns. Consider developing
alternative access to reduce the use of this
intersection by freight traffic.
Med
Spenard Road/
Minnesota Drive
Intersection
Intersection improvements to address turning
movement concerns.
Postmark Drive and
Point Woronzof/
West Northern
Lights Boulevard
Intersection
Improvements to address stop signs, tight
intersections, and left and right turns.
Med
Signal Timing
Modifications
Adjust signal timing on primary freight
corridors to better allow the free flow of
freight traffic; consider adjusting timing on a
daily basis or just on POA days (Sunday and
Tuesday).
Med
Trailer on Flat Car
(TOFC) Yard
Develop a TOFC at the POA. Med
Northern Lights
Boulevard –
Postmark Drive to
Nathaniel Court
Rehabilitate pavement and add shoulders
where needed; wetland impacts are
anticipated.
119 Med
3rd Avenue
Improvements
Reconstruct 3rd Avenue to better
accommodate 53-foot-long trailers.
Med
Midtown Subarea
Transportation Plan
Finish the study by identifying needs and
multimodal/land use solutions.
138 Med

64
Potential Project Description 2035 MTP
Project
Number1
Level of
Priority
Project
Status
Seward Highway/
O’Malley Road
Interchanges Study
Reconnaissance study to identify operations,
functional design, and phasing of the freeway-
to-freeway interchange at Seward Highway
and O’Malley Road/Minnesota Drive and an
interchange at Old Seward Highway and
O’Malley Road.
139 Med
36th Avenue/Seward
Highway
Interchange
(Seward Highway to
Glenn Highway
Connection Phase I)
Add new facility – interchange at 36th Avenue
and Seward Highway, including braided ramps
connecting to the Tudor Road interchange.
104 Med Design
Immediate Freight Projects with Low Implementation Needs
Eagle River Central
Business District
(CBD) – Phase II,
Study (Eagle River)
Study to identify the recommended long-term
solution for the CBD transportation system.
215 Low
Ingra/Gambell
Streets
Improvements
Reconstruct Ingra/Gambell Streets to better
accommodate 53-foot-long trailers.
Low
Ocean Dock Road
Access and Crossing
from POA to
Terminal Road
Improve Ocean Dock Road access and crossing
from the POA to Terminal Road.
Low
Ocean Dock Road
and Terminal Road
Intersection
Improve the Ocean Dock Road and Terminal
Road intersection.
Low
Tudor Road Access
Management -
Seward Highway to
Arctic Boulevard
and Seward
Highway to
Patterson Street
Add access management and turn restrictions;
modify local connections to make adjacent
property access to other roads; east-west or
north-south access in lieu of direct access from
Tudor Road wherever practical.
301 Low
Tudor Road Access
Management -
Seward Highway to
Patterson Street
Add access management and turn restrictions;
modify local connections to make adjacent
property access to other roads; east-west or
north-south access in lieu of direct access from
Tudor Road wherever practical.
302 Low
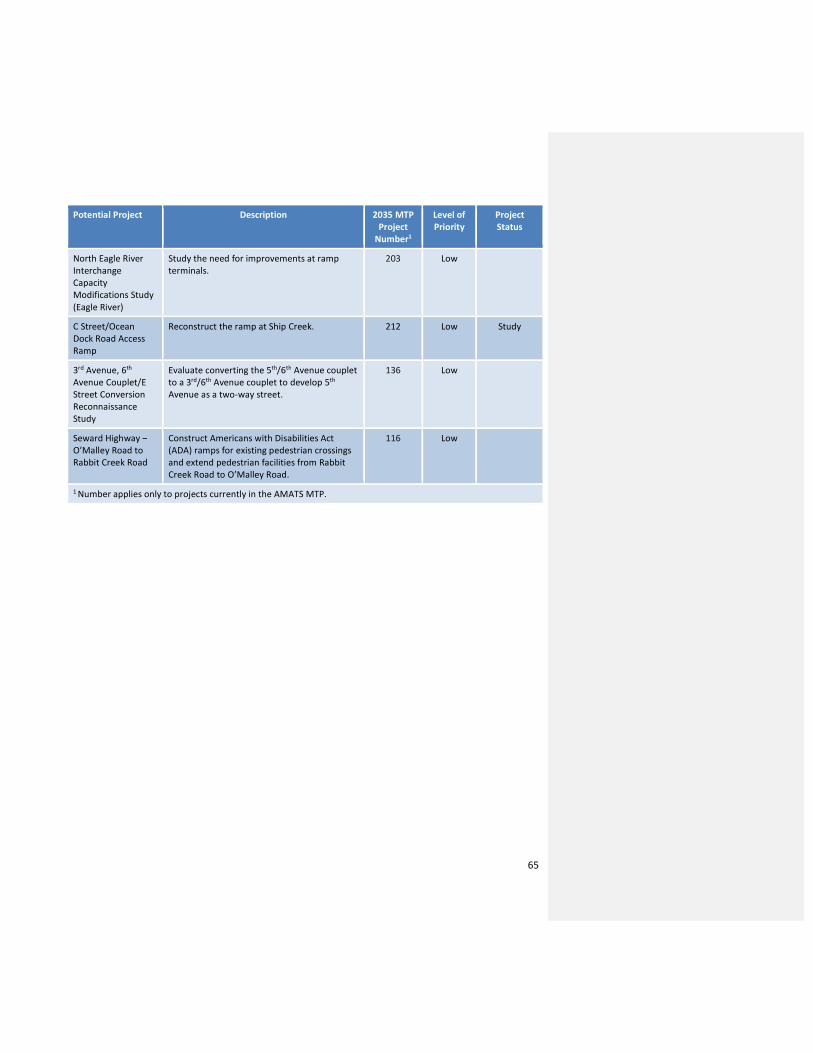
65
Potential Project Description 2035 MTP
Project
Number1
Level of
Priority
Project
Status
North Eagle River
Interchange
Capacity
Modifications Study
(Eagle River)
Study the need for improvements at ramp
terminals.
203 Low
C Street/Ocean
Dock Road Access
Ramp
Reconstruct the ramp at Ship Creek. 212 Low Study
3rd Avenue, 6th
Avenue Couplet/E
Street Conversion
Reconnaissance
Study
Evaluate converting the 5th/6th Avenue couplet
to a 3rd/6th Avenue couplet to develop 5th
Avenue as a two-way street.
136 Low
Seward Highway –
O’Malley Road to
Rabbit Creek Road
Construct Americans with Disabilities Act
(ADA) ramps for existing pedestrian crossings
and extend pedestrian facilities from Rabbit
Creek Road to O’Malley Road.
116 Low
1 Number applies only to projects currently in the AMATS MTP.

66
Table 10-3. Mid-Term (11-15 Years) Freight Projects Identified for Implementation
Potential Project Description 2035 MTP
Project
Number1
Level of
Priority
Project
Status
Mid-Term Freight Projects with High Implementation Needs
Glenn Highway -
Hiland Road to Old
Glenn Highway
(Artillery Road,
Eagle River)
Make necessary improvements at Hiland
Road and Old Glenn Highway (Artillery Road)
interchanges and add a 3rd lane northbound
and southbound between Hiland Road and
Old Glenn Highway (Artillery Road); bridge
improvements at Eagle River interchange,
Hiland Road interchange, and 2 Eagle River
bridges.
105 High North bound
lane is
constructed.
South bound
land is
partially
designed.
Mid-Term Freight Projects with Medium Implementation Needs
Jewel Lake/
International
Airport Road
Grade Separation
Construct interchange at International Airport
Road and Jewel Lake Road incorporating a
grade separation of the railroad; construct a
grade separation of International Airport
Road near Northwood Street with
realignment of the railroad to the south side
of International Airport Road.
304 Med
Minnesota Drive/
Tudor Road
Interchange
Extend controlled access from International
Airport Road through a grade separated
interchange at Tudor Road; consider widening
the arterial to 8 lanes north of Tudor Road to
Northern Lights Boulevard.
309 Med
Ocean Dock Road
Alignment near
POA Entrance
Realign Ocean Dock Road near the POA
entrance
Med
Seward
Highway/92nd
Avenue Grade
Separation
Add new facility - grade separation and
extension of 92nd Avenue from Homer Drive
to Brayton Drive; current project includes
west side on- and off-ramps from Seward
Highway at 92nd Avenue connecting via a
newly constructed 92nd Avenue to the Old
Seward Highway; new traffic signal at 92nd
Avenue and Old Seward Highway; pedestrian,
storm drain, and lighting improvements;
recommend including bicycle lanes.
117 Med 1st phase
under
construction
Glenn Highway
Operations
Analysis –
Muldoon Road to
Eklutna
Include future interchanges - Old Glenn
Highway, Eklutna Village Road, Thunderbird
Falls, Mirror Lake, North Peters Creek/Settlers
Drive, South Peters Creek/Ski Road,
Birchwood Loop Road North, and Birchwood
Loop Road South.
137 Med

67
Potential Project Description 2035 MTP
Project
Number1
Level of
Priority
Project
Status
Mid-Term Freight Projects with Low Implementation Needs
Ingra-Gambell
Couplet Extension
- 3rd Avenue to
Whitney Road
Extend Ingra/Gambell Streets to Ship Creek
Avenue and Whitney Road.
213 Low
Yield Signs at
Highway On-
ramps
Add yield signs at on-ramps on the Glenn and
Seward Highways.
Low
Seward Highway/
O’Malley Road
Interchange
Add a freeway style interchange at Seward
Highway and O’Malley Road/Minnesota Drive
that provides unimpeded traffic flow between
Seward Highway and Minnesota Drive.
211 Low
Glenn
Highway/Farm
Avenue Partial
Interchange
Partial interchange to Farm Avenue off the
Glenn Highway (could include an overcrossing
to a north-south collector on the west side of
the Glenn Highway); includes improvements
to Farm Avenue between Glenn Highway and
Business Boulevard; recommend including
pedestrian facilities.
126 Low
Seward Highway/
O’Malley Road
Interchange
Complete freeway system interchange at
Seward Highway and O’Malley
Road/Minnesota Drive and an interchange at
Old Seward Highway and O’Malley Road.
322 Low
Overpass on
Minnesota Drive
Replace/modify the Minnesota Drive at
Hillcrest Drive overpass to allow for additional
clearance.
Low
C Street - Tudor
Road to 36th
Avenue
Northbound
To address capacity concerns. Low
Lake Otis Parkway
- Debarr Road to
Northern Lights
Boulevard
Capacity concerns/4-lane transition to 3 lanes
at Chester Creek.
Low
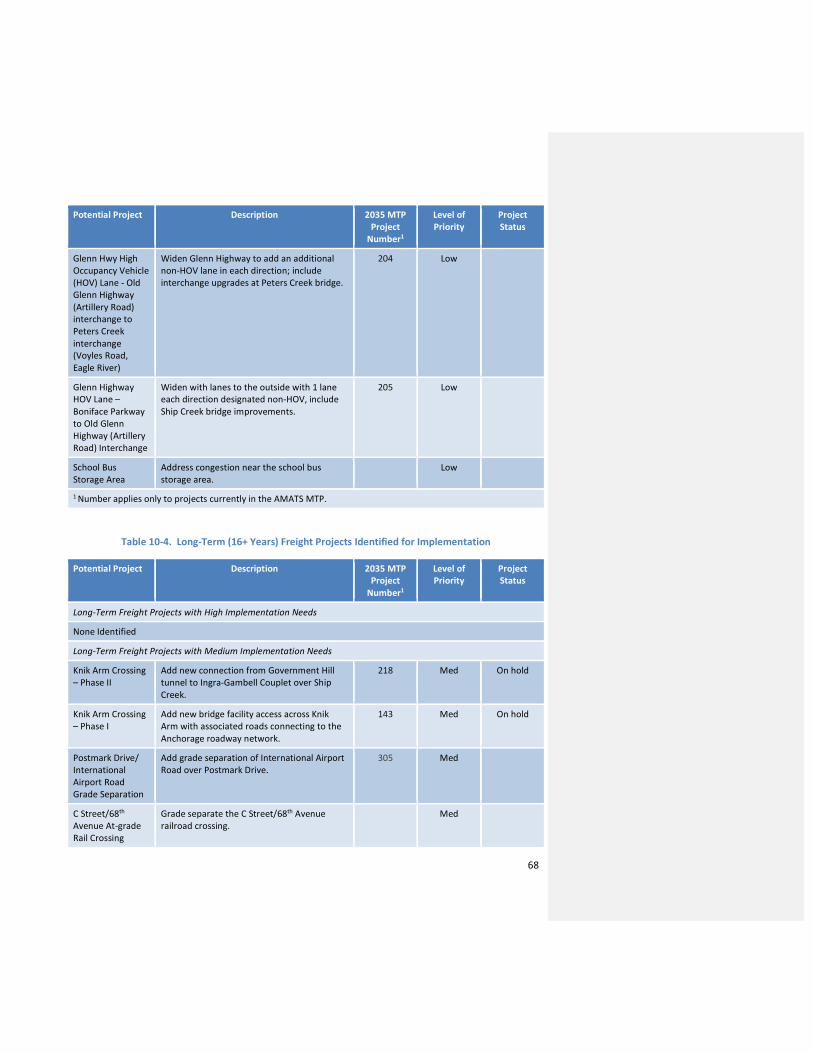
68
Potential Project Description 2035 MTP
Project
Number1
Level of
Priority
Project
Status
Glenn Hwy High
Occupancy Vehicle
(HOV) Lane - Old
Glenn Highway
(Artillery Road)
interchange to
Peters Creek
interchange
(Voyles Road,
Eagle River)
Widen Glenn Highway to add an additional
non-HOV lane in each direction; include
interchange upgrades at Peters Creek bridge.
204 Low
Glenn Highway
HOV Lane –
Boniface Parkway
to Old Glenn
Highway (Artillery
Road) Interchange
Widen with lanes to the outside with 1 lane
each direction designated non-HOV, include
Ship Creek bridge improvements.
205 Low
School Bus
Storage Area
Address congestion near the school bus
storage area.
Low
1 Number applies only to projects currently in the AMATS MTP.
Table 10-4. Long-Term (16+ Years) Freight Projects Identified for Implementation
Potential Project Description 2035 MTP
Project
Number1
Level of
Priority
Project
Status
Long-Term Freight Projects with High Implementation Needs
None Identified
Long-Term Freight Projects with Medium Implementation Needs
Knik Arm Crossing
– Phase II
Add new connection from Government Hill
tunnel to Ingra-Gambell Couplet over Ship
Creek.
218 Med On hold
Knik Arm Crossing
– Phase I
Add new bridge facility access across Knik
Arm with associated roads connecting to the
Anchorage roadway network.
143 Med On hold
Postmark Drive/
International
Airport Road
Grade Separation
Add grade separation of International Airport
Road over Postmark Drive.
305 Med
C Street/68th
Avenue At-grade
Rail Crossing
Grade separate the C Street/68th Avenue
railroad crossing.
Med
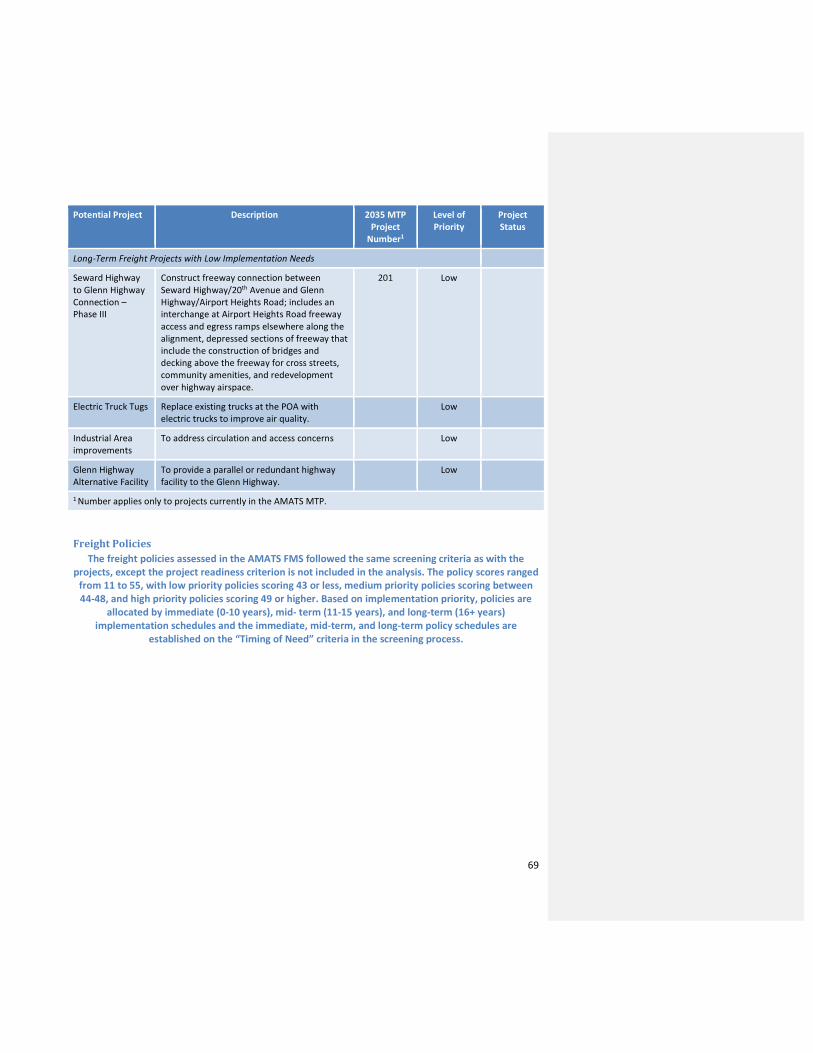
69
Potential Project Description 2035 MTP
Project
Number1
Level of
Priority
Project
Status
Long-Term Freight Projects with Low Implementation Needs
Seward Highway
to Glenn Highway
Connection –
Phase III
Construct freeway connection between
Seward Highway/20th Avenue and Glenn
Highway/Airport Heights Road; includes an
interchange at Airport Heights Road freeway
access and egress ramps elsewhere along the
alignment, depressed sections of freeway that
include the construction of bridges and
decking above the freeway for cross streets,
community amenities, and redevelopment
over highway airspace.
201 Low
Electric Truck Tugs Replace existing trucks at the POA with
electric trucks to improve air quality.
Low
Industrial Area
improvements
To address circulation and access concerns Low
Glenn Highway
Alternative Facility
To provide a parallel or redundant highway
facility to the Glenn Highway.
Low
1 Number applies only to projects currently in the AMATS MTP.
Freight Policies
The freight policies assessed in the AMATS FMS followed the same screening criteria as with the
projects, except the project readiness criterion is not included in the analysis. The policy scores ranged
from 11 to 55, with low priority policies scoring 43 or less, medium priority policies scoring between
44-48, and high priority policies scoring 49 or higher. Based on implementation priority, policies are
allocated by immediate (0-10 years), mid- term (11-15 years), and long-term (16+ years)
implementation schedules and the immediate, mid-term, and long-term policy schedules are
established on the “Timing of Need” criteria in the screening process.

70
Table 10-5,

71
Table 10-6, and Table 10-7 present the Immediate, Mid-Term, and Long-Term Freight Policies for
Implementation by low, medium, and high priority.
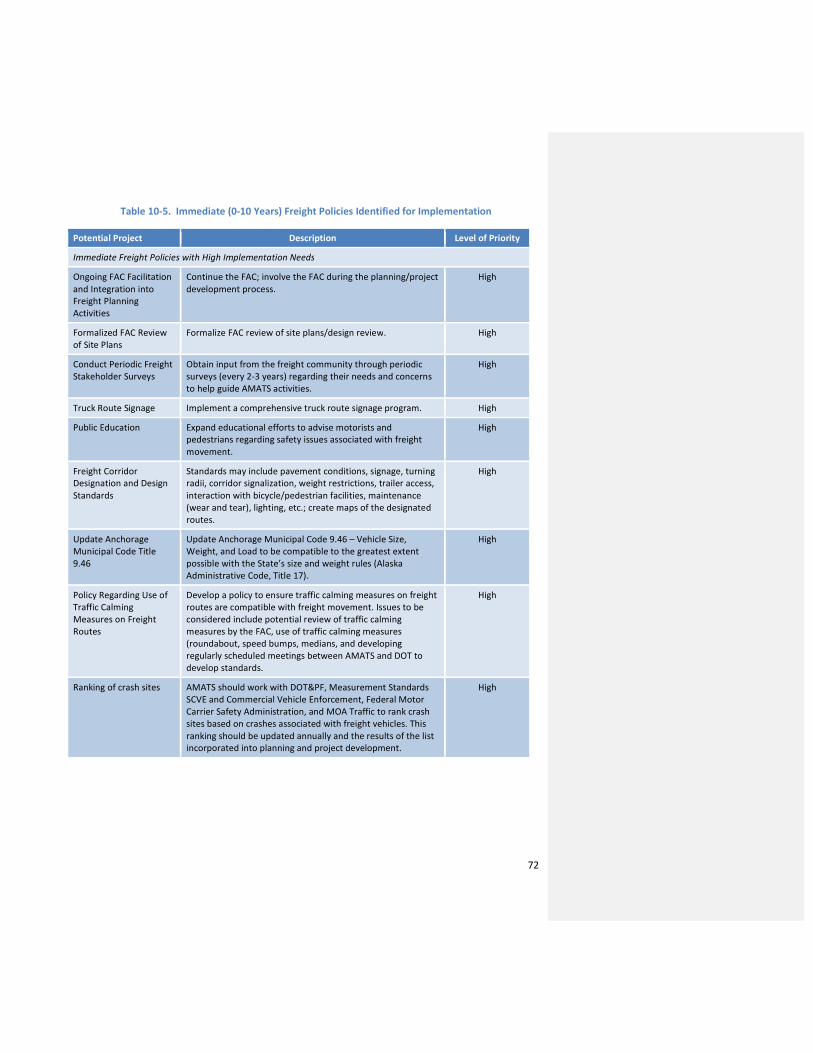
72
Table 10-5. Immediate (0-10 Years) Freight Policies Identified for Implementation
Potential Project Description Level of Priority
Immediate Freight Policies with High Implementation Needs
Ongoing FAC Facilitation
and Integration into
Freight Planning
Activities
Continue the FAC; involve the FAC during the planning/project
development process.
High
Formalized FAC Review
of Site Plans
Formalize FAC review of site plans/design review. High
Conduct Periodic Freight
Stakeholder Surveys
Obtain input from the freight community through periodic
surveys (every 2-3 years) regarding their needs and concerns
to help guide AMATS activities.
High
Truck Route Signage Implement a comprehensive truck route signage program. High
Public Education Expand educational efforts to advise motorists and
pedestrians regarding safety issues associated with freight
movement.
High
Freight Corridor
Designation and Design
Standards
Standards may include pavement conditions, signage, turning
radii, corridor signalization, weight restrictions, trailer access,
interaction with bicycle/pedestrian facilities, maintenance
(wear and tear), lighting, etc.; create maps of the designated
routes.
High
Update Anchorage
Municipal Code Title
9.46
Update Anchorage Municipal Code 9.46 – Vehicle Size,
Weight, and Load to be compatible to the greatest extent
possible with the State’s size and weight rules (Alaska
Administrative Code, Title 17).
High
Policy Regarding Use of
Traffic Calming
Measures on Freight
Routes
Develop a policy to ensure traffic calming measures on freight
routes are compatible with freight movement. Issues to be
considered include potential review of traffic calming
measures by the FAC, use of traffic calming measures
(roundabout, speed bumps, medians, and developing
regularly scheduled meetings between AMATS and DOT to
develop standards.
High
Ranking of crash sites AMATS should work with DOT&PF, Measurement Standards
SCVE and Commercial Vehicle Enforcement, Federal Motor
Carrier Safety Administration, and MOA Traffic to rank crash
sites based on crashes associated with freight vehicles. This
ranking should be updated annually and the results of the list
incorporated into planning and project development.
High

73
Potential Project Description Level of Priority
Facilitated Coordination
of Land Use and Freight
Planning
Collaborate with municipalities regarding non-commercial/
industrial land in Ship Creek Valley, designate industrial
reserves, protect rail corridors, and avoid noise sensitive land
uses near airports; suggest avenues for cross
agency/department collaboration to support industrial
clusters and freight infrastructure in specific reserves;
consider use of ARRC, JBER, and POA (on-port facilities) land
for industry areas.
High
Immediate Freight Policies with Medium Implementation Needs
Data Collection Enhance data collection of truck counts, truck weights, truck
speeds, commercial vehicle credentials checking/screening. Mid
Dedicated Intersection
Improvement Program
Develop a program to fund freight related intersection
improvements similar to the Highway Safety Improvement
Program (HSIP).
Mid
Commercial Vehicle
Enforcement Efforts
Support commercial vehicle enforcement. Efforts can include
assisting with educating law enforcement on how to identify
unsafe vehicles; communicating to trucking companies about
applicable rules, regulations, and reporting requirements;
providing tools, equipment and/or staff as needed by CVE;
and communicating to state leadership about the importance
of enforcement activities.
Mid
Government-Private
Sector Connections
Identify opportunities to strengthen connections between
government and the private sector. These connections can be
formalized through cooperative or interagency agreements.
Potential opportunities include working together on
educational programs, policy development, and infrastructure
improvements.
Mid
Immediate Freight Policies with Low Implementation Needs
Support Workforce
Development Programs
Support programs that encourage employment in freight
related industries (e.g., new driver training and career fairs)
Low
Create Database of
Public/Private
Stakeholders
Update the electronic database of public and private
stakeholders. Use the Annual Freight Forum database as a
starting point.
Low
Promote/Incentivize
Lower Emission Freight
Modes and Technologies
Encourage lower emission modes and technologies to
improve air quality.
Low

74
Table 10-6. Mid-Term (11-15 Years) Freight Policies Identified for Implementation
Potential Project Description Level of Priority
Mid-term Freight Policies with High Implementation Needs
None Identified
Mid-term Freight Policies with Medium Implementation Needs
None Identified
Mid-term Freight Policies with Low Implementation Needs
Dedicated POA Fund
Using Private and Public
Funds
Develop a fund that can be used to finance POA
improvement.
Low
Policy Regarding Loading
Zones
Develop a policy to ensure loading zones can accommodate
53-foot-long trailer.
Low
Identify locations with
conflicts between
freight, transit, and
pedestrians/ bicyclists
Identify potential truck conflict locations with transit, bicycles
and pedestrians and use engineering, maintenance,
scheduling, enforcement, and education strategies to
minimize these conflicts.
Low
Evaluate removal of
weight restrictions
during project
development
Evaluate potential for removing seasonal weight restrictions
when freight routes are reconstructed.
Low
Table 10-7. Long-Term (16+ Years) Freight Policies Identified for Implementation
Potential Project Description Level of Priority
Long-term Freight Policies with High Implementation Needs
None Identified
Long-term Freight Policies with Medium Implementation Needs
None Identified
Long-term Freight Policies with Low Implementation Needs
Traffic Operations
Center (TOC)
A TOC is needed in Anchorage to support Information
Technology Systems.
Low

75
11. Implementation Strategy This section presents short- and long-term implementation and funding strategies designed to address
the freight needs identified in the FMS. Full implementation of the FMS will take many years given the
expected levels of available funding. This implementation section reflects the following elements:
• Funding;
• Education; and
• Planning.
Each element is discussed below.
Funding
This section is organized into four areas: federal, state, local, and other funding.
Federal
At the federal level, the primary source of transportation funding is the Federal Gasoline Tax. Revenue
from this tax goes to the Highway Trust Fund, which is a dedicated funding source for the Federal-Aid
Highway Program. Other sources include the Federal Vehicle Taxes, Federal Diesel Tax, air passenger
excise taxes, aviation fuel taxes, and appropriation from the General Fund. Under various FHWA
programs, this revenue is then given back to states and other jurisdictions.
In December 2015, a new federal transportation funding bill, the FAST Act, became law. The FAST Act
recognizes and creates funds for freight improvements. Freight funding under the FAST Act is primarily
granted through two programs:
• National Highway Freight Program (NHFP): The FAST Act provides $6.3 billion in formula funds
to States over a 5-year period. Eligible projects are those that contribute to efficient freight
movements on the National Highway Freight Network and are identified in a freight
improvement plan included in a state’s freight plan (FHWA, 2016).7 States can use a maximum of
10 percent of its NHFP apportionment for intermodal or rail freight projects. Alaska enjoys
1,222.23 miles in the National Highway Freight Network, including the Glenn and Seward
Highways in Anchorage. As a result, Alaska is expected to receive $80 million in funding through
this program (Martinson, 2015).
• Fostering Advancements in Shipping and Transportation for the Long-Term Achievement of
National Efficiencies (FASTLANE) Grant Program: This new competitive grant program will
provide $4.5 billion of funding to nationally and regionally significant freight and highway
projects over the next 5 years. FASTLANE grant funding is allocated “to complete projects that
improve safety and hold the greatest promise to eliminate freight bottlenecks and improve
critical freight movements“(U.S. Department of Transportation [DOT], n.d.). FASTLANE grants
can be used for a maximum of 60 percent of total eligible project costs. However, 10 percent of
FASTLANE grants are reserved for small projects, with a minimum grant amount of $5 million. In
7 Required in FY 2018 and beyond.
76
addition, state Departments of Transportation need to spend at least 25 percent of each fiscal
year’s FASTLANE grants for project in rural areas (DOT, 2016).8 States, Metropolitan Planning
Organizations (MPOs), local governments, and tribal governments are among those
organizations eligible to apply for a grant. Special purpose districts and public authorities
(including port authorities), and other parties are also eligible to apply for funding to complete
projects that improve safety and hold the greatest promise to eliminate freight bottlenecks and
improve critical freight movements.
State
The State of Alaska funds transportation improvements through money appropriated by the Alaska
Legislature. Historically, State funding is based on revenue from oil tax. In late 2014, crude oil prices
dropped radically, resulting in a significant impact on the state’s budget. As of August 2016, very little
state money is being spent on transportation improvements and this is likely to be the case for several
years. In the future, the state is expected to resume making investments in transportation
infrastructure, but funding levels remains uncertain.
In addition, Anchorage also receives a share of the statewide general obligation (GO) bonds. While GO
bonds are likely to be issued in the future, it is unknown when the next one will be issued or how
funding would be provided to Anchorage.
Local
The MOA issues voter approved bonds to fund transportation improvement and to provide matching
funds for federally funded projects within the Anchorage Roads and Drainage Service Area (ARDSA).
Other
Public-Private Partnership
In recent years, there is heightened interest in having public agencies and private entities work together
to construct and operate critical transportation facilities and services. For example, ARRC, POA, and
TSAIA could team with private entities to identify and implement public-private partnership (P3)
solutions, as could DOT&PF or AMATS. While not all projects are suitable for P3, AMATS should consider
this option for projects when it is practical and mutually beneficial.
Non-Freight Related Improvements
Non-freight related transportation improvements could also benefit freight movement in the AMATS
region. AMATS uses an integrated approach to develop projects that address the needs of multiple user
groups such as transit, bicycles, pedestrians, and roadways as well as freight. With this strategy, AMATS
can develop and program projects that primarily benefit other user groups but also have a positive
impact on freight, potentially allowing AMATS to develop more efficient and cost effective projects. It
may also reduce overall impacts to neighborhoods from transportation improvements.
8 According to FHWA, a rural area is an area outside a U.S. Census Bureau designated urbanized area with a
population over 200,000.

77
Education
Education is an important element of freight mobility, especially in terms of workforce and community
education. This section presents continuing education programs that could be used to support FMS
implementation over time.
Workforce Education Program
Participants in the FMS process have indicated that one of the biggest challenges facing freight mobility
in Anchorage is the ability to attract and retain a skilled workforce. Addressing this potential shortage in
new truck drivers is critical for the future of freight mobility in Anchorage. Several areas to potentially
promote include:
• Career Awareness: Students often make career decisions before they learn about
transportation, so they do not consider or prepare for employment in the freight industry.
• Changing demographics: Younger workers have different expectations for work-life balance and
flexible work situations. Employers may need to adjust their management approach to retain
younger workers in this field.
• Changing technologies: Advances in technology dramatically changed how freight companies
operate. The increased use of technology transformed the skills that people need to fill
positions. For example, companies may use computerized logistics systems for route planning
rather than traditional methods.
AMATS should continue to work with its partners, such as the
ATA, to pursue opportunities to support workforce education.
For example, AMATS could invite ATA to the annual
Transportation Fair to educate attendees about potential
careers in the trucking industry, AMATS could with its
partners could produce educational material on becoming a
truck driver, and AMATS could promote driver training
through its social media channels. Also, AMATS and the FAC
should highlight these efforts at their annual Freight Forum.
Community Education
AMATS should collaborate and cooperate with partners to provide broad education about the
importance of freight and related activities to the Anchorage economy and quality of life. Many people
do not understand how the goods they purchase are transported. By better understanding the freight
system, people will gain additional knowledge and hopefully support projects and policies designed to
make the overall freight system operate more efficiently and safely.
Equally, another component of community education is to educate drivers on how to better share the
road with commercial vehicles. Many people do not realize the differences between how a car and large
trucks operate. For example, trucks and buses have larger blind spots, need longer stopping distances,
need longer time to stop, and may need to swing left to make a right hand turn. Driver education can
increase the safety for everyone using the road system. In addition, AMATS could take this opportunity
Potential sources of financial aid for
driver training include:
• Alaska Education Loans
(www.acpe.alaska.gov)
• Department of Veterans Affairs
(www.gibill.va.gov)
• Alaska Job Center Network
(http://jobs.alaska.gov/)

78
to fully take advantage of advanced technology to make distracted driving less tempting. Examples of
programs AMATS could use as part of this effort include the Federal Motor Carrier Safety
Administration’s Our Roads, Our Responsibility program (https://www.fmcsa.dot.gov/ourroads), and the
American Trucking Association’s Share the Road Program
(http://www.trucking.org/Share_the_Road.aspx) or new safety and distracted driving smartphone
applications such as Verify developed by Cellepathy (http://www.cellepathy.com/).
Figure 11-1. Infographic used by the City of Seattle to educate residents about freight
Source: City of Seattle
Agency Education
AMATS’ FAC, must be actively involved in the implementation of this FMS, and, more importantly, the
ongoing education of the MOA, DOT&PF, and other regional public and private stakeholders in the
Anchorage freight planning process. The FAC, while formalized for many years within AMATS, should be
invited to actively participate in the development of the upcoming MTP Update and to promote the
identification, assessment, and potential programming of freight-oriented projects during the MTP
planning process. The FAC could be used as a continued forum for freight planning activities and to help
identify and educate these stakeholders about the viability and benefits of how improved freight
transportation infrastructure will help the agency and its constituents meet the needs for a growing and
healthy economy.
Industry Education
The FAC should encourage trucking companies and others in the freight industry to review the MOA’s
freight routes and applicable code (Title 9) on an annual basis and encourage the use of these routes
when possible. AMATS can support this effort by ensuring the most up-to-date information is available
online. Further, AMATS and the FAC could produce a truck route map similar to the one produced by the
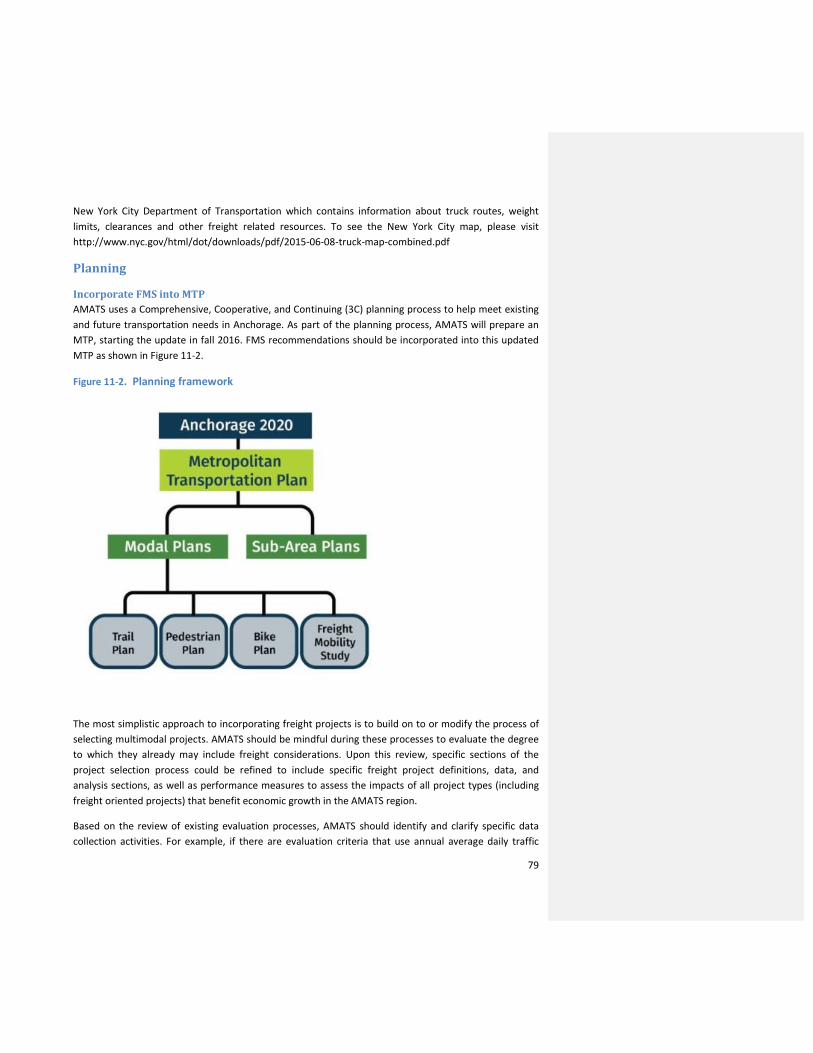
79
New York City Department of Transportation which contains information about truck routes, weight
limits, clearances and other freight related resources. To see the New York City map, please visit
http://www.nyc.gov/html/dot/downloads/pdf/2015-06-08-truck-map-combined.pdf
Planning
Incorporate FMS into MTP
AMATS uses a Comprehensive, Cooperative, and Continuing (3C) planning process to help meet existing
and future transportation needs in Anchorage. As part of the planning process, AMATS will prepare an
MTP, starting the update in fall 2016. FMS recommendations should be incorporated into this updated
MTP as shown in Figure 11-2.
Figure 11-2. Planning framework
The most simplistic approach to incorporating freight projects is to build on to or modify the process of
selecting multimodal projects. AMATS should be mindful during these processes to evaluate the degree
to which they already may include freight considerations. Upon this review, specific sections of the
project selection process could be refined to include specific freight project definitions, data, and
analysis sections, as well as performance measures to assess the impacts of all project types (including
freight oriented projects) that benefit economic growth in the AMATS region.
Based on the review of existing evaluation processes, AMATS should identify and clarify specific data
collection activities. For example, if there are evaluation criteria that use annual average daily traffic
80
(AADT), then this could also include annual average daily truck traffic (AADTT). Once the modifications
are developed, it is critical that the necessary data be collected to support the changes. The
recommended revisions and new data requirements should be merged into AMATS’ procedures.
On-going Identification of Freight-Specific Projects and Policies
FMS determined needed freight projects covering a 20-year period, from 2016 to 2036. As needs and
conditions shift, there likely are other basic projects and policies that are essential to improve freight
mobility. AMATS, and its FAC, should be aware of these circumstances and pinpoint crucial projects and
policies. In addition, when new transportation projects are initiated, their potential impact on freight
mobility and the region’s economy should be considered.
To keep the FMS relevant, AMATS should update the project list every two years while other elements
get updated as needed to reflect changing conditions. This process, in addition to assessing freight
projects - to the call for projects of the MTP every five years, should keep freight oriented projects at the
forefront in the AMATS planning and programming processes.
Commitment to Continuing Coordination with Key Freight Modes
Clearly, the FMS benefited substantially from the detailed input received from the FAC. With broad
outreach in the planning process, the FAC actively engages the private sector, multiple modes, and end
users of the freight system. AMATS should continue to employ the FAC to provide dynamic insight on
future goods movement, identify freight needs when developing projects, analyze freight concerns with
site plans, contribute prudent input into land use plans, offer ongoing involvement with AMATS efforts,
and public participation.
Implement Recommended Short-Term Freight Policies
To implement the FMS, several attainable policies recommended in the Section 10 should be carried out
over the short term to support this FMS, and to further reach AMATS overall goals and objectives. These
include:
Implement Designated Regional Truck Route: A regional truck route network should be assessed,
signed, and enforced in the AMATS region as a means to concentrate heavy duty truck movements on
selected roadways and corridors. While trucks use all system roadways, heavy duty truck movements
need to be focused on key regional freight routes to protect communities, increase safety, reduce
neighborhood impacts, and alleviate bottlenecks. Figure 11-3 shows the proposed key freight routes
suggested as designated regional truck routes, including:
• A/C Streets;
• Seward Highway;
• Glenn Highway;
• Tudor/Muldoon Roads;
• 3rd/ Commercial Drive/Mountain View Drive
• Minnesota Drive; and
• International Airport Road.

AMATS and the FAC will work together along with other agency and community partners to finalize the
proposed regional truck route network and to have the network adopted by the appropriate entities.
Freight Corridor Designation and Design Standards: As part of the Designated Regional Truck Routes
implementation strategy, freight corridor designation and design standards should be developed and
implemented. Designated regional truck routes should not just accommodate trucks; they should be
designed for trucks.
These standards will include pavement condition ratings, signage and wayfinding, turning radii, corridor
signalization, utility and signal pole location, landscaping, weight restrictions, trailer access, interaction
with bicycle/pedestrian facilities, maintenance (wear and tear), and lighting, among others. Detailed
design criteria for streets on the freight network should be included in the MOA’s Design Criteria
Manual and DOT&PF’s Alaska Highway Preconstruction Manual.
Designing for truck movements will often require balancing the needs of other, and sometimes
competing, transportation modes. For example, lanes have to be wide enough to accommodate a truck
without encroaching on adjacent lanes, but wider roadways are usually less pedestrian friendly. Like
trucking, the Anchorage transit system uses primarily major arterials attracting pedestrians and cyclists
to bus stops. As each roadway segment is surrounded by a different setting or land use (e.g., dense
urban, industrial, etc.) and characteristics, designs should be developed on a case-by-case basis.
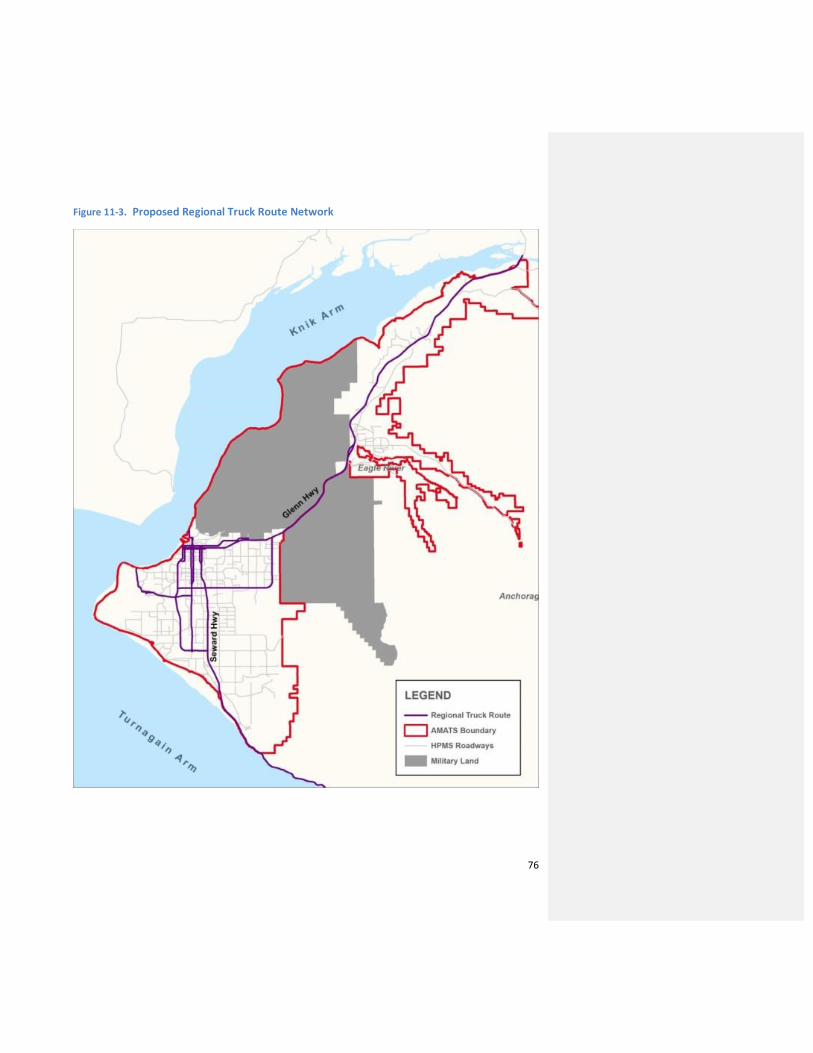
76
Figure 11-3. Proposed Regional Truck Route Network

77
Update Anchorage Municipal Code Title 9.46: To support freight mobility, Anchorage Municipal Code Title
9.46 – Vehicle Size, Weight, and Load should be reviewed and revised to be compatible to the greatest
extent possible with the State’s size and weight rules (Alaska Administrative Code, Title 17). AMATS
should work with the DOT&PF and MOA to identify and adopt changes to AMC 9.46.
Truck Route Signage: To help enforce heavy duty truck usage of designed regional truck routes and
educate truck drivers on using these specific corridors to access and egress the AMATS region, AMATS
should work with the DOT&PF and MOA to implement a comprehensive truck route signage program.
While many drivers are familiar with the Anchorage area, signage is particularly helpful to drivers who
make infrequent trips here.
Ongoing FAC Facilitation and Integration into Freight Planning Activities: The FAC should continue as a
standing permanent committee within the AMATS planning process. This will facilitate freight planning
activities and the development of the freight program in the AMATS region, as well as support and
promote freight infrastructure project assessment and implementation in the overall transportation
planning process in the AMATS region.
Formalized FAC Review of Site Plans: In cooperation with DOT&PF and MOA, AMATS should formalize
the FAC’s review of site plans and design reviews specifically related to a site’s potential increase in
truck movements, truck access and egress routes, use of alternative modes, impact to local
neighborhoods and communities, and economic impact.
Due to the volunteer nature of the FAC, undertaking review of all site plans may prove difficult for
committee members. While site plans that have substantial freight involvement (e.g., a new retail
development) should remain a singular focus, the FAC can work with the MOA to educate planners of
immediate freight concerns to be aware of during the site plan review process for other projects. For
example, a freight mobility and access checklist for appropriate site plans could be created by the FAC to
assist planners.
Conduct Periodic Freight Stakeholder Surveys: In cooperation with the FAC, AMATS should draft
periodic surveys (every 2-3 years) to obtain valued input from the freight community regarding their
exact needs and concerns. Accurate information and data such as these survey tools, can then
encourage and support the development of specific freight-oriented projects and policies. More
importantly, by gathering these comments, definitive actions can result in achievable, successful
projects - implemented to help guide the AMATS transportation planning process.
Public Education: Educational efforts to advise motorists and pedestrians regarding safety issues
associated with freight movement should be bolstered. Currently, AMATS and the FAC produced public
safety messages regarding safely sharing the road. Yet additional work could highlight the existing
Operation Lifesaver program spearheaded by ARRC. AMATS and the FAC could collaborate with the
ARRC to identify ways to expand the reach of the Operation Lifesaver program.
Policy Regarding Use of Traffic Calming Measures on Freight Routes: Traffic calming measures are
designed to slow traffic down. However, some traffic calming measures make freight movement

78
challenging and potentially create inadvertent hazards. For example, a curb extension reduces the
crossing distance of a road and increases the ability for a pedestrian and vehicle to see the crossing in
areas where a parking lane would block visibility. However, larger trucks sometimes drive over the curb
when making a right turn, creating a potential conflict with pedestrians.
AMATS should craft a policy to ensure traffic calming measures on freight routes are compatible with
truck movements. While there are no standard solutions to address freight conflicts with other modes of
transportation, there are potential solutions. For example, on truck routes, instead of using curb
extensions for pedestrians, they could be given longer crossing times.
12. Conclusion The AMATS FMS inventories and identifies existing conditions and future freight needs in the Anchorage
area. Completion of this plan is an important milestone for freight planning in Anchorage. However, it is
not the end of the process. AMATS will build upon the recommendations of the plan and carry them
forward into the MTP and other implementation actions.

79
References
Alaska Department of Transportation & Public Facilities (DOT&PF)
2013 State of Alaska Commercial Vehicle Safety Plan for the Federal Motor Carrier Safety
Administration’s Motor Carrier Safety Assistance Program Fiscal Year 2014. Available on the
internet at: http://dot.alaska.gov/mscve/assets/webdocs/2014CVSP.pdf
2015 Airport Facts. Available on the internet at:
http://www.dot.state.ak.us/anc/about/facts.shtml
2016 CVE Crash Mapping, email received 2/22/2016
Alaska Railroad Corporation (ARRC)
2015 Freight Services. Available on the internet at:
https://www.alaskarailroad.com/Portals/6/pdf/pr/2015_05_19_Freight_Business_FS_PR.pd
f
American Transportation Research Institute (ATRI)
2017 Identifying Autonomous Vehicle Technology Impacts on the Trucking Industry. November
2016.
American Trucking Associations (ATA)
2013 Relative Contribution/Fault in Car-Truck Crashes. February 2013. Available on the internet
at:
http://www.trucking.org/ATA%20Docs/News%20and%20Information/Reports%20Trends%2
0and%20Statistics/02%2012%2013%20--%20FINAL%202013%20Car-
Truck%20Fault%20Paper.pdf
Bureau of Labor Statistics
n.d. Quarterly Census of Employment and Wages
Federal Aviation Administration (FAA)
2015 All-Cargo Data Reported for Calendar Year 2014. CY 2014 ACAIS. September 22, 2015.
Available on the internet at:
http://www.faa.gov/airports/planning_capacity/passenger_allcargo_stats/passenger/media
/cy14-cargo-airports.pdf
Federal Highway Administration (FHWA)
2016 National Highway Freight Program (NHFP). February 2016. Available on the internet at
http://www.fhwa.dot.gov/fastact/factsheets/nhfpfs.pdf

80
GLDPartners
2014 AIAS Air Cargo Related Economic Development Opportunity Assessment. September 9, 2014
(amended January 15, 2015 and January 20, 2016). Available on the internet at:
http://aedcweb.com/wp-content/uploads/2014/10/Final-AIAS-Air-Cargo-Related-EDO-
Assessment-V3-1-20-16.pdf
HDR, Inc. in association with CDM Smith
2015 Alaska State Rail Plan. Draft. November 2015. Prepared for the Alaska Department of
Transportation and Public Facilities. Available on the internet at:
http://www.asrpoloh.com/assets/akdot_121815_rail_plan_draft.pdf
Lantz, Paul
2015 NPC Energy Services Provides EPM and 70E Compliance Solutions for Ted Stevens Anchorage
Int’l Airport. NPC Energy Services LLC website. Available on the internet at:
http://npcesllc.com/npc-energy-services-provides-epm-and-70e-compliance-solutions-for-
ted-stevens-anchorage-intl-airport/
McDowell Group
2016 Southcentral Alaska Ports Freight and Fuel Analysis 2016 Update. Prepared for Port of
Anchorage, March 2016. Available on the internet at: http://www.portofanc.com/wp-
content/uploads/McDowell_Group_2016_Report.pdf
Martinson, Erica
2015 “What Alaska gets out of the new federal transportation bill.” Alaska Dispatch News.
December 4, 2015. Available on the internet at: http://www.adn.com/politics/article/what-
alaska-gets-out-new-federal-transportation-bill/2015/12/05/
Municipality of Anchorage (MOA), Planning Department
2001 Anchorage 2020, Anchorage Bowl Comprehensive Plan. Adopted February 20, 2001,
Assembly Ordinance 2000-119 S. Available on the internet at:
http://www.muni.org/Departments/OCPD/Planning/Publications/Pages/Anchorage2020.as
px
Municipality of Anchorage (MOA), Community Development Department Planning Division and URS
Corporation
2012 West Anchorage District Plan. Adopted July 12, 2012, Assembly Ordinance AO 2012-47, As
Amended. Available on the internet at:
http://www.muni.org/Departments/OCPD/Planning/Publications/Pages/WestAnchorageDis
trictPlan.aspx
81
Pipeline and Hazardous Materials Safety Administration (PHMSA).
2016 Pipeline Incident 20 Year Trends. Available on the internet at:
http://www.phmsa.dot.gov/pipeline/library/data-stats/pipelineincidenttrends
Port of Anchorage (POA)
2016 Facilities. Available on the internet at http://www.portofanc.com/operations/facilities/
RSG
2016 AMATS Travel Model Update: Socioeconomic Projections and Land Use Allocation Report
Draft. February 2016. Prepared for AMATS.
Transportation Research Board, National Cooperative Freight Research Program (TRB, NCFRP)
2015 Improving Freight System Performance in Metropolitan Areas. Report 33, May 2015.
Available on the internet at: http://onlinepubs.trb.org/onlinepubs/ncfrp/ncfrp_rpt_033.pdf
U.S. Census Bureau
2016 American Factfinder. FNSB Summary File 1 for 2000 and 2010. Available on the Internet at:
http://factfinder.census.gov/faces/tableservices/jsf/pages/productview.xhtml?pid=DEC_10_
SF1_SF1DP1&prodType=table
U.S. Department of Transportation (DOT)
n.d. The FAST Act: Freight Provisions. Available on the internet at:
https://www.transportation.gov/fastact/freight-factsheet
2016 Fostering Advancements in Shipping and Transportation for the Long-term Achievement of
National Efficiencies (FASTLANE) Grants. February 2016. Available on the internet at:
https://www.fhwa.dot.gov/fastact/factsheets/fastlanegrantsfs.cfm