Embed Size (px)
Citation preview

REMEDIAL ACTION CONTRACT
FOR REMEDIAL, ENFORCEMENT OVERSIGHT, AND NON-TIME- CRITICAL REMOVAL ACTIVITIES AT SITES OF RELEASE OR
THREATENED RELEASE OF HAZARDOUS SUBSTANCES
IN EPA REGION 8
U.S. EPA CONTRACT NO. EP-W-05-049
2010 Ground Water Data Analysis Report Butte Priority Soils Operable Unit
Silver Bow Creek/Butte Area National Priorities List Site
Butte, Montana
Work Assignment No.: 311-NGNG-0822
January 2012
Prepared for:
U.S. ENVIRONMENTAL PROTECTION AGENCY
Federal Building 10 West 15th Street, Suite 3200
Helena, MT 59626
Prepared by:
CDM FEDERAL PROGRAMS CORPORATION
50 West 14th Street, Suite 200 Helena, MT 59601


i Q:\Priority Soils\Ground-Water-Monitoring-Summary Report\Final\gw_report_1-2012.final.docx
Contents
Section 1 Introduction ................................................................................................. 1-1
1.1 Purpose of Report ............................................................................................ 1-1
1.2 Remedial Action Objectives and Remediation Goals ................................. 1-2
1.3 Ground Water Selected Remedy Components ........................................... 1-2
1.4 Ground Water Monitoring Program Requirements ................................... 1-2
Section 2 Ground Water Monitoring Activities ..................................................... 2-1
2.1 Ground Water Monitoring Program Implementation ............................... 2-1
2.1.1 Ground Water Sampling and Analysis ........................................... 2-1
2.1.2 Additional Well Installation ............................................................. 2-2
2.1.3 Upper MSD Pumping Test ................................................................ 2-3
2.1.4 Data Management .............................................................................. 2-5
2.1.5 MSD Subdrain Load Monitoring...................................................... 2-6
2.2 Ground Water Remedial Design Activities ................................................. 2-6
2.2.1 MSD Subdrain Isolation Study ......................................................... 2-6
2.2.2 Area between MSD and LAO Capture Systems ............................ 2-7
2.2.2.1 Blue Water Seep ................................................................... 2-7
2.2.2.2 Slag Tunnel Seep .................................................................. 2-7
2.2.2.3 BRW Test Pits ....................................................................... 2-8
2.2.2.4 Extension of the LAO Capture System ............................. 2-8
2.2.2.5 Preliminary Results ............................................................. 2-8
2.2.3 Ground Water Fingerprinting .......................................................... 2-9
Section 3 Data Analysis .............................................................................................. 3-1
3.1 Effectiveness of Capture and Treatment Systems ....................................... 3-1
3.1.1 MSD Capture System ......................................................................... 3-1
3.1.1.1 Surface Water Impacts ........................................................ 3-1
3.1.1.2 Hydraulic Capture Zone .................................................... 3-2
3.1.1.3 Ground Water Quality Monitoring ................................... 3-3
3.1.2 LAO Capture System ......................................................................... 3-4
3.1.2.1 Surface Water Impacts ........................................................ 3-4
3.1.2.2 Hydraulic Capture .............................................................. 3-4
3.1.2.3 Vertical Ground Water Potential ....................................... 3-6
3.1.2.4 Ground Water Monitoring ................................................. 3-6
3.2 TI Zone Perimeter Monitoring ....................................................................... 3-7
3.3 Additional Information ................................................................................ 3-10
3.3.1 Investigation of the Middle Gravel ................................................ 3-10
3.3.2 Middle Gravel Water Quality ......................................................... 3-12
3.3.2.1 Middle Gravel - Spatial Trends ....................................... 3-13
3.3.2.2 Middle Gravel - Temporal Trends .................................. 3-13
3.3.3 Geochemical Fingerprinting ........................................................... 3-14
3.4 Ground Water Level Trends ........................................................................ 3-16
3.4.1 Effect of Subdrain ............................................................................. 3-16
3.4.2 Ground Water Divide in the Parrot Tailings Area ...................... 3-17

Contents
ii Q:\Priority Soils\Ground-Water-Monitoring-Summary Report\Final\gw_report_1-2012.final.docx
Section 4 References .................................................................................................... 4-1
List of Tables
Table 3-1 Dissolved Metals in Ground Water near Pump Vault October 2010 ................ 3-3 Table 3-2 Ground Water Quality in Wells Near Cell D4 ...................................................... 3-7 Table 3-3 TI Zone Perimeter Well Monitoring Results since 2007 (µg/L) ......................... 3-9 Table 3-4 Former TI Zone Perimeter Well Monitoring Results ......................................... 3-10 Table 3-5 Summary of Cluster Analysis Groupings using April and August 2010 Data..................................................................................................................... 3-15
List of Figures
Figure 2-1 Monitoring Well Locations Figure 3-1 Dissolved Metals at Station MSD-OUT Figure 3-2 Gains and Losses in Silver Bow Creek between SS-04 and SS-05 Figure 3-3 Site-Wide Water Table Map October 2010 Figure 3-4 Water Table Map Lower MSD Area October 2010 Figure 3-5 Water Table Map Lower MSD Area May 2010 Figure 3-6 Water Table Map Lao May 2010 Figure 3-7 Water Table Map LAO October 2010 Figure 3-8 Water Table Map near Cell D4 May 2010 Figure 3-9 Water Table Map near Cell D4 October 2010 Figure 3-10 Water Table Map near Cell D4 January 2010 Figure 3-11 Water Table Cross-Section through Cell D4 Figure 3-12 Bedrock Ground Water Potential near Cell D4 October 2010 Figure 3-13 Bedrock Ground Water Potential near Cell D4 May 2010 Figure 3-14 Cadmium in Shallow Ground Water near Cell D4 Figure 3-15 Copper in Shallow Ground Water near Cell D4 Figure 3-16 Zinc in Shallow Ground Water near Cell D4 Figure 3-17 Cadmium in Bedrock Ground Water near Cell D4 Figure 3-18 Copper in Bedrock Ground Water near Cell D4 Figure 3-19 Zinc in Bedrock Ground Water near Cell D4 Figure 3-20 Geologic Cross-Section Along MSD Figure 3-21 Middle Gravel Potentiometric Surface October 2010 Figure 3-22 Spatial trends for copper and zinc within selected middle gravel wells
(November 2010 data) Figure 3-23 Spatial trends for copper within selected middle gravel wells (July-
August 2004 data) Figure 3-24 Spatial trend for copper within selected middle gravel wells (July-
August 2004 data) Figure 3-25 Temporal trends for copper and zinc within well GS-41D Figure 3-26 Temporal trends for copper and zinc within well GS-41S Figure 3-27 Temporal trends for copper and zinc within well AMW-01B Figure 3-28 Temporal trends for copper and zinc within well MSD-01B Figure 3-29 Temporal trends for copper and zinc within well MSD-02B Figure 3-30 Temporal trends for copper and zinc within well MSD-03

Contents
iii Q:\Priority Soils\Ground-Water-Monitoring-Summary Report\Final\gw_report_1-2012.final.docx
Figure 3-31 Temporal trends for copper and zinc within well MSD-05 Figure 3-32 Temporal trends for copper and zinc within well GS-09 Figure 3-33 Temporal trends for copper and zinc within well GS-11 Figure 3-34 GS-41S and GS-41D Vertical Gradient Figure 3-35 GS-42S and GS-42D Vertical Gradient Figure 3-36 AMW-01, AMW-01B, and AMW-01C Vertical Gradient Figure 3-37 GS-30S and GS-30D Vertical Gradient Figure 3-38 GS-08, GS-09, and GS-11 Vertical Gradient Figure 3-39 GS-46S and GS-46D Vertical Gradient Figure 3-40 Water Table Elevations near the Parrot Tailings October 2010 Figure 3-41 Long-Term Water Elevations Along Cross-Section in Parrot Tailings Area Figure 3-42 Water Table Elevation Differences between AMW-08 and GS-41S Figure 3-43 Water Table Elevations along Cross-Section through Parrot Tailings
List of Acronyms
µg/L micrograms per Liter ARAR Applicable or Relevant and Appropriate Requirement BMFOU Butte Mine Flooding Operable Unit BPSOU Butte Priority Soils Operable Unit BRW Butte Reduction Works CDM CDM Federal Programs Corporation CGWA Controlled Ground Water Area COC contaminant of concern DEQ Montana Department of Environmental Quality DSR Data Summary Report EPA Environmental Protection Agency GWIC Ground Water Information Center GWMP Ground Water Monitoring Plan HCC hydraulic control channel LAO Lower Area One MBMG Montana Bureau of Mines and Geology MSD Metro Storm Drain RAO Remedial Action Objective RD remedial design RG remedial goal ROD Record of Decision TI technical impracticability
Appendices
Appendix A Data Analysis

Contents
iv Q:\Priority Soils\Ground-Water-Monitoring-Summary Report\Final\gw_report_1-2012.final.docx

1-1 Q:\Priority Soils\Ground-Water-Monitoring-Summary Report\Final\gw_report_1-2012.final.docx
Section 1 Introduction
1.1 Purpose of Report The purpose of this report is to summarize ground water monitoring and ground water remedial design (RD) activities that have occurred since the initiation of the of
the Interim Comprehensive Ground Water Monitoring Plan (GWMP) (U.S.
Environmental Protection Agency [EPA] 2007)1 by the responsible parties as part of the initial efforts at remedial design and remedial action implementation following
the issuance of the Record of Decision (ROD) (EPA, with partial concurrence by the
Montana Department of Environmental Quality [DEQ] 2006). The primary activities described in the ROD and addressed in this report are associated with development
of a ground water monitoring program. The monitoring program activities performed
since 2007 are as follows:
Installation of additional ground water monitoring wells monitor ground water
contamination within the Butte Priority Soils Operable Unit (BPSOU);
Monitoring ground water at regular intervals to evaluate the ground water flow and
groundwater/surface water interaction and the effectiveness of remedial actions
performed to date;
Tracer test to determine metals loading within the Metro Storm Drain (MSD) subdrain;
and
Aquifer test to evaluate transmissivity of the middle gravel portion of the alluvial
aquifer and lateral and vertical interconnection of the alluvial aquifer within the MSD.
During the implementation of the monitoring program and remedial actions, additional ground water tasks were identified and implemented. They include:
Tests to isolate the lower portions of the MSD subdrain to better understand ground
water loading in the area;
Collection of ground water samples in the MSD area and analysis for a wide variety of
constituents for the purpose of geochemical analysis; and
Design and partial implementation of an extension of the ground water collection
system in Lower Area One (LAO).
The data collected during these tasks have been previously presented in other data
reports. This report presents a discussion or analysis of these data and focuses on elements not addressed in other reports.
1 The plan has since been replaced by a Revised Interim Ground Water Monitoring Plan (EPA 2011)
which EPA ordered implemented in 2011.

Section 1 Introduction
1-2 Q:\Priority Soils\Ground-Water-Monitoring-Summary Report\Final\gw_report_1-2012.final.docx
1.2 Remedial Action Objectives and Remediation Goals The remedial action objectives (RAOs) for ground water presented in the BPSOU
ROD are to:
Prevent ingestion of or direct contact with contaminated groundwater that would result in
unacceptable risk to human health.
Prevent groundwater discharge that would lead to violations of surface water applicable or
relevant and appropriate requirements (ARARs) and remedial goals (RGs) for the BPSOU.
Prevent degradation of groundwater that exceeds current standards.
The RGs for ground water presented in the BPSOU ROD are to meet numeric water
quality standards for ground water established in the ROD except where standards
are waived. The ROD established a Technical Impracticability (TI) Zone in the alluvial aquifer where standards for six contaminants of concern (COCs) were waived.
1.3 Ground Water Selected Remedy Components The RAOs and RGs are expected to be met through implementation of the selected
remedy. The first RAO - to prevent ingestion of or contact with contaminated ground water - is addressed through establishment of a Controlled Ground Water Area
(CGWA). The Butte Alluvial and Bedrock CGWA was established in October 2009
and is currently in effect.
The second and third RAOs - to prevent ground water discharge and further ground
water degradation – are addressed through the following ground water components
of the remedy:
Collection of contaminated ground water in the MSD area;
Collection of contaminated ground water in the LAO area; and
Treatment of collected ground water.
Other remedial measures, such as infiltration barriers or alternative snow storage areas may also be required and are being evaluated.
Ground water monitoring is required to evaluate whether the remedy is effective at
meeting RAOs and RGs.
1.4 Ground Water Monitoring Program Requirements
To implement the ground water monitoring program, the following components were
required by the ROD:

Section 1 Introduction
1-3 Q:\Priority Soils\Ground-Water-Monitoring-Summary Report\Final\gw_report_1-2012.final.docx
1. All monitoring wells in the BPSOU aquifer (MSD, LAO, and between) will be
sampled every 5 years. Additionally, EPA in consultation with DEQ will identify a
network of wells for annual water quality sampling. The Interim Comprehensive Ground Water Monitoring Plan was developed in 2007 (EPA 2007) and was
implemented in October 2007. These data form much of the basis for this
report.
2. Water levels will be measured in all wells and certain surface water locations twice per
year. Water levels will be measured in a select network on a monthly basis, or more
frequently if necessary for operation of the capture and treatment system. This activity is ongoing and is discussed in Section 2.
3. Ground water monitoring will be coordinated with the Butte Mine Flooding Operable
Unit (BMFOU) monitoring program managed by the Montana Bureau of Mines and
Geology (MBMG) as there is overlap in the monitoring well networks. This activity
is ongoing and is discussed in Section 2.1.1.
4. Additional monitoring wells will be installed throughout the MSD as needed to
determine flow direction, gradients, and ground water quality. Additional monitoring
wells will be installed in areas where the extent(s) of ground water plumes are
uncertain. These will also include additional nested well sets in key areas of the
floodplain, additional mid-level and deep wells, and possibly bedrock wells. This
activity has been implemented and is discussed in Section 2.
5. Wells will also be installed, as necessary, to monitor the subdrain. This activity has been implemented and is discussed in Section 2.
6. One pumping test will be conducted on a mid-level well (AMW-1B) in upper MSD to
determine if the subdrain will influence flow in the mid-level portion of the aquifer. This activity has been implemented and is discussed in Section 2.1.3.
7. The ground water loads entering the MSD subdrain will be monitored annually in the
fall (base flow) using dye tracer methods to determine flow and standard sampling to
measure metals and arsenic concentrations. Load monitoring will assure that the
subdrain continues to operate as expected and is not fouling or clogging. This activity
has been implemented and is discussed in Section 2.1.5. In addition, two
monitoring wells will be installed adjacent to MSD just downgradient of the pump
vault to assure that captured ground water is not leaving the capture system. This
activity has been implemented and is discussed in Section 2.
8. A network of nested wells will be installed between the MSD and Blacktail Creek. This
activity has been partially implemented and is discussed in Section 2.
9. At least two nested well groupings (three wells per grouping) will be installed at the
very west end of the BPSOU as point-of-compliance wells. Each well group will
consist of a shallow well, a deeper weathered bedrock well, and a deep solid bedrock
well. This activity has been implemented and is discussed in Section 2.

Section 1 Introduction
1-4 Q:\Priority Soils\Ground-Water-Monitoring-Summary Report\Final\gw_report_1-2012.final.docx
10. There is no ground water capture system between the end of the MSD subdrain and
the start of the hydraulic control channel (HCC). If ground water inflow between the
MSD and LAO capture systems is found to adversely affect surface water quality,
additional ground water capture and hydraulic control shall be developed and
implemented in this area. This activity has been partially implemented and is
discussed in Section 2.2.2.

2-1 Q:\Priority Soils\Ground-Water-Monitoring-Summary Report\Final\gw_report_1-2012.final.docx
Section 2 Ground Water Monitoring Activities
2.1 Ground Water Monitoring Program Implementation The first step in implementation of ground water monitoring was completion of the
Interim Comprehensive GWMP (EPA 2007). The overall goals of the GWMP were to:
Ensure that ground water capture and treatment systems are effective;
Determine that contaminated ground water is not leaving the TI Zone or discharging to
surface water to the extent that standards are violated or that protectiveness is not
achieved;
Provide additional information as necessary on the movement, quality, and quantity of
ground water to assure that ground water contamination plumes are not spreading and
ground water quality is not degrading; and
Provide data for review of the ground water remedy.
This plan identified six tasks to address the overall goals as well as the 10 requirements listed in Section 1.4:
Task 1 - Ground Water Sampling and Analysis
Task 2 - Well Installation
Task 3 - Upper MSD Pumping Test
Task 4 - Data Management
Task 5 - MSD Subdrain Load Monitoring
This section describes the status of each task.
2.1.1 Ground Water Sampling and Analysis The GWMP (EPA 2007) specified procedures, data quality objectives, locations, and a
schedule for ground water monitoring. Ground water monitoring was implemented
in 2007 with monthly water level measurements and annual ground water sampling
occurring since that time. The most recent 2010 sampling event occurred in October to
November 2010. Two Data Summary Reports (DSRs) have been submitted (Atlantic
Richfield 2009 and Atlantic Richfield 2011) and electronic data have been periodically submitted to EPA. The data summary reports include wells sampled, deviations from
the sampling and analysis plan, and analytical results. Limited analysis of the water
level data is presented in Section 3.4 and limited analysis of the water quality data is presented in Sections 3.1.1.3 and 3.1.2.4.

Section 2 Ground Water Monitoring Activities
2-2 Q:\Priority Soils\Ground-Water-Monitoring-Summary Report\Final\gw_report_1-2012.final.docx
BMFOU ground water monitoring is being conducted under a separate plan and the
analyses of the results are published in an annual report (e.g., Duaime and Tucci
2009). Additionally, analytical data are available from the authors of the annual report and online from the Ground Water Information Center (GWIC). Although the
sampling and analysis is coordinated to minimize duplication, the results have not
been effectively incorporated into analysis of ground water data for BPSOU. Some pertinent water level data from BMFOU are evaluated in Section 3.4.2 of this report.
2.1.2 Additional Well Installation Twenty-seven additional monitoring wells were installed at BPSOU between 2007 and
2010. Additional monitoring well locations are shown on Figure 2-1. The need for
additional monitoring wells at the site was presented in the GWMP. The GWMP divided the site into separate areas of interest to aid in the evaluation and
interpretation of site data and to ensure that the needs and objectives of each area of
interest are being met. The following areas of interest were established for this purpose:
Technical Impracticability (TI) Zone;
MSD capture system;
LAO capture system;
Ground water area between MSD and LAO capture systems; and
Private wells.
Each area of interest was developed with a specific purpose, described in detail in the GWMP.
The initial specific monitoring well locations and proposed construction details were
first presented in the Draft Ground Water Monitoring New Well Installation Plan (Atlantic Richfield 2007). Sixteen wells were proposed in the plan as follows:
Six wells within or just outside the TI zone;
Five wells within the MSD capture system;
Four wells between the MSD and LAO capture systems; and
One well in the Colorado Smelter repository area.
Twelve of the 16 wells were installed in December 2007. The installation details were
presented in the Draft Final Groundwater Monitoring New Well Installation Plan
Construction Completion Report (Atlantic Richfield 2008). Well BPS07-10A (Colorado
Smelter repository area) was not installed because the static water level in the monitoring
well borehole (approximately 37 feet below ground surface) was greater than 10 feet
below the bottom of the repository.

Section 2 Ground Water Monitoring Activities
2-3 Q:\Priority Soils\Ground-Water-Monitoring-Summary Report\Final\gw_report_1-2012.final.docx
Based on directions from and correspondence with EPA, 14 additional monitoring wells
were installed in early 2008. The well locations proposed by EPA and corresponding well
nomenclature are as follows:
Shallow alluvial well paired with HCA-B2 (BPS07-17A);
Nested wells by surface water station SS-07 (BPS-7- 18A/B);
Shallow well located west of pump vault in peninsula formed by confluence of
Blacktail Creek and MSD channel (BPS07-07);
Shallow well in wetlands north of confluence and north of MSD (BPS07-23);
Two shallow wells north and south of pump vault far enough away not to interfere
with construction (BPS07-20 and BPSOU-22);
Well nest adjacent to pump vault( BPS07-21 and BPSOU-21B);
New well pair south of BT98-02 to delineate TI Zone (BPS07-16A/B);
New well pair to delineate TI zone southwest of Clark Park (BPS07-05A/B); and
Wells evaluating water quality on the south side of the slag canyon (BPS07-14A and
BPS07-15A).
Installation details regarding these wells are included in the Groundwater Monitoring
New Well Installation Plan Construction Completion Reports (Atlantic Richfield
2010a and 2010b).
Four additional wells (AMC-24C, AMW-13C, BPS07-21C, and BPS07-24) were
installed in 2010 by CDM to provide additional monitoring points within the middle gravel layer.
Collectively, the additional wells add to the knowledge of the alluvial aquifer at
BPSOU and supplement the previous well network to provide additional water quality information where it was sparse or lacking. Discussion of the alluvial aquifer
is presented in Section 3.
2.1.3 Upper MSD Pumping Test The Phase I MSD pumping test was conducted between January 25 and February 10,
2010, to determine if the MSD subdrain would influence flow in the mid-level portion of the aquifer. Pumping test procedures were set forth in the Final 2010 Metro Storm
Drain (MSD) Sub-Drain Pumping Test Work Plan (Atlantic Richfield 2010h).
Independent analyses were provided by MBMG and EPA.
Monitoring well AMW-01B was utilized as the pumping well during the test. The
Phase I pumping test consisted of three steps as follows:

Section 2 Ground Water Monitoring Activities
2-4 Q:\Priority Soils\Ground-Water-Monitoring-Summary Report\Final\gw_report_1-2012.final.docx
A step-drawdown test conducted from January 25 through 27 to determine the
pumping rate needed to maintain groundwater elevation below the MSD subdrain
invert. The step-drawdown test consisted of pumping at four different pumping rates
(9, 30, 61, and 92 gallons per minute), with a total pumping time of 329 minutes.
A 73.5-hour pumping test starting on February 1, 2010, at a pumping rate of 90 gallons
per minute. The pumping rate was determined based on the step-drawdown test data.
Monitoring of groundwater recovery from February 4 through 10, 2010.
A summary of pumping test results and estimates of aquifer transmissivity were
included in the Draft Final 2010 Metro Storm Drain (MSD) Sub-Drain Pumping Test Technical Memorandum (Atlantic Richfield 2010f).
Significant conclusions included in the memorandum are as follows:
Based on well logs, the aquifer test was conducted in a permeable gravelly layer
approximately 15 feet thick underlain and overlain by less permeable materials.
Response to pumping was observed in wells not completed in the middle gravel layer
indicating some hydraulic connectivity between all layers monitored.
Aquifer storativity was found to range from 0.0003 to 0.002. These storativity values are
representative of a semi-confined to leaky confined aquifer.
The calculated transmissivity ranged from 1,793 to 24,000 square feet per day with an
average of 8,500 square feet per day. The calculated hydraulic conductivity values for
the middle portion of the aquifer ranged from 130 to 930 feet per day with an average
of 600 feet per day.
Based on poor curve matching during data analysis, transmissivity estimates for the
upper and lower portions of the aquifer were considered to be invalid.
Based on derivative analysis, the pumping test characteristics were found to be
consistent with an unconfined aquifer with delayed yield or secondary
porosity/permeability.
Prior to conducting the aquifer test, the portion of the aquifer near the Parrot tailings had been described as relatively low hydraulic conductivity and low gradient (EPA
2006). A previous aquifer test in the area indicated a hydraulic conductivity on the
order of 1 to 3 feet per day (Appendix B-7 PRP Group 2002). Due to observed contamination at depth beneath the tailings, a deep circulation flow path was
visualized with ground water eventually rising toward the ground surface in the
middle and lower reaches of the MSD (EPA 2006). The results of the aquifer test showed that the hydraulic conductivity of the aquifer in this area is significantly
higher than previously estimated.

Section 2 Ground Water Monitoring Activities
2-5 Q:\Priority Soils\Ground-Water-Monitoring-Summary Report\Final\gw_report_1-2012.final.docx
Overall, the aquifer physical characteristics and response to pumping did not
precisely match any of the numeric models evaluated during data analysis primarily
because of the lack of an aquiclude below the pumped layer. Generally, the alluvial aquifer can be described as multiple layers each having contrasting transmissivities.
All layers appear to be interconnected with evidence of delayed response.
2.1.4 Data Management Ground water data collected under the BPSOU GWMP are managed by Atlantic
Richfield, the primary data generator. The 2007 GWMP required development of a data management plan addressing the following elements:
Electronic format of data packages;
Database management;
Data accessibility;
Quality control procedures; and
Roles and responsibilities of system managers and data users.
Currently, a data management plan specific to ground water monitoring has not been approved. Data management is conducted in accordance with Clark Fork River
Standard Operating Procedures.
The largest generator of ground water data at BPSOU is Atlantic Richfield. Two
general types of data are generated: discrete data associated with sampling and
analysis and monthly manual water level measurements, and continuous data such as
water levels collected by automatic loggers. The data are evaluated for quality in accordance with standard operating procedures and entered into Microsoft Access
databases maintained by an Atlantic Richfield contractor. Data access is provided by
request from data users and production of a data package specific to the request.
Occasionally, ground water data are generated by other entities. MBMG maintains
data loggers in some wells pertinent to BMFOU and conducts discrete investigations
at the request of DEQ or Natural Resources Damage Program. Examples of recent investigations include installation of wells and ground water sample collection in the
Parrot Tailings area; collection and analysis of ground water samples for geochemical
analysis; and collection and analysis of samples from new wells installed in 2010. Data
collected by MBMG are available from the investigators or online from GWIC.
As a part of required ground water monitoring for BMFOU, MBMG collected ground
water data from select wells within BPSOU. Monitoring data are available from the investigators or online from GWIC.

Section 2 Ground Water Monitoring Activities
2-6 Q:\Priority Soils\Ground-Water-Monitoring-Summary Report\Final\gw_report_1-2012.final.docx
Currently, Atlantic Richfield and MBMG databases are maintained separately;
however, for the purposes of this report, EPA has combined selected data for analysis
as presented in Section 3.4.2.
2.1.5 MSD Subdrain Load Monitoring
The ROD requires load monitoring to ensure that the subdrain operates as expected and is not fouling or clogging. In addition, the monitoring data are to be used to
determine if the pumping rate properly matches the groundwater collection rate and
that contaminated water is not re-entering the aquifer near the pump vault. The GWMP required development of a load monitoring plan to establish procedures and
schedules for tracer tests and standard water sampling.
A load monitoring event using tracers was conducted in 2009. The results are
presented in the Draft Final Metro Storm Drain 2009 Tracer-Dilution Study Technical
Memorandum (Atlantic Richfield 2010c). In addition to tracers, load measurements
were conducted using portable flow meters and conventional sampling in 2009 and previously in 2005. Precision of measurements proved difficult to evaluate, because
water can flow into and out of the central perforated pipe and flow through the gravel
portions of the subdrain. It is not currently possible to measure the flow in the gravel. This investigation concluded that alternative methods of measuring flows and
loading would be equally effective and easier to implement than dye tracer
methodology. Dye tracer monitoring is no longer recommended.
A load monitoring plan has not been prepared to date; however, changes to the MSD
subdrain are being implemented. Cleanouts where previous sampling and flow
measurements were conducted are being removed and replaced with manholes. Manholes have been installed at two locations and included wing walls to force water
out of the gravel and to flow through the manhole where is can be measured. Future
measurements will be made at the manholes using permanent or temporary flumes or other conventional flow measurement devices. A load monitoring plan will be
prepared following further installation of manholes and evaluation of flow devices.
2.2 Ground Water Remedial Design Activities In addition to activities associated with the ground water management program, additional activities have occurred as a part of RD.
2.2.1 MSD Subdrain Isolation Study Load monitoring in the MSD subdrain determined that the lower reaches are
characterized by high ground water inflow with apparently low COC concentrations.
However, the sampling methodology lacked precision to determine how low the concentrations were in this area. If the concentrations were low enough to not
adversely affect surface water, the subdrain could be adjusted to focus on the highly
contaminated ground water and allow relatively clean ground water to remain in the aquifer. By not collecting relatively clean ground water, less capacity at the treatment
plant is used that capacity may be more useful for other purposes.

Section 2 Ground Water Monitoring Activities
2-7 Q:\Priority Soils\Ground-Water-Monitoring-Summary Report\Final\gw_report_1-2012.final.docx
To more accurately evaluate ground water concentrations and loading in the lower
MSD subdrain, a MSD subdrain pilot study was designed to determine if
groundwater collection from the lower reach of the subdrain could be purposefully limited. The Draft Final 2010 Metro Storm Drain (MSD) Sub-Drain Isolation Test Phase III
Pilot Study Work Plan (Atlantic Richfield 2010d) establishes procedures for conducting
this pilot test.
The isolation test proposed utilizing two previously installed groundwater isolation
lines extending downstream of manhole MH-MSD-108, and abandoning a similar
upstream isolation line. A plug was installed in the main MSD outlet pipe from MH-MSD-108, and the downstream flow was subsequently plugged. The upstream water
collecting in MH-MSD-108 was then pumped directly to the MSD vault via the
isolation lines.
The MSD isolation test has been completed and summary report of the MSD isolation
test results is in process.
2.2.2 Area between MSD and LAO Capture Systems Analysis of ongoing surface water monitoring data identified copper loading that
appeared to be a results of ground water inflow between the MSD capture system and the LAO capture system. Additional surface water sampling was conducted in 2008 to
verify the results and identify the location of ground water inflow. The additional
sampling identified two locations where potentially contaminated ground water appeared to be entering Silver Bow Creek: 1) within slag canyon just upstream of the
bridge from the asphalt plant and 2) just below the bridge along the slag tunnel.
Samples were collected in the seepage areas as a part of surface water monitoring. The upstream seepage was blue in color, but contained low concentrations of copper and
elevated arsenic concentrations. The lower seepage contained significantly elevated
copper concentrations and appeared to be the source of copper loading in Silver Bow Creek.
2.2.2.1 Blue Water Seep
Further investigation of the blue water seep included excavating a pit north of the slag wall (WET 2010). The excavation revealed visually identifiable tailings and a
wooden culvert penetrating the slag wall and allowing water to flow to Silver Bow
Creek. The culvert was plugged with concrete and the tailings were left in place. Because the seep sample did not contain significantly elevated metals concentrations,
the tailings did not appear to be affecting water quality measured at the blue water
seep.
2.2.2.2 Slag Tunnel Seep
The lower seepage was investigated in two phases. The first phase involved detailed
monitoring of ground water and surface water elevation and quality while manipulating ground water levels in Butte Reduction Works (BRW) north of Silver
Bow Creek. Details of the activities and results were presented in the Surface and

Section 2 Ground Water Monitoring Activities
2-8 Q:\Priority Soils\Ground-Water-Monitoring-Summary Report\Final\gw_report_1-2012.final.docx
Ground Water Manipulation Investigation Butte Reduction Works (Atlantic Richfield
2010e). This investigation concluded that reversing the ground water gradient so that
water flows away from the stream results in an improvement in surface water quality. Reestablishing a gradient toward the stream resulted in degradation of surface water
quality. Additionally, highly contaminated ground water was confirmed in the
vicinity of the slag tunnel including in the seep. In short, the investigation indicated that contaminated ground water in the BRW area seemed to be impacting surface
water quality.
2.2.2.3 BRW Test Pits
Further investigation of the slag tunnel seep was conducted by excavation of five test
pits in the BRW area. Sampling focused on areas immediately adjacent to the slag wall
and the slag and concrete tunnel where waste may have been left behind during the
LAO Expedited Response Action. Significant tailings were encountered in three of the
test pits and analyses indicated elevated concentration of arsenic, copper, lead, and
zinc (Atlantic Richfield 2010g). Additionally, ground water was encountered in the test pits and minor copper plating was observed on the bucket of the excavator
indicating significant ground water contamination. Cumulatively, these investigations
impart the following information:
Tailings containing elevated arsenic and metals are present in the BRW area.
Highly contaminated ground water is present near the tailings.
There is a relationship between the ground water gradient and surface water quality.
2.2.2.4 Extension of the LAO Capture System
Ground water monitoring program element number 10 requires additional capture and hydraulic control of ground water if contaminated ground water inflow is
identified in the area between the capture systems that adversely affects surface water
quality. As a result, a preliminary design for extension of the LAO capture system to the slag tunnel area has been prepared and approved (Atlantic Richfield 2010g).
The overall design of the extension of the capture system is to enlarge an existing
pond in BRW and excavate a new pond near the slag tunnel. The BRW ponds are below the water table and direct flow to the HCC for treatment at BTL. The ponds are
to be connected via a culvert or siphon with controls for adjustment of the ground
water level in the ponds. Based on field observations, the ponds and culvert have been installed, but construction is not fully complete. Completion and data collection
is expected to continue in 2011.
2.2.2.5 Preliminary Results
Based on information presented in a technical meeting, the new BRW ponds were
partially operational in December 2010 when a surface water base flow monitoring
event was completed. Based on this single data set, metals concentrations in Silver

Section 2 Ground Water Monitoring Activities
2-9 Q:\Priority Soils\Ground-Water-Monitoring-Summary Report\Final\gw_report_1-2012.final.docx
Bow Creek near the slag tunnel did not increase as previous data had shown. This
indicates that ground water inflow was not adversely affecting surface water during
sampling. Further operation and monitoring is ongoing.
2.2.3 Ground Water Fingerprinting
In an effort to better understand sources and fates of contamination in the MSD area, samples were collected synoptically from numerous wells and analyzed for a wide
variety of elements and constituents. The samples were collected and analyzed by
MBMG at the request of Atlantic Richfield. The data have been subjected to various geochemical and statistical models in an effort to correlate sources and downgradient
wells to develop a conceptual model of fate and transport. Currently, no reports
prepared by Atlantic Richfield have been finalized and a summary of draft reports is not appropriate at this time because of anticipated revisions. Analysis of the data by
CDM is provided in Section 3.3.3 and Appendix A.

Section 2 Ground Water Monitoring Activities
2-10 Q:\Priority Soils\Ground-Water-Monitoring-Summary Report\Final\gw_report_1-2012.final.docx
This page left intentionally blank.

3-1 Q:\Priority Soils\Ground-Water-Monitoring-Summary Report\Final\gw_report_1-2012.final.docx
Section 3 Data Analysis
Ground water data collected since 2007 has been analyzed for specific investigations such as the MSD Loading Investigation, the Upper MSD Pumping Test, and
fingerprinting. Significantly less evaluation has been conducted on the data from
ongoing ground water monitoring. The following sections present analysis of select ground water monitoring data with the intent of meeting the overall goals of the
GWMP:
Ensure that ground water capture and treatment systems are effective;
Determine that contaminated ground water is not leaving the TI Zone or discharging to
surface water to the extent that it contributes to the ground water remedy being not
protective of surface water;
Provide additional information as necessary on the movement, quality, and quantity of
ground water to assure that ground water contamination plumes are not spreading and
ground water quality is not degrading; and
Provide data for review of the ground water remedy.
The goals are evaluated in the following sections.
3.1 Effectiveness of Capture and Treatment Systems Two ground water capture systems (the MSD capture system and the LAO capture
system) and one treatment system (Butte Treatment Lagoons) are currently
operational at BPSOU.
Effectiveness of the capture systems is measured in multiple ways. The purpose of the
systems is to prevent contaminated ground water from impacting surface water
quality; therefore, the direct method of determining effectiveness is to review surface water data downstream of the capture systems.
3.1.1 MSD Capture System 3.1.1.1 Surface Water Impacts
A review of the data was presented in the 2008 Surface Water Characterization report
(EPA 2008). In the report, data were presented that indicated metals were slightly impacting surface water near the mouth of MSD, specifically at sampling station
MSD-OUT, during base flow conditions from 2005 to 2007. The impact was small and
did not significantly contribute to exceedances of RGs. During that period, the water level in the pump vault at the end of the MSD subdrain was maintained at or above
the invert of the subdrain pipe as it entered the vault. Because of this configuration it
was possible for some water to dam in the subdrain and bypass the vault.
As a part of upgrades to the pumping vault, the pumping level was changed in early
2008 to below the invert of the subdrain pipe. Monitoring data at MSD-OUT show

Section 3 Data Analysis
3-2 Q:\Priority Soils\Ground-Water-Monitoring-Summary Report\Final\gw_report_1-2012.final.docx
that cadmium and zinc concentrations have decreased significantly since 2007 (See
Figure 3-1).
Direct impacts to Silver Bow Creek near the MSD subdrain pump vault can be evaluated by evaluating increases in metals loading from surface water stations SS-04
and SS-05. Gains and losses between SS-04 and SS-05 for dissolved copper and zinc
for 2008 and 2009 are shown on Figure 3-2. Net metals loading calculations indicate that there is not a consistent gain or loss of copper or zinc between SS-04 and SS-05.
Cadmium is not detectable in base flow samples at these stations.
Two ground water methods are available to evaluate effectiveness of the MSD capture system: monitoring of COC concentrations in wells and delineation of hydraulic
capture using ground water elevations.
3.1.1.2 Hydraulic Capture Zone
As discussed in Section 2.1.1, water levels have been monitored monthly since 2007.
Impacts to surface water are more likely when the surface water is low and annual
ground water sampling occurs in the fall. To evaluate hydraulic capture, a water table map is needed. October 2010 water elevations from BPSOU were combined with
water elevation data from BMFOU and Montana Pole. All three sites use a common
elevation datum of NAVD29, but well surveys have not been coordinated and some variation in well measuring point elevations is expected. Variations are expected to be
less than 1 foot between sites.
Using only elevations from shallow wells, a site wide water table map was constructed and is presented on Figure 3-3. The water table contours for October 2010
near the MSD subdrain are shown on Figure 3-4. The contours represent equal
elevation of the water table and ground water flows perpendicular to the contours. The V-shaped contours along the subdrain clearly show that ground water is
influenced by and flows toward the subdrain. The closed contours near well BPS07-03
indicated a low area in the water table where ground water flows from all directions toward the subdrain. West of the pump vault, a ground water divide exists that marks
the limit of ground water capture. At a ground water divide, flow splits into two
directions and the water table becomes somewhat level. Demarking the actual divide is difficult because of the relatively level water table. May 2010 contours are shown on
Figure 3-5 and the divide may be near BPS07-07 and BPS07-23. Based on the same
data, the contours may be drawn somewhat differently and the divide could be placed east or west of these wells. Although the precise location of the divide is
difficult to identify, the existence of a divide indicates that a capture zone exists
around the pump vault and extends east, north, and south. Generally, it appears that the shallow ground water in the TI Zone east of the pump vault is being captured by
the MSD subdrain.
The vertical extent of the capture zone is more difficult to delineate. Well pairs and triplets near the pumping vault indicate an upward gradient. Results of the aquifer
test in the upper MSD area indicated that the aquifer is layered with all layers

Section 3 Data Analysis
3-3 Q:\Priority Soils\Ground-Water-Monitoring-Summary Report\Final\gw_report_1-2012.final.docx
connected, but having different hydraulic properties. The hydraulic properties of the
aquifer near the pumping vault have not been fully characterized and delineation of
the vertical extent of capture cannot be accurately obtained using the available data. Based on the upward gradient and interconnection of the aquifer, some ground water
beneath the subdrain is being captured, but the depth of capture is uncertain.
3.1.1.3 Ground Water Quality Monitoring
Monitoring wells near the pumping vault evaluate changes in ground water quality
and detect if contaminated water collected in the subdrain is being released back into
the ground water. Wells around the pump vault have only been sampled two to four times, so no trends can be evaluated. Dissolved metals data from October 2010 for
wells near the pump vault are shown in Table 3-1. Based on the data, well BPS07-03
located south of the subdrain is slightly elevated in cadmium, copper, and zinc, but
concentration are significantly lower than water within the subdrain measured at
cleanout 10 (MSDCL-10). Well BPS07-21A is also south of the subdrain and is slightly
elevated in zinc. The significantly lower metals concentrations in these wells than the water in the subdrain indicate that there is not a major outflow of collected water into
the aquifer south of the subdrain.
Table 3-1 Dissolved Metals in Ground Water near Pump Vault
October 2010 Well Cadmium
µg/L Copper
µg/L Zinc µg/L
Location
BPS07-03 1.1 10 216 Adjacent to subdrain near cleanout 10
BPS07-21A 0.13 0.42 432 Southwest of subdrain terminus
BPS07-22 29 322 1,840 Northwest of subdrain terminus
BPS07-07 0.23 1.8 56 Near ground water divide
BPS07-23 <0.02 0.28 29 Near ground water divide
MSDCL-10 46.5 2,380 9,460 Last sampling point in subdrain
µg/L = micrograms per Liter
Well BPS07-22 northwest of the subdrain is elevated in cadmium, copper, and zinc.
The only other sample collected from this well was in November 2009 and the metals
concentrations were significantly higher: cadmium – 878 micrograms per liter (µg/L), copper – 6,140 µg/L, and zinc – 52,700 µg/L. The significantly higher metals
concentrations in previous samples than water in the subdrain indicate a local source
of contamination. BPS07-22 is located within an area of delineated waste referred to as the Lower MSD Tailings and the metals concentrations in ground water at this well
are consistent with contamination from tailings. Based on Figure 3-5, the direction of
ground water flow from well BPS07-22 appears to be toward the subdrain.
Metals concentration in wells BPS07-07 and BPS07-23 near the ground water divide
are low indicating minimal to no impact from tailings. These wells are in an area that
is a possible pathway for flow if contaminated water were to escape the subdrain. The lack of metals contamination in the wells indicates that collected water from the
subdrain has not exited the capture system and impacted this location.

Section 3 Data Analysis
3-4 Q:\Priority Soils\Ground-Water-Monitoring-Summary Report\Final\gw_report_1-2012.final.docx
Collectively, the water quality data do not indicate a significant excursion past the
pump vault at this location. Combined with the lack of surface water impacts and the
hydraulic indication of capture, the data indicate that the MSD capture system appears be adequately preventing contaminated ground water within the TI Zone in
the MSD area from significantly impacting to surface water at this time.
3.1.2 LAO Capture System 3.1.2.1 Surface Water Impacts
A review of surface water data near the end of the LAO capture system was presented in the 2008 Surface Water Characterization report (EPA 2008). In the report, data
indicated that dissolved metals concentrations that were not attributed to a known
source were increasing from surface water station SS-06G to SS-07 during base flow
conditions from 2005 to 2007. The report suggested that the increase may be due to
dissolution of suspended metals or a ground water inflow. The impact was small but
contributed to slight exceedances of RGs for copper in surface water.
In 2010, more detailed surface water sampling was conducted in the reach from SS-0G
to SS-07.
3.1.2.2 Hydraulic Capture
The LAO capture system is comprised of the HCC that collects ground water between
BRW and the west end of the site. Ground water flows in the channel to cell D4 of the
LAO lagoon system. Cell D4 is the lowest point in the collection system and all collected water flows to the cell and is pumped to the lime treatment plant for
treatment. Cell D4 is normally operated at an elevation of 5,414 to 5,414.6 feet.
Since 2007, three new monitoring wells have been installed near the downgradient end of the LAO capture system. Additionally, monthly water level measurements
have been collected since late 2007. To determine if hydraulic capture is occurring in
LAO, select water elevation data were compiled and plotted. To evaluate the water table and the general direction of ground water flow at the water table, water
elevations from shallow wells, ponds, the HCC, and Silver Bow Creek were selected
for contouring. A range of conditions was evaluated including low water table in winter and high water table in spring and conditions in between during fall of 2010.
Water table elevations were designated by assuming wells as points, ponds as equal
elevation surfaces, and the HCC as a line with elevations interpolated between stage
locations. Stage locations in Silver Bow Creek were assumed to represent the water
table and were used as points. Contours were generated using the 3D Analyst
package of ArcView followed by smoothing. The most complete data sets were May and October 2010. The highest water table conditions generally occur May to July, so
May is representative of a high water table. October 2010 is representative of base
conditions occurring the rest of the year.
Contours for May 2010 in LAO are shown on Figure 3-6. Water table contours for
October 2010 are shown on Figure 3-7. In the east half of LAO, water table elevation

Section 3 Data Analysis
3-5 Q:\Priority Soils\Ground-Water-Monitoring-Summary Report\Final\gw_report_1-2012.final.docx
contours generally indicate that ground water flows toward the HCC. The contours
cross the meandering Silver Bow Creek suggesting that the stream has less influence
on water table contours than does the HCC.
In the eastern portion of LAO generally near the slag canyon, water table contours
appear to be influenced by Silver Bow Creek between SS-05 and SS-05A. The HCC
does not extend to this area and the V-shaped bends in the water table contours suggest that the Silver Bow Creek channel affects the water table in this area.
South of LAO, the Montana Pole capture systems influence the water table indicating
groundwater is collected, treated, and discharged to surface water.
Around the treatment lagoons, the direction of ground water flow is less clear. The
nine treatment ponds (A-1, A-2, A-3, B-1, B-2, B3, C-1, C-2, and C-3) are unlined and
have a surface elevation higher that the adjacent HCC. Additional collection ponds (D2 and D3) are also maintained with a surface elevation below the adjacent
treatment ponds and Silver Bow Creek. The water table maps assume that the water
surface in the unlined ponds equals the water table elevation. As a result, ground water contours are strongly controlled by the edges of the ponds. Detailed water table
maps near cell D4 for May and October 2010 are shown on Figure 3-8 and Figure 3-9,
respectively.
Under high water table conditions in May 2010, cell D4, with an elevation of 5,414.54
feet is a low point in the area and it is surrounded by a 5,415-foot contour (see Figure
3-8). The Ranchland Packing pond west of cell D4 is significantly higher than the surrounding wells and HCC, and exerts considerable control over the water table and
direction of ground water flow. Other ponds are also present with similar elevation,
but none are monitored. Because cell D4 represents a low point and Silver Bow Creek at and downstream of SS-07 is also a low point, a ground water divide exists between
these locations. The ground water divide is generally in the area shown by well
BMW-03A and the end of the HCC shown as a purple line on Figure 3-8. Northeast of this divide ground water is captured by cell D4 and southwest of this divide ground
water flows to Silver Bow Creek. Based on the water table contours for May 2010, cell
D4 captures the vast majority of shallow ground water in this area during annual high water conditions. Vertical capture is discussed in Section 3.1.2.3.
Water table contours for October 2010 at relatively low water conditions are presented
on Figure 3-9. Similar to May 2010 conditions, cell D4 represents a low area as does
Silver Bow Creek at and below SS-07. The resulting ground water divide is again
located near BMW-03A and the end of the HCC. The Ranchland Packing pond
remains higher than the surrounding wells and controls ground water flow west of the HCC. Based on the water table contours for October 2010, cell D4 captures the vast
majority of shallow ground water in this area during moderately low water
conditions.

Section 3 Data Analysis
3-6 Q:\Priority Soils\Ground-Water-Monitoring-Summary Report\Final\gw_report_1-2012.final.docx
Lowest water conditions occur in January to February. Water table contours from
January 2010 are shown on Figure 3-10. Because of cold weather, several wells and
ponds were frozen reducing the data available for contouring. As a result, the divide between cell D4 and Silver Bow Creek is less well-defined. Cell D4 still represents a
low point and ground water capture is evident, but the data are less definitive than in
Figure 3-8 and Figure 3-9.
Cross-sections of water table measurements made in 2010 are shown on Figure 3-11.
The cross-sections include shallow wells BPS07-17A and BPS07-18A as the left (west)
end and cell D4 as the right (east) end. The upper cross-section passes through the HCC at point HCC-7 while the lower cross-section passes through well BMW-03A.
Both sections indicate a ground water divide between BPS07-18A and cell D4.
3.1.2.3 Vertical Ground Water Potential
Wells completed below the water table near cell D4 range in depth from 35 to 196 feet
and are completed in bedrock. Ground water elevation in bedrock wells less than 100
feet deep for October 2010 is shown on Figure 3-12. Significantly less data are available than for the water table, so the bedrock aquifer potentiometric surface is not
contoured. For October 2010, wells BMW-04B, BMW-03B, HCA-B1, and HCA-B2 have
a similar water level elevation, indicating that the potentiometric surface between these wells is fairly flat resulting in little horizontal flow. Well BMW-04B, adjacent to
cell D4, has the lowest potentiometric elevation of the bedrock wells. All the bedrock
wells have a higher potential than cell D4 indicating that an upward gradient exists in this area.
Bedrock water levels for May 2010 are shown on Figure 3-13. Conditions are similar
with wells BMW-04B, BMW-03B, and HCA-B2 having a similar water level elevation. Again, cell D4 is lower indicating an upward gradient.
3.1.2.4 Ground Water Monitoring
Dissolved metals concentrations for October 2010 are shown in Table 3-12. All wells except for BPSOU07-18A, BMW-03A, and BMW-03B are contaminated with at least
one exceedance of ground water RGs shown as bolded in the table. Since an RAO is to
prevent ground water discharge that would lead to violations of surface water ARARs, surface water standards are relevant at this location. Exceedances of surface
water standards are shown as underlined in the table. The relevant surface water
standard is the chronic aquatic life standard. All wells except BMW-03B exceeded the chronic aquatic life standard for zinc.

Section 3 Data Analysis
3-7 Q:\Priority Soils\Ground-Water-Monitoring-Summary Report\Final\gw_report_1-2012.final.docx
Table 3-2 Ground Water Quality in Wells near Cell D4
Well Screen
(feet)
Cadmium (µg/L)
Copper (µg/L)
Zinc (µg/L)
Water Table Wells
NW-03 9-14 8.14 81.5 240
GS-26 9-14 27.9 2090 9800
BPS07-17A 8-18 17.7 105 5280
BPS07-18A 8-18 3.5 12 1570
BMW-03A 14-19 <0.032 1.02 793
Bedrock Wells
HCAB-02 25-35 <0.023 1.41 1870
BPS07-18B 29-39 0.053 3.18 6930
HCAB-01 40-50 58.2 1260 25700
BMW-06B 59-79 80.4 4410 24800
BMW-03B 36-50 0.191 2.48 38.2
Bold = Exceedance of ground water RG. Underlined = Exceedance of surface water standard.
µg/L = micrograms per Liter.
Ground water quality at the west end of LAO has historically been poor and the
monitoring results shown in Table 3-2 are typical. The purpose of the LAO ground
water capture system is to prevent contaminated ground water from leaving the site and impacting surface water. Assuming that the ground water divide shown on
Figure 3-8 represents the limit of ground water capture, wells BPS07-18A and BPS07-
18B are likely to represent quality of ground water not captured. Except for zinc, ground water quality at these wells meets ground water RGs.
Cadmium, copper, and zinc data from 2007 to 2010 for shallow wells in the cell D4
area are shown on Figure 3-14, Figure 3-15, and Figure 3-16, respectively. There is some variability in the results, but no trends are obvious. Cadmium, copper, and zinc
data for the bedrock wells near cell D4 are shown on Figure 3-17, Figure 3-18, and
Figure 3-19, respectively. Again, no trends are obvious. Although only 4 years of data were used, the time-series plots indicate that ground water quality around cell D4 is
not changing significantly.
3.2 TI Zone Perimeter Monitoring The alluvial aquifer TI zone was established in the BPSOU ROD as shown on Figure 2-1and Figure 3-3. The perimeter was based on limited data and additional wells were
drilled in 2007 and 2008 to better define the boundary. New wells included BPS07-
01A, BPS07-01B, BT-98-02B, and AMW-13B. Following sampling of these and exiting wells BT-98-2 and AMW-13 in 2007, it was discovered that well BT-98-02 slightly
exceeded the ROD performance standards for cadmium and zinc (see Table 3-3). To
more accurately define the TI zone boundary, additional wells were drilled including BPS07-16a, BPS07-16B, BPS07-05A, and BPS07-05B south of the ROD TI Zone
boundary. The new wells do not exceed ROD performance standards and were
included as TI Zone perimeter monitoring wells.

Section 3 Data Analysis
3-8 Q:\Priority Soils\Ground-Water-Monitoring-Summary Report\Final\gw_report_1-2012.final.docx
In accordance with the 2007 BPSOU Interim Ground Water Monitoring Plan, TI Zone
perimeter wells have been sampled annually in the fall since 2007. Data for the five
COCs with ROD performance standards are shown in Table 3-3. No exceedances of standards have occurred for the four sampling events shown. Because only four
annual events have been completed, no trend evaluation has been completed at this
time.
MBMG has sampled some of the TI Zone boundary wells for purposes other than
compliance monitoring. The data are included in Table 3-3 and show no exceedances
of performance standards.
Based on the additional data collected since the ROD was prepared, the southern limit
of the TI zone near wells BT-98-02 and BPS07-16A has changed. This change is not
significant and does not represent a threat to human health or the environment. It does however indicate a change should be made to the TI Zone boundary. This
change should be reflected in a ROD modification.

Section 3 Data Analysis
3-9 Q:\Priority Soils\Ground-Water-Monitoring-Summary Report\Final\gw_report_1-2012.final.docx
Table 3-3
TI Zone Perimeter Well Monitoring Results since 2007 (µg/L) Location Date Sampled Source Arsenic Cadmium Copper Mercury Lead Zinc
AMW-13 12/21/2007 AR 0.435 2.85 11.8 0.01449
0.045 454
AMW-13 10/2/2008 AR 2.9 2 8 0.1 0.05 610
AMW-13 11/6/2009 AR 1.9 2.4 13 0.1 0.05 225
AMW-13 4/16/2010 MBMG 6.59 0.582 3.65 NR <2.5 190
AMW-13 8/11/10 MBMG 0.70 3.58 27.80 NR <0.20 1,061
AMW-13B 12/17/2007 AR 3.44 0.177 2.43 0.243 0.086 30.8
AMW-13B 12/17/2007 AR 3.59 0.231 2.36 0.031 0.045 30.8
AMW-13B 9/4/2008 AR 3.3 0.32 1.4 0.1 0.05 32
AMW-13B 10/8/2009 AR 3.8 0.45 1.7 0.1 0.05 33.7
AMW-13B 4/16/2010 MBMG 3.28 0.253 1.24 NR <0.5 23.8
AMW-13B 8/10/2010 MBMG 3.53 0.278 1.18 NR <0.20 24.3
AMW-13C 05/28/10 AR 4.47 2.76 0.88 NR <0.055
325
AMW-13C 6/2/10 MBMG 5.00 2.56 0.97 NR <0.15 293
AMW-13C 8/10/10 MBMG 5.35 2.62 1.84 NR <0.20 287
BPS07-01A 12/19/2007 AR 3.36 0.026 2.23 0.01449
0.105 15.4
BPS07-01A 9/3/2008 AR 1.5 0.074 1.6 0.1 0.05 45
BPS07-01A 10/8/2009 AR 3.2 0.2 1.3 0.1 0.092 2.5
BPS07-01B 12/19/2007 AR 1.45 0.026 3.22 0.025 0.045 47.5
BPS07-01B 9/3/2008 AR 2.3 0.05 1.2 0.1 0.074 2.8
BPS07-01B 10/8/2009 AR 1.7 0.21 1.9 0.1 0.05 51.6
BPS07-05A 9/3/2008 AR 7.1 0.16 2 0.1 0.05 4.2
BPS07-05A 10/8/2009 AR 9.8 0.23 2.3 0.1 0.05 2.5
BPS07-05B 9/3/2008 AR 0.53 0.097 0.67 0.1 0.05 4.4
BPS07-05B 10/8/2009 AR 0.64 0.2 1 0.1 0.097 4.9
BPS07-16A 9/3/2008 AR 1.8 0.32 3 0.1 0.05 130
BPS07-16A 10/8/2009 AR 1.9 0.42 2.1 0.1 0.05 146
BPS07-16B 9/3/2008 AR 2 0.62 4.4 0.1 1.4 27
BPS07-16B 10/8/2009 AR 1.5 0.53 0.52 0.1 0.05 24
ROD Standard 10 5 1300 2 15 2000
Exceedance of Standard
0 0 0 0 0 0
AR = Atlantic Richfield

Section 3 Data Analysis
3-10 Q:\Priority Soils\Ground-Water-Monitoring-Summary Report\Final\gw_report_1-2012.final.docx
Table 3-4 Former TI Zone Perimeter Well Monitoring Results
Location Date Sampled Source Arsenic Cadmium Copper Mercury Lead Zinc
BT-98-02 12/21/2007 AR 0.888 4.66 7.73 0.03 0.047 1750
BT-98-02 4/24/2008 AR 1.35 6.14 5.29 0.01449 0.591 2280
BT-98-02 4/24/2008 AR 1.75 6.2 6.76 0.01449 0.591 2350
BT-98-02 9/3/2008 AR 1 5.3 5 0.1 0.05 2200
BT-98-02 10/8/2009 AR 1.2 7 5.8 0.1 0.05 2550
BT-98-02B 1/15/2008 AR 0.723 2.33 3.43 0.01449 0.15 84.5
BT-98-02B 9/3/2008 AR 0.69 1.7 1.8 0.1 0.05 68
BT-98-02B 10/8/2009 AR 0.83 1.9 2.4 0.1 0.05 78.2
AMW-11 2/11/2011 MBMG 15.4 0.74 1.19 -- 1.04 121
ROD Standard 10 5 1300 2 15 2000
Exceedance of
Standard
0 4 0 0 0 4
3.3 Additional Information 3.3.1 Investigation of the Middle Gravel
As described in Section 2.1.2, several investigations have been conducted since completion of the ROD and a better understanding of the significance of the middle
gravel can now be described. Prior to conducting the aquifer test, the portion of the
aquifer near the Parrot tailings had been described as relatively low hydraulic conductivity and low gradient (EPA 2006). A previous aquifer test in the area
indicated a hydraulic conductivity on the order of 1 to 3 feet per day (Appendix B-7
PRP Group 2002). Due to observed contamination at depth beneath the tailings, a deep circulation flow path was visualized with ground water eventually rising
toward the ground surface in the middle and lower reaches of the MSD (EPA 2006).
Work conducted by MBMG suggested that a higher hydraulic conductivity gravel bed was present in the aquifer that may create an additional flow path with faster
contaminant travel rates.
The middle gravel was described by Metesh and Madison (2004) as follows: “The
intermediate ground-water, 40 to 60 feet below ground surface, flows through discrete layers of
gravel and sand with minor silt and clay. In the upper part of the drainage, this flow system is
dominated by a continuous layer of coarse gravel; in the lower part of the drainage, the coarse
gravel apparently grades to a fine gravel.” This was based on lithology encountered in a
line of wells from GS-41D to MSD-03. It was further described as having fairly high
concentrations of dissolved constituents.
An aquifer test was conducted in this unit in 2010. Monitoring well AMW-01B was
selected as the pumping well, because its construction was amenable for pump
installation and it was within the identified middle gravel area. A summary of the test and results are presented in Section 2.1.3. Generally, the aquifer test indicated that the

Section 3 Data Analysis
3-11 Q:\Priority Soils\Ground-Water-Monitoring-Summary Report\Final\gw_report_1-2012.final.docx
middle gravel has a high transmissivity. Additionally, boundary conditions were not
encountered demonstrating the middle gravel has significant lateral extent. Wells
completed in the alluvium deeper and shallower than the middle gravel also showed response to pumping indicating that confining layers are not continuous. Comparison
to type curves indicated that the aquifer type is leaky or multi-layer with leaky
interbeds.
Since initial identification of the middle gravel, several additional wells have been
completed in an effort to delineated the downgradient limit of the contamination
within the gravel and improve understanding of the lithology in the lower MSD area. Wells MSD-04 and MSD-05 were installed by MBMG in 2004 and 2007, wells AMC-
24B, AMW-13B, and BPS07-21B were installed by Atlantic Richfield in 2007 and 2009,
and wells AMC-24C, AMW-13C, BPS07-21C, and BPS07-24 were installed by EPA in
2010. See Figure 2-1 for well locations.
Based on these new wells, the alluvium is generally finer grained in the lower MSD
area than around the Civic Center. Identification of a gravelly layer with minor fines that correlates with the upper MSD is not readily made. Additionally, the degree of
contamination in the aquifer is significantly lower such that definition of the middle
gravel based on elevated concentrations of dissolved metals is not possible.
A cross-section of wells from the Parrot Tailings to the eastern part of LAO is shown
on Figure 3-20. Well pairs and triplets are shown where available. Because of the
variety of drilling techniques used, the sample quality and resulting lithologic descriptions are inconsistent making correlation difficult between wells. On the cross-
section, the lithology has been simplified to emphasize grain size. Well screens are
also shown on the cross-section along with zinc concentrations from October 2010. Water table and potentiometric elevations are shown in text for each well and the
water table is shown as a blue line.
Wells from GS-41D to MSD-03 were completed in the middle gravel. Screens and zinc concentrations show a general correlation between the orange lines on the cross-
section. The lithologic descriptions within this area include gravel as a major
component. GS-42D is completed deeper and gravel is not identified within the screened interval, but the zinc concentration is consistent with the middle gravel and
it responded to pumping. On this basis, GS-42 may be completed below the middle
gravel, but is apparently hydraulically connected.
The middle gravel correlates to MSD-05 based on screened depth and zinc
concentration, but gravel was not a major component of the lithology. Further
correlation to GS-09 can be made based on zinc, but the lithologic descriptions for the well are sparse. Since GS-09 is only 180 feet from MSD-05, it is expected that the
lithology is similar. The screen depth is lower than MSD-05 indicating that the
contamination is spread vertically. BPS07-24 has an appropriate screened interval and zinc concentration as well as some gravel that is sufficient to correlate it with the
middle gravel in other wells.

Section 3 Data Analysis
3-12 Q:\Priority Soils\Ground-Water-Monitoring-Summary Report\Final\gw_report_1-2012.final.docx
Wells further downgradient are not easily correlated to the middle gravel. Wells
AMC-24B, AMW-13B, and BPS087-21B are too shallow to be correlated to the bedding
of the middle gravel; however, AMC-24B contains somewhat elevated concentrations of zinc. Wells AMC-24C, AMW-13C, and BPS07-21C are completed at a more
appropriate depth for correlation to the middle gravel and coarse sand or gravel was
observed, but the contaminant correlation is lacking. The fine grained and coarser grained layers are not easily correlated between wells in this area. Based on well
depth, elevation, and zinc concentrations, it is inconclusive if any of these six wells are
completed in the middle gravel and are directly downgradient of the contaminant plume.
Vertical ground water gradients are shown on Figure 3-20. Generally, gradients are
downward around the Parrot tailings. Ground water contamination has been carried
from the shallower ground water in the tailings source area to the middle gravel as
seen in well GS-41S. Within the middle gravel, contamination from this source has
traveled as far as BPS07-24. Slight upward gradients from the middle gravel to the shallow ground water are present from wells AMW-01 to GS-09. At AMC-24, there is
an upward gradient from the deeper well (AMC-24C) to the mid-level well (AMC-
24B). Although the screened interval in AMW-024B is too shallow to be the same bedding layer as the middle gravel, the slight upward gradient and the lack of
continuity of fine grained layer allows for the possibility that the contamination in
AMC-24B may be related to that in BPS07-24.
The potentiometric surface of the middle gravel is shown on Figure 3-21. Only a few
wells are completed in the middle gravel and most are aligned on the MSD. The
limited water level data provide for contours of limited accuracy, especially at the west end of Figure 3-21. The data are too sparse to define a horizontal capture zone
for the model gravel, but the direction of flow is generally parallel to the MSD.
3.3.2 Middle Gravel Water Quality The wells completed within the middle gravel that appear to be along the axis of the
metals plume consist (from upgradient to downgradient) of the following (see geologic cross section Figure 3-20):
GS-41D (installed in 1989)
AMW-1B (2004)
MSD-1B (2004)
MSD-2B (2004)
MSD-3 (2004)
MSD-5 (2004)
GS-9 (1985)

Section 3 Data Analysis
3-13 Q:\Priority Soils\Ground-Water-Monitoring-Summary Report\Final\gw_report_1-2012.final.docx
BPS07-24 (2010)
AMC-24C (2010)
3.3.2.1 Middle Gravel - Spatial Trends
The analysis of spatial trends will be limited to the nine wells along the presumed
path of the metals plume. The analysis of spatial trends will help to identify wells that may be off of the axis of the plume or otherwise anomalous. Figure 3-22 shows the
spatial trend for the nine presumed on-axis wells for copper and zinc. The decrease in
concentrations with distance from the Parrot Tailings is consistent for wells GS-41D, AMW-1B, MSD-2B (for copper), MSD-5, GS-9, BPSO7-24, and AMC-24C. Wells MSD-3
and MSD-1B are anomalously low in that they have lower concentrations than the
next well downgradient within the series. The same anomalously low concentrations
for these two wells are consistently observed for other sampling dates and parameters
(see Figure 3-23 and Figure 3-24 for the July-August 2004 sampling event for copper
and cadmium, respectively).
MSD-3 is either off axis or MSD-5 and GS-9 has been impacted by the local Diggings
East Tailings. However, the groundwater gradient appears to be consistently upward
in the area, which would preclude the transport of shallow tailings-impacted ground waters to the deeper middle gravel zone.
3.3.2.2 Middle Gravel - Temporal Trends
On-Axis Wells
Well GS-41-D
The trend for well GS-41-D appears to be consistently upward. The spike in copper
and zinc for October 2009 appears to be anomalous. Copper concentrations appear to have increased from approximately 300,000 µg/L in 1990 to 1,110,000 µg/L for 2010,
representing a threefold increase.
Such a trend is not unexpected, given the upward trend in the shallow well (GS-41S) and the downward groundwater gradient in this area (see Figure 3-26).
Well AMW-1B
The temporal trend for well AMW-1B is shown in Figure 3-27. The trend is generally
flat, despite the relatively strong increasing trend for well GS-41D.
Well MSD-1B (possibly off axis)
Unlike wells GS-41D and AMW-1B, the trend for AMW-1B is clearly downward. Unfortunately, the well was not installed until 2004 (about the same time the MSD
subdrain was installed), so it is unclear if the trend was caused by the changes in
groundwater flow vectors initiated when the subdrain was brought on line. The fact that the well may be off axis is another possible explanation for the downward trend.

Section 3 Data Analysis
3-14 Q:\Priority Soils\Ground-Water-Monitoring-Summary Report\Final\gw_report_1-2012.final.docx
Well MSD-2B
The temporal trend for well MSD-2B is shown in Figure 3-29.
Neglecting the anomalously low point in May 2006, the trend is fairly flat. However, with the degree of variability in the data and the relatively recent installation of the
well it is difficult to be sure.
Well MSD-3 (possibly off axis)
The temporal trend for well MSD-3 is shown in Figure 3-30.
The trends for MSD-3 are cyclical with both upward and downward trends since
2004. The cycles do not appear to be seasonal, as the times of the year when the highs
and lows occurred were not consistent. However, as the trend appears to be regular
(as opposed to an irregular and variable pattern dominated by alternating high and
low spikes), the variations in concentration appear to have a specific cause, such as differences in precipitation in the recharge area (presumably the Parrot complex).
Well MSD-5
The trend plot for well MSD-5 is presented in Figure 3-31.
The trends for copper, zinc, and cadmium appear to be flat from 2004 through 2010.
Cadmium was added to identify possible impacts from the Diggings East Tailings,
which have a relatively high cadmium concentration compared to the Parrot metals
plume. The variations for MSD-5 are not regular and are more “spikey” in nature,
with no evidence of a seasonal trend.
Well GS-9
The trend plot for well GS-9 is presented in Figure 3-32.
The trends for copper, zinc, and cadmium, appear to be generally upward, although it
is difficult to tell with the large gap in data between the late 1980s and 2004. There also appears to a seasonal trend in the data with highs in the summer and lows in the
winter, which is unusual for a deep well. Interestingly, the same peaks occur, but in a
more pronounced fashion, in well GS-11, which is the shallow well in the GS-11/GS-9/GS-8 triplet (Figure 3-33).
The final two wells in the series (AMC-13 and BPS07-24) were not installed until 2010,
have too few data points to plot a trend, and are not considered in the temporal analysis.
3.3.3 Geochemical Fingerprinting “Fingerprinting” is a process where information is derived from an evaluation of the
chemical analyses for the waters at a site with the goal of deriving information about

Section 3 Data Analysis
3-15 Q:\Priority Soils\Ground-Water-Monitoring-Summary Report\Final\gw_report_1-2012.final.docx
the sources of waters or the geochemical processes that are occurring. CDM
performed a fingerprinting analysis using a different statistical approach from that
employed by Atlantic Richfield (Appendix C of their September 2010 Draft Technical
Memorandum Groundwater/Surface Water Conceptual Site Model, prepared by
Formation Environmental). CDM used cluster analysis to group the ground waters and
surface waters, while Atlantic Richfield used factor analysis and discriminant function analysis. A more detailed discussion of the fingerprinting analysis is provided in
Appendix A, while a summary of the groupings is provided below.
Table 3-5 Summary of Cluster Analysis Groupings using April and August 2010
Data
Group Description Signature
1 Parrot wells, middle gravel wells near the Parrot, and the upper MSD subdrain
Very high in metals, low pH, very low alkalinity, and low molybdenum.
2 Surface water, BRW seep, lower MSD subdrain, and some visitor center and slag canyon area wells
Low in most constituents except molybdenum, which is comparatively high.
3 Lower middle gravel wells, North Side tailings, and Diggings East tailings wells
High calcium, sulfate, sodium, REDOX, copper, zinc, cadmium, and nickel. Very high strontium and moderate pH. Iron is low.
4 East Ridge wells, and wells between the East Ridge and the Parrot tailings.
High aluminum, REDOX, copper, cobalt, and cadmium. Low molybdenum, magnesium, and strontium.
5 Basin Creek/Blacktail Creek wells and miscellaneous wells from across the site
High alkalinity, zinc, molybdenum, and iron. Other metals and REDOX are moderate.
6 Summit Valley wells High alkalinity, pH, and iron. Low REDOX.
The results are very similar to those obtained by Atlantic Richfield. Group 1 is similar
to the “Parrot” group, Group 2 is similar to “Neutralized,” Group 3 is similar to “2nd
Tailings,” Group 4 is similar to “East Ridge,” and Group 6 is similar to “Summit Valley.” Group 5 is a less definitive group, as the cluster is joined at a much greater
distance than the other groups. Geographically, Group 5 locations are all across the
site and can probably most accurately be described as samples that do not fit into the other groups for one reason or another. The fact that the lower middle gravel wells
cluster with the North Side Tailings and Diggings East wells suggests that there is
mixing between the lower middle gravel wells and the shallower wells that have been influenced by local tailings sources. The upward groundwater gradient and the poor

Section 3 Data Analysis
3-16 Q:\Priority Soils\Ground-Water-Monitoring-Summary Report\Final\gw_report_1-2012.final.docx
seal for the GS-8/GS-9/GS-11 well cluster may also have resulted in localized vertical
mixing.
3.4 Ground Water Level Trends Ground water elevations were collected on a monthly basis during 2008 through 2010. For 2008 and 2010, the month containing the largest number of high water-level
measurements in monitoring wells was June, and the month containing the largest
number of low water-level measurements was December. A discussion of these trends related to the Parrot Tailings is included in this section.
3.4.1 Effect of Subdrain Dewatering of the MSD subdrain began in April 2003 and the system reached
equilibrium conditions in approximately January 2005. Time trend plots of ground
water elevations and vertical gradients for several well nests near the subdrain were evaluated to determine the long-term effects of the subdrain on nearby ground water
conditions. Data for the time trend plots were obtained from the GWIC database.
Time trend plots may be affected by the following limitations:
The measuring point datum for some wells is uncertain and appears to be estimated
in some cases. Therefore, the ground water elevations may be off by several tenths of
a foot in some cases and vertical gradients may be correspondingly inaccurate. However, relative changes in elevations and gradients over time can still be
evaluated.
Because of either the installation date of the wells or the lack of available data, pre-
2004 data are not available for all wells. Therefore, not all trends can be evaluated vs.
pre-startup conditions.
A summary of the time trend plots and brief discussion of trends is as follows:
GS-41-S/D (Figure 3-34): This well pair is located to the north of the MSD, near the
Parrot Tailings area. Post-startup ground water levels have remained fairly consistent
with pre-startup levels (the temporary increase of ground water elevations in the late-1990s is likely due to above average precipitation during that period). The vertical
gradient is downward and has remained relatively stable throughout the monitoring
period. Based on the data included in Figure 3-34, ground water in the area of this well pair appears to be minimally affected by the MSD subdrain.
GS-42-S/D (Figure 3-35): This well pair is located closer to the channel and to the
southeast of GS-41 S/D. A slight decline in ground water elevations and vertical gradient appear to indicate MSD subdrain capture in the area of this well nest. The
downward vertical gradient may also be an indicator that the deeper portion of the
aquifer is also being dewatered.
AMW-A/B/C (Figure 3-36): This well triplet is located to the southeast of GS-42 S/D
and near the subdrain. Ground water elevations in AMW-01A have decreased since

Section 3 Data Analysis
3-17 Q:\Priority Soils\Ground-Water-Monitoring-Summary Report\Final\gw_report_1-2012.final.docx
startup. Pre-startup data are not available for comparison of the middle (AMW-1B)
and deep (AMW-1C) wells. Post-startup vertical gradients within the well nest are
fluctuating, and neither increasing/decreasing trends nor consistent upward/downward gradients were interpreted from the available data.
GS-30 S/D (Figure 3-37): This well pair is located to the south of the MSD. Ground
water elevations in both the shallow and deep wells have declined post-startup. Vertical gradients in this well are variable. Given the relatively shallow total depth of
well GS-30D (38.5 feet below ground surface), interpretations regarding the effect of
the subdrain on the lower aquifer at this location cannot be made.
GS-8/9/11 (Figure 3-38): This well triplet is located to the south of GS-30S.
Groundwater elevations in the middle (GS-9) and deep (GS-8) wells have generally
declined post-startup. Pre-startup data for the shallow well (GS-11) were not available. There appears to be a slight upward gradient from the deeper portions of
the aquifer to the shallow portion, although there is some fluctuation in these
gradients. The gradient between the mid-level and deep well appears to be neutral and has remained fairly constant since startup.
GS-46-S/D (Figure 3-39): This well pair is located to the south and upgradient of the
MSD, and is not expected to be significantly affected by the subdrain. The well pair is included for reference as a location that may be somewhat comparable to background
conditions. Groundwater elevations and vertical gradient appear to be fairly
comparable between pre-startup and post-startup conditions, with the exception of a drop in both over approximately the last year. Additional data are needed to confirm
the cause of this drop and whether the declines represent a long-term trend.
3.4.2 Ground Water Divide in the Parrot Tailings Area It has long been recognized that a ground water divide exists near the Parrot Tailings
(e.g., Atlantic Richfield 1993 and EPA 2006). Northeast of the divide, ground water flows toward the Berkeley Pit and southwest of the divide, ground water flows along
or into the MSD subdrain. The location of the divide has most often been delineated
near GS-41s with more recent delineations centering on AMW-20 (Tucci 2010). In reviewing the data on which the ground water contours were based, there is a lack of
consistency in the well list used to delineate the ground water divide. The most
complete data set near the Parrot tailings is presented on Figure 13 of Tucci (2010) based on data collected on December 2, 2009. This map places the divide at AMW-20
and the adjacent water bodies referred to by Tucci (2010) as the Ecology Ponds. Tucci
also presents water level data showing a rise in the water table related to filling of the ponds in 2003. The map shown on Figure 3-40 uses October 2010 data from multiple
sources to contour the water table and delineate the ground water divide. This map is
similar to Tucci’s map in that AMW-20 is a high point and demarks the divide in the Parrot Tailings area. Filling of the ponds coincident with restarting of milling
operations at Montana Resources in 2003 is readily observed as a rise in the water
levels in AMW-20 (Figure 3-41 and Tucci 2010). It appears that operation of the Ecology Ponds may control the local water table.

Section 3 Data Analysis
3-18 Q:\Priority Soils\Ground-Water-Monitoring-Summary Report\Final\gw_report_1-2012.final.docx
Limited water level data for AMW-20 are not available before 2003; however, other
wells in the vicinity have a longer history. Pertinent wells that form a cross section
through the Parrot Tailings and the ground water divide include GS-42s, GS-41A, AMW-08, AMW-20, and AMC-05. Water levels in AMC-05 are significantly lower
than in the other wells in this cross section and always lie on the northeast side of the
divide. Water table elevation data collected since 1993 for the other wells along this cross-section are shown in Figure 3-41. The water table elevation is almost always
highest in well AMW-20 indicating it is near the ground water divide for the dates
when this well was measured. Wells AMW-08 and GS-41S show a lower water table than AMW-20 since 2004 indicating that they are on the southwest side of the ground
water divide while the Ecology Ponds are being used.
The ponds adjacent to AMW-20 are referred to by Duaime and Tucci (2009) as the
Emergency Ponds. In reviewing water level data for alluvial wells near the
concentrator, they said: “This pond received considerable input of fresh water prior to MR’s
start-up in the fall of 2003. The water level trend for 2003-2005 shown on figure 2-3 for this
well [AMC-5] is similar to the trend seen in 1986-1987, which coincides with the startup of
mining following ARCO’s 1983 suspension of mining. It is apparent that filling the
Emergency Pond with make-up water for milling operations has a considerable influence on
alluvial water levels in the immediate area.”
Recent operation of the MR Concentrator has occurred from 1986 to present with a
shutdown period between July 2000 and September 2003. Figure 3-41 shows that all wells were declining from 1998 to 2003, because reduced precipitation caused the
regional water table to decline. The effect of the concentrator shutdown can be seen
on Figure 3-42 as the difference in elevation between wells AMW-08 near the ponds and GS-41S southwest of the ponds. During concentrator operations before 2001 and
after 2003, the elevation difference in these wells is 0.5 to 1.2 feet. During the
suspension period, the difference between these wells decreased to around 0.1 feet. This results in a shift in the ground water divide away from AMW-20 and toward GS-
41S.
Figure 3-43 shows water levels along the cross section before (1994 to 2000), during (2001 to 2003), and after (2004 to 2010) the shutdown period. Water table elevations
before and after the shutdown period show that AMW-20 is usually higher than the
other wells indicating that the ground water divide is near or northeast of that well. During the suspension period, water levels from July 2002 and August 2003 indicate
that GS-41S is higher than AMW-08. As a result, the ground water divide is shifted
southwest of AMW-8 for these dates.
A complicating factor in evaluating water elevations in this area is the installation of
the MSD subdrain beginning in 2004. This is expected to affect wells southwest of this
cross section, but may also influence GS-42S. Comparing elevation differences from GS-42S to GS-41S before and after installation of the subdrain shows no significant
differences except when the MR Concentrator operations were suspended. This

Section 3 Data Analysis
3-19 Q:\Priority Soils\Ground-Water-Monitoring-Summary Report\Final\gw_report_1-2012.final.docx
suggests operation of the Emergency Ponds has a greater affect on the ground water
gradient near the Parrot Tailings than installation of the MSD Subdrain.

Section 3 Data Analysis
3-20 Q:\Priority Soils\Ground-Water-Monitoring-Summary Report\Final\gw_report_1-2012.final.docx
This page left intentionally blank.

4-1 Q:\Priority Soils\Ground-Water-Monitoring-Summary Report\Final\gw_report_1-2012.final.docx
Section 4 References
Atlantic Richfield. 2007. Draft Ground Water Monitoring New Well Installation Plan. Atlantic Richfield Company. Atlantic Richfield. 2008. Draft Final Groundwater Monitoring New Well Installation Plan Construction Completion Report (CCR) Atlantic Richfield Company. Atlantic Richfield. 2009. Data Summary Report Interim Ground Water Monitoring 2008. Atlantic Richfield Company. Atlantic Richfield. 2010a. Draft Final Groundwater Monitoring New Well Installation Plan Construction Completion Report (CCR) Addendum 1. Atlantic Richfield Company. Atlantic Richfield. 2010b. Draft Final Groundwater Monitoring New Well Installation Plan Construction Completion Report (CCR) Addendum 2. Atlantic Richfield Company. Atlantic Richfield. 2010c. Draft Final MSD 2009 Tracer-Dilution Study Technical Memorandum. Atlantic Richfield Company.
Atlantic Richfield. 2010d. Draft Final 2010 MSD Subdrain Isolation Test Phase III Pilot Study Work Plan.
Atlantic Richfield. 2010e. Draft Surface and Groundwater Manipulation Investigation
Butte Reduction Works, Butte Priority Soils Operable Unit.
Atlantic Richfield. 2010f. Final 2010 MSD Mid-Level Aquifer Pumping Test Technical Memorandum. Atlantic Richfield Company.
Atlantic Richfield. 2010g. Final 2009 Butte Reduction Works Slag Tunnel Test Pit
Results and Potential Remedial Actions. Prepared by Pioneer Technical Services.
Atlantic Richfield. 2010h. Final 2010 Metro Storm Drain (MSD) Sub-Drain Pumping Test Work Plan. Atlantic Richfield Company.
Atlantic Richfield. 2011. Data Summary Report Interim Ground Water Monitoring 2010. Atlantic Richfield Company.
Duaime, T.E., and Tucci, N.J. 2009. Butte Mine Flooding Operable Unit Water-Level
Monitoring and Water-Quality Sampling 2008 Consent Decree Update Butte, Montana 1982-2008. Montana Bureau of Mines and Geology Open-File Report 589.
EPA. 2006. Final Technical Memorandum Technical Impracticability Evaluation for
Alluvial Groundwater Butte Priority Soils Operable Unit, Silver Bow Creek/Butte Area NPL Site, Butte, Montana.

Section 4 References
4-2 Q:\Priority Soils\Ground-Water-Monitoring-Summary Report\Final\gw_report_1-2012.final.docx
EPA and DEQ 2006. Record of Decision, Butte Priority Soils Operable Unit, Silver Bow
Creek/Butte Area Superfund Site, Butte, Montana. Prepared by EPA in consultation
with and partial concurrence from DEQ.
EPA. 2007. Interim Comprehensive Ground Water Monitoring Plan Silver Bow Creek/Butte Area NPL Site. EPA. 2008. Final Surface Water Characterization Report. Butte Priority Soils Operable Unit. Silver Bow Creek/Butte Area Superfund Site, Butte, Montana.
Metesh, J., and Madison, J. 2004. Summary of Investigation Upper Silver Bow Creek, Butte Montana. Montana Bureau of Mines and Geology Open-File Report 507.
PRP Group. 2002. Phase II Remedial Investigation Report. Appendix B-7 Summary of
Aquifer Test Results within the Butte Priority Soils Operable Unit.
WET. 2010. Butte Reduction Works – Blue Water Seep Investigation Summary. Letter
to Rick Larson, Butte-Silver Bow Public Works Department from John Trudnowski,
Water-Environment Technologies, dated August 9, 2010.

Figures

�)
�)
�)�)
�)�)
�)�)�) !(
!(
!(!(!(!(
!(
!(!(!(
!(!(
!(
!(
!(
!(
!(!(
�)
!(
!(
!(!(
!(!( !(!(
!(!(
!(!(
�)�)
�)!(
�)
!(
�)�)
!(
�)!(
!(
!(�)
�)
�)�)�)
�)
!(�)
�)�)
�)
�)�)
�)
�)
�) �)
�)
�)
�)�)
�)�)
�)�)
�)
�)
�)�)
�)
�)
�)
�)
�)
�)�)�)
�)�)
�)�)
�)�)
�)
�)
�)�)�)�) �)�)�)
�)
�)
�)�)
�)�)
�)
�)
�)
�)�)
�)�)
!(!(
!(
!(
!(
!(
!(
�)
�)
�)�)
!(
MW-G-96
MW-H-96BPS07-10A
MW-H-96
MW-G-96
BMW-3ABMW-3B
NW-03
BMW-6BGS-26
HCAB-01HCAB-02
BMW-4B
NW-4M-1
BMW-2D
BMW-2B
BMW-2A
S-5
GS-25D
GS-25
GS-25C
CT-94-1GW-6
GS-18
GS-34S
CT-84-1
GS-17D
GS-16
GS-19
GS-13A
GS-22
GS-23
BMW-8A
GS-12
GS-20NE-2
HCA-MG-1
BMW98-4A
BMW-9A
BMW-9B
CT-98-1A
CT-98-1B
CT-98-2A
CT-98-2B
FP98-3
FP98-5
FP98-6FP98-9
FP98-1
FP98-2
FP98-4
FP98-7
FP98-8
WA-LEV-2S-02
GS-14
GS-32S
AMW-01
AMW-01B
AMW-01C
AMW-12
GS-30D
GS-30S
GS-31DGS-31S
GS-32D
GS-44D
GS-44S
MF-03
MF-07
MF-08 MF-09
MF-10
MF-11
MSD-02A
MSD-02B
MSD-03
MSD-04
BPS07-11A
BPS07-11B
BPS07-04B
BPS07-02B
BPS07-03BBPS07-04A
BPS07-02A
BPS07-03A
AMC-24B
MSD-01A
AMC-24
GS-08
GS-09
GS-11
MSD-01B
MSD-01C
GS-27D
GS-27S
AMW-13
BT98-02
BPS07-05A
BPS07-01A
BPS07-06A
BPS07-06B
BPS07-06C
GS-27C
BPS07-07A
BPS07-07B
BPS07-07C
BPS07-01B
BPS07-05B
BT98-02B
AMW-13B
BPS07-08A
BPS07-09A
BPS07-10A
BPS07-09B
BPS07-08B
GS-46D
GS-46S
GS-41S
GS-41D
GS-43S
GS-43D
AMC-12
GS-40
AMC-6
GS-28
AMW-11
MSD-02C
MSD-05
HCAB-2A BPS07-12A
B6
LegendMonitoring Well and Purpose
�) Colorado Smelter
�) Interior
�) LAO Capture System
�) MSD Capture
�) POC
�) TI Zone to SW
!( Water Levels
Figure 2-1Ground Water Monitoring Wells
Butte Priority Soils Operable Unit
Silver Bow Creek / Butte Area NPL SiteButte / Silver Bow County, Montana
´0 1,000 2,000 3,000 4,000500
Feet

0.025
0.03
0.035
5
6
7
Disso
lved C
admi
um, m
g/L
Figure 3-1Dissolved Metals at Station MSD-OUT
Dissolved Zinc Dissolved Cadmium
MSD subdrain operation withhigh water level in vault
MSD subdrain operation with lowwater level in vault
0
0.005
0.01
0.015
0.02
0
1
2
3
4
9/16/2003 9/16/2004 9/16/2005 9/16/2006 9/16/2007 9/16/2008 9/16/2009
Disso
lved C
admi
um, m
g/L
Disso
lved Z
inc, m
g/L
MSD subdrain dewatering and construction

-5
-4
-3
-2
-1
0
1
2
3
4
5
-0.15
-0.1
-0.05
0
0.05
0.1
0.15
1/1/2008 4/1/2008 7/1/2008 10/1/2008 1/1/2009 4/1/2009 7/1/2009
Zinc L
oad,
lb./d
ay
Copp
er Lo
ad, lb
./day
Figure 3-2: Gains and Losses in Silver Bow Creek between SS-04 and SS-05
CuDis Gain/Loss ZnDis Gain/Loss

Figure 3-3Alluvial Aquifer Water Table October 2010
LegendMonitoring Wells and Date Measured
BPSOU October 27-28 2010
Butte Mine Flooding October 28 2010
Montana Pole October 27 2010
Montana Pole August 31 2010
MBMG Data February 2011
Water Table Contours October 2010
MSD Subdrain
Hydraulic Control Channel
Butte Treatment Lagoons
Cell D4 Collection Area
Alluvial Aquifer TI Zone
0 1,000 2,000 3,000 4,000 5,000 6,000500Feet
Z:\
gis
\Pu
blic
\Bu
tte\W
ate
r_Ta
ble
\MX
D\W
L_
Oct
10
.mxd
Butte Priority Soil Operable Unit

#*#*#*#*#*#*#*#*#*#*#*#*#*
#*#*#*#*#*#*#*#*#*#*#*#*#*
#*#*#*#*#*#*#*#*#*#*#*#*#*
#*#*#*#*#*#*#*#*#*#*#*#*#*
#*#*#*#*#*#*#*#*#*#*#*#*#*
�)
�)
BPS07-16A
AMC-23
AMC-24
AMW-02
AMW-11
AMW-12
AMW-13
BPS07-03ABPS07-07
GS-32S
BPS07-21
BPS07-22
BPS07-23
BT-98-02
GS-11
GS-28
GS-29SR
GS-30S
GS-31S
MF-01
MF-08
MF-09
MF-10
MW2-CGSB3
MSDSG-02
SS-05
SS-04
55444444
55444433
55444422
55444411
55444400
55443399
55443388
5544 33 77
5544 3366
55444488
554444775 54 44 46 655
444455
55443377
55444477
55444466
Figure 3-4Alluvial Aquifer Water Table in Lower MSD October 2010
Legend
Water Table Elevation October 2010
Shallow Wells
�) Surface Water Stations
#* MSD Cleanout
Other wells not used in contouring
MSD Subdrain
0 250 500 750 1,000 1,250Feet
Z:\
gis
\Pu
blic
\Bu
tte\W
ate
r_Ta
ble
\MX
D\W
L_
low
erM
SD
_O
ct1
0.m
xd
´Butte Priority Soils Operable Unit

�)
BPS07-16A
AMC-23
AMC-24
AMW-02
AMW-11
AMW-12
AMW-13
BPS07-03ABPS07-07
GS-31S
BPS07-21
BPS07-22
BPS07-23
BT-98-02
GS-11
GS-28
GS-29SR
GS-30S
GS-32S
MF-01
MF-03
MF-08
MF-09
MF-10
MW2-CGSB3
MSDSG-02
SS-04
5 54 44 47 7
5 54 44 46 6
5544
4455
554444
44
55 4444 33
55 44 44 2255 44 44 1155 44 44 0055 44 33 99
55 44 33 8855443377
55444488
5544 44 77
55443388
Figure 3-5Alluvial Aquifer Water Table in Lower MSD May 2010
Legend
Water Table Elevation May 2010
Shallow Wells
�) Surface Water Stations
Other wells not used in contouring
MSD Subdrain
Butte Treatment Lagoons
0 250 500 750 1,000Feet
Z:\
gis
\Pu
blic
\Bu
tte\W
ate
r_Ta
ble
\MX
D\W
L_
low
erM
SD
_M
ay
10
.mxd
´Butte Priority Soils Operable Unit

#*#*#*
#*
#*
#*#*
#*#*
#*#*#*#*
#*
#*#*#*#*#*#*#*#*#*#*#*#*
#*#*#*#*#*#*#*#*#*#*#*#*
#*#*#*#*#*#*#*#*#*#*#*#*
#*#*#*#*#*#*#*#*#*#*#*#*
#*#*#*#*#*#*#*#*#*#*#*#*
#*#*#*#*#*#*#*#*#*#*#*#*
#*#*#*#*#*#*#*#*#*#*#*#*
�)
�)�)
�)
�)
�)
�)
�)�)�)
�)
5421.44
GW
Divide
A2 Level5422.09
D3 Level5417.34
A3 Level5420.71
D4 Level5414.54
B3 Level5422.39
C3 Level5422.44
D2 Level5419.68
A1 Level5423.52
GS-12
RLP-W
FP98-8
M-03-87BMW-01B
BMW-02ABMW-03A BPS07-08ABPS07-09A
BPS07-13A
BPS07-14A
BPS07-15A
BPS07-17ABPS07-18A
CT-84-01
CT-94-1
FP98-1
FP98-2
FP98-4
FP98-5
FP98-6
FP98-7
BMW-09A
FP98-9
GS-13A
GS-16
GS-17DR
GS-18R
GS-19
GS-20
GS-22
GS-23
GS-25
GS-26
GS-34S
GW-06R
HCA-MG1
NW-3
NW-4
S-2
S-5
SW-4 SS-05.7SS-05.9
SS-05A
SS-05
SS-07
SS-06H SS-06GR2
SS-06F
SS-06A
SS-05B
SS-06G
55 44 33 99
55 44 33 88
55 4433 77
55 4433 66
55 4433 55
55 4433 4455
44333355
443322
55 4433 1155 44 33 00
55 44 22 9955 44 22 88
55443355
55443344
55443333
55442277
55 44 44 00
55 4411 99
5544 2211554422 2255 4422 33
5544 2244
55442200
55 4411 66
55441155
55 4411 88
5544226655442255
55443355
55442288
55 44 11 88
55 44 11 77
Figure 3-6Alluvial Aquifer Water Table in LAO May 2010
Legend
Lower Area One
Water Table Elevation May 2010
Shallow Wells
Other wells not used in contouring
Montana Pole shallow wells
�) Surface Water Stations
#* Pond Stage
#* HCC Stage
Hydraulic Control Channel
Butte Treatment Lagoons
0 250 500 750 1,000 1,250 1,500Feet
Z:\
gis
\Pu
blic
\Bu
tte\W
ate
r_Ta
ble
\MX
D\W
L_
LA
O_
Ma
y10
.mx
d
´Butte Priority Soils Operable Unit
NOTE: Surface water stations shown are assumed to represent the local water table.
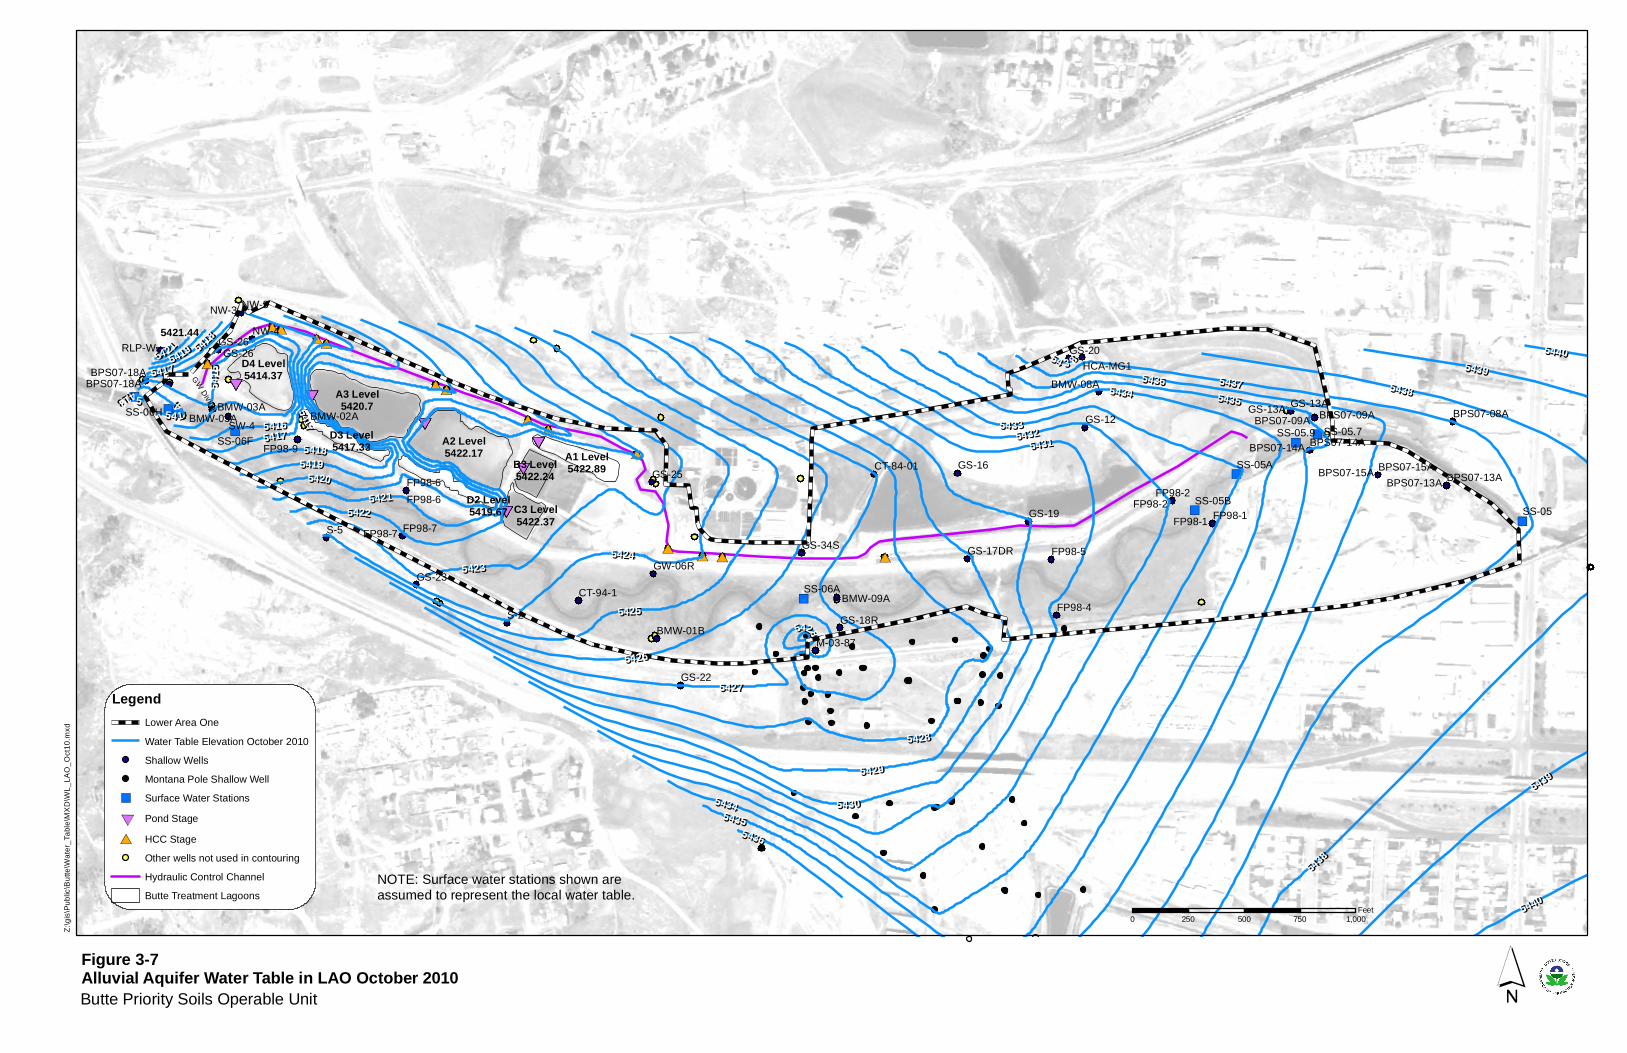
#*#*#*
#*
#*
#*#*
#*#*
#*#*#*#*
#*
#*#*#*#*#*#*#*#*#*#*#*#*
#*#*#*#*#*#*#*#*#*#*#*#*
#*#*#*#*#*#*#*#*#*#*#*#*
#*#*#*#*#*#*#*#*#*#*#*#*
#*#*#*#*#*#*#*#*#*#*#*#*
#*#*#*#*#*#*#*#*#*#*#*#*
#*#*#*#*#*#*#*#*#*#*#*#*
�)
�)�)
�)
�)
�)
�)
�)�)
�)
5421.44
GW
Divide
D3 Level5417.33
A3 Level5420.7
D4 Level5414.37
B3 Level5422.24
A1 Level5422.89
C3 Level5422.37
D2 Level5419.67
A2 Level5422.17
BMW-08A
SW-4
RLP-W
M-03-87BMW-01B
BMW-02ABMW-03A
BMW-03A
BPS07-18A
BMW-09A
BPS07-08ABPS07-09ABPS07-09A
BPS07-13ABPS07-13A
BPS07-14ABPS07-14A
BPS07-15ABPS07-15A
BPS07-18A
CT-84-01
CT-94-1
FP98-1FP98-1
FP98-2FP98-2
FP98-4
FP98-5
FP98-6
FP98-6
FP98-7FP98-7
FP98-9
GS-12GS-13A
GS-16
GS-17DR
GS-18R
GS-19
GS-20
GS-22
GS-23
GS-25
GS-26GS-26
GS-34S
GW-06R
HCA-MG1
GS-13A
NW-3NW-3
NW-4
S-2
S-5
SS-05.7SS-05.9
SS-05A
SS-06H
SS-06F
SS-06A
SS-05SS-05B
55441177
5544 33 88
55
441133
5544 22 11 5544440055 44 11 99
55 44 11
4455442288
55 44 11 88
55 44 11 77
55 443366
55 44 44 00
55443399
55443355
55 44 1177
55 44 33 99
55443344
55 441166
5544
1155
55443388
55441188
55 44 33 88
55441199
55 4422 3355442244
55 442211
554422 55
55442200
5544 22 66
55442222
5544334455443366
55443355
55 44 22 99
55 44 33 00
55 44 22 88
55443377
55 44 331155 44 33 22
5544 22 77
55 44 33 33
Figure 3-7Alluvial Aquifer Water Table in LAO October 2010
Legend
Lower Area One
Water Table Elevation October 2010
Shallow Wells
Montana Pole Shallow Well
�) Surface Water Stations
#* Pond Stage
#* HCC Stage
Other wells not used in contouring
Hydraulic Control Channel
Butte Treatment Lagoons
0 250 500 750 1,000Feet
Z:\
gis
\Pu
blic
\Bu
tte\W
ate
r_Ta
ble
\MX
D\W
L_
LA
O_
Oct
10
.mxd
´Butte Priority Soils Operable Unit
NOTE: Surface water stations shown are assumed to represent the local water table.

#*
#*
#*#*
#*
#*#*#*#*#*#*#*#*#*#*#*#*
#*#*#*#*#*#*#*#*#*#*#*#*
#*#*#*#*#*#*#*#*#*#*#*#*
�)
�)�)
�)
�)
5421.44
GW
Divide
D4 Level5414.54
A3 Level5420.71
D3 Level5417.34
NW-4
BMW-02A
BMW-03A
BPS07-17ABPS07-18A
FP98-8
FP98-9
GS-26
NW-3
S-5
SW-4
RLP-W
SS-06GSS-06GR2
SS-06H
SS-07
SS-06F
55441177
55442255
55442244
55442233
55442222
55442211
55442200
55441199
55441188
5544119955441177
55441166
55441155
5 54 42 20 05 54 41 18 8
55 44 22 11 55 44 22 00
5544 11995544 11885544 1177
55441144
55441155
55 44 11 99
Figure 3-8Alluvial Aquifer Water Table Near Cell D4 May 2010
Legend
Water Table Contours
Shallow Wells
�) Surface Water Stations with Elevations
#* Pond Stage
#* HCC Stage
Other wells not used in contouring
Hydraulic Control Channel
Butte Treatment Lagoons
0 250 500Feet
Z:\g
is\P
ublic
\But
te\W
ater
_Tab
le\M
XD
\WL_
D4_
May
10.m
xd
´Butte Priority Soils Operable Unit
NOTE: Surface water stations shown are assumed to represent the local water table.

#*
#*
#*#*
#*
#*#*#*#*#*#*#*#*#*#*#*#*
#*#*#*#*#*#*#*#*#*#*#*#*
#*#*#*#*#*#*#*#*#*#*#*#*
�)
�)
�)
�)
5421.71
GW
Divide
D4 Level5414.37
A3 Level5420.7
D3 Level5417.33
S-5
BMW-02A
BMW-03A
BPS07-17ABPS07-18A
FP98-9
GS-26
NW-3
NW-4
SW-4
RLP-W
SS-06GR2SS-06H
SS-07
SS-06F
55441177
55442244
55442233
55442222
55442211
55442200
55441199
55441188
55442211
55442200
55 441199
55 441188554411 77
55441155
55 4411 77
55441166
5544
22005 54 41 18 8
55441144
5 54 41 13 3
5544 1199
55441199
Figure 3-9Alluvial Aquifer Water Table Near Cell D4 October 2010
Legend
Water Table Contours
Shallow Wells
�) Surface Water Stations
#* Pond Stage
#* HCC Stage
Other wells not used in contouring
Hydraulic Control Channel
Butte Treatment Lagoons
0 250 500Feet
Z:\
gis
\Pu
blic
\Bu
tte\W
ate
r_Ta
ble
\MX
D\W
L_
D4
_O
ct1
0.m
xd
´Butte Priority Soils Operable Unit
NOTE: Surface water stations shown are assumed to represent the local water table.

#*
#*
#*#*
#*
#*#*#*#*#*#*#*#*#*#*#*#*
#*#*#*#*#*#*#*#*#*#*#*#*
#*#*#*#*#*#*#*#*#*#*#*#*
�)�)
�)
FrozenEst.5421
NOTES: Surface water stations shown are assumed to represent the local water table.
Critical locations were frozen during this event.
D3 - No data
FrozenG
W D
ivide
Dry
D4 Level5414.15
A3 Level5420.67
BMW-02A
BPS07-17ABPS07-18A
FP98-9
GS-26
NW-3
NW-4
S-5
SW-4
RLP-W
SS-06GSS-06GR2
SS-07 54135413
54205420
54195419
54145414
54185418
54235423
54195419
54225422
54175417
54215421
54195419
54205420
5417
5417
5 418
5 418
5416
5416
5415
5415
Figure 3-10Alluvial Aquifer Water Table Near Cell D4 January 2010
Legend
Water Table Contours October 2010
Shallow Wells
�) Surface Water Stations
#* Pond Stage
#* HCC Stage
Other wells not used in contouring
Hydraulic Control Channel
Butte Treatment Lagoons
0 250 500Feet
Z:\
gis
\Pu
blic
\Bu
tte\W
ate
r_Ta
ble
\MX
D\W
L_
D4
_Ja
n1
0.m
xd
´Butte Priority Soils Operable Unit

5413.0
5413.5
5414.0
5414.5
5415.0
5415.5
5416.0
BPS07-18A BPS07-17A HCC-07 D4
5415.5
5416.0
Figure 3-11Water Table Cross-Section through Cell D4 AreaButte Priority Soils Operable Unit
Water table elevation in feet.
5413.0
5413.5
5414.0
5414.5
5415.0
BPS07-18A BPS07-17A BMW-03A D4
1/22/2010 2/23/2010 3/30/2010 4/27/2010 5/27/2010 6/29/2010
7/27/2010 8/31/2010 9/29/2010 10/27/2010 11/30/2010 12/28/2010
BMW-03A frozen from January to April
Figure 3-11Water Table Cross-Section through Cell D4 AreaButte Priority Soils Operable Unit

#*#*#*#*#*#*#*#*#*#*#*#*
#*#*#*#*#*#*#*#*#*#*#*#*
#*#*#*#*#*#*#*#*#*#*#*#*
5421.71
D4 Level5414.37
A3 Level5420.7
D3 Level5417.33
BMW-02B5416.78
BMW-03B5415.23
BMW-04B5415.13
BMW-06B5416.99
BPS07-18B5413.81
HCA-B15415.49
HCA-B25415.22
Figure 3-12Bedrock Aquifer Potential Near Cell D4 October 2010
Legend
Bedrock Wells <100 feet deep
#* Pond Stage
Hydraulic Control Channel
Butte Treatment Lagoons
0 250 500Feet
Z:\g
is\P
ublic
\But
te\W
ater
_Tab
le\M
XD
\WL_
D4_
BR
_Oct
10.m
xd
´Butte Priority Soils Operable Unit

#*#*#*#*#*#*#*#*#*#*#*#*
#*#*#*#*#*#*#*#*#*#*#*#*
#*#*#*#*#*#*#*#*#*#*#*#*
5421.71
D4 Level5414.54
A3 Level5420.71
D3 Level5417.34
BMW-02B5416.88
BMW-03B5415.33
BMW-04B5415.25
BMW-06B5416.79
BPS07-18B5413.55
HCA-B15415.47
HCA-B25415.19
Figure 3-13Bedrock Aquifer Potential Near Cell D4 May 2010
Legend
Bedrock Wells <100 feet deep
#* Pond Stage
Hydraulic Control Channel
Butte Treatment Lagoons
0 250 500Feet
Z:\
gis
\Pu
blic
\Bu
tte\W
ate
r_Ta
ble
\MX
D\W
L_
D4
_B
R_
Ma
y10
.mxd
´Butte Priority Soils Operable Unit

25
30
35
Figure 3-14: Cadmium in Shallow Ground Water Near Cell D4GS-26 NW-3 BPS07-17A BPS07-18A BMW-03A
0
5
10
15
20
11/1/2007 10/31/2008 10/31/2009 10/31/2010
Cadm
ium µg
/L

0
500
1000
1500
2000
2500
3000
0
20
40
60
80
100
120
140
11/1/2007 10/31/2008 10/31/2009 10/31/2010
Axis T
itle
Copp
er µg
/LFigure 3-15: Copper in Shallow Ground Water Near Cell D4
NW-3 BPS07-17A BPS07-18A BMW-03A GS-26

0
2000
4000
6000
8000
10000
12000
11/1/2007 10/31/2008 10/31/2009 10/31/2010
Zinc µ
g/LFigure 3-16: Zinc in Shallow Ground Water Near Cell D4
GS-26 NW-3 BPS07-17A BPS07-18A BMW-03A

10
100
Figure 3-17: Cadmium in Bedrock Ground Water Near Cell D4HCA-B2 BPS07-18B BMW-03B HCA-B1 BMW-6B
0.01
0.1
1
10
11/1/2007 10/31/2008 10/31/2009 10/31/2010
Cadm
ium µg
/L

1000
10000
Figure 3-18: Copper in Bedrock Ground Water Near Cell D4HCA-B2 BPS07-18B BMW-03B HCA-B1 BMW-6B
1
10
100
11/1/2007 10/31/2008 10/31/2009 10/31/2010
Copp
er µg
/L

1000
10000
100000
Figure 3-19: Zinc in Bedrock Ground Water Near Cell D4HCA-B2 BPS07-18B BMW-03B HCA-B1 BMW-6B
1
10
100
1000
11/1/2007 10/31/2008 10/31/2009 10/31/2010
Zinc µ
g/L

5510 0 0 35 Alluvium 55105509 1 55095508 2 55085507 3 55075506 4 5506LegendWest
East
Figure 3-20: Geologic Cross-Section in Metro Storm Drain Area
5506 4 55065505 5 55055504 6 Rim of Berkeley Pit5503 Uncontaminated Well 7 55035502 8 55025501 Contaminated Well 9 55015500 AMW-20 10 55005499 Zinc, mg/L 11 54995498 5484 12 54985497 Jan-09 Water level and date 863 feet 13 54975496 Well F 2334 feet 14 54965495 Sandy 0 AMW-08 0 9 Slag 5451.93 15 54955494 1 5495 16 54945493 Silty, clayey 2 17 54935492 569 feet 3 18 54925491 4 19 5491
GS-41 GS-09-02
AMW-08
AMW-20
AMC-0510
LegendWest Parrot Tailings
5491 4 19 54915490 0 GS-41S 0 1.5 Topsoil 341 5 20 54905489 Gravelly 580 feet 1 5490 6 21 54895488 2 1.5 5 Silty Sand 0 GS-09-02 0 19 Fill 7 22 54885487 3 1 5488 8 23 54875486 4 2 9 9 19 No Recovery 24 54865485 Fill, may contain waste 5 5 21 Silty Sand 3 10 0 0 4 Clayey sand and gravel 25 54855484 6 4 11 1 26 54845483 Organic materials 7 5 12 2 27 54835482 8 6 13 3 28 54825481 9 7 14 4 4 9 Tailings 29 54815480 10 8 15 5 30 54805479 11 9 16 6 31 54795478 12 10 17 7 32 54785477 13 11 18 8 33 54775476 14 12 19 19 21 Slag 9 9 14 Tailings 34 5476
GS-42
AMW-20
5476 14 12 19 19 21 Slag 9 9 14 Tailings 34 54765475 15 13 20 10 35 35 85 Decomposed granite 54755474 16 14 21 21 26 Slag 11 36 54745473 17 15 22 12 37 54735472 18 16 23 13 38 54725471 472 feet 19 17 24 14 14 17 Tailings 39 54715470 0 GS-42S 0 3 Fill 20 18 25 15 40 54705469 1 5470 21 21 28 Tailings 19 19 19.5 Tailings 26 26 28 Fill 16 41 54695468 2 22 20 20 23 Organic clay 27 5459.62 17 17 20.5 Tailings 42 54685467 3 3 9 Tailings 23 21 28 28 31 No recovery 18 43 54675466 548 feet 4 24 22 29 AMW-08 19 44 54665465 0 AMW-1B 0 5 Fill - Tailings 5 25 41S 5458.98 23 23 27 Medium sand 30 20 20.5 30 Silty sand and gravel 45 54655464 1 5465 6 26 41D 5458.38 24 GS-09-02 5459.39 31 31 34 Silty Sand 21 46 54645463 2 7 27 25 32 22 47 54635462 3 AMW-1 8 28 28 34 Sandy gravel 26 GS-09-02 33 23 AMW-20 48 54625461 4 9 9 10.5 Sandy Clay 29 27 27 29 Silty Clay 34 34 35.5 Clay 24 Oct-10 49 5461BPS07-21 GS-8-9-11 GS-30 MSD-05 MSD-03 MSD-02
MSD-01
AMW-01
Diggings Tailings
Bend
in Se
ctio
n
5461 4 9 9 10.5 Sandy Clay 29 27 27 29 Silty Clay 34 34 35.5 Clay 24 Oct-10 49 54615460 583 0 MSD-1B 0 5 Black soil 5 5 10 Peat 10 30 28 35 35.5 37 Silty sand 25 50 54605459 1 5460 6 11 10.5 22 Sand 31 Oct-10 29 Dec-09 29 35 Sand and Gravel 36 Dec-09 26 51 54595458 739 feet 0 MSD-2B 0 2.5 Fill and tailings 2 7 Cu 0.019 12 GS-42S 32 GS-41S Cu 1580 30 37 37 42.5 Clay/Silt 27 52 54585457 1 5458 3 8 Zn 11.8 13 33 Zn 857 31 38 28 53 54575456 181 feet 413 feet 2 4 9 14 Oct-10 34 34 48 Silty clayey cobbly sand 32 Cu 44.6 39 Cu 8.1 29 54 54565455 0 GS-08 0 0.5 Soil 3 2.5 4.4 Clay and silt 5 MSD-1A 5 10 Sand and gravel 10 10 15 Silty Clay 15 35 33 Zn 110 40 Zn 313 30 30 36 Silty clay 55 54555454 233 feet 0 BPS07-24 0 8 Fill 660 feet 1 5455 0.5 6 Fill 0 MSD-05 0 5 Fill 0 MSD-3 0 16 Silt and clay 4 6 11 Sep-10 16 36 34 41 31 56 54545453 BPS07-21C 1 5454 2 1 5454 1 5454 5 MSA2A Unknown Screen4.4 6.2 Tailings 7 Oct-10 12 17 Cu 304 37 35 35 36 Sandy silty clay 42 42.5 43.5 No recovery 32 57 54535452 0 5452 0 14 Fill/Garbage1090 feet 2 3 2 2 6 6.2 7.5 Silt 8 13 18 Zn 197 38 36 43 43.5 44 Silty Sand 33 58 54525451 1 676 feet 3 4 3 3 7 9 14 19 39 44 44 45.5 Sandy Silt 34 Cu 10 59 54515450 2 0 MF-10 0 3 Fill 4 BPS07-24 5 4 4 8 7.5 10 Silt 10 10 15 Coarse sand 15 15 25 Very Coarse Sand 20 42S 5456.90 40 Downward 45 45.5 47.5 Clay 35 Zn 40 60 54505449 3 Oct-10 0 AMC-24 0 1.5 Sand 1 5450 5 5443.72 6 6 15 Fill 5 5 9 Clay 5 Oct-10 9 Oct-10 11 16 AMW01 5454.54 21 42D 5456.83 41 46 36 36 42 Silty sand 61 54495448 380 feet 4 BPS07-21 5438.93 1 5449 2 6 7 GS-11 6 6 10 10 10.6 Silty clay 12 Cu 2.8 17 AMW01B 5454.92 22 22 27 Sand 42 47 47.5 49.5 Silty gravelly sand 37 62 54485447 5 BPS07-21B 5438.32 2 1.5 4 Fill 3 3 16 Sand 7 8 7 7 11 10.6 12.9 Gravelly sand 13 Zn 7 18 AMW01C 5455.6 23 No vertical gradient 43 48 38 63 54475446 5444 6 BPS07-21C 5439.52 3 4 8 8 13 Black sandy clay 9 Oct-10 8 Oct-10 8 12 14 19 Upward 24 44 49 49.5 56 No recovery 39 64 54465445 MW-3A-MPC 7 4 4 28 Fine sand 5 9 10 9 9 13 Medium to coarse sand 9 13 2A 5449.84 12.9 15 Clayey sand 15 15 20 Silt and clay 20 25 45 50 40 AMW-20 5461.55 65 5445
BPS07-21
AMC-24 MF-10
GS-8-9-11 GS-30 MSD-05 MSD-03 MSD-02
GS-19
Blac
ktail
Cree
k
40
313110857197
7
BPS07-24
12
Silve
r Bow
Cree
k
Bend
in Se
ctio
n
BPS07-07GS-29
MW-3A-MPC
5445 MW-3A-MPC 7 4 4 28 Fine sand 5 9 10 9 9 13 Medium to coarse sand 9 13 2A 5449.84 12.9 15 Clayey sand 15 15 20 Silt and clay 20 25 45 50 40 AMW-20 5461.55 65 54455444 WL 5429.96 0 0 1 Fill 5442 440 feet 5442 8 5 6 MF-10 5442.98 10 Oct-10 Zn 87 11 10 10 MSD-3 5448.87 14 2B 5451.16 16 21 26 46 48 61.5 Sandy Gravel 51 41 Log of F 66 54445443 1 1 10 Black fill GS-29 BPS07-07 9 6 7 Oct-10 11 12 Cu 13.1 11 11 15 15 17.5 Clayey silt 17 MSD-1A 5453.31 22 27 27 34 Gravel 47 52 42 42 60 Coarse sand 67 54435442 2 0 0 24 Slag and fill 0 0 6 Fill 10 7 8 12 13 Zn 92.5 12 GS-30S 12 16 Upward 18 MSD-1B 5453.74 23 28 48 53 43 68 AMC-05 5437.97 54425441 418 feet 1360 feet 3 MW-3 830 feet 1 1 11 8 Oct-10 9 13 13 18 Black sand 14 13 13 23 Medium sand with silt 13 17 17.5 20 Fine sand 19 MSD-1C 5453.46 24 29 49 GS-41D 54 44 69 54415440 GS-19D 4 2 2 12 BPS07-21 9 10 14 15 15 30 Sand 14 14 18 Cu 0.18 20 20 32 Silty sand 25 25 30 Sandy silt and clay 30 50 55 45 70 54405439 0 5439 0 10 Fill 5 3 3 13 10 11 15 16 15 15 19 Zn 9.5 21 26 31 51 56 56 56.5 Sandy silty clay 46 71 54395438 1 6 4 5437.93 4 Oct-10 14 14 21 Sandy Peat 11 12 16 17 16 Cu 0.0025 16 16 18 Coarse sand and gravel 20 10 22.5 Medium sand 22 27 32 52 57 56.5 61 No recovery 47 72 Oct-10 54385437 2 7 5 Oct-10 Blacktail 5 5438.24 15 12 13 Cu 0.04 17 18 17 Zn 0.01 17 21 23 28 33 53 58 48 73 54375436 3 8 6 6 6 7 Black clay 16 13 14 Zn 9.5 18 18 21 Black clay 19 18 18 22 22.5 23.4 Medium to coarse sand 24 29 34 34 40 Clayey sand 54 59 49 74 54365435 4 9 7 7 7 10 Sand 17 14 15 19 20 GS-11 5446.54 19 19 23 23.4 24.2 Silt 25 30 30 45 Gravel and sand 35 55 60 50 75 54355434 5 10 10 18 Sand and gravel 8 8 18 Oct-10 15 16 16 18 Clay 20 21 GS-9 5446.82 20 GS-30S 5445.94 20 20 24 Silty clayey sand 24 24.2 25 Clayey sand 26 31 36 56 Cu 1052 61 61 61.5 Sandy silty clay 51 76 54345433 6 5432 11 9 9 19 16 17 21 21 28 Sand 22 GS-8 5446.16 21 GS-30D 5445.77 21 25 25 27.5 No recovery 27 32 AMW-1B 37 57 Zn 639 62 61.5 65.5 No recovery 52 77 54335432 7 12 10 10 10 12 Black silt 20 17 Cu 0.003 18 18 23 Clay sand 22 23 22 MSD-05 5446.78 22 26 28 33 38 58 63 53 78 54325431 8 13 11 11 21 21 26 Medium sand 18 Zn 0.35 19 23 24 23 Downward 23 24 Gravel 23 27 27.5 30 Medium to coarse sand 29 Upward 34 39 59 64 54 79 54315430 9 Silver Bow 14 12 12 12 13 Sand 22 19 20 24 25 24 24 27 Silt 24 24 32 Coarse sand 28 30 35 40 40 53 Clay 60 65 65.5 66 Silty gravelly sand 55 80 5430
639
7
92
10<1
<1<1<110
87
5430 9 Silver Bow 14 12 12 12 13 Sand 22 19 20 24 25 24 24 27 Silt 24 24 32 Coarse sand 28 30 35 40 40 53 Clay 60 65 65.5 66 Silty gravelly sand 55 80 54305429 10 10 20 Medium sand 15 13 13 13 15 Black silt 23 20 21 25 26 25 25 29 31 36 41 61 66 66 71 No recovery 56 81 AMC-05 54295428 11 16 No recent WL 14 14 24 21 22 26 27 26 26 30 30 36 Silt sand clay 32 32 45 Sand and gravel 37 42 67 57 82 54285427 12 17 15 15 25 22 23 27 28 27 27 28.5 Gravel 27 31 33 38 Cu 87.3 43 68 58 83 54275426 13 18 18 19 Sandy clay 16 26 26 30 Fine sand 23 28 28 34 Gravelly sand 29 28 GS-30D 28.5 32 Silt 28 32 34 39 Zn 228 44 69 59 84 54265425 14 19 19 25 Gravel 17 27 24 AMC-24 5441.16 29 30 30 36 Gravel and Sand 29 29 33 35 40 45 70 60 60 85 Coarse sand 85 85 90 Sand and gravel 54255424 15 20 18 28 25 AMC-24B 5441.08 30 31 30 30 34 MSD-2B 36 41 46 GS-42D 71 71 75 Silty sand 61 86 54245423 16 21 19 29 26 AMC-24C 5441.36 31 32 31 31 35 37 42 47 72 62 87 54235422 17 22 MW-3A 20 30 30 31 Silty sand 27 32 33 32 32 35 Coarse sand and gravel 32 32 35 Medium sand 36 36 43 Gravel 38 43 48 73 63 88 54225421 18 23 21 31 31 34 Medium to coarse sand 28 28 36 Coarse sand and gravel 33 34 33 Cu 0.0044 33 37 39 MSD-1B 44 49 74 64 89 54215420 19 24 22 32 29 Downward 34 34 39 Silt and clay 35 34 Zn 0.12 34 38 40 45 AMW-1C 45 55 Silt and clay 50 75 65 90 54205419 20 20 35 Medium to coarse 25 25 30 Sand and gravel 23 33 30 35 36 36 37 Gravel sand clay 35 35 43 Silt with sand 35 35 37 Silty clayey sand 39 41 Cu 1.6 46 51 66 Cu 11 54195418 21 26 24 24 26 Silty sand 34 BPS07-21B 34 35 Silty sand 31 36 37 Upward 37 42 Sand and Gravel 36 36 40 Cu 41.8 42 Zn 78.1 47 52 67 Zn 45 54185417 22 27 25 35 35 39 Medium sand with gravel 32 37 38 37 37 37 40 Silt and clay 41 Zn 267 43 48 53 53 58 Silty sand 68 54175416 23 28 36 33 38 39 38 38 38 Gravel stringer 38 42 44 49 54 69 54165415 24 29 37 34 39 39 44 Sand 40 39 39 MSD-3 43 43 45 Silt sand clay 45 45 55 Silty clayey gravel 50 55 Cu 99 70 5415200
228
78267<1
<1<1
<1
45<1
<1
5415 24 29 37 34 39 39 44 Sand 40 39 39 MSD-3 43 43 45 Silt sand clay 45 45 55 Silty clayey gravel 50 55 Cu 99 70 54155414 25 30 30 35 Sandy clay Note: bedrock entcountered in GS-29D 38 35 40 41 40 40 40 50 Sand and fine gravel 44 46 51 56 Zn 200 71 54145413 26 31 approx. 200 feet north at 25 feet 39 39 41 Gravel and silty sand 36 36 38 Clay 41 42 42 79 Sand and gravel interbedded clay41 41 45 47 52 HOLE MAKING 20 GPM (BUCKET AND STOPWATCH). PH=5.9, SC=2970.57 WATER AT 58' CYCLONE SAMPLE TAKEN. SC=3745 PH=5.0 72 54135412 27 32 40 37 42 43 42 Upward 42 48 53 58 58 58.5 Silt 73 54125411 28 33 41 41 49 Silty sand 38 AMC-24B 38 48 Coase sand and gravel 43 44 43 43 52 Silt and sand, some gravel 43 49 54 59 58.5 60 Gravel 74 54115410 29 34 42 39 44 44 58 Sandy silt 45 44 44 50 Downward 55 55 60 Coarse Sand 75 Ctitical WL5409 30 43 40 45 46 45 45 51 56 76 54095408 31 44 41 46 47 46 46 Cu 0.83 52 57 77 54085407 32 45 42 47 48 47 47 Zn 15.1 53 58 78 54075406 33 46 43 48 49 48 48 54 59 79 54065405 34 Bedrock 47 44 Cu 0.24 49 50 49 MSD-05 49 55 55 56 Silty clayey sand 60 60 95 Silt and clay 80 54055404 35 35 50 Waethered bedrock 48 45 Zn 2.1 50 51 50 50 50 55 Coarse sand and silt 56 56 60 Sand and gravel 61 81 54045403 36 49 49 51 Sandy silt 46 51 52 51 51 57 AT 56 FT HIT A SAND AND GRAVEL LAYER MAKING ABOUT 60 GPM. SC=3240, PH=5.05. 56-60 VERY COARSE SAND WITH LESS THAN 5% SILT AND CLAY.62 82 54035402 37 50 47 52 53 52 52 55 Coarse sand 52 58 63 83 54025401 38 51 51 54 Silty sand 48 48 52 Clay 53 54 53 Cu 11.4 53 59 64 84 54015400 39 52 49 54 55 54 Zn 42.5 54 60 60 65 Sand 65 85 85 90 Clay 5400
200
15
422
0.2
5400 39 52 49 54 55 54 Zn 42.5 54 60 60 65 Sand 65 85 85 90 Clay 54005399 40 53 50 55 56 55 55 55 60 Clayey silty sand 61 66 86 53995398 41 54 54 59 Silty sand with gravel 51 56 57 56 62 67 87 53985397 42 55 52 52 54 Coarse sand 57 58 57 63 68 88 53975396 43 56 53 58 58 64 Sand 59 GS-09 58 64 69 89 53965395 44 57 54 54 63.5 From AMC-24c 59 60 59 65 65 75 Medium sand 70 90 90 95 Coarse sand 53955394 45 58 55 Sand with silt 60 61 60 60 70 Medium to coarse sand 66 71 91 53945393 46 59 59 64 Silt with sand interbeds 56 Upward 61 Cu 0.8 62 61 67 72 92 53935392 47 60 57 62 Zn 5.4 63 62 68 73 93 53925391 48 61 58 63 64 63 69 74 94 53915390 49 62 59 64 64 65 Sand with gravel 65 64 70 75 95 95 115 Red monzonite 53905389 50 50 150 Less weathered 63 60 65 65 67 Silty sand 66 Cu 8.8 65 71 76 96 53895388 51 64 64 65 Sand 61 66 67 Zn 38.5 66 72 77 97 53885387 52 65 BPS07-21C 65 66 Silty sand 62 67 67 69 Fine sand 68 67 73 78 Upward 98 53875386 53 66 66 68 Gravel and sand 63 63.5 64 Medium to coarse sand wet 68 69 68 74 79 99 53865385 54 67 64 64 74 Sand trace silt 69 69 70 Silt 70 69 75 75 85 Gravel and sand 80 100 5385
42
39
5
5385 54 67 64 64 74 Sand trace silt 69 69 70 Silt 70 69 75 75 85 Gravel and sand 80 100 53855384 55 68 68 69 Silty sand 65 70 70 71 Sand 71 70 70 77 Silt and Clay 76 81 101 53845383 56 69 69 79.5 Medium sand 66 71 72 71 77 82 102 53835382 57 70 67 72 73 72 78 83 103 53825381 58 71 68 AMC-24C 73 74 73 79 84 104 53815380 59 72 Cu 0.0005 69 75 74 80 85 105 53805379 60 73 Zn 0.2 70 76 75 81 86 106 53795378 61 74 71 77 76 82 87 107 53785377 62 75 72 78 77 83 88 108 53775376 63 76 73 79 79 80 Sand and gravel 84 89 109 53765375 64 77 74 74 76.5 Coarse sand 80 80 97 Sand 85 85 100 Silt and clay 90 110 53755374 65 78 75 Cu 0.05 81 86 91 111 53745373 66 79 76 Zn 0.5 82 87 92 Cu 4.6 112 53735372 67 80 79.5 81 Silt 77 83 88 93 Zn 25.3 113 53725371 68 81 81 83 Medium sand 78 76.5 80 sand with silt 84 89 94 114 53715370 69 82 79 85 Downward 90 95 95 100 Coarse Sand 115 115 125 Red and brown monzonite 53705369 70 83 83 89 Silty sand 80 80 80.5 Coase sand and gravel 86 91 96 116 536925
0.5
.3
5369 70 83 83 89 Silty sand 80 80 80.5 Coase sand and gravel 86 91 96 116 53695368 71 84 81 81 82 Sand 87 92 97 117 53685367 72 85 82 88 93 98 118 53675366 73 86 83 89 94 99 119 53665365 74 87 84 84 85.5 Silty clay 90 95 100 100 105 Silt and clay 120 53655364 75 88 85 91 96 101 121 53645363 76 89 89 91 Silt 86 86 87.5 Silty sand 92 97 102 122 53635362 77 90 87 93 98 103 123 53625361 78 91 88 94 99 104 124 53615360 79 95 100 100 105 Silty clayey sand 105 125 125 130 Red clay 53605359 80 96 101 126 53595358 81 97 97 100 Clay 102 127 53585357 82 98 103 128 53575356 83 99 104 129 53565355 84 100 100 110 Sand clayey 105 105 112 Silt and clay 130 130 135 Red monzonite 53555354 85 101 106 135 150 Orange brown clay 5354
25
5354 85 101 106 135 150 Orange brown clay 53545353 86 102 107 150 160 Red brown monzonite 53535352 87 103 108 160 185 Brown monzonite 53525351 88 104 109 MSD-01C 185 205 Dark brown monzonite 53515350 89 105 110 205 230 Greenish brown clay 53505349 90 106 111 230 247 Brown monzonite 53495348 91 107 112 112 116 Coarse sand 247 308 Brown and greenish clay 53485347 92 108 113 308 335 Gray monzonite 53475346 93 109 114 Cu 0.477 335 520 Gray monzonite 53465345 94 110 110 134 Sand and clay 115 Zn 20 520 525 Gray clay 53455344 95 111 116 525 530 Gray monzonite 53445343 96 112 530 535 Dark gray monzonite 53435342 97 113 535 555 Gray monzonite 53425341 98 114 555 570 Gray monzonite 53415340 99 115 570 575 Light gray monzonite 53405339 100 116 575 651 Gray monzonite 5339
20
5339 100 116 575 651 Gray monzonite 53395338 101 117 53385337 102 118 53375336 103 119 614 634 Screen 53365335 104 120 53355334 105 121 53345333 106 122 53335332 107 123 53325331 108 124 53315330 109 125 53305329 110 126 GS-08 53295328 111 127 53285327 112 128 53275326 113 129 53265325 114 130 53255324 115 131 53245324 115 131 53245323 116 132 53235322 117 133 53225321 118 134 134 135 Clay 53215320 119 135 135 148 Sand and clay 53205319 120 136 53195318 121 137 53185317 122 138 53175316 123 139 Cu 0.017 53165315 124 140 Zn 0.49 53155314 125 141 53145313 126 142 53135312 127 143 53125311 128 144 53115310 129 145 53105309 130 146 53095308 131 147 5308
<1
5308 131 147 53085307 132 148 148 151 Clay 53075306 133 149 53065305 134 150 53055304 135 151 53045303 136 53035302 137 53025301 138 53015300 139 53005299 140 52995298 141 52985297 142 52975296 143 52965295 144 52955294 145 52945293 146 52935293 146 52935292 147 52925291 148 52915290 149 52905289 150 150 200 Hard granite 52895288 151 52885287 152 52875286 153 52865285 154 52855284 155 52845283 156 52835282 157 52825281 158 52815280 159 52805279 160 52795278 161 52785278 161 52785277 162 52775276 163 52765275 164 52755274 165 52745273 166 52735272 167 52725271 168 52715270 169 52705269 170 52695268 171 52685267 172 52675266 173 52665265 174 52655264 175 52645263 176 52635263 176 52635262 177 52625261 178 52615260 179 52605259 180 52595258 181 52585257 182 52575256 183 52565255 184 52555254 185 52545253 186 52535252 187 52525251 188 52515250 189 52505249 190 52495248 191 5248
<1
5248 191 52485247 192 52475246 193 52465245 194 52455244 195 52445243 196 52435242 197 52425241 198 52415240 199 52405239 200 52395238 52385237 5237
Figure 3-20: Geologic Cross-Section in Metro Storm Drain Area

Parrot Tailings Area
MSD-01B5453.74
AMC-135456.15
AMW-01B5454.79
BPS07-05B5449.67
GS-095446.82
GS-41D5458.38
GS-42D5456.83
GS-44DR5457.38
GS-46D5460.78
MSD-02B5451.16
MSD-035448.87
MSD-045450.18
MSD-055446.78
AMW-13C5440.14
BPS07-21C5439.52
BPS07-245443.72
AMC-24C5441.36
5459
5458
54575456545554545453545254515450
5442
5441
5440
5443
5444
5446
5447
5448
5449
5445
5460
Figure 3-21Middle Gravel Potentiometric Surface October 2010
Legend
Potentiometric Contours in Middle Gravel 1 ft.
MSD Subdrain
Water Table Contours 1 ft.
TI Zone
Middle Gravel Wells and Static Water Elevation
Butte Priority Soils Operable Unit
Z:\
gis\
Pub
lic\B
utte
\Wat
er_T
able
\MX
D\W
L_F
all1
0_m
iddl
egra
vel.m
xd
´
0 500 1,000 1,500 2,000250Feet

Butte Priority Soils Operable Unit
0
200
400
600
800
1000
1200
GS-41D AMW-1B MSD-1B MSD-2B MSD-3 MSD-5 GS-9 BPS07-24 AMC-24C
Cu or
Zn Co
ncen
tratio
n (mg
/L)
Well ID
Figure 3-22: Spatial Trends for Copper and Zinc within Selected Middle Gravel Wells
Cu
Zn

Butte Priority Soils Operable Unit
0
10000
20000
30000
40000
50000
60000
70000
80000
90000
AMW-1B MSD-1B MSD-2B MSD-3 MSD-5 GS-9
Copp
er, µg
/LFigure 3-23: Spatial Trends for Copper within Selected Middle Gravel
Wells (Jul-August 2004)

Butte Priority Soils Operable Unit
0
200
400
600
800
1000
1200
1400
AMW-1B MSD-1B MSD-2B MSD-3 MSD-5 GS-9
Cadm
ium, µ
g/LFigure 3-24: Spatial Trends for Cadmium within Selected Middle Gravel
Wells (July - August 2004)

Butte Priority Soils Operable Unit
0
200000
400000
600000
800000
1000000
1200000
1400000
0
500000
1000000
1500000
2000000
2500000
1/1/1982 1/1/1986 1/1/1990 1/1/1994 1/1/1998 1/1/2002 1/1/2006 1/1/2010
Zinc µ
g/L
Copp
er µg
/LFigure 3-25: Temporal Trends for Copper and Zinc within GS-41D
CuDis ZnDis

600000
700000
800000
900000
1000000
1000000
1200000
1400000
1600000
1800000
Figure 3-26: Temporal Trends for Copper and Zinc within Well GS-41SCuDis ZnDis
Butte Priority Soils Operable Unit
0
100000
200000
300000
400000
500000
0
200000
400000
600000
800000
1000000
1/1/1982 1/1/1986 1/1/1990 1/1/1994 1/1/1998 1/1/2002 1/1/2006 1/1/2010
Zinc µ
g/L
Copp
er µg
/L

Butte Priority Soils Operable Unit
0
50000
100000
150000
200000
250000
300000
0
20000
40000
60000
80000
100000
120000
1/1/1982 1/1/1986 1/1/1990 1/1/1994 1/1/1998 1/1/2002 1/1/2006 1/1/2010
Zinc µ
g/L
Copp
er µg
/LFigure 3-27: Temporal Trends for Copper and Zinc within Well AMW-01B
CuDis ZnDis

Butte Priority Soils Operable Unit
0
50000
100000
150000
200000
250000
0
500
1000
1500
2000
2500
3000
3500
4000
4500
1/1/1982 1/1/1986 1/1/1990 1/1/1994 1/1/1998 1/1/2002 1/1/2006 1/1/2010
Zinc µ
g/L
Copp
er µg
/LFigure 3-28: Temporal Trends for Copper and Zinc within Well MSD-01B
CuDis ZnDis

Butte Priority Soils Operable Unit
0
50000
100000
150000
200000
250000
300000
0
5000
10000
15000
20000
25000
30000
35000
40000
45000
50000
1/1/1982 1/1/1986 1/1/1990 1/1/1994 1/1/1998 1/1/2002 1/1/2006 1/1/2010
Zinc µ
g/L
Copp
er µg
/LFigure 3-29: Temporal Trend for Copper and Zinc within Well MSD-02B
CuDis ZnDis

Butte Priority Soils Operable Unit
0
5000
10000
15000
20000
25000
30000
0
500
1000
1500
2000
2500
1/1/1982 1/1/1986 1/1/1990 1/1/1994 1/1/1998 1/1/2002 1/1/2006 1/1/2010
Zinc µ
g/L
Copp
er µg
/LFigure 3-30: Temporal Trends for Copper and Zinc within Well MSD-03
CuDis ZnDis
May
May
JulyApril
December
July
September
October
AprilOctober

Butte Priority Soils Operable Unit
0
5000
10000
15000
20000
25000
30000
35000
40000
45000
50000
0
20
40
60
80
100
120
140
160
1/1/1982 1/1/1986 1/1/1990 1/1/1994 1/1/1998 1/1/2002 1/1/2006 1/1/2010
Copp
er or
Zinc µ
g/L
Cadm
ium µg
/LFigure 3-31: Temporal Trends for Copper and Zinc within Well MSD-05
CdDis CuDis ZnDis
December
December
AugustJuly
October
April
October

25000
30000
35000
40000
45000
80
100
120
140
Zinc o
r Cop
per µ
g/L
Cadm
ium µg
/LFigure 3-32: Temporal Trend for Copper and Zinc within WellGS-09
CdDis ZnDis CuDis
August
August
DecemberNovember
SeptemberOctober
March November
April
Butte Priority Soils Operable Unit
0
5000
10000
15000
20000
25000
0
20
40
60
80
1/1/1982 1/1/1986 1/1/1990 1/1/1994 1/1/1998 1/1/2002 1/1/2006 1/1/2010
Zinc o
r Cop
per µ
g/L
Cadm
ium µg
/L
May
DecemberJanuary
April

100000
120000
140000
160000
500
600
700
Copp
er or
Zinc µ
g/L
Figure 3-33: Temporal Trends for Copper and Zinc wtihin Well GS-11CdDis CuDis ZnDis
Butte Priority Soil Operable Unit
0
20000
40000
60000
80000
0
100
200
300
400
1/1/1982 1/1/1986 1/1/1990 1/1/1994 1/1/1998 1/1/2002 1/1/2006 1/1/2010
Copp
er or
Zinc µ
g/L
Cadm
ium µg
/L

‐0.02
‐0.01
0.00
0.01
0.02
0.03
5459.00
5460.00
5461.00
5462.00
5463.00
5464.00
Vertical G
radien
t (ft/ft)
roun
d Water
Elevation
(ft am
sl)
Figure 3 - 3 4
Butte Priority Soils Operable Unit
GW-41 S/D Vertical Gradient
‐0.06
‐0.05
‐0.04
‐0.03
5455.00
5456.00
5457.00
5458.00
05/07/90 01/31/93 10/28/95 07/24/98 04/19/01 01/14/04 10/10/06 07/06/09 04/01/12
G
Date
GS‐41S GS‐41D GS‐41S/D Vertical Gradient (+ upward, ‐ downward) Dewatering Startup/Equilibration

0.02
0.03
0.04
0.05
0.06
0.07
0.08
5457
5458
5459
5460
5461
5462
Vertical G
radien
t (ft/ft)
Groun
d Water Elevation
(ft am
sl)
Figure 3‐35
Butte
Priority
Soils
Operable
Unit
GS
42
S/D
Vertical
Gradient
‐0.02
‐0.01
0.00
0.01
5454
5455
5456
5/7/1990 1/31/1993 10/28/1995 7/24/1998 4/19/2001 1/14/2004 10/10/2006 7/6/2009
Date
GS‐42S GS‐42D GS‐42 S/D Vertical Gradient Dewatering Startup/Equilibration

0
0.01
0.02
0.03
0.04
0.05
5,454.00
5,455.00
5,456.00
5,457.00
5,458.00
5,459.00
Vertical G
radien
t (ft/ft)
Groun
d Water Elevation
(ft am
sl)
Figure 3‐36
Butte
Priority
Soils
Operable
Unit AMW‐1
A,B,C
Vertical
Gradient
‐0.03
‐0.02
‐0.01
5,452.00
5,453.00
1/31/1993 10/28/1995 7/24/1998 4/19/2001 1/14/2004 10/10/2006 7/6/2009 4/1/2012
Date
AMW‐01 A AMW‐01 B AMW‐01 C
A/B Gradient(+ upward, ‐ downward) B/C Gradient A/C Gradient
Dewatering Startup/Equilibration

‐0.01
0.00
0.01
0.02
0.03
0.04
5,446.0
5,446.5
5,447.0
5,447.5
5,448.0
5,448.5
5,449.0
Vertical G
radien
t (ft/ft)
Groun
dwater Elevation
(ft amsl)
Figure 3‐37
Butte Priority Soils Operable Unit
GS‐30
S/D
Vertical
Gradient
‐0.04
‐0.03
‐0.02
5,444.5
5,445.0
5,445.5
5,446.0
5/7/1990 1/31/1993 10/28/1995 7/24/1998 4/19/2001 1/14/2004 10/10/2006 7/6/2009
Date
GS‐30S GS‐30D GS‐30 S/D Vertical Gradient Dewatering Startup/Equilibration

‐0 015
‐0.01
‐0.005
0
0.005
0.01
0.015
0.02
0.025
5,446.00
5,447.00
5,448.00
5,449.00
5,450.00
Vertical G
radien
t (ft/ft)
Groun
d Water Elevation
(ft am
sl)
Figure 3‐38
Butte
Priority
Soils
Operable
Unit GS‐8,
9,11
Vertical
Gradient
‐0.03
‐0.025
‐0.02
‐0.015
5,444.00
5,445.00
11/19/1987 8/15/1990 5/11/1993 2/5/1996 11/1/1998 7/28/2001 4/23/2004 1/18/2007 10/14/2009
Date
GS‐8 (Deep) GS‐9 (Mid‐level) GS‐11(Shallow)
GS‐11/9 Gradient(+ upward, ‐ downward) GS‐9/8 Gradient GS‐11/8 Gradient
Dewatering Startup/Equilbration

0.01
0.02
0.03
0.04
5460.00
5461.00
5462.00
5463.00
5464.00
5465.00
5466.00
Vertical G
radien
t (ft/ft)
roun
d Water Elevation
(ft am
sl)
Figure 3-39
Butte Priority Soils Operable Unit
GW-46 S/D Vertical Gradient
‐0.02
‐0.01
0.00
5456.00
5457.00
5458.00
5459.00
05/07/90 01/31/93 10/28/95 07/24/98 04/19/01 01/14/04 10/10/06 07/06/09 04/01/12
G
Date
GS‐46S GS‐46D GS‐46S/D Vertical Gradient (+ upward, ‐ downward) Dewatering Startup/Equilibration

#*#*#*#*#*#*#*#*#*#*#*#*#*
Parrot Tailings
Berkekey Pit
Montana Resources
Concentrator
Ecology Ponds
G r o u n d Wa t e r D i v i d e
AMW-08
AMC-06
AMC-12
GS-46SBPS07-11ABPS07-11A
GS-40R
GS-41S
GS-42S
AMC-05
AMW-08
AMW-20
BMF05-01
5461
54385439
54405441
5442
5453
544354445445
544654475448
5462
5449
5454
54505451
54525453
54545455
545654575458
5455
54595460
5456 54
61
5457
5458
5459
5 460
Figure 3-40Water Table Elevations near the Parrot Tailings October 2010
Legend
BPSOU Boundary
Water Table Elevation October 2010
BPSOU Shallow Wells
BMFOU Alluvium Wells
#* MSD Cleanout
Surface Water
0 250 500 750 1,000Feet
Z:\g
is\P
ublic
\But
te\W
ater
_Tab
le\M
XD
\WL_
Par
rot_
Oct
10.m
xd
´Butte Priority Soils Operable Unit

5,461.00
5,462.00
5,463.00
5,464.00
5,465.00
Figure 3-41Long-Term Water Elevations Along Cross Section in Parrot Tailings Area
MR Concentrator shut down
MR Concentrator restarted
Butte Priority Soils Operable Unit
5,455.00
5,456.00
5,457.00
5,458.00
5,459.00
5,460.00GS-42SGS-41SAMW-8AMW-20MRI

Butte Priority Soil Operable Unit
0.00
0.20
0.40
0.60
0.80
1.00
1.20
1.40
1.60
1.80
2.00
01/01/94 01/01/96 01/01/98 01/01/00 01/01/02 01/01/04 01/01/06 01/01/08 01/01/10
Figure 3-42Water Table Elevation Differences between AMW-08 and GS-41S
Difference from AMW-08 to GS-41S Montana Resources Suspended

5,462
5,464
Wat
er T
able
Ele
vatio
nFigure 3-43
Water Table Elevations Along Cross Section Through Parrot Tailings
Mar-94Jun-97Dec-97
Southwest Northeast
Butte Priority Soil Operable Unit
5,454
5,456
5,458
5,460
GS-42S GS-41S AMW-8 AMW-20
Wat
er T
able
Ele
vatio
n
Jan-00Jul-01Jul-02Aug-03May-04Apr-05Jul-09May-10
Note: Dashed lines represent period when MR Concentrator operations were suspended

Appendix A Data Analysis

1636.00
4.96
38.3046.60
10.0000
100.0000
1000.0000
Dissolved Iron (mg/L)First Quartile Median Maximum Minimum Third Quartile
Figure 2Box and Whisker Plot for Iron, April and August 2010 Data.
Ground Water Characterization ReportButte Priority Soils Operable Unit
Silver Bow Creek/Butte Area NPL Site
0.12
1.11
0.06
0.000.00
0.00
0.00
0.21
0.0001
0.0010
0.0100
0.1000
1.0000
123456

8.61
7.647.76
7.18
7.0000
8.0000
9.0000
10.0000
pH (su)
First Quartile Median Maximum Minimum Third Quartile
Figure 3Box and Whisker Plot for pH, April and August 2010 Data.
Ground Water Characterization ReportButte Priority Soils Operable Unit
Silver Bow Creek/Butte Area NPL Site
5.755.50
3.84
5.50
3.99
4.824.90
6.37
2.0000
3.0000
4.0000
5.0000
6.0000
123456

2332.00
31.40
95.30143.00
277.00100.0000
1000.0000
10000.0000
Dissolved Cobalt (ug/L)First Quartile Median Maximum Minimum Third Quartile
Figure 4Box and Whisker Plot for Cobalt, April and August 2010 Data.
Ground Water Characterization ReportButte Priority Soils Operable Unit
Silver Bow Creek/Butte Area NPL Site
1.351.08
0.05
0.20
7.43
0.18
0.05
0.0100
0.1000
1.0000
10.0000
123456

141.0095.30
100.0000
1000.0000
Molybdenum (ug/L)First Quartile Median Maximum Minimum Third Quartile
Figure 5Box and Whisker Plot for Molybdenum, April and August 2010 Data.
Ground Water Characterization ReportButte Priority Soils Operable Unit
Silver Bow Creek/Butte Area NPL Site
4.697.73
1.07
6.10
0.200.200.200.20
0.37
0.82
0.1000
1.0000
10.0000
123456

4231.00
455.00
60.40
481.00
140.00 100.0000
1000.0000
10000.0000
Cadmium (ug/L)First Quartile Median Maximum Minimum Third Quartile
Figure 6Box and Whisker Plot for Cadmium, April and August 2010 Data.
Ground Water Characterization ReportButte Priority Soils Operable Unit
Silver Bow Creek/Butte Area NPL Site
4.55
0.58
0.05
3.74
24.80
0.070.05
0.0100
0.1000
1.0000
10.0000
123456

164867.00
29.20
180.00
2184.00
247.00
82.40149.00 100.0000
1000.0000
10000.0000
100000.0000
Aluminum (mg/L)First Quartile Median Maximum Minimum Third Quartile
Figure 7Box and Whisker Plot for Aluminum, April and August 2010 Data.
Ground Water Characterization ReportButte Priority Soils Operable Unit
Silver Bow Creek/Butte Area NPL Site
2.10
82.40
0.40
2.10
149.00
0.00
0.40
0.0001
0.0010
0.0100
0.1000
1.0000
10.0000
123456

148.00163.00
16.00
513.00544.00
53.31
21.00
4.004.00
116.00
1.00000
10.00000
100.00000
Alkalinity (mg/L)First Quartile Median Maximum Minimum Third Quartile
Figure 8Box and Whisker Plot for Alkalinity, April and August 2010 Data.
Ground Water Characterization ReportButte Priority Soils Operable Unit
Silver Bow Creek/Butte Area NPL Site
0.00
0.00
0.00010
0.00100
0.01000
0.10000
1.00000
123456

91.00
42.8062.30
365.00
73.30 100.0000
1000.0000
Barium (mg/L)First Quartile Median Maximum Minimum Third Quartile
Figure 9Box and Whisker Plot for Barium, April and August 2010 Data.
Ground Water Characterization ReportButte Priority Soils Operable Unit
Silver Bow Creek/Butte Area NPL Site
25.80
42.80
5.205.44
1.72
10.306.94
21.00
1.0000
10.0000
123456

470.00
116.00
499.00
146.00
506.00388.00
259.00
117.00 100.0000
1000.0000
Calcium (mg/L)First Quartile Median Maximum Minimum Third Quartile
Figure 10Box and Whisker Plot for Calcium, April and August 2010 Data.
Ground Water Characterization ReportButte Priority Soils Operable Unit
Silver Bow Creek/Butte Area NPL Site
26.0026.90
49.3035.80
1.0000
10.0000
123456

8294.00
407.40
2096.00
519.80
2104.00
934.701186.00
434.00
1000.0000
10000.0000
Sulfate (mg/L)First Quartile Median Maximum Minimum Third Quartile
Figure 11Box and Whisker Plot for Sulfate, April and August 2010 Data.
Ground Water Characterization ReportButte Priority Soils Operable Unit
Silver Bow Creek/Butte Area NPL Site
30.01
75.0487.92
41.76
1.0000
10.0000
100.0000
123456

820.00
600
700
800
900
Nickel (ug/L)First Quartile Median Maximum Minimum Third Quartile
Figure 12Box and Whisker Plot for Nickel, April and August 2010 Data.
Ground Water Characterization ReportButte Priority Soils Operable Unit
Silver Bow Creek/Butte Area NPL Site
4.12
221.00
133.00105.00
0.30118.00
0.051.1624.700.090.05
0
100
200
300
400
500
123456

624272.00
400000
500000
600000
700000
Zinc (ug/L)First Quartile Median Maximum Minimum Third Quartile
Figure 13Box and Whisker Plot for Zinc, April and August 2010 Data.
Ground Water Characterization ReportButte Priority Soils Operable Unit
Silver Bow Creek/Butte Area NPL Site
898.00
126757.00
9641.00
87241.00
207.0036473.00
3.1258.104594.001.650.350
100000
200000
300000
400000
123456

136.00
183.00
201.00
150
200
250
Sodium (mg/L)First Quartile Median Maximum Minimum Third Quartile
Figure 14Box and Whisker Plot for Sodium, April and August 2010 Data.
Ground Water Characterization ReportButte Priority Soils Operable Unit
Silver Bow Creek/Butte Area NPL Site
136.00
75.5087.00
77.20
50.60
10.70
55.00
12.507.9923.60
0
50
100
123456

491.00487.00501.00
439.00
493.00
363.00
400
500
600
REDOX (mv)First Quartile Median Maximum Minimum Third Quartile
Figure 15Box and Whisker Plot for REDOX, April and August 2010 Data.
Ground Water Characterization ReportButte Priority Soils Operable Unit
Silver Bow Creek/Butte Area NPL Site
211.00
298.00
169.00162.20
363.00
145.00120.00
0
100
200
300
123456

20.10
15
20
25
Nitrate (mg/L)First Quartile Median Maximum Minimum Third Quartile
Figure 16Box and Whisker Plot for Nitrate, April and August 2010 Data.
Ground Water Characterization ReportButte Priority Soils Operable Unit
Silver Bow Creek/Butte Area NPL Site
8.81
5.095.58
9.588.52
0.130.070.03
1.95
0.030.030
5
10
123456

71.60
89.40
62.50
60
70
80
90
100
Arsenic (mg/L)First Quartile Median Maximum Minimum Third Quartile
Figure 17Box and Whisker Plot for Arsenic, April and August 2010 Data.
Ground Water Characterization ReportButte Priority Soils Operable Unit
Silver Bow Creek/Butte Area NPL Site
7.17
1.00
14.70
0.601.152.030.300.300.300
10
20
30
40
50
123456

18.98
12
14
16
18
20
Fluoride (mg/L)First Quartile Median Maximum Minimum Third Quartile
Figure 18Box and Whisker Plot for Fluoride, April and August 2010 Data.
Ground Water Characterization ReportButte Priority Soils Operable Unit
Silver Bow Creek/Butte Area NPL Site
1.611.391.28
2.66
0.77
0.130.220.430.500.230.230
2
4
6
8
10
123456

86.90
57.10 60
70
80
90
100
Silica (mg/L)First Quartile Median Maximum Minimum Third Quartile
Figure 19Box and Whisker Plot for Silica, April and August 2010 Data.
Ground Water Characterization ReportButte Priority Soils Operable Unit
Silver Bow Creek/Butte Area NPL Site
50.7051.6049.8044.40
41.20
17.7018.10
45.20
13.10
21.30
0
10
20
30
40
50
123456

7697.00
5000
6000
7000
8000
9000
Strontium (mg/L)First Quartile Median Maximum Minimum Third Quartile
Figure 20Box and Whisker Plot for Strontium, April and August 2010 Data.
Ground Water Characterization ReportButte Priority Soils Operable Unit
Silver Bow Creek/Butte Area NPL Site
4621.00
1122.00738.00
3551.003205.00
1433.00
187.00
945.00
200.00285.00259.00 0
1000
2000
3000
4000
5000
123456

4123.00
155.00139.00
1000
10000
Magnesium (mg/L)First Quartile Median Maximum Minimum Third Quartile
Figure 21Box and Whisker Plot for Magnesium, April and August 2010 Data.
Ground Water Characterization ReportButte Priority Soils Operable Unit
Silver Bow Creek/Butte Area NPL Site
31.70
155.00
33.00
139.00
68.50
76.70
5.53
24.20
6.89
13.0010.30
1
10
100
123456

1062860.00
31720.00
3624.006420.00 10000.0
100000.0
1000000.0
10000000.0
Dissolved Copper (ug/L)First Quartile Median Maximum Minimum Third Quartile
Figure 22Box and Whisker Plot for Copper, April and August 2010 Data.
Ground Water Characterization ReportButte Priority Soils Operable Unit
Silver Bow Creek/Butte Area NPL Site
62.80
3.65
1539.00
0.53
13.10
312.00
1.21
0.30 0.1
1.0
10.0
100.0
1000.0
123456